Site of Airway Obstruction in Asthma as Determined by Measuring Maximal Expiratory Flow Breathing Air and a Helium-Oxygen Mixture P. J. DESPAS, M. LERoux, and P. T. MACKILEM From the Respiratory Division, Department of Medicine, Royal Victoria Hospital, McGill University, Montreal, Canada A B S T R A C T Because maximum expiratory flow-vol- ume rates in normal subjects are dependent on gas den- sity. the resistance between alveoli and the point at which dynamic compression begins (R..) is mostly due to con- vective acceleration and turbulence. We measured maxi- mum expiratory flow-volume (MEFV) curves in asth- matics and chronic bronchitics breathing air and He-02. In the latter and in some asthmatics, MEFV curves did not change, indicating that Ru. is mostly due to laminar flow. Therefore, the point at which dvnamic compression begins must be further upstream than in normal subjects and the site of obstruction must be in small airways. In other asthmatics, flow increased normally indicating ob- struction in larger airways. The response to He-02 did not correlate with initial values of pulmonary resistance, the initial MEFV curves or the response to bronchodi- lators. We conclude that the site of airway obstruction varies among asthmatics and that the site of obstruction is not detectable by measurement of the usual parameters of lung mechanics. INTRODUCTION The site of airway obstruction in most patients with chronic obstructive lung disease is in airways less than 2-3 mm in diameter (1). Less is known about the site of airway obstruction in asthmatics. Bronchography in- dicates that central airways may be constricted (2-4) during an acute attack, while in remission there is evi- dence that considerable obstruction may affect peripheral airways ( a5-7). Examination of the effects of altered gas density on the maximum expiratory flow-volume (MEFV)' curve Received for puiblicationt 2 March 1972 autd int revised form 8 August 1972. 1 Abbreviatiouis used int this paper: Aeppy cross-sectional area at EPP; EPP, equal pressure points; FRC, functional may be a simple way of defining the site of airway ob- struction in asthmatics. According to Mead maximum expiratory flow rate at a particular lung volume is deter- mined by the elastic recoil pressure of the lung at that volume and the resistance of the airways between the alveoli and the points where the lateral intraluminal pressure equals pleural pressure (equal pressure points, EPP). This resistance is defined as the upstream re- sistance (Ru.) (8). If EPP are in large airways most of Ru. will be due to convective acceleration and turbu- lence. Because pressure losses due to both of these are dependent on gas density, changes in gas density will alter Ru. and thus maximum expiratory flow. This is the case in normal subjects: EPP are in large airways at lung volumes above 40% vital capacity (VC) (9) and maximum expiratory flow rates over these lung vol- umes are density dependent (10-12). In the presence of airway obstruction in small airways, EPP will be fur- ther upstream (toward the alveoli) than in normal sub- jects and maximum expiratory flow will be less density dependent than normal to the extent that the resistance to laminar flow (which is independent of gas density) makes up a greater portion of the total resistance up- stream from EPP. Obstruction in larger airways might have a lesser influence on the normal response to a change in gas density. Previous studies in patients with airway obstruction reveal a marked variation in the changes in dynamic lung function that occur when gas density is altered (13-16). The variation is not obviously related to the residual capacity; MEFV, maximum expiratory flow-volume; Pca, pressure drop due to convective acceleration; P.t (1), elastic recoil pressure of the lung; Rca, resistance due to convective acceleration; Rfr, frictional resistance to airflow; RL, pulmonary resistance; Ru., upstream resistance; RV, residual volume; TLC, total lung capacity; VC, vital ca- pacity; Vmax5o, maximum expiratory flow at 50% vital ca- pacity. The Journal of Clinical Investigation Volume 51 December 1972 3235

Welcome message from author
This document is posted to help you gain knowledge. Please leave a comment to let me know what you think about it! Share it to your friends and learn new things together.
Transcript
Site of Airway Obstruction in Asthma as Determined
by Measuring Maximal Expiratory Flow
Breathing Air and a Helium-Oxygen Mixture
P. J. DESPAS, M. LERoux, and P. T. MACKILEM
From the Respiratory Division, Department of Medicine, Royal VictoriaHospital, McGill University, Montreal, Canada
A B S T R A C T Because maximum expiratory flow-vol-ume rates in normal subjects are dependent on gas den-sity. the resistance between alveoli and the point at whichdynamic compression begins (R..) is mostly due to con-vective acceleration and turbulence. We measured maxi-mum expiratory flow-volume (MEFV) curves in asth-matics and chronic bronchitics breathing air and He-02.In the latter and in some asthmatics, MEFV curves didnot change, indicating that Ru. is mostly due to laminarflow. Therefore, the point at which dvnamic compressionbegins must be further upstream than in normal subjectsand the site of obstruction must be in small airways. Inother asthmatics, flow increased normally indicating ob-struction in larger airways. The response to He-02 didnot correlate with initial values of pulmonary resistance,the initial MEFV curves or the response to bronchodi-lators. We conclude that the site of airway obstructionvaries among asthmatics and that the site of obstructionis not detectable by measurement of the usual parametersof lung mechanics.
INTRODUCTIONThe site of airway obstruction in most patients withchronic obstructive lung disease is in airways less than2-3 mm in diameter (1). Less is known about the siteof airway obstruction in asthmatics. Bronchography in-dicates that central airways may be constricted (2-4)during an acute attack, while in remission there is evi-dence that considerable obstruction may affect peripheralairways ( a5-7).Examination of the effects of altered gas density on
the maximum expiratory flow-volume (MEFV)' curve
Received for puiblicationt 2 March 1972 autd int revisedform 8 August 1972.
1 Abbreviatiouis used int this paper: Aeppy cross-sectionalarea at EPP; EPP, equal pressure points; FRC, functional
may be a simple way of defining the site of airway ob-struction in asthmatics. According to Mead maximumexpiratory flow rate at a particular lung volume is deter-mined by the elastic recoil pressure of the lung at thatvolume and the resistance of the airways between thealveoli and the points where the lateral intraluminalpressure equals pleural pressure (equal pressure points,EPP). This resistance is defined as the upstream re-sistance (Ru.) (8). If EPP are in large airways mostof Ru. will be due to convective acceleration and turbu-lence. Because pressure losses due to both of these aredependent on gas density, changes in gas density willalter Ru. and thus maximum expiratory flow. This isthe case in normal subjects: EPP are in large airwaysat lung volumes above 40% vital capacity (VC) (9)and maximum expiratory flow rates over these lung vol-umes are density dependent (10-12). In the presence ofairway obstruction in small airways, EPP will be fur-ther upstream (toward the alveoli) than in normal sub-jects and maximum expiratory flow will be less densitydependent than normal to the extent that the resistanceto laminar flow (which is independent of gas density)makes up a greater portion of the total resistance up-stream from EPP. Obstruction in larger airways mighthave a lesser influence on the normal response to achange in gas density.
Previous studies in patients with airway obstructionreveal a marked variation in the changes in dynamiclung function that occur when gas density is altered(13-16). The variation is not obviously related to the
residual capacity; MEFV, maximum expiratory flow-volume;Pca, pressure drop due to convective acceleration; P.t (1),elastic recoil pressure of the lung; Rca, resistance due toconvective acceleration; Rfr, frictional resistance to airflow;RL, pulmonary resistance; Ru., upstream resistance; RV,residual volume; TLC, total lung capacity; VC, vital ca-pacity; Vmax5o, maximum expiratory flow at 50% vital ca-pacity.
The Journal of Clinical Investigation Volume 51 December 1972 3235
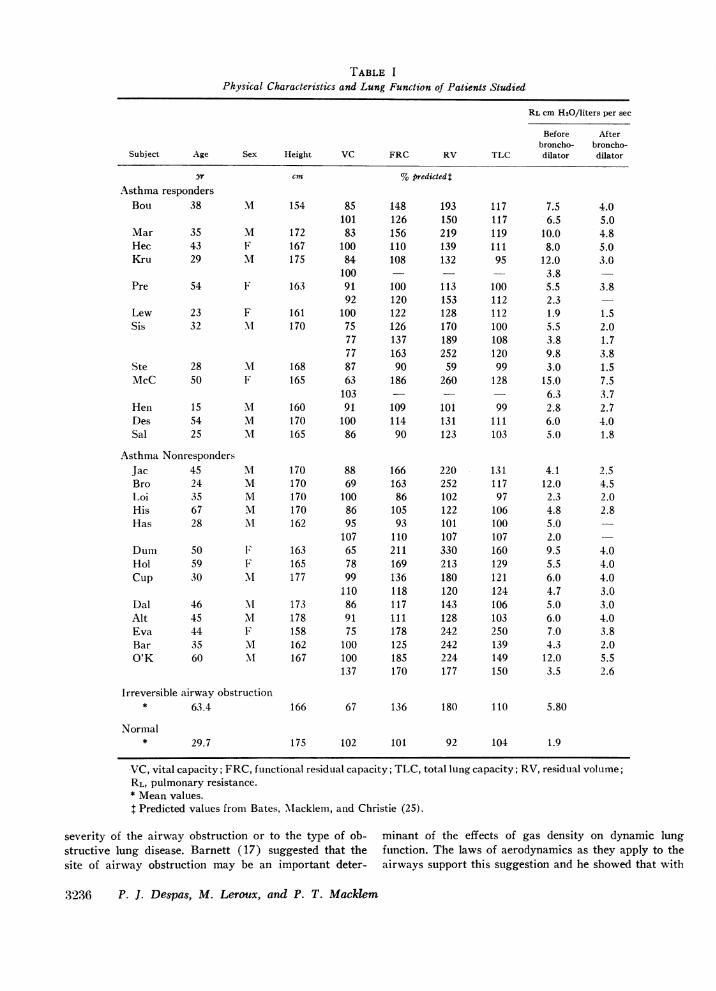
TABLE IPhysical Characteristics and Lung Function of Patients Studied
RL cm H20/liters per sec
Before Afterbroncho- broncho-
Subject Age Sex Height VC FRC RV TLC dilator dilator
yr cm % predicted$Asthma respondersBou 38 M 154 85 148 193
101 126 150Mar 35 M 172 83 156 219Hec 43 F 167 100 110 139Kru 29 M 175 84 108 132
100Pre 54 F 163 91 100 113
92 120 153Lew 23 F 161 100 122 128Sis 32 .i 170 75 126 170
77 137 18977 163 252
Ste 28 .4 168 87 90 59McC 50 F 165 63 186 260
103 - -Hen 15 .4 160 91 109 101Des 54 M 170 100 114 131Sal 25 M 165 86 90 123
Asthma NonrJacBroIoiHisHas
DumHolCup
DalAltEvaBarO'K
responders45 .I 170 88 166 22024 M 170 69 163 25235 M 170 100 86 10267 M 170 86 105 12228 M 162 95 93 101
107 110 10750 F 163 65 211 33059 F 165 78 169 21330 lvI 177 99 136 180
110 118 12046 MI 173 86 117 14345 'vI 178 91 111 12844 F 158 75 178 24235 M 162 100 125 24260 Xi 167 100 185 224
137 170 177
117 7.5117 6.5119 10.0111 8.095 12.0
3.8100 5.5112 2.3112 1.9100 5.5108 3.8120 9.899 3.0128 15.0
6.399 2.8
111 6.0103 5.0
131 4.1117 12.097 2.3106 4.8100 5.0107 2.0160 9.5129 5.5121 6.0124 4.7106 5.0103 6.0250 7.0139 4.3149 12.0150 3.5
4.05.04.85.03.0
3.8
1.52.01.73.81.57.53.72.74.01.8
2.54.52.02.8
4.04.04.03.03.04.03.82.05.52.6
Irreversible airway obstruction* 63.4 166 67 136 180 110 5.80
Normal* 29.7 175 102 101 92 104 1.9
VC, vital capacity; FRC, functional residual capacity; TLC, total lung capacity; RV, residual volume;RL, pulmonary resistance.* Mean values.I Predicted values from Bates, 'Macklem, and Christie (25).
severity of the airway obstruction or to the type of ob- minant of the effects of gas density on dynamic lungstructive lung disease. Barnett (17) suggested that the function. The laws of aerodynamics as they apply to thesite of airway obstruction may be an important deter- airways support this suggestion and he showed that with
3236 P. J. Despas, M. Leroux, and P. T. Mackilem
tracheal obstruction, pulmonary resistance was densitydependent but when obstruction was in peripheral air-ways the resistance was not density dependent (17).
Stimulated by Barnett's observations, we have stud-ied the effects of 20% oxygen in helium on the MEFVcurves and pulmonary resistance (RL) in asthmatics.These effects were compared with those obtained in nor-mal subjects and in patients with irreversible airwaysobstruction. The mixture's density is only 36% that ofair but it is 12% more viscous.
METHODS
We studied 25 asthmatics with significant reversible air-way obstruction who had been repeatedly studied in theroutine laboratory. Most were symptomatic when we studiedthem and had a significant reduction in pulmonary re-sistance immediately following a bronchodilator aerosol(Table I). We also studied seven patients with irreversibleairway obstruction. They had chronic bronchitis and dyspneaand showed little change in the degree of airway obstruc-tion over several years. The control group were normal,nonsmoking subj ects and included medical and laboratorystaff.While the subjects were breathing air we measured the
subdivisions of lung volume, the static deflation pressurevolume curve of the lung, pulmonary resistance at functionalresidual capacity (FRC), and the maximal expiratory flow-volume curves. Change in lung volume was measured by aKrogh spirometer attached to the body plethysmograph.Absolute lung volume was obtained by the gas compressiontechnique based on Boyle's law (18). The static deflationpressure volume curve of the lung was obtained by plottingtranspulmonary pressure (as assessed by the difference be-tween mouth and esophageal pressure) during 1-2-sec peri-ods of zero-airflow, against lung volume on deflation toresidual volume (RV) after a full inspiration to total lungcapacity (TLC). Esophageal pressure was measured by anesophageal balloon catheter (balloon length 10 cm, circum-ference 3.5 cm, volume 0.5 ml of air, catheter PE 200tubing 60 cm long) coupled to a Sanborn 267B differentialpressure transducer (Sanborn Div., Hewlett-Packard Co.,Waltham, Mass.), the other side of which was connectedvia a catheter to the mouthpiece. Pulmonary resistance dur-ing inspiration (RL) was taken as the ratio of the compo-nent of transpulmonary pressure in phase with inspiratoryflow to flow during tidal breathing. Flow was measured bya Fleisch pneumotachograph coupled to a Sanborn 270 dif-ferential pressure transducer. The component of transpul-monary pressure in phase with flow was measured by sub-tracting from transpulmonary pressure a signal proportionalto lung volume, so that the pressure flow loop, as displayedon the x-y coordinates of a long persistence display oscillo-scope, became a line (19). The slope of this line as it passedthrough zero flow was read directly by a rotatable overlyinggrid and gave us inspiratory pulmonary resistance. TheMEFV curves were obtained by displaying flow againstvolume on the x-y coordinates of a Tektronix 564 storageoscilloscope (Tektronix, Inc., Beaverton, Ore.) duringforced expiration from TLC to RV. Each MEFV curvewas repeated several times and curves that were not highlyreproducible were rejected. After completing these mea-surements the subject breathed a 20%o oxygen in heliummixture for 10 min, when RL and MEFV curves were
measured again. Breathing helium oxygen does not influencethe static pressure volume curves of the lung (13), so thatthe vital capacity was unchanged in any subject. Further-more no changes in FRC were detected. The curves werestored and traced with an oscillotracer (R. A. Waters Co.,Waltham, Mass.). Pressure, flow, and volume were alsorecorded on a four-channel direct writing Sanborn recorder.The body plethysmograph was pressure compensated and
had a frequency response adequate to 8 counts/sec. It wascalibrated with a calibrating syringe of 500 ml capacity forlarge volume recordings and with a 50 ml syringe forsmall volume recordings. The pressure transducers werecalibrated with water manometers. The pneumotachographwas calibrated for air and for the He-02 by passing thegases through the pneumotachograph which was coupled by2 inch diameter smooth bore tubing to a 120 liter Tissotspirometer. The pneumotachograph resistance was linearfor both gases up to flow rates of 6 liters/sec.
RESULTS
Results obtained in the lung function tests for the threegroups of subjects are given in Table I. The asthmaticswere further subdivided into responders and nonre-sponders according to their change in maximum expira-tory flow when they breathed He-02 (see below). Meanvalues only are reported for the normal subjects andthose with irreversible airway obstruction. Among asth-matics RL was increased in all but one subject (Lew)either at the initial study or at a subsequent study. RLwas markedly increased in several subjects.MEFV curves. There was a substantial increase in
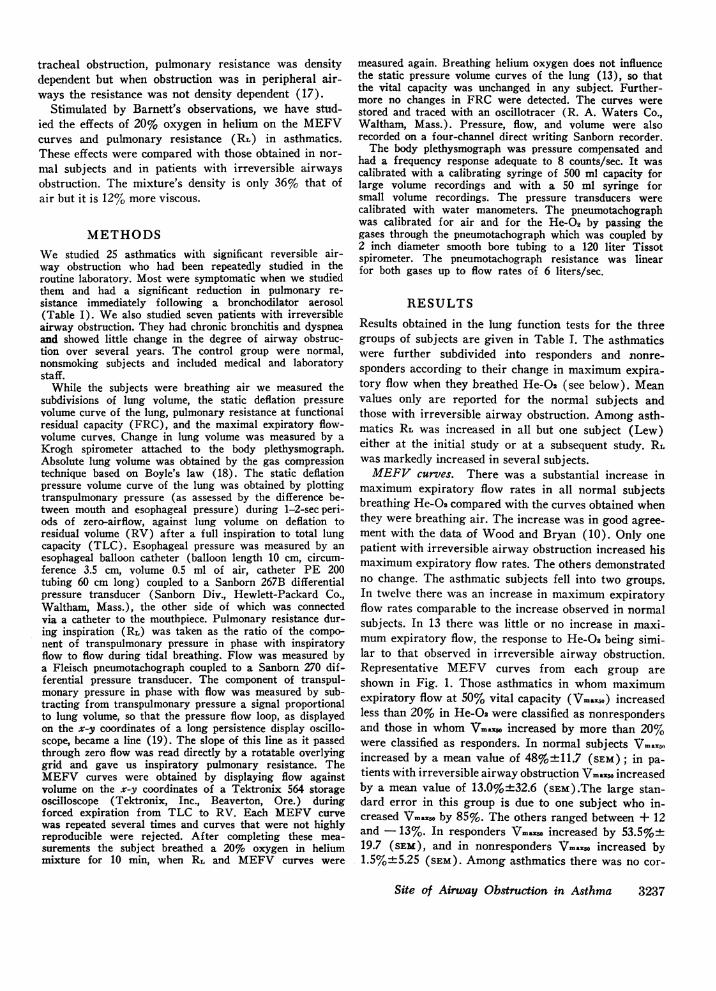
maximum expiratory flow rates in all normal subjectsbreathing He-G2 compared with the curves obtained whenthey were breathing air. The increase was in good agree-ment with the data of Wood and Bryan (10). Only onepatient with irreversible airway obstruction increased hismaximum expiratory flow rates. The others demonstratedno change. The asthmatic subjects fell into two groups.In twelve there was an increase in maximum expiratoryflow rates comparable to the increase observed in normalsubjects. In 13 there was little or no increase in mnaxi-mum expiratory flow, the response to He-O2 being simi-lar to that observed in irreversible airway obstruction.Representative MEFV curves from each group areshown in Fig. 1. Those asthmatics in whom maximumexpiratory flow at 50% vital capacity (Vmax5o) increasedless than 20% in He-Oa were classified as nonrespondersand those in whom \mao increased by more than 20%were classified as responders. In normal subjects Vrnaxnoincreased by a mean value of 48%+11.7 (SEM); in pa-tients with irreversible airway obstruction 'i7maxwo increasedby a mean value of 13.0%+32.6 (sEM).The large stan-dard error in this group is due to one subject who in-creased Vrno by 85%. The others ranged between + 12and - 13%. In responders Vraxno increased by 53.5%+19.7 (SEM), and in nonresponders Vmxso increased by1.5%±+5.25 (SEM). Among asthmatics there was no cor-
Site of Airway Obstruction in Asthma 3237
6-
4-
Stw Irreversible Has AsthmaE AiwA obstn ction Nonresponder> 12 RL 5-1-5-5 RL 20-2-2
108-
6-4-
2
0 20 40 60 80 0 20 40 60 80 100PER CENT VC
FIGURE 1 Representative maximum expiratory flow-volumecurves for the four groups of subjects. - - -- MEFV curveson air; MEFV curves on He-02; .. predictedMEFV curves on He-02 from the data of Wood and Bryanassuming that Vma. a (density) -0.5 (10). Values for pul-monary resistance (RL) in cm H20/liters per sec breathingair and breathing He-02 are given for each case.
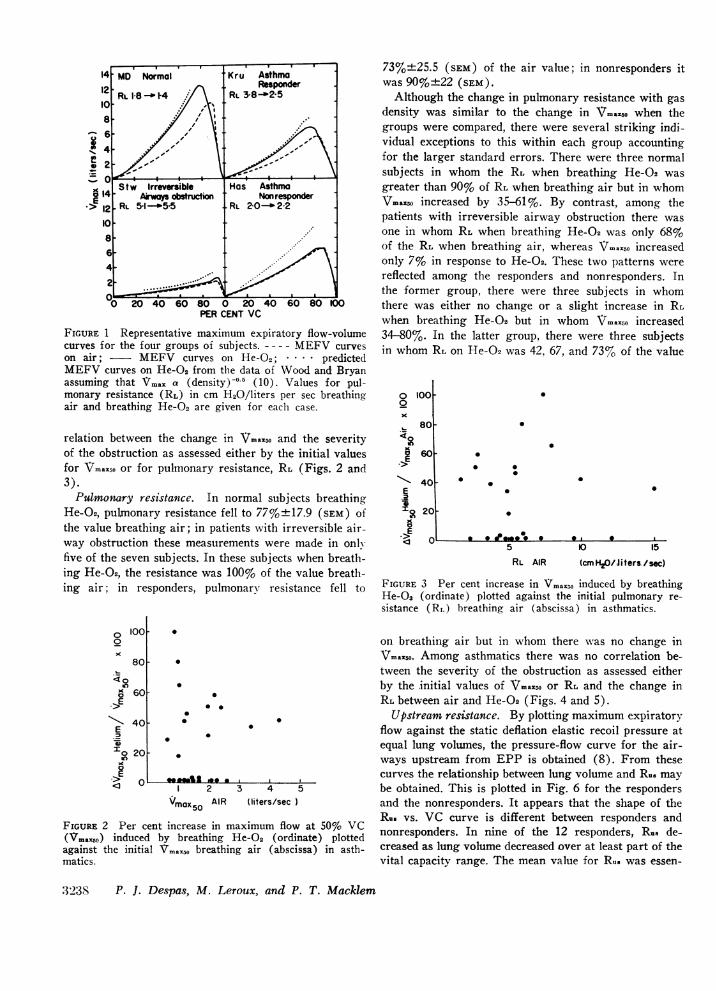
relation between the change in Vmaxsm and the severityof the obstruction as assessed either by the initial valuesfor Vmraxzo or for pulmonary resistance, RL (Figs. 2 and3).Pulmonary resistance. In normal subjects breathing
He-O2, pulxnonary resistance fell to 77%±+ 17.9 (SEM) ofthe value breathing air; in patients with irreversible air-way obstruction these measurements were made in onlyfive of the seven subjects. In these subjects when breath-ing He-O2, the resistance was 100% of the value breath-ing air; in responders, pulmonary resistance fell to
73%+25.5 (sEM) of the air value; in nonresponders itwas 90%±+22 (SEM).Although the change in pulmonary resistance with gas
density was similar to the change in Vmrno when thegroups were compared, there were several striking indi-vidual exceptions to this within each group accountingfor the larger standard errors. There were three normalsubjects in whom the RL when breathing He-O2 wasgreater than 90% of RL when breathing air but in whomlVmax5o increased by 35-61%. By contrast, among thepatients with irreversible airway obstruction there wasone in whom RL when breathing He-O2 was only 68%of the RL when breathing air, whereas Vmaxsm increasedonly 7% in response to He-O2. These two patterns werereflected among the responders and nonresponders. Inthe former group, there were three subjects in whomthere was either no change or a slight increase in RLwhen breathing He-O but in whom Vmax,o increased34-80%. In the latter group, there were three subjectsin whom RL on He-02 was 42, 67, and 73% of the value
o 1000x
> 80
a 60E
'-40E
200E
o
.
F
aI-
0
* 00
0
0
5 10 15RL AIR (cmKH2/Jiters./sc)
FIGURE 3 Per cent increase in Vmax5o induced by breathingHe-02 (ordinate) plotted against the initial pulmonary re-sistance (R,.) breathing air (abscissa) in asthmatics.
0 V0
E<0
EX
1001-
801
601
40!
20F
0
0
* 00S
00
0
goess 0 a .,
.
1 2 3 4 5VmaX AIR (liters/sec )
FIGURE 2 Per cent increase in maximum flow at 50% VC(Vmax5o) induced by breathing He-02 (ordinate) plottedagainst the initial Vmaxso breathing air (abscissa) in asth-matics.
on breathing air but in whom there was no change inVmaxso. Among asthmatics there was no correlation be-tween the severity of the obstruction as assessed eitherby the initial values of Vrnax.o or RL and the change inRL between air and He-02 (Figs. 4 and 5).Upstream resistance. By plotting maximum expiratory
flow against the static deflation elastic recoil pressure atequal lung volumes, the pressure-flow curve for the air-ways upstream from EPP is obtained (8). From thesecurves the relationship between lung volume and Ru. maybe obtained. This is plotted in Fig. 6 for the respondersand the nonresponders. It appears that the shape of theRu. vs. VC curve is different between responders andnonresponders. In nine of the 12 responders, R.. de-creased as lung volume decreased over at least part of thevital capacity range. The mean value for Ru. was essen-
3238 P. J. Despas, M. Leroux, and P. T. Macklem
.--IF
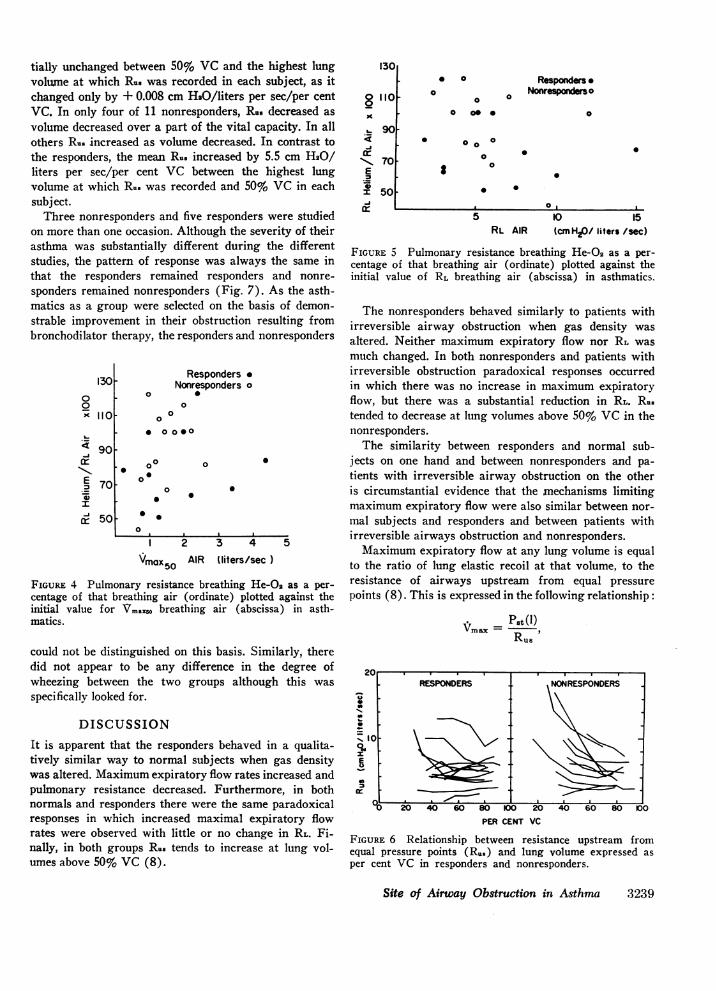
tially unchanged between 50% VC and the highest lungvolune at which Ru. was recorded in each subject, as itchanged only by + 0.008 cm H}O/liters per sec/per centVC. In only four of 11 nonresponders, Ru. decreased asvolume decreased over a part of the vital capacity. In allothers R.. increased as volume decreased. In contrast tothe responders, the mean R.. increased by 5.5 cm H20/liters per sec/per cent VC between the highest lungvolume at which Ru. was recorded and 50% VC in eachsubject.Three nonresponders and five responders were studied
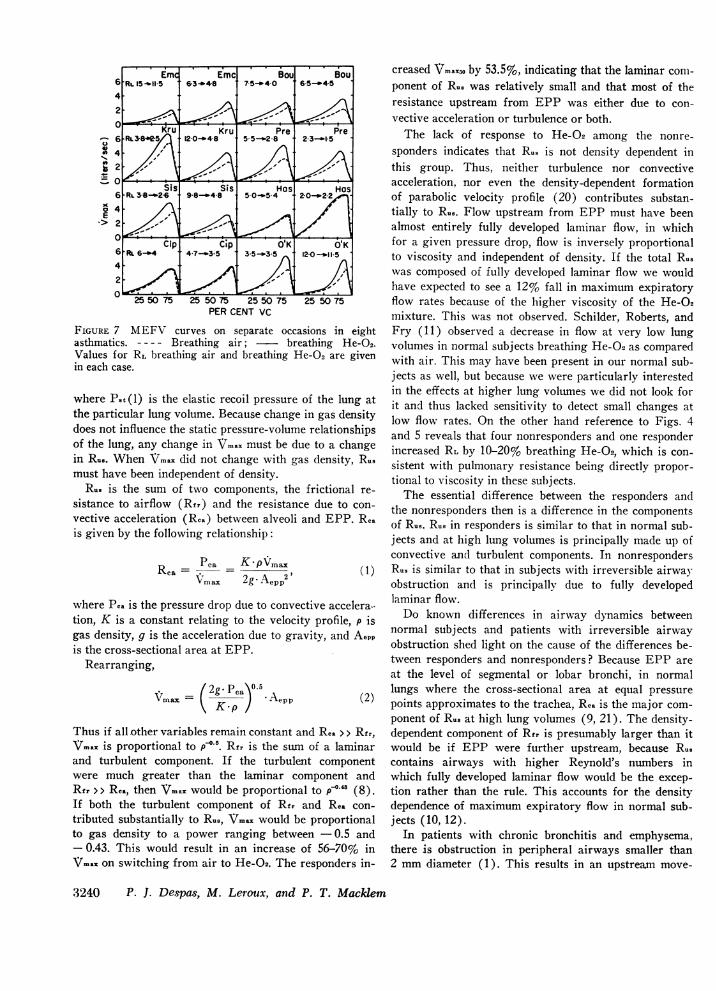
on more than one occasion. Although the severity of theirasthma was substantially different during the differentstudies, the pattern of response was always the same inthat the responders remained responders and nonre-sponders remained nonresponders (Fig. 7). As the asth-matics as a group were selected on the basis of demon-strable improvement in their obstruction resulting frombronchodilator therapy, the responders and nonresponders
13000x 110
4 90 .
E 70-._
cr 50.
Responders -Nonresponders o
o S0
00
* 0 000
S00
0
0
o00
0
0
0
0
00
1 2 3 4
VmaxSO AIR Uliters/sec )Vmx505
FIGURE 4 Pulmonary resistance breathing He-Q2 as a per-centage of that breathing air (ordinate) plotted against theinitial value for Vma.. breathing air (abscissa) in asth-matics.
could not be distinguished on this basis. Similarly, theredid not appear to be any difference in the degree ofwheezing between the two groups although this wasspecifically looked for.
DISCUSSIONIt is apparent that the responders behaved in a qualita-tively similar way to normal subjects when gas densitywas altered. Maximum expiratory flow rates increased andpulmonary resistance decreased. Furthermore, in bothnormals and responders there were the same paradoxicalresponses in which increased maximal expiratory flowrates were observed with little or no change in RL. Fi-nally, in both groups Ru. tends to increase at lung vol-umes above 50% VC (8).
1301
x
CK
N\ 70E
-iI 5
* a0
a0 oC 0
0
S
5
Responders .O Nonresponderso
0
0
0a
0
10 15RL AIR (cmnH80/ liters /sec)
FIGURE 5 Pulmonary resistance breathing He-02 as a per-centage of that breathing air (ordinate) plotted against theinitial value of RL breathing air (abscissa) in asthmatics.
The nonresponders behaved similarly to patients withirreversible airway obstruction when gas density wasaltered. Neither maximum expiratory flow nor RL wasmuch changed. In both nonresponders and patients withirreversible obstruction paradoxical responses occurredin which there was no increase in maximum expiratoryflow, but there was a substantial reduction in RL. R..tended to decrease at lung volumes above 50% VC in thenonresponders.The similarity between responders and normal sub-
jects on one hand and between nonresponders and pa-tients with irreversible airway obstruction on the otheris circumstantial evidence that the mechanisms limitingmaximum expiratory flow were also similar between nor-mal subjects and responders and between patients withirreversible airways obstruction and nonresponders.Maximum expiratory flow at any lung volume is equal
to the ratio of lung elastic recoil at that volume, to theresistance of airways upstream from equal pressurepoints (8). This is expressed in the following relationship:
Pst (1)Imaxc = pRU6
s 0
z0.
-o 40 W D00
PER CENT VC40 60 80 100
FIGURE 6 Relationship between resistance upstream fromequal pressure points (R..) and lung volume expressed asper cent VC in responders and nonresponders.
Site of Airway Obstruction in Asthma 3239
RESPONDERS
_.
NONRESPONDERS
I
6 RL"5~ 12-0-*458 5-5-28 2-3-1-54)
2 7-
Sis Sis Has Has6 RL3-82 26 98-a48 50-o54 20--22
254E.>2 ~ -
Cidp O'K O'K6 Ru. 6--4 4-7-.3*5 3*5--o3*5 12-0 -m"1 1-54-2--
C25 5075 25 50 75 25 50 75 25 5075PER CENT VC
FIGURE 7 MEFV curves on separate occasions in eightasthmatics. ---- Breathing air; breathing He-02.Values for RL breathing air and breathing He-02 are givenin each case.
where Pat (1) is the elastic recoil pressure of the lung atthe particular lung volume. Because change in gas densitydoes not influence the static pressure-volume relationshipsof the lung, any change in VVmax must be due to a changein R.8. When Vmax. did not change with gas density, Ru.must have been independent of density.
R.- is the sum of two components, the frictional re-sistance to airflow (Rfr) and the resistance due to con-vective acceleration (Rca) between alveoli and EPP. Rcais given by the following relationship:
Pca _K-pVmaxRca = - 2'Vmax 2g.Aepp2(1
where Pca is the pressure drop due to convective accelera.tion, K is a constant relating to the velocity profile, p isgas density, g is the acceleration due to gravity, and Aeppis the cross-sectional area at EPP.
Rearranging,
Vmax (2g- PcaV5 (2)vmxKKp) 'Aepp 2
Thus if all other variables remain constant and Rea > > Rfr,Vmax is proportional to p'-6. Rvr is the sum of a laminarand turbulent component. If the turbulent componentwere much greater than the laminar component andRfr > > Rca, then VVmna would be proportional to p'.4 (8).If both the turbulent component of Rfr and Rca con-tributed substantially to R.8, V..a would be proportionalto gas density to a power ranging between - 0.5 and- 0.43. This would result in an increase of 56-70% inVm.a on switching from air to He-02. The responders in-
creased VVmaxso by 53.5%, indicating that the laminar conm-ponent of R.8 was relatively small and that most of theresistance upstream from EPP was either due to con-vective acceleration or turbulence or both.The lack of response to He-02 among the nonre-
sponders indicates that R.8 is not density dependent inthis group. Thus, neither turbulence nor convectiveacceleration, nor even the density-dependent formationof parabolic velocity profile (20) contributes substan-tially to Ru.. Flow upstream from EPP must have beenalmost entirely fully developed laminar flow, in whichfor a given pressure drop, flow is inversely proportionalto viscosity and independent of density. If the total R.8was composed of fully developed laminar flow we wouldhave expected to see a 12% fall in maximum expiratoryflow rates because of the higher viscosity of the He-O2mixture. This was not observed. Schilder, Roberts, andFry (11) observed a decrease in flow at very low lungvolumes in normal subjects breathing He-02 as comparedwith air. This may have been present in our normal sub-jects as well, but because we were particularly interestedin the effects at higher lung volumnes we did not look forit and thus lacked sensitivity to detect small changes atlow flow rates. On the other hand reference to Figs. 4and 5 reveals that four nonresponders and one responderincreased RL by 10-20% breathing He-02, which is con-sistent with pulmonary resistance being directly propor-tional to viscosity in these subjects.The essential difference between the responders and
the nonresponders then is a difference in the componentsof Rus. Rus in responders is similar to that in normal sub-jects and at high lung volumes is principally made up ofconvective and turbulent components. In nonrespondersRu. is similar to that in subjects with irreversible airwayobstruction and is principally due to fully developedlaminar flow.Do known differences in airway dynamics between
normal subjects and patients with irreversible airwayobstruction shed light on the cause of the differences be-tween responders and nonresponders? Because EPP areat the level of segrmental or lobar bronchi, in normallungs where the cross-sectional area at equal pressurepoints approximates to the trachea, Rca is the major com-ponent of Rus at high lung volumes (9, 21). The density-dependent component of Rfr is presumably larger than itwould be if EPP were further upstream, because Ru.contains airways with higher Reynold's numbers inwhich fully developed laminar flow would be the excep-tion rather than the rule. This accounts for the densitydependence of maximum expiratory flow in normal sub-jects (10, 12).
In patients with chronic bronchitis and emphysema,there is obstruction in peripheral airways smaller than2 mm diameter (1). This results in an upstream move-
3240 P. J. Despas, M. Leroux, and P. T. Macklem
ment of EPP into airways where the total cross-sectionalarea at equal pressure points is presumably substantiallyincreased. Because Rca is inversely proportional to thesquare of this cross-sectional area and because V\ma isgreatly reduced, one would predict that Rca would be-come small (see equation 1). In order for the density-dependent component of Rfr to become small as well itwould seem likely that the upstream motion of EPPwould have to be quite considerable indeed, but one can-not state exactly how far. Thus, in order to account fordensity independence of maximum flow it is necessary topostulate peripheral airway obstruction with EPP situ-ated where the total cross-sectional area at EPP is largeand the flow upstream is laminar and fully developed.The upstream displacement of EPP is consistent withwhat is known about airway dynamics in irreversibleairway obstruction (22).We suggest that the nonresponders were similar to
the patients with irreversible airway obstruction and thatEPP were in airways where the total cross-sectionalarea was large and the flow upstream laminar. We sug-gest that this was due to obstruction in small airways.The responders had a similar degree of airway ob-
struction as assessed by RL and Vrnas5o. In spite of this,we suggest that the site of obstruction was different andwas located in larger airways so that EPP did not moveso far upstream, with the result that the cross-section atEPP was sufficiently small so that Rca was a large com-ponent of R.8 or the flow upstream was turbulent or both.Our data do not permit us to determine the exact locationof EPP, but if Rca were substantial there may well havebeen bronchoconstriction at the site of EPP. We returnto this point later.
If these considerations are correct, the site of ob-struction in asthma is different in different individuals,being located in small airways in some and in larger air-ways in others. Because responders do not appear to be-come nonresponders and vice versa, it appears likely thatthe site remains fixed in any given asthmatic although amore prolonged longitudinal study would be necessaryto make this statement unequivocally.Our conclusions are consistent with the experimental
evidence published by Barnett (17). He found that theresistance produced by obstruction in a large airway(the trachea) was decreased when He-02 was breathedcompared with air, whereas when the obstruction wasmore peripheral, induced by histamine, the resistance wasessentially independent of gas density. Vagal stimulationproduced an intermediate response.How can our conclusions and Barnett's observations
be reconciled with the paradoxical responses that we ob-served? Among the responders and the normal subjectsthere were individuals in whom RL did not change, butin whom there were substantial increases in maximal
expiratory flow. During the measurements of RL thesubjects were breathing quietly. Resistance due to con-vective acceleration is not a component of RL. Thus anyresponse to He-02 must have been due to density de-pendence of the frictional resistance of the airways. Ifthe frictional resistance was principally due to laminarflow, very little density dependence would be apparent.During forced expirations, however, Rca does contributeto Rus and is directly proportional to density (equation1). The paradoxical finding that Vra30o increased whileRL remained unchanged may be explained if Rea was amajor component of Rus but in the absence of dynamiccompression during the measurement of RL (to which Rezdoes not contribute) flow was essentially laminar throughthose airways with the highest resistance. If this were thecase it seems likely that the cross-sectional area at thesite of EPP, where the transmural pressure across theseairways is presumably close to zero, would have to besubstantially less than it is during quiet breathing whenthese airways are distended. This might well be con-sistent with an increase in bronchomotor tone at this site.The other paradoxical response (a decrease in RL with-
out substantial change in Vma3cso) also requires explana-tion. An increase in the tone of large airways makesthem less compressible but increases their resistance toairflow (23). During quiet breathing at a given flowrate, this would increase the Reynold's numbers, and thedegree of turbulence within them, which would renderthe frictional resistance more density dependent. Be-cause they are less compressible, however, EPP wouldmove further upstream so that Ru. would not contain thefrictional resistance of these airways. Thus, the para-doxical change in RL without much change in Vmax,awould be explained if EPP were located upstream fromnarrowed airways whose frictional resistance was den-sity dependent and contributed substantially to RL but notat all to RU..A curious finding among most responders, similar to
that in normal subjects was, that Rus increased as lungvolume increased above 50% VC (Fig. 6). In normalsubjects this has been attributed to changes in Rca withlung volume. As volume decreases, EPP move upstreamso that the cross-sectional area at EPP increases. Fur-thermore, as volume decreases V..a. decreases. Both ofthese will result in a decrease in Rca as volume decreases(equation 1). If a similar mechanism were operating inthe responders to account for the change in Ru. with vol-ume, the contribution of Rca to Ru. would have to belarge. Because Vmax was markedly reduced, the cross-section at EPP would also have to be reduced in orderfor Rca to be large. Mead, Turner, Macklem, and Littleplotted Vmar against Pat(l) at the same lung volumes toobtain pressure-flow curve of the airways upstream fromEPP. They also plotted isopleths of Rca using different
Site of Airway Obstruction in Asthma 3241
TRANSPULMONARY PRESSURE (cm H20)
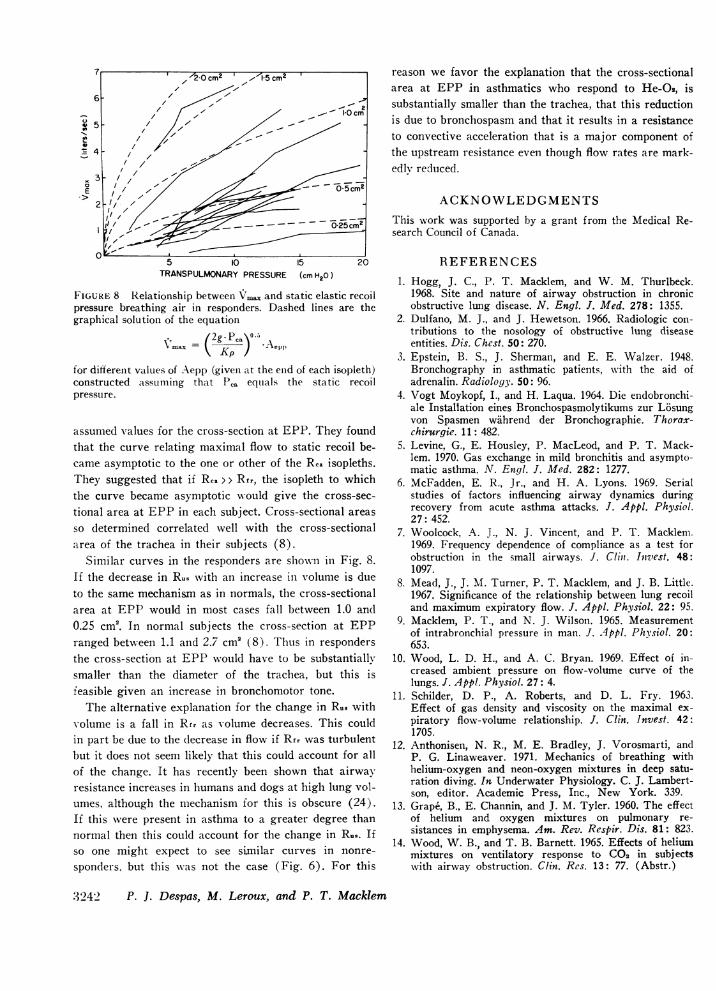
FIGURE 8 Relationship between V1ax and static elastic recoilpressure breathing air in responders. Dashed lines are thegraphical solution of the equation
ji 2g.Pca °\0
IV5~~~~~~~~
for different values of .Aepp (given at the enld of each isopleth)constructed <assuming that PCa equals the static recoilpressure.
assumed values for the cross-section at EPP. They foundthat the curve relating maximal flow to static recoil be-came asymptotic to the one or other of the Rca isopleths.They suggested that if Rca > > f the isopleth to whichthe curve became asymptotic would give the cross-sec-tional area at EPP in each subject. Cross-sectional areasso determined correlated well with the cross-sectionalarea of the trachea in their subjects (8).
Similar curves in the responders are shown in Fig. 8.If the decrease in Ru8 with an increase in volumle iS dueto the same mechanisan as in normals, the cross-sectionalarea at EPP would in most cases fall between 1.0 and0.25 cm2. In normal subjects the cross-section at EPPranged between 1.1 and 2.7 cm2 (8). Thus in respondersthe cross-section at EPP would have to be substantiallysmaller than the diameter of the trachea, but this isfeasible given an increase in bronchomotor tone.The alternative explanation for the change in Ru wvith
volume is a fall in Rfr as volume decreases. This couldin part be due to the decrease in flow if Rfr was turbulentbut it does not seem likely that this could account for allof the change. It has recently been shown that airwayresistance increases in humans and dogs at high lung vol-umes, although the mechanisml for this is obscure (24).If this were present in asthma to a greater degree thannormal then this could account for the change in Ru5. Ifso one might expect to see sianiilar curves in nonre-sponders. but this wsas not the case (Fig. 6). For this
reason we favor the explanation that the cross-sectionalarea at EPP in asthmatics who respond to He-O0, issubstantially smaller than the trachea, that this reductionis due to bronchospasm and that it results in a resistanceto convective acceleration that is a major component ofthe upstream resistance even though flow rates are mark-edlv reduced.
ACKNOWLEDGMENTSThis work was supported by a grant from the Medical Re-search Council of Canada.
REFERENCES1. Hogg, J. C., P. T. Macklem, and W. M. Thurlbeck.
1968. Site and nature of airway obstruction in chronicobstructive lung disease. N. Engl. J. Med. 278: 1355.
2. Dulfano, M. J., and J. Hewetson. 1966. Radiologic con-tributions to the nosology of obstructive lung diseaseentities. Dis. Chest. 50: 270.
3. Epstein, B. S., J. Sherman, and E. E. Walzer. 1948.Bronchography in asthmatic patients, with the aid ofadrenalin. Radiology. 50: 96.
4. Vogt Moykopf, I., and H. Laqua. 1964. Die endobronchi-ale Installation eines Bronchospasmolytikums zur L6sungvon Spasmen wahrend der Bronchographie. Thorax-chirurgie. 11: 482.
5. Levine, G., E. Housley, P. MacLeod, and P. T. Mack-lem. 1970. Gas exchange in mild bronchitis and asympto-matic asthma. N. Engl. J. Med. 282: 1277.
6. McFadden, E. R., Jr., and H. A. Lyons. 1969. Serialstudies of factors influencing airway dynamics duringrecovery from acute asthma attacks. J. Appl. Physiol.27: 452.
7. Woolcock, A. J., N. J. Vincent, and P. T. Mackleni.1969. Frequency dependence of compliance as a test forobstruction in the small airways. J. Cliii. Intvest. 48:1097.
8. Mead, J., J. M. Turner, P. T. Macklem, and J. B. Little.1967. Significance of the relationship between lung recoiland maximum expiratory flow. J. Appl. Physiol. 22: 95.
9. Macklem, P. T., and N. J. Wilson. 1965. Measurementof intrabronchial pressure in man. J. 4pp!. Physiol. 20:653.
10. Wood, L. D. H., and A. C. Bryan. 1969. Effect of in-creased ambient pressure on flow-volume curve of thelungs. J. Appl. Physiol. 27: 4.
11. Schilder, D. P., A. Roberts, and D. L. Fry. 1963.Effect of gas density and viscosity on the maximal ex-piratory flow-volume relationship. J. Clin. Invest. 42:1705.
12. Anthonisen, N. R., M. E. Bradley, J. Vorosmarti, andP. G. Linaweaver. 1971. Mechanics of breathing withhelium-oxygen and neon-oxygen mixtures in deep satu-ration diving. In Underwater Physiology. C. J. Lambert-son, editor. Academic Press, Inc., New York. 339.
13. Grape, B., E. Channin, and J. M. Tyler. 1960. The effectof helium and oxygen mixtures on pulmonary re-sistances in emphysema. Am. Rev. Respir. Dis. 81: 823.
14. Wood, W. B., and T. B. Barnett. 1965. Effects of heliummixtures on ventilatory response to C02 in subj ectswith airway obstruction. Clin. Res. 13: 77. (Abstr.)
.3242 P. J. Despas, M. Leroux, and P. T. Macklem
15. Gold, M., A. Marks, and J. S. Bocles. 1964. Effects ofreduction in air density on dynamic function in ob-structive airway disease. Am. Rev. Respir. Dis. 90:316. (Abstr.)
16. Schiller, I. W., F. C. Lowell, M. T. Lynch. and W.Franklin. 1955. The effect of helium oxygen mixtureson pulmonary function in asthmatic patients. J. Allergy.26: 11.
17. Barnett, T. B. 1967. Effects of helium and oxygen mix-tures on pulmonary mechanics during airway constric-tion. J. Appl. Physiol. 22: 707.
18. Mead, J. 1960. Volume displacement body plethysmo-graph for respiratory measurements in human subjects.J. Appl. Physiol. 15: 736.
19. Mead, J., and J. L. Whittenberger. 1953. Physical prop-erties of human lungs measured during spontaneousrespiration. J. Appl. Physiol. 5: 779.
20. Olson, D. E., and J. W. Gersten. 1968. The pressure
drop, fluid flow regime and velocity profile of air in-spired into the human lung. Fed. Proc. 27: 228 (Abstr.62)
21. Macklem, P. T., and J. Mead. 1968. Factors determiningmaximum expiratory flow in dogs. J. Appl. Physiol.25: 159.
22. Macklem, P. T., R. G. Fraser, and W. G. Brown. 1965.Bronchial pressure measurements in emphysema andbronchitis. J. Clin. Invest. 44: 897.
23. Olsen, C. R., A. E. Stevens, and M. B. McIlroy. 1967.Rigidity of tracheae and bronchi during muscular con-striction. J. Appl. Physiol. 23: 27.
24 Vincent, M. J., R. Knudson, D. E. Leith, P. T. Mack-lem, and J. Mead. 1970. Factors influencing pulmonaryresistance. J. Appl. Physiol. 29: 236.
25. Bates, D. V., P. T. Macklem, and R. V. Christie.1971. Respiratory Function in Disease. W. B. Saunders& Co., Philadelphia. 2nd edition.
Site of Airway Obstruction in Asthma 3243
Related Documents