Journal of Neuroscience Methods 94 (1999) 81 – 92 Single-trial estimation of neuronal firing rates: From single-neuron spike trains to population activity Martin Nawrot, Ad Aertsen, Stefan Rotter * Neurobiology and Biophysics, Institute of Biology III, Albert -Ludwigs -Uni6ersity, Scha ¨nzlestraße 1, D-79104 Freiburg, Germany Received 15 July 1999; accepted 5 August 1999 Abstract We present a method to estimate the neuronal firing rate from single-trial spike trains. The method, based on convolution of the spike train with a fixed kernel function, is calibrated by means of simulated spike trains for a representative selection of realistic dynamic rate functions. We derive rules for the optimized use and performance of the kernel method, specifically with respect to an effective choice of the shape and width of the kernel functions. An application of our technique to the on-line, single-trial reconstruction of arm movement trajectories from multiple single-unit spike trains using dynamic population vectors illustrates a possible use of the proposed method. © 1999 Elsevier Science B.V. All rights reserved. Keywords: Dynamic population vector; Dynamic spike responses; Kernel estimator; Neural coding; Single-trial rate estimation; Spike train analysis; Stochastic point process www.elsevier.com/locate/jneumeth 1. Introduction Most prevailing models of neural coding rely heavily on neuronal firing rates. It has been demonstrated in many physiological studies that the firing rate reveals relevant aspects of a neuron’s involvement in informa- tion processing and computation. The availability of methods to measure firing rates from neuronal spike trains is therefore essential. The conventional strategy is to average the spike responses over repeated trials in the form of a peri-stimulus time histogram (PSTH; Gerstein and Kiang, 1960), and to interpret the out- come as an estimate of the time-varying rate function (Fig. 1). Using this technique, important insights into the neural mechanisms of sensory and motor processing have been gained. There are, however, a number of problems with this approach: (1) Not all interesting experiments can be forced into a repeated-trial design; (2) averaging across trials requires stationarity across trials, which is not always guaranteed; (3) potentially relevant dynamic effects which are not strictly time-locked to the trigger event do not survive trial-averaging. For these various reasons it is becoming increasingly important to elimi- nate the need for trial-averaging and to consider, in- stead, the alternative of estimating spike rates on the basis of single-trial responses. In addition, (4) the issue of trial-by-trial variability of neuronal responses is re- cently receiving increasing interest (Arieli et al., 1996; Azouz and Gray, 1999). Moreover, (5) certain multiple- electrode recording experiments (e.g. Chapin et al., 1999) create the need for a reliable on-line estimate of neuronal firing rates. The firing rate is a fundamental concept for the description of a spiking neuron (and a point process in general; Cox and Isham, 1980). The underlying firing rate r (t ), also termed intensity function, is a non-nega- tive deterministic function of time, such that the integral & t b t a r (t ) dt (1) represents the expected number of spikes encountered in an observation of the neuron during the observation interval [t a , t b ). In the context of the current paper, the underlying rate function is assumed to be invariant across trials. In reality, this rate function may change as a result of * Corresponding author. Tel.: +49-761-2032862; fax: +49-761- 2032860. E-mail address: [email protected] (S. Rotter) 0165-0270/99/$ - see front matter © 1999 Elsevier Science B.V. All rights reserved. PII:S0165-0270(99)00127-2

Welcome message from author
This document is posted to help you gain knowledge. Please leave a comment to let me know what you think about it! Share it to your friends and learn new things together.
Transcript
Journal of Neuroscience Methods 94 (1999) 81–92
Single-trial estimation of neuronal firing rates:From single-neuron spike trains to population activity
Martin Nawrot, Ad Aertsen, Stefan Rotter *Neurobiology and Biophysics, Institute of Biology III, Albert-Ludwigs-Uni6ersity, Schanzlestraße 1, D-79104 Freiburg, Germany
Received 15 July 1999; accepted 5 August 1999
Abstract
We present a method to estimate the neuronal firing rate from single-trial spike trains. The method, based on convolution ofthe spike train with a fixed kernel function, is calibrated by means of simulated spike trains for a representative selection ofrealistic dynamic rate functions. We derive rules for the optimized use and performance of the kernel method, specifically withrespect to an effective choice of the shape and width of the kernel functions. An application of our technique to the on-line,single-trial reconstruction of arm movement trajectories from multiple single-unit spike trains using dynamic population vectorsillustrates a possible use of the proposed method. © 1999 Elsevier Science B.V. All rights reserved.
Keywords: Dynamic population vector; Dynamic spike responses; Kernel estimator; Neural coding; Single-trial rate estimation; Spike trainanalysis; Stochastic point process
www.elsevier.com/locate/jneumeth
1. Introduction
Most prevailing models of neural coding rely heavilyon neuronal firing rates. It has been demonstrated inmany physiological studies that the firing rate revealsrelevant aspects of a neuron’s involvement in informa-tion processing and computation. The availability ofmethods to measure firing rates from neuronal spiketrains is therefore essential. The conventional strategy isto average the spike responses over repeated trials inthe form of a peri-stimulus time histogram (PSTH;Gerstein and Kiang, 1960), and to interpret the out-come as an estimate of the time-varying rate function(Fig. 1). Using this technique, important insights intothe neural mechanisms of sensory and motor processinghave been gained.
There are, however, a number of problems with thisapproach: (1) Not all interesting experiments can beforced into a repeated-trial design; (2) averaging acrosstrials requires stationarity across trials, which is notalways guaranteed; (3) potentially relevant dynamiceffects which are not strictly time-locked to the trigger
event do not survive trial-averaging. For these variousreasons it is becoming increasingly important to elimi-nate the need for trial-averaging and to consider, in-stead, the alternative of estimating spike rates on thebasis of single-trial responses. In addition, (4) the issueof trial-by-trial variability of neuronal responses is re-cently receiving increasing interest (Arieli et al., 1996;Azouz and Gray, 1999). Moreover, (5) certain multiple-electrode recording experiments (e.g. Chapin et al.,1999) create the need for a reliable on-line estimate ofneuronal firing rates.
The firing rate is a fundamental concept for thedescription of a spiking neuron (and a point process ingeneral; Cox and Isham, 1980). The underlying firingrate r(t), also termed intensity function, is a non-nega-tive deterministic function of time, such that theintegral& tb
ta
r(t) dt (1)
represents the expected number of spikes encounteredin an observation of the neuron during the observationinterval [ta, tb).
In the context of the current paper, the underlyingrate function is assumed to be invariant across trials. Inreality, this rate function may change as a result of
* Corresponding author. Tel.: +49-761-2032862; fax: +49-761-2032860.
E-mail address: [email protected] (S. Rotter)
0165-0270/99/$ - see front matter © 1999 Elsevier Science B.V. All rights reserved.PII: S 0 1 6 5 -0270 (99 )00127 -2
0
20
50
100
ρ [H
z]0 500 1000
0
20
50
100
time [ms]
λ [H
z]
A
B
C
D
0 500 10000
20
50
100
time [ms]
rate
[H
z]
tria
l
A
B
M. Nawrot et al. / Journal of Neuroscience Methods 94 (1999) 81–9282
circumstances beyond the control of the experimenter.However, even if the rate function is the same overtrials, individual spike trains in repeated observationsmay vary considerably, as a result of random fluctua-tions. The underlying rate is nevertheless reflected bythe instantaneous density of spikes.
The rate function underlying the spiking of a realneuron, however, cannot be observed directly, it mustbe reconstructed from the recorded spike trains. Unfor-tunately, the theory of stochastic point processes doesnot currently provide a substantial apparatus for thedirect inference of underlying dynamics from experi-mental data. Here, we describe a method to estimatethe neuronal firing rate from single-trial spike trains byconvolution with a fixed kernel function. The methodis calibrated on the basis of simulated spike trains fora selected set of typical dynamic underlying ratefunctions. From this we derive rules for the optimizeduse and performance of the kernel method. Finally,we present an application of our technique to theon-line, single-trial reconstruction of arm movementtrajectories from multiple single-unit spike trains usingdynamic population vectors. Preliminary results havebeen presented in abstract form (Nawrot et al., 1997,1999).
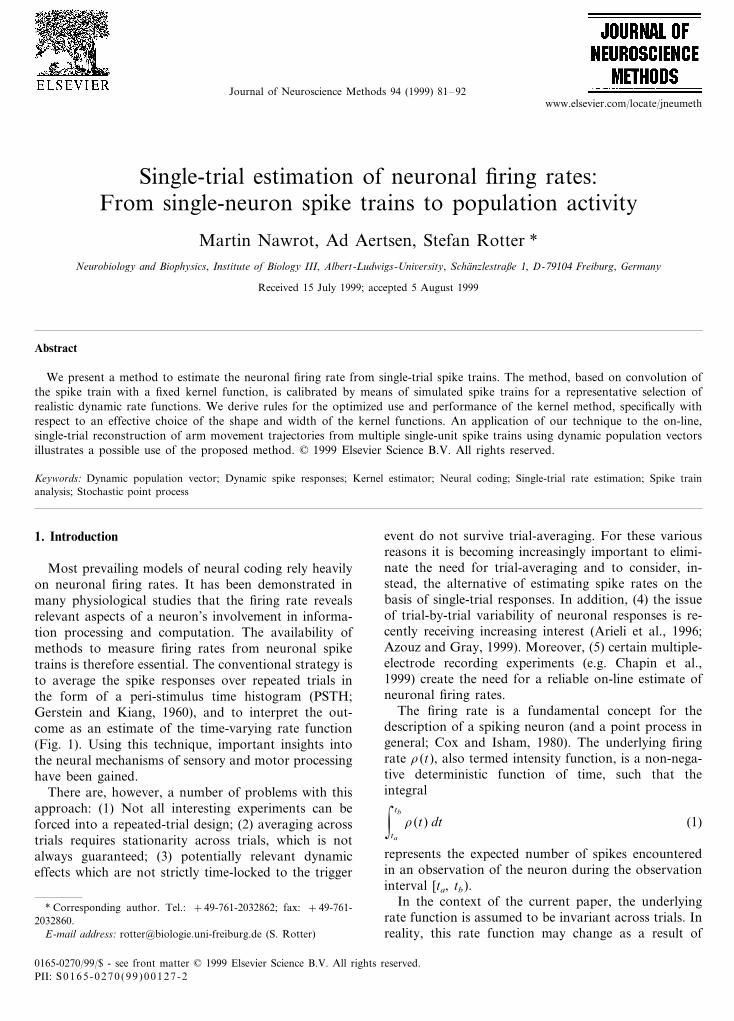
Fig. 2. Concept of single-trial rate estimation by means of the kernelapproach. The ‘true’ underlying rate function r(t) shown in (A) isestimated from one single-trial spike train (B) by taking the sum overkernel functions K(t− ti), centered at spike occurrence times ti (C),yielding the empirical rate function l(t) shown in (D). In thisparticular example, a triangular kernel with a standard width ofs=40 ms was used.
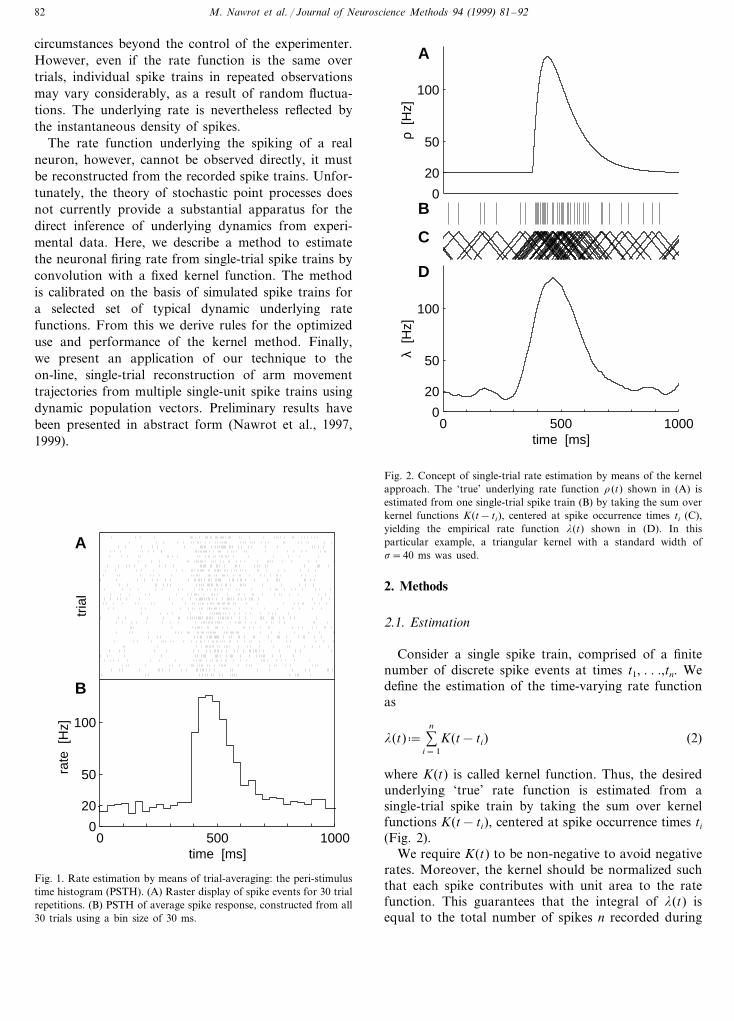
Fig. 1. Rate estimation by means of trial-averaging: the peri-stimulustime histogram (PSTH). (A) Raster display of spike events for 30 trialrepetitions. (B) PSTH of average spike response, constructed from all30 trials using a bin size of 30 ms.
2. Methods
2.1. Estimation
Consider a single spike train, comprised of a finitenumber of discrete spike events at times t1, . . .,tn. Wedefine the estimation of the time-varying rate functionas
l(t)� %n
i=1
K(t− ti) (2)
where K(t) is called kernel function. Thus, the desiredunderlying ‘true’ rate function is estimated from asingle-trial spike train by taking the sum over kernelfunctions K(t− ti), centered at spike occurrence times ti
(Fig. 2).We require K(t) to be non-negative to avoid negative
rates. Moreover, the kernel should be normalized suchthat each spike contributes with unit area to the ratefunction. This guarantees that the integral of l(t) isequal to the total number of spikes n recorded during

−3 −2 −1 0 1 2 3
0
30
time [σ]
K [
1/σ]
A
−1 −0.5 0 0.5 1
0
1
frequency [1/σ]
B
M. Nawrot et al. / Journal of Neuroscience Methods 94 (1999) 81–92 83
Table 1Tested kernel functionsa
Kernel SupportK(t, s)
Boxcar 1
23s[−3s, 3s ]
Triangle 1
6s2(6s−�t �) [−6s,6s ]
Epanechnikov 3
45s
�1−
t2
5s2
�[−5s,5s ]
Gauss[−�,+�]
1
2psexp
�−
t2
2s2
�a Outside the support, the kernels are defined to be zero. All kernel
functions are normalized to unit area and have standard width s.
&�−�
t K(t) dt=0. (3c)
The properties of the estimation depend on the prop-erties of the specific kernel function chosen. Two as-pects are important: the shape of the kernel functionand its width. The kernel shape determines the visualappearance of the estimated rate function. The stan-dard width of the kernel
s='&�
−�
t2 K(t) dt (4)
specifies the temporal resolution of the rate estimation.Hence, s can be viewed as a smoothing parameter.Table 1 lists the four kernel functions of differentshapes that we tested, parametrized by their standardwidth. Fig. 3 shows the time course and Fourier trans-form of these four types of kernels.
Kernel estimators are widely used and treated theo-retically in the context of density estimation (Parzen,1962; Silverman, 1986; Scott, 1992; Bowman, 1997).The method has also been proposed for estimatingneuronal firing rates by various authors (Sanderson,1980; Richmond et al., 1987, 1990; Paulin, 1992;Nawrot et al., 1997; Szucs, 1998).
2.2. Calibration
To test the kernel estimator method we employ acalibration procedure on the basis of simulated spiketrains, generated according to pre-set underlying ratefunctions with a variety of parametrized dynamics. Thecalibration involves three steps. First, we specify thestochastic point process used for generating spike data.Second, we choose a representative class of underlyingrate functions that will be used for the simulations.Third, we define a quality measure with which we canassess the performance of the rate estimation.
2.2.1. The Poisson processThe underlying rate function is only partially specify-
ing the point process, it represents its ‘deterministic’aspects. The actual stochastic properties of spike gener-ation are reflected by the probability distribution of thespike counts for each observation interval.
In the context of neuronal modeling, the most fre-quently used type of stochastic point process is thePoisson process. In fact, it is the most elementary typeof stochastic point process (Cox and Isham, 1980). Thepoints occur independently of each other, governedonly by the rate function. As a consequence, the spikecounts have a Poisson distribution with both mean andvariance given by expression (1). The simplicity of thePoisson model supports the generation of computer-simulated spike trains, while being not too remote fromreal spike trains recorded from physiological neurons.
Fig. 3. Tested kernel functions (—Triangle, – – Boxcar, –·– Gauss,· · · Epanechnikov). All kernels have unit area and are parametrizedaccording to their standard width s (cf. Table 1). (A) Time courseand (B) Fourier transforms of kernel functions.
the observation interval. Finally, we require the firstmoment of K(t) to be zero to preserve the center ofmass of the spike train. Taken together, this leads tothe following constraints on the kernel function:
K(t)]0, (3a)&�−�
K(t) dt=1, (3b)

M. Nawrot et al. / Journal of Neuroscience Methods 94 (1999) 81–9284
Table 2Simulation parameters for the dynamic rate function r(t): constantbackground rate b, response strength A and response width wa
b [Hz] 1 2 5 10 20 30 40 50 –0A [spikes] 5 10 20 30 40 50 80 100
20 30 40 50 8010 100w [ms] 150 200
a The parameter space tested is spanned by a selection of triplecombinations (b, A, w) taken from this set.
spikes and w=100 ms is shown in Fig. 2A. ThirtyPoisson realizations using this underlying rate functionare shown in Fig. 1A.
2.2.3. Measure of performanceTo evaluate the performance of the rate estimator
(Eq. 2) we use the integrated square error (Silverman,1986; Scott, 1992)
ISE�& T
0
(l(t)−r(t))2 dt (8)
as a global measure of the discrepancy of the estimatedrate function l(t) from the underlying rate functionr(t). The integral was computed for a fixed observationinterval, which we chose to begin 100 ms before re-sponse onset and to end 400 ms after it. The better theagreement between the underlying rate function r(t)and its estimate l(t), the lower the value of ISE. Anexample for visual comparison of underlying and esti-mated rate functions is shown in Fig. 2A and D,respectively.
For each intensity function rb,A,w(t), we simulated anensemble of N=100 trials. From each spike train wethen estimated a single-trial rate function and calcu-lated the ISE with respect to rb,A,w(t). As a measure forthe performance of the rate estimation method forensembles of trials we used the mean integrated squareerror
MISEN��ISE�N=1N
%N
j=1
& T
0
(lj(t)−r(t))2dt (9)
as the mean ISE for N single-trial estimations lj(t) ofthe same underlying rate function r(t).
3. Results
The results of our calibration procedure, expressed interms of the mean integrated square error MISE, showhow the performance of the rate estimation depends onshape and width of the kernel function. Based on asystematic variation of the parameters (b, A, w), wederived rules for the construction of optimized kernelswhen applying the method to experimental data.
3.1. Influence of kernel shape
In the case of constant spike rates, i.e. in the absenceof a phasic response, the four kernel shapes performvirtually identically, independent of the rate level. Ascan be seen for a typical example in Fig. 4A, the fourkernel shapes can hardly be distinguished on the basisof their MISE values. The standard deviation of ISEs,calculated from an ensemble of single-trial estimateswith a Triangle kernel, is larger than the differencesbetween mean values for different kernel shapes.
2.2.2. A family of rate functionsNext, we have to define a class of realistic dynamic
rate functions r(t) that resemble typical PSTHs from invivo single-unit spike recordings. For this purpose wechose a parametric family of phasic response profiles,superimposed on a stationary background of adjustablestrength. All parameters were subject to systematicvariation. The phasic response was selected to be pro-portional to a beta-function
bt 1,t 2(t)�Í
Ã
Ã
Á
Ä
1t1−t2
�e−
t
t1−e−t
t2�
0
for t\0
for tB0
(5)
where tl\t2\0 are the falling and rising time con-stants, respectively. Here, bt 1,t 2
(t) is normalized to unitarea, and its standard width is given by
w=t12+t2
2. (6)
We finally define the following class of intensityfunctions
rb,A,w(t)�b+A bt 1,t 2(t− t0), with t1=2t2 (7)
where t0 denotes the time of response onset. Thus, wehave three parameters that capture the essential proper-ties of the underlying rate function. The constant back-ground rate b accounts for spontaneous activity. Theresponse strength A is the integral over the phasicexcitatory response; it measures the expected number ofspikes exceeding spontaneous activity. The temporalextent of the response is characterized by its standardwidth w.
To test the performance of the rate estimation, wegenerated sets of repeated trials of artificial spike traindata for a variety of choices for the parameters(b, A, w) according to Table 2. We made sure that thescanned parameter range covers dynamic rate functionsas they are typically observed in physiological record-ings from a variety of brain areas, including criticalcases with weak responses, possibly in the presence ofhigh background rates. Time-inverted versions of theserate functions are implicitly covered by our analysis,because all tested kernels are symmetrical. An examplefor a rate function with parameters b=20 Hz, A=20

0 20 40 60 80 1000
σ [ms]
MIS
E
A
0 20 40 60 80 1000
σ [ms]
MIS
E
B
M. Nawrot et al. / Journal of Neuroscience Methods 94 (1999) 81–92 85
In the case of time-varying rates (A\0) we obtainedthe same result. Different kernels perform equally wellover a broad range of kernel widths. As shown in theexample of Fig. 4B, the main features of the graphs arepresent for all four kernel shapes. In particular, foroptimal choice of s, the difference in performance fordifferent kernel shapes is negligible. This finding is ingood agreement with theoretical results given in Silver-man (1986) and Scott (1992).
From these results we can draw the conclusion thatthe choice of a specific kernel shape is not critical forthe estimation error. Thus, the choice of the kernelshape can be based on other considerations, in particu-lar visual appearance (e.g. smoothness) of the estimatedrate. The latter is determined by the filter properties ofthe kernel function, which can be inferred from itsfrequency spectrum (Fig. 3B).
The results shown in Fig. 4 also indicate that thestandard width is a good choice for parametrizing thetemporal resolution of K(t) with respect to the com-parability of kernel shapes.
Computational costs scale with the extent of thesupport, i.e. the domain over which the kernel functionassumes non-zero values. This parameter is comparablefor all kernels, with the exception of the Gaussiankernel. This latter kernel, predominant in earlier publi-cations on this subject, must be constrained to a rea-sonable finite support (cf. Fig. 3A) to be competitivewith respect to computational costs. All results pre-sented in subsequent sections are based on estimationsusing a Triangle kernel.
3.2. Influence of kernel width
3.2.1. Constant ratesFig. 5 summarizes the performance of the kernel
estimator for stationary spike rates. Specifically, weanalyzed the dependence of the estimation error MISEon spike rate b and kernel width s. Fig. 5A generalizesthe result obtained in Fig. 4A for different firing ratesb. In each case, we observe a monotonic decrease ofMISE with increasing kernel width s. As was to beexpected for a constant rate, a better estimate of therate is obtained for a wider kernel.
When comparing the performance of the kernel esti-mator for different values of the spike rate, we observean increase of MISE and, hence, a decrease of perfor-mance with rate. This is a straightforward result of thestatistical properties of the Poisson process: the vari-ance of the spike count increases with its rate. This, infact, suggests to normalize the MISE by dividing it bythe variance of the total spike count, which is propor-tional to the rate b in the case of a Poisson process.Indeed, Fig. 5B shows that the variance-normalizedMISE is independent of the spike rate, apart fromstatistical fluctuations.
3.2.2. Time-6arying rates: 6ariation of responseduration
We now turn to the performance of the kernel esti-mator for time-varying rate functions. In our simula-tions, this is accomplished by having a phasic responsecomponent, characterized by its response strength Aand duration w, superimposed on a constant back-ground b.
We first consider the dependence of the estimatorperformance on the kernel width s under variation ofthe response duration w. The response strength A andbackground level b are kept fixed. The results aresummarized in Fig. 6. Observe that for each choice ofresponse duration there exists a unique optimal choiceof kernel width s. For instance, in the case ofw=50 ms, best performance is achieved for :20 ms,
Fig. 4. Performance of rate estimation for different kernel shapes,depending on the kernel width s. Line styles as in Fig. 3. Error barsdenote the standard deviation of the integrated square error from 100single-trial estimations with a Triangle kernel. (A) MISE as a func-tion of s for the estimation of a constant rate with b=10 Hz. (B)MISE as a function of s in the case of a time-varying rate functionwith simulation parameters b=10 Hz, A=20, w=50 ms. The esti-mate is optimal for s:20 ms, independent of the kernel shape. Forboth constant and transient rate functions, the choice of the kernelshape has almost no influence on the performance of the rateestimation.

0 50 100 150 2000
10
20
30
40
50
σ [ms]
b [H
z]
A
0 50 100 150 2000
20
40
60
80
100
σ [ms]
w [
ms]
0 50 100 150 2000
10
20
30
40
50
σ [ms]
b [H
z]
B
M. Nawrot et al. / Journal of Neuroscience Methods 94 (1999) 81–9286
Fig. 5. Performance of rate estimation for constant rates b, dependingon the kernel width. (A) Absolute error (MISE), (B) variance-normal-ized error (MISE/b). Gray code using arbitrary units, darker regionsrepresent better performance (low MISE resp. MISE/b), lighter re-gions represent worse performance (high MISE resp. MISE/b). Con-tour lines are drawn for equidistant levels of MISE and MISE/b,respectively.
Fig. 6. Dependence of rate estimation performance on kernel width,under variation of the duration w of the phasic response. Backgroundrate b=10 Hz and response strength A=20 spikes are fixed. Graycode as in Fig. 5; contour lines are drawn for equidistant MISElevels. Dashed line fitted to minimum values of MISE.
mine the optimal time resolution to be chosen in theanalysis. Conversely, the time resolution chosen in theanalysis poses a lower bound for the time constants ofthe dynamics that can be reliably reconstructed.
3.2.3. Time-6arying rates: 6ariation of responsestrength and background rate
Next, we consider the dependence of the estimatorperformance on the kernel width s under variation ofthe response strength A. Now, the response duration wand background level b are kept fixed. The results areshown in Fig. 7A.
Observe that for large enough response strength A,there exists a clear minimum of the MISE, and anassociated optimal choice of s close to the shorter timeconstant of the response transient. For increasing val-ues of A, this optimum slowly shifts towards smallervalues of s (cf. dashed line in Fig. 7A). Hence, for weakphasic responses, the temporal resolution of the rateestimation is reduced. As in Fig. 5, the gradual decreaseof MISE values for smaller A reflect the decrease invariance of the corresponding spike counts.
Analogous conclusions can be drawn from the resultsof variation of the background rate b (Fig. 7B). Asimilar behavior of the optimal kernel width s as inFig. 7A is obtained, provided we replace a decrease ofA by an increase of b. This underlines the dual roles of
coinciding with the shorter of the two time constantsgoverning the rate dynamics (Eq. 5). For the parameterrange shown here, the optimal choice of kernel widthincreases approximately linearly with the response du-ration, as indicated by the dashed line in Fig. 6.
This result confirms our expectation that the fastesttime constants of the underlying rate dynamics deter-

0 20 40 60 80 1000
20
40
60
80
100
σ [ms]
A
A
0 20 40 60 80 1000
5
10
15
20
25
30
σ [ms]
b [H
z]
B
M. Nawrot et al. / Journal of Neuroscience Methods 94 (1999) 81–92 87
Fig. 7. Dependence of rate estimation performance on kernel width,under variation of (A) the strength A of phasic response and (B) thebackground rate b. In (A) the background rate b=20 Hz andresponse duration w=50 ms. In (B) the response strength A=5 andresponse width w=20 ms. Gray code as in Fig. 5; contour lines aredrawn for equidistant MISE levels. Dashed lines fitted to minimumvalues of MISE.
3.2.4. Rules for optimized use and performance of thekernel method
Given a measured spike train, we will now outlinetwo possible and complementary strategies for findingan optimized kernel to be employed for single-trial rateestimation.
The first strategy is based on the availability ofsufficient pre-knowledge about the underlying ratefunction. Calibration plots as discussed in the previoussections can then be used to determine a kernel whichpromises (near-)optimal rate estimators. The resultsfrom our numerical analyses have been cast into a setof rules to guide the user in the search for the optimalkernel (see Table 3). Starting from educated guesses ofthe temporal width w, the strength A of the response,and the intensity b of the background rate, one canread out the width s of the best-performing kernel fromthe corresponding calibration plots as in our Figs. 5–7.Iterative improvement by repeated application of thisprocedure might recommend itself.
The second strategy, in contrast, does not rely somuch on pre-information and user interaction. Thenon-monotonic dependence of the MISE on kernelwidth, especially at larger values of the responsestrength A and low values of the background rate b,suggests an alternative approach to determine the un-known rate dynamics underlying an experimentally-recorded spike train. By systematically reducing thekernel width s and evaluating the ISE for pairs ofsuccessive rate estimates associated with these kernels,one typically encounters a more or less clear minimumin this measure of difference, located at some criticalvalue of the kernel width s. We applied this unsuper-vised search procedure to a number of single-trial spiketrains for a representative selection of underlying ratefunctions. The results are shown in Fig. 8. Observe thatin most cases considered, this procedure indeed yields aclear minimum, provided the response is not too weakor too wide. In each case, we also show the width of thekernel which was found to be optimal according to ourpreviously stated criteria (dotted lines in Fig. 8). Wefound very good agreement between these two num-bers, in all cases examined. Hence, the location of theminimum in our iterative procedure provides a usefulestimate of the optimized kernel width, even in theabsence of prior information on the underlying ratedynamics.
We applied both strategies for determining an opti-mized kernel width to real spike trains recorded fromsingle neurons of the monkey motor cortex. For suchdata, obviously, no reference to a known underlyingrate function is possible. Nevertheless, in all cases con-sidered the unsupervised search yielded an unequivocalprescription of an optimized kernel width s. Dependingon the characteristics of the particular data set, this
these two parameters of the response. By contrast, bothan increase in A and an increase in b lead to an increasein total spike count. As a consequence, in both casesthe variance is increased, implying larger values for theMISE, as is reflected by the similarity of gray gradientsin both Fig. 7A and B.

1 10 100
ISE
σ [ms]
w=20ms w=50ms w=100ms
A=
20A
=50
A=
100
M. Nawrot et al. / Journal of Neuroscience Methods 94 (1999) 81–9288
optimized kernel width was in the range of a few tens ofmilliseconds. Again, it was possible to confirm thisestimate by an application of the first method, starting
out from rough estimates of the response parametersobtained by visual inspection of the raw spike trains.The possibility to cross-validate the results, an applica-
Table 3Rules for optimized use and performance of the kernel methoda
Rule Figures
Stationary ratesThe wider the kernel the better 4A, 5A, B1
Transient ratesKernel shape not important 4A, B2
4B, 6, 7A, B3 Kernel width must be tuned for optimal performance,depending on response strength, response duration, and background rate
Unique optimal kernel width exists and4is proportional to (fastest) time constant 6
7Adecreases with increasing response strengthincreases with increasing background rate 7B
a These results are based on an evaluation of the MISE for numerical simulations of a representative and physiologically plausible selection ofdynamic rate functions.
Fig. 8. Unsupervised search to identify optimized kernel width for single trial spike trains. Each curve shows the ISE between successive rateestimates, determined by progressively decreasing the kernel width s by equidistant steps on a logarithmic scale. Each frame shows the results forfive individual trials of spike data for a particular choice of response strength A, response duration w, and background rate b. Different framescorrespond to representative selections of response strength A and response duration w ; the background rate b=20 Hz was fixed in all cases.Observe that in most cases the ISE curves show a more or less clear minimum, provided the response is not too weak or too wide. For comparisonwith previous results, obtained from direct comparison of the reconstructed rates with the known underlying rate function, the dotted linesindicate the kernel width for which the estimator showed best performance in terms of MISE (dashed line in Fig. 7 A). In each row of framesall ordinates are scaled identically.

0 10 20 30 400
10
20
30
40
50
σ [ms]
N
A
0 10 20 30 400
10
20
30
40
50
σ [ms]
N
B
M. Nawrot et al. / Journal of Neuroscience Methods 94 (1999) 81–92 89
Fig. 9. Performance of trial-averaged kernel estimation in comparisonwith the PSTH. Shown is the MISE of reconstructed rates forrandomly drawn ensembles of N trials for (A) trial-averaged kernelestimates using a triangular kernel of width s and (B) conventionalPSTH estimates using bins of width 23s matched to the standardwidth s of the Boxcar kernel. Example for fixed simulation parame-ters b=20 Hz, A=20, w=50 ms. Gray scales for MISE values areidentical in both plots. Dashed line fitted to minimum values ofMISE.
estimator for single-trial estimates. Now we will con-sider the question how good the kernel estimator per-forms as a trial-averaging technique in comparison withthe classical method of constructing a PSTH. To thisend, we perform rate estimation for each single-trialseparately and average the resulting rate estimatesacross a number of trials before evaluating the ISE.
Exemplary results are shown in Fig. 9. In the case ofkernel estimation (Fig. 9A) there exists a unique opti-mal kernel width s for any number of trials N. Ascould be expected, the temporal width of the kernelmay be chosen smaller, the more trials are available.Thus, the temporal resolution that can be attained bythe rate estimate improves with the number of trials N(cf. dashed line in Fig. 9A). The integrated square errordecreases approximately with the square root of N.
In comparison, the results of PSTH performance(Fig. 9B) show that there is no optimal bin width forconstructing the histogram. The vertical stripes in thisFigure are a Moire-type pattern, reflecting the misalign-ment of the discrete binning grid with the responseonset t0 (cf. Section 2.2.2). Only if t0 lies exactly on thegrid, the region around the response onset is faithfullycaptured by the PSTH.
In general, on the basis of a fixed number of trials,the kernel estimator performs decisively better than thePSTH. In practical terms, this implies that kernel esti-mation needs considerably fewer trials than the his-togram approach to achieve an equally good ratereconstruction.
Note that in our simulations we did not introduceany trial-specific latency variations for the responseonset t0. Such latencies are, however, often present inexperimental data where repeated trials are not strictlytime-locked to the response-inducing event (typically astimulus) (Sanderson, 1980; Richmond et al., 1990;Nawrot et al., 1999). In the presence of such latencyvariations, the binning artifact will be diminished. Evi-dently, in this case, straightforward trial-averaging isbound to decrease the peak performance of both thePSTH and the kernel estimator. More sophisticatedtechniques, based on a realignment of trials, may thenbe invoked to obtain a faithful portrait of the dynamicrate functions (Sanderson, 1980; Nawrot et al., 1999).
3.3. Application to single-trial population 6ector
In the previous sections we were mainly concernedwith ascertaining ourselves that the kernel estimatoryields a reliable estimate of the underlying rate func-tions. Now, we will explore an application of themethod that specifically addresses two other importantaspects: the possibility of on-line estimation, combinedwith having access to the simultaneous activities ofmultiple-single neurons. This application, in fact, re-sembles earlier approaches to reconstruct the sensory
tion of a dual strategy as outlined above is, therefore,our strong recommendation.
3.2.5. Time-6arying rates: trial-a6eragingSo far we have evaluated the performance of our rate

Arm Trajectory
Preferred Directions of 100 Neurons0 1 2 3 4 5
time [s]
neur
ons
Integrated Population Vector
A B
C D
M. Nawrot et al. / Journal of Neuroscience Methods 94 (1999) 81–9290
Fig. 10. Representation of a fast 2D arm movement by simultaneous spike trains of a recorded population of 100 neurons. (A) Preferred directionsof all neurons contributing to the population vector, length of the vectors indicate velocity tuning. (B) Spike trains of a representative sample of30 neurons. An average firing rate between 10 and 25 Hz and Poisson statistics were used in the simulations. (C) Simulated hand trajectory, givingrise to the neuronal spike trains is shown. Observe how the frequent turns during the initial phase of the movement are reflected in dynamicchanges in the firing rates. (D) Reconstructed movement trajectory, obtained by integration of the population vector. The firing rates werecomputed from the spike trains without averaging by using the kernel method (Triangle, s=75 ms).
interpretation of multi-neuron spike trains (Johan-nesma, 1981; Gielen et al., 1988; Hesselmans and Jo-hannesma, 1989).
The on-line computation of time-dependent neuronalpopulation vectors (Georgopoulos et al., 1982;Schwartz, 1994) from simultaneously recorded spiketrains can be achieved by a straightforward applicationof the kernel method. Trial-averaging is not necessary,if (1) the neuronal population is large enough, (2) thepreferred directions of the individual neurons are uni-formly distributed, and (3) the parameters of the kernelare carefully chosen. An application to real-time con-trol of reaching movements of a robot arm on the basisof simultaneously recorded motor cortex neurons inextension to Chapin et al. (1999) thereby becomesfeasible.
We tested the performance of this approach on thebasis of computer simulated spike trains, assuming a
population of motor cortex neurons with realistic direc-tional and velocity tuning (Moran and Schwartz, 1999).If the directional tuning of a neuron follows a cosinelaw, its firing rate f(t) depends on the current velocityvector 6
�(t) of the movement according to
f(t)= f0+ p�
· 6�
(t) (10)
where f0 is the background firing rate and p�
is thepreferred movement direction of the neuron. The mod-ulation of the firing rate p
�· 6�
(t) is proportional to thevelocity of the movement, the length of the preferredvector p
�encodes the gain for velocity. For a randomly
sampled population of motor neurons, the preferredvectors p
�are broadly distributed, more or less evenly
covering all possible directions.We used the kernel method to reconstruct the time
course of the firing rate for each neuron of the popula-tion individually. On the basis of these rates, and

M. Nawrot et al. / Journal of Neuroscience Methods 94 (1999) 81–92 91
assuming that the preferred directions and velocity gainsof all neurons are known, the time-dependent populationvector can be constructed in the usual way. Temporalintegration of this population vector then yields a trajec-tory in space, which matches the trajectory of the originalarm movement in very good approximation (Fig. 10). Aquantitative evaluation of this procedure for real multi-neuron spike data is currently in progress. As was to beexpected, the reconstructed representation improves withthe size of the population. We found that, for therelatively fast type of movement shown, a population ofonly 50–100 neurons suffices to achieve a surprisinglyhigh quality of movement representation. Such numbersare rapidly becoming feasible using state-of-the-artmulti-electrode recording techniques (Nicolelis, 1998).
4. Discussion
We described a method to estimate the neuronal firingrate from single-trial spike train data. The method,basically a convolution of the spike train with a fixedkernel function, was calibrated on the basis of simulatedspike trains. Our findings demonstrate that estimation ofneuronal firing rates from single-trial spike trains isfeasible for a representative selection of physiologicallyrealistic dynamic spike responses, including difficultcases with weak responses against a relatively strongbackground. On the basis of these results, we derivedrules for the optimized use and performance of the kernelmethod, specifically with respect to an effective choice ofthe shape and width of the kernel functions.
To better localize sharp edges and other fast transientsof the underlying rate function (e.g. to extract theresponse latency or the slope at response onset), the useof asymmetric, causal or anti-causal, kernel shapessuggests itself. However, judged by the ISE measure,their use did not lead to improved rate estimates for thefamily of dynamic rate functions examined. To selec-tively assess the performance of rate estimators withrespect to such local features of the underlying ratefunction, different (non-integral) measures can be con-structed. The potential of such extended methods iscurrently being explored. Further experiments in ourlaboratory using extensions of the basic method (includ-ing adaptive kernels, Savitzky–Golay filters (Diesmannet al., 1996) and more general non-linear rate estimators(Nawrot et al., 1997)) yielded promising results. So far,however, they were not found to be widely applicable,primarily because the additional parameters make themless managable and, accordingly, they still require toomuch user intervention.
We are currently testing the applicability of single-trialrate estimates also in the context of other types of spiketrain analyses. A particularly important application inthis respect concerns their use as control measurements
against which to test multiple single-unit spike data forthe presence of dynamic spike synchronization phenom-ena (Gerstein and Aertsen, 1985; Aertsen et al., 1987,1989; Riehle et al., 1997; Grun et al., 1999).
The approach of single-trial estimation of neuronalfiring rates opens the way to address a number ofquestions that were previously impossible to be treatedwith conventional methods relying on trial-averaging. Asa possible application in this sense, we described theon-line, single-trial reconstruction of arm movementtrajectories from multiple single-unit spike trains usingdynamic population vectors.
Acknowledgements
We gratefully acknowledge the comments by M.Diesmann and D. Heck on an earlier version of themanuscript. This research was supported by theDeutsche Forschungsgemeinschaft (DFG), the German-Israeli Foundation for Scientific Research and Develop-ment (GIF) and the Human Frontier Science Program(HFSP).
References
Aertsen A, Bonhoeffer T, Kruger J. Coherent activity in neuronalpopulations: analysis and interpretation. In: Canianello ER, editor.Physics of Cognitive Processes. Singapore: World Scientific Pub-lishing, 1987:1–34.
Aertsen A, Gerstein G, Habib M, Palm G. Dynamics of neuronal firingcorrelation: modulation of ‘effective connectivity’. J Neurophysiol1989;61:900–17.
Arieli A, Sterkin A, Grinvald A, Aertsen A. Dynamics of ongoingactivity: explanation of the large variability in evoked corticalresponses. Science 1996;273:1868–71.
Azouz R, Gray CM. Cellular mechanisms contributing to responsevariability of cortical neurons in vivo. J Neurosci 1999;19:2209–23.
Bowman AW. Applied Smoothing Techniques for Data Analysis: TheKernel Approach with S-Plus Illustrations, volume 18 of OxfordStatistical Science Series. Oxford: Oxford University Press, 1997.
Chapin JK, Moxon KA, Markowitz RS, Nicolelis MA. Real-timecontrol of a robot arm using simultaneously recorded neurons inthe motor cortex. Nature Neurosci 1999;2:664–70.
Cox DR, Isham V. Point Processes. Monographs on Applied Proba-bility and Statistics. London: Chapman and Hall, 1980.
Diesmann M, Rotter S, Gewaltig MO, Aertsen A. Estimating thetemporal accuracy of neural spike responses. In: Schnitzler H,Elsner N, editors, Brain and Evolution. Proc 24th GottingenNeurobiology Conference, volume 2. 1996; 474.
Georgopoulos AP, Kalaska JF, Caminiti R, Massey JT. On therelations between the direction of two-dimensional arm movementsand cell discharge in primate motor cortex. J Neurosci1982;2:1527–37.
Gerstein GL, Kiang NY-S. An approach to the quantitative analysisof electrophysiological data from single neurons. Biophys J1960;1:15–28.
Gerstein GL, Aertsen AMHJ. Representation of cooperative firingactivity among simultaneously recorded neurons. J Neurophysiol1985;54:1513–28.

M. Nawrot et al. / Journal of Neuroscience Methods 94 (1999) 81–9292
Gielen C, Hesselmans G, Johannesma P. Sensory interpretation ofneural activity patterns. Math Biosci 1988;92:15–35.
Grun S, Diesmann M, Grammont F, Riehle A, Aertsen A. Detect-ing unitary events without discretization of time. J NeurosciMeth 1999; this volume.
Hesselmans G, Johannesma P. Spectro-temporal interpretation ofactivity patterns of auditory neurons. Math Biosci 1989;93:31–51.
Johannesma P. Neural representation of sensory stimuli and sen-sory interpretation of neural activity. In: Szekely G, Labos E,Damjanovich S, editors. Neural Communication and Control,volume 30 of Advances in Physiological Science. Oxford/Elms-frod: Pergamon Press, 1981:103–25.
Moran DW, Schwartz AB. Motor cortical representation of speedand direction during reaching. J Neurophysiol 1999; (in press).
Nawrot M, Rotter S, Aertsen A. Firing rate estimation from singletrial spike trains. In: Elsner N, Waessle H, editors, GottingenNeurobiology Report 1997, Stuttgart: Thieme, volume 2. 1997;623.
Nawrot M, Rotter S, Riehle A, Aertsen A. Variability of neuronalactivity in relation to behaviour. In: Elsner N, Eysel U, editors,Proceedings of the 1st Gottingen Neurobiology Conference ofthe German Neuroscience Society 1999, Stuttgart: Thieme, vol-ume 1. 1999; 101.
Nicolelis MAL. Methods for Neural Ensemble Recordings. BocaRaton, Florida: CRC Press, 1998.
Parzen E. On estimation of a probability density function andmode. Ann of Math Stat 1962;33:1065–76.
Paulin MG. Digital filters for firing rate estimation. Biol Cybern1992;66:525–31.
Richmond BJ, Optican LM, Podell M. Temporal encoding of two-dimensional patterns by single units in primate inferior tempo-ral cortex: I: response characteristics. J Neurophysiol1987;57:132–46.
Richmond BJ, Otican LM, Spitzer H. Temporal encoding of two-dimensional patterns by single units in primate primary visualcortex: I: stimulus-response relations. J Neurophysiol1990;64:351–69.
Riehle A, Grun S, Diesmann M, Aertsen A. Spike synchronizationand rate modulation differentially involved in motor corticalfunction. Science 1997;278:1950–3.
Sanderson AC. Adaptive filtering of neuronal spike train data.IEEE Trans Biomed Eng 1980;BME–27:271–4.
Schwartz AB. Direct cortical representation of drawing. Science1994;265:540–2.
Scott DW. Multivariate Density Estimation: Theory, Practice, andVisualisation. Wiley Series in Probability and MathematicalStatistics. Chichester/New York: John Wiley, 1992.
Silverman B. Density Estimation for Statistics and Data Analysis.London: Chapman & Hall, 1986.
Szucs A. Application of the spike density function in analysis ofneuronal firing patterns. J Neurosci Meth 1998;81:159–67.
..
Related Documents