SINGAPORE ENERGY STATSTICS 2016 1

Welcome message from author
This document is posted to help you gain knowledge. Please leave a comment to let me know what you think about it! Share it to your friends and learn new things together.
Transcript

S I N G A P O R E E N E R GY S TAT S T I C S 2 016
1

2 3
P R E FA C E
The Energy Market Authority of Singapore (EMA) embarked on an annual publication of Singapore Energy Statistics (SES) in 2011. This year, I am pleased to present to you our sixth edition which continues the expanded coverage of 43 data tables presented in 2015. I believe that the data, spanning across seven energy-related topics, will provide a comprehensive and in-depth understanding of Singapore’s energy landscape.
This publication starts with an overview of the supply of energy into Singapore (Chapter 1, Energy Supply), followed by its uses in the Transformation sector (Chapter 2, Energy Transformation) and its subsequent consumption by different end-users (Chapter 3, Energy Consumption). We further deep-dive into the commodity balance tables (Chapter 4, Energy Balances) before detailing the prices of these energy products (Chapter 5, Energy Prices). We continue the focus on the Solar Photovoltaic (PV) landscape in Singapore (Chapter 6, Solar) before concluding with key selected energy-related statistics such as the grid emission factor, and power sector manpower data (Chapter 7, Other Energy-Related Statistics).
Technical notes and a glossary accompany this publication to provide a background on the key definitions and concepts used.
The SES 2016 can also be accessed via a dedicated micro-site*. Additional energy-related statistics not covered in the SES 2016 can also be found online^.
The publication of this report is made possible through the co-operation and support of the many organisations, government ministries and statutory boards that have provided information. I would like to express my gratitude to all who have contributed towards this new milestone. We look forward to your continued support.
Bernard neeAssistant Chief ExecutiveEnergy Planning & Development DivisionEnergy Market AuthoritySingapore
June 2016
EnErgy markEt authority
*http://www.ema.gov.sg/Singapore_Energy_Statistics.aspx ^https://www.ema.gov.sg/Statistics.aspx
The Energy Market Authority (EMA) is a statutory board under the Ministry of Trade and Industry (MTI). Our main goals are to promote effective competition in the energy market, ensure a reliable and secure energy supply, and develop a dynamic energy sector in Singapore. Through our work, we seek to forge a progressive energy landscape for sustained growth.
ISSN 2251-2624
©Research and Statistics Unit, Energy Market Authority
All rights reserved. No part of this publication may be reproduced in any material form (including photocopy or storing it in any medium by electronic means and whether or not transiently or incidentally to some other use of this publication) without prior written permission of the copyright owner except in accordance with the provision of the Copyright Act (Cap. 63). Applications for the copyright owner’s written permission to reproduce any part of this publication should be addressed to:
directorPlanning dePartmentresearch & statistics Unit Energy Market Authority991G Alexandra Road #02-29Singapore 119975Republic of Singapore

4 5
taBle of contentstaBle of contents
technical notes
glossarY
section 04 energY Balances
section 05 energY Prices
section 06 solar
section 07 other energY-related statistics
Table
Table
TableTableTableTableTable Table
TableTableTable
TableTable TableTableTable
Table
Table
4.1
4.2
5.15.25.35.45.5 5.6
6.16.26.3
7.1 7.27.37.47.5
3.12
3.11
Electricity Balance Table
Natural Gas Balance Table
Electricity & Gas TariffsQuarterly Electricity Tariffs (Low Tension Tariffs)Annual Electricity Tariffs by Components (Low Tension Tariffs)Town Gas Tariffs by QuarterConsumer Price Index for Selected Energy Products (Base index of 100 at 2014)Producer & International Trade Price Indices of Mineral Fuels, Lubricants & Related Materials (Base index of 100 at 2012)
Installed Capacity of Grid-Connected Solar Photovoltaic (PV) SystemsNumber of Grid-Connected Solar PV InstallationsSolar PV Installations by URA Planning Region as of end of Period
Electricity Grid Emission Factors and Upstream Fugitive Methane Emission FactorPeak System DemandNumber of Power Sector Employees by OccupationNumber of Power Sector Employees by Residency StatusNumber of Licensed Electrical, Gas Service & Cable Detection Workers
Total Final Energy Consumption
Total Oil Consumption by Sector
Electricity
Natural Gas
Final Energy Consumption
Oil
section 01 energY sUPPlY 10
77
78
80
84
85
92
100
106
112
86
20
34
36
energY snaPshot of singaPore 06
eXecUtiVe sUmmarY 08
section 02 energY transformation
section 03 energY consUmPtion
TableTableTableTableTable
TableTableTableTableTableTable Table
TableTableTableTableTableTable Table
TableTableTableTableTable
Table
1.11.21.2.11.2.21.3
2.12.22.2.12.32.3.12.42.5
3.13.23.2.13.2.23.33.43.5
3.63.73.83.93.10
2.6
Imports of Energy ProductsExports of Energy ProductsDomestic Exports of Energy ProductsRe-Exports of Energy ProductsStock Change
1516 171819
Energy Flows for Electricity GeneratorsAnnual Fuel Mix for Electricity Generation by Energy ProductsMonthly Fuel Mix for Electricity Generation by Energy ProductsLicensed Generation Capacity by Technology TypeLicensed Generation Capacity by Generation CompanyPlant Technology Share of Electricity GenerationMarket Share for Electricity Generation
29 3030313233 34
89 8990 90 91 91
96 9697
104104105105 105
464748 495054 58
6363 64 6872
Market Share for Electricity RetailElectricity Consumption by Sub-Sector (Total)Electricity Consumption by Sub-Sector (Contestable Consumers)Electricity Consumption by Sub-Sector (Non-Contestable Consumers)Total Household Electricity Consumption by Dwelling TypeAverage Monthly Household Electricity Consumption by Dwelling TypeAverage Monthly Electricity Consumption by Planning Area & Dwelling Type (Annual)
Market Share for Natural Gas RetailNatural Gas Consumption by Sub-SectorTotal Household Town Gas Consumption by Dwelling TypeAverage Monthly Household Town Gas Consumption by Dwelling TypeAverage Monthly Household Town Gas Consumption by Planning Area & Dwelling Type (Annual)
Energy Flows in the Oil Refining Sector
Electricity Generation
Electricity
Natural Gas
Oil Refining
Notes: a. This publication contains statistics that are the most recently available at the time of its preparation. b. Numbers may not add up to the totals due to rounding. c. Some statistics, particularly for the most recent time periods, are provisional and may be subject to revision in later issues. d. All statistical tables above are available in machine-readable format on http://www.ema.gov.sg/singapore_energy_statistics.aspx. Notations: - nil, negligible or not applicable. “s” - Suppressed to avoid disclosure of individual data.

2015 EnErgy SnAPSHOT
OF SIngAPOrE
IMPOrTS & EXPOrTS
Energy Exports
92.0 Mtoe
47,513.8 gWh
A POWEr SECTOr WITH A STrOngSIngAPOrE COrE
EnErgy FlOWS
EnErgy COnSUMPTIOn
SOlAr
95.9%Singapore Residents
4.1%Non-Residents
Total Energy Inputs into Electricity Generators
10.2 mtoe
annUal fUel miX for electricitY generation BY energY ProdUcts
licensed generation caPacitY BY technologY tYPe
Total Gross Electricity Generated by the Electricity Generators
4.3 mtoe
Energy Imports
173.7 Mtoe
5,090Workers As
Of 2014
singaPore consUmed
of electricitY
57,748.1tJof natUral gas (ng)
(Excluding NG used in power generation)
OthersHouseholdsCommerce &Services-related
Industrial-related
Petroleum Products Crude Oil Natural Gas (NG)
279.1 (0.6%)
7,220.9 (15.2%)
2,444.8 (5.1%)
17,481.0 (36.8%)
20,088.0 (42.3%)
113.4 (65.3%)
90.9 (98.8%)
49.4 (28.5%)
1.1 (1.2%)
10.4 (6.0%) 82.5
(0.1%)2,508.0
(4.3%)3,753.8
(6.5%)50,738.6
(87.9%)665.2 (1.2%)
Coal & Peat
0.4 (0.2%)
---
West
north north-east
16.2 MWac
4.2 MWac 8.2 MWac
182 Installations
67 Installations 253 Installations
overall
45.8 MWac942 Installations
east
8.9 MWac146 Installations
Installed Capacity Number of Solar PV Installations
Petroleum Products
Natural GasCoal
CCGT/Co-Gen/Tri-GenSteam TurbineOpen Cycle Gas TurbineWaste-To-Energy
central
8.3 MWac294 Installations
2005 2010 20161
2.5% 2.6%
74.4%
23.1%
77.2%
20.2%
Others
0.1 (0.0%)
Transport- related
1 Data for 2016 is as of 1Q 2016.
3.2%
0.2%
95.5%
1.1%
Others
2010 9,938.3 mW
3.7%2.6%
62.0% 31.7%
20161 13,404.7 mW
75.8% 20.9%
1.3%1.9%
2.9%2.6%2005
9,709.8 mW46.7% 47.8%

01 ENERGY SUPPLY
8 9
energY floWs
Singapore’s import of energy products grew by 7.2% from 162 Mtoe in 2014 to 174 Mtoe in 2015. The exports of energy products also registered a 6.7% increase, growing from 86 Mtoe in 2014 to 92 Mtoe in 2015. The bulk of energy imports and exports were petroleum products. Imports of Natural Gas (NG) marginally increased by 0.4% to 10 Mtoe in 2015, with Liquefied Natural Gas (LNG) accounting for 25% of these imports. Electricity generation increased by 2.0% from 49 TWh in 2014 to 50 TWh in 2015. Natural gas constituted about 95% of fuel mix, comparable with that recorded in 2014. The six largest Main Power Producers in Singapore accounted for 91% of total electricity generated. The remaining 9% was generated by Autoproducers and waste-to-energy companies. Total licensed generation capacity in Singapore was 13,405 MW as of end-March 2016. Combined Cycle Gas Turbines, Co-Generation Plants and/or Tri-Generation Plants accounted for the bulk of this capacity (10,164 MW or 76%). Electricity consumption rose by 2.4% from 46 TWh in 2014 to 48 TWh in 2015. Industrial-related, and Commerce & Services-related sectors comprised 42% and 37% of total consumption respectively. 15% was accounted for by Households. End-users consumption of NG declined 3.0% from 59,515 TJ in 2014 to 57,748 TJ in 2015, due to weaker demand by the Industrial-related sector. In 2015, Industrial-related consumption of NG was 50,739 TJ. This was 3.5% lower than that a year ago.
•
• • • • •
EXECUTIVE SUMMAry
solar and other energY statistics
The adoption of solar PV systems in Singapore continued to accelerate in 2015 as grid-connected installed capacity of solar PV systems sharply increased from 26 MWac in 2014 to 46 MWac in 2015. This increase was driven by 305 new installations in 2015. By end-2015, there were a total of 942 solar PV installations across Singapore. The Western Region of Singapore had the highest concentration of solar PV, with a total capacity of 16 MWac (35%) distributed across 182 installations, as of end of 2015. Singapore’s Grid Emission Factor (GEF), which measures emissions per unit of electricity generated, improved from 0.4332 kg CO2/kWh in 2014 to 0.4313 kg CO2/kWh in 2015.
•
• •


01 energY sUPPlY
12
Singapore relies heavily on the import of fuels to ensure a secure, reliable, and diversified supply of competitively-priced energy. Singapore imported 174 Mtoe of energy products in 2015, 7.2% higher than the 162 Mtoe recorded in the preceding year. Imports of Natural Gas (NG), mainly in the form of Pipeline Natural Gas (PNG), grew by 0.4% to 10 Mtoe. Imports of PNG comprised 75% of total NG imports in 2015. Liquefied Natural Gas (LNG) accounted for the remaining 25%.
Overall energy exports grew by 6.7% to 92 Mtoe in 2015, primarily driven by stronger demand for fuel oil and gas/diesel oil exports. In contrast, declines were registered in the export of jet fuel kerosene, coal and peat.
50,000
2010 2011 2012 2013
100,000
150,000
Unit: ktoe
S I N G A P O R E E N E R GY S TAT I S T I C S 2 016
13
IMPOrTS & EXPOrTS OF EnErgy PrOdUCTS
eXPorts
Coal and PeatCrude OilPetroleum Products
imPorts
Other Energy ProductsCoal & PeatNatural GasPetroleum ProductsCrude Oil
2014 2015
49,4
38
90,9
28
113,
433
669
7.71,064
0.1
47,4
80
85,5
05
103,
802
8,016
767
7.9
0
0.1
45,3
96
88,1
31
101,
061
Note: The values for each component in the chart above are ordered according to the legend.
396407
10,36210,317
4481

01 ENERGY SUPPLY
14 15
S I N G A P O R E E N E R GY S TAT I S T I C S 2 016
Stock build in 2014 totalled 4.4 ktoe of energy products, compared with a stock build of 422 ktoe in 2013. Crude oil & Natural Gas Liquids (NGL) registered a stock build of 156 ktoe in 2014, compared to a stock build of 373 ktoe a year ago. Petroleum products exhibited a reversal in trend as 249 ktoe of stock draw was recorded in 2014 compared to a stock build of 49 ktoe in 2013. In 2014, NG registered a stock build of 98 ktoe.
STOCK CHAngE
2010 2012 2013 2014 2015
Sources: International Enterprise (IE) Singapore & Energy Market Authority (EMA)
Table 1.1 IMPOrTS OF EnErgy PrOdUCTS Unit: ktoe
115,166.2
7,619.5
1,847.7
789.0
3,999.7
4,095.0
58,884.6
6,190.1
- - -
29,551.2
2,180.7
59,673.6
6,190.1
- - -
49,293.9
8.7
158,035.1
1,224.8
14,584.4
6,369.9
13,980.8
1,609.3
50,430.1
8,779.6
59,444.4
1,586.8
51,654.9
8,779.6
97,575.6
25.0
159,561.8
294.2
1,043.2
12,930.3
7,693.4
13,895.5
2,295.9
46,920.5
8,830.8
63,691.9
1,673.0
47,214.7
9,874.0
26.7
102,180.0
266.4
162,039.2 173,719.9
332.1
2,259.2
14,322.8
8,981.5
14,774.5
1,401.6
47,147.8
8,058.0
62,279.9
2,041.2
47,479.9
10,317.2
44.4
103,801.5
396.2
1,348.6
2,577.6
14,809.2
9,684.5
15,614.9
1,413.8
48,089.0
7,784.1
69,902.8
2,007.7
49,437.7
10,361.7
113,432.9
406.5
other energy Products
total
crude oil
natural gas (ng)
Petroleum Products
coal & Peat
Crude Oil
Pipeline NG
Fuel Oil
Jet Fuel Kerosene
Other Crude Oil
Liquefied NG
Gas/Diesel Oil
Naphtha
Gasoline
Other Petroleum Products
Notes: a. Numbers may not add up to the totals due to rounding. b. All data are compiled from IE’s trade statistics except Natural Gas, Other Energy Products and biomass trade data, which are compiled from EMA’s administrative returns.c. IE releases trade data in mass units. EMA releases similar data in energy units (ktoe).d. The product classification of energy products differs from that used by IE for trade statistics. e. Biomass trade recorded is for energy use only. Notation:- nil, negligible or not applicable.
81.12010stock Build
stock draw
2011 2012 2013
-422
2014
-4.4
-600
-400
200
-200
400
0
600
800
1,000
Unit: ktoe 154,480.7
1,063.9
17,459.2
5,970.2
14,858.7
1,149.6
44,332.2
8,016.1
58,020.0
3,602.7
45,396.1
8,016.1
101,060.6
7.9
Stock change is the difference between the opening and closing stock levels on national territory on the first and last day of the calendar year respectively. A net increase in stock change refers to a stock draw as it is an addition to supply. A net decrease in stock change denotes a stock build as supply is withdrawn into inventory. This definition of stock change is in accordance with the International Energy Agency’s (IEA) recommendations.
549
2005

1716
S I N G A P O R E E N E R GY S TAT I S T I C S 2 016
01 energY sUPPlY
2010 2012 2013 2014 2015
Sources: International Enterprise (IE) Singapore & Energy Market Authority (EMA)
Table 1.2 EXPOrTS OF EnErgy PrOdUCTS Unit: ktoe
total
crude oil
Petroleum Products
coal & Peat
Crude Oil
Fuel Oil
Jet Fuel Kerosene
Other Crude Oil
Gas/Diesel Oil
Naphtha
Gasoline
Other Petroleum Products
64,432.8
15,183.0
7,728.7
642.4
15,208.8
2,470.2
177.3
16,066.7
6,955.3
819.7
63,612.8
0.3
84,488.3
793.0
-
23,815.5
465.9
24,283.1
7,522.8
22,490.1
5,117.7
793.1
83,695.1
0.1
84,842.2
671.8
21,966.2
463.6
23,499.6
6,908.2
0.1
26,314.0
5,015.8
671.8
84,167.5
2.9
86,180.7
668.5
22,679.9
453.4
25,234.0
7,398.6
0.1
24,688.2
5,050.3
668.5
85,504.5
7.7
91,992.7
1,002.2
23,428.2
788.3
25,330.0
7,500.5
62.1
28,927.5
4,953.6
1,064.2
90,928.2
0.1
88,897.5
726.2
27,376.4
990.4
24,037.6
6,715.2
40.3
21,802.3
7,208.9
766.6
88,130.8
0.1
2010 2012 2013 2014 2015
Sources: International Enterprise (IE) Singapore & Energy Market Authority (EMA)
Table 1.2.1 dOMESTIC EXPOrTS OF EnErgy PrOdUCTS Unit: ktoe
total
crude oil
Petroleum Products
coal & Peat
Crude Oil
Fuel Oil
Jet Fuel Kerosene
Other Crude Oil
Gas/Diesel Oil
Naphtha
Gasoline
Other Petroleum Products
Notes: a. Numbers may not add up to the totals due to rounding.b. All data are compiled from IE’s trade statistics. c. IE releases trade data in mass units. EMA releases similar data in energy units (ktoe). d. The product classification of energy products differs from that used by IE for trade statistics. Notation:- nil, negligible or not applicable.
58,060.2
12,732.2
7,457.2
425.7
14,126.0
2,448.9
14,755.4
6,114.7
425.7
57,634.5
0.0
63,815.6
484.7
16,547.8
383.9
14,934.6
7,003.3
0.0
20,019.5
4,441.9
484.7
63,330.9
0.0
68,573.0
566.2
14,679.2
336.8
17,091.2
6,389.3
0.0
25,482.2
4,028.1
566.2
68,006.8
0.0
-
71,516.5
584.2
14,828.7
436.6
20,954.3
6,906.7
23,873.1
3,932.7
584.2
70,932.0
0.2
78,402.6
752.7
17,480.9
703.1
20,716.5
6,950.7
0.7
27,661.8
4,136.1
753.4
77,649.1
0.0
55,302.4
479.7
19,099.3
911.7
11,641.7
6,420.8
0.1 -
11,715.8
5,033.3
479.8
54,822.6
0.0
20052005
Notes: a. Numbers may not add up to the totals due to rounding.b. All data are compiled from IE’s trade statistics. c. IE releases trade data in mass units. EMA releases similar data in energy units (ktoe). d. The product classification of energy products differs from that used by IE for trade statistics. Notation:- nil, negligible or not applicable.

S I N G A P O R E E N E R GY S TAT I S T I C S 2 016
01 energY sUPPlY
1918
2010 2011 2012 2013 2014
Source: Energy Market Authority (EMA)
Table 1.3 STOCK CHAngE Unit: ktoe
total 548.7 907.3 -115.8 -421.8 -4.4
-2.6 465.1 -280.3 470.4 -18.5
42.5 -206.1 180.0 -181.6 -155.2
603.4 616.4
563.5
-
-175.0
357.4
-
-48.9 249.3
-74.7
-
-337.7
-
422.9
-98.0
-54.8 290.8 59.2 -372.8 -155.7
Petroleum Products
Heavy Distillates & Residuum
natural gas
crude oil & natural gas liquids (ngl)
Light Distillates
Middle Distillates
Notes:a. Numbers may not add up to the totals due to rounding.b. Stock change refers to the net increase (stock draw) or net decrease (stock build) in the quantity of energy products over the reference year. They are calculated as a difference between the opening and closing inventory at the start and end of the calendar year respectively.c. A negative figure denotes a stock build. A positive figure denotes a stock draw.
Notes: a. Numbers may not add up to the totals due to rounding.b. All data are compiled from IE’s trade statistics. c. IE releases trade data in volumetric units. EMA releases similar data in energy units (ktoe). d. The product classification of energy products differs from that used by IE for trade statistics.
2010 2012 2013 2014 2015
Sources: International Enterprise (IE) Singapore & Energy Market Authority (EMA)
Table 1.2.2 rE-EXPOrTS OF EnErgy PrOdUCTS Unit: ktoe
total
crude oil
Petroleum Products
coal & Peat
Crude Oil
Fuel Oil
Jet Fuel Kerosene
Other Crude Oil
Gas/Diesel Oil
Naphtha
Gasoline
Other Petroleum Products
6,372.6
2,450.7
271.5
216.7
1,082.8
21.4
177.3
1,311.3
840.6
394.0
5,978.3
0.3
20,672.6
308.4
7,267.8
82.0
9,348.5
519.5
0.0
2,470.6
675.8
308.4
20,364.2
0.1
16,269.2
105.6
7,287.0
126.9
6,408.4
518.9
0.0
831.8
987.7
105.6
16,160.7
2.8
14,664.2
84.3
7,851.2
16.9
4,279.8
491.9
0.0
815.1
1,117.6
84.3
14,572.4
7.5
13,590.1
249.5
5,947.3
85.2
4,613.5
549.8
61.4
1,265.7
817.5
310.8
13,279.1
0.1
33,595.0
246.6
8,277.1
78.7
12,395.9
294.4
40.2
10,086.5
2,175.7
286.8
33,308.2
0.0
2005


0 2 ENERGY TRANSFORMATION S I N G A P O R E E N E R GY S TAT I S T I C S 2 016
2 2 2 3
YTL PowerSeraya
Sembcorp Cogen
Tuas Power Generation
Senoko Energy
Others
PacificLight Power
Around 4,323 ktoe (50 TWh) of electricity was generated in 2015, an increase of 2.0% from the 4,240 ktoe (49 TWh) produced in 2014. Main Power Producers (MPPs) contributed 94% (4,044 ktoe) of total electricity generation. The remaining 6.4% (279 ktoe) was accounted for by Autoproducers1.
Autoproducers’ share of electricity generation grew steadily from 2.8% in 2010 to 6.4% in 2015, with a year-on-year percentage increase of 9.0% from 2014.
Singapore’s electricity generation industry has over time moved away from oil-fired steam turbine plants by building new Combined Cycle Gas Turbine (CCGT) plants or repowering existing ones.
CCGTs use Natural Gas (NG) as its primary fuel, in contrast to steam turbine plants powered mainly by fuel oil. The increased availability of worldwide natural gas supplies through LNG imports has furthered the rise of NG’s share of Singapore’s electricity generation fuel mix.
In 2015, NG accounted for about 95% of fuel mix, comparable with that recorded in 2014. Petroleum products, mainly in the form of diesel and fuel oil, made up 0.7% of the fuel mix. Other energy products (e.g. municipal waste, coal and biomass) accounted for 2.9% while the remaining 1.2% was from coal.
ElECTrICITy gEnErATIOn FUEl MIX FOr ElECTrICITy gEnErATIOn
Petroleum Products
natural gas coal others electricity2015
Total Electricity Generation
Main Power Producers
Autoproducers
-204.8 -9,064.8 -255.9 -698.2 4,322.6
-189.9 -988.3 - -19.8 278.6
-14.9 -8,076.5 -255.9 -678.4 4,043.9
Unit: ktoe
2010 2011 2012 2013 20152014 20161
40
60
20
80
100
Unit: Percent (%)
1 Data for 2016 is as of 1Q 2016.1 Autoproducers are enterprises that produce electricity but for whom the production is not their principal activity.
electricitY generation fUel miX
PetroleumProducts
Natural Gas (NG)
Coal
Others
Autoproducers
Main PowerProducers
4,323Total Electricity
Generated
190
988
20
15
8,077
279
4,044
256
678
3% Others
0% Steam
Turbine
CCGT/Co-Gen/Tri-Gen
Keppel Merlimau Cogen
3.2%2.6%
96%77%
0.2%
1.1% 1.2% 1.1%
20%
2.9%
95%
0.7%
97%
18%12%
20%
11%
8.7%9.5%
21%
2.8%
95%
0.7%
Note: A negative sign indicates a withdrawal/ input into the system.
Natural Gas OthersCoalPetroleum Products

0 2 ENERGY TRANSFORMATION S I N G A P O R E E N E R GY S TAT I S T I C S 2 016
24 2 5
257257
The total licensed generation capacity in Singapore climbed to 13,405 MW as of end-March 2016. This was a 3.0% increase from 13,009 MW in 2015.
The licensed generation capacity of newer CCGT, Co-Generation Plants and/or Tri-Generation Plants (CCGT/Co-Gen/Tri-Gen) plants stood at 10,164 MW in the first quarter of 2016. This was more than double the 4,534 MW of capacity registered for such similar plant types in 2005. The proportion of CCGT/Co-Gen/Tri-Gen plants in overall capacity rose from 47% in 2005 to 76% in 2016.
The licensed generation capacity of steam turbine plants, which typically run on fuel oil and diesel, declined over the last decade. This dropped from 4,640 MW in 2005 to 2,804 MW as of end-March 2016, representing a fall of 40% over about 10 years. This was due to more steam turbine plants being repowered into more efficient CCGT/Co-Gen/Tri-Gen plants. Open cycle gas turbine plants continued to remain a small component of Singapore’s electricity generation capacity. They accounted for only 1.3% (180 MW) of overall capacity as of end-March 2016.
MPPs accounted for 97% (or 12,991 MW) of total licensed generation capacity. Autoproducers made up the remaining 3.1% (414 MW).
ElECTrICITy gEnErATIOn IndUSTry
1 Data for 2016 is as of 1Q 2016.2 Includes electricity generation capacities by Wholesaler Licensees and Waste-To-Energy Plants.3 Includes electricity generation capacity by TP Utilities.
Others2
TuaspringPacificLight Power
YTL PowerSeraya
Keppel Merlimau Cogen
Tuas Power Generation3
SembCorp Cogen
Senoko Energy
1 Data for 2016 is as of 1Q 2016.
Note: The values for each component in the chart above are ordered according to the legend.
2010
2010
2011
2011
2012
2012
2013
2013
2015
2015
2014
2014
20161
20161
6,000
10,000
9,000
3,000
5,000
12,000
15,000
15,000
Unit: mW
Unit: mW
licensed generation caPacitY BY technologY tYPe
licensed generation caPacitY BY generation comPanY
Steam Turbine Waste-To-EnergyOpen Cycle Gas Turbine
257
10,1649,7686,164
2,8042,735
3,148
2,804
257
396671
278
575
2,635
3,100
2,640
785500
3,300
3,100
2,609
1,189
1,340
800
180180 180
3703,3003,300
3,1003,100
2,6092,579
1,1891,189
1,3401,340
800800671
CCGT/Co-Gen/Tri-Gen
9,712

0 2 ENERGY TRANSFORMATION S I N G A P O R E E N E R GY S TAT I S T I C S 2 016
2 6 2 7
1 Includes electricity generation by TP Utilities.2 Includes electricity generation by Wholesale Licensees and Waste-To-Energy Plants.
Unit: Percent (%)
Percentage contriBUtion BY generation comPanY
2010
2011
2012
2013
2015
2014
Unit: Percent (%)
market share for electricitY generation
Senoko EnergyYTL PowerSerayaTuas Power Generation1
Keppel Merlimau CogenSembCorp Cogen
PacificLight PowerOthers2
0% 25% 50% 100%75%
The electricity generation market share for the three major MPPs also saw a decline since 2010. This was in line with their decreasing share of generation capacity. Their combined share fell from 76% in 2010 to 59% in 2015. Conversely, the next largest MPPs - Keppel Merlimau Cogen and Sembcorp Cogen - gradually expanded their combined market share from 18% in 2010 to 23% in 2015.
20%
22%
25%
18%
18%
21%
21%
25%
12%
9.6%
11% 8.7% 9.5%
12%
9.4%
8.3%
8.1%
8.6%
6.2%
2010
2011
2012
2013
2015
2014
20161 25%
25%
23%
24%
19%
20%
8.9%
9.1%
10% 6%
10% 6.1%
0% 25% 50% 100%75%
3% 5%
5.2%
Since 2010, expansion of smaller existing MPPs, and the entry of new players (PacificLight Power in 2014, and Tuaspring in 2015) have introduced new competition to the power generation market. The generation capacity market share of the three major MPPs – Senoko Energy, YTL PowerSeraya and Tuas Power – consequently fell from 84% in 2010 to 67% in the first quarter of 2016.
Senoko EnergyYTL PowerSerayaTuas Power Generation2
TuaspringSembCorp Cogen
PacificLight PowerKeppel Merlimau Cogen Others3
27% 31% 27% 7.9% 5%
2.8%27%
1 Data for 2016 is as of 1Q 2016.2 Includes electricity generation capacity by TP Utilities.3 Includes electricity generation capacity by Wholesaler Licensees and Waste-To-Energy Plants
Note: The values for each component in the chart above are ordered according to the legend.
Note: The values for each component in the chart above are ordered according to the legend.
25% 24% 20% 9.1% 10% 6.1% 5.2%

0 2 ENERGY TRANSFORMATION S I N G A P O R E E N E R GY S TAT I S T I C S 2 016
2 8 2 9
About 49 Mtoe of refinery inputs was consumed by the oil refining sector in 2014, a 5.8% fall from 52 Mtoe recorded in 2013. These inputs yielded 47 Mtoe of refinery outputs, 7.0% lower than the corresponding output a year earlier.
Light Distillates outputs increased by 9.0% to 14 Mtoe in 2014. However, Middle Distillates and Heavy Distillates & Residuum outputs recorded declines of 9.4% and 17% respectively. In 2014, Middle Distillates output totalled 21 Mtoe while that for Heavy Distillates & Residuum totalled 12 Mtoe.
EnErgy FlOW In OIl rEFInIng SECTOr
refinerY inPUts & oUtPUts
49
52
57
15
14
12
21
Refinery Inputs Light Distillates Middle Distillates Heavy Distillates& Residuum
14
14
Unit: mtoe
2010 2012 2013 2014 2015
Source: Energy Market Authority (EMA)
Table 2.1 EnErgy FlOWS FOr ElECTrICITy gEnErATOrS Unit: ktoe
7,717.4 total energy inputs into electricity generators
total gross electricity generated by the electricity generators
energy inputs into main Power Producers
gross electricity generated by main Power Producers
gross electricity generated by autoproducers
energy inputs into autoproducers
Coal & Peat
Petroleum Products
Petroleum Products
Others
Natural Gas
Natural Gas
Others
Note: a. Numbers may not add up to the totals due to rounding. Notation:- nil, negligible or not applicable.
3,285.7
-
-
-
-
-
5,271.8
-
2,445.6
0.0
- -
7,717.4
3,285.7
-
-
9,747.7
7,110.4
341.3
3,886.2
394.7
-
152.6
1,278.2
621.2
736.0
9,011.7
1.9
4,038.8
9,975.0
7,611.0
26.7
262.8
3,883.1
842.4
-
241.1
454.7
669.6
1,105.2
8,869.8
134.5
4,124.1
10,118.7 10,223.7
8,065.5 8,076.5
44.4 63.4
203.0 189.9
3,984.2 4,043.9
901.6
-
988.3
19.8
255.7 278.6
28.5 14.9
690.8 678.4
1,104.6 1,198.0
9,014.1 9,025.7
229.3 255.9
4,239.9 4,322.6
Of Which: Biomass Excluding Municipal Waste
9,444.0
6,369.8
313.2
3,791.7
258.5
-
108.6
1,915.2
587.3
571.7
8,872.3
3,900.3
26
24
2005
13

0 2 ENERGY TRANSFORMATION S I N G A P O R E E N E R GY S TAT I S T I C S 2 016
3 0 31
2014
2015
Source: Energy Market Authority (EMA)
Table 2.2.1 MOnTHly FUEl MIX FOr ElECTrICITy gEnErATIOn by EnErgy PrOdUCTS Unit: Percent (%)
Notes:a. Numbers may not add up to the totals due to rounding.b. The Fuel Mix presented in this table is calculated using the Output Method. The Output Method uses the amount of electricity generated and the corresponding type of fuel used to calculate the fuel mix for the generation of electricity. It takes into account the domestic fuel-to-electricity conversion efficiency of the generating plants and the plant technology.c. From 2016, the category “Others” includes solar.
20122010 2013 2014 2015 20161
Source: Energy Market Authority (EMA)
Table 2.3 lICEnSEd gEnErATIOn CAPACITy by TECHnOlOgy TyPE Unit: mW
1 Data for 2016 is as of end-March 2016. Notes: a. Numbers may not add up to the totals due to rounding.b. CCGT/Co-Gen/Tri-Gen refers to Combined Cycle Gas Turbines, Co-Generation Plants and/or Tri-Generation Plants. Notation:- nil, negligible or not applicable.
9,709.8
250.8
4,640.0
285.0
-
-
- -
- -
285.0
4,534.0
250.8
4,640.0
9,709.8
4,534.0
10,087.8
256.8
2,541.0
106.0
180.0
46.0
60.0
-
180.0
7,004.0
256.8
2,601.0
9,981.8
7,050.0
11,241.1
256.8
2,642.0
318.3
180.0
258.3
60.0
-
180.0
7,844.0
256.8
2,702.0
10,922.8
8,102.3
12,883.3
256.8
2,674.5
318.3
180.0
258.3
60.0
-
180.0
9,453.7
256.8
2,734.5
12,545.0
9,712.0
13,009.0 13,404.7
256.8 256.8
2,674.5 2,674.5
414.0 414.0
180.0 180.0
284.7 284.7
129.3 129.3
- -
180.0 180.0
9,483.7 9,879.4
256.8 256.8
2,803.8 2,803.8
12,595.0 12,990.7
9,768.4 10,164.1
total licensed generation capacity
Open Cycle Gas Turbine
Steam Turbine
CCGT/Co-Gen/Tri-Gen
CCGT/Co-Gen/Tri-Gen
Waste-To-Energy
Waste-To-Energy
Steam Turbine
of Which: autoproducers
Open Cycle Gas Turbine
CCGT/Co-Gen/Tri-Gen
Steam Turbine
Open Cycle Gas Turbine
of Which: main Power Producers
Petroleum Products
Petroleum Products
Coal
Others
Coal
Others
Natural Gas
Natural Gas
0.5
0.4
95.3
95.9
1.1
3.1
0.7
2.6
0.4
0.7
96.0
95.4
0.9
2.7
0.9
3.1
0.5
0.5
96.0
95.2
0.7
2.8
1.3
3.0
1.4
0.5
94.7
95.4
1.1
2.8
1.2
2.9
0.8
0.7
95.3
95.1
1.2
2.7
1.3
3.0
1.5
0.5
94.4
95.3
1.3
2.8
1.3
2.9
0.9
94.8
1.3
3.0
1.1
94.5
1.4
3.1
0.9
95.2
1.2
2.7
0.7
95.3
1.2
2.9
0.3
95.8
1.0
2.8
0.3
95.4
1.2
3.1
0.9
95.1
1.3
2.7
0.8
95.5
1.2
2.6
0.3
95.7
1.3
2.8
0.5
95.4
1.2
2.9
0.4
95.7
1.2
2.8
Jan
Jan
feb
feb
mar
mar
apr
apr
may
may
Jun
Jun
Jul
Jul
aug
aug
sep
sep
oct
oct
nov
nov
dec
dec
0.3
95.6
1.2
2.8
9,938.3
256.8
3,148.0
21.5
370.0
21.5
370.0
6,142.0
256.8
3,148.0
9,916.8
6,163.5
2005
Source: Energy Market Authority (EMA)
23.1 13.0 4.7 0.7 0.7 0.2
-
2.5
-
2.7
-
3.5
1.1
2.8
1.2
2.9
1.1
3.2
74.4 84.3 91.8 95.4 95.3 95.5
1 Data for 2016 is as of 1Q 2016. Notes:a. Numbers may not add up to the totals due to rounding.b. The Fuel Mix presented in this table is calculated using the Output Method. The Output Method uses the amount of electricity generated and the corresponding type of fuel used to calculate the fuel mix for the generation of electricity. It takes into account the domestic fuel-to-electricity conversion efficiency of the generating plants and the plant technology.c. From 2016, the category “Others” includes solar.
20122010 2013 2014 2015 20161
Table 2.2 AnnUAl FUEl MIX FOr ElECTrICITy gEnErATIOn by EnErgy PrOdUCTS Unit: Percent (%)
Petroleum Products
Coal
Others
Natural Gas
20.2
-
2.6
77.2
20052016
Table 2.2.1 MOnTHly FUEl MIX FOr ElECTrICITy gEnErATIOn by EnErgy PrOdUCTS (COnTInUEd) Unit: Percent (%)
Petroleum Products
Coal
Natural Gas
0.1
95.7
1.0
0.3
95.3
1.1
0.2
95.4
1.3
Jan feb mar
Source: Energy Market Authority (EMA)
Notes:a. Numbers may not add up to the totals due to rounding.b. The Fuel Mix presented in this table is calculated using the Output Method. The Output Method uses the amount of electricity generated and the corresponding type of fuel used to calculate the fuel mix for the generation of electricity. It takes into account the domestic fuel-to-electricity conversion efficiency of the generating plants and the plant technology. c. From 2016, the category “Others” includes solar.
Others 3.2 3.4 3.0

0 2 ENERGY TRANSFORMATION S I N G A P O R E E N E R GY S TAT I S T I C S 2 016
3 2 3 3
-
-
-
-
-
- -
-
- - - - - - -
250.8
-
-
-
179.8
-
-
-
22.0
179.8
-
-
-
22.0
179.8
-
-
-
22.0
179.8 179.8
- 395.7
- -
- -
22.0 22.0
250.8
-
179.8
-
22.0
179.8
-
22.0
179.8
-
22.0
179.8 179.8
- 395.7
22.0 22.0
national environment agency
tuaspring
senoko Wte
Waste-To-Energy
CCGT/Co-Gen/Tri-Gen
Waste-To-Energy
CCGT/Co-Gen/Tri-Gen
Steam Turbine
Open Cycle Gas Turbine
Waste-To-Energy
keppel seghers tuas Wte
of Which: autoproducers
Table 2.3.1 lICEnSEd gEnErATIOn CAPACITy by gEnErATIOn COMPAny (COnTInUEd) Unit: mW
Unit: Percent (%)
Open Cycle Gas Turbine
Steam Turbine
20122010 2013 2014 2015 20161
55.0
60.0
55.0
106.0
46.0
55.0
60.0
55.0
318.3
258.3
55.0
60.0
55.0
318.3
258.3
55.0 55.0
129.3 129.3
55.0 55.0
414.0 414.0
284.7 284.7
Source: Energy Market Authority (EMA)
Source: Energy Market Authority (EMA)
1 Data for 2016 is as of 1Q 2016. Notes: a. Numbers may not add up to the totals due to rounding. b. CCGT/Co-Gen/Tri-Gen refers to Combined Cycle Gas Turbines, Co-Generation Plants and/or Tri-Generation Plants. Notation:- nil, negligible or not applicable.
1 Data for 2016 is as of 1Q 2016.2 Includes electricity generation capacity by TP Utilities. Notes: a. Numbers may not add up to the totals due to rounding. b. CCGT/Co-Gen/Tri-Gen refers to Combined Cycle Gas Turbines, Co-Generation Plants and/or Tri-Generation Plants. Notation:- nil, negligible or not applicable.
80.0 82.0 86.8 93.8 97.4 97.3
3.0 2.0 2.7 2.6 2.6 2.6
17.0 16.0 10.5 3.6 0.0 0.0
Note: a. Numbers may not add up to the totals due to rounding.
20112010 2012 2013 2014 2015
Source: Energy Market Authority (EMA)
Table 2.4 PlAnT TECHnOlOgy SHArE OF ElECTrICITy gEnErATIOn
CCGT/Co-Gen/Tri-Gen
Steam Turbines
Others
Table 2.3.1 lICEnSEd gEnErATIOn CAPACITy by gEnErATIOn COMPAny Unit: mW
9,709.8 10,087.8 11,241.1 12,883.3 13,009.0 13,404.7
1,250.0
364.0
2,640.0
785.0
2,190.0
1,440.0
785.0
1,200.0
493.0
1,472.0
2,040.0
785.0
500.0
1,448.0
1,440.0
785.0
500.0
-- -
- - - -- - -
-
- - - -
-
-
--
--
-
-
-
-
785.0
-
-
-
- -
- -
- -
-- -
- - - -- - -
-
- - - -
- - - - - - -
600.0
493.0
1,472.0
2,141.0
1,340.0
1,448.0
1,440.0
785.0
1,340.0
-
-
701.0
493.0
1,472.0
2,579.4
1,188.8
1,340.0
1,448.0
1,845.9
1,188.8
1,340.0
-
-
733.5
493.0 493.0
1,472.0 1,472.0
2,609.4 2,609.4
1,188.8 1,188.8
1,340.0 1,340.0
1,448.0 1,448.0
1,875.9 1,875.9
1,188.8 1,188.8
1,340.0 1,340.0
- -
- -
733.5 733.5
1,945.0 2,807.0
2,734.0
180.0
2,807.0
3,100.0
180.0
2,807.0
3,100.0
180.0
2,807.0 2,807.0
3,100.0
180.0
3,100.0 3,100.0
180.0 180.0
3,300.0 3,300.0
105.0
3,300.0 3,300.0 3,300.0 3,300.0
CCGT/Co-Gen/Tri-Gen
senoko energy
total licensed generation capacity
Ytl Powerseraya
Open Cycle Gas Turbine
Steam Turbine
CCGT/Co-Gen/Tri-Gen
tuas Power generation2
sembcorp cogen
keppel merlimau cogen
Steam Turbine
CCGT/Co-Gen/Tri-Gen
CCGT/Co-Gen/Tri-Gen
CCGT/Co-Gen/Tri-Gen
Steam Turbine
Steam Turbine
Steam Turbine
Open Cycle Gas Turbine
Open Cycle Gas Turbine
Open Cycle Gas Turbine
Open Cycle Gas Turbine
20122010 2013 2014 2015 20161
800.0 800.0 800.0
800.0 800.0 800.0CCGT/Co-Gen/Tri-Gen
PacificLight Power
Steam Turbine
Open Cycle Gas Turbine
9,938.3
500.0
1,472.0
2,640.0
500.0
1,448.0
1,440.0
785.0
785.0
500.0
190.0
1,200.0
1,945.0
3,100.0
180.0
2,635.0
179.8
-
-
-
22.0
179.8
-
22.0
55.0
55.0
21.5
21.5
2005 2005
of Which: main Power Producers

0 2 ENERGY TRANSFORMATION S I N G A P O R E E N E R GY S TAT I S T I C S 2 016
3 4 3 5
Table 2.5 MArKET SHArE FOr ElECTrICITy gEnErATIOn
Table 2.6 EnErgy FlOWS In THE OIl rEFInIng SECTOr
Unit: Percent (%)
Unit: ktoe
2010
2010
2012
2011
2013
2012
2014
2013
2015
2014
Source: Energy Market Authority (EMA)
Source: Energy Market Authority (EMA)
31.7 26.3 26.2 22.4 20.1
12.1
- -
9.2
-
8.4 9.6 11.6
4.8 6.2 6.4 8.5 8.6 9.5
28.1 25.1 22.9 18.0 17.9
1.0 8.3 8.7
Senoko Energy
YTL PowerSeraya
PacificLight Power
Others2
SembCorp Cogen
1 Includes electricity generation by TP Utilities. 2 Includes electricity generation by Wholesale Licensees and Waste-To-Energy Plants. Note:a. Numbers may not add up to the totals due to rounding. Notation:- nil, negligible or not applicable
53,281.7 56,326.6 56,674.7 52,114.8 49,066.3
12,795.3 12,907.9 13,952.3 12,915.1 14,071.7
50,631.3 53,713.1
14,927.2
54,542.1
15,927.8
50,993.2 47,432.9
14,735.0 14,495.8 11,991.3
6,499.6 6,859.3
22,908.8
7,786.6
24,877.4
7,384.8 7,413.1
25,854.8 23,582.3 21,369.9
46,782.1 49,467.3 48,888.2 44,730.0 41,653.3
Refinery Inputs1
Other Feedstocks3
Middle Distillates
Crude Oil & Natural Gas Liquids
Refinery Outputs2
Heavy Distillates & Residuum
Light Distillates
1 Refinery inputs refer to the total amount of energy products that enter the refining process in the refinery sector. 2 Refinery outputs refer to the total amount of energy products that exit from the refining process in the refinery sector. 3 Other Feedstocks include Additives/Oxygenates, Refinery Feedstocks, Orimulsion, Shale Oil, Other Hydrocarbons, Natural Gas and Hydrogen. Note: a. Numbers may not add up to the totals due to rounding.
25.0
9.4
26.7
2005
23.2 24.5 20.1 21.3 21.0Tuas Power Generation1 24.6
8.6 12.9 11.8 11.2-Keppel Merlimau Cogen 8.1
This page is intentionally left blank.

0 3 ENERGY CONSUMPTION S I N G A P O R E E N E R GY S TAT I S T I C S 2 016
3 8 3 9
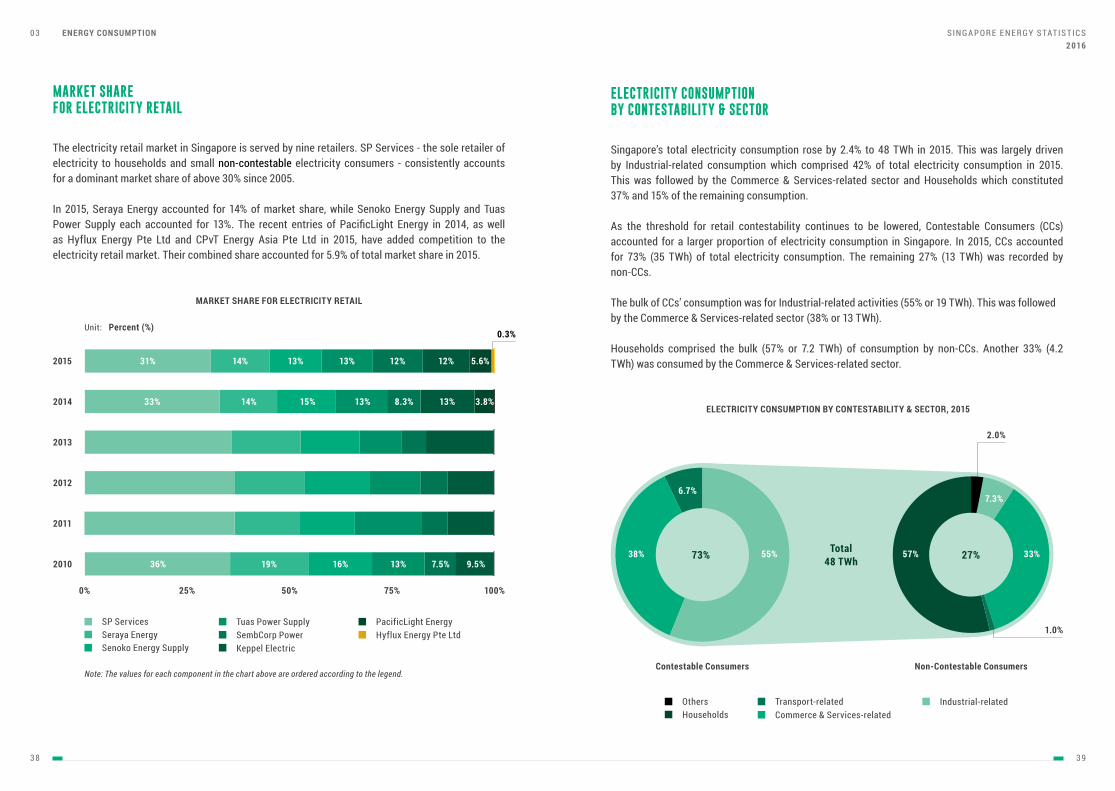
The electricity retail market in Singapore is served by nine retailers. SP Services - the sole retailer of electricity to households and small non-contestable electricity consumers - consistently accounts for a dominant market share of above 30% since 2005.
In 2015, Seraya Energy accounted for 14% of market share, while Senoko Energy Supply and Tuas Power Supply each accounted for 13%. The recent entries of PacificLight Energy in 2014, as well as Hyflux Energy Pte Ltd and CPvT Energy Asia Pte Ltd in 2015, have added competition to the electricity retail market. Their combined share accounted for 5.9% of total market share in 2015.
MArKET SHArE FOr ElECTrICITy rETAIl
electricitY consUmPtion BY contestaBilitY & sector, 2015
2.0%
1.0%
Singapore’s total electricity consumption rose by 2.4% to 48 TWh in 2015. This was largely driven by Industrial-related consumption which comprised 42% of total electricity consumption in 2015. This was followed by the Commerce & Services-related sector and Households which constituted 37% and 15% of the remaining consumption.
As the threshold for retail contestability continues to be lowered, Contestable Consumers (CCs) accounted for a larger proportion of electricity consumption in Singapore. In 2015, CCs accounted for 73% (35 TWh) of total electricity consumption. The remaining 27% (13 TWh) was recorded by non-CCs.
The bulk of CCs’ consumption was for Industrial-related activities (55% or 19 TWh). This was followedby the Commerce & Services-related sector (38% or 13 TWh).
Households comprised the bulk (57% or 7.2 TWh) of consumption by non-CCs. Another 33% (4.2 TWh) was consumed by the Commerce & Services-related sector.
ElECTrICITy COnSUMPTIOn by COnTESTAbIlITy & SECTOr
OthersHouseholds
Industrial-relatedTransport-relatedCommerce & Services-related
contestable consumers non-contestable consumers
73% total48 tWh
55%38%
6.7%
market share for electricitY retail
2010
2011
2012
2013
2015
2014
SP ServicesSeraya EnergySenoko Energy Supply
PacificLight EnergyTuas Power SupplyHyflux Energy Pte LtdSembCorp Power
Keppel Electric
0% 25% 50% 100%75%
31%
33%
36%
13%
15%
16%
14%
14%
19%
13%
13%
13%
12%
8.3%
12%
13%
7.5%
5.6%
3.8%
9.5%
Unit: Percent (%)0.3%
27% 33%57%
7.3%
Note: The values for each component in the chart above are ordered according to the legend.

0 3 ENERGY CONSUMPTION S I N G A P O R E E N E R GY S TAT I S T I C S 2 016
4 0 41
HOUSEHOld ElECTrICITy COnSUMPTIOn
1-room/2-room 3-room 4-room 5-room & executive
The average monthly electricity consumption of a 4-room public housing unit was 387 kWh in 2015. The average monthly electricity consumptions of a 1-room/2-room, and a 3-room unit were 57% and 26%, respectively, lower than that of a 4-room unit. On the other hand, the average monthly electricity consumption of a 5-room and executive flat was about 23% (475 kWh) more than that of a 4-room unit.
Unit: kWh
aVerage monthlY electricitY consUmPtionBY PUBlic hoUsing dWelling tYPe, 2015
500
100
200
300
400
The average monthly consumption of electricity by Households marginally increased 0.5% from 466 kWh in 2014 to 468 kWh in 2015. The average monthly consumption by public housing dwellings registered a 1.2% increase from 2014, to reach 376 kWh in 2015. That for private housing units fell by 2.1% to 732 kWh in 2015.
Jan decaug octJunmar novJulapr sepmayfeb
Unit: kWh
aVerage monthlY hoUsehold electricitY consUmPtion, 2015
Average Consumption 732 kWh
Public Housing
Average Consumption 376 kWh
Private Housing
800
600
400
200
732
376
57%26%
23%
400
200
Jan decaug octJunmar novJulapr sepmayfeb
600
800
Unit: gWh
total electricitY consUmPtion of hoUseholds, 2015
939692949493
8991
7976
79
91
173168163167167164
161153
131122131
161
146146147152147144137134
116113121
142
154155155161157153147143124120129
152
6868687169686563555356 66111111111110109.78.58.58.9 11
Total electricity consumed by Households rose from 6,924 GWh in 2014 to 7,221 GWh in 2015. This represented a year-on-year increase of 4.3%. About 59% (4,284 GWh) of total consumption was by public housing units. Private housing units accounted for the remaining 41% (2,926 GWh).
Note: The values for each component in the chart above are ordered according to the legend.
Private Apartments & Condominiums
Private housing
Landed Properties 5-Room & Executive4-Room
3-Room 1-Room/2-Room
Public housing

0 3 ENERGY CONSUMPTION S I N G A P O R E E N E R GY S TAT I S T I C S 2 016
42 4 3
Households use NG in the form of town gas, which is manufactured by City Gas and then sold to households and other end-consumers. The average monthly household town gas consumption fell by 2.7%, from 83 kWh in 2014 to 81 kWh in 2015.
In 2015, the average monthly town gas consumption of a 4-room public housing unit was 80 kWh. A 1-room/2-room, and a 3-room unit consumed about 68% (54 kWh) and 83% (66 kWh) of town gas, respectively, relative to the consumption of a 4-room dwelling. Average monthly town gas consumption of a 5-room and executive flat was about 5.6% (85 kWh) higher than that of a 4-room unit.
FInAl nATUrAl gAS COnSUMPTIOn
HOUSEHOldS TOWn gAS COnSUMPTIOn
1 Final end-users or consumers exclude those involved in power generation (as Main Power Producers or Autoproducers) and oil refining.
Unit: kWh
aVerage monthlY toWn gas consUmPtionBY PUBlic hoUsing dWelling tYPe, 2015
20
40
60
80
100
1-room/2-room 3-room 4-room 5-room & executive
17%
5.6%
32%
End-users1 consumption of NG declined 3.0% from 59,515 TJ in 2014 to 57,748 TJ in 2015. This followed weakening demand for natural gas by the Industrial-related sector.
NG consumption by Industrial-related consumers amounted to 50,739 TJ in 2015, about 3.5% lower than in the preceding year. Consumption by Transport-related users also registered a decline of 17% to 665 TJ in 2015. In contrast, the Commerce & Services-related sector and Households’ consumption of NG rose by 3.6% and 1.8%, respectively.
4.4%
51,876 tJ 57,748 tJ
final natUral gas consUmPtion BY sector
2010 2015
1.9%
0.1%
87%88%
6.4% 6.5%
4.3%
1.2%
0.1%
OthersHouseholds
Industrial-relatedCommerce & Services-relatedTransport-related

0 3 ENERGY CONSUMPTION S I N G A P O R E E N E R GY S TAT I S T I C S 2 016
4 4 4 5
Singapore’s Total Final Energy Consumption (TFEC) increased by 4.6% from 13,913 ktoe in 2013 to 14,549 ktoe in 2014. In 2014, the demand for petroleum products saw an increase of around 5.8% to 8,970 ktoe. Consumption of electricity increased by 3.2% to 3,990 ktoe while that for NG declined by 1.4% to 1,422 ktoe.
In 2014, the majority of TFEC was in the form of petroleum products (62% or 8,970 ktoe). This was followed by electricity at 27% (3,990 ktoe) and NG at 9.8% (1,422 ktoe).
Almost two-thirds (67% or 9,789 ktoe) of TFEC was accounted for by the Industrial-related sector. This was predominantly in the form of petroleum products (6,668 ktoe) and electricity (1,699 ktoe). Consumers in the Transport-related, and Commerce & Services-related sectors accounted for 17% (2,429 ktoe) and 11% (1,631 ktoe) of end-use consumption respectively. The Transport-related sector consumed mainly petroleum products (2,200 ktoe), while the Commerce & Services-related sector consumed mostly electricity (1,466 ktoe).
Households accounted for 4.7% (678 ktoe) of total energy consumption. This was primarily in the form of electricity (595 ktoe), and NG by way of town gas (59 ktoe).
TOTAl FInAl EnErgy COnSUMPTIOn
Total oil consumption amounted to 8,970 ktoe in 2014, representing an increase of 5.8% relative to the 8,475 ktoe recorded in 2013. Demand was largely channelled to Industrial-related activities, with a consumption amount totalling 6,668 ktoe (or 74%). The Transport-related sector was the second largest consumer, registering 2,200 ktoe (or 25%) of oil consumption in 2014. The Commerce & Services-related sector consumed 79 ktoe (0.9%) of oil, while the remaining 24 ktoe of oil was consumed by Households.
OIl COnSUMPTIOn
total oil consUmPtion BY sector, 2014
8,970 ktoe
0.3%
0.9%
74%
25%
9,789
1,631 2,429
678 21
total energY consUmPtion BY sector & energY ProdUct, 2014
Unit: ktoe
10,000
2,000
4,000
6,000
8,000
industrial-related
commerce &services-related
households otherstransport-related
Households
Industrial-relatedCommerce & Services-relatedTransport-related
Petroleum ProductsElectricityNatural GasCoal & Peat
0 3 ENERGY CONSUMPTION S I N G A P O R E E N E R GY S TAT I S T I C S 2 016
4 6 47
Source: Energy Market Authority (EMA)
41.7
7.6
13.3
17.5
3.1
-
-
-
16.8
-
-
-
2010
6.6
36.7
12.3
15.9
11.4
-
-
-
17.1
2012
35.8
5.9
10.3
14.5
16.6
-
-
-
16.9
2013
8.3
12.7
3.8
-
-
14.6
13.4
14.2
33.0
2014
30.8
12.2
0.3
0.0
12.6
5.6
12.7
11.5
14.3
2015
SP Services
Senoko Energy Supply
Keppel Electric
Seraya Energy
Tuas Power Supply
PacificLight Energy
SembCorp Power
Hyflux Energy Pte Ltd
CPvT Energy Asia Pte Ltd
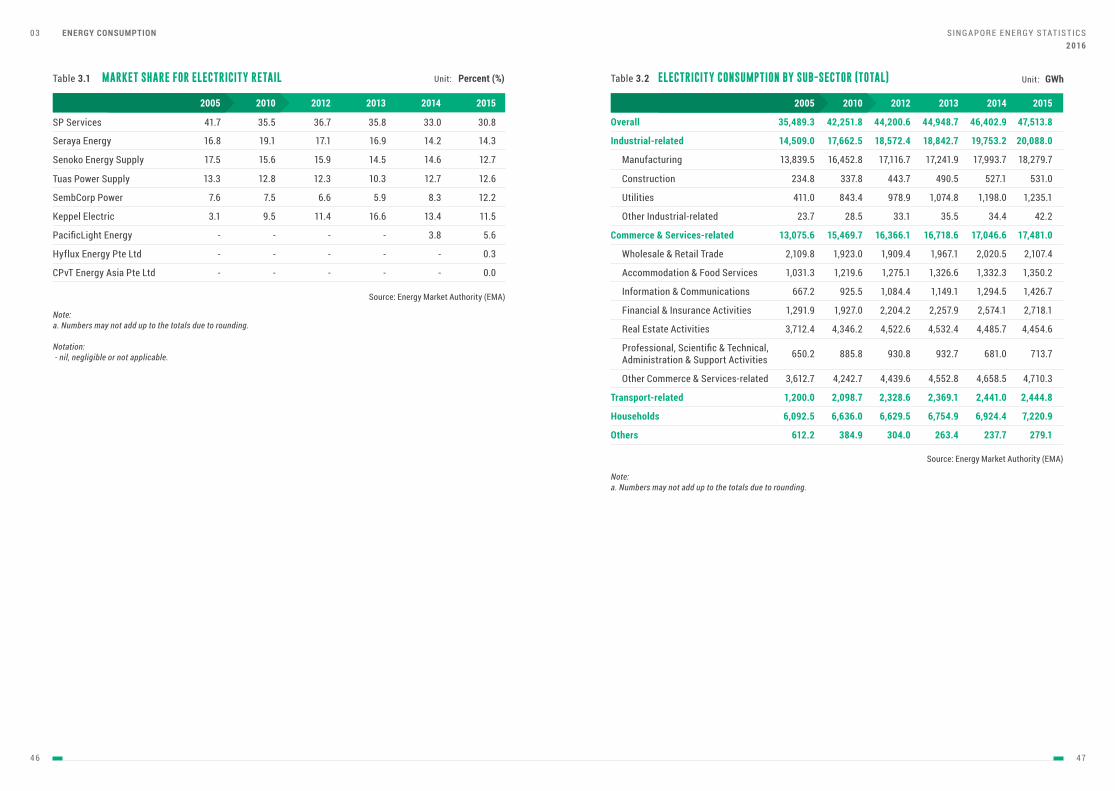
Table 3.1 MArKET SHArE FOr ElECTrICITy rETAIl
Note: a. Numbers may not add up to the totals due to rounding. Notation: - nil, negligible or not applicable.
Unit: Percent (%)
35.5
7.5
12.8
15.6
9.5
19.1
2005 2015
overall
Manufacturing
industrial-related
Other Industrial-related
Accommodation & Food Services
Construction
commerce & services-related
Information & Communications
transport-related
Wholesale & Retail Trade
Financial & Insurance Activities
households
Professional, Scientific & Technical, Administration & Support Activities
others
Other Commerce & Services-related
Table 3.2 ElECTrICITy COnSUMPTIOn by SUb-SECTOr (TOTAl) Unit: gWh
Utilities
35,489.3
234.8
13,075.6
667.2
1,200.0
2,109.8
1,291.9
6,092.5
650.2
612.2
3,612.7
13,839.5
23.7
1,031.3
14,509.0
411.0
3,712.4
2010
44,200.6
443.7
16,366.1
1,084.4
2,328.6
1,909.4
2,204.2
6,629.5
930.8
304.0
4,439.6
17,116.7
33.1
1,275.1
18,572.4
978.9
2012
4,522.6
44,948.7
490.5
16,718.6
1,149.1
2,369.1
1,967.1
2,257.9
6,754.9
932.7
263.4
4,552.8
17,241.9
35.5
1,326.6
18,842.7
1,074.8
2013
4,532.4
46,402.9 47,513.8
527.1 531.0
17,046.6 17,481.0
1,294.5 1,426.7
2,441.0 2,444.8
2,020.5 2,107.4
2,574.1 2,718.1
6,924.4 7,220.9
681.0 713.7
237.7 279.1
4,658.5 4,710.3
17,993.7 18,279.7
34.4 42.2
1,332.3 1,350.2
19,753.2 20,088.0
1,198.0 1,235.1
2014
4,485.7 4,454.6 Real Estate Activities
Source: Energy Market Authority (EMA)
Note: a. Numbers may not add up to the totals due to rounding.
42,251.8
337.8
15,469.7
925.5
2,098.7
1,923.0
1,927.0
6,636.0
885.8
384.9
4,242.7
16,452.8
28.5
1,219.6
17,662.5
843.4
4,346.2
2005

0 3 ENERGY CONSUMPTION S I N G A P O R E E N E R GY S TAT I S T I C S 2 016
4 8 49
Table 3.2.2 ElECTrICITy COnSUMPTIOn by SUb-SECTOr (nOn-COnTESTAblE COnSUMErS) Unit: gWh
323.5 274.2 229.0
overall
Manufacturing
industrial-related
Other Industrial-related
Accommodation & Food Services
Construction
commerce & services-related
Information & Communications
transport-related
Wholesale & Retail Trade
Financial & Insurance Activities
households
Professional, Scientific & Technical, Administration & Support Activities
others
Other Commerce & Services-related
Utilities
12,655.8
153.9
5,246.8
157.6
128.0
771.2
420.3
6,092.5
227.6
530.1
909.8
470.1
6.3
389.1
658.5
28.2
2,371.2
14,071.3
367.1
5,612.5
314.2
166.3
887.3
434.2
6,629.5
291.6
277.1
1,130.7
953.5
15.1
527.5
1,385.9
50.3
2,027.0
14,009.4
410.3
5,462.2
174.0
916.7
421.8
6,754.9
296.9
238.6
979.1
869.1
16.7
543.1
1,379.7
83.6
1,981.1
13,323.1 12,757.9
416.2 339.5
4,843.3 4,230.7
155.7 127.1
771.8 661.4
398.1 346.8
6,924.4 7,220.9
296.4 305.1
214.5 252.3
892.5 730.7
668.2 522.0
13.6 17.3
506.2 481.8
1,185.1 926.9
87.2 48.1
1,704.1 1,476.0 Real Estate Activities
Source: Energy Market Authority (EMA)
Note: a. Numbers may not add up to the totals due to rounding.
20152010 2012 2013 2014
13,216.3
255.1
5,031.5
223.0
136.6
781.7
379.1
6,636.0
266.3
346.9
1,010.5
742.1
9.2
429.8
1,065.3
58.9
1,940.9
20052015
overall
Manufacturing
industrial-related
Other Industrial-related
Accommodation & Food Services
Construction
commerce & services-related
Information & Communications
transport-related
Wholesale & Retail Trade
Financial & Insurance Activities
households
Professional, Scientific & Technical, Administration & Support Activities
others
Other Commerce & Services-related
Table 3.2.1 ElECTrICITy COnSUMPTIOn by SUb-SECTOr (COnTESTAblE COnSUMErS) Unit: gWh
Utilities
22,833.4
80.9
7,828.8
509.6
1,072.0
-
1,338.5
871.7
422.7
82.1
2,702.9
13,369.4
17.4
642.3
13,850.5
382.8
1,341.2
2010
30,129.4
76.6
10,753.6
770.3
2,162.3
--
1,022.1
1,770.0
639.2
27.0
3,308.9
16,163.2
18.1
747.6
17,186.5
928.6
2012
2,495.6
30,939.3
80.2
11,256.4
825.6
2,195.1
-
1,050.3
1,836.1
635.9
24.8
3,573.7
16,372.8
18.8
783.5
17,463.0
991.2
2013
2,551.3
33,079.9 34,756.0
110.9 191.5
12,203.4 13,250.3
1,020.4 1,197.8
2,285.3 2,317.8
- -
1,248.7 1,446.0
2,176.0 2,371.3
384.5 408.6
23.2 26.8
3,766.1 3,979.6
17,325.5 17,757.7
20.8 24.9
826.0 868.4
18,568.0 19,161.1
1,110.8 1,187.0
2014
2,781.6 2,978.6 Real Estate Activities
Source: Energy Market Authority (EMA)
Note: a. Numbers may not add up to the totals due to rounding.
Notation:- nil, negligible or not applicable.
29,035.4
82.8
10,438.2
702.5
1,962.0
1,141.3
1,547.9
619.4
38.0
3,232.2
15,710.6
19.3
789.8
16,597.2
784.5
2,405.2
2005

0 3 ENERGY CONSUMPTION S I N G A P O R E E N E R GY S TAT I S T I C S 2 016
5 0 51
Private Apartments & Condominiums
Private Apartments & Condominiums
Private Apartments & Condominiums
Table 3.3 TOTAl HOUSEHOld ElECTrICITy COnSUMPTIOn by dWEllIng TyPE
overall
overall
overall
Private housing
Private housing
Private housing
1-Room/2-Room
1-Room/2-Room
1-Room/2-Room
Landed Properties
Landed Properties
Landed Properties
5-Room & Executive
5-Room & Executive
5-Room & Executive
Public housing
Public housing
Public housing
3-Room
3-Room
3-Room
others
others
others
4-Room
4-Room
4-Room
Note:a. Numbers may not add up to the totals due to rounding.
Jan
Jan
Jan
feb
feb
feb
Jun
Jun
Jun
mar
mar
mar
apr
apr
apr
may
may
may
2005
2010
2012
Private Apartments & Condominiums
2005Jul aug sep oct decnov annual
overall
Private housing
1-Room/2-Room
Landed Properties
5-Room & Executive
Public housing
3-Room
others
4-Room
Private Apartments & Condominiums
overall
Private housing
1-Room/2-Room
Landed Properties
5-Room & Executive
Public housing
3-Room
others
4-Room
Private Apartments & Condominiums
overall
Private housing
1-Room/2-Room
Landed Properties
5-Room & Executive
Public housing
3-Room
others
4-Room
Unit: gWh
Source: Energy Market Authority (EMA)
2010Jul aug sep oct decnov annual
2012Jul aug sep oct decnov annual
447.8
503.3
166.2
198.4
111.1
121.9
52.9
56.6
0.9
1.0
6.3
7.1
70.4
77.5
110.4
118.3
280.7
303.9
95.8
120.9
437.1
505.0
165.5
202.4
107.3
121.1
51.5
55.8
0.9
1.0
6.0
6.9
70.7
81.0
106.0
117.8
270.8
301.5
94.8
121.4
560.2
607.9
211.3
242.1
138.3
147.0
64.4
66.8
1.1
1.1
7.0
8.0
86.8
91.9
138.1
142.8
347.9
364.7
124.5
150.1
479.7
508.6
183.3
204.4
117.1
121.7
55.4
56.0
1.0
1.0
6.1
6.9
78.5
79.9
116.8
118.7
295.4
303.3
104.8
124.5
533.6
540.9
200.9
216.0
131.5
130.3
61.4
59.9
1.1
1.1
6.9
7.4
83.1
83.4
131.8
126.3
331.6
323.8
117.9
132.5
535.0
557.1
203.5
222.1
130.9
134.4
61.5
61.6
1.1
1.0
6.8
7.5
83.1
83.9
131.2
130.5
330.5
334.0
120.4
138.3
490.6
190.9
119.055.6
1.0
6.2
77.0
117.9
298.7
113.9
503.9
199.9
120.256.5
1.0
6.1
82.4
120.1
302.9
117.5
606.0
239.1
145.667.8
1.3
7.2
93.9
145.0
365.6
145.2
547.6
220.7
129.460.4
1.1
6.4
88.0
129.7
325.9
132.7
585.0
231.7
140.264.6
1.2
6.8
91.5
140.4
352.0
140.3
573.5
226.5
137.364.6
1.2
7.0
87.9
137.0
345.9
138.6
537.4
594.8
201.1
236.2
528.8
585.6
197.7
233.5
516.3
573.2
194.3
228.0
520.0
560.2
200.0
225.4
478.0
524.8
181.6
210.2
518.6
568.1
197.8
228.5
6092.5
6,629.5
2,303.0
2,647.0
133.0
143.9
130.8
141.2
127.5
138.8
126.6
134.7
117.0
126.5
127.0
136.4
1,498.3
1,597.9
61.9
65.3
1.0
1.1
61.7
64.6
1.0
1.1
59.4
62.9
1.0
1.0
59.1
61.0
1.1
1.0
55.3
57.2
0.9
0.9
59.1
61.4
1.0
1.1
703.5
729.0
12.0
12.4
6.9
8.0
82.2
88.6
7.0
7.9
81.4
89.4
133.5
140.4
6.6
7.9
80.2
87.6
130.7
137.3
6.5
7.5
81.9
87.2
6.0
7.5
74.7
80.8
127.6
134.7
126.8
130.5
117.2
122.6
6.4
7.8
80.6
86.5
78.4
90.5
953.6
1,017.8
127.2
132.8
1,497.2
1,552.6
335.3
357.5
118.9
147.6
330.1
351.0
116.2
144.2
321.0
344.2
114.1
140.3
319.0
333.8
118.1
138.1
295.4
313.8
106.9
129.4
319.7
338.5
117.2
142.0
3,777.4
3,970.1
1,349.4
1,629.3
575.2
224.1
539.7
207.5
539.2
209.8
557.8
220.7
536.2
211.4
581.4
229.1
6,636.0
2,611.3
139.2 131.6 131.2 133.8 129.1139.9 1,596.664.7
1.2
61.8
1.0
60.8
1.1
62.7
1.2
59.9
1.1
65.3
1.2
744.6
13.6
7.0
86.4
6.9
82.1
139.0
6.7
83.7
130.8
7.0
86.6
6.8
82.7
129.6 132.4 127.9
7.2
88.7
81.2
1,030.7
138.8 1,588.5
349.9
137.7
331.2
125.4
328.3
126.1
335.8
134.1
323.7
128.7
351.2
140.4
4,011.0
1,580.6

0 3 ENERGY CONSUMPTION S I N G A P O R E E N E R GY S TAT I S T I C S 2 016
52 5 3
Private Apartments & Condominiums
Private Apartments & Condominiums
Private Apartments & Condominiums
overall
overall
overall
Private housing
Private housing
Private housing
1-Room/2-Room
1-Room/2-Room
1-Room/2-Room
Landed Properties
Landed Properties
Landed Properties
5-Room & Executive
5-Room & Executive
5-Room & Executive
Public housing
Public housing
Public housing
3-Room
3-Room
3-Room
others
others
others
4-Room
4-Room
4-Room
Note:a. Numbers may not add up to the totals due to rounding.
Jan
Jan
Jan
feb
feb
feb
Jun
Jun
Jun
mar
mar
mar
apr
apr
apr
may
may
may
2013
2014
2015
Table 3.3 TOTAl HOUSEHOld ElECTrICITy COnSUMPTIOn by dWEllIng TyPE (COnTInUEd)
Private Apartments & Condominiums
2013Jul aug sep oct decnov annual
overall
Private housing
1-Room/2-Room
Landed Properties
5-Room & Executive
Public housing
3-Room
others
4-Room
Private Apartments & Condominiums
overall
Private housing
1-Room/2-Room
Landed Properties
5-Room & Executive
Public housing
3-Room
others
4-Room
Private Apartments & Condominiums
overall
Private housing
1-Room/2-Room
Landed Properties
5-Room & Executive
Public housing
3-Room
others
4-Room
Source: Energy Market Authority (EMA)
2014Jul aug sep oct decnov annual
2015Jul aug sep oct decnov annual
Unit: gWh
513.1
509.7
202.1
201.7
125.6
124.7
56.3
55.8
0.9
0.9
7.5
8.0
78.1
77.4
120.6
118.5
310.0
307.1
124.0
124.3
209.7
128.5 56.4
8.9
79.0
120.7
314.6
130.7
498.0
489.3
199.1
194.6
120.4
119.1
54.2
53.3
0.9
0.8
7.2
7.7
78.0
76.7
116.2
113.7
298.0
293.9
121.1
117.9
197.8
120.1 53.1
8.5
75.8
113.3
294.9
122.0
629.6
639.0
249.7
254.3
154.4
156.0
68.5
69.0
1.2
1.1
8.8
9.7
93.3
94.3
146.9
149.0
378.6
383.6
156.5
160.0
632.3
256.6
153.1 67.5
1.0
10.4
92.8
143.8
374.7
163.8
498.3
488.7
201.8
199.5
119.6
116.8
53.6
52.4
0.9
0.9
7.1
7.4
78.2
77.5
115.2
111.7
295.5
288.3
123.6
122.0
210.1
123.6 54.8
8.5
79.0
116.2
303.0
131.1
568.3
568.1
228.1
231.6
137.0
136.0
61.9
61.2
1.1
1.1
8.0
8.5
87.4
88.5
132.3
129.7
339.1
335.5
140.7
143.1
594.2
243.4
142.5 63.4
1.0
9.7
90.7
134.3
349.8
152.7
601.8
609.5
245.9
248.9
142.3
146.2
64.8
66.1
1.1
1.0
8.4
9.2
91.3
91.0
139.3
138.1
354.8
359.6
154.5
157.9
610.7
250.6
146.5 65.2
0.9
10.2
89.2
137.2
359.2
161.4
612.0
241.4
617.5
243.3
560.6
222.4
555.0
227.6
530.1
212.7
570.7
229.6
6,754.9
2,703.8
148.8 150.9 136.3 131.7 128.1137.9 1,633.066.6
1.1
67.5
1.1
61.3
1.0
59.9
1.1
57.9
0.9
61.4
1.0
734.1
12.3
8.7
89.7
9.0
91.4
145.3
8.5
85.2
145.8
8.1
87.6
8.2
81.4
131.0 126.6 122.3
8.5
86.1
97.9
1,027.8
132.3 1,573.9
369.4
151.7
373.2
151.9
337.2
137.3
326.3
140.0
316.5
131.3
340.1
143.4
4,038.8
1,676.1
628.1
250.4
635.5
252.1
592.4
236.1
580.9
238.4
571.8
231.2
611.5
248.4
6,924.4
2,787.1
153.0 155.4 144.4 138.8 138.3147.1 1,675.868.3
1.0
68.9
1.0
63.9
1.0
62.4
1.0
61.3
0.9
65.6
1.0
748.2
11.6
9.7
91.5
10.0
93.4
145.7
9.5
88.3
148.1
9.3
89.7
9.4
85.7
137.5 131.0 130.7
9.9
90.4
108.3
1,044.5
139.5 1,593.3
376.7
158.9
382.4
158.7
355.3
147.7
341.4
148.7
339.7
145.5
362.1
158.0
4,125.7
1,742.6
647.0
261.5
656.7
261.3
635.7
254.5
643.6
263.4
622.4 7,220.9
251.2
645.7
265.7 2,925.8
157.4 161.1 155.0 154.9 151.9 154.2 1,748.8 69.4 70.7
1.0
67.9
0.9
67.7
0.9
68.0
0.9 0.9
66.0
0.9
770.1 10.7
94.2
11.0
94.2
147.1
10.8
91.6
151.7
10.7
95.7
10.7
90.7
146.6 145.9 141.7
10.7
93.0
120.7
1,065.8
146.1 1,644.6
384.5
167.3
394.6
167.1
380.3
162.9
379.3
167.7
370.3
160.5
379.0
172.7
4,284.2
1,859.9
525.2
0.9
493.6
0.8
513.9
0.8 11.0

0 3 ENERGY CONSUMPTION S I N G A P O R E E N E R GY S TAT I S T I C S 2 016
5 4 5 5
Private Apartments & Condominiums
Private Apartments & Condominiums
Private Apartments & Condominiums
Table 3.4 AVErAgE MOnTHly HOUSEHOld ElECTrICITy COnSUMPTIOn by dWEllIng TyPE
overall
overall
overall
Private housing
Private housing
Private housing
1-Room/2-Room
1-Room/2-Room
1-Room/2-Room
Landed Properties
Landed Properties
Landed Properties
5-Room & Executive
5-Room & Executive
5-Room & Executive
Public housing
Public housing
Public housing
3-Room
3-Room
3-Room
others
others
others
4-Room
4-Room
4-Room
Jan
Jan
Jan
feb
feb
feb
Jun
Jun
Jun
mar
mar
mar
apr
apr
apr
may
may
may
2005
2010
2012
Private Apartments & Condominiums
2005Jul aug sep oct decnov annual
overall
Private housing
1-Room/2-Room
Landed Properties
5-Room & Executive
Public housing
3-Room
others
4-Room
Private Apartments & Condominiums
overall
Private housing
1-Room/2-Room
Landed Properties
5-Room & Executive
Public housing
3-Room
others
4-Room
Private Apartments & Condominiums
overall
Private housing
1-Room/2-Room
Landed Properties
5-Room & Executive
Public housing
3-Room
others
4-Room
Unit: kWh
Source: Energy Market Authority (EMA)
2010Jul aug sep oct decnov annual
2012Jul aug sep oct decnov annual
Note:a. Numbers may not add up to the totals due to rounding.
418.1
431.1
751.4
717.9
345.6
351.5
241.7
258.9
594.2
579.7
135.2
148.9
1,037.7
422.0
428.1
1,119.6
330.9
341.7
624.8
583.6
408.3
430.9
749.8
726.1
347.8
333.6235.2
255.4
572.7
602.71,151.8
129.0
143.2
1,044.8
405.1
425.3
319.1
338.2
619.2
582.6
519.7
514.0
941.9
851.6
418.7
427.4294.7
306.3
711.8
676.9
151.1
164.4
1,277.9
1,291.0
524.4
512.7
408.2
406.7
796.0
704.7
446.9
432.2
825.2
728.3
348.5
363.4253.1
255.4
637.1
570.0
131.5
143.4
1,157.1
1,138.0
445.4
427.0
347.6
339.0
679.3
591.6
496.2
459.1
900.8
765.3
372.7
407.4280.3
273.7
723.3
643.7
148.0
151.9
1,224.8
1,176.3
501.9
455.2
389.7
362.1
759.2
627.3
496.8
472.5
909.9
787.8
383.5
404.9281.0
282.2
693.5
573.8
147.0
153.7
1,224.2
1,194.0
498.9
469.6
388.0
373.0
772.9
653.0
433.4
734.7
354.8255.8
607.0
143.2
1,105.4
429.8
343.2
598.9
446.1
773.4
358.4260.1
617.5
142.7
1,182.4
438.5
348.4
622.4
531.5
903.2
431.5311.2
743.9
163.3
1,333.7
528.4
418.5
747.2
482.1
845.7
384.3277.1
621.8
146.6
1,262.0
471.8
373.2
693.8
513.5
880.6
415.2296.0
719.0
156.0
1,296.4
510.9
402.6
728.3
505.4
866.5
408.1296.8
671.9
159.5
1,268.6
500.1
396.8
721.5
497.7
502.9
890.6
832.0
489.3
493.9
872.3
816.5
477.7
483.2
856.0
797.5
480.8
471.1
877.9
783.5
441.6
440.3
791.2
727.0
479.7
478.0
866.8
796.8
471.1
467.5
853.0
777.8
409.8
410.7
401.2
403.8
394.1
393.6
382.0
390.9
386.7
361.3392.2
357.9
386.3
379.6
283.8
298.7
622.7
661.0
283.3
296.0
604.5
626.5
272.9
288.4
605.1
601.8
272.1
280.0
644.3
648.3
254.4
262.1
569.7
530.8
272.0
281.7
640.7
639.4
268.7
278.2
634.2
612.6
147.8
162.2
1,206.7
148.8
161.6
1,196.3
1,266.5
506.2
504.2
141.2
158.9
1,178.9
1,258.7
495.0
492.6
139.7
151.0
1,202.2
1,246.0
132.7
150.0
1,094.4
1,136.4
482.8
482.7
479.1
467.2
441.8
438.5
140.4
156.2
1,183.5
1,226.7 1,239.7
141.1
153.8
1,169.1
1,203.9
480.5
475.9
473.7
465.0
393.3
398.5
754.1
689.9
387.2
390.9
733.1
670.4
376.7
383.0
717.7
651.2
374.4
370.9
739.5
637.9
347.0
348.1
662.8
593.5
375.5
376.1
732.1
654.3
369.9
369.1
716.2
636.9
502.4
839.5
471.9
778.7
472.0
789.4
486.9
826.6
466.3
785.9
509.6
866.6
485.1
824.3
411.8 389.7 388.7 395.2 380.2414.2 394.4295.6
689.9
282.7
582.4
277.9
642.1
286.2
699.4
272.8
629.1
298.9
667.6
284.3
657.8
158.1
1,232.1
154.9
1,166.3
505.4
150.4
1,204.8
476.5
156.8
1,232.4
149.6
1,173.1
473.2 482.0 465.4
160.8
1,291.3
153.5
1,229.0
506.6 482.4
399.3
699.5
378.3
639.6
375.3
642.4
383.0
681.7
368.2
648.4
401.4
717.6
382.4
678.6

0 3 ENERGY CONSUMPTION S I N G A P O R E E N E R GY S TAT I S T I C S 2 016
5 6 5 7
Private Apartments & Condominiums
Private Apartments & Condominiums
Private Apartments & Condominiums
overall
overall
overall
Private housing
Private housing
Private housing
1-Room/2-Room
1-Room/2-Room
1-Room/2-Room
Landed Properties
Landed Properties
Landed Properties
5-Room & Executive
5-Room & Executive
5-Room & Executive
Public housing
Public housing
Public housing
3-Room
3-Room
3-Room
others
others
others
4-Room
4-Room
4-Room
Jan
Jan
Jan
feb
feb
feb
Jun
Jun
Jun
mar
mar
mar
apr
apr
apr
may
may
may
2013
2014
2015
Table 3.4 AVErAgE MOnTHly HOUSEHOld ElECTrICITy COnSUMPTIOn by dWEllIng TyPE (COnTInUEd)
Private Apartments & Condominiums
2013Jul aug sep oct decnov annual
overall
Private housing
1-Room/2-Room
Landed Properties
5-Room & Executive
Public housing
3-Room
others
4-Room
Private Apartments & Condominiums
overall
Private housing
1-Room/2-Room
Landed Properties
5-Room & Executive
Public housing
3-Room
others
4-Room
Private Apartments & Condominiums
overall
Private housing
1-Room/2-Room
Landed Properties
5-Room & Executive
Public housing
3-Room
others
4-Room
Source: Energy Market Authority (EMA)
2014Jul aug sep oct decnov annual
2015Jul aug sep oct decnov annual
Unit: kWh
Note:a. Numbers may not add up to the totals due to rounding.
430.2
420.2
699.2
675.5
354.7
347.5253.6
258.7
550.6
581.9
149.6
151.4
1,108.9
1,104.0
430.9
422.3
343.7
336.4
567.2
544.0
414.7
648.9
345.4251.0
657.7
153.1
1,107.8
421.3
334.0
519.0
418.9
402.5
691.3
648.0
341.2
331.0242.2
544.2
587.3
249.5143.2
144.7
1,105.6
1,082.9
416.7
405.2
331.4
321.5
513.7
557.0
390.6
614.6
322.9
594.2
236.9144.8
1,066.3
396.2
313.7
486.5
525.1
516.2
852.7
816.9
434.8
427.8
313.2
777.1
311.5
702.4
171.8
173.3
1,312.1
1,307.5
526.0
525.7
418.7
414.6
669.0
705.5
491.0
767.6
405.4299.5
726.9
173.3
1,281.6
497.1
393.6
625.4
417.4
400.0
697.8
661.3
338.0
323.0237.1
245.7
546.3
605.4
139.0
137.2
1,117.6
1,111.9
411.9
396.4
327.4
313.9
525.9
563.8
403.3
645.7
329.6242.9
605.9
143.3
1,123.6
403.5
319.8
513.9
473.9
462.4
779.7
757.1
386.3
374.9276.5
282.9
746.8
651.5
154.8
154.8
1,221.6
1,234.6
472.3
459.4
374.8
364.1
610.8
636.7
463.7
736.3
378.9280.4
754.1
163.6
1,259.0
465.6
368.3
590.7
508.1
494.6
844.8
808.7
410.1
401.8298.4
299.8
734.9
647.1
164.4
167.4
1,299.2
1,285.8
502.4
488.4
398.0
389.5
666.1
700.1
476.3
757.8
389.3289.1
703.3
171.0
1,249.5
475.6
378.0
622.4
508.6
506.6
821.0
802.0
513.0
510.0
825.1
800.1
465.9
474.7
759.2
748.8
459.0
463.5
767.5
749.9
436.8
453.0
710.5
718.9
471.1
486.8
772.5
780.1
469.0
466.1
768.6
748.0
417.8
419.1
423.6
423.8
382.2
393.3
368.0
376.4
356.8
372.9
384.2
398.2
383.1
382.6
303.8
723.4
307.7
308.5
666.0
697.7
279.4
310.0
634.1
716.9
272.3
286.9
612.8
754.7
278.7
279.8
647.0
783.0
273.1
598.8
696.5
263.1
292.9
635.9
668.3
279.6
280.9
619.8
167.0
171.9
1,269.6
1,289.2
173.3
176.6
1,285.2
1,293.3
518.9
514.1
161.6
166.5
1,215.6
1,240.6
521.0
521.8
154.9
160.9
1,233.0
1,249.1
154.9
161.2
1,139.7
1,189.5
467.9
483.9
451.3
459.8
435.7
457.1
161.1
171.7
1,223.5
1,272.8
158.0
161.7
1,211.1
1,222.3
471.1
489.1
468.8
468.7
407.1
406.7
658.6
411.3
411.4
679.1
653.5
371.1
381.6
678.8
605.3
358.3
365.5
615.8
604.2
346.7
361.6
632.5
583.0
372.6
386.7
620.8
638.6
371.7
371.3
576.0 627.9
606.9
500.4
775.8
507.9
776.1
491.8
759.0
494.2
773.5
476.6
733.3
506.8
787.6
468.4
732.3
415.7 425.2 408.5 406.2 397.3416.4 386.9307.0 312.6
739.6
300.2
704.6
297.9
713.4
306.0
738.3 698.6
290.3
735.3
284.5
697.1
177.2
1,316.9
183.3
1,301.7
507.6
178.4
1,292.4
523.4
175.4
1,319.9
174.5
1,260.2
505.9 501.7 486.7
179.8
1,336.2
168.3
1,243.2
515.7 475.1
402.9
630.1
413.1
632.2
397.8
616.1
394.9
625.7
384.9
593.2
405.2
645.0
375.6
592.7

0 3 ENERGY CONSUMPTION S I N G A P O R E E N E R GY S TAT I S T I C S 2 016
5 8 5 9
Kallang
Tampines
West region
Clementi
Outram
Hougang
overall Public housing
Queenstown
Punggol
Geylang
Pasir Ris
Yishun
Choa Chu Kang
central region
Tanglin
Serangoon
Marine Parade
north east region
Bukit Batok
Jurong East
Bukit Timah
Bedok
Woodlands
overall
Rochor
Sengkang
Bishan
Toa Payoh
north region
Novena
Ang Mo Kio
Bukit Panjang
Jurong West
Bukit Merah
east region
Sembawang
Notes:a. Numbers may not add up to the totals due to rounding. b. Planning Areas refer to areas demarcated in the Urban Redevelopment Authority’s Master Plan 2008. Notation:- nil, negligible or not applicable.
1-room/2-room
Kallang
Tampines
West region
Clementi
Outram
Hougang
Queenstown
Punggol
Geylang
Pasir Ris
Yishun
Choa Chu Kang
central region
Tanglin
Serangoon
Marine Parade
north east region
Bukit Batok
Jurong East
Bukit Timah
Bedok
Woodlands
overall
Rochor
Sengkang
Bishan
Toa Payoh
north region
Novena
Ang Mo Kio
Bukit Panjang
Jurong West
Bukit Merah
east region
Sembawang
Source: Energy Market Authority (EMA)
Table 3.5 AVErAgE MOnTHly ElECTrICITy COnSUMPTIOn by PlAnnIng ArEA & dWEllIng TyPE (AnnUAl) Unit: kWh
289.8
405.9
312.7
389.6
332.4
490.3
373.3
412.9
2010 2012 2013 20152014
302.4
410.6
386.2386.5
417.4
228.7
310.1
379.4
390.1
319.4
319.5
401.7
339.1309.5
375.0
361.1
377.1
409.1
348.7
397.3
370.2
448.8
398.2
301.8
434.2
379.0
318.5
328.9295.6
359.1
339.9
477.0
375.1
405.6
329.6298.4
363.8
341.8
481.0
387.2
406.5
331.7 339.8304.2 303.8
368.8 358.8
344.6 348.5
478.0 475.1
368.0 382.5
407.7 407.6
312.8
401.9
404.0
324.1
392.7
319.3
404.3
408.9
326.3
397.7
321.6 323.4
403.7 406.8
397.4 411.8
331.1 336.1
388.2 400.5
402.0 403.9
347.1
318.1
380.9
393.9
314.2
378.3
393.3
405.7 410.9
350.4
321.6 324.3
377.1 371.4
394.8 403.4
351.8 359.4
324.7
395.2
319.7
371.7
361.9
358.2
328.4
397.1
324.4
372.4
362.2
361.5
393.4
349.5
403.7
331.2 334.8
398.2 406.6
318.7 321.0
371.7 372.5
364.1 373.3
363.6 368.9
395.2
349.6
402.5
395.9 399.6
351.7 357.6
402.6 412.7
369.1
434.7
397.6
418.7
375.8
309.6
371.7
415.9
395.0
312.0
422.0
377.9
318.2
371.3 375.6
416.8 413.1
386.5 386.6
316.2
419.5 421.2
378.8 382.7
320.3 322.5
317.5 324.4
265.0
399.4
270.7
397.2
273.9 280.4
394.8 397.4
333.3303.7
420.9
345.0
493.1
388.8
419.9
324.0
415.6
411.7
336.0
403.8
356.9
323.3
395.8
403.5
423.7333.0
410.1
323.3
391.8
372.1
377.1
405.9
358.6
413.4
382.4
448.4
417.6
435.9
389.7
328.8
316.6
230.6
417.1
153.5
147.1
161.1
154.4
224.5
165.1
145.4
181.2161.9
142.8
165.2
124.9
160.8
161.0
186.6164.1
155.5
168.1
147.2
174.7
160.4
178.9
183.3 188.9168.6 172.4
167.6 181.2
173.5
148.1 184.7
163.3 180.7
170.1 175.1
138.3-
-
-
--
-
141.3
131.0
150.5-
-
152.4
162.4
158.6
152.6
154.3-
-
159.9
163.8
158.8
157.6
158.8-
-
162.6 168.4
152.5 163.4
161.6 165.0
152.2 167.2
163.0-
-
131.0108.2
123.3
150.0
159.3
135.6
183.6
164.6
158.4
188.7
160.7
137.0
185.7
139.4
187.7
169.1 170.9
159.2 159.8
183.2 192.9
144.1
190.3 200.7
140.5
147.9
162.2
149.9170.1
150.2
140.8
141.4
139.7
125.2
153.3
147.7
190.9
157.6
124.7
118.8
156.1
157.9
192.8
161.9
148.0
150.6
154.5
146.5
159.9 164.5
167.9 177.3
195.5
169.5 175.7
143.2 158.4
157.8 172.8
156.3
147.7
199.4
159.6 161.7
145.7 160.3
141.5
120.8
151.4
132.2
153.8
157.7
150.1
154.6
120.3
158.0
165.9
138.2
171.2
162.7
135.3
161.9
168.9 175.9
141.0
172.6 176.8
165.5 175.1
144.4 158.4
169.5
143.8 149.9
136.7
161.7
139.8
155.5
144.0 148.9
174.1 182.3
177.6164.0
96.5
164.8
276.3
146.9
138.9
150.6-
-
-
156.0
134.1
157.3
137.6
171.5
162.1
189.5
112.4152.6
166.3
188.5
158.9
140.8
142.9
156.9
135.6
153.5
149.7
145.8
162.7142.5
140.6
137.9
135.5
151.9
2010 2012 2013 2015201420052005

0 3 ENERGY CONSUMPTION S I N G A P O R E E N E R GY S TAT I S T I C S 2 016
6 0 61
Table 3.5 AVErAgE MOnTHly ElECTrICITy COnSUMPTIOn by PlAnnIng ArEA & dWEllIng TyPE (AnnUAl) (COnTInUEd)
Kallang
Tampines
West region
Clementi
Outram
Hougang
3-room
Queenstown
Punggol
Geylang
Pasir Ris
Yishun
Choa Chu Kang
central region
Tanglin
Serangoon
Marine Parade
north east region
Bukit Batok
Jurong East
Bukit Timah
Bedok
Woodlands
overall
Rochor
Sengkang
Bishan
Toa Payoh
north region
Novena
Ang Mo Kio
Bukit Panjang
Jurong West
Bukit Merah
east region
Sembawang
4-room
Unit: kWh
Kallang
Tampines
West region
Clementi
Outram
Hougang
Queenstown
Punggol
Geylang
Pasir Ris
Yishun
Choa Chu Kang
central region
Tanglin
Serangoon
Marine Parade
north east region
Bukit Batok
Jurong East
Bukit Timah
Bedok
Woodlands
overall
Rochor
Sengkang
Bishan
Toa Payoh
north region
Novena
Ang Mo Kio
Bukit Panjang
Jurong West
Bukit Merah
east region
Sembawang
Source: Energy Market Authority (EMA)Notes:a. Numbers may not add up to the totals due to rounding. b. Planning Areas refer to areas demarcated in the Urban Redevelopment Authority’s Master Plan 2008. Notation:- nil, negligible or not applicable.
258.5
267.7
279.0
272.0
256.5
266.1
293.5264.0
199.7
283.7
275.0
271.7
298.4263.8
211.6
283.3
284.8
275.5
289.8
299.6 304.7266.6 267.1
249.7 242.8
285.5
39.7 211.2
276.9 287.8
281.0 277.3
283.0
277.7
253.8
283.9
283.4292.4
273.7
285.7
285.4
31.2
290.1
280.4
287.5
285.8 289.2
184.9 239.9
294.9 297.6
274.2 285.8
287.6268.7262.4
296.1
269.2
249.6
254.2
268.4
299.4
280.7
262.7
278.7
278.4
260.7
279.0
273.6
302.4
283.3 285.3
261.5 263.7
280.3 282.9
276.9
303.7 310.0
275.5
278.7
260.9
285.9260.7
267.8
251.9
264.3
279.0
269.1-
--
-247.0
283.4
268.3
285.8
275.7
266.2
268.1
283.9
271.1
289.5
275.2
267.5
271.7
278.1
277.0-
-270.6
286.0
272.0 281.0
281.8
278.5 280.7
271.3 277.6
276.7 280.4
280.0
278.5-
271.5
288.5
285.0
280.2
280.4 284.7
272.4 283.5
282.3
268.9
253.3
284.6
293.2
256.7
259.1
278.2
389.8
257.2
295.0
268.9
263.3
279.6
335.3
226.0
289.2
297.5
271.0
267.1
281.1
369.4 325.7
248.5 251.9
292.5
295.0 297.8
273.7 276.8
268.7 271.9
285.7
293.1 297.7
288.4
279.2
285.6
279.4
285.2 289.1
280.9 287.4
298.4271.9
17.7
288.3
279.4
280.6
294.7
289.7297.2
276.9
307.3
284.0
267.4
272.5
277.8290.1
275.7
284.6
283.2
270.1
277.6
278.0
283.0-
-271.0
284.3
359.1
237.0
301.7
273.3
274.8
294.9
297.5
287.9
361.6
406.0
375.6
361.0
402.5
424.0
384.8
380.5
409.0378.5337.4
307.0
402.6
419.0
388.6
375.9
396.7373.6346.5
327.8
406.1
424.0
402.9
378.1
408.8
404.1 397.7377.8356.9
389.7349.6
343.5 336.7
408.2
419.9 416.3
382.3 398.9
381.7 380.8
372.5
412.0
348.3374.7
368.7
405.7
361.2380.0
379.2
407.9
365.5386.2
381.9
406.8 409.5
355.3 372.8377.7 392.4
382.2391.7399.9
370.0
382.0
358.4
384.4
396.0
372.0
376.7
360.8
387.9
371.0
357.1
388.1
397.0
372.9
381.6 384.3
357.4 354.5
388.4 397.4
401.7
375.4 381.4
384.4
376.7
399.0
377.8360.9
387.1
377.1
386.2
377.4
386.4
373.0
374.8
395.3
355.7
371.1
377.8
365.5
380.4
396.4
360.3
373.3
380.3
371.1
373.6
387.2
377.7
383.8 386.6
398.5 407.1
355.5
374.3 375.0
382.9 393.2
373.8 378.4
373.7
385.0
377.2
354.9
377.6
387.5 392.9
380.1 391.9
390.8
386.3
426.3
360.1
401.4
425.6
377.7
375.7
379.6
367.5
362.9
414.2
373.7
349.0
383.1
370.3
363.7
384.4
418.5
376.5
361.0
382.9
375.7 383.3
358.2 362.5
388.0
415.7 418.7
377.7 380.9
363.2 359.6
390.6
389.3 398.8
366.6
398.8
380.7
396.0
386.6 397.1
394.9 396.5
384.9356.5
368.6
407.5
430.3
401.9
386.3
390.7
382.8
417.3
365.2
384.8
389.6
384.7
386.6
373.4
398.2
409.5388.0
405.5
366.1
393.9
388.3
387.2
393.6
385.9
394.4
421.4
376.0
429.6
387.6
377.4
397.3
272.8
414.6
2010 2012 2013 201520142005 2010 2012 2013 201520142005

0 3 ENERGY CONSUMPTION S I N G A P O R E E N E R GY S TAT I S T I C S 2 016
6 2 6 3
Table 3.5 AVErAgE MOnTHly ElECTrICITy COnSUMPTIOn by PlAnnIng ArEA & dWEllIng TyPE (AnnUAl) (COnTInUEd)
Kallang
Tampines
West region
Clementi
Outram
Hougang
5-room/executive
Queenstown
Punggol
Geylang
Pasir Ris
Yishun
Choa Chu Kang
central region
Tanglin
Serangoon
Marine Parade
north east region
Bukit Batok
Jurong East
Bukit Timah
Bedok
Woodlands
overall
Rochor
Sengkang
Bishan
Toa Payoh
north region
Novena
Ang Mo Kio
Bukit Panjang
Jurong West
Bukit Merah
east region
Sembawang
Unit: kWh
50.7 51.2 49.3 50.1 46.2 42.8
18.6 21.1 21.7 17.0 9.2 9.0- -
30.7
-
27.6
5.5
29.0
12.6
27.4 29.7
13.5
-
- -
-
-
-
-
-
2.2
- -
34.6
0.0
2015
SembCorp Gas
City-OG Gas Energy ServicesPavilion Gas
Gas Supply
City Gas
Table 3.6 MArKET SHArE FOr nATUrAl gAS rETAIl1 Unit: Percent (%)
2010 2011 2012 2013 2014
Keppel Gas
Source: Energy Market Authority (EMA)
Source: Energy Market Authority (EMA)
1 Natural Gas Retail Sales by Gas Retailers at distribution network level (< 10bar). Notes:a. Figures may not add up to total due to rounding. b. All Gas Supply Pte Ltd (GSPL)’s gas retail contracts have been novated and transferred to Pavilion Gas Pte Ltd on 1 Nov 2014. GSPL’s gas retailer licence was terminated with effect from 18 Mar 2015. Notation: - nil, negligible or not applicable.
52,566.1 60,353.3 59,514.6 57,748.1
143.4
3,496.3
0.1
927.7
123.9
292.7
2,382.1
106.5
32.0
540.9
317.8
3,807.5
0.4
841.7
185.5
296.1
2,409.1
134.9
31.9
548.7
278.7 259.9
3,623.9 3,753.8
0.4 0.6
806.1 665.2
202.6 310.7
287.0 270.8
2,464.6 2,508.0
130.5 148.5
35.0 82.5
570.9 559.6
45,221.4
- -
52,526.4
0.1
2,349.2
52,141.8 50,395.0
0.3
2,379.3
0.4 1.3
2,362.6 2,395.1
45,728.0 53,263.1
363.0
52,585.0 50,738.6
418.7 164.2 82.4
2015
overall
Manufacturingindustrial-related
Other Industrial-related
Accommodation & Food Services
Construction
commerce & services-related
Information & Communications
transport-related
Wholesale & Retail Trade
Financial & Insurance Activities
households
Professional, Scientific & Technical, Administration & Support Activities
others
Other Commerce & Services-related
Table 3.7 nATUrAl gAS COnSUMPTIOn by SUb-SECTOr Unit: tJ
2011 20122010 2013 2014
Utilities
83.0 262.7 69.9 68.5 Real Estate Activities
Note:a. Figures may not add up to total due to rounding. Notation: - nil, negligible or not applicable.
51,876.2 54,438.1
171.8 163.9
3,323.6 3,493.2
0.3 0.2
968.0 1,202.0
123.3 125.9
298.9 300.6
2,257.2 2,309.1
106.5 93.9
34.1 33.1
512.6 555.5
44,737.7 46,833.4
2,202.6 2,337.9
45,293.3 47,400.5
383.8 403.2
79.5 79.3
Source: Energy Market Authority (EMA)Notes:a. Numbers may not add up to the totals due to rounding. b. Planning Areas refer to areas demarcated in the Urban Redevelopment Authority’s Master Plan 2008. Notation:- nil, negligible or not applicable.
458.5
502.3
490.1
399.5
504.4
533.6
499.9
462.3
498.2444.5
427.9
484.1
518.0
492.3
457.2
487.7442.5
435.6
489.2
521.9
505.3
459.9
499.2
491.1 505.5448.9 449.5
435.4 428.7
495.2
524.3 528.0
474.2 488.9
462.9 466.2
438.4
522.7
413.9462.2
439.9
500.4
441.3
442.4
470.8
445.5
504.0
448.1
443.7
476.1
446.3
504.9 511.1
448.0 465.2
450.1 458.7
471.5 485.8
450.3475.0508.7
653.0
460.1
429.9
466.6
474.6
478.6
437.8
434.8
461.6
432.3
431.3
459.3
476.2
484.0
443.1 452.3
435.1 434.1
465.2 478.1
483.0
484.2 493.7
477.2
489.3
512.4
493.3443.5
451.3
480.1
469.7
492.2
495.4
465.9
454.3
499.4
428.4
454.7
465.8
440.3
457.5
502.3
436.4
459.8
465.0
444.2
460.4
469.7
474.6
460.4
501.3 511.9
428.5
457.0 457.9
467.5 481.9
446.7 454.2
463.5
471.4
476.3
466.2
431.3
461.7
472.5 484.1
479.9 492.9
462.9
473.3
512.8
423.7
467.6
530.5
461.3
478.7
465.0
468.9
441.3
505.1
451.9
437.6
468.8
451.8
447.0
447.5
509.6
454.6
447.2
468.9
438.8 446.5
440.8 442.8
455.0
509.2 513.9
457.2 464.4
448.6 448.8
477.9
457.9 468.3
424.0
489.9
441.9
493.4
449.5 465.6
491.4 493.5
494.1460.0
454.6
499.2
533.9
508.4
471.1
457.1
519.2
451.1
486.3
482.8
495.6
459.4
445.6
470.9
506.8476.1
518.3
438.9
475.3
481.7
459.5
481.1
491.1
485.8
482.4
492.8
456.6
524.4
466.6
469.9
472.8
276.1
510.1
2010 2012 2013 201520142005

0 3 ENERGY CONSUMPTION S I N G A P O R E E N E R GY S TAT I S T I C S 2 016
6 4 6 5
Private Apartments & Condominiums
Private Apartments & Condominiums
Private Apartments & Condominiums
Table 3.8 TOTAl HOUSEHOld TOWn gAS COnSUMPTIOn by dWEllIng TyPE
overall
overall
overall
Private housing
Private housing
Private housing
1-Room/2-Room
1-Room/2-Room
1-Room/2-Room
Landed Properties
Landed Properties
Landed Properties
5-Room & Executive
5-Room & Executive
5-Room & Executive
Public housing
Public housing
Public housing
3-Room
3-Room
3-Room
others
others
others
4-Room
4-Room
4-Room
Jan
Jan
Jan
feb
feb
feb
Jun
Jun
Jun
mar
mar
mar
apr
apr
apr
may
may
may
2005
2010
2012
Note:a. Figures may not add up to total due to rounding.
Private Apartments & Condominiums
2005Jul aug sep oct decnov annual
overall
Private housing
1-Room/2-Room
Landed Properties
5-Room & Executive
Public housing
3-Room
others
4-Room
Private Apartments & Condominiums
overall
Private housing
1-Room/2-Room
Landed Properties
5-Room & Executive
Public housing
3-Room
others
4-Room
Private Apartments & Condominiums
overall
Private housing
1-Room/2-Room
Landed Properties
5-Room & Executive
Public housing
3-Room
others
4-Room
Unit: gWh
Source: Energy Market Authority (EMA)
2010Jul aug sep oct decnov annual
2012Jul aug sep oct decnov annual
48.6
53.5
6.9
10.7
16.0
16.6
6.6
6.1
0.6
1.3
1.1
1.1
1.0
17.4
17.8
0.9
41.1
41.6
5.9
9.8
6.9
48.1
55.4
11.2
17.2
15.86.5
6.1
0.6
1.30.9
1.1
1.1
1.0
17.2
18.5
40.5
6.0
10.2
43.0
47.5
54.6
10.8
6.9
17.2
15.76.3
6.0
0.5
1.2
1.0
1.1
0.9
0.9
17.1
18.4
40.1
5.9
9.9
42.6
6.8
48.2
55.5
11.2
17.2
15.96.5
6.1
0.5
1.2
1.0
1.1
1.0
0.9
17.5
18.7
40.8
5.9
10.2
43.1
7.0
49.0
55.9
11.3
17.4
16.16.6
6.2
0.5
1.2
1.1
1.1
1.0
0.9
17.7
18.8
41.4
6.1
10.4
43.4
6.8
47.3
54.0
10.9
16.8
15.66.2
5.9
0.5
1.2
1.0
1.1
0.9
0.9
17.1
18.1
39.9
5.9
10.0
41.8
51.6
9.5
6.1
1.3
1.1
0.9
17.516.2
40.9
8.6
51.8
9.5
6.0
1.2
1.0
0.9
17.816.3
8.6
41.1
9.3
51.3
6.0
1.1
1.0
0.9
17.716.2
8.4
40.8
9.5
52.0
6.0
1.1
1.0
1.0
18.016.3
8.5
41.4
9.6
53.2
6.2
1.1
1.0
1.0
18.516.8
8.6
42.5
9.4
51.1
5.9
1.2
1.0
0.9
17.516.0
8.4
40.5
6.6
46.4
52.6
7.1
10.2
48.3
56.3
7.3
11.1
48.9
58.5
7.2
11.5
48.2
55.8
11.3
46.4
53.2
6.8
10.9
49.2
56.2
7.3
11.6
576.1
661.7
83.6
132.6
16.6
15.4
17.7
15.9
18.5
16.1
17.5
15.8
17.5
15.316.3
16.6
189.7
206.8
6.1
5.8
0.5
1.3
6.4
6.3
0.6
1.2
6.3
6.4
0.6
1.3
6.2
6.0
0.6
1.2
6.0
5.8
0.6
1.2
6.3
6.0
0.6
1.3
76.0
72.8
6.9
14.9
1.0
1.0
0.9
1.0
1.1
0.9
0.9
16.8
17.7
1.0
1.1
1.0
0.9
17.4
19.0
1.0
1.1
0.9
0.9
1.0
1.1
0.9
0.9
17.6
19.7
17.4
18.7
16.6
17.6
1.0
1.1
0.9
0.9 1.0
12.3
13.0
11.2
11.1
17.7
18.7
207.6
221.6
39.3
5.7
9.3
40.7
41.2
6.1
10.1
41.0
44.0
6.4
10.6
40.4
45.7
6.2
10.4
39.0
43.3
6.0
10.0
41.4
43.3
6.4
10.6
485.6
41.1 514.2
72.4
121.5
9.1 9.7
50.6
10.1
53.1
9.9
53.4 53.6 50.7
9.5
54.6
10.1
627.0
115.1
5.8
1.2
6.1
1.2
6.2
1.2
6.1
1.1
5.8
1.2
6.0
1.3
72.2
14.3
1.0 1.1
0.9
17.516.0
1.1
0.9
18.316.7
1.1
1.0
1.0
0.9
18.817.2
18.416.8
17.315.9
1.1
0.9 1.0
12.4
11.3
18.416.7
215.7197.2
8.2
40.3
8.8
42.2
9.2
43.2
8.9
42.2 40.0
8.6
42.4
9.1
497.5
103.9

0 3 ENERGY CONSUMPTION S I N G A P O R E E N E R GY S TAT I S T I C S 2 016
6 6 6 7
Private Apartments & Condominiums
Private Apartments & Condominiums
Private Apartments & Condominiums
overall
overall
overall
Private housing
Private housing
Private housing
1-Room/2-Room
1-Room/2-Room
1-Room/2-Room
Landed Properties
Landed Properties
Landed Properties
5-Room & Executive
5-Room & Executive
5-Room & Executive
Public housing
Public housing
Public housing
3-Room
3-Room
3-Room
others
others
others
4-Room
4-Room
4-Room
Jan
Jan
Jan
feb
feb
feb
Jun
Jun
Jun
mar
mar
mar
apr
apr
apr
may
may
may
2013
2014
2015
Table 3.8 TOTAl HOUSEHOld TOWn gAS COnSUMPTIOn by dWEllIng TyPE (COnTInUEd)
Note:a. Figures may not add up to total due to rounding.
Private Apartments & Condominiums
2013Jul aug sep oct decnov annual
overall
Private housing
1-Room/2-Room
Landed Properties
5-Room & Executive
Public housing
3-Room
others
4-Room
Private Apartments & Condominiums
overall
Private housing
1-Room/2-Room
Landed Properties
5-Room & Executive
Public housing
3-Room
others
4-Room
Private Apartments & Condominiums
overall
Private housing
1-Room/2-Room
Landed Properties
5-Room & Executive
Public housing
3-Room
others
4-Room
Source: Energy Market Authority (EMA)
2014Jul aug sep oct decnov annual
2015Jul aug sep oct decnov annual
Unit: gWh
54.0
56.2
57.3
11.1
12.2
13.2
16.9
17.6
5.9
6.1
6.0
1.2
1.2
1.2
1.1
1.2
1.4
0.9
0.9
17.8
18.017.5
17.9
0.9
41.7
42.7
42.9
10.2
11.3
12.3
54.9
58.8
58.6
11.5
12.7
13.5
17.9
17.15.9
6.3
6.1
1.2
1.3
1.20.9
1.1
1.2
1.4
0.9
1.0
18.1
19.118.2
18.5
42.2
10.6
11.7
12.6
44.8
43.9
56.4
56.0
11.5
12.1
12.9
57.3
17.6
17.86.1
6.2
6.0
1.2
1.2
0.1
1.1
1.2
1.3
0.9
0.9
0.9
18.6
18.717.9
18.0
43.7
10.5
11.2
12.0
44.0
42.9
55.3
60.3
11.7
12.6
14.1
57.8
18.3
17.15.9
6.2
6.3
1.2
1.3
1.3
1.1
1.2
1.4
0.9
0.9
1.0
18.3
18.817.7
19.1
42.4
10.8
11.7
13.1
43.9
45.0
56.8
60.7
11.8
12.6
14.1
57.6
18.9
17.76.2
6.2
6.5
1.1
1.1
0.2
1.1
1.2
1.4
0.9
1.0
1.0
18.9
18.717.8
19.6
43.9
10.9
11.6
13.1
43.9
46.5
53.6
55.5
11.0
12.0
12.9
55.2
17.3
16.85.8
6.0
6.0
1.2
1.2
0.1
1.1
1.2
1.3
0.9
0.9
0.9
17.8
17.817.1
17.7
41.5
10.1
11.0
12.0
42.1
42.4
54.6
56.4
10.8
11.6
12.6
57.5
58.8
11.4
12.1
12.5
57.4
55.2
58.9
11.9
12.6
13.2
56.2
58.3
58.4
12.1
12.9
13.5
55.1
57.3 57.0 55.4
57.9
11.8
12.4
13.4
57.3
58.5
57.9
12.3
12.6
13.6
669.2
684.6
696.7
138.9
148.4
159.5
17.9
17.3
18.9
18.2
18.6
17.9
18.3
17.4
18.1
17.117.8
18.3
209.0
217.8
6.0
6.0
6.2
1.2
1.2
0.1
6.3
6.4
6.4
1.3
1.2
0.1
6.2
6.2
6.4
1.3
1.2
0.1
6.0
6.1
6.2
1.1
1.2
0.1
6.0
5.9
6.2
1.2
1.1
0.1
6.1
6.1
6.1
1.3
1.2
0.1
72.4
73.5
74.5
14.6
14.3
4.9
1.1
1.2
1.3
0.9
1.2
1.3
1.5
0.9
0.9
0.9
18.2
17.917.3
18.2
1.2
1.3
1.4
0.9
0.9
0.9
19.2
19.018.3
19.4
1.1
1.3
1.4
0.9
1.0
1.0
1.2
1.3
1.4
0.9
0.9
1.0
19.0
19.118.2
19.2
18.4
18.317.6
18.8
17.8
17.617.1
18.4
1.2
1.3
1.4
0.9
0.9 0.9
1.0 1.0
13.6
14.7
16.5
11.0
11.3
11.4
18.7
18.317.6
18.6
220.7
221.2212.4
223.4
42.6
9.9
10.7
11.6
44.8
42.5
43.7
10.5
11.2
11.6
44.3
44.9
46.1
11.0
11.7
12.2
42.9
44.7
45.6
11.2
12.0
12.5
42.0
43.2 41.9
44.2
10.9
11.5
12.5
43.8
43.2
44.8
11.3
11.6
12.6
515.7
521.9
44.4 532.3
127.9
137.1
148.1

0 3 ENERGY CONSUMPTION S I N G A P O R E E N E R GY S TAT I S T I C S 2 016
6 8 6 9
Private Apartments & Condominiums
Private Apartments & Condominiums
Private Apartments & Condominiums
overall
overall
overall
Private housing
Private housing
Private housing
1-Room/2-Room
1-Room/2-Room
1-Room/2-Room
Landed Properties
Landed Properties
Landed Properties
5-Room & Executive
5-Room & Executive
5-Room & Executive
Public housing
Public housing
Public housing
3-Room
3-Room
3-Room
4-Room
4-Room
4-Room
Jan
Jan
Jan
feb
feb
feb
Jun
Jun
Jun
mar
mar
mar
apr
apr
apr
may
may
may
Table 3.9 AVErAgE MOnTHly HOUSEHOld TOWn gAS COnSUMPTIOn by dWEllIng TyPE
2005
2010
2012
Private Apartments & Condominiums
Jul aug sep oct decnov annual
overall
Private housing
1-Room/2-Room
Landed Properties
5-Room & Executive
Public housing
3-Room4-Room
Private Apartments & Condominiums
overall
Private housing
1-Room/2-Room
Landed Properties
5-Room & Executive
Public housing
3-Room4-Room
Private Apartments & Condominiums
overall
Private housing
1-Room/2-Room
Landed Properties
5-Room & Executive
Public housing
3-Room4-Room
Source: Energy Market Authority (EMA)
Jul aug sep oct decnov annual
Jul aug sep oct decnov annual
Unit: kWh
2005
2010
2012
Note:a. Figures may not add up to total due to rounding.
90.1
84.2
87.5
88.5
93.6
83.5
82.2
71.8
66.9
59.7
144.1
90.5
84.6
131.8
89.4
81.1
82.3
85.9
88.9
86.8
87.9
91.9
86.1
92.081.0
72.7
136.6
64.5
58.2
144.5
89.3
88.0
88.0
82.8
89.2
83.7
87.0
84.7
84.1
87.0
84.5
90.878.7
71.1
61.9
56.6
142.3
129.6
88.4
86.7
86.6
79.0
84.4
82.2
88.9
86.5
85.3
91.3
85.7
92.581.1
71.7
62.3
56.4
144.1
136.1
90.6
88.4
88.7
80.0
88.6
83.4
90.2
87.0
87.2
92.0
86.1
93.982.3
72.5
64.5
58.1
144.9
135.2
91.6
88.8
89.9
82.0
89.4
84.0
86.8
83.9
84.0
88.7
83.1
90.477.9
69.2
62.1
56.3
140.8
131.6
88.3
85.6
86.4
79.0
86.1
80.8
85.0
86.0
74.260.8
132.7
84.686.2
82.7
82.9
85.3
86.5
73.959.5
136.2
86.086.2
83.2
83.2
83.1
83.7
72.556.5
132.0
85.384.9
82.0
79.8
85.4
85.2
73.157.3
140.6
86.986.3
81.7
83.3
85.6
87.0
75.258.2
139.6
89.088.6
85.5
82.0
84.1
83.7
72.657.9
136.1
84.684.6
81.7
80.7
84.8
81.4
80.2
81.7
88.1
86.9
85.1
88.5
88.9
90.1
87.4
91.7
87.5
85.7
85.3
90.0
83.7
81.3
79.7
85.5
89.1
86.1
85.9
91.4
87.8
85.4
84.9
89.0
81.6
89.0
86.7
91.7
90.1
92.4
85.0
90.9
84.9
87.693.4
80.5
91.5
84.8
77.1
68.5
79.9
73.7
79.8
74.6
78.8
70.4
76.1
67.9
79.6
70.7
79.5
71.2
60.2
53.7
137.3
62.1
57.4
143.9
126.3
86.3
83.7
61.8
59.4
144.4
132.8
89.3
89.4
60.6
56.7
142.1
133.9
61.3
55.2
131.8
127.7
90.3
93.0
88.9
88.0
84.6
82.6
62.1
57.5
140.7
131.8 137.5
62.5
57.1
141.8
132.5
90.6
88.1
89.1
87.2
84.8
75.3
79.0
87.6
79.3
80.0
85.9
88.3
84.6
82.5
89.2
86.9
87.6
80.4
87.5
83.5
82.9
75.4
83.0
88.8
82.8
81.2
88.7
87.4
78.4 82.6
80.0
86.4
80.2 85.6
82.3
89.0
86.4
86.5
86.7 87.1 81.7
82.2
88.9
88.2
85.3
85.2
70.9 74.3 75.1 73.7 69.773.0 73.255.6 59.4
129.8
88.083.984.0
59.3
133.3
90.887.6
61.4
139.5
56.2
125.9
88.790.1
88.887.9
86.682.8
59.6
134.5 139.2
58.5
134.9
83.187.7 86.4
80.8
76.9
84.6
82.5
86.8
85.7
84.9
83.3
79.8
79.3
84.7
84.9
83.3
81.9

0 3 ENERGY CONSUMPTION S I N G A P O R E E N E R GY S TAT I S T I C S 2 016
7 0 7 1
Table 3.9 AVErAgE MOnTHly HOUSEHOld TOWn gAS COnSUMPTIOn by dWEllIng TyPE (COnTInUEd)
Private Apartments & Condominiums
Private Apartments & Condominiums
Private Apartments & Condominiums
overall
overall
overall
Private housing
Private housing
Private housing
1-Room/2-Room
1-Room/2-Room
1-Room/2-Room
Landed Properties
Landed Properties
Landed Properties
5-Room & Executive
5-Room & Executive
5-Room & Executive
Public housing
Public housing
Public housing
3-Room
3-Room
3-Room
4-Room
4-Room
4-Room
Jan
Jan
Jan
feb
feb
feb
Jun
Jun
Jun
mar
mar
mar
apr
apr
apr
may
may
may
2013
2014
2015
Unit: kWh
Private Apartments & Condominiums
Jul aug sep oct decnov annual
overall
Private housing
1-Room/2-Room
Landed Properties
5-Room & Executive
Public housing
3-Room4-Room
Private Apartments & Condominiums
overall
Private housing
1-Room/2-Room
Landed Properties
5-Room & Executive
Public housing
3-Room4-Room
Private Apartments & Condominiums
overall
Private housing
1-Room/2-Room
Landed Properties
5-Room & Executive
Public housing
3-Room4-Room
Source: Energy Market Authority (EMA)
Jul aug sep oct decnov annual
Jul aug sep oct decnov annual
2013
2014
2015
Note:a. Figures may not add up to total due to rounding.
82.2
83.5
81.0
86.9
90.7
89.4
81.4
79.2
68.4
68.5
65.6
57.4
57.0
55.4
127.6
132.1
83.2
84.282.2
82.0
131.8
79.1
79.7
77.0
84.5
88.5
87.3
83.9
87.2
82.9
90.4
94.0
91.8
80.7
82.568.9
71.2
66.2
133.7
56.4
58.8
55.6
128.4
138.3
85.0
89.185.6
84.9
80.3
88.2
91.6
89.7
83.6
78.9
85.2
77.8
87.9
86.1
84.4
83.4
77.5
85.370.4
68.5
64.5
55.8
52.2
131.4
53.3
129.6
130.8
87.5
82.9
81.7
86.8
82.6
85.4
83.7
82.1
80.8
75.8
84.0
84.6
91.0
92.4
94.3
85.1
81.5
82.268.6
69.5
67.3
54.8
53.8
54.4
132.2
136.0
134.8
85.7
87.583.0
87.1
80.4
88.6
90.0
92.3
81.4
80.1
85.9
85.0
90.8
91.1
93.1
84.5
84.2
85.271.1
69.0
69.7
55.5
53.9
55.6
131.9
137.6
139.5
88.4
83.1
89.5
87.0
83.0
88.5
88.6
90.8
81.2
82.6
81.7
77.5
84.7
86.1
85.3
80.8
76.9
81.567.6
67.0
64.6
54.4
52.2
127.1
53.4
133.9
130.0
83.9
79.5
80.7
82.7
79.1
82.2
83.5
83.1
77.6
75.2
82.0
78.0
82.0
81.7
81.3
86.5
81.1
86.7
85.2
81.3
86.2
80.2
81.2
90.2
88.3
85.2
84.0
84.2
79.9
91.3
89.5
86.0
81.9
82.1 81.4 78.7
78.7
88.2
84.5
84.5
85.5
84.3
80.4
92.1
86.7
86.6
84.1
82.9
80.7
88.5
88.0
86.9
78.8
82.4
82.6
86.8
81.4
85.4
79.6
82.3
80.2
80.484.0
78.9
83.3
80.1
68.3
67.2
65.6
71.7
70.2
68.0
70.5
68.3
67.3
68.7
66.5
65.7
67.7
64.8
65.5
69.3
66.5
65.8
69.3
68.1
66.3
54.4
52.9
127.4
58.2
53.0
56.6
129.9
129.1
128.4
85.4
80.2
82.5
57.7
55.8
54.7
132.9
131.4
127.0
89.7
83.284.1
87.5
55.0
54.9
53.0
133.6
134.8
133.5
55.6
54.5
54.6
130.6
127.6
131.9
88.8
87.983.4
86.7
85.9
88.2 84.480.2
84.6
83.4
80.877.4
82.8
56.3
52.8
54.9
136.2
133.7 132.3
133.4 136.6
56.0
52.5 54.4
54.3
130.8
133.0
132.6
87.4
84.279.9
85.1
86.2
85.581.8
84.6
80.2
79.2
79.0
84.4
78.1
76.9
79.4
82.8
79.0
83.2
82.2
80.9
84.2
85.9
82.9
80.5
81.6
79.9
87.8
87.2
83.7
78.6
78.3 75.6
78.6
89.7
82.3
82.2
81.9
78.4
78.0
88.9
84.4
84.2
81.1
79.9
77.1 78.4
85.9 86.1
85.6
84.6
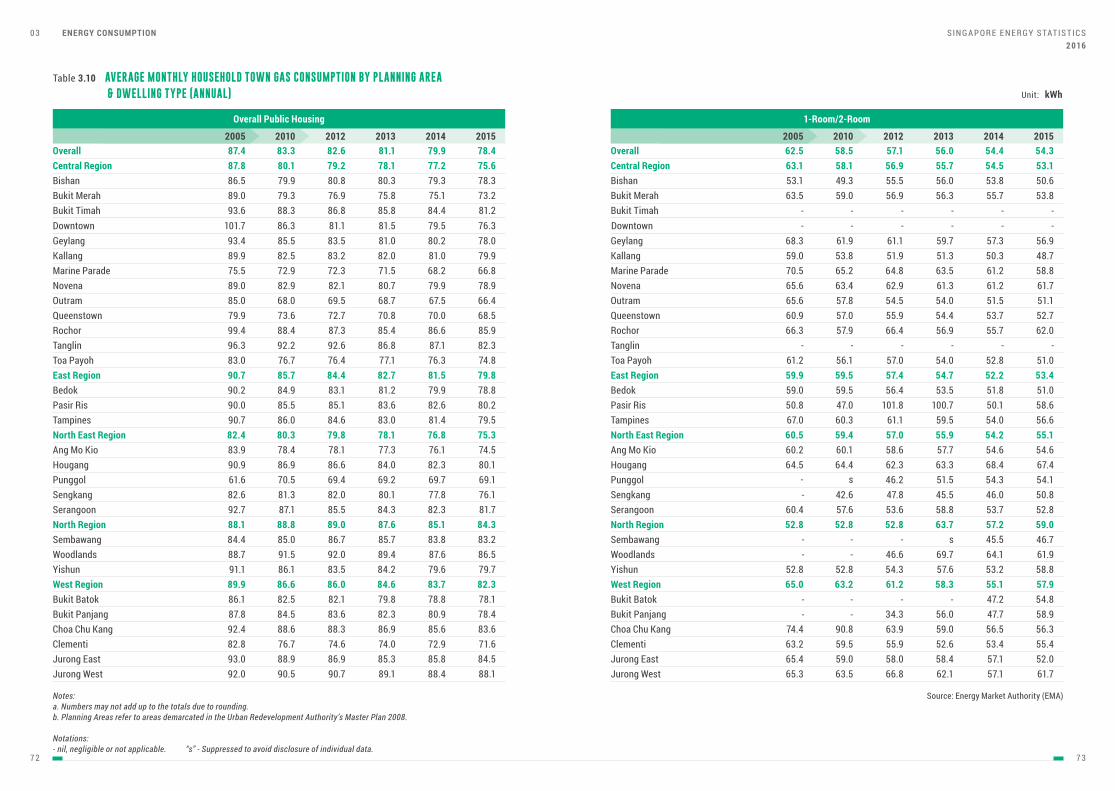
0 3 ENERGY CONSUMPTION S I N G A P O R E E N E R GY S TAT I S T I C S 2 016
7 2 7 3
Table 3.10 AVErAgE MOnTHly HOUSEHOld TOWn gAS COnSUMPTIOn by PlAnnIng ArEA & dWEllIng TyPE (AnnUAl)
Kallang
Tampines
West region
Clementi
Outram
Hougang
Queenstown
Punggol
Geylang
Pasir Ris
Yishun
Choa Chu Kang
central region
Tanglin
Serangoon
Marine Parade
north east region
Bukit Batok
Jurong East
Bukit Timah Downtown Downtown
Bedok
Woodlands
overall
Rochor
Sengkang
Bishan
Toa Payoh
north region
Novena
Ang Mo Kio
Bukit Panjang
Jurong West
Bukit Merah
east region
Sembawang
Notes:a. Numbers may not add up to the totals due to rounding. b. Planning Areas refer to areas demarcated in the Urban Redevelopment Authority’s Master Plan 2008. Notations: - nil, negligible or not applicable. “s” - Suppressed to avoid disclosure of individual data.
1-room/2-room
Unit: kWh
Kallang
Tampines
West region
Clementi
Outram
Hougang
Queenstown
Punggol
Geylang
Pasir Ris
Yishun
Choa Chu Kang
central region
Tanglin
Serangoon
Marine Parade
north east region
Bukit Batok
Jurong East
Bukit Timah
Bedok
Woodlands
overall
Rochor
Sengkang
Bishan
Toa Payoh
north region
Novena
Ang Mo Kio
Bukit Panjang
Jurong West
Bukit Merah
east region
Sembawang
Source: Energy Market Authority (EMA)
overall Public housing
2010 2012 2013 201520142005 2010 2012 2013 201520142005
79.9
90.9
99.4
61.6
93.4
90.0
91.1
92.4
88.473.6
70.5
85.5
85.5
86.1
88.6
89.0
90.7
84.488.1
79.3
85.7
85.0
76.7
88.8
82.9
78.4
84.5
90.5
79.986.5
85.0
83.9
87.8
92.0
87.8
83.0
92.7
89.075.5
82.4
86.1
93.0
93.6101.7 -
-
-
90.2
88.7
80.1
87.1
72.9
80.3
82.5
88.9
88.386.3 -
-
-
84.9
91.5
87.4
96.3
82.6
89.9
90.7
89.9
82.8
83.3
92.2
81.3
86.0
86.6
76.7
82.5
68.0
86.9
87.372.7
69.4
83.5
85.1
83.5
88.3
80.2 78.0
85.4 86.6 85.970.8 70.0 68.5
69.2
81.0
83.6 82.6 80.2
84.2 79.6 79.7
86.9 85.6 83.6
76.9
84.4
86.7
76.4
89.0
75.8
82.7 81.5 79.8
85.7 83.8 83.2
77.1 76.3 74.8
87.6 85.1 84.3
75.1 73.280.8
78.1
83.6
90.7
80.3
82.1
77.3 76.1 74.5
82.3 80.9 78.4
89.1 88.4 88.1
79.3 78.3
80.7 79.9 78.9
79.2
85.5
72.3
79.8
82.1
86.9
78.1
84.3 82.3 81.7
71.5
78.1 76.8 75.3
79.8 78.8 78.1
85.3 85.8 84.5
86.881.1 -
-
-
83.1
92.0
77.2 75.6
68.2 66.8
85.881.5 -
-
-
81.2 79.9 78.8
89.4 87.6 86.5
84.479.5 -
-
-81.276.3 -
-
-
82.6
92.6
82.0
84.6
86.0
74.6
81.1
86.8 87.1 82.3
80.1 77.8 76.1
83.2
83.0 81.4 79.5
84.6 83.7 82.3
74.0 72.9 71.6
79.9 78.4
82.0 81.0 79.9
69.5
86.6
68.7 67.5 66.4
84.0 82.3 80.1
60.9
64.5-
66.3
68.3
50.8
52.8
74.4
57.957.0
61.9
47.0
52.8
90.8
63.5
59.9
52.8
59.0
59.556.1
52.8
63.4
60.1
63.5
49.353.1
65.6
60.2
65.3
63.1
61.2
60.4
65.6 70.5
60.5
65.4
59.0
58.1
57.6
65.2
59.4
59.0
59.5
62.5
59.0
67.0
65.0
63.2
58.5
42.6-
60.3
63.2
59.5
53.8
57.8
64.4s
66.455.9
46.2
61.1
101.8
54.3
63.9
57.3 56.9
56.9 55.7 62.054.4 53.7 52.7
51.5 54.3 54.1
59.7
100.7 50.1 58.6
57.6 53.2 58.8
59.0 56.5 56.3
56.9
57.457.0
52.8
56.3
54.7 52.2 53.4
45.5 46.7
54.0 52.8 51.0
63.7 57.2 59.0
55.7 53.855.5
58.6
34.3
66.8
56.0
62.9
57.7 54.6 54.6
56.0 47.7 58.9
62.1 57.1 61.7
53.8 50.6
61.3 61.2 61.7
56.9
53.6
64.8
57.0
58.0
55.7
58.8 53.7 52.8
63.5
55.9 54.2 55.1
47.2 54.8
58.4 57.1 52.0
56.4
46.6
54.5 53.1
61.2 58.8
53.5 51.8 51.0
69.7 64.1 61.9
57.1
47.8
61.1
61.2
55.9
56.0
45.5 46.0 50.8
51.9
59.5 54.0 56.6
58.3 55.1 57.9
52.6 53.4 55.4
54.4 54.3
51.3 50.3 48.7
54.5
62.3
54.0 51.5 51.1
63.3 68.4 67.469.7 69.1
-
--
-
--
-
-
s
-
--

0 3 ENERGY CONSUMPTION S I N G A P O R E E N E R GY S TAT I S T I C S 2 016
74 75
Table 3.10 AVErAgE MOnTHly HOUSEHOld TOWn gAS COnSUMPTIOn by PlAnnIng ArEA & dWEllIng TyPE (AnnUAl) (COnTInUEd)
Kallang
Tampines
West region
Clementi
Outram
Hougang
3-room
Queenstown
Punggol
Geylang
Pasir Ris
Yishun
Choa Chu Kang
central region
Tanglin
Serangoon
Marine Parade
north east region
Bukit Batok
Jurong East
Bukit Timah
Bedok
Woodlands
overall
Rochor
Sengkang
Bishan
Toa Payoh
north region
Novena
Ang Mo Kio
Bukit Panjang
Jurong West
Bukit Merah
east region
Sembawang
4-room
Unit: kWh
Kallang
Tampines
West region
Clementi
Outram
Hougang
Queenstown
Punggol
Geylang
Pasir Ris
Yishun
Choa Chu Kang
central region
Tanglin
Serangoon
Marine Parade
north east region
Bukit Batok
Jurong East
Bukit Timah
Bedok
Woodlands
overall
Rochor
Sengkang
Bishan
Toa Payoh
north region
Novena
Ang Mo Kio
Bukit Panjang
Jurong West
Bukit Merah
east region
Sembawang
Source: Energy Market Authority (EMA)
2010 2012 2013 201520142005 2010 2012 2013 201520142005
Notes:a. Numbers may not add up to the totals due to rounding. b. Planning Areas refer to areas demarcated in the Urban Redevelopment Authority’s Master Plan 2008. Notations: - nil, negligible or not applicable. “s” - Suppressed to avoid disclosure of individual data.
Downtown Downtown
75.0
83.8
91.3
88.9
62.2
80.8
81.167.5
81.4
62.7
79.8
88.1
78.5
63.6
77.4
73.669.9
63.7
79.9
70.5
69.1
84.3
64.069.2
90.5
74.8
69.7
89.9
82.6
75.9
80.2
84.959.7
75.4
79.4
73.194.8 82.9 77.1 76.8 75.6 74.4
78.9
76.6
74.5
73.7
59.4
70.6
77.1
59.9
74.0
72.7
79.5
86.5
91.5
69.7
-
75.2
70.9
73.2
91.1
54.0-
66.5
s
72.0
67.6
81.7
77.9
78.6
78.165.7
49.9
77.8
63.0
78.4
73.7 71.7
77.4 79.2 79.763.1 62.1 60.5
51.1 56.6 56.4
74.8
62.9 61.1 63.5
76.3 72.9 67.8
73.7
72.269.7
63.4
71.9
71.2 69.6 67.5
26.0 56.3 56.1
67.6 66.6 65.2
61.6 59.8 62.2
70.7 67.561.5
69.4
67.6
82.3
59.1
78.4
68.1 66.7 65.3
66.0 64.8 62.9
78.3 76.1 74.9
59.3 56.5
77.0 75.9 75.5
72.2
71.6
58.1
68.9
74.3
70.1
67.7 65.4 63.7
57.1
66.7 65.7 63.9
72.3 72.7 71.4
60.2
72.5
66.7
69.1 67.2
55.2 54.4
61.8
71.4 70.1 68.2
57.6 57.3 60.6
58.4 56.3
71.2
86.0
58.7
65.9
70.7
66.2
69.3
78.6 79.3 79.7
56.0 59.5 58.7
79.8
66.9 62.7 62.1
69.1 68.1 66.7
65.2 64.4 63.1
68.1 66.3
77.4 76.6 74.8
73.8
78.3
71.0 69.6 67.9
73.8 73.1 69.0
90.2
90.4
108.2
68.7
101.8
87.1
90.3
92.3
72.497.680.9
71.5
91.9
82.2
87.0
88.9
96.0
92.8
86.088.2
82.2
87.2
86.489.1
82.3
90.4
87.4
95.2
78.483.9
95.7
99.1
90.1
95.7
92.9
91.3
93.0
89.981.0
89.4
83.7
96.8
90.7109.7 90.6 86.5 87.4 83.9 78.3
99.2
88.3
83.3
86.7
76.2
83.3
80.3
92.2
87.8
91.4
91.0
91.5
69.5
87.3
95.1
90.7
92.8
93.9
86.4
83.5
81.1
86.5
89.7
84.4
88.9
63.6
87.2
85.397.479.6
65.6
90.5
82.4
82.1
88.6
87.0 84.4
79.5 78.1 65.894.477.9
94.9 90.977.0 75.2
65.8 66.2 66.1
88.0
81.1 80.2 77.6
84.1 79.3 79.7
87.4 86.1 84.5
80.3
86.1
87.988.5
79.6
84.3 83.1 80.9
86.5 83.2 82.687.4 84.3 83.5
79.1 77.878.8
89.2
85.1
95.1
78.7
82.4
88.2 87.2 85.7
83.7 81.9 78.7
93.3 92.2 91.1
77.2 75.7
80.1 79.3 77.4
82.1
85.4
76.2
80.5
79.8
90.2
81.2
84.2 82.2 81.1
76.0
78.5 76.9 75.3
77.6 76.9 76.5
89.6 89.9 88.0
84.9
90.0
91.1
80.3 78.7
71.5 69.6
85.2
87.6 86.3 84.8
89.0 87.1 85.9
84.4 82.4
84.8 83.3
81.3
80.0
84.7
88.5
80.6
81.8 80.1
81.2 80.1 78.9
78.0 75.7 73.8
87.5
83.0 81.7 79.4
87.1 85.9 84.1
79.6 78.3 76.5
87.0 86.0 85.4
70.0
86.8
70.0 69.9 69.5
84.2 82.3 80.3
-
-
-
-
-
-
- s 53.9
- - - - - -

0 3 ENERGY CONSUMPTION S I N G A P O R E E N E R GY S TAT I S T I C S 2 016
76 7 7
Table 3.10 AVErAgE MOnTHly HOUSEHOld TOWn gAS COnSUMPTIOn by PlAnnIng ArEA & dWEllIng TyPE (AnnUAl) (COnTInUEd)
Kallang
Tampines
West region
Clementi
Outram
Hougang
5-room/executive
Queenstown
Punggol
Geylang
Pasir Ris
Yishun
Choa Chu Kang
central region
Tanglin
Serangoon
Marine Parade
north east region
Bukit Batok
Jurong East
Bukit Timah
Bedok
Woodlands
overall
Rochor
Sengkang
Bishan
Toa Payoh
north region
Novena
Ang Mo Kio
Bukit Panjang
Jurong West
Bukit Merah
east region
Sembawang
Unit: kWh2014
overall
Commerce & Services-related
Industrial-related
Others
Transport-related
Table 3.11 TOTAl OIl COnSUMPTIOn by SECTOr Unit: ktoe
2010 2011 2012 2013
Households
Sources: Energy Market Authority (EMA) & National Environment Agency (NEA)
Note:a. Numbers may not add up to the totals due to rounding. Notation: - nil, negligible or not applicable.
7,790.2 7,614.0 7,946.8 8,475.0 8,970.4
2,219.1 2,366.9 2,292.7 2,133.3 2,199.8
84.2 68.9
-
68.3
-
86.4 78.9
- - -
5,465.2 5,153.4
21.7
5,562.0
24.8
6,225.3 6,667.6
23.7 30.0 24.1
Source: Energy Market Authority (EMA)
2010 2012 2013 201520142005
Notes:a. Numbers may not add up to the totals due to rounding. b. Planning Areas refer to areas demarcated in the Urban Redevelopment Authority’s Master Plan 2008. Notations: - nil, negligible or not applicable. “s” - Suppressed to avoid disclosure of individual data.
Downtown
91.2
92.5
133.5
59.2
101.5
91.7
99.4
92.8
98.987.1
70.0
94.5
87.4
91.7
88.6
95.2
92.8
83.389.1
88.1
88.3
84.1
85.9
89.6
93.3
85.1
83.8
88.1
84.291.8
149.0
91.6
87.8
89.3
95.3
94.0
94.3
100.691.4
79.7
88.3
95.7
100.8- - - - - -
95.9
89.1
88.3
89.2
89.9
81.1
84.6
91.6
96.2
92.1
91.9
89.1
115.9
79.7
97.6
91.8
90.8
96.9
86.6
105.8
82.1
86.6
87.5
88.3
91.0
69.9
87.7
100.387.3
73.3
93.2
86.7
92.0
88.6
92.0 89.3
100.9 103.2 107.386.1 85.2 83.7
74.3 75.5 75.3
91.4
85.0 84.3 82.5
91.8 88.6 88.1
87.3 86.5 84.6
86.7
87.1
85.8
86.7
90.8
85.3
85.4 84.4 83.5
85.3 85.1 85.2
92.2 91.9 90.2
89.2 88.2 87.8
84.9 83.486.1
87.9
84.4
88.9
85.4
92.4
88.2 88.0 85.6
83.5 83.0 81.7
87.9 88.1 88.8
84.9 84.6
92.0 91.7 90.3
89.1
87.7
89.7
83.2
84.1
90.0
89.0
86.6 84.7 84.7
88.9
82.6 81.6 80.6
81.8 81.4 80.7
87.8 89.2 88.9
95.2
90.0
93.0
88.4 87.1
84.8 83.3
92.7
87.9 86.9 87.1
90.6 89.6 88.9
91.3 87.6
87.2
98.5
84.9
85.5
87.7
86.7
86.2
93.0 94.3 93.7
83.9 82.2 81.1
98.1
84.0 82.8 82.0
86.5 86.2 85.6
86.8 85.0 83.7
85.5 84.6
97.7 96.4 96.0
82.8
87.7
84.5 83.0 80.1
85.8 84.2 82.5

0 3 ENERGY CONSUMPTION S I N G A P O R E E N E R GY S TAT I S T I C S 2 016
7 8 7 9
Table 3.12 TOTAl FInAl EnErgy COnSUMPTIOn (COnTInUEd) Unit: ktoe
-
-
-
-
-
- -
-
-
-
-
-
-
total final energy consumption
Households
Industrial-related
Transport-related
Commerce & Services-related
Others
Petroleum Products
crude oil
natural gas totalotherselectricity2012
-
-
-
-
coal & Peat
68.3
2,292.7
83.5
22.2
0.8
1,407.2
200.2
26.1
1,559.0
2,515.1
26.9
23.1 5,562.0 1,092.2 1,596.9 8,247.2
23.1 7,946.8
23.7
1,255.5
56.9
3,800.6
570.0
13,026.0
650.6
Sources: Energy Market Authority (EMA), Civil Aviation Authority of Singapore (CAAS), International Enterprise (IE) Singapore, Maritime & Port Authority (MPA), National Environment Agency (NEA) & Department of Statistics (DOS)
Sources: Energy Market Authority (EMA), Civil Aviation Authority of Singapore (CAAS), International Enterprise (IE) Singapore, Maritime & Port Authority (MPA), National Environment Agency (NEA) & Department of Statistics (DOS)
Petroleum Products
crude oil
natural gas totalotherselectricity2014 coal
& Peat
total final energy consumption
Households
Industrial-related
Transport-related
Commerce & Services-related
Others
Notes:a. Figures may not add up to total due to rounding. Notation: - nil, negligible or not applicable.
Notes:a. Figures may not add up to total due to rounding. Notation: - nil, negligible or not applicable.
-
-
-
-
-
-
-
-
-
-
-
-
-
-
-
-
-
-
-
-
-
-
-
-
-
-
-
-
-
-
-
-
-
-
total final energy consumption
Households
Industrial-related
Transport-related
Commerce & Services-related
Others
Petroleum Products
crude oil
natural gas totalotherselectricity2013 coal
& Peat
1,437.5
1,465.7
203.7
209.9
22.6
20.4
1,614.8
1,631.2
2,357.1
2,429.0
23.4
21.2
131.9
166.9
1,620.2
1,698.5
9,249.6
9,789.0
131.9
166.9
3,864.9
3,989.9
580.8
595.4
13,913.3
14,548.7
668.3
678.4
86.4
78.9
2,133.3
2,199.8
6,225.3
6,667.6
8,475.0
8,970.4
30.0
24.1
90.9
86.6
20.1
19.3
0.8
0.8
1,272.2
1,256.0
1,441.5
1,421.5
57.5
58.9
68.9
2,366.9
83.4
28.7
0.8
1,365.1
191.2
29.8
1,517.4
2,586.8
30.6
6.8 5,153.4 1,132.1 1,554.4 7,846.7-
-
-
-
-
-6.8 7,614.0
24.8
1,300.2
55.2
3,698.0
557.4
12,619.0
637.4
Petroleum Products
crude oil
natural gas totalotherselectricity2011 coal
& Peat
total final energy consumption
Households
Industrial-related
Transport-related
Commerce & Services-related
Others
-
--
--
--
-- -
-
Table 3.12 TOTAl FInAl EnErgy COnSUMPTIOn Unit: ktoe
84.2
2,219.1
79.4
23.1
0.8
1,330.2
180.5
33.1
1,493.8
2,422.7
33.9
7.9
-
-
-
-
5,465.2 1,081.8 1,518.7 8,073.6-
-
-
-
- -
-
-
-
-
-
7.9 - -7,790.2
21.7
1,239.0
53.9
3,633.0
570.6
12,670.1
646.2
total final energy consumption
Households
Industrial-related
Transport-related
Commerce & Services-related
Others
Petroleum Products
crude oil
natural gas totalotherselectricity2010 coal
& Peat

8 0 81

8 2 8 3
S I N G A P O R E E N E R GY S TAT I S T I C S 2 016
0 4 ENERGY BALANCES
Singapore generated 50 TWh of electricity in 2015, 1.9% higher than the 49 TWh recorded in 2014. Of the 50 TWh of electricity generated in 2015, 94% (or 47 TWh) was accounted for by MPPs. The remaining 6.4% (or 3.2 TWh) was by Autoproducers. Own use and losses in the Transformation sector amounted to 2.4 TWh.
Of the 48 TWh of electricity consumed in Singapore in 2015, the Industrial-related sector accounted for 42% (or 20 TWh). Another 37% (or 17 TWh) was consumed by the Commerce & Services-related sector. Households and the Transport-related sector contributed to 15% (or 7.2 TWh) and 5.1% (or 2.4 TWh) of total electricity consumption, respectively.
ElEctricity balancEs
NG imports into Singapore rose by 0.4% from 431,961 TJ in 2014 to 433,824 TJ in 2015. This increase was primarily driven by higher demand for NG used in power generation. About 1,101 TJ of NG contributed to stock draw as of end-2015.
About 379,527 TJ of NG supply was used for power generation in 2015, representing 87% of total NG supply. This was a 1.1% increase from the 375,435 TJ used for the same purpose in 2014. Another 57,748 TJ of NG, which included town gas as the main feedstock, was consumed directly by end-consumers. The Industrial-related sector accounted for 88% (or 50,739 TJ) of total NG consumption. The remainder was consumed primarily by the Commerce & Services-related sector (6.5% or 3,754 TJ), and by Households (4.3% or 2,508 TJ).
natural gas balancEs
Autoproducers
Petroleum Products
Natural Gas (NG)
Coal
Others
Main PowerProducers
50,272Total Electricity
Generated
2,428Other Transformations
20,088Industrial-related
17,481Commerce &
Services-related
2,445Transport-related
279 Others
7,890
2,976
230
93,930
173
11,494
2,2093,240
47,031
ELECtRiCitY FLow, 2015Unit: Gwh NAtuRAL GAS FLow, 2015Unit: tJ
50,739Industrial-related
3,754Commerce &
Services-related
665Transport-related
83Others
Pipeline NG Imports
Liquefied NGImports
Stock Change(Stock Draw)
Energy Supply Energy transformation
ElectricityGeneration
OtherTransformations
Natural Gas (NG)Supply
325,905
107,919
1,101 540
379,527
57,748 Final Consumption
7,221Households
2,508Households

0 4 ENERGY BALANCES
8 4 8 5
S I N G A P O R E E N E R GY S TAT I S T I C S 2 016
Table 4.1 ElEctricity balancE tablE Unit: Gwh Table 4.2 natural gas balancE tablE Unit: tJ
2010 2010 20112012 20122013 20132014 20142015 2015
36,881.1
14,509.0
42,787.9
17,662.5
44,682.5
18,572.4
45,580.1
18,842.7
46,762.2 47,843.8
19,753.2 20,088.0
6,092.5
1,263.0
6,636.0
1,774.7
6,629.5
2,804.0
6,754.9
2,973.8 3,240.4
6,924.4 7,220.9
38,212.7
1,200.0
44,097.5
2,098.7
35,489.3
-1,391.8
45,196.5
2,328.6
42,251.8
-536.1
45,160.5
2,369.1
44,200.6
-481.9
46,336.2 47,031.1
2,441.0 2,444.8
44,948.7
-631.4
46,402.9 47,513.8
-359.3 -330.0
38,212.7
13,075.6
45,360.5
15,469.7
-1,331.6
612.2
46,971.2
16,366.1
-2,572.6
384.9
47,963.3
16,718.6
-2,288.8
304.0
49,310.0 50,271.5
17,046.6 17,481.0
-2,383.2
263.4
-2,547.8 -2,427.7
237.7 279.1
Indigenous Production -
-
-
-
-
-
-
-
-
-
-
-
-
-
-
-
-
-
-
-
-
-
-
-
-
- -
- -
- -
- -
- -
- -
total transformation Sector
Industrial-related
Exports
Main Power Producers
Transport-related
Imports
Electricity Generation
Commerce & Services-related
total Primary Energy Supply
total Final Energy Consumption
Statistical Differences (SD)
International Bunkers
Autoproducers
Households
Stock Changes
Other Transformations
Others
Source: Energy Market Authority (EMA)
Notes: a. Figures may not add up to total due to rounding.b. Other transformations includes losses and own use. Notation: - nil, negligible or not applicable.
Note: a. Figures may not add up to total due to rounding. Notation: - nil, negligible or not applicable.
Source: Energy Market Authority (EMA)
Indigenous Production
total transformation Sector
Exports
Main Power Producers
Imports
Electricity Generation
total Primary Energy Supply
International Bunkers
Autoproducers
Stock Changes
Industrial-related
Transport-related
Commerce & Services-related
total Final Energy Consumption
Statistical Differences (SD)
Households
Other Transformations
Oil Refining
Others
-278,063.5 -286,327.8
45,293.3 47,400.5
-314,810.1
45,728.0
-354,522.7
53,263.1
-375,973.0 -380,066.8
52,585.0 50,738.6
-10,825.2 -11,039.2
2,257.2 2,309.1
-16,523.9
2,382.1
-35,270.9
2,409.1
-37,748.2 -41,377.8
2,464.6 2,508.0
-266,689.9 -274,719.2
968.0 1,202.0
-297,700.1
927.7
335,618.5 338,981.9
51,876.2 54,438.1
-5,678.8 1,783.9
-318,657.3
841.7
367,584.3
52,566.1
-208.1
-337,686.4 -338,148.9
806.1 665.2
413,404.6
60,353.3
4,411.7
427,857.5 434,925.0
59,514.6 57,748.1
7,630.1 2,889.9
335,618.5 338,981.9
-277,515.1 -285,758.4
3,323.6 3,493.2
367,584.3
-314,224.0
3,496.3
-548.5 -569.4
34.1 33.1
413,404.6
-353,928.2
3,807.5
-586.2
32.0
431,960.5 433,823.7
-375,434.5 -379,526.7
3,623.9 3,753.8
-594.5
31.9
-4,103.1 1,101.3
-538.5 -540.1
35.0 82.5
-
-
-
-
-
- -
- -
- -
- -
- -
-
-
-
-
-
- -
- -
- -
- -
2005


0 5 ENERGY PRICES S I N G A P O R E E N E R GY S TAT I S T I C S 2 016
8 8 8 9
Electricity tariffs in Singapore are regulated by the EMA. These are updated quarterly to reflect changes in the cost of power generation. Energy cost constitutes the largest component of electricity tariffs. This is based on the average price of NG in the last quarter.
The four main components of electricity tariffs in Singapore are (i) Energy Costs (paid to the generation companies), (ii) Grid Charges (paid to SP PowerAssets), (iii) Market Support Services Fees (paid to SP Services), and (iv) Market Administration and Power System Operation Fees (paid to the Energy Market Company and the Power System Operator).
In 2015, the annual electricity tariffs declined by 15%, from 25.6 cents per kWh in Q4 2014 to 21.7 cents per kWh in Q4 2015. This was mainly due to lower energy costs, which fell from 20.2 cents per kWh in 2014 to 16.3 cents per kWh in 2015, arising from lower Singapore gas prices in 2015.
ElEctricity tariffs
2010 2011 2012 2013 20152014
Unit: Cents/kwh
ANNuAL ELECtRiCitY tARiFFS BY ComPoNENtS (Low tENSioN tARiFFS)
20
30
10
Table 5.1 ElEctricity & gas tariffs
Table 5.2 ElEctricity tariffs by QuartEr (low tEnsion tariffs) Unit: Cents/kwh
Prices index
1 Data for 2016 is as of 1Q 2016. Notes:a. Electricity tariffs refer to the low tension tariffs applicable for Households and non-Contestable Consumers. b. Town Gas tariffs refer to the general Town Gas tariffs applicable for all consumers with consumption of less than 1,000 kWh of gas per month.c. Inflation Adjusted Electricity and Town Gas tariffs are compiled using the Core Inflation Index (Base Year of 2014).
Note: a. Low tension tariffs refers to electricity tariffs applicable for Households and non-Contestable Consumers. Notation: - nil, negligible or not applicable.
Source: Energy Market Authority (EMA)
Source: SP Services
28.8 22.32012
2012
Electricity tariffs,
inflation Adjusted
town Gas tariffs,
inflation Adjusted
Cents/kwh (Base index of 100 at 2014)
Year
20161
2016
21.5
19.2
18.2
16.8
84.9
76.2
87.4
81.0
84.5
75.4
86.9
80.2
2015
2015
25.4 20.92014
2014
26.6 21.42013
2013
21.3
25.4
19.2
20.2
2005
2005
2010
2010
109.2 102.8 113.2 106.6
Electricity tariffs
town Gas tariffs
Electricity tariffs,
inflation Adjusted
town Gas tariffs,
inflation Adjusted
100.0 100.0 100.0 100.0
102.6 100.4 104.6 102.4
69.0
91.8
75.9
89.1
83.6
99.7
91.9
96.8
AnnualQ1 Q2 Q3 Q4
16.7
22.9
16.1
23.6
18.3
24.1
19.6
23.3
17.7
23.5
26.3 26.7 26.0 26.0 26.3
27.6 28.8 28.1 27.3 27.9
19.5
25.7 25.7 25.7 25.3 25.6
23.3 20.9
17.7
22.4
-
20.4
-
21.7
-
0.1 0.2
20.218.3
5.14.9
16.3
5.2
0.20.1
0.20.1
Energy Costs Market Support Service FeesGrid Charges Power System Operation &Market Administration Fees

0 5 ENERGY PRICES S I N G A P O R E E N E R GY S TAT I S T I C S 2 016
9 0 91
Table 5.3 annual ElEctricity tariffs by componEnts (low tEnsion tariffs)
Table 5.5 consumEr pricE indEx for sElEctEd EnErgy products (basE indEx of 100 at 2014)
Table 5.6 producEr & intErnational tradE pricE indicEs of minEral fuEls, lubricants & rElatEd matErials (basE indEx of 100 at 2012)
Unit: Cents/kwh
2010 2012 2013 2014 2015
total
Source: Energy Market Authority (EMA)
Source: Singapore Department of Statistics (DOS)
Source: Singapore Department of Statistics (DOS)
Notes: a. Figures may not add up to total due to rounding. b. Electricity tariffs refer to the low tension tariffs applicable for Households and non-Contestable Consumers.
17.7
0.1
0.3
5.5
11.8
23.5
0.1
0.2
4.9
18.3
27.9
0.1
0.2
4.8
22.8
26.3
0.1
0.2
5.0
21.0
25.6 21.7
0.1
0.2
5.1
20.2
0.1
0.2
5.2
16.3
Grid Charges
Energy Costs
Market Support Service Fees
Power System Operation & Market Administration Fees
Annual
Annual
Q1
Q1
Q2
Q2
Q3
Q3
Q4
Q4
Table 5.4 town gas tariffs by QuartEr
Table 5.4 town gas tariffs by QuartEr (continuEd)
Unit: Cents/kwh
Unit: Cents/kwh
Sources: City Gas Pte Ltd & Energy Market Authority (EMA)
Notes:a. Bulk Tariff A applies for minimum consumption of 1,000 kWh of gas per month.b. Bulk Tariff B applies for minimum consumption of 50,000 kWh of gas per month.c. Rates are not inclusive of GST. Notation: - nil, negligible or not applicable.
15.7
18.8
14.7
17.8
15.7
18.9
14.7
17.9
15.8
18.9
14.8
17.9
16.6
18.3
15.6
17.3
16.0
18.7
15.0
17.7
21.1
20.1
21.1
20.1
21.1
20.1
20.9
19.9
21.1
20.1
21.1
20.1
21.2
20.2
17.0
16.0
21.0
20.0
21.1
20.1
21.1
20.1
21.4
20.3
21.9
20.9
19.6
18.6
21.8
20.7
19.0
16.3
15.3
18.0
21.4
20.4
21.6
20.6
18.0
-
-
17.0
18.3
-
-
17.2
18.7
-
-
17.7
2005
2005
2010
2010
General tariffs
Bulk tariff A
2013
2013
2012
2012
2016
2016
2014
2014
2015
2015
61.5 70.12005
2005
96.7 97.02012
2012
84.0 84.32010
2010
91.1 95.3 2015
2015
98.2 99.42013
2013
PetrolYear Liquefied Petroleum Gas (LPG)
100.0 100.02014
2014
61.3 58.5 62.3 66.3
95.9 94.6 95.9 96.0
100.0 100.0 100.0 100.0
76.2 76.3 76.2 78.5
88.8
52.0
88.6
56.3
88.7
52.1
89.6
58.3
import Price index (iPi)
Export Price index (EPi)
Domestic Supply Price index (DSPi)
Singapore manufactured Products Price index (SmPPi)
2005
Sources: City Gas Pte Ltd & Energy Market Authority (EMA)
Notes:a. Bulk Tariff A applies for minimum consumption of 1,000 kWh of gas per month.b. Bulk Tariff B applies for minimum consumption of 50,000 kWh of gas per month.c. Rates are not inclusive of GST.
Notation: - nil, negligible or not applicable.
14.2
17.3
14.2
17.4
14.3
17.4
15.1
16.8
14.5
17.2
19.6 19.6 19.6 19.4 19.6
19.7 19.7
15.5
19.5 19.6 19.6
19.8 20.4
18.1
20.3
14.8
17.5
19.9 20.1
-
16.5
-
16.7
-
17.2
AnnualQ1 Q2 Q3 Q4
2005
2010
Bulk tariff B
2013
2012
2016
2014
2015

0 6 SOLAR S I N G A P O R E E N E R GY S TAT I S T I C S 2 016
9 4 9 5
The adoption of solar PV systems in Singapore continued to accelerate in 2015. Grid-connected installed capacity of solar PV systems sharply increased from 26 MWac in 2014 to 46 MWac in 2015. This increase was driven by 305 new installations in 2015.
Of the 942 systems installations as at the end of 2015, 39% (or 363 installations) were by residentialusers. The remaining 61% (or 579 installations) were by non-residential users, including Town Councils and the Housing Development Board. Of the total installed capacity of 46 MWac in 2015, residential users accounted for 6.8% (or 3.1 MWac). Non-residential users accounted for the remaining 93% (or 43 MWac).
At the end of 2015, the Western region of Singapore had the highest concentration of solar PV, with a corresponding total capacity of 16 MWac (35%) distributed across 182 installations. This was followed by the Eastern region with a total capacity of 8.9 MWac across 146 installations. The Central region had a total capacity of 8.3 MWac across 294 installations.
Most solar PV systems were located in the Central (294 installations) and North-eastern regions (253 installations). Many of these were residential installations, which were significantly smaller in capacity. Hence, the combined share of installed capacity in these two regions was disproportionately smaller (36%) compared with its corresponding share of the total number of installed systems (58%).
installEd capacity & numbEr of grid-connEctEd solar photovoltaic (pv) systEms
solar pv installations by planning rEgion
2010 2011 2012 2013 20152014
Unit: mwacInstalled Capacity
Number ofinstallations
SoLAR Pv iNStALLAtioNS(As At End Period)
DiStRiButioN oF SoLAR iNStALLAtioNS iN SiNGAPoRE, 2015
20 400
30 600
40 800
50 1000
10 200
Non-Residential Consumers Number of InstallationsResidential Consumers
24
0.1
43
637
106
942
1.7 3.12.8 8.9 mwacEast
8.3 mwacCentral
16 mwacWest
8.2 mwacNorth-east
4.2 mwacNorth
182
67
294
253
146

0 6 SOLAR S I N G A P O R E E N E R GY S TAT I S T I C S 2 016
9 6 9 7
total
total
total
Non-Residential
Non-Residential
Non-Residential
Residential
Residential
Residential
Contestable
Contestable
Contestable
5.9
171
4.6
5.6
131
4.3
0.3
40
2.2
46
1.7
2011
2011
3.4
85
2.6
3.8
106
2.9
3.7
85
2.8
0.1
21
0.1
1.8
32
1.4
2010
2010
1.8
53
1.4
10.1
296
7.8
9.3
210
7.2
0.8
86
0.6 0.2
3.1
69
2.4
2012
2012
6.2
141
4.8
15.3
390
11.8
14.0
256
10.8
1.3
134
1.0
5.9
86
4.6
2013
2013
8.1
170
6.2
33.1
637
25.5
30.9
414
23.8
2.2
223
1.7
16.6
121
12.8
2014
2014
14.3
293
11.0
59.5
942
45.8
55.5
579
42.7
4.0
363
3.1
31.3
172
24.1
2015
2015
24.2
407
18.6
Non-Contestable
Non-Contestable
Non-Contestable
Source: SP PowerGrid Ltd (SPPG)
Source: SP PowerGrid Ltd (SPPG)
Sources: SP PowerGrid Ltd (SPPG) & Energy Market Authority (EMA)
Notes: a. Figures may not add up to total due to rounding. b. MWp refers to megawatt peak, which is a typical measure of the installed nameplate capacity for solar PV systems. MWp represents the amount of electric power that can be produced by a solar PV system at its peak. c. MWac refers to the Alternating Current (AC) capacity of the inverters used in solar PV installations.
Note: a. Figures may not add up to total due to rounding.
Notes: a. Figures may not add up to total due to rounding. b. MWac refers to the Alternating Current (AC) capacity of the inverters used in solar PV installations.
Table 6.1 installEd capacity of grid-connEctEd solar photovoltaic (pv) systEms
Table 6.2 numbEr of grid-connEctEd solar photovoltaic (pv) installations
Unit: mwp
Unit: mwac
20112010 2012 2013 2014 2015
Table 6.3 solar pv installations by ura planning rEgion as at End of pEriod
overall
overall
Non-Residential
Non-Residential
East
East
Non-Residential
Non-Residential
Central
Central
Non-Residential
Non-Residential
North-East
North-East
Non-Residential
Non-Residential
North
North
Non-Residential
Non-Residential
west
west
Non-Residential
Non-Residential
total
total
Sub-total
Sub-total
Sub-total
Sub-total
Sub-total
Sub-total
Sub-total
Sub-total
Sub-total
Sub-total
Residential
Residential
Residential
Residential
Residential
Residential
Residential
Residential
Residential
Residential
Residential
Residential
2010
2011
85 2,839.4 97.1%
14 835.7 28.6%
25 971.4 33.2%
16 144.7 4.9%
12 210.6 7.2%
18 676.9 23.1%
106 2,925.3 100.0%
16 845.4 28.9%
39 1,029.7 35.2%
19 159.0 5.4%
14 214.3 7.3%
18 676.9 -
23.1%
21 86.0 2.9%
2 9.7 0.3%
14 58.3 2.0%
3 14.2 0.5%
2 3.7 0.1%
0 0.0%
131 4,337.2 94.9%
17 966.9 21.1%
45 1,694.3 37.1%
26 448.5 9.8%
16 299.4 6.5%
27 928.1 -
20.3%
171 4,572.3 100.0%
21 980.0 21.4%
69 1,877.5 41.1%
34 479.1 10.5%
20 307.6 6.7%
27 928.1 20.3%
40 235.1 5.1%
4 13.1 0.3%
24 183.2 4.0%
8 30.6 0.7%
4 8.2 0.2%
0 0.0%
Percentage Share (of total installed Capacity)
uRA Planning Region
Residential Status
Number of Solar Pv installations
installed Capacity (kwac)
Sources: SP PowerGrid Ltd (SPPG) & Energy Market Authority (EMA)

0 6 SOLAR S I N G A P O R E E N E R GY S TAT I S T I C S 2 016
9 8 9 9
2012
2013
overallNon-Residential
EastNon-Residential
CentralNon-Residential
North-EastNon-Residential
NorthNon-Residential
westNon-Residential
total
Sub-total
Sub-total
Sub-total
Sub-total
Sub-total
Residential
Residential
Residential
Residential
Residential
Residential
210 7,175.9 92.6%
25 1,192.7 15.4%
71 2,212.8 28.5%
63 2,117.9 27.3%
17 376.4 4.9%
34 1,276.1 16.5%
296 7,753.4 100.0%
44 1,283.2 16.5%
109 2,566.4 33.1%
84 2,217.5 28.6%
22 390.0 5.0%
37 1,296.3 16.7%
86 577.5 7.4%
19 90.5 1.2%
38 353.6 4.6%
21 99.6 1.3%
5 13.6 0.2%
3 20.2 0.3%
overallNon-Residential
EastNon-Residential
CentralNon-Residential
North-EastNon-Residential
NorthNon-Residential
westNon-Residential
total
Sub-total
Sub-total
Sub-total
Sub-total
Sub-total
Residential
Residential
Residential
Residential
Residential
Residential
256 10,801.8 91.7%
29 1,770.7 15.0%
87 2,714.6 23.0%
79 2,920.0 24.8%
21 1,183.2 10.1%
40 2,213.4 18.8%
390 11,777.6 100.0%
62 1,986.5 16.9%
141 3,215.0 27.3%
111 3,082.5 26.2%
29 1,234.2 10.5%
47 2,259.3 19.2%
134 975.7 8.3%
33 215.8 1.8%
54 500.5 4.2%
32 162.5 1.4%
8 51.0 0.4%
7 45.9 0.4%
overall
overall
Non-Residential
Non-Residential
East
East
Non-Residential
Non-Residential
Central
Central
Non-Residential
Non-Residential
North-East
North-East
Non-Residential
Non-Residential
North
North
Non-Residential
Non-Residential
west
west
Non-Residential
Non-Residential
total
total
Sub-total
Sub-total
Sub-total
Sub-total
Sub-total
Sub-total
Sub-total
Sub-total
Sub-total
Sub-total
Residential
Residential
Residential
Residential
Residential
Residential
Residential
Residential
Residential
Residential
Residential
Residential
414
42
101
149
28
94
637
96
194
204
37
106
223
54
93
55
9
12
23,766.7
3,309.2
3,737.8
6,129.8
2,484.1
8,105.9
25,490.3
3,677.3
4,614.4
6,467.5
2,542.0
8,189.0
1,723.6
368.2
876.6
337.7
57.9
83.1
93.2%
13.0%
14.7%
24.0%
9.7%
31.8%
100.0%
14.4%
18.1%
25.4%
10.0%
32.1%
6.8%
1.4%
3.4%
1.3%
0.2%
0.3%
579 42,748.3 93.3%
65 8,298.8 18.1%
149 6,879.2 15.0%
159 7,489.9 16.4%
46 4,051.3 8.8%
160 16,029.1 35.0%
942 45,805.5 100.0%
146 8,900.6 19.4%
294 8,296.4 18.1%
253 8,180.0 17.9%
67 4,217.4 9.2%
182 16,211.2 35.4%
363 3,057.2 6.7%
81 601.8 1.3%
145 1,417.2 3.1%
94 690.1 1.5%
21 166.1 0.4%
22 182.0 0.4%
Sources: SP PowerGrid Ltd (SPPG) & Energy Market Authority (EMA)
Percentage Share (of total installed Capacity)
uRA Planning Region
Residential Status
Number of Solar Pv installations
installed Capacity (kwac)
Percentage Share (of total installed Capacity)
uRA Planning Region
Residential Status
Number of Solar Pv installations
installed Capacity (kwac)
2014
2015
Table 6.3 solar pv installations by ura planning rEgion as at End of pEriod (continuEd)Table 6.3 solar pv installations by ura planning rEgion as at End of pEriod (continuEd)
Notes: a. Figures may not add up to total due to rounding. b. MWac refers to the Alternating Current (AC) capacity of the inverters used in solar PV installations.


0 7 Other energy-related StatiSticS S I N G A P O R E E N E R GY S TAT I S T I C S 2 016
10 2 10 3
Unit: kg Co2/kwhGrid Emission Factor(Average Operating Margin)
Singapore’s average Operating Margin (OM) Grid Emission Factor (GEF) has registered sustained improvements since 2012. In 2015, the GEF fell by 0.0019 kg CO2/kWh to 0.4313 kg CO2/kWh, representing a 0.4% decrease. This was mainly due to the greater use of NG for electricity generation as its share of fuel mix continued to be consistently high at around 95%.
The Build Margin (BM) Emission Factor slightly increased from 0.4065 kg CO2/kWh in 2014 to 0.4126 CO2/kWh in 2015 (increase of 0.0061 kg CO2/kWh or 1.5%). In general, Singapore’s BM emission factor trends lower than the OM emission factor. This is because newer plants in Singapore (predominantly CCGTs) are more efficient and primarily use fuels with a lower carbon content (such as natural gas) compared with other fossil fuels.
Employment in the power sector remained healthy despite tight economic conditions. The number of workers employed increased by 18%, from 4,300 in 2011 to 5,090 in 2014. About 63% (or 500) of new positions opened were of a technical nature. Residents (Singaporeans and Permanent Residents) comprised the majority (97% in 2011 and 96% in 2014) of employed workers in the power sector.
grid Emission factor
powEr sEctor EmployEEs
Unit: Percent (%)Percentage of Non-Natural Gas
Energy Products In Fuel Mix
GRiD EmiSSioN FACtoR & PERCENtAGE ShARE oFNoN-NAtuRAL GAS ENERGY PRoDuCtS iN FuEL mix
0.4400 15
0.4600 20
0.4800 25
0.5000 30
0.4200
0.4000
10
5
2010 2011 2012 2013 20152014
Non-Natural Gas Percentage Share of Fuel MixAverage Operating Margin (OM)
PowER SECtoR EmPLoYEES BY NAtuRE oF woRk, & RESiDENCY StAtuS
2011 2014
5,090
4,3003.3%Non-Residents
97%Residents
1,550
1,850
3,2502,750
4.1%Non-Residents
96% Residents
Technical StaffNon-Technical Staff
0.5083
23
4.6 4.8
0.4332 0.4313
Note: The values for each component in the chart above are ordered according to the legend.

0 7 Other energy-related StatiSticS S I N G A P O R E E N E R GY S TAT I S T I C S 2 016
10 4 10 5
Employment Numbers Share (%)
2014 2011 20142011
Table 7.1 ElEctricity grid Emission factor & upstrEam fugitivE mEthanE Emission factor
Table 7.4 numbEr of powEr sEctor EmployEEs by rEsidEncy status
Table 7.5 numbEr of licEnsEd ElEctrical, gas sErvicE & cablE dEtEction workErs
Table 7.2 pEak systEm dEmand
2010
Year
2012 2013 2014 2015
Electricity Grid Emission Factors
overall
Source: Energy Market Authority (EMA)
Source: Energy Market Authority (EMA)
Sources: City Gas Pte Ltd & Energy Market Authority (EMA)
Average Operating Margin (OM) (kg CO2 /kWh)
Residents
Build Margin (BM) (kg CO2/kWh)
Non-Residents
Upstream Fugitive Methane Emission Factor (kg CH4/kWh)
0.4205 0.4319 0.4333 0.4112 0.4065 0.4126
0.5255 0.5083 0.4912 0.4499 0.4332 0.4313
0.00216 0.00222 0.00222 0.00216 0.00213 0.00213
5,332
6,232
6,572
6,466
6,323
6,626
-
5,341
6,358
6,761
6,659
6,576
6,849
-
5,297
6,244
6,868
6,735
6,524
6,919
-
5,385
6,494
6,801
6,686
6,639
6,839
-
5,298
6,311
6,869
6,814
6,552
6,960
-
5,408
6,395
6,715
6,572
6,457
6,890
-
5,333
6,218
6,652
6,471
6,373
6,746
6,909
5,285
6,216
6,541
6,381
6,289
6,551
6,733
5,083
5,981
6,385
6,455
6,323
6,546
6,735
5,471
6,285
6,846
6,663
6,490
6,856
-
5,475
6,345
6,850
6,578
6,563
6,870
-
5,456
6,320
6,699
6,556
6,432
6,748
-
2005
2010
2013
2012
2016
2014
2015
Unit: mw
DecAugJulmay JunAprmarFebJan Sep oct Nov
Source: Energy Market Authority (EMA)
140
4,160
4,300
210
4,880
5,090
3.3
96.7
100
4.1
95.9
100
Electricians
Engineers
Gas Service Workers (Restricted)
Notation: - nil, negligible or not applicable.
1,299
401
528
1,163
359
444
1,119
354
413
1,074
354
393
1,073
347
390
1,080
359
381
4,101
6,672
343
-
3,341
5,761
308
146
3,211
5,580
291
192
2,955
5,270
293
201
2,900
5,219
296
213
2,902
5,251
296
233
2015
Total
Technicians
Gas Service Workers
Cable Detection Workers
2010 2012 2013 2014
2005
2005Number of workersNotation: - nil, negligible or not applicable.
Note:a. The Grid Emission Factor (GEF) measures the average CO2 emission emitted per MWh of electricity. It can be calculated using the Average Operating Margin (OM) or the Build Margin (BM) method. The OM measures the system-wide emissions factor while the BM measures the emissions factor of newer facilities. More details on the GEF could be found in the “Technical Notes” section.
Table 7.3 numbEr of powEr sEctor EmployEEs by occupation
Source: Energy Market Authority (EMA)
Employment Numbers Share (%)
40 40 0.8Trading Staff 0.8100 30 2.2Others 0.5
4,300 5,090 100overall 100
520 690 12.1Engineers 13.5
960 1,040 22.4Corporate Service Staff 20.4
2,750 3,250 64.0technical Staff 63.7
270 330 6.4Management 6.5
2014 2011 20142011
970 1,180 22.5 23.2Technical Officers
180 410 4.2 8.0Commercial Staff
1,260 1,370 29.4Technicians 27.01,550 1,850 36.0Non-technical Staff 36.3


0 8 TECHNICAL NOTES S I N G A P O R E E N E R GY S TAT I S T I C S 2 016
10 8 10 9
objectives
Singapore Energy Statistics 2016 provides users with findings and statistics relating to Singapore’s energy supply, transformation and demand.
Sources of Data
The data used in the publication were mainly obtained through administrative returns from licensees and through surveys. EMA licensees are required to submit regulatory returns under the Electricity and Gas Acts. Energy statistics collected through the Joint Energy and Emissions Statistics Survey were also used in this publication. This survey is conducted by EMA Research and Statistics Unit (RSU) together with those of the Economic Development Board (EDB) and the National Environment Agency (NEA) under the Statistics Act.
Other sources of data featured in this publication include energy products trade statistics from the International Enterprise (IE) Singapore, energy consumption statistics from the NEA and prices statistics from the Singapore Department of Statistics (DOS).
Compilation Framework & methodology
In compiling the energy statistics, EMA closely follows the recommended principles and methodologies set out in the International Energy Agency (IEA)’s Energy Statistics Manual. For the computation of the electricity grid emission factors and upstream fugitive methane emission factor, methodologies recommended by the Intergovernmental Panel on Climate Change (IPCC) are adopted.
units of measurement
Energy products are recorded in their original units of measure. As these units of measure vary, quantities of energy products need to be converted into a common unit to allow for comparison and aggregation. The common unit of measurement used to measure energy products in this publication is the tonne of oil equivalent (toe). According to the IEA, the tonne of oil equivalent is defined as follows:
= 41.868 gigajoules (GJ)= 11,630 kilowatt hours (kWh)
The tonne of oil equivalent should be regarded as a measure of energy content rather than a physical quantity. One tonne of oil is not equal to one tonne of oil equivalent.
The following prefixes are used for multiples of the various units of measure:
= 1,000 or 103
= 1,000,000 or 106
= 1,000,000,000 or 109
= 1,000,000,000,000 or 1012
kilo (k)mega (M)giga (G)tera (T)
The top block (Energy Supply). This shows the flow representing energy entering and leaving the national territory. It also includes stock changes to provide information on total energy supply on the national territory during the reference period;
The middle block (Energy Transformation). This shows how energy is transformed, transferred, and used by energy industries for their own use and losses in distribution and transmission; and
The bottom block (Final Consumption). This shows final energy consumption by energy consumers.
a)
b)
c)
All prices and tariffs are presented in Singapore dollars.
Calorific Values
EMA uses Net Calorific Values (NCVs) to convert all fuels, except natural gas, from their original units to tonnes of oil equivalent (toe). Gross Calorific Values (GCVs) are used for unit conversion of natural gas, unless otherwise stated.
Energy Balance
An energy balance is an accounting framework for compilation and reconciliation of data on all energy products entering, exiting, and used within the national territory of a given country during a reference period.
It expresses all forms of energy in a common accounting unit, and shows the relationships between the inputs to, and the outputs from the energy transformation industries.
The balance is divided into three main blocks:
1 tonne of oil equivalent

0 8 TECHNICAL NOTES S I N G A P O R E E N E R GY S TAT I S T I C S 2 016
110 111
Fuel mix for Electricity Generation
The fuel mix for electricity generation can be calculated using either the input or output method. This publication presents fuel mix data compiled by the output method.
The input method calculates the fuel mix for electricity generation based on the ratio of volume of fuel input to generation units. It does not take into account variations in energy content of fuel used by different companies for electricity generation, nor variations in fuel-to-electricity conversion efficiency of the generating plants.
The output method uses the amount of electricity generated and the corresponding type of fuel used to calculate the fuel mix for electricity generation. It takes the domestic fuel-to-electricity conversion efficiency of the generating plants as well as the type of plants used into account.
Electricity & Gas tariffs
Annual and quarterly electricity and gas tariffs refer to the weighted average of tariffs for the specific periods as they may be adjusted at various period throughout the year.
Re-referencing Price indices
To allow comparisons between the movements of different prices, price indices series are pegged to a reference year. This is because of the shift from expressing the price indices in relation to a specific base year, to expressing the price indices in relation to a reference year common across all price indices.
Grid Emission Factors & methane Emission Factors
The methodologies for the compilation of Grid Emission Factors (GEF) are based on the United Nations Framework Convention on Climate Change (UNFCCC) Clean Development Mechanism (CDM) Methodological Tool. This is the “Tool to calculate the emission factor for an electricity system” and the UNFCCC CDM Approved Baseline Methodology (AM) 0029 Baseline Methodology for grid connected electricity generation plants using natural gas.
GEF measures average CO2 emissions emitted per unit net electricity generated. It is calculated using the Average Operating Margin (OM) method. This is the generation-weighted average CO2 emission per unit net electricity generation of all generating power plants serving the electricity grid. GEF by Build Margin (BM) method refers to the generation-weighted average CO2 emission per unit net electricity generation of the five most recently built power units and/or the set of power capacity additions that comprise at least 20% of the total system electricity generation.
Upstream fugitive Methane Emission Factor (MEF) from electricity generation measures the average CH4 emission per unit net electricity generated. The methodology is similar to the BM method. However, it is based on the five most recently built power units that run on natural gas. These five plants should also generate at least 20% of total system electricity generation.
CLASSiFiCAtioN
Energy Products
Energy products refer to products exclusively or mainly used as a source of energy. They include energy in forms suitable for direct use (for instance, electricity and heat) and energy products that release energy while undergoing some chemical or other process (such as combustion). The classification of energy products is based on the Singapore Trade Classification, Customs & Excise Duties 2012 (STCCED 2012 or HS 2012). STCCED classification adopts the ASEAN Harmonised Tariff Nomenclature 2012 (AHTN 2012). This is based on the 6-digit Harmonised Commodity Description and Coding System developed by the World Customs Organisation (WCO) for the classification of goods.
industrial Activity
Industrial activity refers to the principal activity undertaken by the enterprise. This is where the enterprise devotes most of its resources; or from which it derives most of its income. The classification of the principal activity of the enterprise in the SES 2016 is based on the Singapore Standard Industrial Classification, 2015 (SSIC 2015). SSIC 2015 adopts the basic framework and principles of the International Standard Industrial Classification of all Economic Activities (ISIC).
Planning Region/Area
Planning Region/Area refers to those demarcated in the Urban Redevelopment Authority’s Master Plan 2008.


0 9 GLOSSARY S I N G A P O R E E N E R GY S TAT I S T I C S 2 016
114 115
EnErgy products
Coal & Peat Products
Coal and peat products include all coals, both primary (including hard coal and lignite/brown coal) and derived fuels (including patent fuel, coke over coke, gas coke, BKB, coke oven gas, blast furnace gas and oxygen steel furnace gas). Peat is also included in this category. The energy products and their corresponding HS 2012 codes under this category are:
27021000, 27022000
27060000
27011100
27040010, 27040020, 27040030
27050000
27011210, 27011290, 27011900
27030010, 27030020
27012000
Anthracite
Coke Oven Coke
Gas Works Gas
Hard Coal
Peat
BKB/PB6
Lignite
Coal Tar
Crude oil Products
Crude oil products include crude oil, natural gas liquids, refinery feedstocks and additives as well as other hydrocarbons. The energy products and their corresponding HS 2012 codes under this category are:
27101920
27111410, 27111490, 27112900
27090010, 27090020, 27090090
29091100, 29091900, 29092000, 29093000, 29094100, 29094300, 29094400, 29094900, 29095000, 29096000, 38112110, 38112190, 38112900, 38119090
Natural Gas Liquids
Crude Oil
Additives/ Oxygenates
Refinery Feedstocks
Petroleum Products
Petroleum products include ethane, LPG, aviation gasoline, motor gasoline, jet fuel, kerosene, gas/diesel oil, fuel oil, naphtha, white spirit, lubricants, bitumen, paraffin waxes, petroleum coke and other petroleum products. The energy products and their corresponding HS 2012 codes under this category are:
27101211, 27101212, 27101213, 27101214, 27101215, 27101216
27101220Gasoline (Aviation)
Light Distillates
Gasoline (Motor)
27111200, 27111300, 27111900Liquefied Petroleum Gas (LPG)
27101230, 27101240, 27101250, 27101260, 27101280, 27101290
27101270
White Spirit SBP
Naphtha
Natural Gas
others (Energy Products)
27101981, 27101982
27101983
27101979
27131100, 27131200
27101971, 27101972
27112190
27111100
27132000, 27139000, 27141000, 27149000, 27150000
27121000, 27122000, 27129010, 27129090
27101941, 27101942, 27101943, 27101944, 27101950
27071000, 27072000, 27073000, 27074000, 27075000, 27079100, 27079910, 27079990, 27081000, 27082000, 27101930, 27101960,27101989, 27101990, 27102000, 27109100, 27109900
Gas/Diesel Oil
Natural Gas
Liquefied Natural Gas
Other Kerosenes
Bitumen
Paraffin Waxes
Lubricants
Other Petroleum Products
middle Distillates
Natural Gas includes natural gas (excluding Natural Gas Liquids) and town gas. The energy products and their corresponding HS 2012 codes under this category are:
‘Others’ refer to other energy products that are not classified. These include solar, biomass, and waste (such as municipal waste and biogas). Municipal waste is waste produced by residential, commercial and public services that is collected by local authorities for disposal in a central location for the production of electricity and/or heat.
heavy Distillates & Residuum
Fuel Oil
Petroleum Coke
Jet Fuel Kerosene

0 9 GLOSSARY S I N G A P O R E E N E R GY S TAT I S T I C S 2 016
116 117
main Power Producers
Autoproducers
own use
Licensed Generation Capacity
Co-Generation (Co-Gen) Plant
tri-Generation (tri-Gen) Plant
open Cycle Gas turbine (oCGt) Plant
Steam turbine Plant
waste-to-Energy (wtE) Plant
Combined Cycle Gas turbine (CCGt) Plant
These are enterprises that produce electricity as their principal activity.
These are enterprises that produce electricity but for whom the production is not their principal activity.
Own use in electricity generation refers to the part of electricity generated which is consumed by the auxiliary equipment of the generation plant (such as pumps, fans and motors) under normal operations.
The licensed capacity of a generation, or wholesaler licensee, refers to the authorised capacity that EMA grants to a licensee for the generation of electricity.
Co-generation plants (also known as combined heat plants) are plants which simultaneously generate electricity and useful heat from a common fuel source. This, improves overall thermodynamical efficiency.
Tri-generation plants are those which simultaneously generate electricity, useful heat and cooling from a common fuel source. This improves overall thermodynamical efficiency.
An Open Cycle Gas Turbine plant is a gas turbine power plant which discards the heat content of the exhaust gases exiting the turbine. This is, as opposed to using a heat exchanger, or recovered in a heat recovery steam generator (HRSG) as in a CCGT.
A steam turbine is a turbine that is driven by the pressure of steam discharged at high velocity against the turbine vanes.
A Waste-To-Energy plant is a power plant which generates power from the incineration of waste.
Combined Cycle Gas Turbines are a form of highly efficient energy generation technology that combines a gas-fired turbine with a steam turbine.
The design uses a gas turbine to create electricity. It then captures the resulting waste heat to create steam, which, in turn, drives a steam turbine to significantly increase the system’s power output without any increase in fuel.
Electricity Consumption
Contestable Consumers
Final Energy Consumption
Final Natural Gas Consumption
This refers to total electricity consumption by end users, including (embedded) consumption by Autoproducers.
Contestable Consumers are large, non-residential consumers with an average monthly consumption of 2,000 kWh or more. They have a monthly electricity bill of at least $450. Consumers can add up their electricity usage across different locations in Singapore to meet the prevailing threshold. Consumers eligible for contestability can choose to buy electricity from electricity retailers or the wholesale electricity market at half-hourly spot prices. They can also choose to remain with SP Services to buy electricity at regulated tariffs. The contestability threshold was last lowered on 1 July 2015 by EMA.
Final energy consumption covers all energy supplied to the final consumer for all energy uses. It is usually disaggregated into the final end-use sectors such as industry, commerce & services, transport, households, and others.
This refers to total natural gas consumption by end-users, excluding consumption for electricity generation.
ElEctricity & natural gas consumption
ElEctricity gEnEration

0 9 GLOSSARY S I N G A P O R E E N E R GY S TAT I S T I C S 2 016
118 119
Commerce & Services-related
Commerce & Services-related consumption is defined by the following sub-sectors. This is in accordance to the Singapore Standard Industrial Classification 2015 (SSIC 2015).
SSIC Section C, Division 10-32
SSIC Section J, Division 58-63
SSIC Section N, Division 77-82
SSIC Section R, Division 90-93
SSIC Section T, Division 97
SSIC Section B, Division 8-9
SSIC Section I, Division 55 - 56
SSIC Section M, Division 69-75
SSIC Section Q, Division 86-88
SSIC Section F, Division 41-43
SSIC Section A, Division 1-3
SSIC Section G, Division 46-47
SSIC Section L, Division 68
SSIC Section P, Division 85
SSIC Section D, Division 35, andSection E, Division 36-38
SSIC Section K, Division 64-66
SSIC Section O, Division 84
SSIC Section S, Division 94-96
SSIC Section U, Division 99
Mining and Quarrying
Accommodation and Food Services Activities
Professional, Scientific and Technical Activities
Health and Social Services
Construction
Agriculture and Fishing
Wholesale and Retail Trade
Real Estate Activities
Education
Utilities
Financial and Insurance Activities
Public Administration and Defence
Other Service Activities
Activities of Extra-Territorial Organisations and Bodies
Manufacturing
Information and Communications
Administrative and Support Services Activities
Arts, Entertainment and Recreation
Activities of Households as Employers of Domestic Personnel
Central Region
households
others
East Region
North-East Region
North Region
west Region
transport-related
Bishan, Bukit Merah, Bukit Timah, Downtown Core, Geylang, Kallang, Marine Parade, Marina East, Marina South, Museum, Newton, Novena, Orchard, Outram, Queenstown, River Valley, Rochor, Singapore River, Southern Islands, Straits View, Tanglin, Toa Payoh
The scope of the Households sector includes all households in their capacity as final consumers.
“Others” refer to sectors or activities not adequately defined in SSIC 2015.
Bedok, Changi, Changi Bay, Paya Lebar, Pasir Ris, Tampines
Ang Mo Kio, Hougang, Punggol, North Eastern Islands, Seletar, Sengkang, Serangoon
Central Water Catchment, Lim Chu Kang, Mandai, Simpang, Sembawang, Sungei Kadut, Woodlands, Yishun
Boon Lay, Bukit Batok, Bukit Panjang, Choa Chu Kang, Clementi, Jurong East, Jurong West, Jurong Island, Pioneer, Tengah, Tuas, Western Islands, Western Water Catchment
Transport-related consumption is defined by the following subsectors, This is in accordance to the Singapore Standard Industrial Classification 2015 (SSIC 2015).
SSIC Division 50
SSIC Division 49
SSIC Division 52
SSIC Section H, Division 49-53
SSIC Division 51
SSIC Division 53
Land Transport
Warehousing and Support Activities for Transportation
Transport and Storage
Air Transport
Postal and Courier Activities
Water Transport
industrial-related
Industrial-related consumption is defined by the following sub-sectors. This is in accordance to the Singapore Standard Industrial Classification 2015 (SSIC 2015).
sEctoral activitiEs
planning arEa
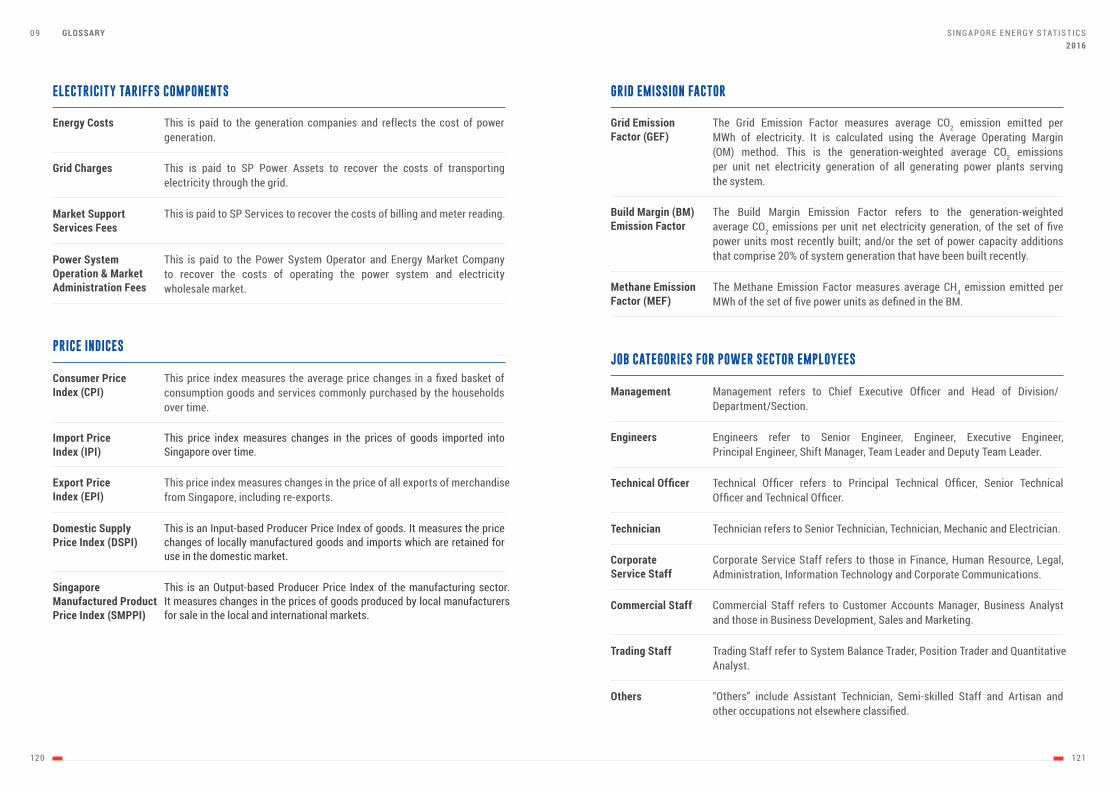
0 9 GLOSSARY S I N G A P O R E E N E R GY S TAT I S T I C S 2 016
12 0 121
Energy Costs
Consumer Price index (CPi)
Grid Charges
market Support Services Fees
Power System operation & market Administration Fees
import Price index (iPi)
Export Price index (EPi)
Domestic Supply Price index (DSPi)
Singapore manufactured Product Price index (SmPPi)
This is paid to the generation companies and reflects the cost of power generation.
This price index measures the average price changes in a fixed basket of consumption goods and services commonly purchased by the households over time.
This is paid to SP Power Assets to recover the costs of transporting electricity through the grid.
This is paid to SP Services to recover the costs of billing and meter reading.
This is paid to the Power System Operator and Energy Market Company to recover the costs of operating the power system and electricity wholesale market.
This price index measures changes in the prices of goods imported into Singapore over time.
This price index measures changes in the price of all exports of merchandise from Singapore, including re-exports.
This is an Input-based Producer Price Index of goods. It measures the price changes of locally manufactured goods and imports which are retained for use in the domestic market.
This is an Output-based Producer Price Index of the manufacturing sector. It measures changes in the prices of goods produced by local manufacturers for sale in the local and international markets.
ElEctricity tariffs componEnts grid Emission factor
pricE indicEs
Grid Emission Factor (GEF)
management
technician
Build margin (Bm) Emission Factor
Engineers
Corporate Service Staff
others
methane Emission Factor (mEF)
Technical Officer
trading Staff
Commercial Staff
The Grid Emission Factor measures average CO2 emission emitted per MWh of electricity. It is calculated using the Average Operating Margin (OM) method. This is the generation-weighted average CO2 emissions per unit net electricity generation of all generating power plants serving the system.
Management refers to Chief Executive Officer and Head of Division/Department/Section.
Technician refers to Senior Technician, Technician, Mechanic and Electrician.
The Build Margin Emission Factor refers to the generation-weighted average CO2 emissions per unit net electricity generation, of the set of five power units most recently built; and/or the set of power capacity additions that comprise 20% of system generation that have been built recently.
Engineers refer to Senior Engineer, Engineer, Executive Engineer, Principal Engineer, Shift Manager, Team Leader and Deputy Team Leader.
Corporate Service Staff refers to those in Finance, Human Resource, Legal, Administration, Information Technology and Corporate Communications.
“Others” include Assistant Technician, Semi-skilled Staff and Artisan and other occupations not elsewhere classified.
The Methane Emission Factor measures average CH4 emission emitted per MWh of the set of five power units as defined in the BM.
Technical Officer refers to Principal Technical Officer, Senior Technical Officer and Technical Officer.
Trading Staff refer to System Balance Trader, Position Trader and Quantitative Analyst.
Commercial Staff refers to Customer Accounts Manager, Business Analyst and those in Business Development, Sales and Marketing.
Job catEgoriEs for powEr sEctor EmployEEs

0 9 GLOSSARY S I N G A P O R E E N E R GY S TAT I S T I C S 2 016
12 2 12 3
Electrical technician
An electrical technician’s licence entitles the holder to carry out the following electrical work:
design, install, repair, maintain, operate, inspect, test and take full charge and responsibility for any electrical installation.
install, repair, maintain, operate, inspect and test an electrical installation where the operating voltage of such an installation does not exceed 1000 volts and the approved load of such installation does not exceed 500 kVA;
an electrical engineer’s licence has a range of operation voltage restrictions. They are as follows:-
design and submit plans and drawings of an electrical installation. The operating voltage of such an installation does not exceed 1000 volts and the approved load of such installation does not exceed 150 kVA. The limitation of 1000 volts shall not apply in the case of an Electric Discharge Lighting Circuit; and
carry out any work or switching operation as instructed by or under the supervision of an authorised high voltage switching engineer.
in operation : “up to 1000 volts”
a)
a)
b)
b)
c)
i.
in operation : “up to 22000 volts”ii.
in operation : “up to 66000 volts”iii.
in operation : “up to 230000 volts”iv.
restricted to particular installationsv.
Cable Detection workers
A licensed cable detection worker is entitled to perform cable detection work. To minimise damages to electricity cables, it is mandatory to perform cable detection work prior to the commencement of any earthworks.
Cable detection work must be carried out by a licensed cable detection worker. He should inform or advise the earthworks contractor, who engaged him, of the location of the cables detected within the worksite.
Gas Service worker (Restricted)
A gas service worker licence (restricted) entitles the holder to carry out the following gas service work where the operating pressure is not more than 30 mbar:
to install, maintain, repair and test gas appliances; and
to install or remove gas meters and to turn-on the gas supply on behalf of a gas licensee.
a)
b)
Electrician An electrician’s licence entitles the holder to carry out the following electrical work:
design, install, repair, maintain, operate, inspect and test an electrical/ supply installation where the operating voltage of such an installation does not exceed 1000 volts and the approved load of such installation does not exceed 45 kVA. The limitation of 1000 volts shall not apply in the case of an Electric Discharge Lighting Circuit;
install, repair, maintain and operate, under the supervision of an electrical technician. The operating voltage of the, electrical/supply installation should not exceed 1000 volts and the approved load of such installation should be more than 45 kVA but does not exceed 500 kVA; and
carry out any work as instructed by or under the supervision of an authorised high voltage switching engineer.
a)
b)
c)
Gas Service worker A gas service worker licence entitles the holder to carry out the following gas service work where the operating pressure is not more than 30 mbar:
to construct, fix, alter, repair and renew gas pipes and fittings;
to install, maintain, repair and test gas appliances; and
to install or remove gas meters and to turn-on the gas supply on behalf of a gas licensee.
a)
b)
c)
An electrical engineer’s licence entitles the holder to carry out the following electrical work:
licEnsEd ElEctrical, gas sErvicE and cablE dEtEction workErs
Electrical Engineer

0 9 GLOSSARY S I N G A P O R E E N E R GY S TAT I S T I C S 2 016
124 12 5

12 6
NotES
Comments on this publication and suggestions for further issues of SES are welcome. Please write to:
Research & Statistics unitPlanning Department
Energy Planning & Development DivisionEnergy market Authority
991G Alexandra Road #01/02-29, Singapore 119975
Republic of Singapore
E [email protected] +65 6835 8000F +65 6835 8020
Related Documents