Journal of Graph Algorithms and Applications http://jgaa.info/ vol. 9, no. 1, pp. 165–182 (2005) Simultaneous Graph Drawing: Layout Algorithms and Visualization Schemes C. Erten S. G. Kobourov V. Le A. Navabi Department of Computer Science University of Arizona {cesim,kobourov,vle,navabia}@cs.arizona.edu Abstract In this paper we consider the problem of drawing and displaying a series of related graphs, i.e., graphs that share all, or parts of the same node set. We present three algorithms for simultaneous graph drawing and three visualization schemes. The algorithms are based on a modifi- cation of the force-directed algorithm that allows us to take into account node weights and edge weights in order to achieve mental map preser- vation while obtaining individually readable drawings. The algorithms and visualization schemes have been implemented and the system can be downloaded at http://simg.cs.arizona.edu/. Article Type Communicated by Submitted Revised regular paper G. Liotta February 2004 July 2005 This work is partially supported by the NSF under grant ACR-0222920. An extended abstract of this paper appeared in GD 2003.

Welcome message from author
This document is posted to help you gain knowledge. Please leave a comment to let me know what you think about it! Share it to your friends and learn new things together.
Transcript
Journal of Graph Algorithms and Applicationshttp://jgaa.info/ vol. 9, no. 1, pp. 165–182 (2005)
Simultaneous Graph Drawing: Layout
Algorithms and Visualization Schemes
C. Erten S. G. Kobourov V. Le A. Navabi
Department of Computer ScienceUniversity of Arizona
{cesim,kobourov,vle,navabia}@cs.arizona.edu
Abstract
In this paper we consider the problem of drawing and displaying a
series of related graphs, i.e., graphs that share all, or parts of the same
node set. We present three algorithms for simultaneous graph drawing
and three visualization schemes. The algorithms are based on a modifi-
cation of the force-directed algorithm that allows us to take into account
node weights and edge weights in order to achieve mental map preser-
vation while obtaining individually readable drawings. The algorithms
and visualization schemes have been implemented and the system can be
downloaded at http://simg.cs.arizona.edu/.
Article Type Communicated by Submitted Revised
regular paper G. Liotta February 2004 July 2005
This work is partially supported by the NSF under grant ACR-0222920.
An extended abstract of this paper appeared in GD 2003.
C. Erten et al., Simultaneous Graph Drawing , JGAA, 9(1) 165–182 (2005) 166
1 Introduction
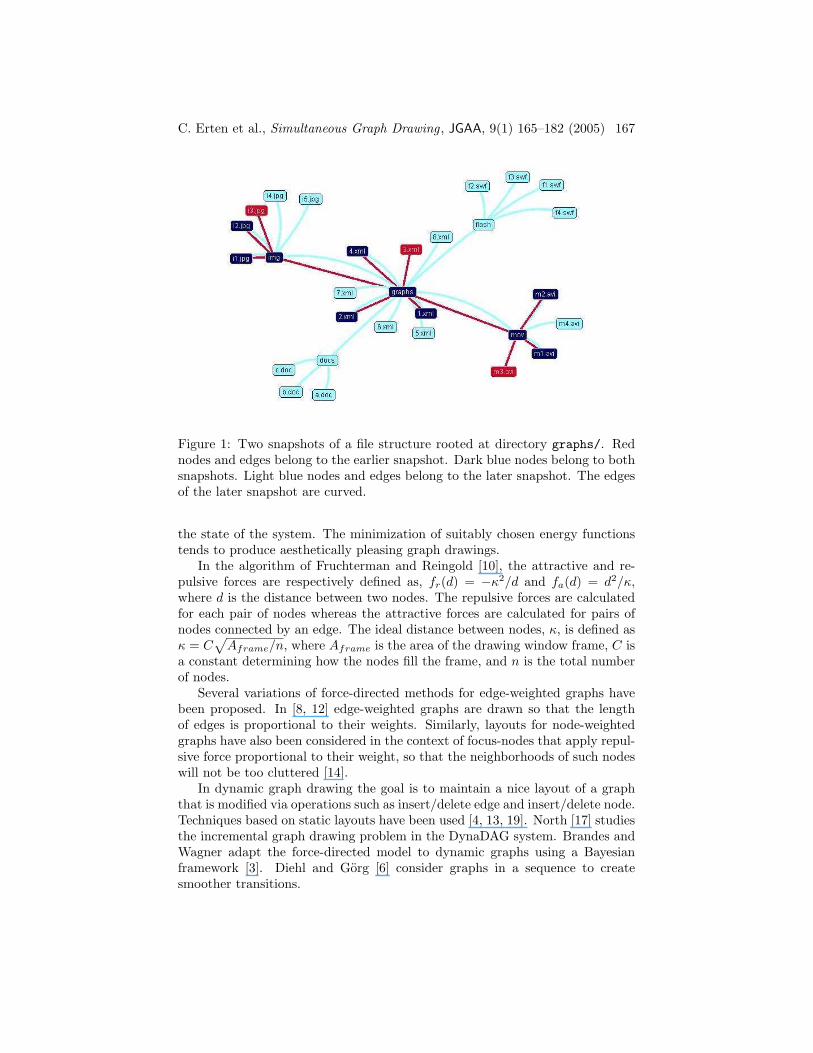
Consider the problem of drawing a series of graphs that share all, or parts ofthe same node set. The graphs may represent different relations between thesame set of objects. For example, in social networks, graphs are often usedto represent different relations between the same set of entities. Alternatively,the graphs may be the result of a single relation that changes through time.For example, in software visualization, the inheritance graph in a Java programchanges as the program is being developed. Consider the graphs in Fig. 1. Thereare two simultaneously displayed graphs that represent two snapshots of a filesystem structure rooted at the directory graphs/. The drawing conveys wellboth underlying structures and it is easy to identify the changes between thetwo snapshots.
In this paper, we attempt to address the following problem: Given a seriesof graphs that share all, or parts of the same node set, what is a natural wayto layout and display them? The layout and display of the graphs are differentaspects of the problem, but also closely related, as a particular layout algorithmis likely to be matched best with a specific visualization technique. As statedabove, however, the problem is too general and it is unlikely that one particularlayout algorithm will be best for all possible scenarios. Consider the case wherewe only have a pair of graphs in the series, and the case where we have hundredsof related graphs. The “best” way to layout and display the two series is likelygoing to be different. Similarly, if the graphs in the sequence are very closelyrelated or not related at all, different layout and display techniques may be moreappropriate. With this in mind, we consider several different algorithms andvisualization models.
For the layout of the graphs, there are two important criteria to consider:the readability of the individual layouts and the mental map preservation inthe series of drawings. The readability of individual drawings depends on aes-thetic criteria such as display of symmetries, uniform edge lengths, and minimalnumber of crossings [18]. Preservation of the mental map can be achieved byensuring that common substructures (nodes, edges, subgraphs etc.) that appearin consecutive graphs in the series, are drawn in a similar fashion [16]. Thesetwo criteria are often contradictory. If we individually layout each graph, with-out regard to other graphs in the series, we may optimize readability at theexpense of mental map preservation. Conversely, if we fix the node positions inall graphs and draw common edges the same way, we are optimizing the mentalmap preservation but the individual layouts may be far from readable.
1.1 Related Work
Classical force-directed methods [1] for graph drawing typically begin with aninitial random placement of the nodes inside a drawing window frame of pre-specified size. The graph is then treated as a system of interacting physicalobjects, based on attractive and repulsive forces [10] or graph distances [15].Force-directed layout algorithms employ an energy function that characterizes
C. Erten et al., Simultaneous Graph Drawing , JGAA, 9(1) 165–182 (2005) 167
Figure 1: Two snapshots of a file structure rooted at directory graphs/. Rednodes and edges belong to the earlier snapshot. Dark blue nodes belong to bothsnapshots. Light blue nodes and edges belong to the later snapshot. The edgesof the later snapshot are curved.
the state of the system. The minimization of suitably chosen energy functionstends to produce aesthetically pleasing graph drawings.
In the algorithm of Fruchterman and Reingold [10], the attractive and re-pulsive forces are respectively defined as, fr(d) = −κ2/d and fa(d) = d2/κ,where d is the distance between two nodes. The repulsive forces are calculatedfor each pair of nodes whereas the attractive forces are calculated for pairs ofnodes connected by an edge. The ideal distance between nodes, κ, is defined asκ = C
√
Aframe/n, where Aframe is the area of the drawing window frame, C isa constant determining how the nodes fill the frame, and n is the total numberof nodes.
Several variations of force-directed methods for edge-weighted graphs havebeen proposed. In [8, 12] edge-weighted graphs are drawn so that the lengthof edges is proportional to their weights. Similarly, layouts for node-weightedgraphs have also been considered in the context of focus-nodes that apply repul-sive force proportional to their weight, so that the neighborhoods of such nodeswill not be too cluttered [14].
In dynamic graph drawing the goal is to maintain a nice layout of a graphthat is modified via operations such as insert/delete edge and insert/delete node.Techniques based on static layouts have been used [4, 13, 19]. North [17] studiesthe incremental graph drawing problem in the DynaDAG system. Brandes andWagner adapt the force-directed model to dynamic graphs using a Bayesianframework [3]. Diehl and Gorg [6] consider graphs in a sequence to createsmoother transitions.
C. Erten et al., Simultaneous Graph Drawing , JGAA, 9(1) 165–182 (2005) 168
Brandes and Corman [2] present a system for visualizing network evolutionin which each modification is shown in a separate layer of 3D representationwith nodes common to two layers represented as columns connecting the layers.Thus, mental map preservation is achieved by precomputing good locations forthe nodes and fixing the position throughout the layers. Dwyer and Eades [7]describe a method for visualizing time dependent flow in a network of objects byrepresenting time as the third dimension, using columns of varying width. Alongthese lines, Collberg et al [5] describe a graph-based system for visualization ofsoftware evolution, while preserving the mental map by fixing the locations ofall common nodes in the evolving graph.
1.2 Our Contributions
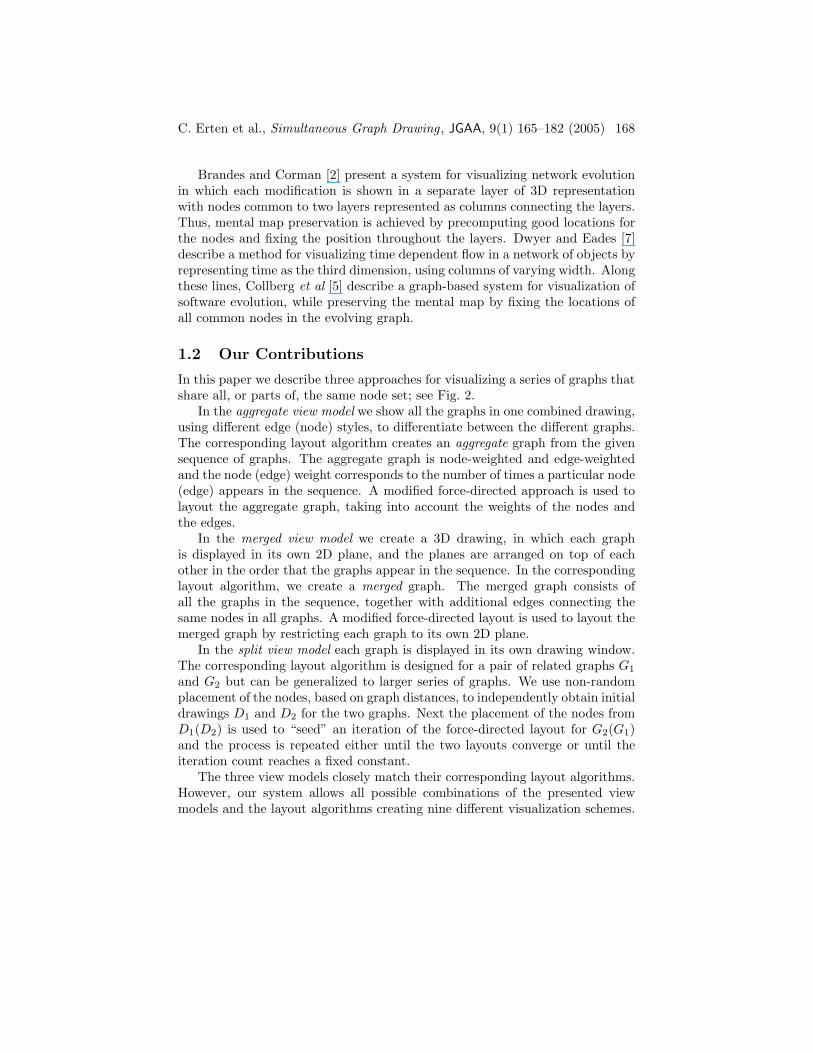
In this paper we describe three approaches for visualizing a series of graphs thatshare all, or parts of, the same node set; see Fig. 2.
In the aggregate view model we show all the graphs in one combined drawing,using different edge (node) styles, to differentiate between the different graphs.The corresponding layout algorithm creates an aggregate graph from the givensequence of graphs. The aggregate graph is node-weighted and edge-weightedand the node (edge) weight corresponds to the number of times a particular node(edge) appears in the sequence. A modified force-directed approach is used tolayout the aggregate graph, taking into account the weights of the nodes andthe edges.
In the merged view model we create a 3D drawing, in which each graphis displayed in its own 2D plane, and the planes are arranged on top of eachother in the order that the graphs appear in the sequence. In the correspondinglayout algorithm, we create a merged graph. The merged graph consists ofall the graphs in the sequence, together with additional edges connecting thesame nodes in all graphs. A modified force-directed layout is used to layout themerged graph by restricting each graph to its own 2D plane.
In the split view model each graph is displayed in its own drawing window.The corresponding layout algorithm is designed for a pair of related graphs G1
and G2 but can be generalized to larger series of graphs. We use non-randomplacement of the nodes, based on graph distances, to independently obtain initialdrawings D1 and D2 for the two graphs. Next the placement of the nodes fromD1(D2) is used to “seed” an iteration of the force-directed layout for G2(G1)and the process is repeated either until the two layouts converge or until theiteration count reaches a fixed constant.
The three view models closely match their corresponding layout algorithms.However, our system allows all possible combinations of the presented viewmodels and the layout algorithms creating nine different visualization schemes.
C. Erten et al., Simultaneous Graph Drawing , JGAA, 9(1) 165–182 (2005) 169
a bd c
ad
bc
a b
d c
a b
d c
a b
d c
(a) (b) (c)
e
e e
Figure 2: Layout and visualization: (a) aggregate; (b) merged; (c) split.
2 Modified Force-Directed Method
The first two algorithms presented in Sections 3 and 4 rely on a modification ofthe force-directed method by Fruchterman and Reingold [10]. This modificationcan be thought of as an extension of the traditional algorithm, that takes intoaccount node weights and edge weights in the force calculations. Thus, weassume that the input graphs in the series are simple unweighted graphs andwe are free to assign appropriately chosen weights.
Given a series of graphs G1, G2, . . . , Gk, we create a graph GAlg = (VAlg, EAlg)such that both the nodes and the edges are assigned weights. Depending on thelayout algorithm (either Aggregate or Merged), we provide two different con-structions for GAlg. The next two sections provide further details on theseconstructions. We use the node and edge weights to modify the standard force-directed algorithm as follows. If a node v ∈ VAlg has large weight then it isplaced close to the center in the final layout. If an edge (u, v) ∈ EAlg has largeweight then the nodes u and v are placed close to each other in the final layout.This is a simple heuristic, but it ensures that:
• persistent nodes remain close to the center of the layout, while transientnodes are placed on the periphery;
• nodes that are adjacent in many of the graphs in the series are placedclose together.
In order to handle the node weights, we place a dummy node in the center ofthe frame and ensure that it attracts all the other nodes in proportion to theirweights. We formulate this new central attraction force as, fca(v) = d2×w(v)/κ,where w(v) is the weight of the node, d is its distance from the center and κ isthe ideal distance.
To handle edge weights, we scale the attractive forces by their edge weightsand the new formulation of the attractive forces becomes, fa(e) = d2 ×w(e)/κ,where w(e) is the weight of the edge e. If two nodes are connected by anedge with weight 0, then the modified algorithm treats them as if they are notconnected at all.
C. Erten et al., Simultaneous Graph Drawing , JGAA, 9(1) 165–182 (2005) 170
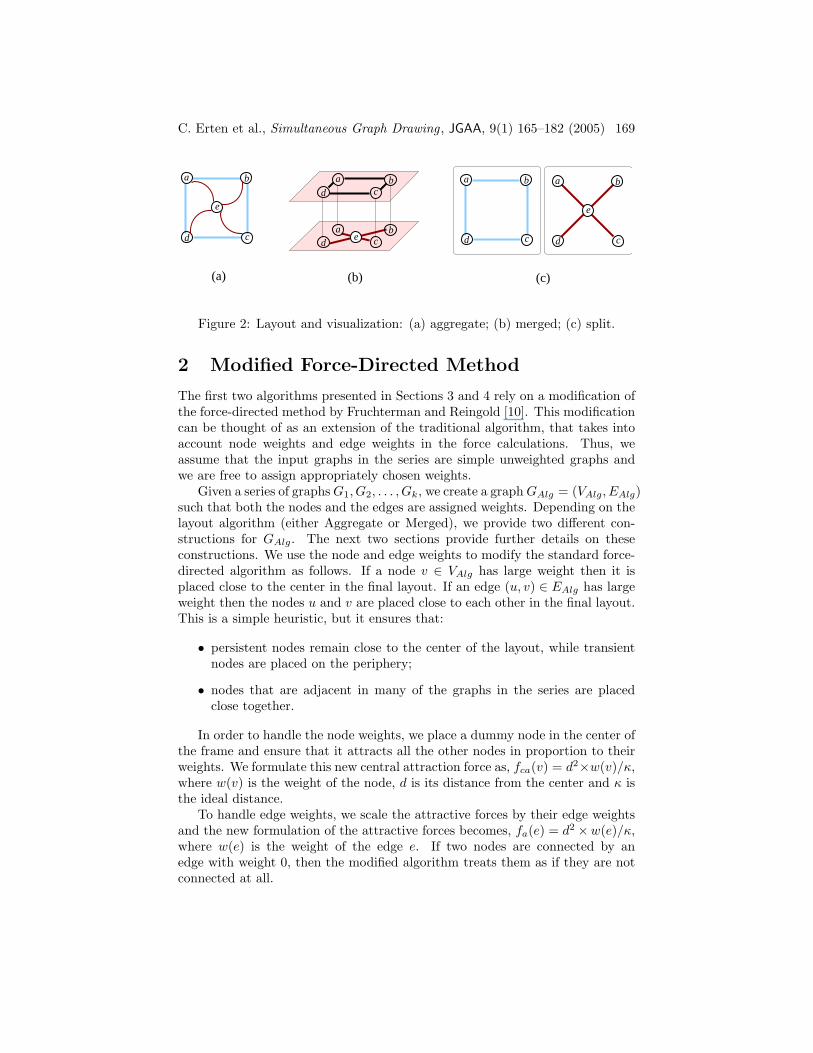
Figure 3: Left: Individual layout of P7 drawn with curved edges. Middle:Individual layout of K7 drawn with straight-line segments. Right: Simultaneousembedding of P7 and K7 obtained from the aggregate layout method.
3 Aggregate Graph Layout and Visualization
This algorithm and its matching visualization scheme combine all the relatedgraphs into a single drawing. The location of the nodes is fixed for all graphsthus perfectly preserving the mental map (possibly at the expense of readabilityof the individual graphs). The edges of different graphs are distinguished byemploying different edge styles. This algorithm/visualization combination ismost suitable when dealing with a small number of graphs or when the graphsare very similar to each other.
3.1 Aggregate View Visualization
In the aggregate view we only display a node once, even though it may appear inmultiple graphs and we display all edges from all the graphs in the sequence; seeFig. 3. The graphs can be displayed in 2D or 3D and we employ different edgecolors and edge styles to differentiate between the different graphs. Displayingall graphs using a single node set allows the viewer to see multiple graphs at thesame time and view the difference in relationships more easily. Different edgecolors and edge styles are used to distinguish between the relationships fromeach graph. For example in Fig. 3 the edges of one graph are drawn with greenstraight line segments, whereas the other graph is drawn with thicker curvededges in a different shade of green.
3.2 Aggregate Layout Algorithm
In the aggregate graph layout method we begin by creating the node-weightedand edge-weighted graph GAlg = (VAlg, EAlg) from the sequence of graphs,G1, G2, . . . , Gk, as follows: A node v ∈ VAlg has weight w(v), where w(v) is thenumber of times it appears in the series. An edge e ∈ EAlg has weight w(e),where w(e) is the number of times it appears in the series. We then apply themodified force-directed layout algorithm to obtain a drawing for GAlg. From
C. Erten et al., Simultaneous Graph Drawing , JGAA, 9(1) 165–182 (2005) 171
this drawing we extract the drawings of each individual graph in the series.Thus, nodes and edges that are present more than once in the series are inthe same position in all graphs that they appear in. This approach guaranteesmental map preservation, possibly at the expense of good readability. Yet, if agraph Gi has many nodes/edges that exist in most of the graphs in the series,then Gi is an important graph and the resulting layout will be similar to thatof an independent layout of Gi.
Fig. 3 shows the simultaneous layout of K7, the complete graph on sevennodes and P7, the path with seven nodes. The edges that belong to the path aredrawn using curved and thick edges. Note that although an individual layoutof K7 would place one of the nodes in the middle, the simultaneous embeddingwith the aggregate layout method pushes that node out because of the presenceof the path. A summary of the aggregate graph layout algorithm is in Fig. 4.
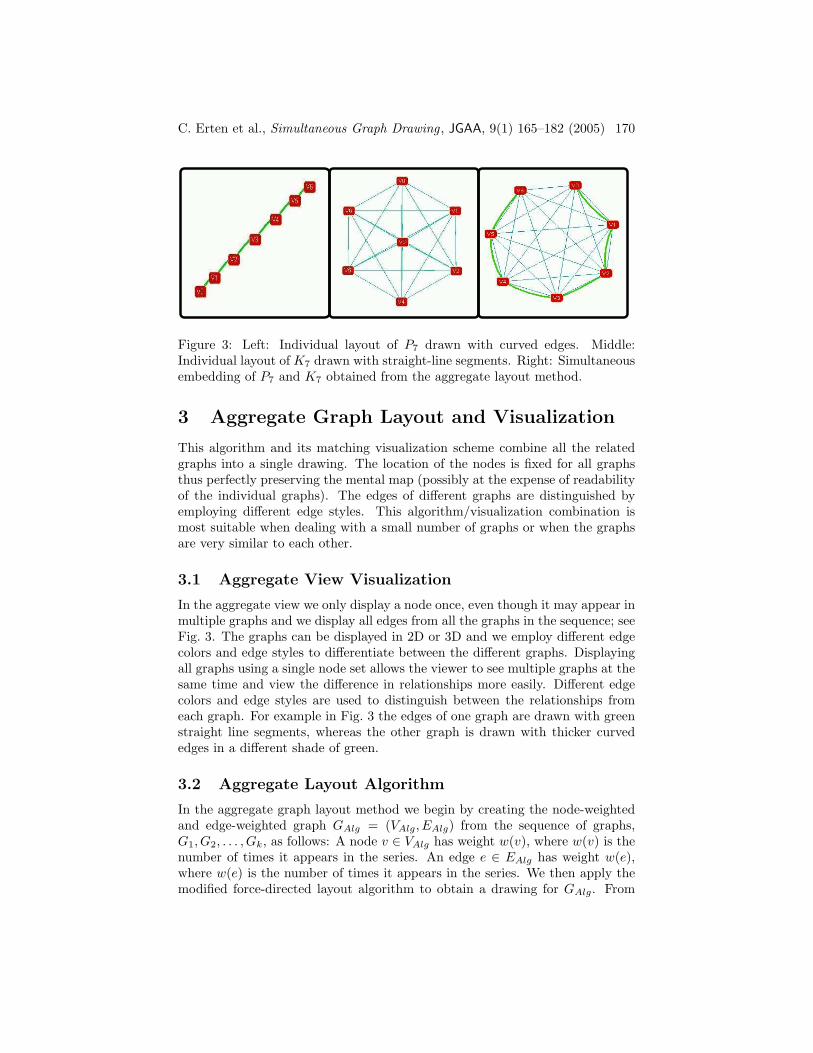
Aggregate Graph Layout
1 Construct GAlg = (VAlg, EAlg):VAlg = V1 ∪ V2 ∪ . . . ∪ Vk, EAlg = E1 ∪ E2 ∪ . . . ∪ Ek
2 Assign weights to each v ∈ VAlg and (u, v) ∈ EAlg:w(v) = number of appearances of v in V1, V2, . . . , Vk
w(u, v) = number of appearances of (u, v) in E1, E2, . . . , Ek
3 Use the modified force-directed layout algorithm on GAlg
4 Extract the layout of each Gi from the layout of GAlg
Figure 4: Aggregate Graph Layout. G1, G2, . . . , Gk are the input graphs.
4 Merged Graph Layout and Visualization
This algorithm and its matching visualization scheme is the most flexible ofour algorithm/visualization combinations. All the graphs in the series aredrawn, and the drawings are closely related and influence each other via edgesconnecting the same nodes on different planes. As the most flexible algo-rithm/visualization combination it is effective in most cases.
4.1 Merged View Visualization
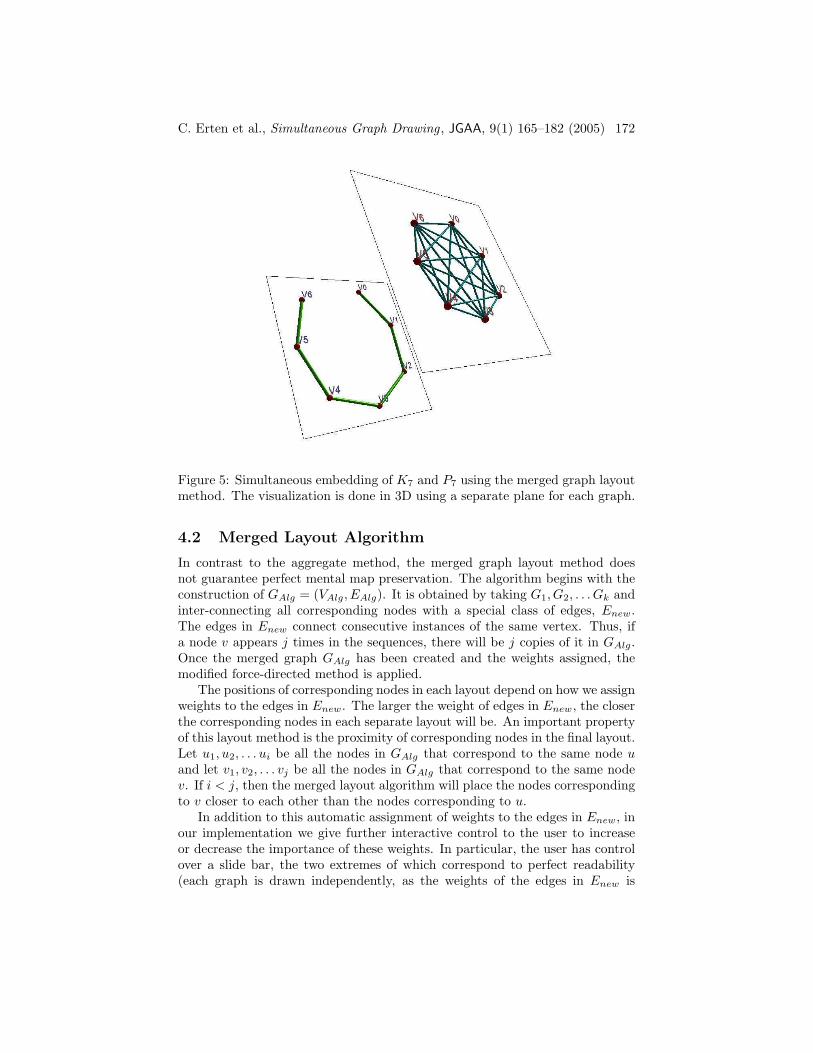
In the merged view each of the graphs is drawn on its separate 2D plane, andthe planes are layered in 3D in the order of appearance; see Fig. 5. All thegraphs are shown on the same screen such that corresponding nodes in adjacentdrawings have approximately the same positions on their planes. This modelprovides a clear mental mapping between the drawings of each graph. Moreoverthe balance between mental map preservation and individual graph readabilitycan be interactively controlled. In our implementation, the user has full 3Dcontrol over the view, can move and rotate the view and zoom in and out.
C. Erten et al., Simultaneous Graph Drawing , JGAA, 9(1) 165–182 (2005) 172
Figure 5: Simultaneous embedding of K7 and P7 using the merged graph layoutmethod. The visualization is done in 3D using a separate plane for each graph.
4.2 Merged Layout Algorithm
In contrast to the aggregate method, the merged graph layout method doesnot guarantee perfect mental map preservation. The algorithm begins with theconstruction of GAlg = (VAlg, EAlg). It is obtained by taking G1, G2, . . . Gk andinter-connecting all corresponding nodes with a special class of edges, Enew.The edges in Enew connect consecutive instances of the same vertex. Thus, ifa node v appears j times in the sequences, there will be j copies of it in GAlg.Once the merged graph GAlg has been created and the weights assigned, themodified force-directed method is applied.
The positions of corresponding nodes in each layout depend on how we assignweights to the edges in Enew. The larger the weight of edges in Enew, the closerthe corresponding nodes in each separate layout will be. An important propertyof this layout method is the proximity of corresponding nodes in the final layout.Let u1, u2, . . . ui be all the nodes in GAlg that correspond to the same node uand let v1, v2, . . . vj be all the nodes in GAlg that correspond to the same nodev. If i < j, then the merged layout algorithm will place the nodes correspondingto v closer to each other than the nodes corresponding to u.
In addition to this automatic assignment of weights to the edges in Enew, inour implementation we give further interactive control to the user to increaseor decrease the importance of these weights. In particular, the user has controlover a slide bar, the two extremes of which correspond to perfect readability(each graph is drawn independently, as the weights of the edges in Enew is
C. Erten et al., Simultaneous Graph Drawing , JGAA, 9(1) 165–182 (2005) 173
0) and perfect mental map preservation (corresponding nodes are fixed in thesame position in all graphs in the series). Fig. 5 illustrates the simultaneousembedding resulting from the merged graph layout of K7 and P7. Note thatalthough the locations of the corresponding nodes might not be the same, themental map is still preserved since the relative locations of the correspondingnodes remain the same. A summary of the merged graph layout algorithm is inFig. 6.
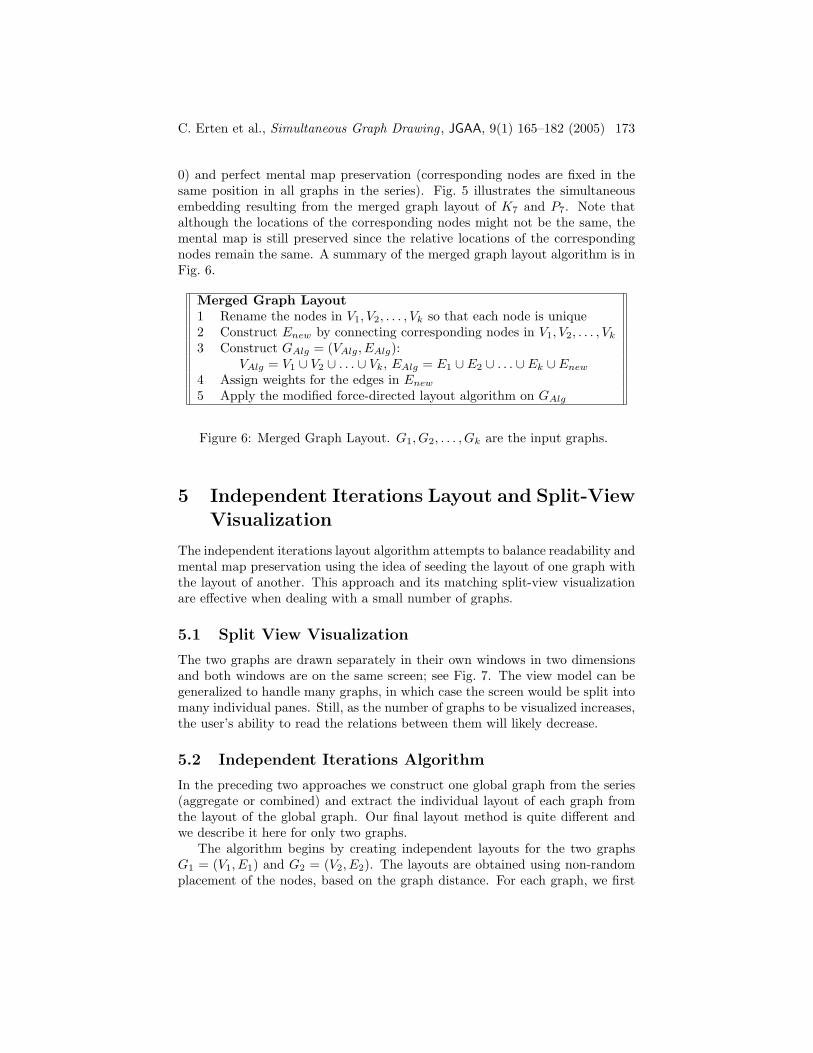
Merged Graph Layout
1 Rename the nodes in V1, V2, . . . , Vk so that each node is unique2 Construct Enew by connecting corresponding nodes in V1, V2, . . . , Vk
3 Construct GAlg = (VAlg, EAlg):VAlg = V1 ∪ V2 ∪ . . . ∪ Vk, EAlg = E1 ∪ E2 ∪ . . . ∪ Ek ∪ Enew
4 Assign weights for the edges in Enew
5 Apply the modified force-directed layout algorithm on GAlg
Figure 6: Merged Graph Layout. G1, G2, . . . , Gk are the input graphs.
5 Independent Iterations Layout and Split-View
Visualization
The independent iterations layout algorithm attempts to balance readability andmental map preservation using the idea of seeding the layout of one graph withthe layout of another. This approach and its matching split-view visualizationare effective when dealing with a small number of graphs.
5.1 Split View Visualization
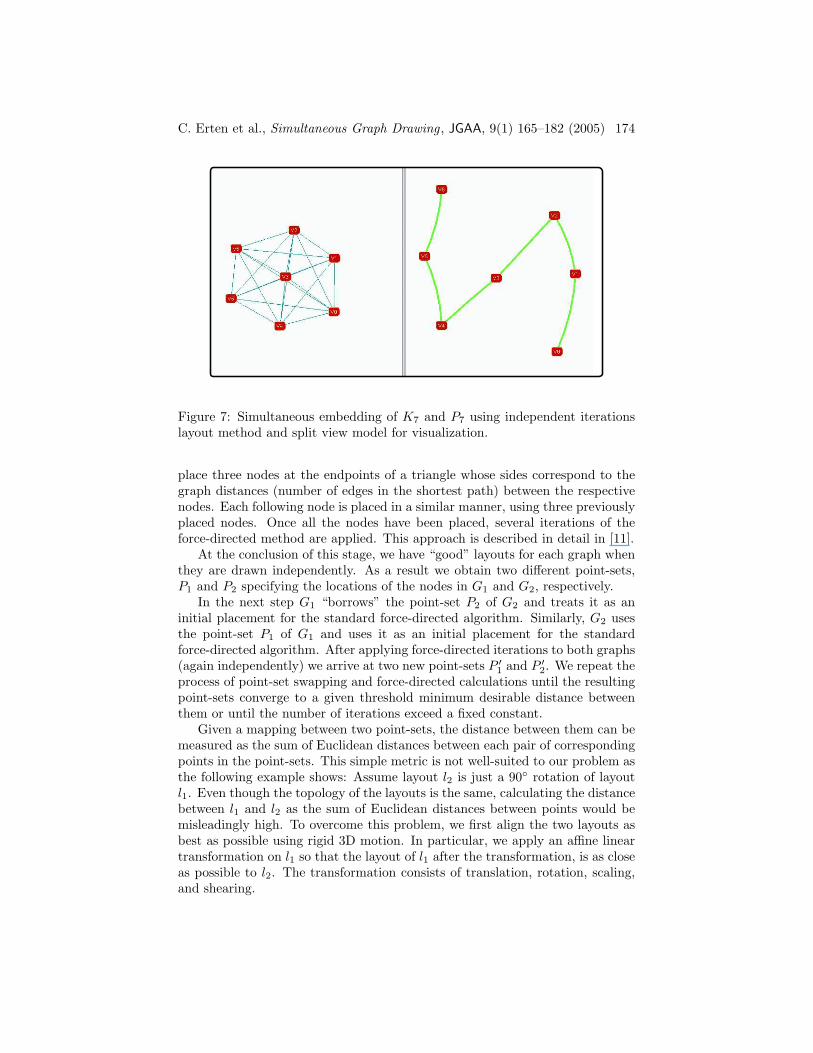
The two graphs are drawn separately in their own windows in two dimensionsand both windows are on the same screen; see Fig. 7. The view model can begeneralized to handle many graphs, in which case the screen would be split intomany individual panes. Still, as the number of graphs to be visualized increases,the user’s ability to read the relations between them will likely decrease.
5.2 Independent Iterations Algorithm
In the preceding two approaches we construct one global graph from the series(aggregate or combined) and extract the individual layout of each graph fromthe layout of the global graph. Our final layout method is quite different andwe describe it here for only two graphs.
The algorithm begins by creating independent layouts for the two graphsG1 = (V1, E1) and G2 = (V2, E2). The layouts are obtained using non-randomplacement of the nodes, based on the graph distance. For each graph, we first
C. Erten et al., Simultaneous Graph Drawing , JGAA, 9(1) 165–182 (2005) 174
Figure 7: Simultaneous embedding of K7 and P7 using independent iterationslayout method and split view model for visualization.
place three nodes at the endpoints of a triangle whose sides correspond to thegraph distances (number of edges in the shortest path) between the respectivenodes. Each following node is placed in a similar manner, using three previouslyplaced nodes. Once all the nodes have been placed, several iterations of theforce-directed method are applied. This approach is described in detail in [11].
At the conclusion of this stage, we have “good” layouts for each graph whenthey are drawn independently. As a result we obtain two different point-sets,P1 and P2 specifying the locations of the nodes in G1 and G2, respectively.
In the next step G1 “borrows” the point-set P2 of G2 and treats it as aninitial placement for the standard force-directed algorithm. Similarly, G2 usesthe point-set P1 of G1 and uses it as an initial placement for the standardforce-directed algorithm. After applying force-directed iterations to both graphs(again independently) we arrive at two new point-sets P ′
1and P ′
2. We repeat the
process of point-set swapping and force-directed calculations until the resultingpoint-sets converge to a given threshold minimum desirable distance betweenthem or until the number of iterations exceed a fixed constant.
Given a mapping between two point-sets, the distance between them can bemeasured as the sum of Euclidean distances between each pair of correspondingpoints in the point-sets. This simple metric is not well-suited to our problem asthe following example shows: Assume layout l2 is just a 90◦ rotation of layoutl1. Even though the topology of the layouts is the same, calculating the distancebetween l1 and l2 as the sum of Euclidean distances between points would bemisleadingly high. To overcome this problem, we first align the two layouts asbest as possible using rigid 3D motion. In particular, we apply an affine lineartransformation on l1 so that the layout of l1 after the transformation, is as closeas possible to l2. The transformation consists of translation, rotation, scaling,and shearing.
C. Erten et al., Simultaneous Graph Drawing , JGAA, 9(1) 165–182 (2005) 175
Fig. 7 shows the simultaneous embedding of K7 and P7 resulting from inde-pendent iterations layout using the split view, described below. Note that theresulting layout for each graph is not the same as an individual layout for thatgraph. Instead, the independent iterations layout is a compromise between thetwo individual layouts. A summary of the layout algorithm is in Fig. 8.
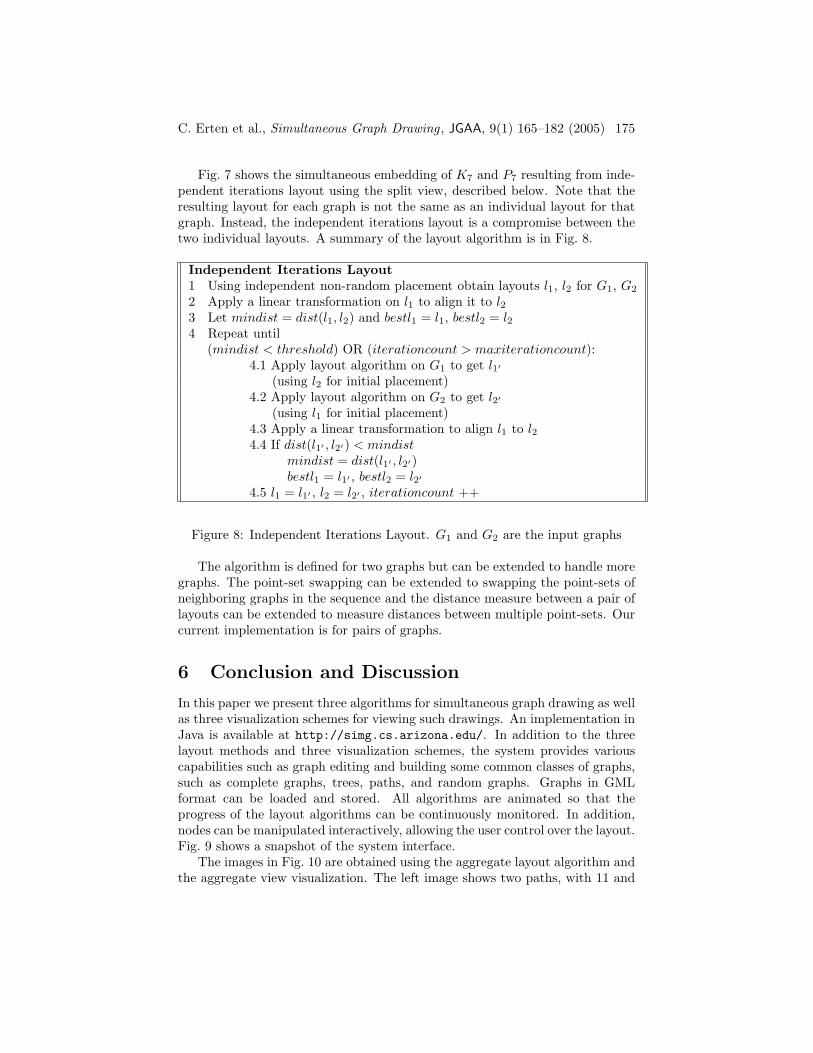
Independent Iterations Layout
1 Using independent non-random placement obtain layouts l1, l2 for G1, G2
2 Apply a linear transformation on l1 to align it to l23 Let mindist = dist(l1, l2) and bestl1 = l1, bestl2 = l24 Repeat until
(mindist < threshold) OR (iterationcount > maxiterationcount):4.1 Apply layout algorithm on G1 to get l1′
(using l2 for initial placement)4.2 Apply layout algorithm on G2 to get l2′
(using l1 for initial placement)4.3 Apply a linear transformation to align l1 to l24.4 If dist(l1′ , l2′) < mindist
mindist = dist(l1′ , l2′)bestl1 = l1′ , bestl2 = l2′
4.5 l1 = l1′ , l2 = l2′ , iterationcount ++
Figure 8: Independent Iterations Layout. G1 and G2 are the input graphs
The algorithm is defined for two graphs but can be extended to handle moregraphs. The point-set swapping can be extended to swapping the point-sets ofneighboring graphs in the sequence and the distance measure between a pair oflayouts can be extended to measure distances between multiple point-sets. Ourcurrent implementation is for pairs of graphs.
6 Conclusion and Discussion
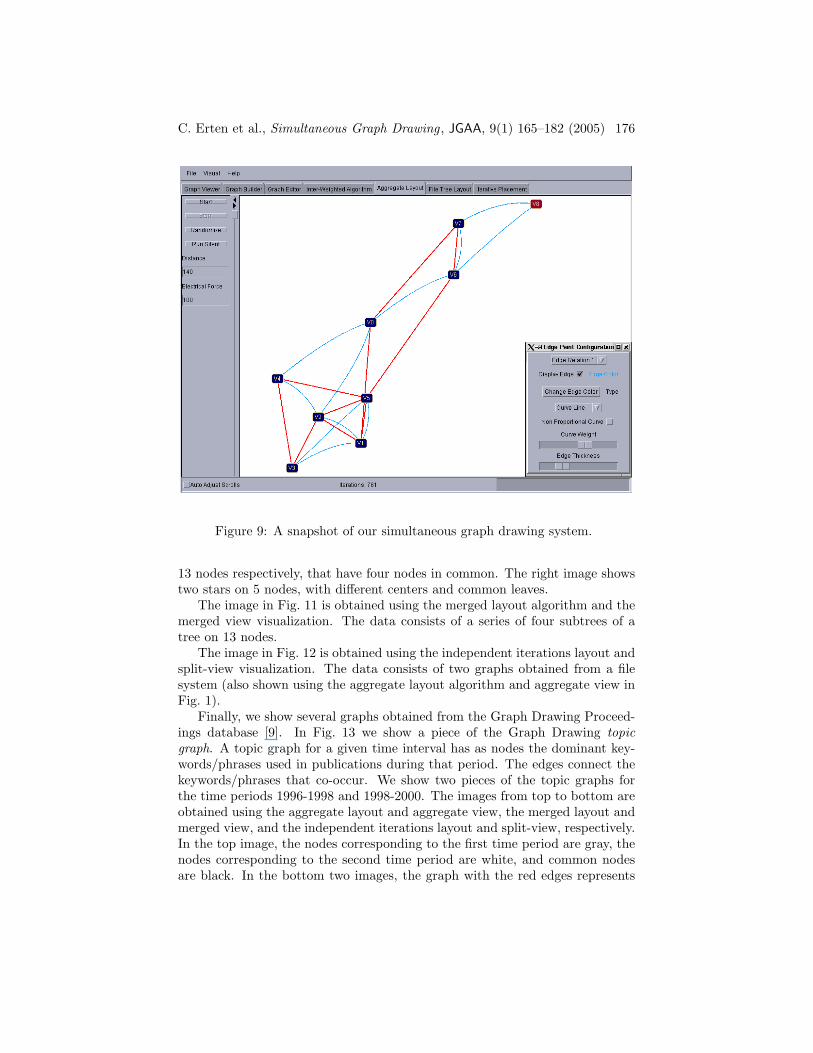
In this paper we present three algorithms for simultaneous graph drawing as wellas three visualization schemes for viewing such drawings. An implementation inJava is available at http://simg.cs.arizona.edu/. In addition to the threelayout methods and three visualization schemes, the system provides variouscapabilities such as graph editing and building some common classes of graphs,such as complete graphs, trees, paths, and random graphs. Graphs in GMLformat can be loaded and stored. All algorithms are animated so that theprogress of the layout algorithms can be continuously monitored. In addition,nodes can be manipulated interactively, allowing the user control over the layout.Fig. 9 shows a snapshot of the system interface.
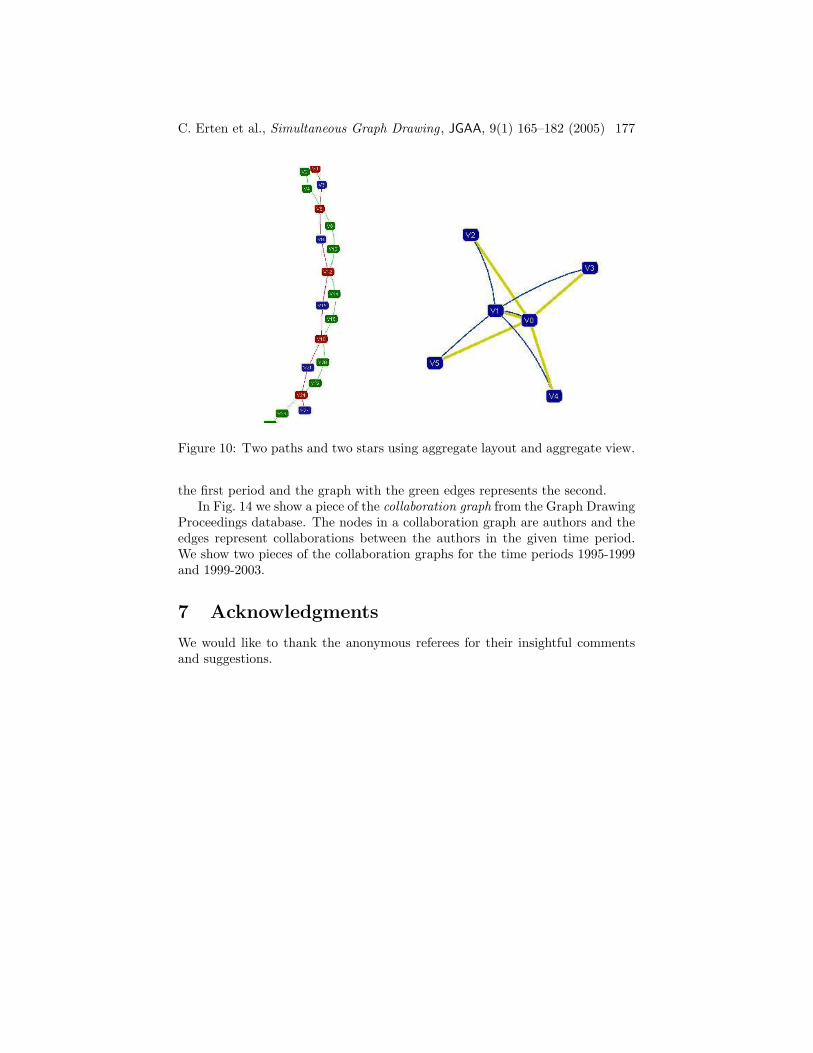
The images in Fig. 10 are obtained using the aggregate layout algorithm andthe aggregate view visualization. The left image shows two paths, with 11 and
C. Erten et al., Simultaneous Graph Drawing , JGAA, 9(1) 165–182 (2005) 176
Figure 9: A snapshot of our simultaneous graph drawing system.
13 nodes respectively, that have four nodes in common. The right image showstwo stars on 5 nodes, with different centers and common leaves.
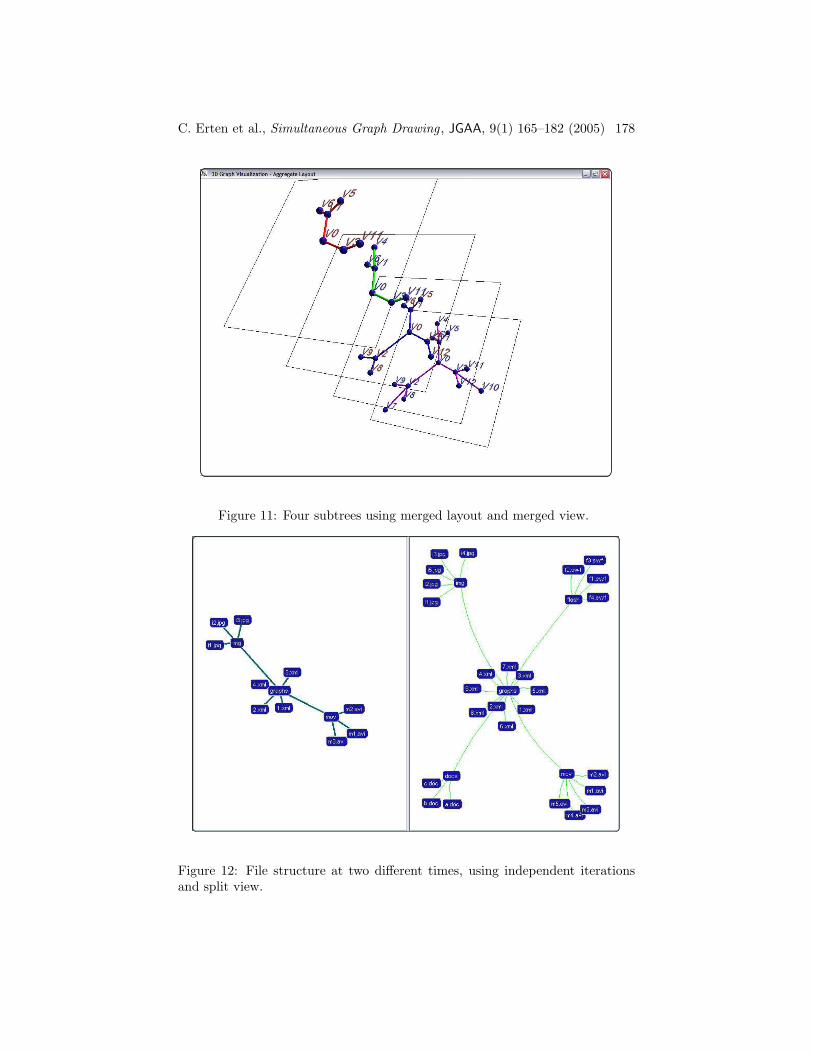
The image in Fig. 11 is obtained using the merged layout algorithm and themerged view visualization. The data consists of a series of four subtrees of atree on 13 nodes.
The image in Fig. 12 is obtained using the independent iterations layout andsplit-view visualization. The data consists of two graphs obtained from a filesystem (also shown using the aggregate layout algorithm and aggregate view inFig. 1).
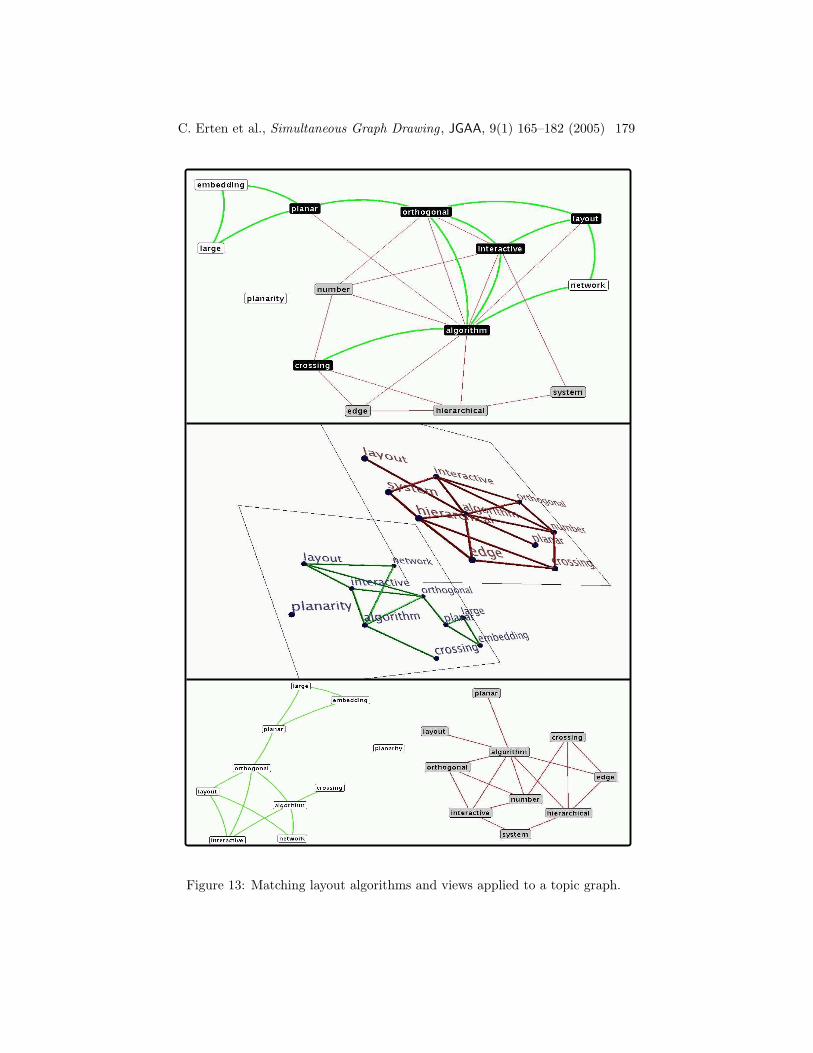
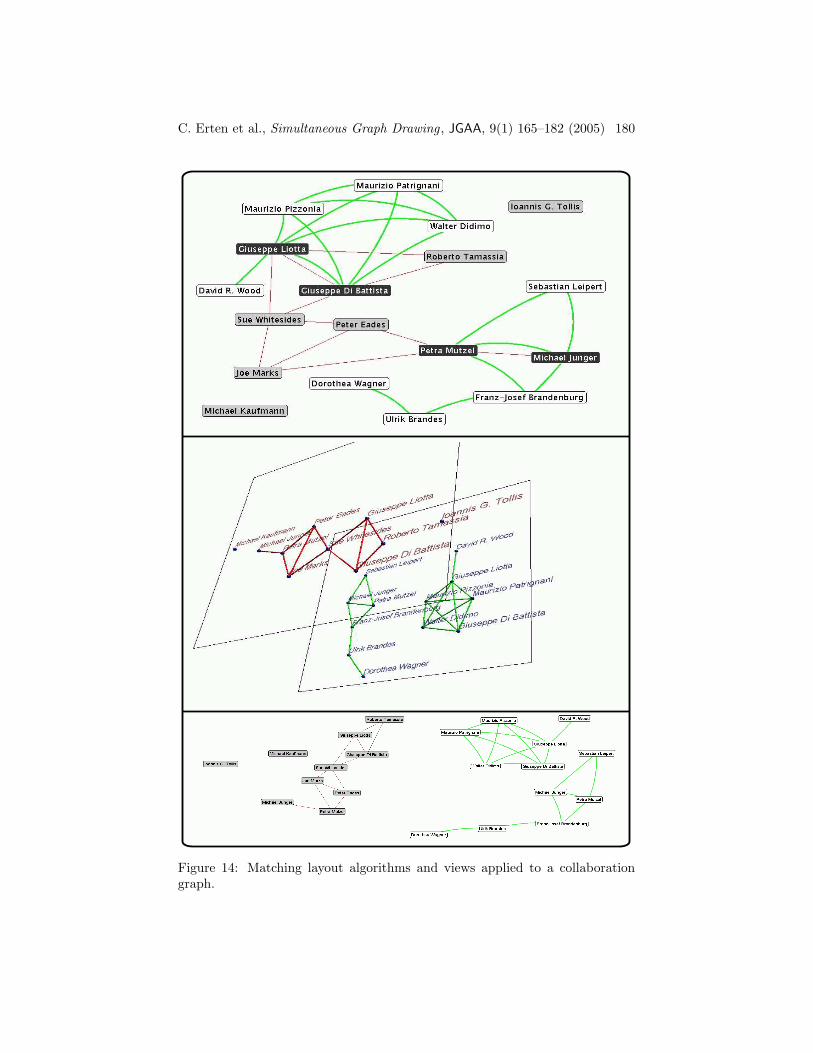
Finally, we show several graphs obtained from the Graph Drawing Proceed-ings database [9]. In Fig. 13 we show a piece of the Graph Drawing topicgraph. A topic graph for a given time interval has as nodes the dominant key-words/phrases used in publications during that period. The edges connect thekeywords/phrases that co-occur. We show two pieces of the topic graphs forthe time periods 1996-1998 and 1998-2000. The images from top to bottom areobtained using the aggregate layout and aggregate view, the merged layout andmerged view, and the independent iterations layout and split-view, respectively.In the top image, the nodes corresponding to the first time period are gray, thenodes corresponding to the second time period are white, and common nodesare black. In the bottom two images, the graph with the red edges represents
C. Erten et al., Simultaneous Graph Drawing , JGAA, 9(1) 165–182 (2005) 177
Figure 10: Two paths and two stars using aggregate layout and aggregate view.
the first period and the graph with the green edges represents the second.In Fig. 14 we show a piece of the collaboration graph from the Graph Drawing
Proceedings database. The nodes in a collaboration graph are authors and theedges represent collaborations between the authors in the given time period.We show two pieces of the collaboration graphs for the time periods 1995-1999and 1999-2003.
7 Acknowledgments
We would like to thank the anonymous referees for their insightful commentsand suggestions.
C. Erten et al., Simultaneous Graph Drawing , JGAA, 9(1) 165–182 (2005) 178
Figure 11: Four subtrees using merged layout and merged view.
Figure 12: File structure at two different times, using independent iterationsand split view.
C. Erten et al., Simultaneous Graph Drawing , JGAA, 9(1) 165–182 (2005) 179
Figure 13: Matching layout algorithms and views applied to a topic graph.
C. Erten et al., Simultaneous Graph Drawing , JGAA, 9(1) 165–182 (2005) 180
Figure 14: Matching layout algorithms and views applied to a collaborationgraph.
C. Erten et al., Simultaneous Graph Drawing , JGAA, 9(1) 165–182 (2005) 181
References
[1] U. Brandes. Drawing on physical analogies. In M. Kaufmann and D. Wag-ner, editors, Drawing Graphs, volume 2025 of Lecture Notes in ComputerScience, pages 71–86. Springer-Verlag, 2001.
[2] U. Brandes and S. R. Corman. Visual unrolling of network evolution andthe analysis of dynamic discourse. In IEEE Symposium on InformationVisualization (INFOVIS ’02), pages 145–151, 2002.
[3] U. Brandes and D. Wagner. A bayesian paradigm for dynamic graph layout.In Proceedings of the 5th Symposium on Graph Drawing (GD), volume 1353of LNCS, pages 236–247, 1998.
[4] J. Branke. Dynamic graph drawing. In M. Kaufmann and D. Wagner,editors, Drawing Graphs: Methods and Models, number 2025 in LNCS,chapter 9, pages 228–246. Springer-Verlag, Berlin, Germany, 2001.
[5] C. Collberg, S. G. Kobourov, J. Nagra, J. Pitts, and K. Wampler. Asystem for graph-based visualization of the evolution of software. In ACMSymposium on Software Visualization, pages 77–86, 2003.
[6] S. Diehl and C. Gorg. Graphs, they are changing. In Proceedings of the10th Symposium on Graph Drawing (GD), pages 23–30, 2002.
[7] T. Dwyer and P. Eades. Visualising a fund manager flow graph withcolumns and worms. In Proceedings of the 6th International Conferenceon Information Visualisation, IV02, pages 147–158. IEEE Computer Soci-ety, 2002.
[8] P. Eades and C. F. X. de Mendonca Neto. Vertex splitting and tension-free layout. In Graph Drawing, volume 1027 of Lecture Notes in ComputerScience, pages 202–211. Springer, 1996.
[9] C. Erten, P. J. Harding, S. G. Kobourov, K. Wampler, and G. Yee.GraphAEL: Graph animations with evolving layouts. In 11th Symposiumon Graph Drawing, pages 98–110, 2003.
[10] T. Fruchterman and E. Reingold. Graph drawing by force-directed place-ment. Softw. – Pract. Exp., 21(11):1129–1164, 1991.
[11] P. Gajer and S. G. Kobourov. GRIP: Graph dRawing with IntelligentPlacement. Journal of Graph Algorithms and Applications, 6(3):203–224,2002.
[12] D. Harel and Y. Koren. Drawing graphs with non-uniform vertices. InProceedings of Working Conference on Advanced Visual Interfaces, pages157–166, 2002.
C. Erten et al., Simultaneous Graph Drawing , JGAA, 9(1) 165–182 (2005) 182
[13] Herman, G. Melancon, and M. S. Marshall. Graph visualization and nav-igation in information visualization: A survey. IEEE Transactions on Vi-sualization and Computer Graphics, 6(1):24–43, 2000.
[14] M. L. Huang, P. Eades, and J. Wang. On-line animated visualization ofhuge graphs using a modified spring algorithm. Journal of Visual Languagesand Computing, 9:623–645, 1998.
[15] T. Kamada and S. Kawai. Automatic display of network structures forhuman understanding. Technical Report 88-007, Dept. of Inf. Science, Uni-versity of Tokyo, 1988.
[16] K. Misue, P. Eades, W. Lai, and K. Sugiyama. Layout adjustment and themental map. J. Visual Lang. Comput., 6(2):183–210, 1995.
[17] S. C. North. Incremental layout in DynaDAG. In Proceedings of the 4thSymposium on Graph Drawing (GD), pages 409–418, 1996.
[18] H. Purchase. Which aesthetic has the greatest effect on human understand-ing? In G. Di Battista, editor, Proceedings of the 5th Symposium on GraphDrawing (GD), pages 248–261, 1998.
[19] K.-P. Yee, D. Fisher, R. Dhamija, and M. Hearst. Animated explorationof dynamic graphs with radial layout. In IEEE Symposium on InformationVisualization (INFOVIS ’01), pages 43–50, 2001.
Related Documents