SIMPLY AMAZING PHILIP MORRIS INTERNATIONAL 2019 ANNUAL REPORT

Welcome message from author
This document is posted to help you gain knowledge. Please leave a comment to let me know what you think about it! Share it to your friends and learn new things together.
Transcript

2019 Philip Morris Annual Report_Feb 25, 2020
SIMPLY AMAZINGP H I L I P M O R R I S I N T E R N A T I O N A L
2 0 1 9 A N N U A L R E P O R T

2019 Philip Morris Annual Report_Feb 25, 2020
Simply Amazing The Simply Amazing campaign focuses on everyday, relatable moments and emotions by showcasing to adult smokers the benefits of switching to IQOS.
Strong Underlying 2019 PerformanceNet Revenues Adjusted Operating Income Adjusted Operating Income Margin
+6.4%vs. 20181
+11.2%vs. 20181
+1.7ppvs. 20181
Note: All references throughout this report to “like-for-like” performance reflect pro forma 2018 results, which have been adjusted for the deconsolidation of our Canadian subsidiary, Rothmans, Benson & Hedges, Inc. (RBH), effective March 22, 2019. All references to adjusted results reflect the exclusion of asset impairment, exit costs and other charges. Reconciliations to the most directly comparable U.S. GAAP measures are provided on pages R-1 to R-2. All references to IQOS are to our Platform 1 heat-not-burn products, unless otherwise stated.(1) On a like-for-like basis, excluding currency. (2) Annualized rate based on a quarterly dividend of $1.17 per common share, declared September 11, 2019.
Adjusted Diluted EPS Operating Cash Flow Annualized Dividend
+9.9%vs. 20181
$10.1 billion $4.68/share2

2019 Philip Morris Annual Report_Feb 25, 2020
Dear Shareholder
2019 vs. 2018 ResultsTotal cigarette and heated tobacco unit (HTU) shipment volume of 766.4 billion units decreased by 2.0%, or by 1.4% on a like-for-like basis. This compares to a total international industry volume decline of 2.0%, excluding China and the U.S. Total cigarette and HTU market share grew by 0.1 percentage point, reaching 28.4% of the international market, excluding China and the U.S., driven mainly by the strong performance of our HTU brands. While our share of the international cigarette market declined by 0.3 percentage points, cigarette share for Marlboro increased by 0.3 percentage points to reach 10.0% – an all-time high. Net revenues of $29.8 billion increased by 0.6%. On a like-for-like basis, currency-neutral net revenues increased by 6.4%, driven primarily by higher HTU shipment volumes, coupled with strong combustible tobacco pricing that more than offset unfavorable combustible tobacco volume/mix. Adjusted operating income (OI) of $11.8 billion increased by 3.4%. On a like-for-like basis, currency-neutral adjusted OI increased by 11.2%, driven by net revenue growth, coupled with the favorable impact of our cost-savings initiatives and increasing leverage of existing smoke-free product infrastructure by a growing volume and user base. Like-for-like adjusted OI margin increased by 170 basis points, excluding currency, despite net incremental investment behind smoke-free products.
Adjusted diluted EPS of $5.19 increased by 1.8%. On a like-for-like basis, currency-neutral adjusted diluted EPS increased by 9.9%. Operating cash flow of $10.1 billion grew by $0.6 billion, or 6.5%, primarily reflecting favorable working capital movements. In September, the Board of Directors approved a 2.6% increase in the quarterly dividend to an annualized rate of $4.68 per share. This represented the twelfth consecutive year in which we increased our dividend since becoming a public company in 2008. Our total shareholder return (TSR) in 2019 was 35.0% in U.S. dollar terms, outperforming that of the S&P 500 (31.5%) and our Peer Group (23.5%). Since the spin-off in 2008, our TSR was 187.5%.
Delivering a Smoke-Free FutureWe continue to make important progress in our journey to replace cigarettes with smoke-free alternatives. In 2019, smoke-free products represented approximately 8% of PMI’s total shipment volume, 19% of net revenues, 71% of commercial expenditure and 98% of R&D expenditure.1 Only three years ago, these metrics stood at approximately 1%, 3%, 15% and 72%, respectively, demonstrating the significant – and rapid – shift in our business. IQOS – the world’s leading heat-not-burn product – remains the driving force behind this progress. As of December 2019, the total number of IQOS users globally2 reached an estimated 13.6 million, up by 41.8% versus
2019 was a year of significant progress and continued success for PMI. We delivered strong underlying business performance, notably reflecting broad-based growth for IQOS and solid combustible tobacco pricing. We also reached several important milestones, such as the introduction of a version of IQOS into the U.S. market following its authorization by the U.S. Food and Drug Administration (FDA) under the Pre-Market Tobacco Application (PMTA) pathway.
IQOS launches in the U.S.
In April 2019, a version of IQOS became the first heat-not-burn product to be authorized for sale by the U.S. FDA under the PMTA pathway. The agency’s rigorous two-year review led to the conclusion that IQOS is “appropriate for the protection of public health.” In September, our U.S. licensee, Altria Group, Inc., launched IQOS in the initial lead market of Atlanta, GA, followed by a subsequent expansion into the Richmond, VA, market in late 2019.
André CalantzopoulosChief Executive Officer
Louis C. Camilleri Chairman of the Board
(1) For shipment volume, this represents HTU shipment volume as a percentage of total cigarette and HTU shipment volume. For net revenues, this represents reduced-risk product net revenues as a percentage of total net revenues, as shown on page R-1 in this report.(2) “Total IQOS users” is defined as the estimated number of legal age (minimum 18 years) IQOS users that used PMI HTUs for at least 5% of their daily tobacco consumption over the past seven days.
1

2019 Philip Morris Annual Report_Feb 25, 2020
2018. Importantly, an estimated 9.7 million of these users – or approximately 71% – have stopped smoking and switched to IQOS.6
The increase in total IQOS users reflected growth across essentially all launch markets, including a near doubling in both Germany and Italy, and even stronger growth in Russia. The notable exception was Korea, where the number of IQOS users declined, mainly reflecting ongoing consumer confusion regarding the heated tobacco category stemming from the Korean FDA’s misleading communication on tar. IQOS user base growth drove a 44.2% increase in our 2019 HTU shipment volume, which reached 59.7 billion units. In IQOS markets, excluding the U.S., our HTU brands reached a full-year share of 5.0%3 – up by 1.4 percentage points – making them the fourth-largest tobacco “brand” in these markets. We also made critical strides in the U.S. market, with the authorization and subsequent commercialization of a version of IQOS, and are now poised to deliver better choices to the 40 million adults in the U.S. who smoke. We look forward to the FDA’s response to our Modified Risk Tobacco Product applications for IQOS, which the agency continues to review.
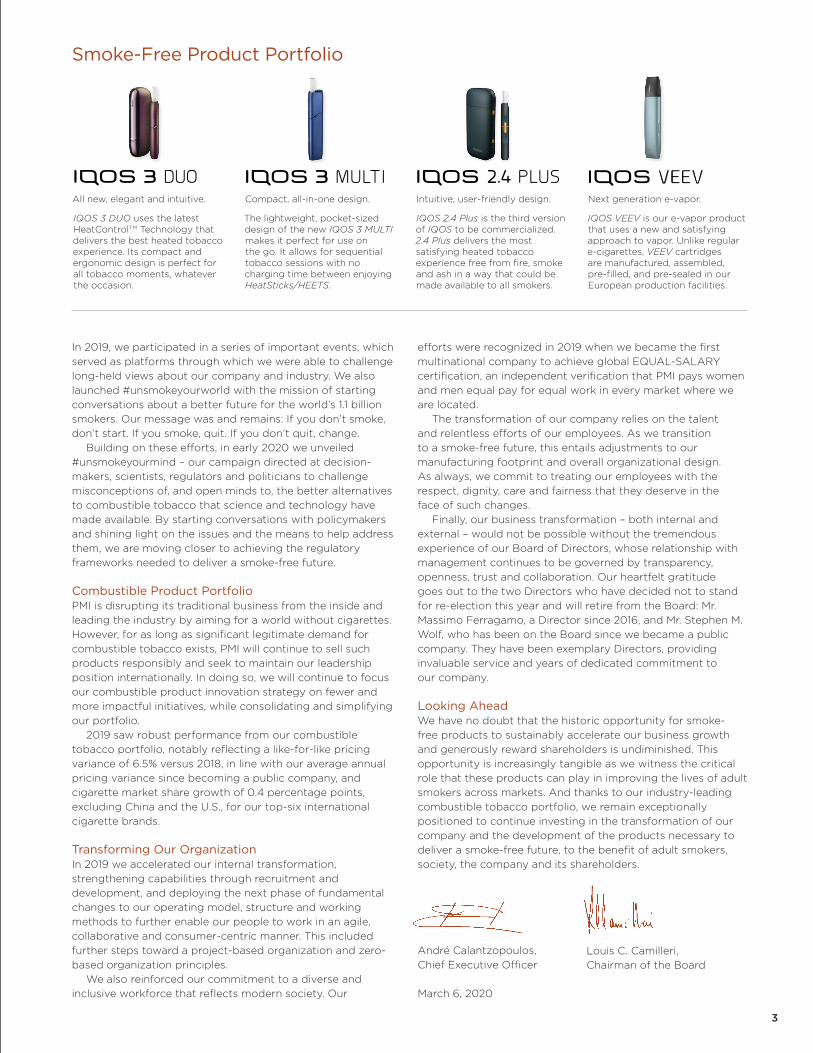
Smoke-Free Product PortfolioBuilding on the success of IQOS 3 and IQOS 3 MULTI, we began the global launch and roll-out of IQOS 3 DUO last Sep-tember. This latest addition to the IQOS family was designed with enhanced features to help adult smokers switch more seamlessly from cigarettes, notably allowing two consecutive uses without recharging the holder. By year-end, IQOS 3 DUO was available in all IQOS launch markets.2
Our aim to deliver a smoke-free future extends beyond IQOS heat-not-burn and requires a portfolio approach that addresses a range of adult smoker preferences and occasions in order to maximize full switching. Last year we made important advances in the e-vapor category with the development of the next generation of our Platform 4 e-vapor product, IQOS VEEV, which we plan to launch in the third quarter of this year and believe provides a superior nicotine delivery and taste experience compared to existing e-vapor products. We also took important steps toward commercializing our Platform 2 heat-not-burn and Platform
3 nicotine salt products, and plan consumer tests for both platforms in 2020. Furthermore, in January 2020 we announced a global collaboration agreement with KT&G, the leading tobacco and nicotine company in South Korea, to commercialize their smoke-free products outside of the country. The agreement will allow PMI to offer a smoke-free product portfolio that provides adult smokers with an ever-broader range of taste, price and technology choices, thereby accelerating our vision of a smoke-free future.
Engaging with StakeholdersAs we continue to transform our business and our organization, it is not enough to simply provide smoke-free products that meet the preferences of today’s adult smokers. We also need to earn the trust and active cooperation of a host of stakeholders, including regulators and public health authorities. We must consistently demonstrate that we are honest, respectful and genuinely committed to transformative change, and we must never fail to align our actions with our words across all areas of our business. An essential step toward gaining trust is being transparent. To that end, we have published our scientific research and findings, and have announced a set of business transformation metrics to allow others to measure our progress. We report publicly on these metrics annually in our Sustainability Report,7 which also details our important efforts and achievements in areas such as our agricultural labor practices and environmental footprint. We look forward to the publication of our next report this May. It is also essential to demonstrate our commitment to doing our part in preventing underage use of nicotine and tobacco products. During 2019, we undertook a comprehensive assessment of our commercial practices, and we have shared our findings through a report publicly available on our website.8 The results of the assessment demonstrate PMI’s strong adherence to our marketing standards, while recognizing areas for further improvement. In addition, we are initiating and engaging in global conversations about the benefits of smoke-free products for those adults who otherwise would continue to smoke.
(1) “Total IQOS users” is defined as the estimated number of legal age (minimum 18 years) IQOS users that used PMI HTUs for at least 5% of their daily tobacco consumption over the past seven days. (2) Excluding the U.S. (3) Reflects sales volume as a percentage of the total industry sales volume for cigarettes and HTUs.(4) Represents reduced-risk product net revenues, as shown on page R-1 in this report. (5) Excluding currency. (6) The estimated number of people who have “stopped smoking and switched to IQOS” is defined as: for markets where IQOS is the only heat-not-burn product, daily individual consumption of PMI HTUs represents the totality of their daily tobacco consumption in the past seven days; for markets where IQOS is one among other heat-not-burn products, daily individual consumption of HTUs represents the totality of their daily tobacco consumption in the past seven days, of which at least 70% are PMI HTUs.(7) Link: https://www.pmi.com/sustainability/sustainability-report (8) Link: https://www.pmi.com/resources/docs/default-source/default-document-library/responsible-marketing-practices-at-pmi. pdf?sfvrsn=496446b4_4
2019: IQOS at a Glance (change vs. 2018)
Total IQOS Users1 HTU Shipment Volume Market Share of HTUs in IQOS Markets2, 3
13.6 million+41.8%
59.7 billion units+44.2%
5.0%+1.4pp
Smoke-Free Product Net Revenues4
$5.6 billion+39.0%5
2
2019 Philip Morris Annual Report_Feb 25, 2020
In 2019, we participated in a series of important events, which served as platforms through which we were able to challenge long-held views about our company and industry. We also launched #unsmokeyourworld with the mission of starting conversations about a better future for the world’s 1.1 billion smokers. Our message was and remains: If you don’t smoke, don’t start. If you smoke, quit. If you don’t quit, change. Building on these efforts, in early 2020 we unveiled #unsmokeyourmind – our campaign directed at decision-makers, scientists, regulators and politicians to challenge misconceptions of, and open minds to, the better alternatives to combustible tobacco that science and technology have made available. By starting conversations with policymakers and shining light on the issues and the means to help address them, we are moving closer to achieving the regulatory frameworks needed to deliver a smoke-free future.
Combustible Product PortfolioPMI is disrupting its traditional business from the inside and leading the industry by aiming for a world without cigarettes. However, for as long as significant legitimate demand for combustible tobacco exists, PMI will continue to sell such products responsibly and seek to maintain our leadership position internationally. In doing so, we will continue to focus our combustible product innovation strategy on fewer and more impactful initiatives, while consolidating and simplifying our portfolio. 2019 saw robust performance from our combustible tobacco portfolio, notably reflecting a like-for-like pricing variance of 6.5% versus 2018, in line with our average annual pricing variance since becoming a public company, and cigarette market share growth of 0.4 percentage points, excluding China and the U.S., for our top-six international cigarette brands.
Transforming Our OrganizationIn 2019 we accelerated our internal transformation, strengthening capabilities through recruitment and development, and deploying the next phase of fundamental changes to our operating model, structure and working methods to further enable our people to work in an agile, collaborative and consumer-centric manner. This included further steps toward a project-based organization and zero-based organization principles. We also reinforced our commitment to a diverse and inclusive workforce that reflects modern society. Our
efforts were recognized in 2019 when we became the first multinational company to achieve global EQUAL-SALARY certification, an independent verification that PMI pays women and men equal pay for equal work in every market where we are located. The transformation of our company relies on the talent and relentless efforts of our employees. As we transition to a smoke-free future, this entails adjustments to our manufacturing footprint and overall organizational design. As always, we commit to treating our employees with the respect, dignity, care and fairness that they deserve in the face of such changes. Finally, our business transformation – both internal and external – would not be possible without the tremendous experience of our Board of Directors, whose relationship with management continues to be governed by transparency, openness, trust and collaboration. Our heartfelt gratitude goes out to the two Directors who have decided not to stand for re-election this year and will retire from the Board: Mr. Massimo Ferragamo, a Director since 2016, and Mr. Stephen M. Wolf, who has been on the Board since we became a public company. They have been exemplary Directors, providing invaluable service and years of dedicated commitment to our company.
Looking AheadWe have no doubt that the historic opportunity for smoke-free products to sustainably accelerate our business growth and generously reward shareholders is undiminished. This opportunity is increasingly tangible as we witness the critical role that these products can play in improving the lives of adult smokers across markets. And thanks to our industry-leading combustible tobacco portfolio, we remain exceptionally positioned to continue investing in the transformation of our company and the development of the products necessary to deliver a smoke-free future, to the benefit of adult smokers, society, the company and its shareholders.
André Calantzopoulos, Chief Executive Officer
March 6, 2020
Next generation e-vapor.
IQOS VEEV is our e-vapor product that uses a new and satisfying approach to vapor. Unlike regular e-cigarettes, VEEV cartridges are manufactured, assembled, pre-filled, and pre-sealed in our European production facilities.
All new, elegant and intuitive.
IQOS 3 DUO uses the latest HeatControlTM Technology that delivers the best heated tobacco experience. Its compact and ergonomic design is perfect for all tobacco moments, whatever the occasion.
Compact, all-in-one design.
The lightweight, pocket-sized design of the new IQOS 3 MULTI makes it perfect for use on the go. It allows for sequential tobacco sessions with no charging time between enjoying HeatSticks/HEETS.
V V
V V
V V
Smoke-Free Product Portfolio
Louis C. Camilleri, Chairman of the Board
Intuitive, user-friendly design.
IQOS 2.4 Plus is the third version of IQOS to be commercialized. 2.4 Plus delivers the most satisfying heated tobacco experience free from fire, smoke and ash in a way that could be made available to all smokers.V V
3

2019 Philip Morris Annual Report_Feb 25, 2020
Company Management
Board of DirectorsAndré CalantzopoulosChief Executive Officer Director since 2013
Louis C. CamilleriChief Executive Officer, Ferrari N.V. Director since 2008
Massimo Ferragamo* 1,3,4,5
Chairman,Ferragamo USA Inc.Director since 2016
Werner Geissler 1,2,3,5 Operating Partner, Advent International Director since 2015
Lisa A. Hook 2,3,5
Businesswoman Director since 2018
Jennifer Li 1,3,4 Chief Executive Officer and Managing Partner, Changcheng Investment Partners Director since 2010
Jun Makihara 1,3,5
Retired Businessman Director since 2014
Kalpana Morparia 3,4,5
Chairman, South and South East Asia, J.P. Morgan Chase Director since 2011
Lucio A. Noto 1,2,3,4
Managing Partner, Midstream Partners, LLC Director since 2008
Frederik Paulsen 3,5 Chairman, Ferring Group Director since 2014
Robert B. Polet 2,3,4,5
Chairman, Rituals Cosmetics Enterprise B.V.Chairman, Arica Holding B.V.Director since 2011
Stephen M. Wolf* 1,2,3,4,5
Managing Partner,Alpilles, LLCDirector since 2008
Board and Committee Leadership Chairman of the Board, Louis C. Camilleri Presiding Director, Lucio A. Noto1 Member of Audit Committee, Jennifer Li, Chair2 Member of Compensation and Leadership Development Committee, Werner Geissler, Chair3 Member of Finance Committee, Jun Makihara, Chair4 Member of Nominating and Corporate Governance Committee, Kalpana Morparia, Chair5 Member of Product Innovation and Regulatory Affairs Committee, Frederik Paulsen, Chair
André CalantzopoulosChief Executive Officer
Massimo AndolinaSenior Vice President, Operations
Drago AzinovicPresident, Middle East & Africa Region and PMI Duty Free
Werner BarthSenior Vice President, Commercial
Charles BendottiGlobal Head, People & Culture
Frank de RooijVice President, Treasury & Corporate Finance
Frederic de WildePresident, European Union Region
Marc S. FirestonePresident, External Affairs & General Counsel
Stacey KennedyPresident, South & Southeast Asia Region
Martin G. King**Chief Financial Officer
Michael KunstSenior Vice President,Commercial Transformation
Andreas KuraliVice President and Controller
Bin Li Chief Product Officer
Marco MariottiPresident, Eastern Europe Region
Mario MasseroliPresident, Latin America & Canada Region
Deepak MishraChief Strategy Officer
Jacek OlczakChief Operating Officer
John O’MullaneChief Life Sciences Officer
Paul RileyPresident, East Asia & Australia Region
Marian SalzmanSenior Vice President, Global Communications
Jaime SuarezChief Digital Officer
Michael VoegeleChief Technology Officer
Stefano VolpettiChief Consumer Officer
Jerry WhitsonDeputy General Counseland Corporate Secretary
Miroslaw ZielinskiChief New Ventures Officer
* Not standing for re-election in 2020.** On February 28, 2020, Emmanuel Babeau was appointed to succeed Martin G. King as Chief Financial Officer, effective May 1, 2020. Mr. King will assume the role of CEO, PMI America, effective May 1, 2020.
4

UNITED STATESSECURITIES AND EXCHANGE COMMISSION
Washington, D.C. 20549 FORM 10-K
ANNUAL REPORT PURSUANT TO SECTION 13 OR 15(d) OF THE SECURITIES EXCHANGE ACT OF 1934
For the fiscal year ended December 31, 2019 OR
TRANSITION REPORT PURSUANT TO SECTION 13 OR 15(d) OF THE SECURITIES EXCHANGE ACT OF 1934For the transition period from to
Commission File Number: 001-33708
PHILIP MORRIS INTERNATIONAL INC. (Exact name of registrant as specified in its charter)
Virginia 13-3435103(State or other jurisdiction of
incorporation or organization) (I.R.S. Employer
Identification No.)
120 Park Avenue
New YorkNew York 10017
(Address of principal executive offices) (Zip Code)
917-663-2000 (Registrant’s telephone number, including area code)
Securities registered pursuant to Section 12(b) of the Act:
Title of each class Trading Symbol(s) Name of each exchange on which registeredCommon Stock, no par value PM New York Stock Exchange
2.000% Notes due 2020 PM20B New York Stock ExchangeFloating Notes due 2020 PM20C New York Stock Exchange1.750% Notes due 2020 PM20A New York Stock Exchange4.500% Notes due 2020 PM20 New York Stock Exchange1.875% Notes due 2021 PM21B New York Stock Exchange1.875% Notes due 2021 PM21C New York Stock Exchange4.125% Notes due 2021 PM21 New York Stock Exchange2.900% Notes due 2021 PM21A New York Stock Exchange2.625% Notes due 2022 PM22A New York Stock Exchange2.375% Notes due 2022 PM22B New York Stock Exchange2.500% Notes due 2022 PM22 New York Stock Exchange2.500% Notes due 2022 PM22C New York Stock Exchange2.625% Notes due 2023 PM23 New York Stock Exchange2.125% Notes due 2023 PM23B New York Stock Exchange3.600% Notes due 2023 PM23A New York Stock Exchange2.875% Notes due 2024 PM24 New York Stock Exchange2.875% Notes due 2024 PM24C New York Stock Exchange0.625% Notes due 2024 PM24B New York Stock Exchange
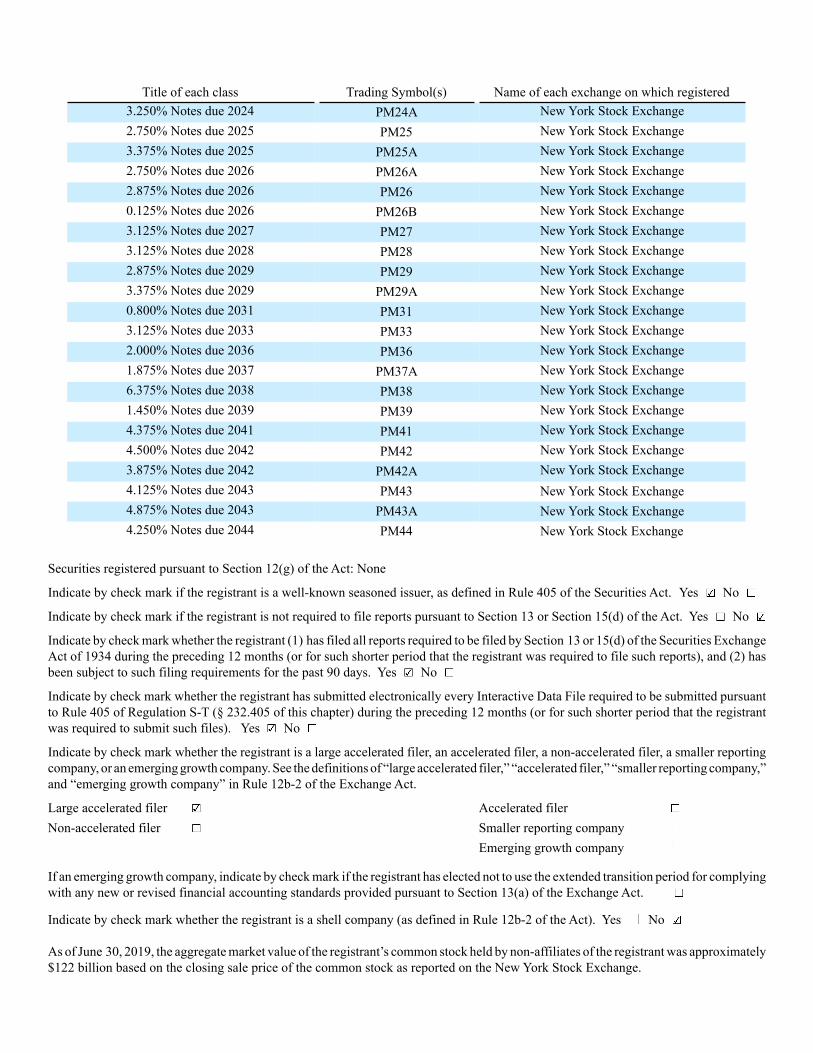
Title of each class Trading Symbol(s) Name of each exchange on which registered3.250% Notes due 2024 PM24A New York Stock Exchange2.750% Notes due 2025 PM25 New York Stock Exchange3.375% Notes due 2025 PM25A New York Stock Exchange2.750% Notes due 2026 PM26A New York Stock Exchange2.875% Notes due 2026 PM26 New York Stock Exchange0.125% Notes due 2026 PM26B New York Stock Exchange3.125% Notes due 2027 PM27 New York Stock Exchange3.125% Notes due 2028 PM28 New York Stock Exchange2.875% Notes due 2029 PM29 New York Stock Exchange3.375% Notes due 2029 PM29A New York Stock Exchange0.800% Notes due 2031 PM31 New York Stock Exchange3.125% Notes due 2033 PM33 New York Stock Exchange2.000% Notes due 2036 PM36 New York Stock Exchange1.875% Notes due 2037 PM37A New York Stock Exchange6.375% Notes due 2038 PM38 New York Stock Exchange1.450% Notes due 2039 PM39 New York Stock Exchange4.375% Notes due 2041 PM41 New York Stock Exchange4.500% Notes due 2042 PM42 New York Stock Exchange3.875% Notes due 2042 PM42A New York Stock Exchange4.125% Notes due 2043 PM43 New York Stock Exchange4.875% Notes due 2043 PM43A New York Stock Exchange4.250% Notes due 2044 PM44 New York Stock Exchange
Securities registered pursuant to Section 12(g) of the Act: None
Indicate by check mark if the registrant is a well-known seasoned issuer, as defined in Rule 405 of the Securities Act. Yes No
Indicate by check mark if the registrant is not required to file reports pursuant to Section 13 or Section 15(d) of the Act. Yes No
Indicate by check mark whether the registrant (1) has filed all reports required to be filed by Section 13 or 15(d) of the Securities Exchange Act of 1934 during the preceding 12 months (or for such shorter period that the registrant was required to file such reports), and (2) has been subject to such filing requirements for the past 90 days. Yes No
Indicate by check mark whether the registrant has submitted electronically every Interactive Data File required to be submitted pursuant to Rule 405 of Regulation S-T (§ 232.405 of this chapter) during the preceding 12 months (or for such shorter period that the registrant was required to submit such files). Yes No
Indicate by check mark whether the registrant is a large accelerated filer, an accelerated filer, a non-accelerated filer, a smaller reporting company, or an emerging growth company. See the definitions of “large accelerated filer,” “accelerated filer,” “smaller reporting company,” and “emerging growth company” in Rule 12b-2 of the Exchange Act.
Large accelerated filer Accelerated filer Non-accelerated filer Smaller reporting company Emerging growth company If an emerging growth company, indicate by check mark if the registrant has elected not to use the extended transition period for complying with any new or revised financial accounting standards provided pursuant to Section 13(a) of the Exchange Act.
Indicate by check mark whether the registrant is a shell company (as defined in Rule 12b-2 of the Act). Yes No
As of June 30, 2019, the aggregate market value of the registrant’s common stock held by non-affiliates of the registrant was approximately $122 billion based on the closing sale price of the common stock as reported on the New York Stock Exchange.

Class Outstanding at January 31, 2020Common Stock,
no par value 1,555,911,930 shares
DOCUMENTS INCORPORATED BY REFERENCE
Document Parts Into Which Incorporated
Portions of the registrant’s definitive proxy statement for use in connection with its annualmeeting of shareholders to be held on May 6, 2020, to be filed with the Securities andExchange Commission (“SEC”) on or about March 26, 2020.
Part III

TABLE OF CONTENTS
Page
PART I
Item 1. Business
Item 1A. Risk Factors
Item 1B. Unresolved Staff Comments
Item 2. Properties
Item 3. Legal Proceedings
Item 4. Mine Safety Disclosures
PART II
Item 5. Market for Registrant’s Common Equity, Related Stockholder Matters and Issuer Purchases of Equity Securities
Item 6. Selected Financial Data
Item 7. Management’s Discussion and Analysis of Financial Condition and Results of Operations
Item 7A. Quantitative and Qualitative Disclosures About Market Risk
Item 8. Financial Statements and Supplementary Data
Item 9. Changes in and Disagreements with Accountants on Accounting and Financial Disclosure
Item 9A. Controls and Procedures
Item 9B. Other Information
PART III
Item 10. Directors, Executive Officers and Corporate Governance
Item 11. Executive Compensation
Item 12. Security Ownership of Certain Beneficial Owners and Management and Related Stockholder Matters
Item 13. Certain Relationships and Related Transactions, and Director Independence
Item 14. Principal Accounting Fees and Services
PART IV
Item 15. Exhibits and Financial Statement Schedules
Signatures
In this report, “PMI,” “we,” “us” and “our” refers to Philip Morris International Inc. and its subsidiaries.
Trademarks and service marks in this report are the registered property of, or licensed by, the subsidiaries of Philip Morris International Inc. and are italicized.
1
5
10
10
11
11
11
14
15
52
53
114
114
114
115
116
116
117
117
118
123

1
PART I
Item 1. Business. General Development of Business
General Philip Morris International Inc. is a Virginia holding company incorporated in 1987. We are a leading international tobacco company engaged in the manufacture and sale of cigarettes, smoke-free products and associated electronic devices and accessories, and other nicotine-containing products in markets outside the United States of America. In addition, we ship a version of our Platform 1 device and its consumables authorized by the U.S. Food and Drug Administration ("FDA") to Altria Group, Inc., for sale in the United States under license.
We are leading a transformation in the tobacco industry to create a smoke-free future, based on a new category of reduced-risk products that, while not risk free, are a much better choice than continuing to smoke. Our goal is to ultimately replace cigarettes with smoke-free products to the benefit of adults who would otherwise continue to smoke, society, the company and its shareholders.
Reduced-risk products ("RRPs") is the term we use to refer to products that present, are likely to present, or have the potential to present less risk of harm to smokers who switch to these products versus continuing smoking. We have a range of RRPs in various stages of development, scientific assessment and commercialization. Because our RRPs do not burn tobacco, they produce an aerosol that contains far lower quantities of harmful and potentially harmful constituents than found in cigarette smoke. Through multidisciplinary capabilities in product development, state-of-the-art facilities and scientific substantiation, we aim to ensure that our RRPs meet adult consumer preferences and rigorous regulatory requirements.
Our IQOS smoke-free product brand portfolio includes heated tobacco and nicotine-containing vapor products. Our leading smoke-free platform ("Platform 1") is a precisely controlled device into which a specially designed heated tobacco unit is inserted and heated to generate an aerosol. We market our heated tobacco units under the brand names HEETS, HEETS Marlboro and HEETS FROM MARLBORO, defined collectively as HEETS, as well as Marlboro HeatSticks and Parliament HeatSticks. Platform 1 was first introduced in Nagoya, Japan, in 2014. As of December 31, 2019, Platform 1 is available for sale in 52 markets in key cities or nationwide.
Our cigarettes are sold in more than 180 markets, and in many of these markets they hold the number one or number two market share position. We have a wide range of premium, mid-price and low-price brands. Our portfolio comprises both international and local brands and is led by Marlboro, the world’s best-selling international cigarette, which accounted for approximately 37% of our total 2019 cigarette shipment volume. Marlboro is complemented in the premium-price category by Parliament. Our other leading international cigarette brands are Bond Street, Chesterfield, L&M, Lark and Philip Morris. These seven international cigarette brands contributed approximately 78% of our cigarette shipment volume in 2019. We also own a number of important local cigarette brands, such as Dji Sam Soe, Sampoerna A and Sampoerna U in Indonesia, and Fortune and Jackpot in the Philippines.
Source of Funds — Dividends We are a legal entity separate and distinct from our direct and indirect subsidiaries. Accordingly, our right, and thus the right of our creditors and stockholders, to participate in any distribution of the assets or earnings of any subsidiary is subject to the prior rights of creditors of such subsidiary, except to the extent that claims of our company itself as a creditor may be recognized. As a holding company, our principal sources of funds, including funds to make payment on our debt securities, are from the receipt of dividends and repayment of debt from our subsidiaries. Our principal wholly owned and majority-owned subsidiaries currently are not limited by long-term debt or other agreements in their ability to pay cash dividends or to make other distributions with respect to their common stock that are otherwise compliant with law.
Description of Business We manage our business in six operating segments as follows:
• The European Union Region (“EU”) is headquartered in Lausanne, Switzerland, and covers all the European Union countries and also Switzerland, Norway, Iceland and the United Kingdom;
• The Eastern Europe Region (“EE”) is also headquartered in Lausanne and includes Southeast Europe, Central Asia, Ukraine, Israel and Russia;

2
• The Middle East & Africa Region (“ME&A”) is also headquartered in Lausanne and covers the African continent, the Middle East, Turkey and our international duty free business;
• The South & Southeast Asia Region (“S&SA”) is headquartered in Hong Kong and includes Indonesia, the Philippines and other markets in this region;
• The East Asia & Australia Region (“EA&A”) is also headquartered in Hong Kong and includes Australia, Japan, South Korea, the People's Republic of China and other markets in this region, as well as Malaysia and Singapore; and
• The Latin America & Canada Region (“LA&C”) is headquartered in New York and covers the South American continent, Central America, Mexico, the Caribbean and Canada. LA&C also includes transactions under license with Altria Group, Inc., for the distribution of our Platform 1 product in the United States.
As of March 22, 2019, we deconsolidated the financial results of our Canadian subsidiary, Rothmans, Benson & Hedges Inc. ("RBH") from our financial statements. For further details, see Item 8, Note 22. Deconsolidation of RBH.
Following the deconsolidation of our Canadian subsidiary, we will continue to report the volume of brands sold by RBH for which other PMI subsidiaries are the trademark owners. These include HEETS, Next, Philip Morris and Rooftop, which together accounted for approximately 40% of RBH's total shipment volume in 2018.
References to total international market, defined as worldwide cigarette and heated tobacco unit volume excluding the United States, total industry, total market and market shares in this Form 10-K are our estimates for tax-paid products based on the latest available data from a number of internal and external sources and may, in defined instances, exclude the People's Republic of China and/or our duty free business. In addition, to reflect the deconsolidation of RBH, effective March 22, 2019, PMI's total market share has been restated for previous periods.
Our total shipments, including cigarettes and heated tobacco units, decreased by 2.0% in 2019 to 766.4 billion units. We estimate that international industry volumes, including cigarettes and heated tobacco units, were approximately 5.1 trillion units in 2019, a 0.9%decrease from 2018. Excluding the People’s Republic of China (“PRC”), we estimate that international cigarette and heated tobacco unit volume was 2.7 trillion units in 2019, a 2.0% decrease from 2018. We estimate that our reported share of the international market (which is defined as worldwide cigarette and heated tobacco unit volume, excluding the United States of America) was approximately 15.1% in 2019, 15.2% in 2018 and 15.1% in 2017. Excluding the PRC, we estimate that our reported share of the international market was approximately 28.4%, 28.3%, and 27.8% in 2019, 2018 and 2017, respectively. Shipments of our principal cigarette brand, Marlboro, decreased by 0.6% in 2019 and represented approximately 10.0% of the international cigarette market, excluding the PRC, in 2019, 9.7% in 2018 and 9.7% in 2017.
Total shipment volume of heated tobacco units reached 59.7 billion units in 2019, up from 41.4 billion units in 2018.
We have a market share of at least 15% and, in a number of instances, substantially more than 15%, in approximately 95 markets, including Algeria, Argentina, Australia, Austria, Belgium, Brazil, the Czech Republic, Egypt, France, Germany, Hong Kong, Hungary, Indonesia, Israel, Italy, Japan, Kazakhstan, Korea, Kuwait, Mexico, the Netherlands, the Philippines, Poland, Portugal, Russia, Saudi Arabia, the Slovak Republic, Spain, Switzerland, Turkey and Ukraine.

3
Distribution & Sales
Our main types of distribution are tailored to the characteristics of each market and are often used simultaneously:
• Direct sales and distribution, where we have set up our own distribution selling directly to the retailers (including gas stations and other key accounts);
• Distribution through independent distributors that often distribute other fast-moving consumer goods and are responsible for distribution in a particular market;
• Exclusive zonified distribution, where the distributors are dedicated to us in tobacco products distribution and assigned to exclusive territories within a market;
• Distribution through national or regional wholesalers that then supply the retail trade; and• Our own brand retail and e-commerce infrastructures for our RRP products and accessories.
Competition We are subject to highly competitive conditions in all aspects of our business. We compete primarily on the basis of product quality, brand recognition, brand loyalty, taste, R&D, innovation, packaging, customer service, marketing, advertising and retail price and, increasingly, adult smoker willingness to convert to our RRPs. In the combustible product category, we predominantly sell American blend cigarette brands, such as Marlboro, L&M, Parliament, Philip Morris and Chesterfield, which are the most popular across many of our markets. In the RRP product category, we predominantly sell Platform 1 devices and heated tobacco units under the IQOS brand umbrella. We seek to compete in all profitable retail price categories, although our brand portfolio is weighted towards the premium-price category.
The competitive environment and our competitive position can be significantly influenced by weak economic conditions, erosion of consumer confidence, competitors' introduction of lower-price products or innovative products, higher tobacco product taxes, higher absolute prices and larger gaps between retail price categories, and product regulation that diminishes the ability to differentiate tobacco products and restricts adult consumer access to truthful and non-misleading information about our RRPs. Competitors include three large international tobacco companies, new market entrants, particularly with respect to innovative products, several regional and local tobacco companies and, in some instances, state-owned tobacco enterprises, principally in Algeria, Egypt, the PRC, Taiwan, Thailand and Vietnam. Industry consolidation and privatizations of state-owned enterprises have led to an overall increase in competitive pressures. Some competitors have different profit and volume objectives, and some international competitors are susceptible to changes in different currency exchange rates. Certain new market entrants may alienate consumers from innovative products through inappropriate marketing campaigns and messaging and inferior product satisfaction, while not relying on scientific substantiation based on appropriate R&D protocols and standards. The growing use of digital media could increase the speed and extent of the dissemination of inaccurate and misleading information about our RRPs.
Procurement and Raw Materials We purchase tobacco leaf of various types, grades and styles throughout the world, mostly through independent tobacco suppliers. In 2019, we also contracted directly with farmers in several countries, including Argentina, Brazil, Colombia, Ecuador, Italy, Pakistan, the Philippines and Poland. In 2019, direct sourcing from farmers represented approximately 23% of PMI’s global leaf requirements. The largest supplies of tobacco leaf are sourced from Argentina, Brazil, China, Italy, Indonesia (mostly for domestic use in kretek products), Malawi, Mozambique, the Philippines, Turkey and the United States.
We believe that there is an adequate supply of tobacco leaf in the world markets to satisfy our current and anticipated production requirements.
In addition to tobacco leaf, we purchase a wide variety of direct materials from a total of approximately 400 suppliers. In 2019, our top ten suppliers of direct materials combined represented approximately 50% of our total direct materials purchases. The three most significant direct materials that we purchase are printed paper board used in packaging, acetate tow used in filter making and fine paper used in the manufacturing of cigarettes and heated tobacco units. In addition, the adequate supply and procurement of cloves are of particular importance to our Indonesian business.
The adequate supply chain for our RRP portfolio, including the supply of electronic devices, is important to our business. We work with two electronics manufacturing service providers for the supply of our Platform 1 devices and a small number of other providers for other products in our RRP portfolio and related accessories. Although we work closely with these service providers on monitoring their

4
production capability and financial health, the commercialization of our RRPs could be adversely affected if they are unable to meet their commitments. The production of our RRP portfolio requires various metals, and we believe that there is an adequate supply of such metals in the world markets to satisfy our current and anticipated production requirements. However, some components and materials necessary for the production of our RRPs are obtained from single or limited sources, and can be subject to industry-wide shortages and price fluctuations. Our inability to secure an adequate supply of such components and materials could negatively impact the commercialization of our RRPs.
Our IQOS devices are subject to product warranties, which are described in more detail in Item 8. Financial Statements and Supplementary Data of this Annual Report on Form 10-K (“Item 8”) in Note 5. Product Warranty to our consolidated financial statements. We discuss our RRP products in more detail in Item 7. Management's Discussion and Analysis of Financial Condition and Results of Operations of this Annual Report on Form 10-K (“Item 7”) in Business Environment—Reduced-Risk Products.
Business Environment
Information called for by this Item is hereby incorporated by reference to the paragraphs in Item 7, Business Environment.
Other Matters Customers As described in more detail in “Distribution & Sales” above, in many of our markets we sell our products to distributors. In 2019, sales to a distributor in the European Union Region and a distributor in the East Asia & Australia Region each amounted to 10 percent or more of our consolidated net revenues. See Item 8, Note 12. Segment Reporting for more information. We believe that none of our business segments is dependent upon a single customer or a few customers, the loss of which would have a material adverse effect on our consolidated results of operations. In some of our markets, particularly in the European Union and in the East Asia & Australia Regions, a loss of a distributor may result in a temporary market disruption. Employees At December 31, 2019, we employed approximately 73,500 people worldwide, including full-time, temporary and part-time staff. Our businesses are subject to a number of laws and regulations relating to our relationship with our employees. Generally, these laws and regulations are specific to the location of each business. In addition, in accordance with European Union requirements, we have established a European Works Council composed of management and elected members of our workforce. We believe that our relations with our employees and their representative organizations are excellent.
Information About Our Executive Officers
The disclosure regarding executive officers is hereby incorporated by reference to the discussion under the heading “Information about our Executive Officers as of February 6, 2020” in Part III, Item 10. Directors, Executive Officers and Corporate Governance of this Annual Report on Form 10-K (“Item 10”).
Intellectual Property
Our trademarks are valuable assets, and their protection and reputation are essential to us. We own the trademark rights to all of our principal brands, including Marlboro, HEETS and IQOS, or have the right to use them in all countries where we use them. In addition, we have a large number of granted patents and pending patent applications worldwide. Our patent portfolio, as a whole, is material to our business. However, no one patent, or group of related patents, is material to us. We also have registered industrial designs, as well as unregistered proprietary trade secrets, technology, know-how, processes and other unregistered intellectual property rights. Effective January 1, 2008, PMI entered into an Intellectual Property Agreement with Philip Morris USA Inc. (“PM USA”), a wholly owned subsidiary of Altria Group, Inc. The Intellectual Property Agreement allocates ownership of jointly funded intellectual property as follows:
• PMI owns all rights to jointly funded intellectual property outside the United States, its territories and possessions; and

5
• PM USA owns all rights to jointly funded intellectual property in the United States, its territories and possessions.
The parties agreed to submit disputes under the Intellectual Property Agreement first to negotiation between senior executives and then to binding arbitration.
Seasonality Our business segments are not significantly affected by seasonality, although in certain markets cigarette consumption trends may rise during the summer months due to outdoor use, longer daylight, and tourism. Environmental Regulation We are subject to international, national and local environmental laws and regulations in the countries in which we do business. We have specific programs across our business units designed to meet applicable environmental compliance requirements and reduce our carbon footprint and wastage as well as water and energy consumption. We report externally about our climate change mitigation strategy, together with associated targets and results in reducing our carbon footprint, through CDP (formerly, the Carbon Disclosure Project), the leading international non-governmental organization assessing the work of thousands of companies worldwide in the area of environmental impact, including climate change. Our environmental and occupational health and safety management system includes policies, standard practices and procedures at all our manufacturing centers. We also conduct regular safety assessments at our offices, warehouses and car fleet organizations. Furthermore, we have engaged an external certification body to validate the effectiveness of this management system at our manufacturing centers around the world, in accordance with internationally recognized standards for safety and environmental management. The environmental performance data we report externally is also verified by a qualified third party. Our subsidiaries expect to continue to make investments in order to drive improved performance and maintain compliance with environmental laws and regulations. We assess and report the compliance status of all our legal entities on a regular basis. Based on the management and controls we have in place and our review of climate change risks (both physical and regulatory), environmental expenditures have not had, and are not expected to have, a material adverse effect on our consolidated results of operations, capital expenditures, financial position, earnings or competitive position.
Available Information We are required to file with the SEC annual, quarterly and current reports, proxy statements and other information required by the Securities Exchange Act of 1934, as amended (the “Exchange Act”). The SEC maintains an Internet website at http://www.sec.gov that contains reports, proxy and information statements, and other information regarding issuers that file electronically with the SEC, from which investors can electronically access our SEC filings. We make available free of charge on, or through, our website at www.pmi.com our Annual Report on Form 10-K, Quarterly Reports on Form 10-Q, Current Reports on Form 8-K and amendments to those reports filed or furnished pursuant to Section 13(a) or 15(d) of the Exchange Act as soon as reasonably practicable after we electronically file such material with, or furnish it to, the SEC. Investors can access our filings with the SEC by visiting www.pmi.com. The information on our website is not, and shall not be deemed to be, a part of this report or incorporated into any other filings we make with the SEC.
Item 1A. Risk Factors. The following risk factors should be read carefully in connection with evaluating our business and the forward-looking statements contained in this Annual Report on Form 10-K. Any of the following risks could materially adversely affect our business, our operating results, our financial condition and the actual outcome of matters as to which forward-looking statements are made in this Annual Report on Form 10-K.
Forward-Looking and Cautionary Statements
We may from time to time make written or oral forward-looking statements, including statements contained in this Annual Report on Form 10-K and other filings with the SEC, in reports to stockholders and in press releases and investor webcasts. You can identify these forward-looking statements by use of words such as "strategy," "expects," "continues," "plans," "anticipates," "believes," "will," "estimates," "intends," "projects," "goals," "targets" and other words of similar meaning. You can also identify them by the fact that they do not relate strictly to historical or current facts.

6
We cannot guarantee that any forward-looking statement will be realized, although we believe we have been prudent in our plans and assumptions. Our RRPs constitute a new product category in its early stages that is less predictable than our mature cigarette business. Achievement of future results is subject to risks, uncertainties and inaccurate assumptions. Should known or unknown risks or uncertainties materialize, or should underlying assumptions prove inaccurate, actual results could vary materially from those anticipated, estimated or projected. Investors should bear this in mind as they consider forward-looking statements and whether to invest in or remain invested in our securities. In connection with the “safe harbor” provisions of the Private Securities Litigation Reform Act of 1995, we are identifying important factors that, individually or in the aggregate, could cause actual results and outcomes to differ materially from those contained in any forward-looking statements made by us; any such statement is qualified by reference to the following cautionary statements. We elaborate on these and other risks we face throughout this document, particularly in Item 7, Business Environment. You should understand that it is not possible to predict or identify all risk factors. Consequently, you should not consider the following to be a complete discussion of all potential risks or uncertainties. We do not undertake to update any forward-looking statement that we may make from time to time, except in the normal course of our public disclosure obligations.
Risks Related to Our Business and Industry
• Consumption of tax-paid cigarettes continues to decline in many of our markets.
This decline is due to multiple factors, including increased taxes and pricing, governmental actions, the diminishing social acceptance of smoking, continuing economic and geopolitical uncertainty, and the continuing prevalence of illicit products. These factors and their potential consequences are discussed more fully below and in Item 7, Business Environment.
• Cigarettes are subject to substantial taxes. Significant increases in cigarette-related taxes have been proposed or enacted and are likely to continue to be proposed or enacted in numerous jurisdictions. These tax increases may disproportionately affect our profitability and make us less competitive versus certain of our competitors.
Tax regimes, including excise taxes, sales taxes and import duties, can disproportionately affect the retail price of cigarettes versus other combustible tobacco products, or disproportionately affect the relative retail price of our cigarette brands versus cigarette brands manufactured by certain of our competitors. Because our portfolio is weighted toward the premium-price cigarette category, tax regimes based on sales price can place us at a competitive disadvantage in certain markets. As a result, our volume and profitability may be adversely affected in these markets.
Increases in cigarette taxes are expected to continue to have an adverse impact on our sales of cigarettes, due to resulting lower consumption levels, a shift in sales from manufactured cigarettes to other combustible tobacco products and from the premium-price to the mid-price or low-price cigarette categories, where we may be under-represented, from local sales to legal cross-border purchases of lower price products, or to illicit products such as contraband, counterfeit and "illicit whites."
• Our business faces significant governmental action aimed at increasing regulatory requirements with the goal of reducing or preventing the use of tobacco products.
Governmental actions, combined with the diminishing social acceptance of smoking and private actions to restrict smoking, have resulted in reduced industry volume in many of our markets, and we expect that such factors will continue to reduce consumption levels and will increase down-trading and the risk of counterfeiting, contraband, "illicit whites" and legal cross-border purchases. Significant regulatory developments will continue to take place over the next few years in most of our markets, driven principally by the World Health Organization's Framework Convention on Tobacco Control (“FCTC”). Since it came into force in 2005, the FCTC has led to increased efforts by tobacco control advocates and public health organizations to promote increasingly restrictive regulatory measures on the marketing and sale of tobacco products to adult smokers. Regulatory initiatives that have been proposed, introduced or enacted include:
• restrictions on or licensing of outlets permitted to sell cigarettes;• the levying of substantial and increasing tax and duty charges;• restrictions or bans on advertising, marketing and sponsorship;• the display of larger health warnings, graphic health warnings and other labeling requirements;• restrictions on packaging design, including the use of colors, and plain packaging;• restrictions on packaging and cigarette formats and dimensions;• restrictions or bans on the display of tobacco product packaging at the point of sale and restrictions or bans on cigarette vending
machines;
7
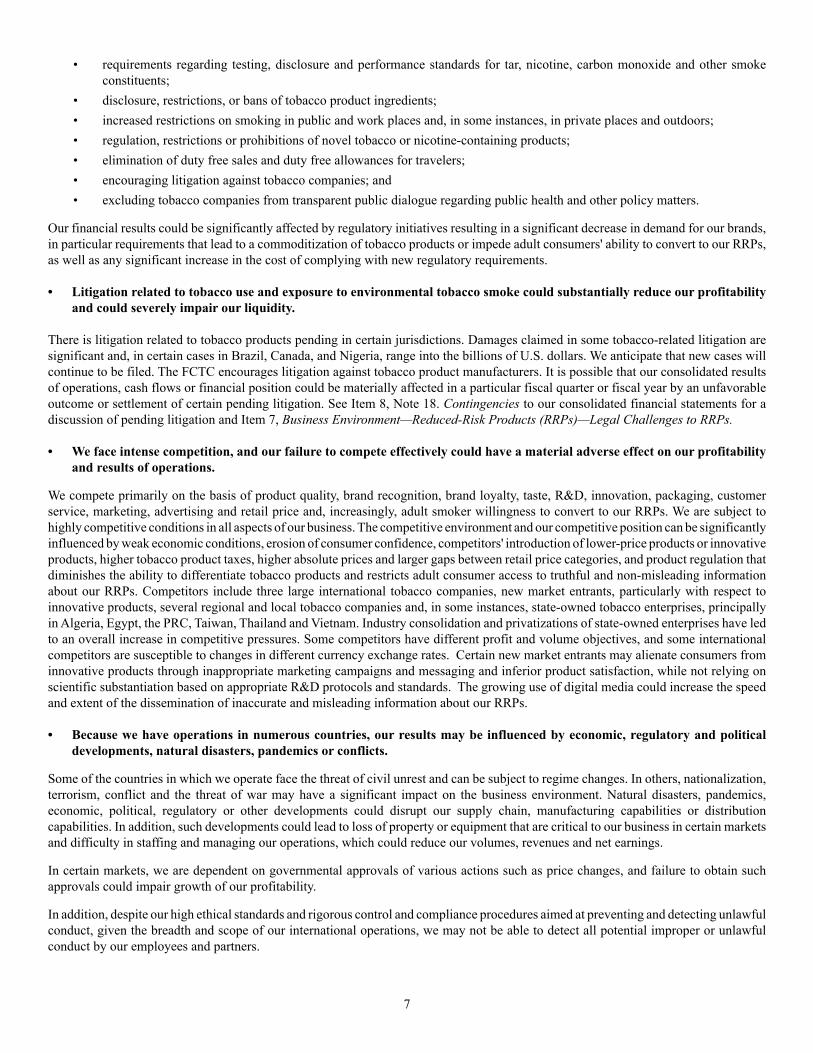
• requirements regarding testing, disclosure and performance standards for tar, nicotine, carbon monoxide and other smoke constituents;
• disclosure, restrictions, or bans of tobacco product ingredients;• increased restrictions on smoking in public and work places and, in some instances, in private places and outdoors;• regulation, restrictions or prohibitions of novel tobacco or nicotine-containing products;• elimination of duty free sales and duty free allowances for travelers; • encouraging litigation against tobacco companies; and• excluding tobacco companies from transparent public dialogue regarding public health and other policy matters.
Our financial results could be significantly affected by regulatory initiatives resulting in a significant decrease in demand for our brands, in particular requirements that lead to a commoditization of tobacco products or impede adult consumers' ability to convert to our RRPs, as well as any significant increase in the cost of complying with new regulatory requirements.
• Litigation related to tobacco use and exposure to environmental tobacco smoke could substantially reduce our profitability and could severely impair our liquidity.
There is litigation related to tobacco products pending in certain jurisdictions. Damages claimed in some tobacco-related litigation are significant and, in certain cases in Brazil, Canada, and Nigeria, range into the billions of U.S. dollars. We anticipate that new cases will continue to be filed. The FCTC encourages litigation against tobacco product manufacturers. It is possible that our consolidated results of operations, cash flows or financial position could be materially affected in a particular fiscal quarter or fiscal year by an unfavorable outcome or settlement of certain pending litigation. See Item 8, Note 18. Contingencies to our consolidated financial statements for a discussion of pending litigation and Item 7, Business Environment—Reduced-Risk Products (RRPs)—Legal Challenges to RRPs.
• We face intense competition, and our failure to compete effectively could have a material adverse effect on our profitability and results of operations.
We compete primarily on the basis of product quality, brand recognition, brand loyalty, taste, R&D, innovation, packaging, customer service, marketing, advertising and retail price and, increasingly, adult smoker willingness to convert to our RRPs. We are subject to highly competitive conditions in all aspects of our business. The competitive environment and our competitive position can be significantly influenced by weak economic conditions, erosion of consumer confidence, competitors' introduction of lower-price products or innovative products, higher tobacco product taxes, higher absolute prices and larger gaps between retail price categories, and product regulation that diminishes the ability to differentiate tobacco products and restricts adult consumer access to truthful and non-misleading information about our RRPs. Competitors include three large international tobacco companies, new market entrants, particularly with respect to innovative products, several regional and local tobacco companies and, in some instances, state-owned tobacco enterprises, principally in Algeria, Egypt, the PRC, Taiwan, Thailand and Vietnam. Industry consolidation and privatizations of state-owned enterprises have led to an overall increase in competitive pressures. Some competitors have different profit and volume objectives, and some international competitors are susceptible to changes in different currency exchange rates. Certain new market entrants may alienate consumers from innovative products through inappropriate marketing campaigns and messaging and inferior product satisfaction, while not relying on scientific substantiation based on appropriate R&D protocols and standards. The growing use of digital media could increase the speed and extent of the dissemination of inaccurate and misleading information about our RRPs.
• Because we have operations in numerous countries, our results may be influenced by economic, regulatory and political developments, natural disasters, pandemics or conflicts.
Some of the countries in which we operate face the threat of civil unrest and can be subject to regime changes. In others, nationalization, terrorism, conflict and the threat of war may have a significant impact on the business environment. Natural disasters, pandemics, economic, political, regulatory or other developments could disrupt our supply chain, manufacturing capabilities or distribution capabilities. In addition, such developments could lead to loss of property or equipment that are critical to our business in certain markets and difficulty in staffing and managing our operations, which could reduce our volumes, revenues and net earnings.
In certain markets, we are dependent on governmental approvals of various actions such as price changes, and failure to obtain such approvals could impair growth of our profitability.
In addition, despite our high ethical standards and rigorous control and compliance procedures aimed at preventing and detecting unlawful conduct, given the breadth and scope of our international operations, we may not be able to detect all potential improper or unlawful conduct by our employees and partners.

8
• We may be unable to anticipate changes in adult consumer preferences.
Our business is subject to changes in adult consumer preferences, which may be influenced by local economic conditions. To be successful, we must:
• promote brand equity successfully;• anticipate and respond to new adult consumer trends;• develop new products and markets and broaden brand portfolios;• improve productivity;• convince adult smokers to convert to our RRPs;• ensure adequate production capacity to meet demand for our products; and• be able to protect or enhance margins through price increases.
In periods of economic uncertainty, adult consumers may tend to purchase lower-price brands, and the volume of our premium-price and mid-price brands and our profitability could suffer accordingly. Such down-trading trends may be reinforced by regulation that limits branding, communication and product differentiation.
• The financial and business performance of our reduced-risk products is less predictable than our cigarette business.
Our RRPs are novel products in a new category, and the pace at which adult smokers adopt them may vary, depending on the competitive, regulatory, fiscal and cultural environment, and other factors in a specific market. There may be periods of accelerated growth and periods of slower growth for these products, the timing and drivers of which may be more difficult for us to predict versus our mature cigarette business. The impact of this lower predictability on our projected results for a specific period may be significant, particularly during the early stages of this new product category.
• We lose revenues as a result of counterfeiting, contraband, cross-border purchases, “illicit whites,” non-tax-paid volume produced by local manufacturers, and counterfeiting of our Platform 1 device and heated tobacco units.
Large quantities of counterfeit cigarettes are sold in the international market. We believe that Marlboro is the most heavily counterfeited international cigarette brand, although we cannot quantify the revenues we lose as a result of this activity. In addition, our revenues are reduced by contraband, legal cross-border purchases, “illicit whites” and non-tax-paid volume produced by local manufacturers. Our revenues and consumer satisfaction with our Platform 1 device and heated tobacco units may be adversely affected by counterfeit products that do not meet our product quality standards and scientific validation procedures.
• From time to time, we are subject to governmental investigations on a range of matters.
Investigations include allegations of contraband shipments of cigarettes, allegations of unlawful pricing activities within certain markets, allegations of underpayment of income taxes, customs duties and/or excise taxes, allegations of false and misleading usage of descriptors, allegations of unlawful advertising, and allegations of unlawful labor practices. We cannot predict the outcome of those investigations or whether additional investigations may be commenced, and it is possible that our business could be materially affected by an unfavorable outcome of pending or future investigations. See Item, 8, Note 18. Contingencies—Other Litigation and Item 7, Business Environment—Governmental Investigations for a description of certain governmental investigations to which we are subject.
• We may be unsuccessful in our attempts to introduce reduced-risk products, and regulators may not permit the commercialization of these products or the communication of scientifically substantiated risk-reduction claims.
Our key strategic priorities are: to develop and commercialize products that present less risk of harm to adult smokers who switch to those products versus continued smoking; and to convince current adult smokers who would otherwise continue to smoke to switch to those RRPs. For our efforts to be successful, we must: develop RRPs that such adult smokers find acceptable alternatives to smoking; conduct rigorous scientific studies to substantiate that they reduce exposure to harmful and potentially harmful constituents in smoke and, ultimately, that these products present, are likely to present, or have the potential to present less risk of harm to adult smokers who switch to them versus continued smoking; and effectively advocate for the development of science-based regulatory frameworks for the development and commercialization of RRPs, including communication of scientifically substantiated information to enable adult smokers to make better consumer choices. We might not succeed in our efforts. If we do not succeed, but others do, or if heat-not-burn products are inequitably regulated compared to other RRP categories without regard to the totality of the scientific evidence available for such products, we may be at a competitive disadvantage. In addition, actions of some market entrants, such as the inappropriate marketing of e-vapor products to youth, as well as alleged health consequences associated with the use of certain e-vapor products, may unfavorably impact public opinion and/or mischaracterize all e-vapor products or other RRPs to consumers, regulators and policy makers

9
without regard to the totality of scientific evidence for specific products. This may impede our efforts to advocate for the development of science-based regulatory frameworks for the development and commercialization of RRPs. We cannot predict whether regulators will permit the sale and/or marketing of RRPs with scientifically substantiated risk-reduction claims. Such restrictions could limit the success of our RRPs. Moreover, the FDA’s premarket tobacco product authorization of a version of our Platform 1 product is subject to strict marketing, reporting and other requirements and is not a guarantee that the product will remain authorized, particularly if there is a significant uptake in youth initiation.
• We may be unsuccessful in our efforts to differentiate reduced-risk products and cigarettes with respect to taxation.
To date, we have been largely successful in demonstrating to regulators that our RRPs are not cigarettes, and as such they are generally taxed either as a separate category or as other tobacco products, which typically yields more favorable tax rates than cigarettes. If we cease to be successful in these efforts, RRP unit margins may be adversely affected.
• Our reported results could be adversely affected by unfavorable currency exchange rates, and currency devaluations could impair our competitiveness.
We conduct our business primarily in local currency and, for purposes of financial reporting, the local currency results are translated into U.S. dollars based on average exchange rates prevailing during a reporting period. During times of a strengthening U.S. dollar, our reported net revenues, operating income and EPS will be reduced because the local currency translates into fewer U.S. dollars. During periods of local economic crises, foreign currencies may be devalued significantly against the U.S. dollar, reducing our margins. Actions to recover margins may result in lower volume and a weaker competitive position.
• Changes in the earnings mix and changes in tax laws may result in significant variability in our effective tax rates. Our ability to receive payments from foreign subsidiaries or to repatriate royalties and dividends could be restricted by local country currency exchange controls.
The Tax Cuts and Jobs Act that was signed into law in December 2017 constitutes a major change to the U.S. tax system. Our estimated impact of the Tax Cuts and Jobs Act is based on management’s current interpretations, and our analysis is ongoing. Our final tax liability may be materially different from current estimates due to developments such as implementing regulations and clarifications. In future periods, our effective tax rate and our ability to recover deferred tax assets could be subject to additional uncertainty as a result of such developments. Furthermore, changes in the earnings mix or applicable foreign tax laws may result in significant variability in our effective tax rates. Because we are a U.S. holding company, our most significant source of funds is distributions from our non-U.S. subsidiaries. Certain countries in which we operate have adopted or could institute currency exchange controls that limit or prohibit our local subsidiaries' ability to convert local currency into U.S. dollars or to make payments outside the country. This could subject us to the risks of local currency devaluation and business disruption.
• Our ability to grow profitability may be limited by our inability to introduce new products, enter new markets or improve our margins through higher pricing and improvements in our brand and geographic mix.
Our profit growth may suffer if we are unable to introduce new products or enter new markets successfully, to raise prices or to improve the proportion of our sales of higher margin products and in higher margin geographies.
• We may be unable to expand our brand portfolio through successful acquisitions or the development of strategic business relationships.
One element of our growth strategy is to strengthen our brand portfolio and market positions through selective acquisitions and the development of strategic business relationships. Acquisition and strategic business development opportunities are limited and present risks of failing to achieve efficient and effective integration, strategic objectives and anticipated revenue improvements and cost savings. There is no assurance that we will be able to acquire attractive businesses on favorable terms, or that future acquisitions or strategic business developments will be accretive to earnings.
• Government mandated prices, production control programs, shifts in crops driven by economic conditions and the impact of climate change may increase the cost or reduce the quality of the tobacco and other agricultural products used to manufacture our products.
As with other agricultural commodities, the price of tobacco leaf and cloves can be influenced by imbalances in supply and demand, and crop quality can be influenced by variations in weather patterns, including those caused by climate change. Tobacco production in certain countries is subject to a variety of controls, including government mandated prices and production control programs. Changes in the

10
patterns of demand for agricultural products could cause farmers to produce less tobacco or cloves. Any significant change in tobacco leaf and clove prices, quality and quantity could affect our profitability and our business.
• Our ability to achieve our strategic goals may be impaired if we fail to attract and retain the best global talent.
To be successful, we must continue transforming our culture and ways of working, align our talent with our business needs, innovate and transform to a consumer-centric business. We compete for talent, including in areas that are new to us, such as digital and technical solutions, with companies in the consumer products, technology and other sectors that enjoy greater societal acceptance. As a result, we may be unable to attract and retain the best global talent with the right degree of diversity, experience and skills to achieve our strategic goals.
• The failure of our information systems to function as intended or their penetration by outside parties with the intent to corrupt them or our failure to comply with privacy laws and regulations could result in business disruption, litigation and regulatory action, and loss of revenue, assets or personal or other confidential data.
We use information systems to help manage business processes, collect and interpret data and communicate internally and externally with employees, suppliers, consumers, customers and others. Some of these information systems are managed by third-party service providers. We have backup systems and business continuity plans in place, and we take care to protect our systems and data from unauthorized access. Nevertheless, failure of our systems to function as intended, or penetration of our systems by outside parties intent on extracting or corrupting information or otherwise disrupting business processes, could place us at a competitive disadvantage, result in a loss of revenue, assets or personal or other sensitive data, litigation and regulatory action, cause damage to our reputation and that of our brands and result in significant remediation and other costs. Failure to protect personal data, respect the rights of data subjects, and adhere to strict cybersecurity protocols could subject us to substantial fines and other legal challenges under regulations such as the EU General Data Protection Regulation. As we are increasingly relying on digital platforms in our business, the magnitude of these risks is likely to increase.
• We may be unable to adequately protect our intellectual property rights, and disputes relating to intellectual property rights could harm our business.
Our intellectual property rights are valuable assets, and their protection is important to our business. If the steps we take to protect our intellectual property rights globally, including through a combination of trademark, design, patent and other intellectual property rights, are inadequate, or if others infringe or misappropriate our intellectual property rights, notwithstanding legal protection, our business could suffer. Intellectual property rights of third parties may limit our ability to introduce new products or improve the quality of existing products in one or more markets. Competitors or other third parties may claim that we infringe their intellectual property rights. Any such claims, regardless of merit, could divert management’s attention, be costly, disruptive, time-consuming and unpredictable and expose us to litigation costs and damages, and impede our ability to manufacture and sell new products or improve existing products. If, as a result, we are unable to manufacture or sell our RRPs or improve their quality in one or more markets, our ability to convert adult smokers to our RRPs in such markets would be adversely affected.
• We may be required to replace third-party contract manufacturers or service providers with our own resources.
In certain instances, we contract with third parties to manufacture some of our products or product parts or to provide other services. We may be unable to renew these agreements on satisfactory terms for numerous reasons, including government regulations. Accordingly, our costs may increase significantly if we must replace such third parties with our own resources.
Item 1B. Unresolved Staff Comments. None.
Item 2. Properties. We own or lease various manufacturing, office and research and development facilities in locations primarily outside the United States. We own properties in Switzerland where our operations center and state-of-the-art research and development facility are located.

11
At December 31, 2019, we operated and owned a total of 38 manufacturing facilities across our six operating segments. Among them, 7 factories produced heated tobacco units.
In 2019, certain facilities each manufactured over 30 billion units (cigarettes and heated tobacco units combined). The largest manufacturing facilities, in terms of volume, are located in Indonesia (S&SA), Turkey (ME&A), the Philippines (S&SA), Russia (EE), Poland (EU), Lithuania (EU), and Italy (EU). As part of our global operating model, products manufactured in a particular manufacturing facility are not necessarily distributed in the operating segment where the facility is located.
We have integrated the production of our heated tobacco units into a number of our existing manufacturing facilities, and we are progressing with our plans to build manufacturing capacity for our other RRP platforms. We will continue to optimize our manufacturing infrastructure.
We believe the properties owned or leased by our subsidiaries are maintained in good condition and are believed to be suitable and adequate for our present needs.
Item 3. Legal Proceedings.
The information called for by this Item is incorporated herein by reference to Item 8, Note 18. Contingencies.
Item 4. Mine Safety Disclosures. Not applicable.
PART II
Item 5. Market for Registrant’s Common Equity, Related Stockholder Matters and Issuer Purchases of Equity Securities.
The principal stock exchange on which our common stock (no par value) is listed is the New York Stock Exchange (ticker symbol "PM"). At January 31, 2020, there were approximately 50,800 holders of record of our common stock.

12
Performance Graph
The graph below compares the cumulative total shareholder return on PMI's common stock with the cumulative total return for the same period of PMI's Peer Group and the S&P 500 Index. The graph assumes the investment of $100 as of December 31, 2014, in PMI common stock (at prices quoted on the New York Stock Exchange) and each of the indices as of the market close and reinvestment of dividends on a quarterly basis.
Date PMI PMI Peer Group (1) S&P 500 IndexDecember 31, 2014 $100.00 $100.00 $100.00December 31, 2015 $113.40 $108.20 $101.40December 31, 2016 $123.10 $109.70 $113.50December 31, 2017 $147.60 $130.20 $138.30December 31, 2018 $98.60 $118.30 $132.20December 31, 2019 $133.00 $146.40 $173.90
(1) The PMI Peer Group presented in this graph is the same as that used in the prior year. The PMI Peer Group was established based on a review of four characteristics: global presence; a focus on consumer products; and net revenues and a market capitalization of a similar size to those of PMI. The review also considered the primary international tobacco companies. As a result of this review, the following companies constitute the PMI Peer Group: Altria Group, Inc., Anheuser-Busch InBev SA/NV, British American Tobacco p.l.c., The Coca-Cola Company, Colgate-Palmolive Co., Diageo plc, Heineken N.V., Imperial Brands PLC, Japan Tobacco Inc., Johnson & Johnson, Kimberly-Clark Corporation, The Kraft-Heinz Company, McDonald's Corp., Mondel z International, Inc., Nestlé S.A., PepsiCo, Inc., The Procter & Gamble Company, Roche Holding AG, and Unilever NV and PLC.
Note: Figures are rounded to the nearest $0.10.

13
Issuer Purchases of Equity Securities During the Quarter Ended December 31, 2019
Our share repurchase activity for each of the three months in the quarter ended December 31, 2019, was as follows:
Period
TotalNumber of
SharesRepurchased
AveragePrice Paidper Share
Total Numberof Shares
Purchased asPart of Publicly
AnnouncedPlans or
Programs
ApproximateDollar Value
of Shares thatMay Yet bePurchased
Under the Plansor Programs
October 1, 2019 –October 31, 2019 (1) — $ — — $ —November 1, 2019 –November 30, 2019 (1) — $ — — $ —December 1, 2019 –December 31, 2019 (1) — $ — — $ —Pursuant to Publicly Announced Plans or Programs — $ —
October 1, 2019 –October 31, 2019 (2) 897 $ 75.37
November 1, 2019 –November 30, 2019 (2) 690 $ 81.33
December 1, 2019 –December 31, 2019 (2) 1,186 $ 82.69
For the Quarter Ended December 31, 2019 2,773 $ 79.98
(1) During this reporting period, we did not have an authorized share repurchase program.
(2) Shares repurchased represent shares tendered to us by employees who vested in restricted and performance share unit awards and used shares to pay all, or a portion of, the related taxes.
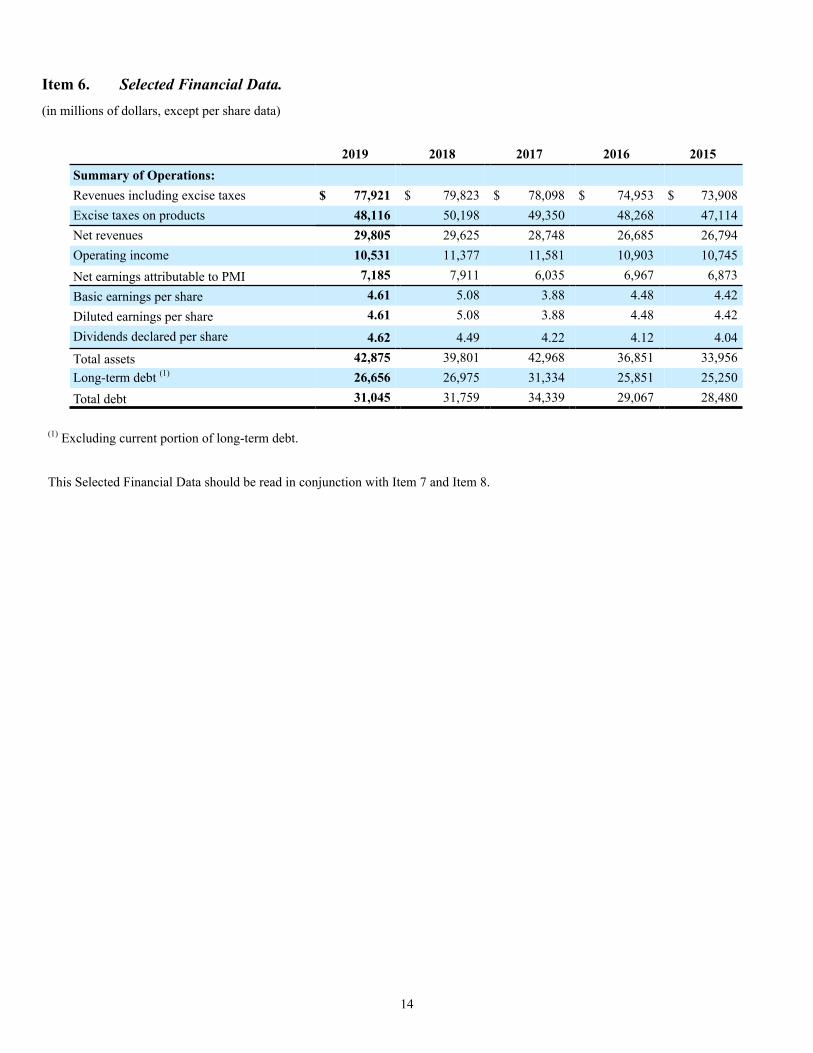
14
Item 6. Selected Financial Data.(in millions of dollars, except per share data)
2019 2018 2017 2016 2015Summary of Operations:Revenues including excise taxes $ 77,921 $ 79,823 $ 78,098 $ 74,953 $ 73,908Excise taxes on products 48,116 50,198 49,350 48,268 47,114Net revenues 29,805 29,625 28,748 26,685 26,794Operating income 10,531 11,377 11,581 10,903 10,745Net earnings attributable to PMI 7,185 7,911 6,035 6,967 6,873Basic earnings per share 4.61 5.08 3.88 4.48 4.42Diluted earnings per share 4.61 5.08 3.88 4.48 4.42Dividends declared per share 4.62 4.49 4.22 4.12 4.04Total assets 42,875 39,801 42,968 36,851 33,956Long-term debt (1) 26,656 26,975 31,334 25,851 25,250Total debt 31,045 31,759 34,339 29,067 28,480
(1) Excluding current portion of long-term debt.
This Selected Financial Data should be read in conjunction with Item 7 and Item 8.

15
Item 7. Management’s Discussion and Analysis of Financial Condition and Results of Operations. The following discussion should be read in conjunction with the other sections of this Annual Report on Form 10-K, including the consolidated financial statements and related notes contained in Item 8, and the discussion of risks and cautionary factors that may affect future results in Item 1A. Risk Factors.
Description of Our Company
We are leading a transformation in the tobacco industry to create a smoke-free future and ultimately replace cigarettes with smoke-free products to the benefit of adults who would otherwise continue to smoke, society, the company and its shareholders. We are a leading international tobacco company engaged in the manufacture and sale of cigarettes, as well as smoke-free products and associated electronic devices and accessories, and other nicotine-containing products in markets outside the United States. In addition, we ship a version of our Platform 1 device and its consumables authorized by the U.S. Food and Drug Administration ("FDA") to Altria Group, Inc., for sale in the United States under license. We are building a future on a new category of smoke-free products that, while not risk free, are a much better choice than continuing to smoke. Through multidisciplinary capabilities in product development, state-of-the-art facilities and scientific substantiation, we aim to ensure that our smoke-free products meet adult consumer preferences and rigorous regulatory requirements. Our IQOS smoke-free product brand portfolio includes heat-not-burn tobacco and nicotine-containing vapor products.
We manage our business in six operating segments:
• European Union ("EU");
• Eastern Europe ("EE");
• Middle East & Africa ("ME&A"), which includes our international duty free business;
• South & Southeast Asia ("S&SA");
• East Asia & Australia ("EA&A"); and
• Latin America & Canada ("LA&C"), which includes transactions under license with Altria Group, Inc. for the distribution of our Platform 1 product in the United States.
Our cigarettes are sold in more than 180 markets, and in many of these markets they hold the number one or number two market share position. We have a wide range of premium, mid-price and low-price brands. Our portfolio comprises both international and local brands. In addition to the manufacture and sale of cigarettes, we are engaged in the development and commercialization of reduced-risk products ("RRPs"). RRPs is the term we use to refer to products that present, are likely to present, or have the potential to present less risk of harm to smokers who switch to these products versus continuing smoking.
We use the term net revenues to refer to our operating revenues from the sale of our products, including shipping and handling charges billed to customers, net of sales and promotion incentives, and excise taxes. Our net revenues and operating income are affected by various factors, including the volume of products we sell, the price of our products, changes in currency exchange rates and the mix of products we sell. Mix is a term used to refer to the proportionate value of premium-price brands to mid-price or low-price brands in any given market (product mix). Mix can also refer to the proportion of shipment volume in more profitable markets versus shipment volume in less profitable markets (geographic mix).
Our cost of sales consists principally of: tobacco leaf, non-tobacco raw materials, labor and manufacturing costs; shipping and handling costs; and the cost of the IQOS devices produced by third-party electronics manufacturing service providers. Estimated costs associated with IQOS warranty programs are generally provided for in cost of sales in the period the related revenues are recognized.
Our marketing, administration and research costs include the costs of marketing and selling our products, other costs generally not related to the manufacture of our products (including general corporate expenses), and costs incurred to develop new products. The most significant components of our marketing, administration and research costs are marketing and sales expenses and general and administrative expenses.
Philip Morris International Inc. is a legal entity separate and distinct from its direct and indirect subsidiaries. Accordingly, our right, and thus the right of our creditors and stockholders, to participate in any distribution of the assets or earnings of any subsidiary is subject to the prior rights of creditors of such subsidiary, except to the extent that claims of our company itself as a creditor may be recognized. As a holding company, our principal sources of funds, including funds to make payment on our debt securities, are from the receipt of
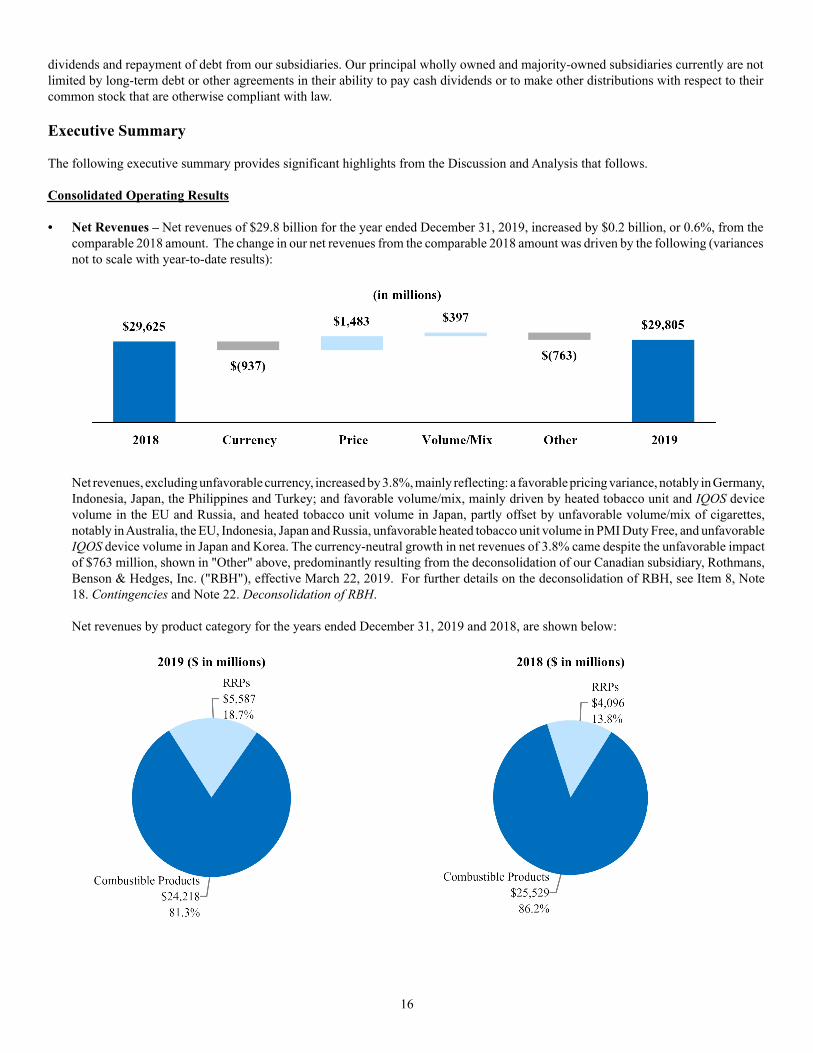
16
dividends and repayment of debt from our subsidiaries. Our principal wholly owned and majority-owned subsidiaries currently are not limited by long-term debt or other agreements in their ability to pay cash dividends or to make other distributions with respect to their common stock that are otherwise compliant with law.
Executive Summary
The following executive summary provides significant highlights from the Discussion and Analysis that follows.
Consolidated Operating Results
• Net Revenues – Net revenues of $29.8 billion for the year ended December 31, 2019, increased by $0.2 billion, or 0.6%, from the comparable 2018 amount. The change in our net revenues from the comparable 2018 amount was driven by the following (variances not to scale with year-to-date results):
Net revenues, excluding unfavorable currency, increased by 3.8%, mainly reflecting: a favorable pricing variance, notably in Germany, Indonesia, Japan, the Philippines and Turkey; and favorable volume/mix, mainly driven by heated tobacco unit and IQOS device volume in the EU and Russia, and heated tobacco unit volume in Japan, partly offset by unfavorable volume/mix of cigarettes, notably in Australia, the EU, Indonesia, Japan and Russia, unfavorable heated tobacco unit volume in PMI Duty Free, and unfavorable IQOS device volume in Japan and Korea. The currency-neutral growth in net revenues of 3.8% came despite the unfavorable impact of $763 million, shown in "Other" above, predominantly resulting from the deconsolidation of our Canadian subsidiary, Rothmans, Benson & Hedges, Inc. ("RBH"), effective March 22, 2019. For further details on the deconsolidation of RBH, see Item 8, Note 18. Contingencies and Note 22. Deconsolidation of RBH.
Net revenues by product category for the years ended December 31, 2019 and 2018, are shown below:

17
• Diluted Earnings Per Share – The changes in our reported diluted earnings per share (“diluted EPS”) for the year ended December 31, 2019, from the comparable 2018 amounts, were as follows:
Diluted EPS% Growth(Decline)
For the year ended December 31, 2018 $ 5.08
2018 Asset impairment and exit costs —2018 Tax items 0.02
Subtotal of 2018 items 0.02
2019 Asset impairment and exit costs (0.23)2019 Canadian tobacco litigation-related expense (0.09)2019 Loss on deconsolidation of RBH (0.12)2019 Russia excise and VAT audit charge (0.20)2019 Fair value adjustment for equity security investments 0.022019 Tax items 0.04
Subtotal of 2019 items (0.58)
Currency (0.13)Interest 0.04Change in tax rate (0.04)Operations 0.22For the year ended December 31, 2019 $ 4.61 (9.3)%
Income taxes – The 2018 Tax items that decreased our 2018 diluted EPS by $0.02 per share in the table above represented a current income tax charge of $185 million primarily due to an increase in our final 2017 transition tax liability, mostly offset by a deferred income tax benefit of $154 million primarily due to the recognition of deferred tax assets for net operating losses in the state of New York.
The 2019 Tax items that increased our 2019 diluted EPS by $0.04 per share in the table above was primarily due to a reduction in estimated U.S. federal income tax on dividend repatriation for the years 2015-2018 ($67 million).
The change in the tax rate that decreased our diluted EPS by $0.04 per share in the table above was primarily due to changes in earnings mix by taxing jurisdiction and U.S. state deferred income tax expense, partially offset by repatriation cost differences.
For further details, see Item 8, Note 11. Income Taxes.
Asset impairment and exit costs – As a part of the optimization of our global manufacturing infrastructure, we recorded pre-tax asset impairment and exit costs of $422 million during 2019, representing $362 million net of income tax and a diluted EPS charge of $0.23 per share. This charge primarily related to a cigarette plant closure in Berlin, Germany (approximately $0.19 per share), as well as the closure of a cigarette plant in Argentina, Colombia and Pakistan. The total pre-tax charge was included in marketing, administration and research costs on the consolidated statements of earnings. For further details, see Item 8, Note 21. Asset Impairment and Exit Costs.
Canadian tobacco litigation-related expense – In the first quarter of 2019, we recorded a pre-tax charge of $194 million, representing $142 million net of tax, relating to the judgment against RBH in two Québec smoking and health class actions. The charge of $0.09per share reflects our assessment of the portion of the judgment that represents probable and estimable loss prior to the deconsolidation of RBH and corresponds to the trust account deposit required by the judgment. The total pre-tax charge was included in marketing, administration and research costs on the consolidated statements of earnings and was included in the operating income of the Latin America & Canada segment. For further details, see Item 8, Note 18. Contingencies and Item 8, Note 22. Deconsolidation of RBH.

18
Loss on deconsolidation of RBH – Following the judgment in the two Québec smoking and health class actions, RBH obtained an initial order from the Ontario Superior Court of Justice granting it protection under the Companies’ Creditors Arrangement Act (“CCAA”), which is a Canadian federal law that permits a Canadian business to restructure its affairs while carrying on its business in the ordinary course with minimal disruption to its customers, suppliers and employees. The administration of the CCAA process, principally relating to the powers provided to the court and the court appointed monitor, removes certain elements of control of the business from both PMI and RBH. As a result, we have determined that we no longer have a controlling financial interest over RBH and that we do not exert "significant influence" over RBH under U.S. GAAP. Therefore, we deconsolidated RBH as of the date of the CCAA filing on March 22, 2019, and will account for our continuing investment in RBH as an equity security, without readily determinable fair value.
A loss on the deconsolidation of RBH of $239 million was included in marketing, administration and research costs on the consolidated statements of earnings and was included in the operating income of the Latin America & Canada segment. The $0.12 per share impact also included a tax benefit of $49 million within the provision for income taxes, as discussed above, related to the reversal of a deferred tax liability on the unremitted earnings of RBH. For further details, see Item 8, Note 18. Contingencies and Item 8, Note 22. Deconsolidation of RBH.
Russia excise and VAT audit charge – As a result of the final tax assessment for the 2015-2017 financial years received by our Russian affiliate, in the third quarter of 2019, PMI recorded a pre-tax charge of $374 million in marketing, administration and research costs in the consolidated statements of earnings, representing $315 million net of income tax and a diluted EPS charge of $0.20. The pre-tax charge of $374 million was included in the operating income of the Eastern Europe segment. For further details, see Item 8, Note 18. Contingencies.
Fair Value adjustment for equity security investments – In the fourth quarter of 2019, PMI recorded a favorable fair value adjustment for its equity security investments of $35 million after tax (or $0.02 per share increase in diluted EPS). The fair value adjustment for its equity security investments was included in equity investments and securities (income)/loss, net ($44 million income) and provision for income taxes ($9 million expense) on the consolidated statements of earnings in 2019. For further details, see Item 8, Note 16. Fair Value Measurements.
Currency – The unfavorable currency impact during 2019 results from the fluctuations of the U.S. dollar, especially against the Euro, Russian ruble and Turkish lira. This unfavorable currency movement has impacted our profitability across our primary revenue markets and local currency cost bases.
Interest – The favorable impact of interest was due primarily to our ongoing efforts to optimize our capital structure following the passage of the U.S. Tax Cuts and Jobs Act. This included the decision to use existing cash to repay $2.5 billion and $4.0 billion of long-term debt that matured in 2018 and in 2019, respectively.
Operations – The increase in diluted EPS of $0.22 from our operations in the table above was due primarily to the following segments:
• European Union: Favorable volume/mix and favorable pricing, partially offset by higher marketing, administration and research costs and higher manufacturing costs;
• South & Southeast Asia: Favorable pricing and lower manufacturing costs, partially offset by unfavorable volume/mix and higher marketing, administration and research costs;
• Middle East & Africa: Favorable pricing, lower manufacturing costs and lower marketing, administration and research costs, partially offset by unfavorable volume/mix; and
• East Asia & Australia: Favorable pricing and lower manufacturing costs, partially offset by unfavorable volume/mix and higher marketing, administration and research costs;
partially offset by
• Latin America & Canada: Unfavorable impact resulting from the deconsolidation of RBH, as well as unfavorable volume/mix, partially offset by lower marketing, administration and research costs, favorable pricing and lower manufacturing costs; and
• Eastern Europe: Higher marketing, administration and research costs and higher manufacturing costs, partially offset by favorable volume/mix and favorable pricing.
For further details, see the Consolidated Operating Results and Operating Results by Business Segment sections of the following Discussion and Analysis.

19
Discussion and Analysis
Critical Accounting Estimates
Item 8, Note 2. Summary of Significant Accounting Policies to our consolidated financial statements includes a summary of the significant accounting policies and methods used in the preparation of our consolidated financial statements. In most instances, we must use a particular accounting policy or method because it is the only one that is permitted under U.S. GAAP.
The preparation of financial statements requires that we use estimates and assumptions that affect the reported amounts of our assets, liabilities, net revenues and expenses, as well as our disclosure of contingencies. If actual amounts differ from previous estimates, we include the revisions in our consolidated results of operations in the period during which we know the actual amounts. Historically, aggregate differences, if any, between our estimates and actual amounts in any year have not had a significant impact on our consolidated financial statements.
The selection and disclosure of our critical accounting estimates have been discussed with our Audit Committee. The following is a discussion of the more significant assumptions, estimates, accounting policies and methods used in the preparation of our consolidated financial statements:
Revenue Recognition - We recognize revenue as performance obligations are satisfied. Our primary performance obligation is the distribution and sales of cigarettes and other nicotine-containing products, including reduced-risk products. Our performance obligations are typically satisfied upon shipment or delivery to our customers. The company estimates the cost of sales returns based on historical experience, and these estimates are immaterial. Estimated costs associated with warranty programs for IQOS devices are generally provided for in cost of sales in the period the related revenues are recognized, based on a number of factors, including historical experience, product failure rates and warranty policies. The transaction price is typically based on the amount billed to the customer and includes estimated variable consideration where applicable. Such variable consideration is typically not constrained and is estimated based on the most likely amount that PMI expects to be entitled to under the terms of the contracts with customers, historical experience of discount or rebate redemption, where relevant, and the terms of any underlying discount or rebate programs, which may change from time to time as the business and product categories evolve.
Inventories - Our inventories are valued at the lower of cost or market based upon assumptions about future demand and market conditions. The valuation of inventory also requires us to estimate obsolete and excess inventory. We perform regular reviews of our inventory on hand, as well as our future purchase commitments with our suppliers, considering multiple factors, including demand forecasts, product life cycle, current sales levels, pricing strategy and cost trends. If our review indicates that inventories of raw materials, components or finished products have become obsolete or are in excess of anticipated demand or that inventory cost exceeds net realizable value, we may be required to make adjustments that will impact the results of operations.
Goodwill and Non-Amortizable Intangible Assets Valuation - We test goodwill and non-amortizable intangible assets for impairment annually or more frequently if events occur that would warrant such review. While the company has the option to perform a qualitative assessment for both goodwill and non-amortizable intangible assets to determine if it is more likely than not that an impairment exists, the company elects to perform the quantitative assessment for our annual impairment analysis. The impairment analysis involves comparing the fair value of each reporting unit or non-amortizable intangible asset to the carrying value. If the carrying value exceeds the fair value, goodwill or a non-amortizable intangible asset is considered impaired. To determine the fair value of goodwill, we primarily use a discounted cash flow model, supported by the market approach using earnings multiples of comparable global and local companies within the tobacco industry. At December 31, 2019, the carrying value of our goodwill was $5.9 billion, which is related to ten reporting units, each of which consists of a group of markets with similar economic characteristics. The estimated fair value of each of our ten reporting units exceeded the carrying value as of December 31, 2019. To determine the fair value of non-amortizable intangible assets, we primarily use a discounted cash flow model applying the relief-from-royalty method. We concluded that the fair value of our non-amortizable intangible assets exceeded the carrying value. These discounted cash flow models include management assumptions relevant for forecasting operating cash flows, which are subject to changes in business conditions, such as volumes and prices, costs to produce, discount rates and estimated capital needs. Management considers historical experience and all available information at the time the fair values are estimated, and we believe these assumptions are consistent with the assumptions a hypothetical marketplace participant would use. Since the March 28, 2008, spin-off from Altria Group, Inc., we have not recorded a charge to earnings for an impairment of goodwill or non-amortizable intangible assets.
Marketing Costs - We incur certain costs to support our products through programs that include advertising, marketing, consumer engagement and trade promotions. The costs of our advertising and marketing programs are expensed in accordance with U.S. GAAP. Recognition of the cost related to our consumer engagement and trade promotion programs contain uncertainties due to the judgment

20
required in estimating the potential performance and compliance for each program. For volume-based incentives provided to customers, management continually assesses and estimates, by customer, the likelihood of the customer's achieving the specified targets, and records the reduction of revenue as the sales are made. For other trade promotions, management relies on estimated utilization rates that have been developed from historical experience. Changes in the assumptions used in estimating the cost of any individual marketing program would not result in a material change in our financial position, results of operations or operating cash flows.
Employee Benefit Plans - As discussed in Item 8, Note 13. Benefit Plans to our consolidated financial statements, we provide a range of benefits to our employees and retired employees, including pensions, postretirement health care and postemployment benefits (primarily severance). We record annual amounts relating to these plans based on calculations specified by U.S. GAAP. These calculations include various actuarial assumptions, such as discount rates, assumed rates of return on plan assets, compensation increases, mortality, turnover rates and health care cost trend rates. We review actuarial assumptions on an annual basis and make modifications to the assumptions based on current rates and trends when it is deemed appropriate to do so. As permitted by U.S. GAAP, any effect of the modifications is generally amortized over future periods. We believe that the assumptions utilized in calculating our obligations under these plans are reasonable based upon our historical experience and advice from our actuaries.
Weighted-average discount rate assumptions for pension and postretirement plan obligations at December 31, 2019 and 2018 are as follows:
2019 2018Pension plans 0.83% 1.61%Postretirement plans 3.28% 3.97%
We anticipate that assumption changes will increase 2020 pre-tax pension and postretirement expense to approximately $256 million as compared with approximately $201 million in 2019, excluding amounts related to employee severance and early retirement programs. The anticipated increase is primarily due to higher amortization of unrecognized actuarial gains/losses of $73 million, coupled with higher service cost of $48 million, partially offset by lower interest cost of $49 million and higher expected return on plan assets of $18 million and other movements of $1 million.
Weighted-average expected rate of return and discount rate assumptions have a significant effect on the amount of expense reported for the employee benefit plans. A fifty-basis-point decrease in our discount rate would increase our 2020 pension and postretirement expense by approximately $65 million, and a fifty-basis-point increase in our discount rate would decrease our 2020 pension and postretirement expense by approximately $58 million. Similarly, a fifty-basis-point decrease (increase) in the expected return on plan assets would increase (decrease) our 2020 pension expense by approximately $36 million.
Income Taxes - Income tax provisions for jurisdictions outside the United States, as well as state and local income tax provisions, are determined on a separate company basis, and the related assets and liabilities are recorded in our consolidated balance sheets.
The extent of our operations involves dealing with uncertainties and judgments in the application of complex tax regulations in a multitude of jurisdictions. The final taxes paid are dependent upon many factors, including negotiations with taxing authorities in various jurisdictions and resolution of disputes arising from federal, state, and international tax audits. In accordance with the authoritative guidance for income taxes, we evaluate potential tax exposures and record tax liabilities for anticipated tax audit issues based on our estimate of whether, and the extent to which, additional taxes will be due. We adjust these reserves in light of changing facts and circumstances; however, due to the complexity of some of these uncertainties, the ultimate resolution may result in a payment that is materially different from our current estimate of the tax liabilities. If our estimate of tax liabilities proves to be less than the ultimate assessment, an additional charge to expense would result. If payment of these amounts ultimately proves to be less than the recorded amounts, the reversal of the liabilities would result in tax benefits being recognized in the period when we determine the liabilities are no longer necessary.
We are required to assess the likelihood of recovering deferred tax assets against future sources of taxable income. If we determine, using all available evidence, that we do not reach the more likely than not threshold for recovery, a valuation allowance is recorded. Significant judgment is required in determining the need for and amount of valuation allowances for deferred tax assets including estimates of future taxable income in the applicable jurisdictions and the feasibility of on-going tax planning strategies, as applicable.
The effective tax rates used for interim reporting are based on our full-year geographic earnings mix projections. Changes in currency exchange rates or earnings mix by taxing jurisdiction could have an impact on the effective tax rates. Significant judgment is required in determining income tax provisions and in evaluating tax positions.
For further details, see Item 8, Note 11. Income Taxes to our consolidated financial statements.

21
Hedging - As discussed below in “Market Risk,” we use derivative financial instruments principally to reduce exposures to market risks resulting from fluctuations in foreign currency exchange and interest rates by creating offsetting exposures. For derivatives to which we have elected to apply hedge accounting, gains and losses on these derivatives are initially deferred in accumulated other comprehensive losses on the consolidated balance sheet and recognized in the consolidated statement of earnings into the same line item as the impact of the underlying transaction and in the periods when the related hedged transactions are also recognized in operating results. If we had elected not to use the hedge accounting provisions, gains (losses) deferred in stockholders’ (deficit) equity would have been recorded in our net earnings for these derivatives.
Fair value of non-marketable equity securities - For further details, see Item 8, Note 22. Deconsolidation of RBH.
Contingencies - As discussed in Item 8, Note 18. Contingencies to our consolidated financial statements, legal proceedings covering a wide range of matters are pending or threatened against us, and/or our subsidiaries, and/or our indemnitees in various jurisdictions. We and our subsidiaries record provisions in the consolidated financial statements for pending litigation when we determine that an unfavorable outcome is probable and the amount of the loss can be reasonably estimated. The variability in pleadings in multiple jurisdictions, together with the actual experience of management in litigating claims, demonstrate that the monetary relief that may be specified in a lawsuit bears little relevance to the ultimate outcome. Much of the tobacco-related litigation is in its early stages, and litigation is subject to uncertainty. At the present time, except as stated otherwise in Item 8, Note 18. Contingencies, while it is reasonably possible that an unfavorable outcome in a case may occur, after assessing the information available to it: (i) management has not concluded that it is probable that a loss has been incurred in any of the pending tobacco-related cases; (ii) management is unable to estimate the possible loss or range of loss for any of the pending tobacco-related cases; and (iii) accordingly, no estimated loss has been accrued in the consolidated financial statements for unfavorable outcomes in these cases, if any. Legal defense costs are expensed as incurred.
Consolidated Operating Results Our net revenues and operating income by segment were as follows:
(in millions) 2019 2018 2017Net Revenues
European Union $ 9,817 $ 9,298 $ 8,318Eastern Europe 3,282 2,921 2,711Middle East & Africa 4,042 4,114 3,988South & Southeast Asia 5,094 4,656 4,417East Asia & Australia 5,364 5,580 6,373Latin America & Canada 2,206 3,056 2,941
Net revenues $ 29,805 $ 29,625 $ 28,748
Operating IncomeEuropean Union $ 3,970 $ 4,105 $ 3,691Eastern Europe 547 902 887Middle East & Africa 1,684 1,627 1,884South & Southeast Asia 2,163 1,747 1,514East Asia & Australia 1,932 1,851 2,608Latin America & Canada 235 1,145 997
Operating income $ 10,531 $ 11,377 $ 11,581
Items affecting the comparability of results from operations were as follows:
• Russia excise and VAT audit charge - See Item 8, Note 18. Contingencies for details of the $374 million pre-tax charge included in the Eastern Europe segment for the year ended December 31, 2019.
• Asset impairment and exit costs - See Item 8, Note 21. Asset Impairment and Exit Costs for details of the $422 million pre-tax charge for the year ended December 31, 2019, as well as a breakdown of these costs by segment.
• Canadian tobacco litigation-related expense - See Item 8, Note 18. Contingencies and Note 22. Deconsolidation of RBH for details of the $194 million pre-tax charge included in the Latin America & Canada segment for the year ended December 31, 2019.

22
• Loss on deconsolidation of RBH - See Item 8, Note 22. Deconsolidation of RBH for details of the $239 million loss included in the Latin America & Canada segment for the year ended December 31, 2019.
Our net revenues by product category were as follows:
PMI Net Revenues by Product Category
(in millions) 2019 2018 2017
Combustible ProductsEuropean Union $ 8,093 $ 8,433 $ 8,048Eastern Europe 2,438 2,597 2,657Middle East & Africa 3,721 3,732 3,893South & Southeast Asia 5,094 4,656 4,417East Asia & Australia 2,693 3,074 3,156Latin America & Canada 2,179 3,037 2,937
Total Combustible Products $ 24,218 $ 25,529 $ 25,107
Reduced-Risk ProductsEuropean Union $ 1,724 $ 865 $ 269Eastern Europe 844 324 55Middle East & Africa 321 382 94South & Southeast Asia — — —East Asia & Australia 2,671 2,506 3,218Latin America & Canada 27 19 4
Total Reduced-Risk Products $ 5,587 $ 4,096 $ 3,640
Total PMI Net Revenues $ 29,805 $ 29,625 $ 28,748Note: Sum of product categories or Regions might not foot to total PMI due to rounding.
Net revenues related to combustible products refer to the operating revenues generated from the sale of these products, including shipping and handling charges billed to customers, net of sales and promotion incentives, and excise taxes. These net revenue amounts consist of the sale of our cigarettes and other tobacco products combined. Other tobacco products primarily include roll-your-own and make-your-own cigarettes, pipe tobacco, cigars and cigarillos and do not include reduced-risk products.
Net revenues related to reduced-risk products refer to the operating revenues generated from the sale of these products, including shipping and handling charges billed to customers, net of sales and promotion incentives, and excise taxes. These net revenue amounts consist of the sale of our heated tobacco units, IQOS devices and related accessories, and other nicotine-containing products, which primarily include our e-vapor products.
We recognize revenue when control is transferred to the customer, typically either upon shipment or delivery of goods.
Revenues from shipments of Platform 1 devices, heated tobacco units and accessories to Altria Group, Inc., commencing in the third quarter of 2019, for sale under license in the United States, are included in Net Revenues of the Latin America & Canada segment.
References to "Cost/Other" in the Consolidated Financial Summary table of total PMI and the six operating segments throughout this "Discussion and Analysis" reflects the currency-neutral variances of: cost of sales (excluding the volume/mix cost component); marketing, administration and research costs (including asset impairment and exit costs, the Canadian tobacco litigation-related expense, the charge related to the deconsolidation of RBH in Canada, and the Russia excise and VAT audit charge); and amortization of intangibles. “Cost/Other” also includes the currency-neutral net revenue variance, unrelated to volume/mix and price components, attributable to fees for certain distribution rights billed to customers in certain markets in the ME&A Region, as well as the impact of the deconsolidation in RBH.

23
Our shipment volume by segment for cigarettes and heated tobacco units was as follows:
PMI Shipment Volume (Million Units)
2019 2018 2017
CigarettesEuropean Union 174,319 179,622 187,293Eastern Europe 100,644 108,718 119,398Middle East & Africa 134,568 136,605 136,759South & Southeast Asia 174,934 178,469 171,600East Asia & Australia 49,951 56,163 62,653Latin America & Canada 72,293 80,738 84,223
Total Cigarettes 706,709 740,315 761,926
Heated Tobacco UnitsEuropean Union 12,569 5,977 1,889Eastern Europe 13,453 4,979 674Middle East & Africa 2,654 3,403 907South & Southeast Asia — — —East Asia & Australia 30,677 26,866 32,729Latin America & Canada (1) 299 147 27
Total Heated Tobacco Units 59,652 41,372 36,226
Cigarettes and Heated Tobacco UnitsEuropean Union 186,888 185,599 189,182Eastern Europe 114,097 113,697 120,072Middle East & Africa 137,222 140,008 137,666South & Southeast Asia 174,934 178,469 171,600East Asia & Australia 80,628 83,029 95,382Latin America & Canada 72,592 80,885 84,250
Total Cigarettes and Heated Tobacco Units 766,361 781,687 798,152
(1) Includes shipments to Altria Group, Inc., commencing in the third quarter of 2019, for sale in the United States under license.
Following the deconsolidation of our Canadian subsidiary, we will continue to report the volume of brands sold by RBH for which other PMI subsidiaries are the trademark owners. These include HEETS, Next, Philip Morris and Rooftop, which together accounted for approximately 40% of RBH's total shipment volume in 2018.
Heated tobacco units ("HTU") is the term we use to refer to heated tobacco consumables, which for us include our HEETS, HEETS Marlboro and HEETS FROM MARLBORO, defined collectively as HEETS, as well as Marlboro HeatSticks and Parliament HeatSticks.
Shipment volume of heated tobacco units to the United States is included in the heated tobacco unit shipment volume of the Latin America & Canada segment.
References to total international market, defined as worldwide cigarette and heated tobacco unit volume excluding the United States, total industry, total market and market shares throughout this "Discussion and Analysis" are our estimates for tax-paid products based on the latest available data from a number of internal and external sources and may, in defined instances, exclude the People's Republic of China and/or our duty free business. In addition, to reflect the deconsolidation of RBH, effective March 22, 2019, PMI's total market share has been restated for previous periods.
In-market sales ("IMS") is defined as sales to the retail channel, depending on the market and distribution model.

24
North Africa is defined as Algeria, Egypt, Libya, Morocco and Tunisia.
The Gulf Cooperation Council ("GCC") is defined as Bahrain, Kuwait, Oman, Qatar, Saudi Arabia and the United Arab Emirates (UAE).
Unless otherwise stated, references to total industry, total market, our shipment volume and our market share performance reflect cigarettes and heated tobacco units.
From time to time, PMI’s shipment volumes are subject to the impact of distributor inventory movements, and estimated total industry/market volumes are subject to the impact of inventory movements in various trade channels that include estimated trade inventory movements of PMI’s competitors arising from market-specific factors that significantly distort reported volume disclosures. Such factors may include changes to the manufacturing supply chain, shipment methods, consumer demand, timing of excise tax increases or other influences that may affect the timing of sales to customers. In such instances, in addition to reviewing PMI shipment volumes and certain estimated total industry/market volumes on a reported basis, management reviews these measures on an adjusted basis that excludes the impact of distributor and/or estimated trade inventory movements. Management also believes that disclosing PMI shipment volumes and estimated total industry/market volumes in such circumstances on a basis that excludes the impact of distributor and/or estimated trade inventory movements improves the comparability of performance and trends for these measures over different reporting periods.
2019 compared with 2018
The following discussion compares our consolidated operating results for the year ended December 31, 2019, with the year ended December 31, 2018.
Estimated international industry cigarette and heated tobacco unit volume, excluding China and the United States, of 2.7 trillion, decreased by 2.0%, due to the EU, EE, S&SA, EA&A and LA&C, as described in the Regional sections below.
Our total shipment volume decreased by 2.0%, due to:
• Middle East & Africa, primarily reflecting lower cigarette shipment volume, notably in Turkey, partly offset by Egypt and Saudi Arabia, and lower heated tobacco unit shipment volume in PMI Duty Free;
• South & Southeast Asia, reflecting lower cigarette shipment volume, primarily in Indonesia, Pakistan and the Philippines, partly offset by Thailand;
• East Asia & Australia, primarily reflecting lower cigarette shipment volume in Japan and lower cigarette and heated tobacco unit shipment volume in Korea, partly offset by higher heated tobacco unit shipment volume in Japan; and
• Latin America & Canada, reflecting lower cigarette shipment volume, principally in Argentina, Canada (primarily due to the impact of the deconsolidation of RBH) and Venezuela. Excluding the volume impact from the RBH deconsolidation of approximately 4.3 billion units (reflecting the volume of RBH-owned brands from March 22, 2018 through December 31, 2018), our total shipment volume in the Region decreased by 5.2%;
partly offset by
• the EU, reflecting higher heated tobacco unit shipment volume across the Region, notably in Italy, partly offset by lower cigarette shipment volume, primarily in France, Germany and Italy; and
• Eastern Europe, reflecting higher heated tobacco unit shipment volume across the Region, notably in Kazakhstan, Russia and Ukraine, partly offset by lower cigarette shipment volume, primarily in Russia and Ukraine.
Excluding the volume impact from the RBH deconsolidation of approximately 4.3 billion units (reflecting the volume of RBH-owned brands from March 22, 2018 through December 31, 2018 and including Duty-Free sales of these brands in Canada), PMI's total shipment volume decreased by 1.4%.
Impact of Inventory Movements
Excluding the volume impact from the deconsolidation of RBH, and the net favorable impact of estimated distributor inventory movements of approximately 1.1 billion units, our total in-market sales declined by 1.5%, due to a 3.7% decline of cigarettes, partly offset by a 35.3%increase in heated tobacco units.

25
The net favorable impact of estimated distributor inventory movements of approximately 1.1 billion units reflected a 2.7 billion favorable impact from heated tobacco units (driven primarily by Japan, mainly reflecting a favorable comparison with 2018 in which IQOSconsumable inventories were reduced, partly offset by PMI Duty Free), partially offset by a 1.6 billion unfavorable impact from cigarettes (due primarily to Japan, North Africa and Thailand, partly offset by the EU Region and Saudi Arabia).
Our cigarette shipment volume by brand and heated tobacco unit shipment volume was as follows:
PMI Shipment Volume by Brand (Million Units)Full-Year
2019 2018 ChangeCigarettesMarlboro 262,908 264,423 (0.6)%L&M 92,873 89,789 3.4 %Chesterfield 57,185 59,452 (3.8)%Philip Morris 49,164 49,864 (1.4)%Parliament 38,723 41,697 (7.1)%Sampoerna A 35,133 39,522 (11.1)%Dji Sam Soe 32,435 29,195 11.1 %Bond Street 28,025 32,173 (12.9)%Lark 19,602 23,021 (14.9)%Fortune 12,831 16,596 (22.7)%Others 77,830 94,583 (17.7)%Total Cigarettes 706,709 740,315 (4.5)%Heated Tobacco Units (1) 59,652 41,372 44.2 %
Total Cigarettes and Heated Tobacco Units 766,361 781,687 (2.0)%(1) Includes shipments to Altria Group, Inc., commencing in the third quarter of 2019, for sale in the United States under license.Note: Sampoerna A includes Sampoerna; Philip Morris includes Philip Morris/Dubliss; and Lark includes Lark Harmony.
Our cigarette shipment volume of the following brands decreased:
• Marlboro, mainly due to Italy and Japan, partly reflecting the impact of out-switching to heated tobacco units, as well as France, partially offset by the Philippines, Saudi Arabia and Turkey;
• Chesterfield, mainly due to Argentina, Italy, Russia and Venezuela, partly offset by Brazil;
• Philip Morris, notably due to Argentina, partly offset by Indonesia and Russia;
• Parliament, mainly due to Japan, Korea and Russia;
• Sampoerna A in Indonesia, mainly reflecting the impact of retail price increases resulting in widened price gaps with competitors' products;
• Bond Street, mainly due to Russia and Ukraine;
• Lark, mainly due to Japan and Turkey;
• Fortune in the Philippines, mainly reflecting up-trading to Marlboro resulting from narrowed price gaps with the below premium price segment; and
• "Others," notably due to: the impact of the deconsolidation of RBH in Canada; mid-price Sampoerna U in Indonesia, partly reflecting the impact of above-inflation retail price increases; and low-price brands, notably Morven in Pakistan and Next/Dubliss in Russia, partly offset by Jackpot in the Philippines.
The increase in our heated tobacco unit shipment volume was mainly driven by: the EU (notably Italy and Poland), Eastern Europe (notably Kazakhstan, Russia and Ukraine) and Japan, partly offset by Korea and PMI Duty Free.
26
Our cigarette shipment volume of the following brands increased:
• L&M, mainly driven by Egypt and Thailand, partly offset by Russia and Turkey; and
• Dji Sam Soe in Indonesia, driven by the strong performance of the DSS Magnum Mild 16 variant and the introduction of 20s and 50s variants.
2019 International Share of Market (excluding China and the United States)
Our total international market share (excluding China and the United States), defined as our cigarette and heated tobacco unit sales volume as a percentage of total industry cigarette and heated tobacco unit sales volume, increased by 0.1 point to 28.4%, reflecting:
• Total international heated tobacco unit market share of 2.2%, up by 0.6 points; and
• Total international cigarette market share of 26.2%, down by 0.5 points.
Our total international cigarette market share, defined as our cigarette sales volume as a percentage of total industry cigarette sales volume, was down by 0.3 points to 26.9%, mainly reflecting: out-switching to heated tobacco units, notably in the EU and Japan; and lower cigarette market share, notably in Argentina, Indonesia, Korea and Turkey.
In 2019, we owned six of the world's top 15 international cigarette brands, with international cigarette market shares as follows: Marlboro, 10.0%; L&M, 3.5%; Chesterfield, 2.2%; Philip Morris, 1.9%; Parliament, 1.5%; and Bond Street, 1.1%.
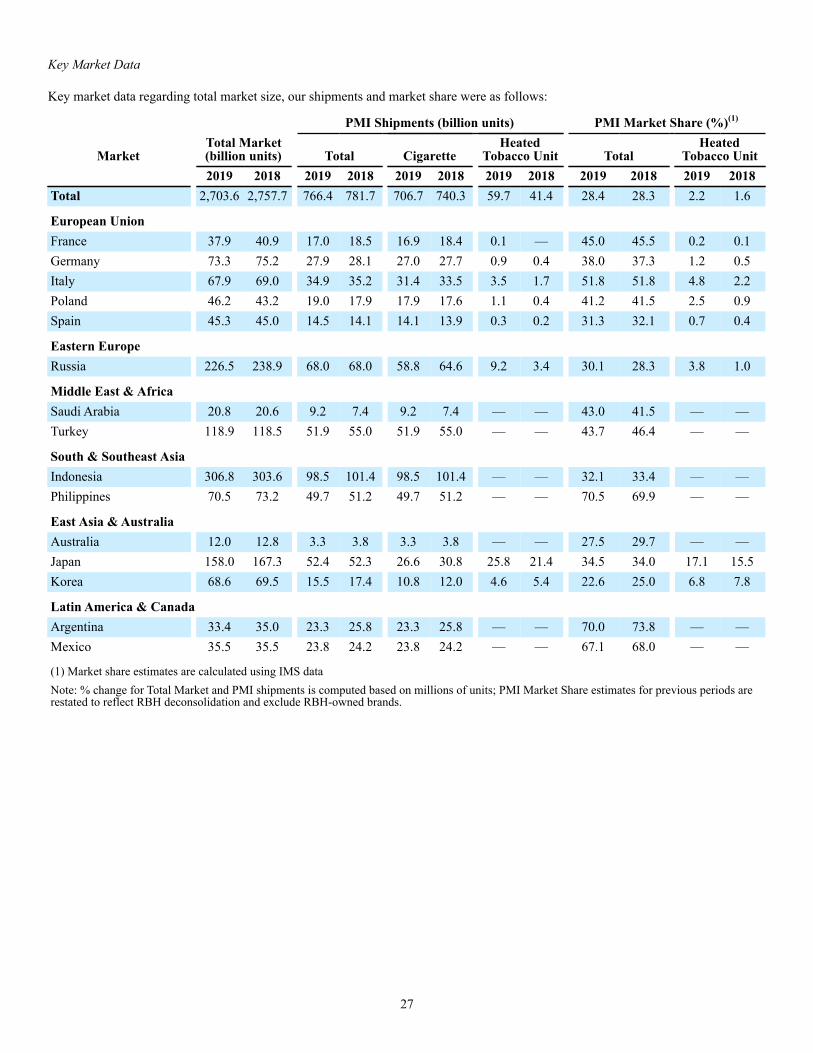
27
Key Market Data
Key market data regarding total market size, our shipments and market share were as follows:
PMI Shipments (billion units) PMI Market Share (%)(1)
MarketTotal Market(billion units) Total Cigarette
HeatedTobacco Unit Total
HeatedTobacco Unit
2019 2018 2019 2018 2019 2018 2019 2018 2019 2018 2019 2018Total 2,703.6 2,757.7 766.4 781.7 706.7 740.3 59.7 41.4 28.4 28.3 2.2 1.6
European UnionFrance 37.9 40.9 17.0 18.5 16.9 18.4 0.1 — 45.0 45.5 0.2 0.1Germany 73.3 75.2 27.9 28.1 27.0 27.7 0.9 0.4 38.0 37.3 1.2 0.5Italy 67.9 69.0 34.9 35.2 31.4 33.5 3.5 1.7 51.8 51.8 4.8 2.2Poland 46.2 43.2 19.0 17.9 17.9 17.6 1.1 0.4 41.2 41.5 2.5 0.9Spain 45.3 45.0 14.5 14.1 14.1 13.9 0.3 0.2 31.3 32.1 0.7 0.4
Eastern EuropeRussia 226.5 238.9 68.0 68.0 58.8 64.6 9.2 3.4 30.1 28.3 3.8 1.0
Middle East & AfricaSaudi Arabia 20.8 20.6 9.2 7.4 9.2 7.4 — — 43.0 41.5 — —Turkey 118.9 118.5 51.9 55.0 51.9 55.0 — — 43.7 46.4 — —
South & Southeast AsiaIndonesia 306.8 303.6 98.5 101.4 98.5 101.4 — — 32.1 33.4 — —Philippines 70.5 73.2 49.7 51.2 49.7 51.2 — — 70.5 69.9 — —
East Asia & AustraliaAustralia 12.0 12.8 3.3 3.8 3.3 3.8 — — 27.5 29.7 — —Japan 158.0 167.3 52.4 52.3 26.6 30.8 25.8 21.4 34.5 34.0 17.1 15.5Korea 68.6 69.5 15.5 17.4 10.8 12.0 4.6 5.4 22.6 25.0 6.8 7.8
Latin America & CanadaArgentina 33.4 35.0 23.3 25.8 23.3 25.8 — — 70.0 73.8 — —Mexico 35.5 35.5 23.8 24.2 23.8 24.2 — — 67.1 68.0 — —
(1) Market share estimates are calculated using IMS dataNote: % change for Total Market and PMI shipments is computed based on millions of units; PMI Market Share estimates for previous periods are restated to reflect RBH deconsolidation and exclude RBH-owned brands.

28
Financial SummaryFinancial Summary -Years Ended December 31,
ChangeFav./(Unfav.)
VarianceFav./(Unfav.)
2019 2018 Total Excl.Curr. Total Cur-
rency Price Vol/Mix
Cost/Other(1)
(in millions)
Net Revenues $ 29,805 $29,625 0.6 % 3.8 % $ 180 $ (937) $ 1,483 $ 397 $ (763)
Cost of Sales (10,513) (10,758) 2.3 % (0.5)% 245 302 — (309) 252
Marketing, Administration and Research Costs (2) (8,695) (7,408) (17.4)% (22.0)% (1,287) 340 — — (1,627)
Amortization of Intangibles (66) (82) 19.5 % 15.9 % 16 3 — — 13
Operating Income $ 10,531 $11,377 (7.4)% (4.9)% $ (846) $ (292) $ 1,483 $ 88 $ (2,125)
(1) Cost/Other variance includes the impact of the RBH deconsolidation.(2) Unfavorable Cost/Other variance includes asset impairment and exit costs of $422 million in 2019, the Russia excise and VAT audit charge of $374 million in 2019, the 2019 loss on deconsolidation of RBH of $239 million, and the 2019 Canadian tobacco litigation-related expense of $194 million, as well as the impact of the RBH deconsolidation.
Note: Net Revenues include revenues from shipments of Platform 1 devices, heated tobacco units and accessories to Altria Group, Inc., commencing in the third quarter of 2019, for sale under license in the United States.
Net revenues, excluding unfavorable currency, increased by 3.8%, mainly reflecting: a favorable pricing variance, notably in Germany, Indonesia, Japan, the Philippines and Turkey; and favorable volume/mix, mainly driven by heated tobacco unit and IQOS device volume in the EU and Russia, and heated tobacco unit volume in Japan, partly offset by unfavorable volume/mix of cigarettes, notably in Australia, the EU, Indonesia, Japan and Russia, unfavorable heated tobacco unit volume in PMI Duty Free, and unfavorable IQOS device volume in Japan and Korea. The currency-neutral growth in net revenues of 3.8% came despite the unfavorable impact of $763 million, shown in "Cost/Other," predominantly resulting from the deconsolidation of RBH.
The unfavorable currency in net revenues was due primarily to the Euro, Russian ruble and Turkish lira.
Net revenues include $5.6 billion in 2019 and $4.1 billion in 2018 related to the sale of RRPs. In 2019, approximately $0.7 billion of our $5.6 billion in RRP net revenues were from IQOS devices.
Operating income decreased by 7.4%. Excluding unfavorable currency ($292 million), asset impairment and exit costs ($422 million) in 2019 related to plant closures in Argentina, Colombia, Germany and Pakistan as part of global manufacturing infrastructure optimization, the 2019 Russia excise and VAT audit charge ($374 million), the 2019 loss on deconsolidation of RBH ($239 million) and the 2019 Canadian tobacco litigation-related expense ($194 million), operating income increased by 5.9%, primarily reflecting: a favorable pricing variance; favorable volume/mix, mainly driven by heated tobacco units in the EU, Japan and Russia, partly offset by unfavorable volume/mix of cigarettes, notably in Australia, the EU, Indonesia, Japan and Russia, as well as unfavorable heated tobacco unit volume in PMI Duty Free; and lower manufacturing costs; partly offset by higher marketing, administration and research costs, reflecting increased investment behind reduced-risk products (mainly in the EU and Eastern Europe), and the net unfavorable impact resulting from the deconsolidation of RBH shown in "Cost/Other."
Interest expense, net, of $570 million decreased by $95 million (14.3%), due primarily to our ongoing efforts to optimize our capital structure following the passage of the Tax Cuts and Jobs Act. This included the decision to use existing cash to repay $2.5 billion and $4.0 billion of long-term debt that matured in 2018 and 2019, respectively.
Our effective tax rate increased by 0.3 percentage points to 23.2%. The effective tax rate for the year ended December 31, 2019, was unfavorably impacted by changes in earnings mix by taxing jurisdiction and U.S. state deferred income tax expense, partially offset by the reversal of a deferred tax liability on the unremitted earnings of our Canadian subsidiary, RBH ($49 million), a reduction in estimated U.S. federal income tax on dividend repatriation for the years 2015-2018 ($67 million), and other repatriation cost differences. We estimate that our 2020 effective tax rate will be approximately 23%, excluding discrete tax events. Changes in currency exchange rates, earnings mix by taxing jurisdiction, or dividend repatriation costs may have an impact on the effective tax rates, which we monitor each quarter. Significant judgment is required in determining income tax provisions and in evaluating tax positions. For further details, see Item 8, Note 11. Income Taxes.
29
We are regularly examined by tax authorities around the world, and we are currently under examination in a number of jurisdictions. It is reasonably possible that within the next 12 months certain tax examinations will close, which could result in a change in unrecognized tax benefits along with related interest and penalties. An estimate of any possible change cannot be made at this time.
Net earnings attributable to PMI of $7.2 billion decreased by $726 million or 9.2%. This decrease was due primarily to lower operating income as discussed above, partially offset by a lower interest expense, net. Diluted and basic EPS of $4.61 decreased by 9.3%. Excluding an unfavorable currency impact of $0.13, diluted EPS decreased by 6.7%.
2018 compared with 2017
For a discussion comparing our consolidated operating results for the year ended December 31, 2018, with the year ended December 31, 2017, refer to Part II, Item 7. Management's Discussion and Analysis of Financial Condition and Results of Operation - Discussion and Analysis - Consolidated Operating Results in our Annual Report on Form 10-K for the year ended December 31, 2018, which was filed with the U.S. Securities and Exchange Commission on February 7, 2019.
Operating Results by Business Segment
Business Environment
Taxes, Legislation, Regulation and Other Matters Regarding the Manufacture, Marketing, Sale and Use of Tobacco Products
The tobacco industry and our company face a number of challenges that may adversely affect our business, volume, results of operations, cash flows and financial position. These challenges, which are discussed below and in “Cautionary Factors That May Affect Future Results,” include:
• regulatory restrictions on our products, including restrictions on the packaging, marketing, and sale of tobacco or other nicotine-containing products that could reduce our competitiveness, eliminate our ability to communicate with adult consumers, or even ban certain of our products;
• fiscal challenges, such as excessive excise tax increases and discriminatory tax structures;• illicit trade in cigarettes and other tobacco products, including counterfeit, contraband and so-called “illicit whites”; • intense competition, including from non-tax paid volume by certain local manufacturers;• pending and threatened litigation as discussed in Item 8, Note 18. Contingencies; and• governmental investigations.
Regulatory Restrictions: The tobacco industry operates in a highly regulated environment. The well-known risks of smoking have led regulators to impose significant restrictions and high excise taxes on cigarettes.
We support a comprehensive regulatory framework for tobacco products based on the principle of harm reduction, including mandated health warnings, minimum age laws, restrictions on advertising, and public place smoking restrictions. We also support regulatory measures that help reduce illicit trade.
Much of the regulation that shapes the business environment in which we operate is driven by the World Health Organization's (“WHO”) Framework Convention on Tobacco Control (“FCTC”), which entered into force in 2005. The FCTC has as its main objective to establish a global agenda for tobacco regulation, with the purpose of reducing tobacco use. To date, 180 countries and the European Union are Parties to the FCTC. The treaty requires Parties to have in place various tobacco control measures and recommends others. The FCTC governing body, the Conference of the Parties (“CoP”), has also adopted non-binding guidelines and policy recommendations related to certain articles of the FCTC that go beyond the text of the treaty. In October 2018, the CoP recognized the need for more scientific assessment and improved reporting to define policy on heated tobacco products. Similar to its previous policy recommendations on e-cigarettes, the CoP invited countries to regulate, restrict or prohibit heated tobacco products, as appropriate under their national laws.
In July 2019, the WHO issued the Report on the Global Tobacco Epidemic 2019. While citing insufficient independent studies regarding the benefits and the unknown long-term health impacts of electronic nicotine delivery systems and heated tobacco products, the WHO has taken the position that such products are not risk-free and should be regulated in the same manner as cigarettes and in line with the FCTC provisions.

30
It is not possible to predict whether or to what extent measures recommended by the WHO, including the FCTC guidelines, will be implemented.
We agree that all tobacco and nicotine-containing products, including our RRPs, need to be regulated; however, we continue to seek to engage in a dialogue with regulators with respect to those measures that we do not believe would protect public health and, if implemented, could disrupt competition, severely limit our ability to market and sell our products (including our RRPs) to adult smokers, or increase illicit trade. We advocate for measures that would accelerate switching to better alternatives to continued smoking and embrace a regulatory framework that recognizes a risk continuum of tobacco and other nicotine-containing products.
Certain measures are discussed in more detail below and in the Reduced-Risk Products (RRPs) section.
Fiscal Challenges: Excessive and disruptive excise, sales and other tax increases and discriminatory tax structures are expected to continue to have an adverse impact on our profitability, due to lower consumption and consumer down-trading to non-premium, discount, other low-price or low-taxed combustible tobacco products such as fine cut tobacco and illicit cigarettes. In addition, in certain jurisdictions, some of our combustible products are subject to tax structures that discriminate against premium-price products and manufactured cigarettes. We believe that such tax policies undermine public health by encouraging consumers to turn to illicit trade, and ultimately undercut government revenue objectives, disrupt the competitive environment, and encourage criminal activity. Other jurisdictions have imposed, or are seeking to impose, levies or other taxes specifically on tobacco companies, such as taxes on revenues and/or profits.
EU Tobacco Products Directive: In April 2014, the EU adopted a significantly revised EU Tobacco Products Directive (TPD), which entered into force in May 2016. All Member States have adopted laws transposing the TPD. The TPD sets forth a comprehensive set of regulatory requirements for tobacco products, including:
• health warnings covering 65% of the front and back panels of cigarette packs, with an option for Member States to further standardize tobacco packaging, including the introduction of plain packaging;
• a ban on characterizing flavors in some tobacco products, with a transition period for menthol expiring in May 2020; • security features and tracking and tracing measures that became effective on May 20, 2019; and• a framework for the regulation of novel tobacco products and e-cigarettes, including requirements for health warnings and
information leaflets, a prohibition on product packaging text related to reduced risk, and the introduction of notification requirements or authorization procedures in advance of commercialization.
Plain Packaging and Other Packaging Restrictions: Plain packaging legislation bans the use of branding, logos and colors on packaging other than the brand name and variant that may be printed only in specified locations and in a uniform font. To date, plain packaging laws have been adopted in certain markets in all of our operating segments, including the key markets of Australia, France, Saudi Arabia and Turkey, and are in various degrees of implementation. Some countries, such as Canada, New Zealand and Israel, adopted plain packaging regulations that apply to all tobacco products, including RRPs. Other countries are also considering plain packaging legislation.
Some countries have adopted, or are considering adopting, packaging restrictions that could have an impact similar to plain packaging. Examples of such restrictions include standardizing the shape and size of packages, prohibiting certain colors or the use of certain descriptive phrases on packaging, and requiring very large graphic health warnings that leave little space for branding.
Restrictions and Bans on the Use of Ingredients: The WHO and others in the public health community have recommended restrictions or total bans on the use of some or all ingredients in tobacco products, including menthol. Broad restrictions and ingredient bans would require us to reformulate our American blend tobacco products and could reduce our ability to differentiate these products in the market in the long term. Menthol bans would eliminate the entire category of mentholated tobacco products. The European Union has banned flavored tobacco products, subject to an exemption until May 2020 for menthol. Other countries may follow the EU’s approach. For instance, Turkey has banned menthol as of May 2020. Broader ingredient bans have been adopted by Canada and Brazil. In Brazil, an ingredient ban is currently on appeal by a tobacco industry union, of which our Brazilian subsidiary is a member. It is not possible to predict the outcome of these legal proceedings.

31
Bans on Display of Tobacco Products at Retail: In a number of our markets, including, but not limited to, Australia and Russia, governments have banned the display of tobacco products at the point of sale. Other countries are considering similar bans.
Bans and Restrictions on Advertising, Marketing, Promotions and Sponsorships: For many years, the FCTC has called for, and countries have imposed, partial or total bans on tobacco advertising, marketing, promotions and sponsorships, including bans and restrictions on advertising on radio and television, in print and on the Internet. The FCTC's non-binding guidelines recommend that governments prohibit all forms of communication with adult smokers.
Restrictions on Product Design: Some members of the public health community are calling for the further standardization of tobacco products by requiring, for example, that cigarettes have a certain minimum diameter, which would amount to a ban on slim cigarettes, or requiring the use of standardized filter and cigarette paper designs. In addition, at its meeting in November 2016, the CoP adopted non-binding guidelines recommending that countries regulate product design features that increase the attractiveness of tobacco products, such as the diameter of cigarettes and the use of flavor capsules.
Restrictions on Public Smoking: The pace and scope of public smoking restrictions have increased significantly in most of our markets. Many countries around the world have adopted, or are likely to adopt, regulations that restrict or ban smoking in public and/or work places, restaurants, bars and nightclubs. Some public health groups have called for, and some countries, regional governments and municipalities have adopted or proposed, bans on smoking in outdoor places, as well as bans on smoking in cars (typically, when minors are present) and private homes.
Other Regulatory Issues: Some regulators are considering, or in some cases have adopted, regulatory measures designed to reduce the supply of tobacco products. These include regulations intended to reduce the number of retailers selling tobacco products by, for example, reducing the overall number of tobacco retail licenses available or banning the sale of tobacco products within specified distances of certain public facilities.
In a limited number of markets, most notably Japan, we are dependent on governmental approvals that may limit our pricing flexibility.
The EU Single-Use Plastics Directive, which will require tobacco manufacturers and importers to cover the costs of public collection systems for tobacco product filters, entered into force on July 2, 2019, after which Member States will have two years to transpose it into national law. While we cannot predict the impact of this initiative on our business at this time, we are monitoring developments in this area.
Illicit Trade: Illicit tobacco trade creates a cheap and unregulated supply of tobacco products, undermines efforts to reduce smoking prevalence, especially among youth, damages legitimate businesses, stimulates organized crime, increases corruption and reduces government tax revenue. Excluding China and the U.S., illicit trade may account for as much as 10% of global cigarette consumption; this includes counterfeit, contraband and the growing problem of “illicit whites,” which are cigarettes legally produced in one jurisdiction for the sole purpose of being exported and illegally sold in another jurisdiction where they have no legitimate market. We estimate that illicit trade in the European Union accounted for approximately 10% of total cigarette consumption in 2019.
A number of jurisdictions are considering actions to prevent illicit trade. In November 2012, the FCTC adopted the Protocol to Eliminate Illicit Trade in Tobacco Products (the “Protocol”), which includes supply chain control measures, such as licensing of manufacturers and distributors, enforcement in free trade zones, controls on duty free and Internet sales and the implementation of tracking and tracing technologies. To date, 58 Parties, including the European Union, have ratified it. The Protocol came into force in September 2018. Parties must now start implementing its measures via national legislation. In October 2018, the first Meeting of the Parties to the Protocol decided to produce a comprehensive report on good practices for the implementation of tracking and tracing systems and to prepare a conceptual framework for global information sharing to combat illicit tobacco trade. We welcome this decision and expect that other Parties will ratify the Protocol.
We devote substantial resources to help prevent illicit trade in combustible tobacco products and RRPs. For example, we engage with governments, our business partners and other stakeholders to implement effective measures to combat illicit trade and, in some instances, pursue legal remedies to protect our intellectual property rights.
The tracking and tracing regulations for cigarettes and roll-your-own products manufactured or destined for the EU became effective on May 20, 2019. The effective date for other tobacco-containing products, including some of our RRPs such as heated tobacco units, is May 20, 2024. While we expect that this regulation will increase our operating expenses, we do not expect this increase to be significant.
In 2009, our Colombian subsidiaries entered into an Investment and Cooperation Agreement with the national and regional governments of Colombia to promote investment in, and cooperation on, anti-contraband and anti-counterfeit efforts. The agreement provides $200

32
million in funding over a 20-year period to address issues such as combating illegal cigarette trade and increasing the quality and quantity of locally-grown tobacco.
In May 2016, PMI launched PMI IMPACT, a global initiative that supports third-party projects dedicated to fighting illegal trade and related crimes such as corruption, organized criminal networks and money laundering. The centerpiece of PMI IMPACT is a council of external independent experts in the fields of law, anti-corruption and law enforcement. The experts are responsible for evaluating and approving funding proposals for PMI IMPACT grants. PMI has pledged $100 million to fund projects within PMI IMPACT over three funding rounds.
Reduced-Risk Products (RRPs)
Our Approach to RRPs: We recognize that smoking cigarettes causes serious diseases and that the best way to avoid the harms of smoking is never to start or to quit. Nevertheless, it is predicted that over the next decade the number of smokers will remain largely unchanged from the current estimate of 1.1 billion, despite the considerable efforts to discourage smoking.
Cigarettes burn tobacco, which produces smoke. As a result of the combustion process, the smoker inhales various toxic substances. In contrast, RRPs do not burn tobacco and produce an aerosol that contains significantly lower levels of harmful and potentially harmful constituents ("HPHCs") than found in cigarette smoke.
For smokers who would otherwise continue to smoke, we believe that RRPs, while not risk-free, offer a much better consumer choice. Accordingly, our key strategic priorities are: to develop and commercialize products that present less risk of harm to adult smokers who switch to those products versus continued smoking; and to convince current adult smokers who would otherwise continue to smoke to switch to those products.
We recognize that this transformation from cigarettes to RRPs will take time and that the speed of transformation will depend in part upon factors beyond our control, such as the willingness of governments, regulators and other policy groups to embrace RRPs as a desired alternative to continued cigarette smoking. We also recognize that our part in this transformation must be funded from our existing cigarette business. For as long as a significant number of adult smokers continues to smoke, it is critical that the industry be led by responsible and ethical manufacturers. Therefore, during the transformation, we intend to remain a leading international cigarette manufacturer.
We have a range of RRPs in various stages of development, scientific assessment and commercialization. We conduct rigorous scientific assessments of our RRP platforms to substantiate that they reduce exposure to HPHCs and, ultimately, that these products present, are likely to present, or have the potential to present less risk of harm to adult smokers who switch to them versus continued smoking. We draw upon a team of expert scientists and engineers from a broad spectrum of scientific disciplines and our extensive learnings of adult consumer preferences to develop and assess our RRPs. Our efforts are guided by the following key objectives:
• to develop RRPs that adult smokers who would otherwise continue to smoke find to be satisfying alternatives to smoking;• for those adult smokers, our goal is to offer RRPs with a scientifically substantiated risk-reduction profile that approaches as
closely as possible that associated with smoking cessation; • to substantiate the reduction of risk for the individual adult smoker and the reduction of harm to the population as a whole, based
on scientific evidence of the highest standard that is made available for scrutiny and review by external independent scientists and relevant regulatory bodies; and
• to advocate for the development of science-based regulatory frameworks for the development and commercialization of RRPs, including the communication of scientifically substantiated information to enable adult smokers to make better consumer choices.
Our RRP Platforms: Our product development is based on the elimination of combustion via tobacco heating and other innovative systems for aerosol generation, which we believe is the most promising path to providing a better consumer choice for those who would otherwise continue to smoke. We recognize that no single product will appeal to all adult smokers. Therefore, we are developing a portfolio of products intended to appeal to a variety of distinct adult consumer preferences.
Four RRP platforms are in various stages of development and commercialization readiness:
Platform 1 uses a precisely controlled heating device incorporating our IQOS HeatControl technology, into which a specially designed and proprietary tobacco unit is inserted and heated to generate an aerosol. We have conducted a series of clinical studies for this platform, the results of which were included in our submission to the U.S. Food and Drug Administration (“FDA”) described below.

33
The results of the first six-month term of the 6+6 month exposure response study were received at the end of 2017, and the related report was completed and submitted to the FDA in the second quarter of 2018. The study showed that all eight of the co-primary clinical risk endpoints moved in the same direction in the group that switched to our Platform 1 product as observed for smoking cessation, with statistically significant changes in five of the eight endpoints compared with on-going smoking. The results of the second six-month term of the 6+6 month exposure response study were received for analysis in the second quarter of 2018; we are analyzing the results, and expect to finalize the report later this year. In addition, as set out in our submission to the FDA referenced above, we completed an 18-month combined chronic toxicity and carcinogenicity study in mice, which was on-going at the time of our FDA submission. We shared the results with the FDA in August 2018.
Platform 2 uses a pressed carbon heat source which, when ignited, generates a nicotine-containing aerosol by heating tobacco. The results of our pharmacokinetic study (that measured the nicotine pharmacokinetic profile as well as subjective effects) and of our five-day reduced exposure study indicate that this platform could be an acceptable substitute for adult smokers who seek an alternative to cigarettes. The reduced exposure study results showed a substantial reduction in relevant biomarkers of exposure to the measured HPHCs in those who switched to Platform 2 compared to those who continued to smoke cigarettes over a five-day period. The sustainability of this reduction as well as changes in clinical risk markers were assessed in a three-month reduced exposure study. The results of this study were received at the end of 2017, and the related report was finalized in the second quarter of 2018.
Platform 3 provides an aerosol of nicotine salt. We have explored two routes for this platform, one with electronics and one without, and conducted nicotine pharmacokinetic studies with both versions. The results of the pharmacokinetic study related to the version without electronics were received, and the related report was finalized in the fourth quarter of 2018. The results indicate this product's potential as an acceptable alternative to continued cigarette smoking in terms of product satisfaction. We are conducting a product use and adaptation study in adult smokers and expect the results in 2020.
Platform 4 covers e-vapor products, which are battery-powered devices that produce an aerosol by vaporizing a nicotine-containing liquid solution. Our e-vapor products comprise devices using current generation technology and our new e-vapor mesh technology that addresses certain challenges presented by some e-vapor products currently on the market. Our IQOS MESH products are designed to ensure the consistency and quality of the generated aerosol. We conducted a nicotine pharmacokinetic study in 2017. The results of this study were received in the second quarter of 2018 for analysis, and the related report was finalized in the fourth quarter of 2018. The results of this study indicate that IQOS MESH products are an effective means of nicotine delivery while being a satisfying alternative for e-cigarette users. In March 2019, a six-month pre-clinical study in mice evaluating the impact of e-cigarette vapor on the risks of pulmonary and cardiovascular disease compared to cigarette smoke was completed; this study did not pertain to a specific product. The study demonstrated that e-cigarette vapors induce significantly lower biological responses associated with cardiovascular and pulmonary diseases compared with cigarette smoke. We will also initiate a clinical study to measure selected biomarkers of exposure to HPHCs and assess changes in clinical risk markers.
After we receive the results of our scientific studies mentioned above, in accordance with standard scientific practices, we intend to share the conclusions in scientific forums and to submit them for inclusion in peer-reviewed publications.
The research and development expense for our RRP portfolio accounted for 98%, 92% and 74% of our total research and development expense for the years ended December 31, 2019, 2018 and 2017, respectively. The research and development expense for the years ended December 31, 2019, 2018 and 2017, is set forth in Item 8, Note 14. Additional Information to the consolidated financial statements.
Commercialization of RRPs: We are building a new product category and tailor our commercialization strategy to the characteristics of each specific market. We focus our commercialization efforts on consumer retail experience, guided consumer trials and customer care, as well as digital communication programs. In order to accelerate switching to our Platform 1 product, our initial market introductions typically entail one-on-one consumer engagement and introductory device discounts. These initial commercialization efforts require substantial investment, which we believe will moderate over time.
In 2014, we introduced our Platform 1 product in pilot city launches in Nagoya, Japan, and in Milan, Italy. Since then, we have continuously expanded our commercialization activities, and the product is currently available for sale in 52 markets in key cities or nationwide. We estimate that only a very small percentage of adult smokers who convert to our Platform 1 product switch back to cigarettes.
We have integrated the production of our heated tobacco units into a number of our existing manufacturing facilities, are progressing with our plans to build manufacturing capacity for our other RRP platforms, and continue to optimize our manufacturing infrastructure.
An adequate supply chain for our RRP portfolio, including the supply of electronic devices, is important to our business. We work with two electronics manufacturing service providers for the supply of our Platform 1 and IQOS MESH devices and a small number of other

34
providers for other products in our RRP portfolio and related accessories. Although we work closely with these service providers on monitoring their production capability and financial health, the commercialization of our RRPs could be adversely affected if they are unable to meet their commitments. The production of our RRP portfolio requires various metals, and we believe that there is an adequate supply of such metals in the world markets to satisfy our current and anticipated production requirements. However, some components and materials necessary for the production of our RRPs, including those for the electronic devices, are obtained from single or limited sources, and can be subject to industry-wide shortages and price fluctuations. Our inability to secure an adequate supply of such components and materials could negatively impact the commercialization of our RRPs.
Our Platform 1 and IQOS MESH devices are subject to standard product warranties generally for a period of 12 months from the date of purchase or such other periods as required by law. We discuss product warranties in more detail in Item 8, Note 5. Product Warranty. The significance of warranty claims is dependent on a number of factors, including device version mix, product failure rates, logistics and service delivery costs, and warranty policies, and may increase with the number of devices sold.
Product quality may affect consumer acceptance of our RRPs.
Our commercialization efforts for the other RRP platforms are as follows:
• We currently market our e-vapor products in Ireland and the U.K. In July 2018, we pilot-launched IQOS MESH, one of our Platform 4 products, in London, U.K. In light of the current confusion in the e-vapor category, we have postponed our planned launch of an improved version of this product until the third quarter of 2020, when we expect to reach the optimal capacity for commercialization at scale.
• We completed a small-scale city test of TEEPS, our Platform 2 product, that we had initiated in December 2017 in Santo Domingo, the Dominican Republic. We are finalizing our improvements to this product and plan to conduct a consumer test by the end of 2020.
• Depending on the outcome of the use and adaptation study described above as well as consumer research, we plan to conduct a consumer test of our Platform 3 product by the end of 2020.
RRP Regulation and Taxation: RRPs contain nicotine and are not risk-free. We therefore support science-based regulation and taxation of RRPs. Regulation and taxation should differentiate between cigarettes and products that present, are likely to present, or have the potential to present less risk of harm to adult smokers who switch to these products versus continued smoking and should recognize a continuum of risk for tobacco and other nicotine-containing products. Regulation should provide minimum standards for all RRP categories and specific rules for product assessment methodologies, ingredients, labeling and consumer communication, and should ensure that the public is informed about the health risks of all combustible and non-combustible tobacco and nicotine-containing products. Regulation, as well as industry practices, should reflect the fact that youth should not consume nicotine in any form.
Some governments have banned or are seeking to ban or severely restrict emerging tobacco and nicotine-containing products such as our RRPs and communication of truthful and non-misleading information about such products. These regulations might foreclose or unreasonably restrict adult consumer access even to products that might be shown to be a better consumer choice than continuing to smoke. We oppose such blanket bans and unreasonable restrictions of products that have the potential to present less risk of harm compared to continued smoking. By contrast, we support regulation that sets clear standards for all RRP categories and propels innovation to benefit adult smokers who would otherwise continue to smoke.
In the United States, an established regulatory framework for assessing “Modified Risk Tobacco Products” and “New Tobacco Products” exists under the jurisdiction of the FDA. We submitted to the FDA a Modified Risk Tobacco Product Application (“MRTPA”) for our Platform 1 product in December 2016, and a Premarket Tobacco Product Application (“PMTA”) for our Platform 1 product in March 2017.
On April 30, 2019, the FDA determined that a version of our Platform 1 product is appropriate for the protection of public health and authorized it for sale in the United States. The FDA’s decision followed its comprehensive assessment of our PMTA.
The FDA’s marketing order does not mean that the agency “approved” our Platform 1 product. The authorization is subject to strict marketing, reporting and other requirements and is not a guarantee that the product will remain authorized, particularly if there is a significant uptake in youth initiation. The FDA will monitor the marketing of the product.
We plan to file a PMTA application for the IQOS 3 device in the coming months.

35
In May 2017, the FDA formally accepted and filed our MRTPA for substantive scientific review and, in June 2017, the FDA opened the period for the public to provide comments on our application. The FDA closed the public comment period on February 11, 2019. In late 2019, we provided a response to the FDA's request for clarification regarding our mice study described above. Following our response, the FDA re-opened a public comment period ending February 24, 2020.
The FDA referred our MRTPA to the Tobacco Product Scientific Advisory Committee (“TPSAC”). TPSAC held a meeting on January 24 and January 25, 2018 to discuss our MRTPA. The recommendations and votes of TPSAC are not binding on the FDA. By regulation, the FDA’s decision on our MRTPA will take into account, in addition to the views of TPSAC, scientific evidence as well as comments, data and information submitted by interested persons.
The FDA review of our MRTPA is on-going.
Separately, in July 2017, the FDA issued a policy announcement aiming to explore the potential of nicotine reduction in cigarettes in conjunction with the availability of less harmful products that deliver nicotine for adults who choose to use such products. In July 2018, as part of a public consultation procedure, we submitted our views on this topic to the FDA. It is not possible to predict the regulatory measures that may be recommended by the FDA as a result of this policy.
In the U.S., tobacco and nicotine-containing products that were not commercially marketed as of February 15, 2007 are subject to review and authorization by the FDA. Following a rise in the use of e-vapor products among minors in the U.S. and an outbreak of lung injuries alleged to be associated with the use of certain e-vapor products in many states, on January 2, 2020, the FDA announced an enforcement policy against the sale of e-vapor products sold without FDA authorization, prioritizing enforcement against the sale of cartridge-based e-vapor products with flavors other than tobacco and menthol, and sale of any nicotine-containing products to minors and where the manufacturer fails to take adequate measures to prevent access by minors.
While we do not sell e-vapor products in the U.S. and therefore are not subject to these actions, we continue to support regulation and industry practices that reflect the fact that youth should not consume nicotine in any form.
Future FDA actions may influence the regulatory approach of other governments.
Until recently, there were no countries with specific product standards for heat-not-burn products. Effective July 2017 and March 2018, respectively, Russia and Ukraine adopted standards that set minimum quality and safety requirements for the consumables and defined methods for demonstrating the absence of combustion, and the product standards in Kazakhstan that came into force in March 2019 also cover devices. In the UAE, a product standard on minimum quality and safety of electronic nicotine-containing products, including heat-not-burn products, was approved in March 2019. Effective December 2019, Jordan adopted a national standard for heat-not-burn products (both devices and consumables), and defined a method for demonstrating the absence of combustion in these products. We expect and encourage other governments to consider similar product standards going forward.
In the EU, all EU Member States have transposed the EU Tobacco Products Directive, including the provisions on novel tobacco products, such as heated tobacco units, and e-cigarettes. Most of the EU Member States require a notification submitted six months before the intended placing on the market of a novel tobacco product, while some require pre-market authorizations for the introduction of such products. To date, we have filed a comprehensive dossier summarizing our scientific assessment of our Platform 1 product in over 20 Member States.
In addition, in Italy, in April 2018, we submitted under recent legislation an application for HEETS, used with the IQOS device, requesting regulatory recognition of the reduction of toxic substances and potential risk reduction resulting from switching to this product compared to continued cigarette smoking. In January 2019, our application was not granted primarily on the grounds of insufficient data and questions of methodology. Due to the constraints of the review process, we had been unable to supplement the application with all the data we subsequently filed with the FDA and to address methodological questions during the review. We plan to submit a new application where we will clarify the concerns raised by the decision and further strengthen our application by submitting additional evidence that became available since we submitted our first application, consistent with our FDA filing. We are confident that our evidence supports our application.
To date, several governmental agencies have published their scientific findings that analyze the harm-reduction potential of certain RRPs versus continuing smoking, including:
In December 2017, at the request of the U.K. Department of Health and Public Health England, the U.K. Committee on Toxicity published its assessment of the risk of heat-not-burn products relative to cigarette smoking. This assessment included analysis of scientific data for two heat-not-burn products, one of which was our Platform 1 product. The assessment concluded that, while still harmful to health,

36
compared with the known risks from cigarettes, heat-not-burn products are probably less harmful. Subsequently, in February 2018, Public Health England published a report stating that the available evidence suggests that heat-not-burn products may be considerably less harmful than cigarettes and more harmful than e-cigarettes.
In May 2018, the German Federal Institute for Risk Assessment (“BfR”) published a study on the Platform 1 aerosol relative to cigarette smoke using the Health Canada Intense Smoking Regimen. BfR found reductions in selected HPHCs in a range of 80-99%. This publication indicates that significant reductions in the levels of selected toxicants are likely to reduce toxicant exposure, which BfR stated might be regarded as a discrete benefit compared to combustible cigarettes.
In May 2018, the Dutch National Institute for Public Health and Environment (“RIVM”) published a factsheet on novel tobacco products that heat rather than burn tobacco, focusing on our Platform 1 product. RIVM analyzed the aerosol generated by our Platform 1 product and concluded that the use of this product, while still harmful to health, is probably less harmful than continued smoking.
In June 2018, the Korean Food and Drug Administration (“KFDA”) issued a statement on products that heat rather than burn tobacco. The KFDA tested three heat-not-burn products, one of which was our Platform 1 product. The KFDA confirmed that the levels of the nine HPHCs tested in the aerosol of these products were on average approximately 90% lower compared to those measured in the cigarette smoke of the top five cigarette brands in South Korea. However, the KFDA stated that it could not establish that the tested heat-not-burn products are less harmful than cigarettes. In October 2018, our Korean affiliate filed a request with a local court seeking information underlying KFDA’s analysis, conclusions and public statements.
In August 2018, the Science & Technology Committee of the U.K. House of Commons published a report of its inquiry into e-cigarettes and heat-not-burn products. The report concluded that e-cigarettes are significantly less harmful to health than smoking tobacco. The report also observed that for those smokers who don’t accept e-cigarettes, heat-not-burn products may offer a public health benefit despite their relative risk. The report called for a risk-proportionate regulatory environment for both e-cigarettes and heat-not-burn products and noted that e-cigarettes should remain the least taxed, cigarettes the most taxed, with heat-not-burn products falling between the two. The U.K. Committee on Advertising Practice announced the removal of a prohibition of health claims in the advertising of e-cigarettes in the U.K. effective November 2018, with a review of the impact of this decision on market practices 12 months thereafter.
In November 2018, the Eurasian Economic Commission (regulatory body of the Eurasian Union consisting of Armenia, Belarus, Kazakhstan, Kyrgyzstan and Russia) published the results of its commissioned study on novel nicotine-containing products, including our Platform 1 product. The study confirms significantly lower levels of HPHCs in the aerosol generated by this product compared to cigarette smoke.
In January 2019, scientific media published the results of the study of the China National Tobacco Quality Supervision and Test Centre (“CNTQST”) comparing the aerosol generated by our Platform 1 product with cigarette smoke. The CNTQST found that the former contained fewer, and lower levels of, harmful constituents than the latter and concluded that the lower temperature of heating tobacco in our Platform 1 product contributed to the difference. The CNTQST stated that the reduction in emissions of harmful constituents cannot be interpreted as equivalent to a proportionate harm/risk reduction for smokers.
We make our scientific findings publicly available for scrutiny and peer review through several channels, including our websites. From time to time, adult consumers, competitors, members of the scientific community, and others inquire into our scientific methodologies, challenge our scientific conclusions or request further study of certain aspects of our RRPs and their health effects. We are committed to a robust and open scientific debate but believe that such debate should be based on accurate and reliable scientific information. We seek to provide accurate and reliable scientific information about our RRPs; nonetheless, we may not be able to prevent third-party dissemination of false, misleading or unsubstantiated information about these products. The dissemination of scientifically unsubstantiated information or studies with a strong confirmation bias by third parties may cause confusion among adult smokers and affect their decision to switch to better alternatives to continued smoking, such as our RRPs.
To date, we have been largely successful in demonstrating to regulators that our heated tobacco units are not cigarettes due to the absence of combustion, and as such they are generally taxed either as a separate category or as other tobacco products, which typically yields more favorable tax rates than cigarettes. Although we believe that this is sensible from the public health perspective, we cannot guarantee that regulators will continue this approach.
There can be no assurance that we will succeed in our efforts to replace cigarettes with RRPs or that regulation will allow us to commercialize RRPs in all markets, to communicate about our RRPs, including making scientifically substantiated risk-reduction claims, or to treat RRPs differently from cigarettes.
37
Legal Challenges to RRPs: We face various administrative and legal challenges related to certain RRP activities, including allegations concerning product classification, advertising restrictions, corporate communications, product coach activities, scientific substantiation, product liability, and unfair competition. While we design our programs to comply with relevant regulations, we expect these or similar challenges to continue as we expand our efforts to commercialize RRPs and to communicate publicly. The outcomes of these matters may affect our RRP commercialization and public communication activities and performance in one or more countries.
Our RRP Business Development Initiatives: In December 2013, we established a strategic framework with Altria Group, Inc. (“Altria”) setting out terms on how the parties would collaborate to develop and commercialize e-vapor products and commercialize two of our RRPs in the U.S. In late 2018, Altria announced that it will participate in the e-vapor category only through another e-vapor company in which Altria acquired a minority interest. Regarding heat-not-burn products, as discussed above, the FDA has authorized a version of our Platform 1 product for sale in the U.S., and we are seeking authorization for our MRTP submission. These efforts are not affected by Altria's e-vapor announcement. In September 2019, Altria's subsidiary, Philip Morris USA Inc., began commercialization of a version of our Platform 1 product in the U.S.
In January 2020, we announced an agreement with KT&G, a leading tobacco and nicotine company in South Korea, for the commercialization of KT&G’s smoke-free products outside of South Korea on an exclusive basis. For more information, see Acquisitions and Other Business Arrangements below.
Other Developments: In September 2017, we announced our support of the Foundation for a Smoke-Free World. We agreed to contribute $80 million per year over the next 12 years, as specified in the agreement. We made an initial contribution of $4.5 million in 2017, the first annual contribution of $80 million in the first quarter of 2018 and the second annual contribution of $80 million in the first quarter of 2019. The Foundation is an independent body and is governed by its independent Board of Directors. The Foundation’s role, as set out in its corporate charter, includes funding research in the field of tobacco harm reduction, encouraging measures that reduce the harm caused by smoking, and assessing the effect of reduced cigarette consumption on the industry value chain.
Governmental Investigations
From time to time, we are subject to governmental investigations on a range of matters, including tax, customs, antitrust, advertising, and labor practices. We describe certain matters pending in Thailand, Russia and South Korea in Item 8, Note 18. Contingencies.
In November 2010, a WTO panel issued its decision in a dispute relating to facts that arose from August 2006 between the Philippines and Thailand concerning a series of Thai customs and tax measures affecting cigarettes imported by PM Thailand into Thailand (see Item 8, Note 18. Contingencies for additional information). The WTO panel decision, which was upheld by the WTO Appellate Body, concluded that Thailand had no basis to find that PM Thailand's declared customs values and taxes paid were too low, as alleged by the DSI in 2009. The decision also created obligations for Thailand to revise its laws, regulations, or practices affecting the customs valuation and tax treatment of future cigarette imports. Thailand agreed in September 2011 to fully comply with the decision by October 2012. The Philippines asserts that to date Thailand has not fully complied with the WTO panel decision. The Philippines has repeatedly expressed concerns with ongoing investigations by Thailand of PM Thailand, including those that led to the criminal charges described in Item 8, Note 18. Contingencies, and has commenced two formal proceedings at the WTO to challenge criminal charges against PM Thailand arguing that the criminal charges appear to be based on grounds not supported by WTO customs valuation rules and inconsistent with several decisions already taken by Thai Customs and other Thai governmental agencies. On November 12, 2018 and July 12, 2019, the WTO issued its decisions agreeing with the Philippines that the criminal charges against PM Thailand and its former and current employeesin connection with import entries of cigarettes from the Philippines and Indonesia, respectively, described in Item 8, Note 18. Contingencies, are inconsistent with WTO customs valuation rules. In January 2019 and September 2019, Thailand appealed the WTO's decision related to the criminal charges in connection with import entries of cigarettes from the Philippines and Indonesia, respectively. It is not possible to predict any future developments in these proceedings while the WTO Appellate Body is not operational.
U.S. GAAP Treatment of Argentina as a Highly Inflationary Economy
Following the categorization of Argentina by the International Practices Task Force of the Center for Audit Quality as a country with a three-year cumulative inflation rate greater than 100%, the country is considered highly inflationary in accordance with U.S. GAAP. Consequently, we began to account for the operations of our Argentinian affiliates as highly inflationary, and to treat the U.S. dollar as the functional currency of the affiliates, effective July 1, 2018.

38
Asset Impairment and Exit Costs
We discuss asset impairment and exit costs in Item 8, Note 21. Asset Impairment and Exit Costs to our consolidated financial statements.
As part of our transformation to a smoke-free future, we also seek to optimize our organizational design. In January 2020, we commenced the first phase of a two-phase restructuring project in Switzerland. This phase may impact approximately 265 existing positions that will be eliminated or relocated, and we initiated consultation procedures for the impacted employees as required under the law. The second phase of this restructuring project is expected to commence in the second quarter of 2020.
Acquisitions and Other Business Arrangements
We discuss our acquisitions in Item 8, Note 6. Acquisitions to our consolidated financial statements.
On August 27, 2019, we announced that we were in discussions with Altria Group, Inc. regarding a potential all-stock, no premium merger of equals, and on September 25, 2019, we announced that the merger discussions had ended and that both companies agreed to focus on launching our Platform 1 product in the United States.
Global Collaboration Agreement with KT&G
In January 2020, PMI announced a global collaboration agreement with the leading tobacco and nicotine company in South Korea, KT&G, to commercialize KT&G’s smoke-free products outside of the country. The agreement will run for an initial period of three years. The two companies plan for global collaboration with the intention to actively expand to cover many markets, based on commercial success. The agreement allows PMI to distribute current KT&G smoke-free products, and their evolutions, on an exclusive basis, and does not restrict PMI from distributing its own or third-party products. KT&G’s smoke-free product brand portfolio includes heat-not-burn tobacco products (e.g., Lil Mini and Lil Plus), hybrid technologies that combine heat-not-burn tobacco and e-vapor technologies (e.g., Lil Hybrid), and e-vapor products (e.g., Lil Vapor). PMI will be responsible for the commercialization of smoke-free products supplied under the agreement.
Products sold under the agreement will be subject to careful assessment to ensure they meet the regulatory requirements in the markets where they are launched, as well as our standards of quality and scientific substantiation of their harm reduction potential. PMI and KT&G will seek any necessary regulatory approvals that may be required on a market-by-market basis. There are no current plans to commercialize KT&G products in the United States.
Investments in Unconsolidated Subsidiaries and Equity Securities
We discuss our investments in unconsolidated subsidiaries and equity securities in Item 8, Note 4. Related Parties - Investments in Unconsolidated Subsidiaries, Equity Securities and Other and Item 8, Note 16. Fair Value Measurements to our consolidated financial statements.
Trade Policy
We are subject to various trade restrictions imposed by the United States of America and countries in which we do business (“Trade Sanctions”), including the trade and economic sanctions administered by the U.S. Department of the Treasury's Office of Foreign Assets Control and the U.S. Department of State. It is our policy to comply fully with these Trade Sanctions.
Tobacco products are agricultural products under U.S. law and are not technological or strategic in nature. From time to time we make sales in countries subject to Trade Sanctions, either where such sanctions do not apply to our business or pursuant to exemptions or licenses.
A subsidiary sells products to distributors that, in turn, sell those products to duty free customers that supply U.N. peacekeeping forces around the world, including those in the U.N. peacekeeping mission located in Abyei, a special administrative territory in Sudan. We do not believe that these sales, which are not subject to Trade Sanctions, and are de minimis in volume and value, present a material risk to our shareholders, our reputation or the value of our shares. We have no employees, operations or assets in the Sudan.
To our knowledge, none of our commercial arrangements results in the governments of any country identified by the U.S. government

39
as a state sponsor of terrorism, nor entities controlled by those governments, receiving cash or acting as intermediaries in violation of U.S. laws.
We do not sell products in Iran, North Korea and Syria. From time to time, we explore opportunities to sell our products in one or more of these countries, as permitted by law.
Certain states within the U.S. have enacted legislation permitting or requiring state pension funds to divest or abstain from future investment in stocks of companies that do business with certain countries that are sanctioned by the U.S. We do not believe such legislation has had a material effect on the price of our shares.
2019 compared with 2018
The following discussion compares operating results within each of our operating segments for 2019 with 2018.
Unless otherwise stated, references to total industry, total market, our shipment volume and our market share performance reflect cigarettes and heated tobacco units.
European Union:
Financial Summary -Years Ended December 31,
ChangeFav./(Unfav.)
VarianceFav./(Unfav.)
2019 2018 TotalExcl.Curr. Total
Cur-rency Price
Vol/Mix
Cost/Other(in millions)
Net Revenues $ 9,817 $ 9,298 5.6 % 11.6% $ 519 $ (563) $ 288 $ 794 $ —
Operating Income $ 3,970 $ 4,105 (3.3)% 4.8% $ (135) $ (330) $ 288 $ 587 $ (680)
Net revenues, excluding unfavorable currency, increased by 11.6%, reflecting a favorable pricing variance, driven principally by France and Germany, partly offset by Poland; and favorable volume/mix, primarily driven by heated tobacco unit and IQOS device volume, notably in the Czech Republic, Germany, Greece, Italy and Poland, partly offset by lower cigarette volume, notably in France and Italy, and unfavorable cigarette volume/mix in Germany.
The net revenues of the European Union segment include $1,724 million in 2019 and $865 million in 2018 related to the sale of RRPs.
Operating income decreased by 3.3%. Excluding asset impairment and exit charges of $342 million in 2019 related to the plant closure in Germany and unfavorable currency of $330 million, operating income increased by 13.1% mainly reflecting: a favorable pricing variance; favorable volume/mix, primarily driven by heated tobacco unit volume, notably in the Czech Republic, Germany, Greece, Italy and Poland, partly offset by lower cigarette volume, notably in France and Italy, and unfavorable cigarette volume/mix in Germany; partially offset by higher manufacturing costs and higher marketing, administration and research costs, notably related to increased investment behind reduced-risk products.

40
European Union - Total Market, PMI Shipment and Market Share Commentaries
Total market, PMI shipment volume and market share performance are shown in the table below:
European Union Key Data Full-YearChange
2019 2018 % / ppTotal Market (billion units) 482.5 484.5 (0.4)%
PMI Shipment Volume (million units)Cigarettes 174,319 179,622 (3.0)%Heated Tobacco Units 12,569 5,977 +100.0%Total European Union 186,888 185,599 0.7 %
PMI Market ShareMarlboro 18.0% 18.5% (0.5)L&M 6.7% 6.9% (0.2)Chesterfield 5.8% 5.9% (0.1)Philip Morris 2.7% 2.9% (0.2)HEETS 2.5% 1.2% 1.3Others 3.1% 3.1% —Total European Union 38.8% 38.5% 0.3
The estimated total market in the EU decreased by 0.4% to 482.5 billion units, notably due to:
• France, down by 7.4%, primarily reflecting the impact of significant excise tax-driven price increases and a higher prevalence of illicit trade;
• Germany, down by 2.5%, primarily reflecting the impact of price increases in 2018 and March 2019; and
• Italy, down by 1.5%, primarily reflecting the impact of price increases in 2018 and the first quarter of 2019;
partly offset by
• Poland, up by 6.8%, primarily reflecting a lower prevalence of illicit trade; and
• Spain, up by 0.8%, partly reflecting a lower prevalence of illicit trade.
Our total shipment volume increased by 0.7% to 186.9 billion units, reflecting:
• higher heated tobacco unit shipment volume across the Region (notably Italy), driven by higher market share;
partly offset by
• lower cigarette shipment volume, mainly in France, due to the lower total market and lower cigarette market share, as well as Germany and Italy, partly reflecting out-switching to heated tobacco units.
Our Regional market share increased by 0.3 points to 38.8%, with gains in the Czech Republic, Germany, Greece and Portugal, partly offset by declines in France, Poland and Spain.

41
Eastern Europe:
Financial Summary -Years Ended December 31,
ChangeFav./(Unfav.)
VarianceFav./(Unfav.)
2019 2018 TotalExcl.Curr. Total
Cur-rency Price
Vol/Mix
Cost/Other(in millions)
Net Revenues $ 3,282 $ 2,921 12.4 % 16.1 % $ 361 $ (108) $ 85 $ 384 $ —
Operating Income $ 547 $ 902 (39.4)% (41.9)% $ (355) $ 23 $ 85 $ 109 $ (572)
Net revenues, excluding unfavorable currency, increased by 16.1%, reflecting a favorable pricing variance, mainly driven by Russia and Ukraine, and favorable volume/mix, predominantly driven by heated tobacco unit and IQOS device volume in Russia and Ukraine, and heated tobacco unit volume in Kazakhstan, partly offset by unfavorable cigarette volume/mix in Russia and lower cigarette volume in Ukraine.
The net revenues of the Eastern Europe segment include $844 million in 2019 and $324 million in 2018 related to the sale of RRPs. Operating income decreased by 39.4%. Excluding the unfavorable impact of $374 million related to the Russia excise and VAT audit charge, and favorable currency of $23 million, operating income decreased by 0.4%, due to: higher marketing, administration and research costs, notably reflecting increased investments behind reduced-risk products (primarily in Russia in support of geographic expansion); and higher manufacturing costs; partly offset by a favorable pricing variance; and favorable volume/mix, predominantly driven by heated tobacco unit volume in Kazakhstan, Russia and Ukraine, partly offset by unfavorable cigarette volume/mix in Russia.
Eastern Europe - Total Market, PMI Shipment Volume and Market Share Commentaries
The estimated total market in Eastern Europe decreased by 5.4% to 397.4 billion units, notably due to:
• Russia, down by 5.2%, primarily reflecting the impact of price increases, as well as an increase in the prevalence of illicit trade; and
• Ukraine, down by 12.0%, primarily reflecting the impact of excise tax-driven price increases, as well as an increase in the prevalence of illicit trade;
partly offset by
• Kazakhstan, up by 5.7%, partly reflecting a lower prevalence of illicit trade.
Our Regional market share increased by 1.6 points to 28.7%.
PMI Shipment Volume (million units) Full-Year
2019 2018 Change
Cigarettes 100,644 108,718 (7.4)%
Heated Tobacco Units 13,453 4,979 +100.0%
Total Eastern Europe 114,097 113,697 0.4 %
PMI's total shipment volume increased by 0.4% to 114.1 billion units, notably reflecting:
• Kazakhstan, up by 11.6%, reflecting the higher total market and a higher market share of heated tobacco units;
partly offset by
• Ukraine, down by 3.0%, reflecting the lower total market, partly offset by a higher market share of heated tobacco units.

42
Middle East & Africa:
Financial Summary -Years Ended December 31,
ChangeFav./(Unfav.)
VarianceFav./(Unfav.)
2019 2018 TotalExcl.Curr. Total
Cur-rency Price
Vol/Mix
Cost/Other(in millions)
Net Revenues $ 4,042 $ 4,114 (1.8)% 2.2% $ (72) $ (162) $ 207 $ (113) $ (4)
Operating Income $ 1,684 $ 1,627 3.5 % 6.8% $ 57 $ (53) $ 207 $ (128) $ 31
Net revenues, excluding unfavorable currency, increased by 2.2%, mainly reflecting: a favorable pricing variance, primarily driven by Egypt, the GCC, PMI Duty Free and Turkey, partly offset by Morocco; partially offset by unfavorable volume/mix, mainly due to heated tobacco unit and cigarette volume in PMI Duty Free, as well as cigarette volume in Kuwait, partly offset by favorable cigarette volume in Egypt and favorable cigarette volume/mix in Algeria and Saudi Arabia.
The net revenues of the Middle East & Africa segment include $321 million in 2019 and $382 million in 2018 related to the sale of RRPs.
Operating income, excluding unfavorable currency, increased by 6.8%, mainly reflecting a favorable pricing variance; lower manufacturing costs; and lower marketing, administration and research costs, notably in the GCC; partly offset by unfavorable volume/mix, mainly due to the same factors as for net revenues noted above.
Middle East & Africa - Total Market, PMI Shipment Volume and Market Share Commentaries
The estimated total market in the Middle East & Africa was essentially flat at 592.4 billion units, notably reflecting:
• Algeria, up by 7.0%, partly reflecting the timing of estimated trade inventory movements in 2019 compared to 2018; and
• Egypt, up by 1.6%, mainly due to the timing of estimated trade inventory movements in 2019 related to anticipated price increases;
offset by
• Duty Free, down by 1.6%, mainly reflecting lower purchases by travelers to China; and
• Morocco, down by 16.0%, primarily reflecting the impact of significant excise tax-driven price increases in 2019.
Our Regional market share decreased by 0.2 points to 23.5%.
PMI Shipment Volume (million units) Full-Year
2019 2018 Change
Cigarettes 134,568 136,605 (1.5 )%
Heated Tobacco Units 2,654 3,403 (22.0 )%
Total Middle East & Africa 137,222 140,008 (2.0)%
Our total shipment volume decreased by 2.0% to 137.2 billion units, notably in:
• PMI Duty Free, down by 7.0%. Excluding the net unfavorable impact of estimated distributor inventory movements of 0.4 billionunits, PMI's in-market sales decline was 4.6%, mainly reflecting lower market share and the lower total market; and
• Turkey, down by 5.6%, mainly reflecting lower market share, primarily driven by the timing of retail price increases in April 2019 compared to competition;
partly offset by
• Egypt, up by 12.2%, primarily reflecting higher market share, driven by L&M, as well as the higher total market; and
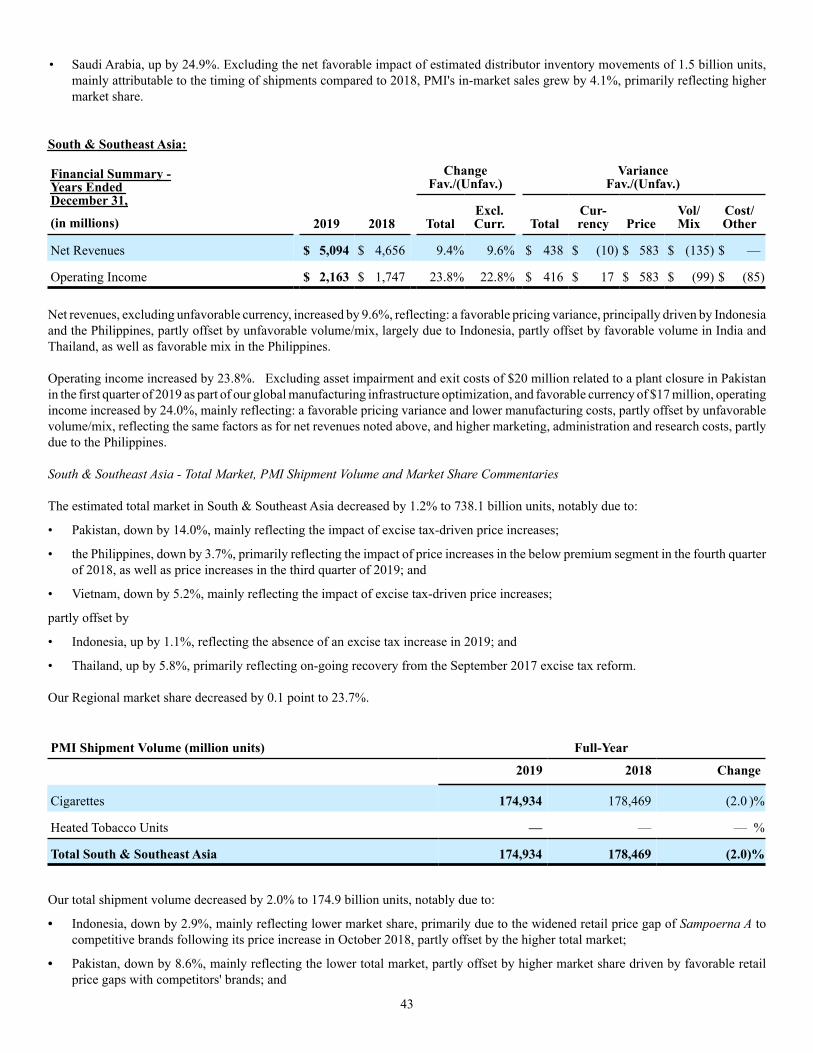
43
• Saudi Arabia, up by 24.9%. Excluding the net favorable impact of estimated distributor inventory movements of 1.5 billion units, mainly attributable to the timing of shipments compared to 2018, PMI's in-market sales grew by 4.1%, primarily reflecting higher market share.
South & Southeast Asia:
Financial Summary -Years Ended December 31,
ChangeFav./(Unfav.)
VarianceFav./(Unfav.)
2019 2018 TotalExcl.Curr. Total
Cur-rency Price
Vol/Mix
Cost/Other(in millions)
Net Revenues $ 5,094 $ 4,656 9.4% 9.6% $ 438 $ (10) $ 583 $ (135) $ —
Operating Income $ 2,163 $ 1,747 23.8% 22.8% $ 416 $ 17 $ 583 $ (99) $ (85)
Net revenues, excluding unfavorable currency, increased by 9.6%, reflecting: a favorable pricing variance, principally driven by Indonesia and the Philippines, partly offset by unfavorable volume/mix, largely due to Indonesia, partly offset by favorable volume in India and Thailand, as well as favorable mix in the Philippines.
Operating income increased by 23.8%. Excluding asset impairment and exit costs of $20 million related to a plant closure in Pakistan in the first quarter of 2019 as part of our global manufacturing infrastructure optimization, and favorable currency of $17 million, operating income increased by 24.0%, mainly reflecting: a favorable pricing variance and lower manufacturing costs, partly offset by unfavorable volume/mix, reflecting the same factors as for net revenues noted above, and higher marketing, administration and research costs, partly due to the Philippines.
South & Southeast Asia - Total Market, PMI Shipment Volume and Market Share Commentaries
The estimated total market in South & Southeast Asia decreased by 1.2% to 738.1 billion units, notably due to:
• Pakistan, down by 14.0%, mainly reflecting the impact of excise tax-driven price increases;
• the Philippines, down by 3.7%, primarily reflecting the impact of price increases in the below premium segment in the fourth quarter of 2018, as well as price increases in the third quarter of 2019; and
• Vietnam, down by 5.2%, mainly reflecting the impact of excise tax-driven price increases;
partly offset by
• Indonesia, up by 1.1%, reflecting the absence of an excise tax increase in 2019; and
• Thailand, up by 5.8%, primarily reflecting on-going recovery from the September 2017 excise tax reform.
Our Regional market share decreased by 0.1 point to 23.7%.
PMI Shipment Volume (million units) Full-Year
2019 2018 Change
Cigarettes 174,934 178,469 (2.0 )%
Heated Tobacco Units — — — %
Total South & Southeast Asia 174,934 178,469 (2.0)%
Our total shipment volume decreased by 2.0% to 174.9 billion units, notably due to:
• Indonesia, down by 2.9%, mainly reflecting lower market share, primarily due to the widened retail price gap of Sampoerna A to competitive brands following its price increase in October 2018, partly offset by the higher total market;
• Pakistan, down by 8.6%, mainly reflecting the lower total market, partly offset by higher market share driven by favorable retail price gaps with competitors' brands; and

44
• the Philippines, down by 2.9%, mainly reflecting the lower total market, partly offset by higher market share, notably of Marlboro;
partly offset by
• Thailand, up by 18.0%, mainly reflecting higher market share, driven by the continued strong performance of L&M 7.1 and the favorable impact of distribution expansion in 2018, as well as the higher total market.
East Asia & Australia:
Financial Summary -Years Ended December 31,
ChangeFav./(Unfav.)
VarianceFav./(Unfav.)
2019 2018 TotalExcl.Curr. Total
Cur-rency Price
Vol/Mix
Cost/Other(in millions)
Net Revenues $ 5,364 $ 5,580 (3.9)% (3.4)% $ (216) $ (26) $ 230 $ (420) $ —
Operating Income $ 1,932 $ 1,851 4.4 % 2.4 % $ 81 $ 37 $ 230 $ (292) $ 106
Net revenues, excluding unfavorable currency, decreased by 3.4%, reflecting: unfavorable volume/mix, mainly due to lower cigarette volume in Australia, Japan and Korea, lower IQOS device volume in Japan, and lower heated tobacco unit volume and IQOS device volume in Korea, partly offset by higher heated tobacco unit volume in Japan. The unfavorable volume/mix was partly offset by a favorablepricing variance, predominantly driven by Australia and Japan.
The net revenues of the East Asia & Australia segment include $2,671 million in 2019 and $2,506 million in 2018 related to the sale of RRPs.
Operating income, excluding favorable currency, increased by 2.4%, mainly reflecting: a favorable pricing variance and lower manufacturing costs, primarily related to Japan and Korea, partly offset by unfavorable volume/mix, mainly reflecting the same drivers as for net revenues noted above, as well as higher marketing, administration and research costs.
East Asia & Australia - Total Market, PMI Shipment Volume and Market Share Commentaries
The estimated total market in East Asia & Australia, excluding China, decreased by 4.0% to 299.2 billion units, notably due to:
• Australia, down by 5.9%, or by 8.9% excluding the impact of estimated trade inventory movements, mainly reflecting the impact of excise tax-driven retail price increases;
• Japan, down by 5.6%, mainly reflecting the impact of the October 1, 2018 excise tax-driven retail price increases, as well as out-switching to the cigarillo category;
• Korea, down by 1.4%, reflecting the secular decline of the cigarette category, partly offset by the growth of the heat-not-burn category; and
• Taiwan, down by 1.9%, continuing to reflect the impact of significant excise tax-driven retail price increases in June 2017, as well as an increase in the prevalence of illicit trade.
Our Regional market share, excluding China, decreased by 0.5 points to 26.9%.
PMI Shipment Volume (million units) Full-Year
2019 2018 Change
Cigarettes 49,951 56,163 (11.1)%
Heated Tobacco Units 30,677 26,866 14.2 %
Total East Asia & Australia 80,628 83,029 (2.9)%
PMI's total shipment volume decreased by 2.9% to 80.6 billion units, notably in:
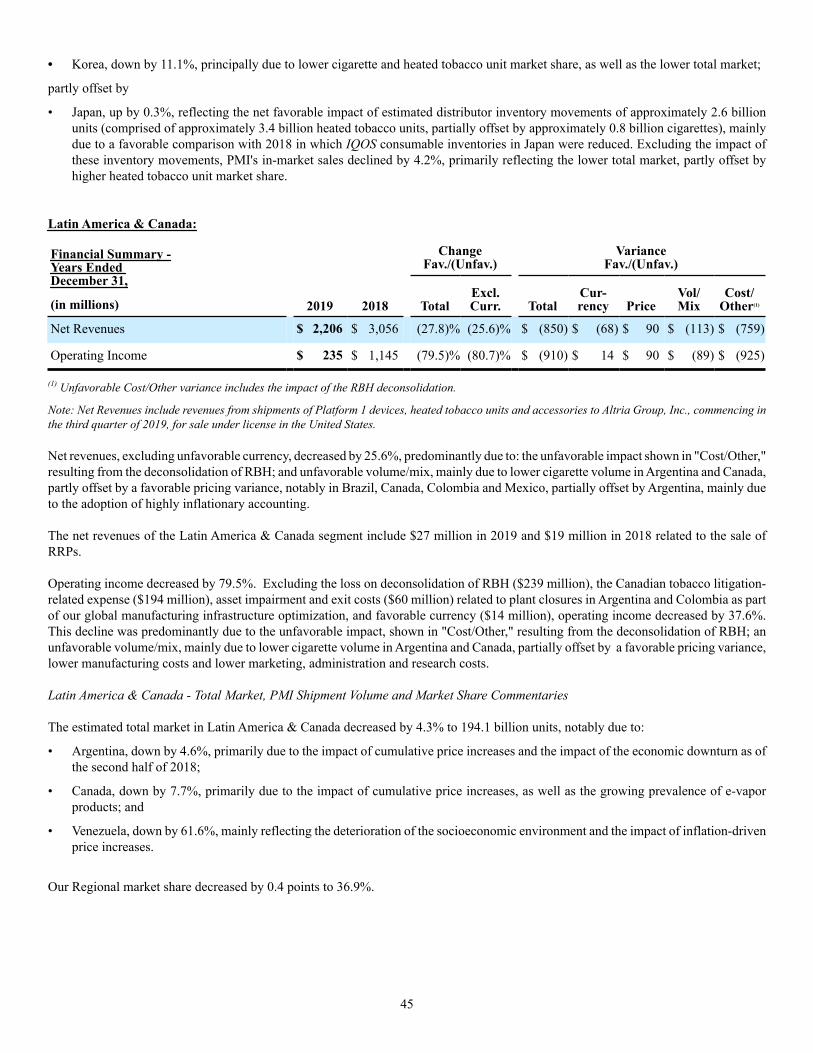
45
• Korea, down by 11.1%, principally due to lower cigarette and heated tobacco unit market share, as well as the lower total market;
partly offset by
• Japan, up by 0.3%, reflecting the net favorable impact of estimated distributor inventory movements of approximately 2.6 billionunits (comprised of approximately 3.4 billion heated tobacco units, partially offset by approximately 0.8 billion cigarettes), mainly due to a favorable comparison with 2018 in which IQOS consumable inventories in Japan were reduced. Excluding the impact of these inventory movements, PMI's in-market sales declined by 4.2%, primarily reflecting the lower total market, partly offset by higher heated tobacco unit market share.
Latin America & Canada:
Financial Summary -Years Ended December 31,
ChangeFav./(Unfav.)
VarianceFav./(Unfav.)
2019 2018 TotalExcl.Curr. Total
Cur-rency Price
Vol/Mix
Cost/Other(1)(in millions)
Net Revenues $ 2,206 $ 3,056 (27.8)% (25.6)% $ (850) $ (68) $ 90 $ (113) $ (759)
Operating Income $ 235 $ 1,145 (79.5)% (80.7)% $ (910) $ 14 $ 90 $ (89) $ (925)
(1) Unfavorable Cost/Other variance includes the impact of the RBH deconsolidation.
Note: Net Revenues include revenues from shipments of Platform 1 devices, heated tobacco units and accessories to Altria Group, Inc., commencing in the third quarter of 2019, for sale under license in the United States.
Net revenues, excluding unfavorable currency, decreased by 25.6%, predominantly due to: the unfavorable impact shown in "Cost/Other," resulting from the deconsolidation of RBH; and unfavorable volume/mix, mainly due to lower cigarette volume in Argentina and Canada, partly offset by a favorable pricing variance, notably in Brazil, Canada, Colombia and Mexico, partially offset by Argentina, mainly due to the adoption of highly inflationary accounting.
The net revenues of the Latin America & Canada segment include $27 million in 2019 and $19 million in 2018 related to the sale of RRPs.
Operating income decreased by 79.5%. Excluding the loss on deconsolidation of RBH ($239 million), the Canadian tobacco litigation-related expense ($194 million), asset impairment and exit costs ($60 million) related to plant closures in Argentina and Colombia as part of our global manufacturing infrastructure optimization, and favorable currency ($14 million), operating income decreased by 37.6%. This decline was predominantly due to the unfavorable impact, shown in "Cost/Other," resulting from the deconsolidation of RBH; an unfavorable volume/mix, mainly due to lower cigarette volume in Argentina and Canada, partially offset by a favorable pricing variance, lower manufacturing costs and lower marketing, administration and research costs.
Latin America & Canada - Total Market, PMI Shipment Volume and Market Share Commentaries
The estimated total market in Latin America & Canada decreased by 4.3% to 194.1 billion units, notably due to:
• Argentina, down by 4.6%, primarily due to the impact of cumulative price increases and the impact of the economic downturn as of the second half of 2018;
• Canada, down by 7.7%, primarily due to the impact of cumulative price increases, as well as the growing prevalence of e-vapor products; and
• Venezuela, down by 61.6%, mainly reflecting the deterioration of the socioeconomic environment and the impact of inflation-driven price increases.
Our Regional market share decreased by 0.4 points to 36.9%.

46
PMI Shipment Volume (million units) Full-Year
2019 2018 Change
Cigarettes 72,293 80,738 (10.5)%
Heated Tobacco Units 299 147 +100.0%
Total Latin America & Canada 72,592 80,885 (10.3)%
Our total shipment volume decreased by 10.3% to 72.6 billion units, or by 5.2% excluding the impact of the RBH deconsolidation, notably due to:
• Argentina, down by 9.4%, primarily reflecting the lower total market, as well as lower market share; and
• Venezuela, down by 74.8%, primarily reflecting the lower total market.
2018 compared with 2017
For a discussion comparing our consolidated operating results within each of our operating segments for the year ended December 31, 2018, with the year ended December 31, 2017, refer to Part II, Item 7. Management's Discussion and Analysis of Financial Condition and Results of Operation - Operating Results by Business Segment in our Annual Report on Form 10-K for the year ended December 31, 2018, which was filed with the U.S. Securities and Exchange Commission on February 7, 2019.
Financial Review
For the Years Ended December 31,(in millions) 2019 2018 2017Net cash provided by operating activities $ 10,090 $ 9,478 $ 8,912Net cash used in investing activities (1,811) (998) (3,083)Net cash used in financing activities (8,061) (9,651) (2,769)

47
2019 compared with 2018
Net Cash Provided by Operating Activities
Net cash provided by operating activities of $10.1 billion for the year ended December 31, 2019, increased by $0.6 billion from the comparable 2018 period. Excluding unfavorable currency movements of $1.0 billion, net cash provided by operating activities increased by $1.6 billion, due to lower working capital requirements of $1.3 billion and other movements of $0.3 billion. The unfavorable currency movements represented the impacts on net earnings coupled with the currency impacts on subsidiary working capital movements and the related inter-company positions from the fluctuations of the U.S. dollar in 2018 and 2019, especially against the Euro, Mexican peso, Russian ruble and Turkish lira.
The lower working capital requirements were primarily due to higher cash provided by accrued liabilities and other current assets related to the timing of excise tax-paid inventory movements and excise tax payments, and higher cash provided by accounts payable reflecting a combination of extended payment terms from vendors in 2019 and higher 2018 payments for IQOS device purchases in the fourth quarter of 2017, partially offset by more cash used for accounts receivable primarily due to the timing of cash collections.
The other movements of $0.3 billion, excluding currency, was driven by the net impact of the net earnings decline of $0.4 billion adjusted for the add-back of the non-cash items of $0.7 billion, comprised of $0.3 billion related to the 2019 Canadian tobacco litigation-related expense and the 2019 loss on deconsolidation of RBH and $0.4 billion related to the 2019 asset impairment and exit costs. While the asset impairment and exit costs were largely non-cash charges in 2019, approximately $0.2 billion of employee separation costs will be paid by the end of 2021 - see Item 8, Note 21. Asset Impairment and Exit Costs for additional information.
Net Cash Used in Investing Activities
Net cash used in investing activities of $1.8 billion for the year ended December 31, 2019, increased by $0.8 billion from the comparable 2018 period. This increase in net cash used in investing activities was due principally to the reduction of cash resulting from the deconsolidation of RBH, partly offset by lower capital expenditures. For further details on deconsolidation of RBH, see Item 8. Note 22. Deconsolidation of RBH.
Our capital expenditures were $0.9 billion in 2019 and $1.4 billion in 2018. The 2019 expenditures were primarily related to our ongoing investments in RRPs. We expect total capital expenditures in 2020 of approximately $1.0 billion (including capital expenditures related to our ongoing investment in RRPs), to be funded by operating cash flows.
Net Cash Used in Financing Activities
Net cash used in financing activities of $8.1 billion for the year ended December 31, 2019, decreased by $1.6 billion from the comparable 2018 period. The decrease in net cash used in financing activities was due primarily to 2019 proceeds from long-term debt issuances ($3.8 billion proceeds from our U.S. dollar and Euro debt issuances in 2019) and the purchase of the remaining 49% interest in our Costa Rican affiliates in 2018, partially offset by higher long-term debt repayments and higher repayments of short-term borrowing. For further details on the purchase of the remaining 49% interest in our Costa Rican affiliates, see Item 8, Note 6. Acquisitions.
Dividends paid in 2019 and 2018 were $7.2 billion and $6.9 billion, respectively.
2018 compared with 2017
For a discussion comparing our net cash activities (operating, investing and financing) for the year ended December 31, 2018, with the year ended December 31, 2017, refer to Part II, Item 7. Management's Discussion and Analysis of Financial Condition and Results of Operation - Financial Review in our Annual Report on Form 10-K for the year ended December 31, 2018, which was filed with the U.S. Securities and Exchange Commission on February 7, 2019.
Debt and Liquidity
We define cash and cash equivalents as short-term, highly liquid investments, readily convertible to known amounts of cash that mature within a maximum of three months and have an insignificant risk of change in value due to interest rate or credit risk changes. As a policy, we do not hold any investments in structured or equity-linked products. Our cash and cash equivalents are predominantly held in demand deposits with institutions that have investment-grade long-term credit rating. As part of our cash management strategy and in order to

48
manage counterparty exposure, we also enter into reverse repurchase agreements. Such agreements are collateralized with government or corporate securities held by a custodial bank and, at maturity, cash is paid back to PMI, and the collateral is returned to the bank. For 2018, we had an average balance of $0.3 billion, and we had a zero balance at December 31, 2018. For 2019, the activity for such reverse repurchase agreements was not material.
We utilize long-term and short-term debt financing, including a commercial paper program that is regularly used to finance ongoing liquidity requirements, as part of our overall cash management strategy. Our ability to access the capital and credit markets as well as overall dynamics of these markets may impact borrowing costs. We expect that the combination of our long-term and short-term debt financing, the commercial paper program and the committed credit facilities, coupled with our operating cash flows, will enable us to meet our liquidity requirements.
Credit Ratings – The cost and terms of our financing arrangements as well as our access to commercial paper markets may be affected by applicable credit ratings. At February 6, 2020, our credit ratings and outlook by major credit rating agencies were as follows:
Short-term Long-term OutlookMoody’s P-1 A2 StableStandard & Poor’s A-1 A StableFitch F1 A Stable
Credit Facilities – On January 31, 2020, we entered into an agreement to amend and extend the term of our $2.0 billion 364-day revolving credit facility from February 4, 2020, to February 2, 2021. At February 6, 2020, our committed credit facilities were as follows:
(in billions)
Type
CommittedCredit
Facilities
364-day revolving credit, expiring February 2, 2021 $ 2.0
Multi-year revolving credit, expiring February 28, 2021 2.5
Multi-year revolving credit, expiring October 1, 2022 3.5
Total facilities $ 8.0
At February 6, 2020, there were no borrowings under the committed credit facilities, and the entire committed amounts were available for borrowing.
All banks participating in our committed credit facilities have an investment-grade long-term credit rating from the credit rating agencies. We continuously monitor the credit quality of our banking group, and at this time we are not aware of any potential non-performing credit provider.
All but the $2.0 billion 364-day revolving credit facility in the table above require us to maintain a ratio of consolidated earnings before interest, taxes, depreciation and amortization (“consolidated EBITDA”) to consolidated interest expense of not less than 3.5 to 1.0 on a rolling four-quarter basis. At December 31, 2019, our ratio calculated in accordance with the agreements was 11.2 to 1.0. These facilities do not include any credit rating triggers, material adverse change clauses or any provisions that could require us to post collateral. We expect to continue to meet our covenants. The terms “consolidated EBITDA” and “consolidated interest expense,” both of which include certain adjustments, are defined in the facility agreements previously filed with the U.S. Securities and Exchange Commission.
We plan to replace our existing $2.5 billion multi-year revolving credit facility, expiring February 28, 2021 with a new $2.0 billion revolving credit facility expiring February 10, 2025. The new credit facility, which is expected to close on February 10, 2020, will not include the consolidated EBITDA to consolidated interest expense ratio covenant discussed above.
In addition to the committed credit facilities discussed above, certain of our subsidiaries maintain short-term credit arrangements to meet their respective working capital needs. These credit arrangements, which amounted to approximately $2.7 billion at December 31, 2019,
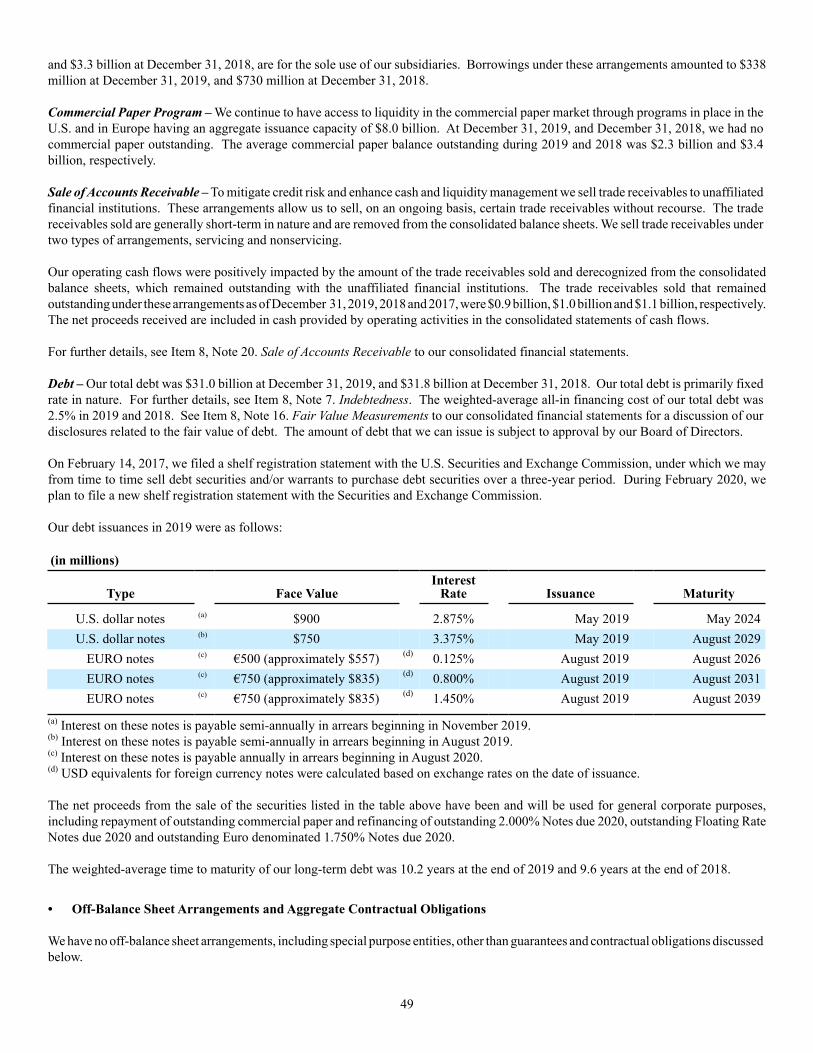
49
and $3.3 billion at December 31, 2018, are for the sole use of our subsidiaries. Borrowings under these arrangements amounted to $338 million at December 31, 2019, and $730 million at December 31, 2018.
Commercial Paper Program – We continue to have access to liquidity in the commercial paper market through programs in place in the U.S. and in Europe having an aggregate issuance capacity of $8.0 billion. At December 31, 2019, and December 31, 2018, we had no commercial paper outstanding. The average commercial paper balance outstanding during 2019 and 2018 was $2.3 billion and $3.4 billion, respectively.
Sale of Accounts Receivable – To mitigate credit risk and enhance cash and liquidity management we sell trade receivables to unaffiliated financial institutions. These arrangements allow us to sell, on an ongoing basis, certain trade receivables without recourse. The trade receivables sold are generally short-term in nature and are removed from the consolidated balance sheets. We sell trade receivables under two types of arrangements, servicing and nonservicing.
Our operating cash flows were positively impacted by the amount of the trade receivables sold and derecognized from the consolidated balance sheets, which remained outstanding with the unaffiliated financial institutions. The trade receivables sold that remained outstanding under these arrangements as of December 31, 2019, 2018 and 2017, were $0.9 billion, $1.0 billion and $1.1 billion, respectively. The net proceeds received are included in cash provided by operating activities in the consolidated statements of cash flows.
For further details, see Item 8, Note 20. Sale of Accounts Receivable to our consolidated financial statements.
Debt – Our total debt was $31.0 billion at December 31, 2019, and $31.8 billion at December 31, 2018. Our total debt is primarily fixed rate in nature. For further details, see Item 8, Note 7. Indebtedness. The weighted-average all-in financing cost of our total debt was 2.5% in 2019 and 2018. See Item 8, Note 16. Fair Value Measurements to our consolidated financial statements for a discussion of our disclosures related to the fair value of debt. The amount of debt that we can issue is subject to approval by our Board of Directors.
On February 14, 2017, we filed a shelf registration statement with the U.S. Securities and Exchange Commission, under which we may from time to time sell debt securities and/or warrants to purchase debt securities over a three-year period. During February 2020, we plan to file a new shelf registration statement with the Securities and Exchange Commission.
Our debt issuances in 2019 were as follows:
(in millions)
Type Face ValueInterest
Rate Issuance Maturity
U.S. dollar notes (a) $900 2.875% May 2019 May 2024U.S. dollar notes (b) $750 3.375% May 2019 August 2029
EURO notes (c) €500 (approximately $557) (d) 0.125% August 2019 August 2026EURO notes (c) €750 (approximately $835) (d) 0.800% August 2019 August 2031EURO notes (c) €750 (approximately $835) (d) 1.450% August 2019 August 2039
(a) Interest on these notes is payable semi-annually in arrears beginning in November 2019.(b) Interest on these notes is payable semi-annually in arrears beginning in August 2019.(c) Interest on these notes is payable annually in arrears beginning in August 2020.(d) USD equivalents for foreign currency notes were calculated based on exchange rates on the date of issuance.
The net proceeds from the sale of the securities listed in the table above have been and will be used for general corporate purposes, including repayment of outstanding commercial paper and refinancing of outstanding 2.000% Notes due 2020, outstanding Floating Rate Notes due 2020 and outstanding Euro denominated 1.750% Notes due 2020.
The weighted-average time to maturity of our long-term debt was 10.2 years at the end of 2019 and 9.6 years at the end of 2018.
• Off-Balance Sheet Arrangements and Aggregate Contractual Obligations
We have no off-balance sheet arrangements, including special purpose entities, other than guarantees and contractual obligations discussed below.

50
Guarantees – At December 31, 2019, we were contingently liable for $0.5 billion of guarantees of our own performance, of which $0.3 billion related to our obligations under indemnity agreements to enable appeals of customs assessments against our distributors, and $0.2 billion were primarily related to excise taxes on the shipment of our products. There is no liability in the consolidated financial statements associated with these guarantees. At December 31, 2019, our third-party guarantees were insignificant.
Aggregate Contractual Obligations – The following table summarizes our contractual obligations at December 31, 2019:
Payments Due
(in millions) Total 2020 2021-2022 2023-20242025 and
ThereafterLong-term debt (1) $30,962 $4,051 $5,779 $4,890 $16,242
Interest on borrowings (2) 10,124 877 1,534 1,273 6,440
Operating leases (3) 949 222 286 158 283
Purchase obligations (4):
Inventory and production costs 3,493 2,199 885 409 —
Other 2,180 977 578 213 412
5,673 3,176 1,463 622 412
Other long-term liabilities (5) 1,992 278 408 661 645$49,700 $8,604 $9,470 $7,604 $24,022
(1) Amounts represent the expected cash payments at the face value of our long-term debt and finance lease obligations. For further details, see Item 8, Note 7. Indebtedness to our consolidated financial statements.
(2) Amounts represent the expected cash payments of our interest expense on our long-term debt, including the current portion of long-term debt. Interest on our fixed-rate debt is presented using the stated interest rate. Interest on our variable debt is estimated using the rate in effect at December 31, 2019. Amounts exclude the amortization of debt discounts, the amortization of loan fees and fees for lines of credit that would be included in interest expense in the consolidated statements of earnings.
(3) Amounts represent the maturity of PMI"s operating lease liabilities, on an undiscounted basis.(4) Purchase obligations for inventory and production costs (such as raw materials, indirect materials and supplies, packaging, co-manufacturing arrangements, storage
and distribution) are commitments for projected needs to be utilized in the normal course of business. Other purchase obligations include commitments for marketing, advertising, capital expenditures, information technology and professional services. Other purchase obligations also include the expected future contributions to the Foundation for a Smoke-Free World. For further details see Business Environment—Other Developments. Arrangements are considered purchase obligations if a contract specifies all significant terms, including fixed or minimum quantities to be purchased, a pricing structure and approximate timing of the transaction. Amounts represent the minimum commitments under non-cancelable contracts. Any amounts reflected on the consolidated balance sheet as accounts payable and accrued liabilities are excluded from the table above.
(5) Other long-term liabilities consist primarily of transition tax (as discussed in Item 8, Note 11. Income Taxes to our consolidated financial statements), postretirement health care costs, accruals established for employment costs and accruals established for Exit activities (for further details, see Note 21. Asset impairment and Exit Costs). The following long-term liabilities included on the consolidated balance sheet are excluded from the table above: accrued pension and postemployment costs, tax contingencies, insurance accruals and other accruals. We are unable to estimate the timing of payments (or contributions in the case of accrued pension costs) for these items. Currently, we anticipate making pension contributions of approximately $77 million in 2020, based on current tax and benefit laws (as discussed in Item 8, Note 13. Benefit Plans to our consolidated financial statements).
Equity and Dividends
We discuss our stock awards as of December 31, 2019, in Item 8, Note 9. Stock Plans to our consolidated financial statements.
During 2019, 2018 and 2017, we did not repurchase any shares under a share repurchase program, and we do not presently intend to repurchase shares of our common stock in 2020.
Dividends paid in 2019 were $7.2 billion. During the third quarter of 2019, our Board of Directors approved a 2.6% increase in the quarterly dividend to $1.17 per common share. As a result, the present annualized dividend rate is $4.68 per common share.

51
Market Risk
Counterparty Risk - We predominantly work with financial institutions with strong short- and long-term credit ratings as assigned by Standard & Poor’s and Moody’s. These banks are also part of a defined group of relationship banks. Non-investment grade institutions are only used in certain emerging markets to the extent required by local business needs. We have a conservative approach when it comes to choosing financial counterparties and financial instruments. As such we do not invest or hold investments in any structured or equity-linked products. The majority of our cash and cash equivalents is currently invested in demand deposits maturing within less than 30 days.
We continuously monitor and assess the credit worthiness of all our counterparties.
Derivative Financial Instruments - We operate in markets outside of the U.S., with manufacturing and sales facilities in various locations throughout the world. Consequently, we use certain financial instruments to manage our foreign currency and interest rate exposure. We use derivative financial instruments principally to reduce our exposure to market risks resulting from fluctuations in foreign exchange and interest rates by creating offsetting exposures. We are not a party to leveraged derivatives and, by policy, do not use derivative financial instruments for speculative purposes.
See Item 8, Note 15. Financial Instruments, Item 8, Note 16. Fair Value Measurements and Item 8, Note 19. Balance Sheet Offsetting to our consolidated financial statements for further details on our derivative financial instruments and the related collateral arrangements.
Value at Risk - We use a value at risk computation to estimate the potential one-day loss in the fair value of our interest-rate-sensitive and foreign currency price-sensitive derivative financial instruments. This computation includes our debt and foreign currency forwards, swaps and options. Anticipated transactions, foreign currency trade payables and receivables, and net investments in foreign subsidiaries, which the foregoing instruments are intended to hedge, were excluded from the computation.
The computation estimates were made assuming normal market conditions, using a 95% confidence interval and a one-day holding period using a "parametric delta-gamma" approximation technique to determine the observed interrelationships between movements in interest rates and various currencies and in calculating the risk of the underlying positions in the portfolio. These interrelationships were determined by observing interest rate and forward currency rate movements primarily over the preceding quarter for determining value at risk at December 31, 2019 and 2018, and primarily over each of the four preceding quarters for the calculation of average value at risk amounts during each year.
Fair Value Impact
(in millions) At
December 31, 2019 Average High Low
Instruments sensitive to:
Foreign currency rates $18 $20 $24 $18
Interest rates $301 $247 $346 $169
Fair Value Impact
(in millions) At
December 31, 2018 Average High Low
Instruments sensitive to:
Foreign currency rates $19 $20 $23 $19
Interest rates $142 $132 $152 $96
The value at risk computation is a risk analysis tool designed to statistically estimate the maximum probable daily loss from adverse movements in interest and foreign currency rates under normal market conditions. The computation does not purport to represent actual losses in fair value or earnings to be incurred by us, nor does it consider the effect of favorable changes in market rates. We cannot predict actual future movements in such market rates and do not present these results to be indicative of future movements in market rates or to

52
be representative of any actual impact that future changes in market rates may have on our future results of operations or financial position.
Contingencies
See Item 3 and Item 8, Note 18. Contingencies to our consolidated financial statements for a discussion of contingencies.
Cautionary Factors That May Affect Future Results
Forward-Looking and Cautionary Statements
We may from time to time make written or oral forward-looking statements, including statements contained in filings with the SEC, in reports to stockholders and in press releases and investor webcasts. You can identify these forward-looking statements by use of words such as "strategy," "expects," "continues," "plans," "anticipates," "believes," "will," "estimates," "intends," "projects," "goals," "targets" and other words of similar meaning. You can also identify them by the fact that they do not relate strictly to historical or current facts.
We cannot guarantee that any forward-looking statement will be realized, although we believe we have been prudent in our plans and assumptions. Our RRPs constitute a new product category in its early stages that is less predictable than our mature cigarette business. Achievement of future results is subject to risks, uncertainties and inaccurate assumptions. Should known or unknown risks or uncertainties materialize, or should underlying assumptions prove inaccurate, actual results could vary materially from those anticipated, estimated or projected. Investors should bear this in mind as they consider forward-looking statements and whether to invest in or remain invested in our securities. In connection with the “safe harbor” provisions of the Private Securities Litigation Reform Act of 1995, we are identifying important factors that, individually or in the aggregate, could cause actual results and outcomes to differ materially from those contained in any forward-looking statements made by us; any such statement is qualified by reference to the following cautionary statements. We elaborate on these and other risks we face throughout this document, particularly in Item 1A. Risk Factors and Business Environment of this section. You should understand that it is not possible to predict or identify all risk factors. Consequently, you should not consider this discussion of potential risks or uncertainties to be complete. We do not undertake to update any forward-looking statement that we may make from time to time, except in the normal course of our public disclosure obligations.
Item 7A. Quantitative and Qualitative Disclosures About Market Risk. The information called for by this Item is included in Item 7, Market Risk.
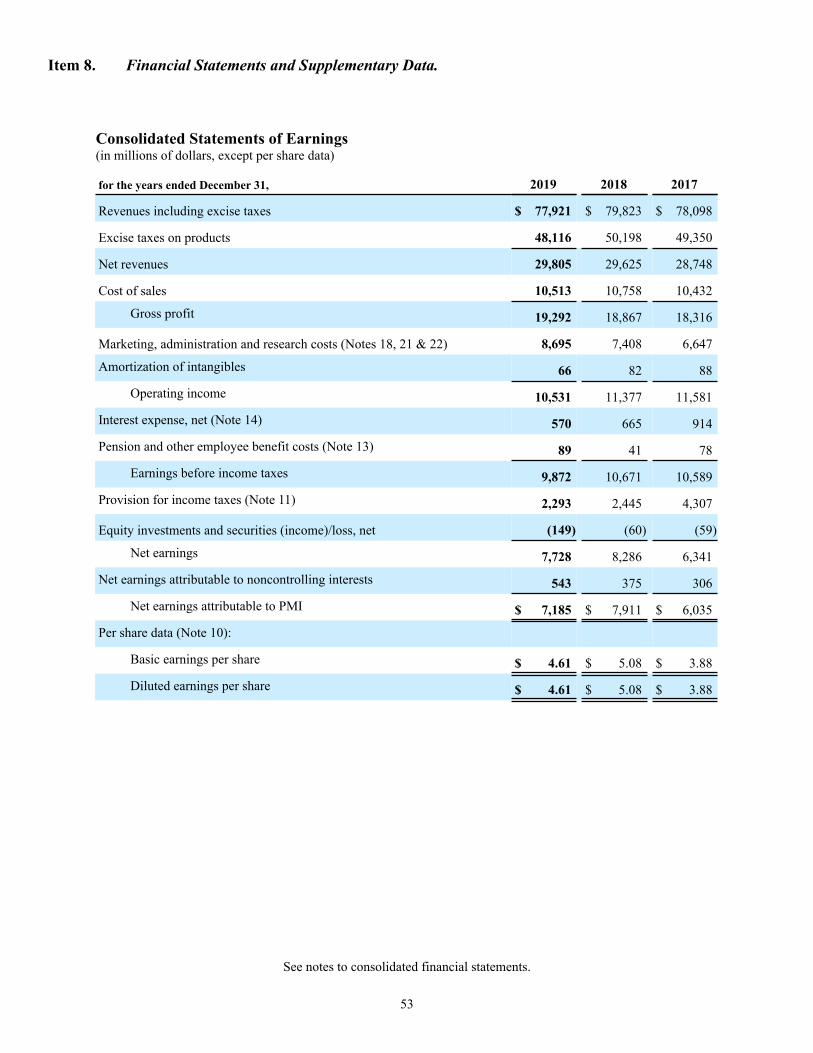
53
Item 8. Financial Statements and Supplementary Data.
Consolidated Statements of Earnings(in millions of dollars, except per share data)
for the years ended December 31, 2019 2018 2017
Revenues including excise taxes $ 77,921 $ 79,823 $ 78,098
Excise taxes on products 48,116 50,198 49,350
Net revenues 29,805 29,625 28,748
Cost of sales 10,513 10,758 10,432
Gross profit 19,292 18,867 18,316
Marketing, administration and research costs (Notes 18, 21 & 22) 8,695 7,408 6,647
Amortization of intangibles 66 82 88
Operating income 10,531 11,377 11,581
Interest expense, net (Note 14) 570 665 914
Pension and other employee benefit costs (Note 13) 89 41 78
Earnings before income taxes 9,872 10,671 10,589
Provision for income taxes (Note 11) 2,293 2,445 4,307
Equity investments and securities (income)/loss, net (149) (60) (59)
Net earnings 7,728 8,286 6,341
Net earnings attributable to noncontrolling interests 543 375 306
Net earnings attributable to PMI $ 7,185 $ 7,911 $ 6,035
Per share data (Note 10):
Basic earnings per share $ 4.61 $ 5.08 $ 3.88
Diluted earnings per share $ 4.61 $ 5.08 $ 3.88
See notes to consolidated financial statements.

54
Consolidated Statements of Comprehensive Earnings(in millions of dollars)
for the years ended December 31, 2019 2018 2017
Net earnings $ 7,728 $ 8,286 $ 6,341
Other comprehensive earnings (losses), net of income taxes:
Change in currency translation adjustments:
Unrealized gains (losses), net of income taxes of ($161) in 2019,($47) in 2018 and $620 in 2017 505 (812) 330
(Gains)/losses transferred to earnings, net of income taxes of $0 in2019, 2018 and 2017 — — (2)
(Gains)/losses transferred to earnings - deconsolidation of RBH,net of income taxes of $0 in 2019, 2018 and 2017 (Note 22) 502 — —
Change in net loss and prior service cost:
Net gains (losses) and prior service costs, net of income taxes of$247 in 2019, $65 in 2018 and ($17) in 2017 (454) (1,046) 523
Amortization of net losses, prior service costs and net transitioncosts, net of income taxes of ($69) in 2019, ($43) in 2018 and($31) in 2017 243 218 228
(Gains)/losses transferred to earnings - deconsolidation of RBH,net of income taxes of ($15) in 2019, $0 in 2018 and $0 in 2017(Note 22) 27 — —
Change in fair value of derivatives accounted for as hedges:
Gains (losses) recognized, net of income taxes of $2 in 2019, ($4)in 2018 and $8 in 2017 (18) 24 (44)
(Gains) losses transferred to earnings, net of income taxes of $3 in2019, $5 in 2018 and $2 in 2017 (14) (31) (11)
Total other comprehensive earnings (losses) 791 (1,647) 1,024
Total comprehensive earnings 8,519 6,639 7,365
Less comprehensive earnings attributable to:
Noncontrolling interests 586 304 306
Comprehensive earnings attributable to PMI $ 7,933 $ 6,335 $ 7,059
See notes to consolidated financial statements.
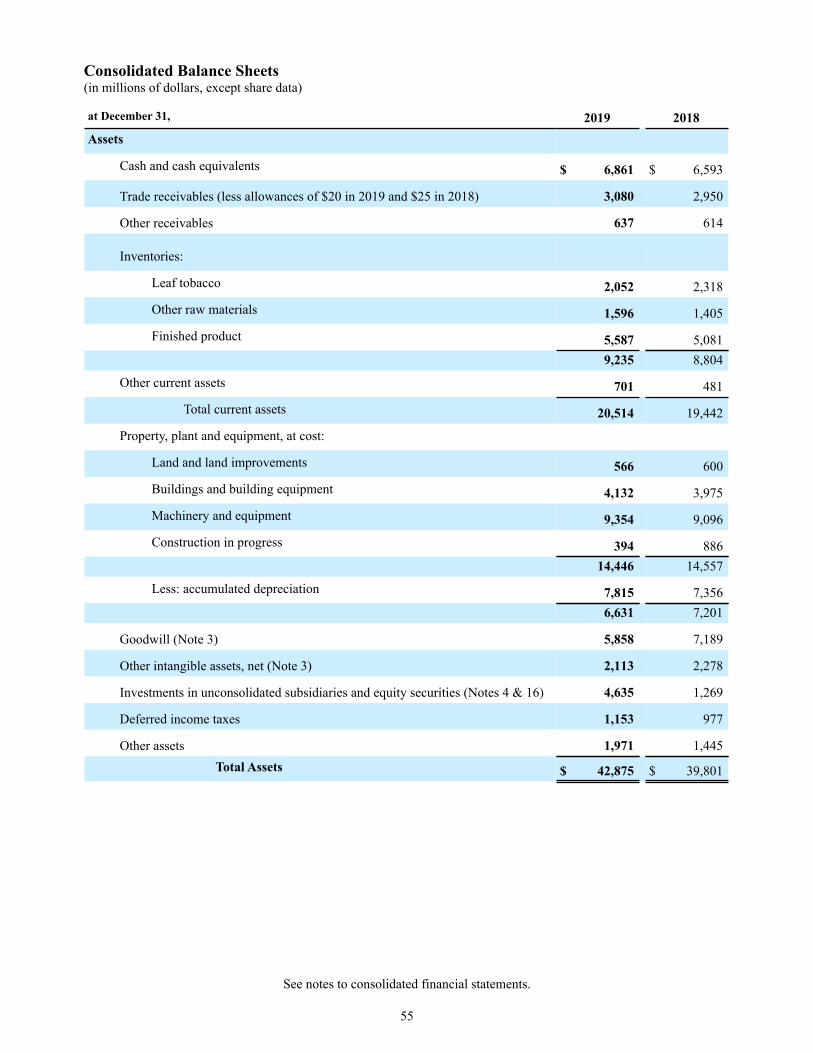
55
Consolidated Balance Sheets (in millions of dollars, except share data)
at December 31, 2019 2018Assets
Cash and cash equivalents $ 6,861 $ 6,593
Trade receivables (less allowances of $20 in 2019 and $25 in 2018) 3,080 2,950
Other receivables 637 614
Inventories:
Leaf tobacco 2,052 2,318
Other raw materials 1,596 1,405
Finished product 5,587 5,0819,235 8,804
Other current assets 701 481
Total current assets 20,514 19,442
Property, plant and equipment, at cost:
Land and land improvements 566 600
Buildings and building equipment 4,132 3,975
Machinery and equipment 9,354 9,096
Construction in progress 394 88614,446 14,557
Less: accumulated depreciation 7,815 7,3566,631 7,201
Goodwill (Note 3) 5,858 7,189
Other intangible assets, net (Note 3) 2,113 2,278
Investments in unconsolidated subsidiaries and equity securities (Notes 4 & 16) 4,635 1,269
Deferred income taxes 1,153 977
Other assets 1,971 1,445Total Assets $ 42,875 $ 39,801
See notes to consolidated financial statements.

56
at December 31, 2019 2018Liabilities
Short-term borrowings (Note 7) $ 338 $ 730
Current portion of long-term debt (Note 7) 4,051 4,054Accounts payable 2,299 2,068Accrued liabilities:
Marketing and selling 666 732Taxes, except income taxes 5,837 5,088Employment costs 1,042 794Dividends payable 1,831 1,783Other 1,973 1,366
Income taxes (Note 11) 796 576Total current liabilities 18,833 17,191
Long-term debt (Note 7) 26,656 26,975Deferred income taxes 908 898Employment costs 3,634 3,083Income taxes and other liabilities (Note 11) 2,443 2,393
Total liabilities 52,474 50,540
Contingencies (Note 18)
Stockholders’ (Deficit) Equity
Common stock, no par value (2,109,316,331 shares issued in 2019 and 2018) — —Additional paid-in capital 2,019 1,939Earnings reinvested in the business 30,987 31,014Accumulated other comprehensive losses (9,363) (10,111)
23,643 22,842
Less: cost of repurchased stock (553,421,668 and 554,736,610 shares in 2019 and2018, respectively) 35,220 35,301
Total PMI stockholders’ deficit (11,577) (12,459)Noncontrolling interests 1,978 1,720
Total stockholders’ deficit (9,599) (10,739)
Total Liabilities and Stockholders’ (Deficit) Equity $ 42,875 $ 39,801
See notes to consolidated financial statements.

57
Consolidated Statements of Cash Flows(in millions of dollars)
for the years ended December 31, 2019 2018 2017CASH PROVIDED BY (USED IN) OPERATING ACTIVITIES
Net earnings $ 7,728 $ 8,286 $ 6,341
Adjustments to reconcile net earnings to operating cash flows:
Depreciation and amortization 964 989 875
Deferred income tax (benefit) provision (141) (100) (501)
Asset impairment and exit costs, net of cash paid (Note 21) 371 (3) (10)
Cash effects of changes in:
Receivables, net (331) 53 (92)
Inventories (548) (613) 730
Accounts payable 451 (51) 425
Accrued liabilities and other current assets 1,108 910 (554)
Income taxes 75 (135) 1,370
Pension plan contributions (200) (110) (66)
Other 613(1)
252 394
Net cash provided by operating activities 10,090 9,478 8,912
CASH PROVIDED BY (USED IN) INVESTING ACTIVITIES
Capital expenditures (852) (1,436) (1,548)
Investments in unconsolidated subsidiaries and equity securities (31) (63) (111)
Deconsolidation of RBH (Note 22) (1,346)(2)
— —
Net investment hedges 386 416 (1,527)
Other 32 85 103
Net cash used in investing activities (1,811) (998) (3,083)
See notes to consolidated financial statements.

58
for the years ended December 31, 2019 2018 2017
CASH PROVIDED BY (USED IN) FINANCING ACTIVITIES
Short-term borrowing activity by original maturity:
Net issuances (repayments) - maturities of 90 days or less $ (364) $ 255 $ (127)
Issuances - maturities longer than 90 days 989 — 1,634
Repayments - maturities longer than 90 days (989) — (1,634)
Long-term debt proceeds 3,819 — 6,850
Long-term debt repaid (3,998) (2,484) (2,551)
Dividends paid (7,161) (6,885) (6,520)
Sale (purchase) of subsidiary shares to/(from) noncontrolling interests(Note 6) 51 (81) 5
Other (408) (456) (426)
Net cash used in financing activities (8,061) (9,651) (2,769)
Effect of exchange rate changes on cash, cash equivalents and restricted cash 27 (685) 1,085
Cash, cash equivalents and restricted cash(3):Increase (Decrease) 245 (1,856) 4,145Balance at beginning of year 6,620 8,476 4,331Balance at end of year $ 6,865 $ 6,620 $ 8,476
Cash Paid: Interest $ 800 $ 882 $ 1,050 Income taxes $ 2,430 $ 2,749 $ 3,403
(1) Includes the Loss on Deconsolidation of RBH ($239 million) and the Canadian tobacco litigation-related charge ($194 million) that were included in marketing, administration and research costs in the consolidated statements of earnings for the year ended December 31, 2019. For further details on these charges, see Note 22. Deconsolidation of RBH.
(2) Includes deconsolidation of RBH cash and cash equivalents of $1,323 million and restricted cash of $23 million.
(3) The amounts for cash and cash equivalents shown above include restricted cash of $4 million, $27 million and $29 million as of December 31, 2019, 2018 and 2017, respectively, which were included in other current assets in the consolidated balance sheets.
See notes to consolidated financial statements.

59
Consolidated Statements of Stockholders' (Deficit) Equity(in millions of dollars, except per share data)
PMI Stockholders’ (Deficit) Equity
CommonStock
AdditionalPaid-inCapital
EarningsReinvested
in theBusiness
AccumulatedOther
ComprehensiveLosses
Cost ofRepurchased
StockNoncontrolling
Interests TotalBalances, January 1, 2017 $ — $ 1,964 $ 30,397 $ (9,559) $ (35,490) $ 1,788 $ (10,900)Net earnings 6,035 306 6,341Other comprehensive earnings
(losses), net of income taxes 1,024 1,024Issuance of stock awards 20 108 128Dividends declared ($4.22 per share) (6,573) (6,573)Payments to noncontrolling interests (255) (255)Other (12) 17 5Balances, December 31, 2017 — 1,972 29,859 (8,535) (35,382) 1,856 (10,230)Net earnings 7,911 375 8,286Other comprehensive earnings
(losses), net of income taxes (1,572) (75) (1,647)Issuance of stock awards 47 81 128Dividends declared ($4.49 per share) (6,994) (6,994)Payments to noncontrolling interests (435) (435)Adoption of new accounting
standards (1) 238 238Other (Note 6) (80) (4) (1) (85)Balances, December 31, 2018 — 1,939 31,014 (10,111) (35,301) 1,720 (10,739)Net earnings 7,185 543 7,728Other comprehensive earnings
(losses), net of income taxes 219 43 262
Issuance of stock awards 79 81 160Dividends declared ($4.62 per share) (7,212) (7,212)Payments to noncontrolling interests (378) (378)Deconsolidation of RBH (Note 22) 529 529Other 1 — 50 51Balances, December 31, 2019 $ — $ 2,019 $ 30,987 $ (9,363) $ (35,220) $ 1,978 $ (9,599)
(1) Financial Accounting Standard Update ASU 2016-01, “Financial Instruments - Overall (Subtopic 825-10): Recognition and Measurement of Financial Assets and Financial Liabilities”
See notes to consolidated financial statements.

60
Notes to Consolidated Financial Statements
Note 1.
Background and Basis of Presentation:
Background
Philip Morris International Inc. is a holding company incorporated in Virginia, U.S.A., whose subsidiaries and affiliates and their licensees are engaged in the manufacture and sale of cigarettes and other nicotine-containing products, including reduced-risk products, in markets outside of the United States of America. In addition, PMI ships a version of its Platform 1 device and its consumables authorized by the U.S. Food and Drug Administration ("FDA") to Altria Group, Inc., for sale in the United States under license. Throughout these financial statements, the term "PMI" refers to Philip Morris International Inc. and its subsidiaries.
Reduced-risk products ("RRPs") is the term PMI uses to refer to products that present, are likely to present, or have the potential to present less risk of harm to smokers who switch to these products versus continuing smoking. PMI has a range of RRPs in various stages of development, scientific assessment and commercialization.
"Platform 1" is the term PMI uses to refer to PMI’s reduced-risk product that uses a precisely controlled heating device incorporating our IQOS HeatControl technology, into which a specially designed and proprietary tobacco unit is inserted and heated to generate an aerosol.
Basis of presentation
The preparation of financial statements in conformity with accounting principles generally accepted in the United States of America ("U.S. GAAP") requires management to make estimates and assumptions that affect the reported amounts of assets and liabilities, the disclosure of contingent liabilities at the dates of the financial statements and the reported amounts of net revenues and expenses during the reporting periods. Significant estimates and assumptions include, among other things: pension and benefit plan assumptions; useful lives and valuation assumptions of goodwill and other intangible assets; valuation assumptions for non-marketable equity securities; marketing programs, and income taxes. Actual results could differ from those estimates.
The consolidated financial statements include PMI, as well as its wholly owned and majority-owned subsidiaries. Investments in which PMI exercises significant influence (generally 20%-50% ownership interest) are accounted for under the equity method of accounting. Investments not accounted for under the equity method of accounting are measured at fair value, if it is readily determinable, with changes in fair value recognized in net income. Investments without readily determinable fair values, non-marketable equity securities, are measured and recorded using a measurement alternative that values the security at cost minus any impairment. All intercompany transactions and balances have been eliminated.
As of March 22, 2019, PMI deconsolidated the financial results of its Canadian subsidiary, Rothmans, Benson & Hedges Inc. ("RBH") from PMI's financial statements. For further details, see Note 22. Deconsolidation of RBH.
Note 2.
Summary of Significant Accounting Policies:
Cash and cash equivalents
Cash equivalents include demand deposits with banks and all highly liquid investments with original maturities of three months or less.

61
Depreciation
Property, plant and equipment are stated at historical cost and depreciated by the straight-line method over the estimated useful lives of the assets. Machinery and equipment are depreciated over periods ranging from 3 to 15 years, and buildings and building improvements over periods up to 40 years.
Employee benefit plans
PMI provides a range of benefits to its employees and retired employees, including pensions, postretirement health care and postemployment benefits (primarily severance). PMI records annual amounts relating to these plans based on calculations specified under U.S. GAAP. PMI recognizes the funded status of its defined pension and postretirement plans on the consolidated balance sheets. The funded status is measured as the difference between the fair value of the plans assets and the benefit obligation. PMI measures the plan assets and liabilities at the end of the fiscal year. For defined benefit pension plans, the benefit obligation is the projected benefit obligation. For the postretirement health care plans, the benefit obligation is the accumulated postretirement benefit obligation. Any plan with an overfunded status is recognized as an asset, and any plan with an underfunded status is recognized as a liability. Any gains or losses and prior service costs or credits that have not been recognized as a component of net periodic benefit costs are recorded as a component of other comprehensive earnings (losses), net of deferred taxes. PMI elects to recognize actuarial gains/(losses) using the corridor approach.
Foreign currency translation
PMI translates the results of operations of its subsidiaries and affiliates using average exchange rates during each period, whereas balance sheet accounts are translated using exchange rates at the end of each period. Currency translation adjustments are recorded as a component of stockholders’ (deficit) equity. In addition, some of PMI’s subsidiaries have assets and liabilities denominated in currencies other than their functional currencies, and to the extent those are not designated as net investment hedges, these assets and liabilities generate transaction gains and losses when translated into their respective functional currencies.
Goodwill and non-amortizable intangible assets valuation
PMI tests goodwill and non-amortizable intangible assets for impairment annually or more frequently if events occur that would warrant such review. PMI performs its annual impairment analysis in the second quarter of each year. The impairment analysis involves comparing the fair value of each reporting unit or non-amortizable intangible asset to the carrying value. If the carrying value exceeds the fair value, goodwill or a non-amortizable intangible asset is considered impaired.
Hedging instruments
Derivative financial instruments are recorded at fair value on the consolidated balance sheets as either assets or liabilities. Changes in the fair value of derivatives are recorded each period either in accumulated other comprehensive losses on the consolidated balance sheet or in earnings, depending on whether a derivative is designated and effective as part of a hedge transaction and, if it is, the type of hedge transaction. Gains and losses on derivative instruments reported in accumulated other comprehensive losses are reclassified to the consolidated statements of earnings, into the same line item as the impact of the underlying transaction, in the periods in which operating results are affected by the hedged item. Cash flows from hedging instruments are classified in the same manner as the affected hedged item in the consolidated statements of cash flows.
Impairment of long-lived assets
PMI reviews long-lived assets, including amortizable intangible assets, for impairment whenever events or changes in business circumstances indicate that the carrying amount of the assets may not be fully recoverable. PMI performs undiscounted operating cash flow analyses to determine if an impairment exists. For purposes of recognition and measurement of an impairment for assets held for use, PMI groups assets and liabilities at the lowest level for which cash flows are separately identifiable. If an impairment is determined to exist, any related impairment loss is calculated based on fair value. Impairment losses on assets to be disposed of, if any, are based on the estimated proceeds to be received, less costs of disposal.
Impairment of investment in non-marketable equity securities
Non-marketable equity securities are subject to periodic impairment reviews during which PMI considers both qualitative and quantitative factors that may have a significant impact on the investees' fair value. Upon determining that an impairment may exist, the security’s fair value is calculated and compared to its carrying value, and an impairment is recognized immediately if the carrying value exceeds the fair value. For further details see Note 22. Deconsolidation of RBH.

62
Impairment of investments in unconsolidated subsidiaries
Investments in unconsolidated subsidiaries are evaluated for impairment whenever events or changes in circumstances indicate that the carrying amount of the investments may not be recoverable. An impairment loss would be recorded whenever a decline in value of an equity investment below its carrying amount is determined to be other than temporary. PMI determines whether a loss is other than temporary by considering the length of time and extent to which the fair value of the equity investment has been less than the carrying amount, the financial condition of the equity investment, and the intent to retain the investment for a period of time is sufficient to allow for any anticipated recovery in market value.
Income taxes
Income taxes are provided on all earnings for jurisdictions outside the United States. These provisions, as well as state and local income tax provisions, are determined on a separate company basis, and the related assets and liabilities are recorded in PMI’s consolidated balance sheets. Significant judgment is required in determining income tax provisions and in evaluating tax positions. PMI recognizes accrued interest and penalties associated with uncertain tax positions as part of the provision for income taxes on the consolidated statements of earnings. PMI recognizes income taxes associated with Global Intangible Low-Taxed Income ("GILTI") taxes as current period expense rather than including these amounts in the measurement of deferred taxes.
Inventories
Inventories are stated at the lower of cost or market. The first-in, first-out and average cost methods are used to cost substantially all inventories. It is a generally recognized industry practice to classify leaf tobacco inventory as a current asset, although part of such inventory, because of the duration of the aging process, ordinarily would not be utilized within one year.
Leases
PMI determines that a contract contains a lease if the contract conveys a right to control the use of the identified asset for a period of time in exchange for consideration. Lease expense is recognized on a straight-line basis over the lease term. At lease commencement, PMI recognizes lease liabilities and the corresponding right-of-use assets (at the present value of future payments) for predominately all of its operating leases. The recognition of the right-of-use asset and lease liability includes renewal options when it is reasonably certain that they will be exercised. Certain of PMI’s leases include payments that are based on changes to an index or on actual usage. These lease payments are adjusted periodically and are included within variable lease costs. PMI accounts for lease and nonlease components as a single-lease component with the exception of its vehicle leases, of which PMI accounts for the lease components separately from the nonlease components. Additionally, leases with an initial term of 12 months or less are not included in the right-of-use asset or lease liability on the consolidated statement of financial position.
Marketing costs
PMI supports its products with advertising, adult consumer engagement and trade promotions. Such programs include, but are not limited to, discounts, rebates, in-store display incentives, e-commerce, mobile and other digital platforms, adult consumer activation and promotion activities, as well as costs associated with adult consumer experience outlets and other adult consumer touchpoints and volume-based incentives. Advertising, as well as certain consumer engagement and trade activities costs, are expensed as incurred. Trade promotions are recorded as a reduction of revenues based on amounts estimated as being due to customers at the end of a period, based principally on historical utilization. For interim reporting purposes, advertising and certain consumer engagement expenses are charged to earnings based on estimated sales and related expenses for the full year.
Revenue recognition
PMI recognizes revenue primarily through the manufacture and sale of cigarettes and other nicotine-containing products, including reduced-risk products. The majority of PMI revenues are generated by sales through direct and indirect distribution networks with short-term payment conditions and where control is typically transferred to the customer either upon shipment or delivery of goods. PMI evaluates the transfer of control through evidence of the customer’s receipt and acceptance, transfer of title, PMI’s right to payment for those products and the customer’s ability to direct the use of those products upon receipt. Typically, PMI’s performance obligations are satisfied and revenue is recognized either upon shipment or delivery of goods.
In certain instances, PMI facilitates shipping and handling activities after control has transferred to the customer. PMI has elected to record all shipping and handling activities as costs to fulfill a contract. The shipping and handling costs that have not been incurred at the time revenue is recognized are accrued. The transaction price is typically based on the amount billed to the customer and includes estimated variable consideration, where applicable. Such variable consideration is typically not constrained and is estimated based on the most likely amount that PMI expects to be entitled to under the terms of the contracts with customers, historical experience of discount

63
or rebate redemption, where relevant, and the terms of any underlying discount or rebate programs, which may change from time to time as the business and product categories evolve. PMI has elected to exclude excise taxes collected from customers from the measurement of the transaction price, thereby presenting revenues net of excise taxes. Estimated costs associated with warranty programs are generally provided for in cost of sales in the period the related revenues are recognized.
Stock-based compensation
PMI measures compensation cost for all stock-based awards at fair value on date of grant and recognizes the compensation costs over the service periods for awards expected to vest. PMI’s accounting policy is to estimate the number of awards expected to be forfeited and adjust the expense when it is no longer probable that the employee will fulfill the service condition. For further details, see Note 9. Stock Plans.
Note 3.
Goodwill and Other Intangible Assets, net:
The movements in goodwill were as follows:
(in millions)European
UnionEasternEurope
MiddleEast &Africa
South &Southeast
AsiaEast Asia &
Australia
LatinAmerica &
Canada TotalBalance at January 1, 2018 $ 1,419 $ 321 $ 102 $ 3,010 $ 567 $ 2,247 $ 7,666Changes due to:
Currency (62) (18) (15) (215) (31) (136) (477)Balances, December 31, 2018 1,357 303 87 2,795 536 2,111 7,189Changes due to:
Currency (19) (3) 2 103 15 34 132Deconsolidation of RBH (1,463) (1,463)
Balances, December 31, 2019 $ 1,338 $ 300 $ 89 $ 2,898 $ 551 $ 682 $ 5,858
At December 31, 2019, goodwill primarily reflects PMI’s acquisitions in Colombia, Greece, Indonesia, Mexico, Pakistan and Serbia, as well as the business combination in the Philippines.
For details on the deconsolidation of RBH, see Note 22. Deconsolidation of RBH.
Details of other intangible assets were as follows:
December 31, 2019 December 31, 2018
(in millions)
Weighted-Average
RemainingUseful Life
GrossCarryingAmount
AccumulatedAmortization Net
GrossCarryingAmount
AccumulatedAmortization Net
Non-amortizable intangibleassets $ 1,319 $ 1,319 $ 1,269 $ 1,269
Amortizable intangible assets:
Trademarks 14 years 1,217 $ 526 691 1,488 $ 608 880
Distribution networks 8 years 113 72 41 141 82 59
Other* 9 years 106 44 62 107 37 70
Total other intangible assets $ 2,755 $ 642 $ 2,113 $ 3,005 $ 727 $ 2,278* Includes farmer contracts and intellectual property rights

64
Non-amortizable intangible assets substantially consist of trademarks from PMI’s acquisitions in Indonesia and Mexico. The increase since December 31, 2018, was due to currency movements of $50 million.
The decrease in the gross carrying amount of amortizable intangible assets from December 31, 2018, was mainly due to the deconsolidation of RBH's trademarks of ($275 million) and distribution network of ($29 million), partially offset by currency movements of $6 million.
The change in the accumulated amortization from December 31, 2018 was mainly due to the deconsolidation of RBH's trademarks of ($133 million) and distribution network of ($18 million), partially offset by the 2019 amortization of $66 million and by currency movements of $2 million.
Amortization expense for each of the next five years is estimated to be $73 million or less, assuming no additional transactions occur that require the amortization of intangible assets.
During the second quarter of 2019, PMI completed its annual review of goodwill and non-amortizable intangible assets for potential impairment, and no impairment charges were required as a result of this review.
Note 4.
Related Parties - Investments in Unconsolidated Subsidiaries, Equity Securities and Other:
Investments in unconsolidated subsidiaries:
At December 31, 2019 and 2018, PMI had total investments in unconsolidated subsidiaries of $1,053 million and $981 million, respectively, which were accounted for under the equity method of accounting. Equity method investments are initially recorded at cost. Under the equity method of accounting, the investment is adjusted for PMI's proportionate share of earnings or losses, dividends, capital contributions, changes in ownership interests and movements in currency translation adjustments. The carrying value of our equity method investments at December 31, 2019 and 2018, exceeded our share of the unconsolidated subsidiaries' book value by $901 million and $835 million, respectively. The difference between the investment carrying value and the amount of underlying equity in net assets, excluding $863 million and $793 million attributable to goodwill as of December 31, 2019 and 2018, respectively, is being amortized on a straight-line basis over the underlying assets' estimated useful lives of 10 to 20 years. At December 31, 2019 and 2018, PMI received year-to-date dividends from unconsolidated subsidiaries of $100 million and $118 million, respectively.
PMI holds a 23% equity interest in Megapolis Distribution BV, the holding company of CJSC TK Megapolis, PMI's distributor in Russia (Eastern Europe segment).
PMI holds a 49% equity interest in United Arab Emirates-based Emirati Investors-TA (FZC) (“EITA”). PMI holds an approximate 25%economic interest in Société des Tabacs Algéro-Emiratie (“STAEM”), an Algerian joint venture that is 51% owned by EITA and 49% by the Algerian state-owned enterprise Management et Développement des Actifs et des Ressources Holding ("MADAR Holding"), which is part of the Middle East & Africa segment, manufactures and distributes under license some of PMI’s brands.
The initial investments in Megapolis Distribution BV and EITA were recorded at cost and are included in investments in unconsolidated subsidiaries and equity securities on the consolidated balance sheets.
Equity securities:
Following the deconsolidation of RBH, PMI recorded the continuing investment in RBH, PMI's wholly owned subsidiary, at fair value of $3,280 million at the date of deconsolidation, within investments in unconsolidated subsidiaries and equity securities. For further details, see Note 22. Deconsolidation of RBH. Transactions between PMI and RBH are considered to be related-party transactions from the date of deconsolidation and are included in the tables below.

65
Other related parties:
United Arab Emirates-based Trans-Emirates Trading and Investments (FZC) ("TTI") holds a 33% non-controlling interest in Philip Morris Misr LLC ("PMM"), an entity incorporated in Egypt which is consolidated in PMI’s financial statements in the Middle East & Africa segment. PMM sells, under license, PMI brands in Egypt through an exclusive distribution agreement with a local entity that is also controlled by TTI.
IPM India, PMI's consolidated subsidiary in the South & Southeast Asia segment, has a non-controlling interest of 43.7% held by Godfrey Phillips India Ltd, who also acts as contract manufacturer and distributor for IPM. Amounts in the tables below include transactions between these related parties, beginning in 2019. Prior periods do not include these transactions as they were not material.
Financial activity with the above related parties:
PMI’s net revenues and expenses with the above related parties were as follows:
For the Years Ended December 31,(in millions) 2019 2018 2017Net revenuesMegapolis Group $ 2,236 $ 1,994 $ 1,874Other 1,015 720 647Net revenues (a) $ 3,251 $ 2,714 $ 2,521
Expenses:Other $ 63 $ 21 $ 23Expenses $ 63 $ 21 $ 23
(a) Net revenues exclude excise taxes and VAT billed to customers. Prior year's amounts have been reclassified to conform with the current year's presentation.
PMI’s balance sheet activity with the above related parties was as follows:
At December 31,(in millions) 2019 2018Receivables:Megapolis Group $ 375 $ 172Other 148 136Receivables $ 523 $ 308
Payables:Other $ 20 $ 8Payables $ 20 $ 8 The activities with the above related parties are in the ordinary course of business, and are primarily for distribution, service fees, contract manufacturing and license agreements. PMI eliminated its respective share of all significant intercompany transactions with the equity method investees.

66
Note 5.
Product Warranty:
PMI's IQOS devices are subject to standard product warranties generally for a period of 12 months from the date of purchase or such other periods as required by law. PMI generally provides in cost of sales for the estimated cost of warranty in the period the related revenue is recognized. PMI assesses the adequacy of its accrued product warranties and adjusts the amounts as necessary based on actual experience and changes in future estimates. Factors that affect product warranties may vary across markets but typically include device version mix, product failure rates, logistics and service delivery costs, and warranty policies. PMI accounts for its product warranties within other accrued liabilities. At December 31, 2019 and December 31, 2018, these amounts were as follows:
At December 31,(in millions) 2019 2018Balance at beginning of period $ 67 $ 71Changes due to: Warranties issued 303 179 Settlements (230) (183) Currency — —Balance at end of period $ 140 $ 67
Note 6.
Acquisitions:
On March 21, 2018, PMI acquired the remaining 49% interest in Tabacalera Costarricense, S.A. and Mendiola y Compañía, S.A. for a net purchase price of $95 million, which includes $2 million of contingent consideration. As a result, PMI now owns 100% of these Costa Rican affiliates. The purchase of the remaining 49% interest resulted in a decrease to PMI’s additional paid-in capital of $86 million.
Note 7.
Indebtedness:
Short-Term Borrowings
At December 31, 2019 and 2018, PMI’s short-term borrowings and related average interest rates consisted of the following:
December 31, 2019 December 31, 2018
(in millions)Amount
OutstandingAverage Year-
End RateAmount
OutstandingAverage Year-
End Rate
Commercial paper $ — —% $ — —%
Bank loans 338 5.5 730 5.8$ 338 $ 730
Given the mix of subsidiaries and their respective local economic environments, the average interest rate for bank loans above can vary significantly from day to day and country to country.
The fair values of PMI’s short-term borrowings at December 31, 2019 and 2018, based upon current market interest rates, approximate the amounts disclosed above.

67
Long-Term Debt
At December 31, 2019 and 2018, PMI’s long-term debt consisted of the following:
December 31,(in millions) 2019 2018
U.S. dollar notes, 1.875% to 6.375% (average interest rate 3.516%), due through 2044 $ 19,783 $ 20,819Foreign currency obligations:
Euro notes, 0.125% to 3.125% (average interest rate 1.950%), due through 2039 9,822 8,656
Swiss franc notes, 1.000% to 2.000% (average interest rate 1.521%), due through 2024 899 1,374
Other (average interest rate 3.125%), due through 2025 203 18030,707 31,029
Less current portion of long-term debt 4,051 4,054$ 26,656 $ 26,975
Other debt:
Other foreign currency debt above includes mortgage debt in Switzerland and finance lease obligations at December 31, 2019 and December 31, 2018.
Debt Issuances Outstanding:
PMI’s debt issuances outstanding at December 31, 2019, were as follows:
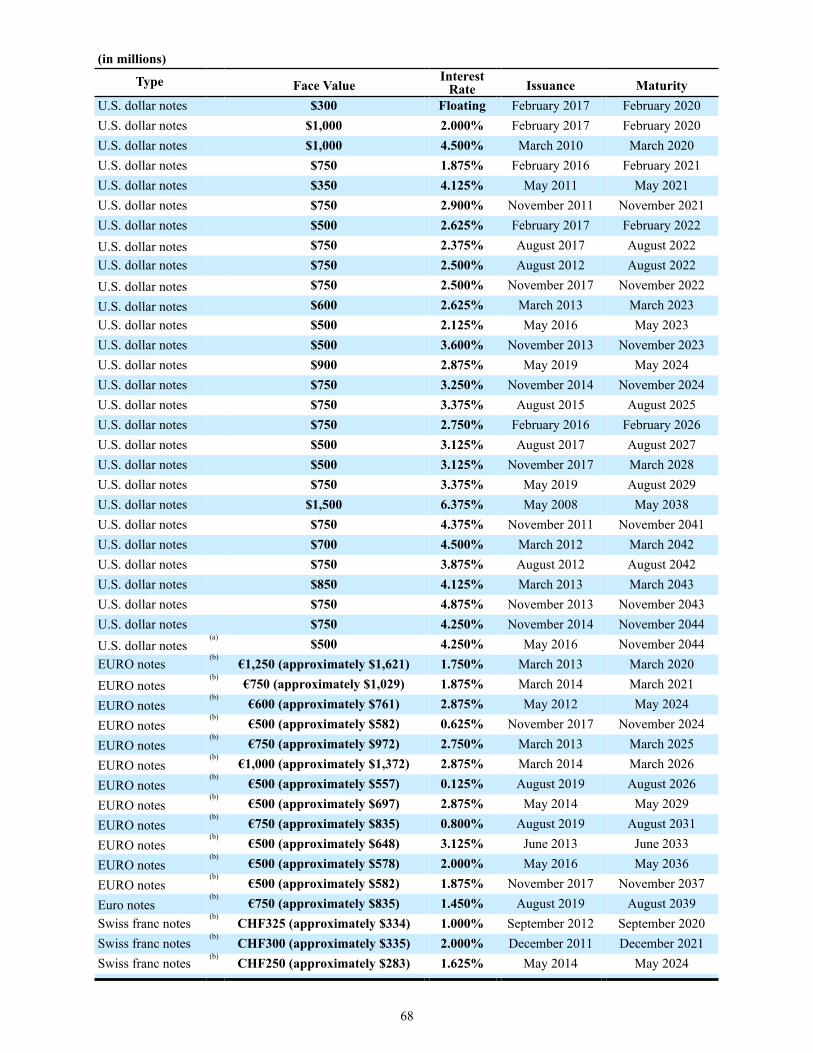
68
(in millions)
Type Face ValueInterest
Rate Issuance MaturityU.S. dollar notes $300 Floating February 2017 February 2020U.S. dollar notes $1,000 2.000% February 2017 February 2020U.S. dollar notes $1,000 4.500% March 2010 March 2020U.S. dollar notes $750 1.875% February 2016 February 2021U.S. dollar notes $350 4.125% May 2011 May 2021U.S. dollar notes $750 2.900% November 2011 November 2021U.S. dollar notes $500 2.625% February 2017 February 2022U.S. dollar notes $750 2.375% August 2017 August 2022U.S. dollar notes $750 2.500% August 2012 August 2022U.S. dollar notes $750 2.500% November 2017 November 2022U.S. dollar notes $600 2.625% March 2013 March 2023U.S. dollar notes $500 2.125% May 2016 May 2023U.S. dollar notes $500 3.600% November 2013 November 2023U.S. dollar notes $900 2.875% May 2019 May 2024U.S. dollar notes $750 3.250% November 2014 November 2024U.S. dollar notes $750 3.375% August 2015 August 2025U.S. dollar notes $750 2.750% February 2016 February 2026U.S. dollar notes $500 3.125% August 2017 August 2027U.S. dollar notes $500 3.125% November 2017 March 2028U.S. dollar notes $750 3.375% May 2019 August 2029U.S. dollar notes $1,500 6.375% May 2008 May 2038U.S. dollar notes $750 4.375% November 2011 November 2041U.S. dollar notes $700 4.500% March 2012 March 2042U.S. dollar notes $750 3.875% August 2012 August 2042U.S. dollar notes $850 4.125% March 2013 March 2043U.S. dollar notes $750 4.875% November 2013 November 2043U.S. dollar notes $750 4.250% November 2014 November 2044U.S. dollar notes
(a)$500 4.250% May 2016 November 2044
EURO notes(b)
€1,250 (approximately $1,621) 1.750% March 2013 March 2020EURO notes
(b)€750 (approximately $1,029) 1.875% March 2014 March 2021
EURO notes(b)
€600 (approximately $761) 2.875% May 2012 May 2024EURO notes
(b)€500 (approximately $582) 0.625% November 2017 November 2024
EURO notes(b)
€750 (approximately $972) 2.750% March 2013 March 2025EURO notes
(b)€1,000 (approximately $1,372) 2.875% March 2014 March 2026
EURO notes(b)
€500 (approximately $557) 0.125% August 2019 August 2026EURO notes
(b)€500 (approximately $697) 2.875% May 2014 May 2029
EURO notes(b)
€750 (approximately $835) 0.800% August 2019 August 2031EURO notes
(b)€500 (approximately $648) 3.125% June 2013 June 2033
EURO notes(b)
€500 (approximately $578) 2.000% May 2016 May 2036EURO notes
(b)€500 (approximately $582) 1.875% November 2017 November 2037
Euro notes(b)
€750 (approximately $835) 1.450% August 2019 August 2039Swiss franc notes
(b)CHF325 (approximately $334) 1.000% September 2012 September 2020
Swiss franc notes(b)
CHF300 (approximately $335) 2.000% December 2011 December 2021Swiss franc notes
(b)CHF250 (approximately $283) 1.625% May 2014 May 2024

69
(a) These notes are a further issuance of the 4.250% notes issued by PMI in November 2014.(b) USD equivalents for foreign currency notes were calculated based on exchange rates on the date of issuance.
The net proceeds from the sale of the securities listed in the table above were used for general corporate purposes, including working capital requirements and repurchase of PMI's common stock until 2015.
Aggregate maturities:
Aggregate maturities of long-term debt are as follows:
(in millions)
2020 $ 4,051
2021 3,015
2022 2,764
2023 1,607
2024 3,283
2025-2029 6,332
2030-2034 1,400
Thereafter 8,51030,962
Debt discounts (255)
Total long-term debt $ 30,707
See Note 16. Fair Value Measurements for additional disclosures related to the fair value of PMI’s debt.
Credit Facilities
On January 28, 2019, PMI entered into an agreement to extend the term of its $2.0 billion 364-day revolving credit facility from February 5, 2019, to February 4, 2020.
At December 31, 2019, PMI’s total committed credit facilities and commercial paper outstanding were as follows:
Type(in billions of dollars)
CommittedCredit
FacilitiesCommercial
Paper
364-day revolving credit, expiring February 4, 2020 $ 2.0
Multi-year revolving credit, expiring February 28, 2021 2.5
Multi-year revolving credit, expiring October 1, 2022 3.5
Total facilities $ 8.0
Commercial paper outstanding $ —
At December 31, 2019, there were no borrowings under these committed credit facilities, and the entire committed amounts were available for borrowing.
Each of these facilities requires PMI to maintain a ratio of consolidated earnings before interest, taxes, depreciation and amortization (“consolidated EBITDA”) to consolidated interest expense of not less than 3.5 to 1.0 on a rolling four-quarter basis. At December 31, 2019, PMI’s ratio calculated in accordance with the agreements was 11.2 to 1.0. These facilities do not include any credit rating triggers, material adverse change clauses or any provisions that could require PMI to post collateral. The terms “consolidated EBITDA” and “consolidated interest expense,” both of which include certain adjustments, are defined in the facility agreements previously filed with the Securities and Exchange Commission.

70
On January 31, 2020, PMI entered into an agreement to amend and extend the term of its $2 billion 364-day revolving credit facility from February 4, 2020, to February 2, 2021.
In addition to the committed credit facilities discussed above, certain subsidiaries maintain short-term credit arrangements to meet their respective working capital needs. These credit arrangements, which amounted to approximately $2.7 billion at December 31, 2019, and $3.3 billion at December 31, 2018, are for the sole use of the subsidiaries. Borrowings under these arrangements amounted to $338 million at December 31, 2019, and $730 million at December 31, 2018.
Note 8.
Capital Stock:
Shares of authorized common stock are 6.0 billion; issued, repurchased and outstanding shares were as follows:
Shares IssuedShares
RepurchasedShares
Outstanding
Balances, January 1, 2017 2,109,316,331 (557,930,784) 1,551,385,547
Issuance of stock awards 1,832,215 1,832,215
Balances, December 31, 2017 2,109,316,331 (556,098,569) 1,553,217,762
Issuance of stock awards 1,361,959 1,361,959
Balances, December 31, 2018 2,109,316,331 (554,736,610) 1,554,579,721
Issuance of stock awards 1,314,942 1,314,942
Balances, December 31, 2019 2,109,316,331 (553,421,668) 1,555,894,663
At December 31, 2019, 27,371,404 shares of common stock were reserved for stock awards under PMI’s stock plans, and 250 millionshares of preferred stock, without par value, were authorized but unissued. PMI currently has no plans to issue any shares of preferred stock.
Note 9.
Stock Plans:
In May 2017, PMI’s shareholders approved the Philip Morris International Inc. 2017 Performance Incentive Plan (the “2017 Plan”). Under the 2017 Plan, PMI may grant to eligible employees restricted shares and restricted share units, performance-based cash incentive awards and performance-based equity awards. Up to 25 million shares of PMI’s common stock may be issued under the 2017 Plan. At December 31, 2019, shares available for grant under the 2017 Plan were 20,127,360.
In May 2017, PMI’s shareholders also approved the Philip Morris International Inc. 2017 Stock Compensation Plan for Non-Employee Directors (the “2017 Non-Employee Directors Plan”). A non-employee director is defined as a member of the PMI Board of Directors who is not a full-time employee of PMI or of any corporation in which PMI owns, directly or indirectly, stock possessing at least 50%of the total combined voting power of all classes of stock entitled to vote in the election of directors in such corporation. Up to 1 millionshares of PMI common stock may be awarded under the 2017 Non-Employee Directors Plan. At December 31, 2019, shares available for grant under the plan were 954,084.
Restricted share unit (RSU) awards
PMI may grant RSU awards to eligible employees; recipients may not sell, assign, pledge or otherwise encumber such awards. Such awards are subject to forfeiture if certain employment conditions are not met. RSU awards generally vest on the third anniversary of the grant date. RSU awards do not carry voting rights, although they do earn dividend equivalents.

71
During 2019, the activity for RSU awards was as follows:
Number ofShares
Weighted-Average GrantDate Fair Value
Per ShareBalance at January 1, 2019 3,318,795 $ 96.26
Granted 1,726,760 77.28Vested (1,126,057) 89.56Forfeited (193,628) 89.36
Balance at December 31, 2019 3,725,870 $ 89.85
During the years ended December 31, 2019, 2018 and 2017, the weighted-average grant date fair value of the RSU awards granted to PMI employees and the recorded compensation expense related to RSU awards were as follows:
(in millions, except per RSUaward granted)
Total Weighted-Average Grant
Date Fair Value ofRSU Awards
Granted
Weighted-Average GrantDate Fair ValuePer RSU Award
Granted
CompensationExpense relatedto RSU Awards
2019 $ 133 $ 77.28 $ 118
2018 $ 129 $ 100.19 $ 114
2017 $ 119 $ 98.59 $ 111
The fair value of the RSU awards at the date of grant is amortized to expense over the restriction period, typically three years after the date of the award, or upon death, disability or reaching the age of 58. As of December 31, 2019, PMI had $124 million of total unrecognized compensation costs related to non-vested RSU awards. These costs are expected to be recognized over a weighted-average period of approximately two years, or upon death, disability or reaching the age of 58.
During the years ended December 31, 2019, 2018 and 2017, share and fair value information for PMI RSU awards that vested were as follows:
(dollars in millions)Shares of RSU
Awards that Vested
Grant Date FairValue of VestedShares of RSU
Awards
Total Fair Valueof RSU Awards
that Vested
2019 1,126,057 $ 101 $ 95
2018 1,451,876 $ 121 $ 149
2017 2,022,856 $ 158 $ 208
Performance share unit (PSU) awards
PMI may grant PSU awards to certain executives; recipients may not sell, assign, pledge or otherwise encumber such awards. The PSU awards require the achievement of certain performance factors, which are predetermined at the time of grant, typically over a three-year performance cycle with performance metrics for such PSUs consisting of PMI’s Total Shareholder Return (TSR) relative to a predetermined peer group and on an absolute basis (50% weight), PMI’s currency-neutral compound annual adjusted operating income growth rate, excluding acquisitions (30% weight), and PMI’s performance against specific measures of PMI's transformation (20% weight). The aggregate of the weighted performance factors for the three metrics determines the percentage of PSUs that will vest at the end of the three-year performance cycle. The minimum percentage of such PSUs that can vest is zero, with a target percentage of 100 and a maximum percentage of 200. Each such vested PSU entitles the participant to one share of common stock. An aggregate weighted PSU performance factor of 100 will result in the targeted number of PSUs being vested. At the end of the performance cycle, participants are entitled to an amount equivalent to the accumulated dividends paid on common stock during the performance cycle for the number of shares earned. PSU awards do not carry voting rights.

72
During 2019, the activity for PSU awards was as follows:
Number of Shares
Grant Date Fair Value
Subject to Other Performance
Factors Per Share
Grant Date Fair Value
Subject to TSR Performance
Factor Per ShareBalance at January 1, 2019 1,194,970 $ 95.85 $ 117.09
Granted 647,700 77.23 83.59Vested (330,616) 89.02 104.60Forfeited (164,594) 90.28 107.09
Balance at December 31, 2019 1,347,460 $ 88.19 $ 107.61
During the years ended December 31, 2019, 2018 and 2017, the grant date fair value of the PSU awards granted to PMI employees and the recorded compensation expense related to PSU awards were as follows:
(in millions, except per PSU awardgranted)
PSU Grant Date Fair ValueSubject to Other
Performance Factors
PSU Grant Date Fair ValueSubject to TSR
Performance Factor
CompensationExpense relatedto PSU Awards
TotalPer PSUAward Total
Per PSUAward Total
2019 $ 30 $ 77.23 $ 21 $ 83.59 $ 542018 $ 20 $ 100.69 $ 24 $ 118.98 $ 242017 $ 19 $ 98.29 $ 25 $ 128.72 $ 37
The grant date fair value of the PSU awards subject to the other performance factors was determined by using the average of the high and low market price of PMI’s stock at the date of the grant. The grant date fair value of the PSU market-based awards subject to the TSR performance factor was determined by using the Monte Carlo simulation model. The following assumptions were used to determine the grant date fair value of the PSU awards subject to the TSR performance factor for the years ended December 31, 2019, 2018 and 2017:
For the Years Ended December 31,2019 2018 2017
Risk-free interest rate (a) 2.4% 2.3% 1.5%
Expected volatility 21.4%(b)
19.6%(c)
15.8%(c)
(a) Based on the U.S. Treasury yield curve.(b) Determined using the observed historical volatility.(c) Determined using a weighted-average of historical and implied volatility.
The fair value of the PSU award at the date of grant is amortized to expense over the performance period, which is typically three yearsafter the date of the award, or upon death, disability or reaching the age of 58. As of December 31, 2019, PMI had $33 million of total unrecognized compensation cost related to non-vested PSU awards. This cost is recognized over a weighted-average performance cycle period of approximately two years, or upon death, disability or reaching the age of 58.
During the year ended December 31, 2019, share and fair value information for PMI PSU awards that vested were as follows:
(dollars in millions)Shares of PSU
Awards that Vested
Grant Date FairValue of VestedShares of PSU
Awards
Total Fair Valueof PSU Awards
that Vested
2019 330,616 $ 32 $ 28
During the years ended December 31, 2018 and 2017, there were no PSU awards that vested.

73
Note 10.
Earnings per Share:
Unvested share-based payment awards that contain non-forfeitable rights to dividends or dividend equivalents are participating securities and therefore are included in PMI’s earnings per share calculation pursuant to the two-class method.
Basic and diluted earnings per share (“EPS”) were calculated using the following:
For the Years Ended December 31,(in millions) 2019 2018 2017
Net earnings attributable to PMI $ 7,185 $ 7,911 $ 6,035
Less distributed and undistributed earnings attributable to share-based payment awards 17 16 14
Net earnings for basic and diluted EPS $ 7,168 $ 7,895 $ 6,021
Weighted-average shares for basic EPS 1,555 1,555 1,552Plus contingently issuable performance stock units (PSUs) 1 — 1Weighted-average shares for diluted EPS 1,556 1,555 1,553
For the 2019, 2018 and 2017 computations, there were no antidilutive stock options.
Note 11.
Income Taxes:
Earnings before income taxes and provision for income taxes consisted of the following for the years ended December 31, 2019, 2018 and 2017:
(in millions) 2019 2018 2017Earnings before income taxes $ 9,872 $ 10,671 $ 10,589Provision for income taxes:
United States federal and state:Current $ 17 $ 120 $ 1,662Deferred 24 (113) (384)
Total United States 41 7 1,278Outside United States:
Current 2,417 2,425 3,146Deferred (165) 13 (117)
Total outside United States 2,252 2,438 3,029Total provision for income taxes $ 2,293 $ 2,445 $ 4,307
In December 2017, the Tax Cuts and Jobs Act was signed into law. Accordingly, PMI recorded a provisional charge of $1.6 billion in its 2017 income tax provision, including a charge for the transition tax on accumulated foreign earnings of $1.4 billion (which represented the transition tax of $2.2 billion, net of a reversal of $0.7 billion of previously recorded deferred tax liabilities on part of its accumulated foreign earnings and other items of $0.1 billion) and $0.2 billion due to the re-measurement of U.S. deferred tax assets and liabilities applying the U.S. federal corporate tax rate of 21%.
PMI completed its analysis of the Tax Cuts and Jobs Act during 2018 and adjusted the 2017 provisional estimates to the final amounts based on its 2017 U.S. federal income tax return as filed. Accordingly, PMI recorded in its income tax provision a charge of $31 million

74
representing a current income tax charge of $185 million, primarily due to an increase in its aggregate foreign cash position used to determine PMI's final 2017 transition tax liability, mostly offset by a deferred income tax benefit of $154 million primarily due to the recognition of deferred tax assets for net operating losses in the state of New York. Updates to the provisional estimates have been recorded in accordance with Staff Accounting Bulletin No. 118 ("SAB 118").
At December 31, 2017, PMI recorded an income tax payable of $1.7 billion attributable to the Tax Cuts and Jobs Act, of which $1.6 billion was recorded in "income taxes and other liabilities" on PMI's consolidated balance sheet. The income tax payable of $1.7 billionrepresented the transition tax of $2.2 billion, partially offset by foreign tax credits related to foreign withholding taxes previously paid of $0.5 billion. The income tax payable is due over an eight-year period beginning in 2018. In December 2018, PMI recorded an increase to income tax payable of $0.1 billion related to PMI’s transition tax liability, in accordance with SAB 118. At December 31, 2019 and December 31, 2018, $1.2 billion and $1.5 billion of PMI's remaining transition tax liability, respectively, was recorded in "income taxes and other liabilities" on PMI's consolidated balance sheet.
At December 31, 2019 and December 31, 2018, U.S. federal and foreign deferred income taxes have been provided on all accumulated earnings of PMI's foreign subsidiaries.
In accordance with the alternatives provided by ASU 2018-02 "Reclassification of Certain Tax Effects from Accumulated Other Comprehensive Income," PMI has elected not to reclassify the income tax effects of the Tax Cuts and Jobs Act from accumulated other comprehensive losses to retained earnings.
PMI is regularly examined by tax authorities around the world and is currently under examination in a number of jurisdictions. The U.S. federal statute of limitations remains open for the years 2015 and onward. Foreign and U.S. state jurisdictions have statutes of limitations generally ranging from three to five years. Years still open to examination by foreign tax authorities in major jurisdictions include Germany (2015 onward), Indonesia (2014 onward), Russia (2017 onward), Switzerland (2017 onward), and Turkey (2014 onward).
It is reasonably possible that within the next 12 months certain tax examinations will close, which could result in a change in unrecognized tax benefits, along with related interest and penalties. An estimate of any possible change cannot be made at this time.
A reconciliation of the beginning and ending amount of unrecognized tax benefits was as follows:
(in millions) 2019 2018 2017Balance at January 1, $ 56 $ 145 $ 79
Additions based on tax positions related to the current year 10 10 71Additions for tax positions of previous years 1 15 5Reductions for tax positions of prior years (2) (94) —Reductions due to lapse of statute of limitations (1) (3) (7)Settlements — (19) (4)Other (1) 2 1
Balance at December 31, $ 63 $ 56 $ 145
Unrecognized tax benefits and PMI’s liability for contingent income taxes, interest and penalties were as follows:
(in millions) December 31, 2019 December 31, 2018 December 31, 2017
Unrecognized tax benefits $ 63 $ 56 $ 145
Accrued interest and penalties 16 12 23
Tax credits and other indirect benefits (12) (14) (35)Liability for tax contingencies $ 67 $ 54 $ 133
The amount of unrecognized tax benefits that, if recognized, would impact the effective tax rate was $50 million at December 31, 2019. The remainder, if recognized, would principally affect deferred taxes.
For the years ended December 31, 2019, 2018 and 2017, PMI recognized income (expense) in its consolidated statements of earnings of $(4) million, $4 million and $(11) million, respectively, related to interest and penalties associated with uncertain tax positions.
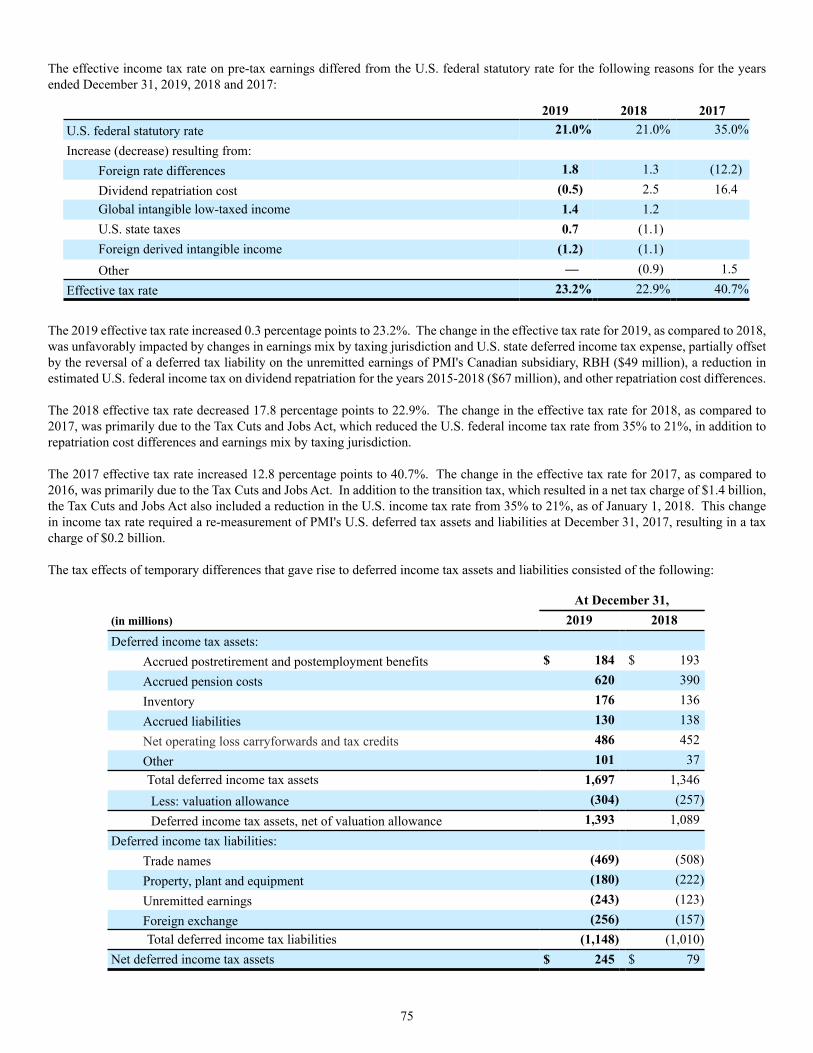
75
The effective income tax rate on pre-tax earnings differed from the U.S. federal statutory rate for the following reasons for the years ended December 31, 2019, 2018 and 2017:
2019 2018 2017U.S. federal statutory rate 21.0% 21.0% 35.0%Increase (decrease) resulting from:
Foreign rate differences 1.8 1.3 (12.2)Dividend repatriation cost (0.5) 2.5 16.4Global intangible low-taxed income 1.4 1.2U.S. state taxes 0.7 (1.1)Foreign derived intangible income (1.2) (1.1)Other — (0.9) 1.5
Effective tax rate 23.2% 22.9% 40.7%
The 2019 effective tax rate increased 0.3 percentage points to 23.2%. The change in the effective tax rate for 2019, as compared to 2018, was unfavorably impacted by changes in earnings mix by taxing jurisdiction and U.S. state deferred income tax expense, partially offset by the reversal of a deferred tax liability on the unremitted earnings of PMI's Canadian subsidiary, RBH ($49 million), a reduction in estimated U.S. federal income tax on dividend repatriation for the years 2015-2018 ($67 million), and other repatriation cost differences.
The 2018 effective tax rate decreased 17.8 percentage points to 22.9%. The change in the effective tax rate for 2018, as compared to 2017, was primarily due to the Tax Cuts and Jobs Act, which reduced the U.S. federal income tax rate from 35% to 21%, in addition to repatriation cost differences and earnings mix by taxing jurisdiction.
The 2017 effective tax rate increased 12.8 percentage points to 40.7%. The change in the effective tax rate for 2017, as compared to 2016, was primarily due to the Tax Cuts and Jobs Act. In addition to the transition tax, which resulted in a net tax charge of $1.4 billion, the Tax Cuts and Jobs Act also included a reduction in the U.S. income tax rate from 35% to 21%, as of January 1, 2018. This change in income tax rate required a re-measurement of PMI's U.S. deferred tax assets and liabilities at December 31, 2017, resulting in a tax charge of $0.2 billion.
The tax effects of temporary differences that gave rise to deferred income tax assets and liabilities consisted of the following:
At December 31,(in millions) 2019 2018Deferred income tax assets:
Accrued postretirement and postemployment benefits $ 184 $ 193Accrued pension costs 620 390Inventory 176 136Accrued liabilities 130 138Net operating loss carryforwards and tax credits 486 452Other 101 37Total deferred income tax assets 1,697 1,346Less: valuation allowance (304) (257)Deferred income tax assets, net of valuation allowance 1,393 1,089
Deferred income tax liabilities:Trade names (469) (508)Property, plant and equipment (180) (222)Unremitted earnings (243) (123)Foreign exchange (256) (157)Total deferred income tax liabilities (1,148) (1,010)
Net deferred income tax assets $ 245 $ 79

76
At December 31, 2019, PMI recorded deferred tax assets for net operating loss carryforwards and tax credits of $486 million, with varying dates of expiration, primarily after 2024, including $98 million with an unlimited carryforward period. At December 31, 2019, PMI has recorded a valuation allowance of $304 million against deferred tax assets that do not meet the more-likely-than not recognition threshold.
At December 31, 2018, PMI recorded deferred tax assets for net operating loss carryforwards of $452 million, with varying dates of expiration, primarily after 2023, including $87 million with an unlimited carryforward period. At December 31, 2018, PMI has recorded a valuation allowance of $257 million against deferred tax assets that do not meet the more-likely-than-not recognition threshold. The increases in deferred tax assets for net operating loss carryforwards and the valuation allowance during 2018 are primarily due to law changes associated with the Tax Cuts and Jobs Act, as discussed above.
Note 12.
Segment Reporting:
PMI’s subsidiaries and affiliates are engaged in the manufacture and sale of cigarettes and other nicotine-containing products, including RRPs, in markets outside of the United States of America. In addition, PMI ships a version of its Platform 1 device and its consumables authorized by the FDA to Altria Group, Inc. for sale in the United States under license. Operating segments for PMI are organized by geographic region and managed by segment managers who are responsible for the operating and financial results of the regions inclusive of all product categories sold in the region. PMI’s operating segments are the European Union; Eastern Europe; Middle East & Africa; South & Southeast Asia; East Asia & Australia; and Latin America & Canada. PMI records net revenues and operating income to its segments based upon the geographic area in which the customer resides. Revenues from shipments of Platform 1 devices, heated tobacco units and accessories to Altria Group, Inc. for sale under license in the United States are included in Net Revenues of the Latin America & Canada segment.
PMI’s chief operating decision maker evaluates segment performance and allocates resources based on regional operating income, which includes results from all product categories sold in each region. Interest expense, net, and provision for income taxes are centrally managed and, accordingly, such items are not presented by segment since they are excluded from the measure of segment profitability reviewed by management. Information about total assets by segment is not disclosed because such information is not reported to or used by PMI’s chief operating decision maker. Segment goodwill and other intangible assets, net, are disclosed in Note 3. Goodwill and Other Intangible Assets, net. The accounting policies of the segments are the same as those described in Note 2. Summary of Significant Accounting Policies. PMI disaggregates its net revenue from contracts with customers by both geographic location and product category for each of PMI's sixoperating segments, as PMI believes this best depicts how the nature, amount, timing and uncertainty of its revenue and cash flows are affected by economic factors.
Net revenues by segment were as follows:
For the Years Ended December 31,(in millions) 2019 2018 2017Net revenues:
European Union $ 9,817 $ 9,298 $ 8,318Eastern Europe 3,282 2,921 2,711Middle East & Africa 4,042 4,114 3,988South & Southeast Asia 5,094 4,656 4,417East Asia & Australia 5,364 5,580 6,373Latin America & Canada 2,206 3,056 2,941
Net revenues $ 29,805 $ 29,625 $ 28,748
Total net revenues attributable to customers located in Japan, PMI's largest market in terms of net revenues, were $3.9 billion, $3.8 billion and $4.7 billion in 2019, 2018 and 2017, respectively. Total net revenues attributable to customers located in Indonesia were $3.1 billion, $3.1 billion and $3.2 billion in 2019, 2018 and 2017, respectively. PMI had one customer in the East Asia & Australia segment that accounted for 13%, 13% and 16% of PMI’s consolidated net revenues, and one customer in the European Union segment that accounted for 10%, 10% and 10% of PMI’s consolidated net revenues in 2019, 2018 and 2017, respectively.

77
PMI's net revenues by product category were as follows:
For the Years Ended December 31,(in millions) 2019 2018 2017
Combustible products:European Union $ 8,093 $ 8,433 $ 8,048Eastern Europe 2,438 2,597 2,657Middle East & Africa 3,721 3,732 3,893South & Southeast Asia 5,094 4,656 4,417East Asia & Australia 2,693 3,074 3,156Latin America & Canada 2,179 3,037 2,937
Total combustible products $ 24,218 $ 25,529 $ 25,107
Reduced-risk products:European Union $ 1,724 $ 865 $ 269Eastern Europe 844 324 55Middle East & Africa 321 382 94South & Southeast Asia — — —East Asia & Australia 2,671 2,506 3,218Latin America & Canada 27 19 4
Total reduced-risk products $ 5,587 $ 4,096 $ 3,640
Total PMI net revenues $ 29,805 $ 29,625 $ 28,748
Note: Sum of product categories or Regions might not foot to total PMI due to roundings.
Net revenues related to combustible products refer to the operating revenues generated from the sale of these products, including shipping and handling charges billed to customers, net of sales and promotion incentives, and excise taxes. These net revenue amounts consist of the sale of PMI's cigarettes and other tobacco products combined. Other tobacco products primarily include roll-your-own and make-your-own cigarettes, pipe tobacco, cigars and cigarillos and do not include reduced-risk products.
Net revenues related to reduced-risk products refer to the operating revenues generated from the sale of these products, including shipping and handling charges billed to customers, net of sales and promotion incentives, and excise taxes. These net revenue amounts consist of the sale of PMI's heated tobacco units, IQOS devices and related accessories, and other nicotine-containing products, which primarily include PMI's e-vapor products.
PMI recognizes revenue, when control is transferred to the customer, typically either upon shipment or delivery of goods.
Operating income by segment were as follows:
For the Years Ended December 31,(in millions) 2019 2018 2017Operating income:
European Union $ 3,970 $ 4,105 $ 3,691Eastern Europe 547 902 887Middle East & Africa 1,684 1,627 1,884South & Southeast Asia 2,163 1,747 1,514East Asia & Australia 1,932 1,851 2,608Latin America & Canada 235 1,145 997
Operating income $ 10,531 $ 11,377 $ 11,581

78
Items affecting the comparability of results from operations were as follows:
• Russia excise and VAT audit charge - See Note 18. Contingencies for details of the $374 million pre-tax charge included in the Eastern Europe segment for the year ended December 31, 2019.
• Asset impairment and exit costs - See Note 21. Asset Impairment and Exit Costs for details of the $422 million pre-tax charge for the year ended December 31, 2019, as well as a breakdown of these costs by segment.
• Canadian tobacco litigation-related expense - See Note 18. Contingencies and Note 22. Deconsolidation of RBH for details of the $194 million pre-tax charge included in the Latin America & Canada segment for the year ended December 31, 2019.
• Loss on deconsolidation of RBH - See Note 22. Deconsolidation of RBH for details of the $239 million loss included in the Latin America & Canada segment for the year ended December 31, 2019.
Other segment data were as follows:
For the Years Ended December 31,
(in millions) 2019 2018 2017Depreciation expense:
European Union $ 254 $ 269 $ 213Eastern Europe 147 101 76Middle East & Africa 90 105 88South & Southeast Asia 142 154 153East Asia & Australia 185 173 160Latin America & Canada 69 94 85
887 896 775Other 11 11 12
Total depreciation expense $ 898 $ 907 $ 787
For the Years Ended December 31,(in millions) 2019 2018 2017Capital expenditures:
European Union $ 466 $ 813 $ 956Eastern Europe 132 136 97Middle East & Africa 35 65 85South & Southeast Asia 100 129 140East Asia & Australia 67 215 87Latin America & Canada 52 74 175
852 1,432 1,540Other — 4 8
Total capital expenditures $ 852 $ 1,436 $ 1,548
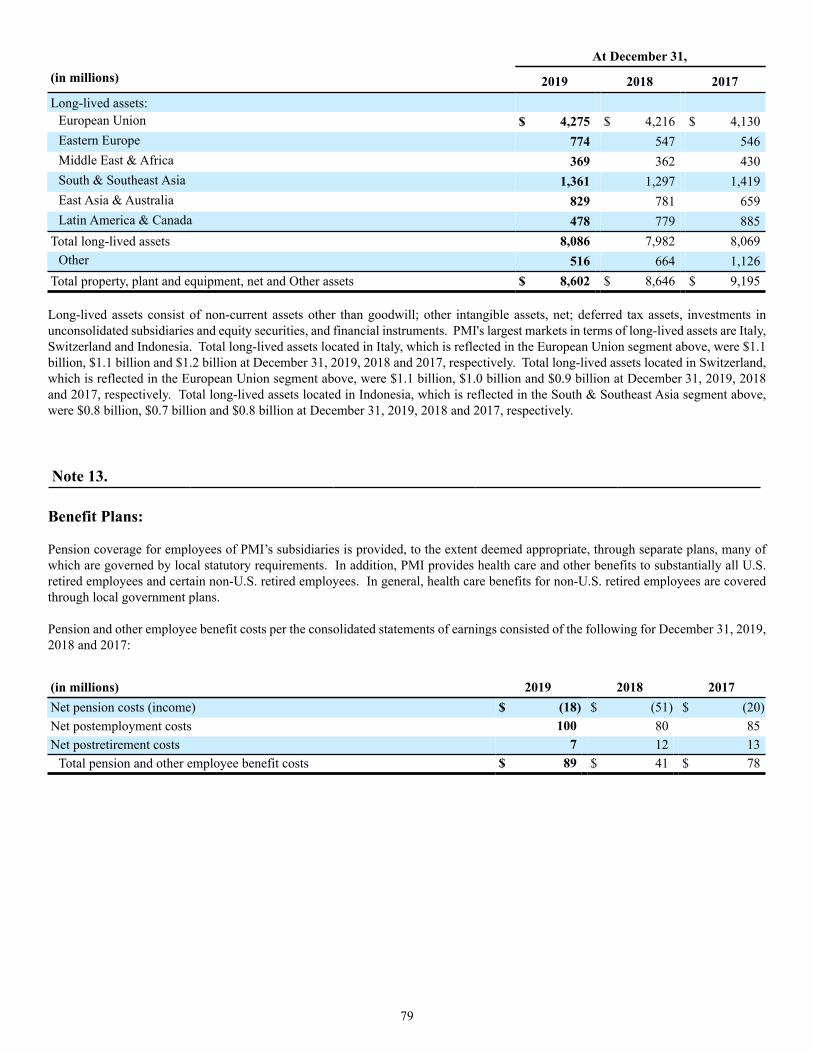
79
At December 31,(in millions) 2019 2018 2017Long-lived assets:
European Union $ 4,275 $ 4,216 $ 4,130Eastern Europe 774 547 546Middle East & Africa 369 362 430South & Southeast Asia 1,361 1,297 1,419East Asia & Australia 829 781 659Latin America & Canada 478 779 885
Total long-lived assets 8,086 7,982 8,069Other 516 664 1,126
Total property, plant and equipment, net and Other assets $ 8,602 $ 8,646 $ 9,195
Long-lived assets consist of non-current assets other than goodwill; other intangible assets, net; deferred tax assets, investments in unconsolidated subsidiaries and equity securities, and financial instruments. PMI's largest markets in terms of long-lived assets are Italy, Switzerland and Indonesia. Total long-lived assets located in Italy, which is reflected in the European Union segment above, were $1.1 billion, $1.1 billion and $1.2 billion at December 31, 2019, 2018 and 2017, respectively. Total long-lived assets located in Switzerland, which is reflected in the European Union segment above, were $1.1 billion, $1.0 billion and $0.9 billion at December 31, 2019, 2018and 2017, respectively. Total long-lived assets located in Indonesia, which is reflected in the South & Southeast Asia segment above, were $0.8 billion, $0.7 billion and $0.8 billion at December 31, 2019, 2018 and 2017, respectively.
Note 13.
Benefit Plans:
Pension coverage for employees of PMI’s subsidiaries is provided, to the extent deemed appropriate, through separate plans, many of which are governed by local statutory requirements. In addition, PMI provides health care and other benefits to substantially all U.S. retired employees and certain non-U.S. retired employees. In general, health care benefits for non-U.S. retired employees are covered through local government plans.
Pension and other employee benefit costs per the consolidated statements of earnings consisted of the following for December 31, 2019, 2018 and 2017:
(in millions) 2019 2018 2017Net pension costs (income) $ (18) $ (51) $ (20)Net postemployment costs 100 80 85Net postretirement costs 7 12 13
Total pension and other employee benefit costs $ 89 $ 41 $ 78
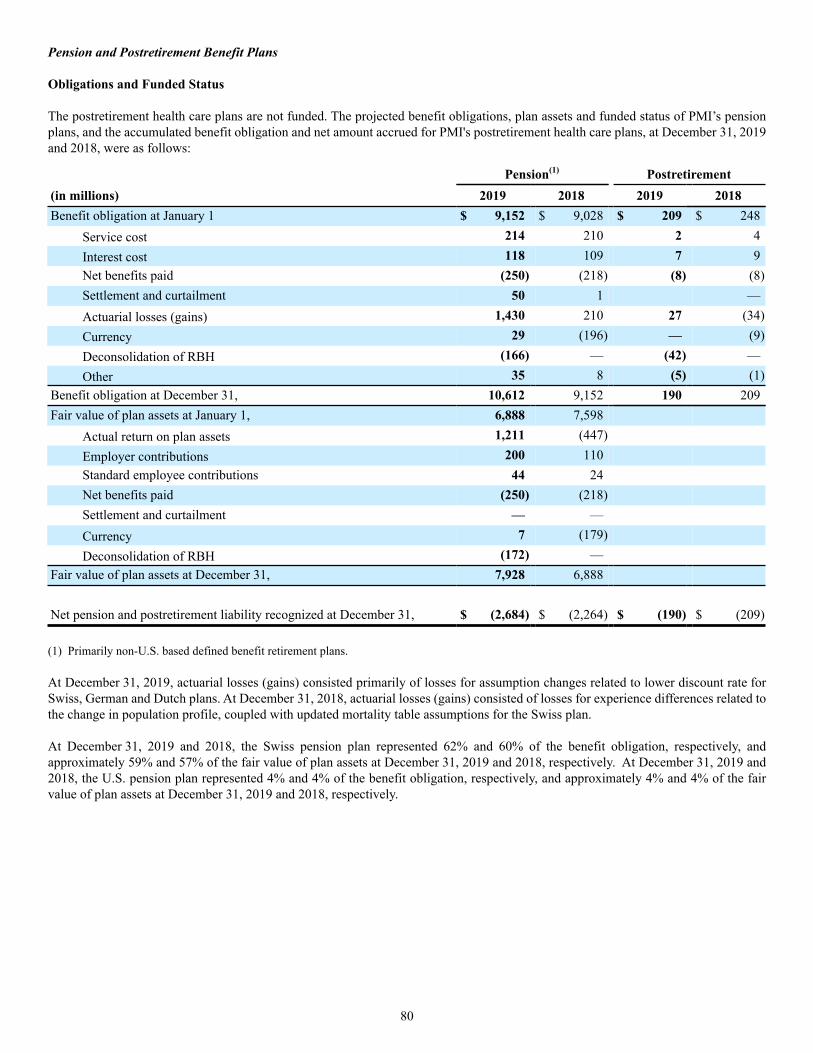
80
Pension and Postretirement Benefit Plans
Obligations and Funded Status
The postretirement health care plans are not funded. The projected benefit obligations, plan assets and funded status of PMI’s pension plans, and the accumulated benefit obligation and net amount accrued for PMI's postretirement health care plans, at December 31, 2019and 2018, were as follows:
Pension(1) Postretirement(in millions) 2019 2018 2019 2018Benefit obligation at January 1 $ 9,152 $ 9,028 $ 209 $ 248
Service cost 214 210 2 4Interest cost 118 109 7 9Net benefits paid (250) (218) (8) (8)Settlement and curtailment 50 1 —Actuarial losses (gains) 1,430 210 27 (34)Currency 29 (196) — (9)Deconsolidation of RBH (166) — (42) —Other 35 8 (5) (1)
Benefit obligation at December 31, 10,612 9,152 190 209Fair value of plan assets at January 1, 6,888 7,598
Actual return on plan assets 1,211 (447)Employer contributions 200 110Standard employee contributions 44 24Net benefits paid (250) (218)Settlement and curtailment — —Currency 7 (179)Deconsolidation of RBH (172) —
Fair value of plan assets at December 31, 7,928 6,888
Net pension and postretirement liability recognized at December 31, $ (2,684) $ (2,264) $ (190) $ (209)
(1) Primarily non-U.S. based defined benefit retirement plans.
At December 31, 2019, actuarial losses (gains) consisted primarily of losses for assumption changes related to lower discount rate for Swiss, German and Dutch plans. At December 31, 2018, actuarial losses (gains) consisted of losses for experience differences related to the change in population profile, coupled with updated mortality table assumptions for the Swiss plan.
At December 31, 2019 and 2018, the Swiss pension plan represented 62% and 60% of the benefit obligation, respectively, and approximately 59% and 57% of the fair value of plan assets at December 31, 2019 and 2018, respectively. At December 31, 2019 and 2018, the U.S. pension plan represented 4% and 4% of the benefit obligation, respectively, and approximately 4% and 4% of the fair value of plan assets at December 31, 2019 and 2018, respectively.
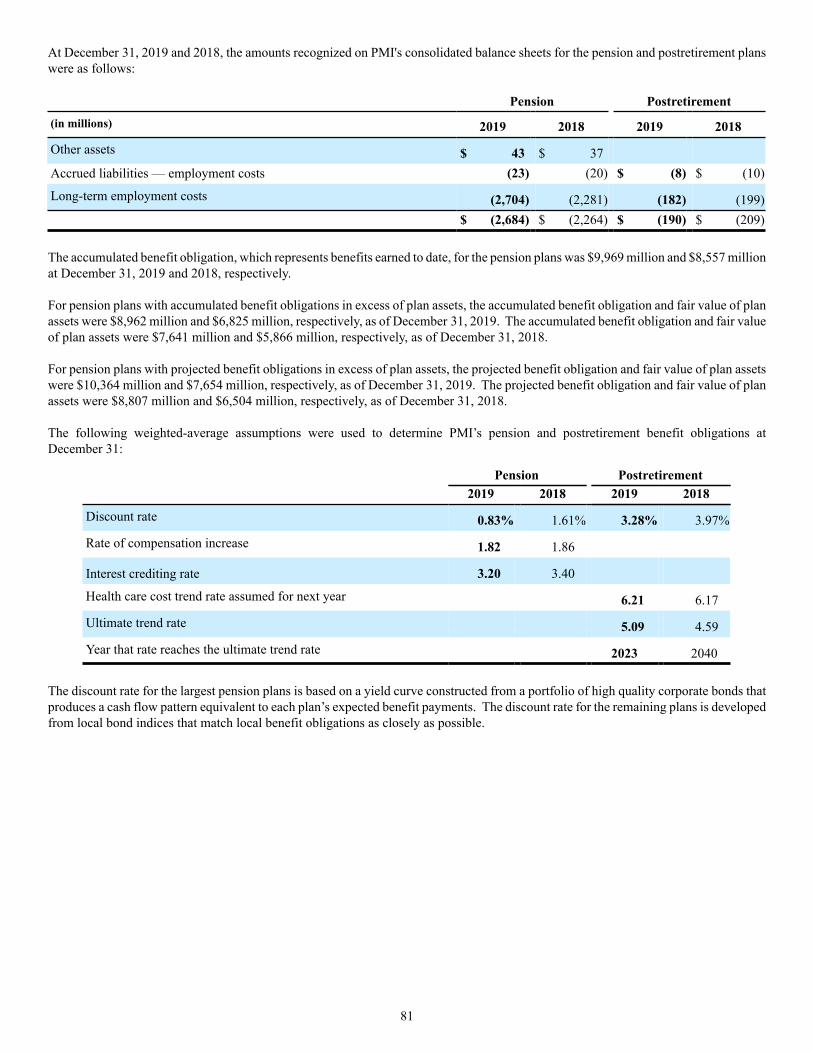
81
At December 31, 2019 and 2018, the amounts recognized on PMI's consolidated balance sheets for the pension and postretirement plans were as follows:
Pension Postretirement(in millions) 2019 2018 2019 2018
Other assets $ 43 $ 37Accrued liabilities — employment costs (23) (20) $ (8) $ (10)
Long-term employment costs (2,704) (2,281) (182) (199)$ (2,684) $ (2,264) $ (190) $ (209)
The accumulated benefit obligation, which represents benefits earned to date, for the pension plans was $9,969 million and $8,557 millionat December 31, 2019 and 2018, respectively.
For pension plans with accumulated benefit obligations in excess of plan assets, the accumulated benefit obligation and fair value of plan assets were $8,962 million and $6,825 million, respectively, as of December 31, 2019. The accumulated benefit obligation and fair value of plan assets were $7,641 million and $5,866 million, respectively, as of December 31, 2018.
For pension plans with projected benefit obligations in excess of plan assets, the projected benefit obligation and fair value of plan assets were $10,364 million and $7,654 million, respectively, as of December 31, 2019. The projected benefit obligation and fair value of plan assets were $8,807 million and $6,504 million, respectively, as of December 31, 2018.
The following weighted-average assumptions were used to determine PMI’s pension and postretirement benefit obligations at December 31:
Pension Postretirement2019 2018 2019 2018
Discount rate 0.83% 1.61% 3.28% 3.97%
Rate of compensation increase 1.82 1.86
Interest crediting rate 3.20 3.40
Health care cost trend rate assumed for next year 6.21 6.17
Ultimate trend rate 5.09 4.59
Year that rate reaches the ultimate trend rate 2023 2040
The discount rate for the largest pension plans is based on a yield curve constructed from a portfolio of high quality corporate bonds that produces a cash flow pattern equivalent to each plan’s expected benefit payments. The discount rate for the remaining plans is developed from local bond indices that match local benefit obligations as closely as possible.

82
Components of Net Periodic Benefit Cost
Net periodic pension and postretirement health care costs consisted of the following for the years ended December 31, 2019, 2018 and 2017:
Pension Postretirement(in millions) 2019 2018 2017 2019 2018 2017Service cost $ 214 $ 210 $ 208 $ 2 $ 4 $ 4Interest cost 118 109 108 7 9 8
Expected return on plan assets (328) (349) (326) — — —Amortization:
Net losses 189 172 186 — 4 5
Prior service cost (1) 2 6 — (1) —
Settlement and curtailment 4 15 6 — — —
Net periodic pension and postretirement costs $ 196 $ 159 $ 188 $ 9 $ 16 $ 17
Settlement and curtailment charges were due primarily to employee severance and early retirement programs.
The following weighted-average assumptions were used to determine PMI’s net pension and postretirement health care costs:
Pension Postretirement2019 2018 2017 2019 2018 2017
Discount rate - service cost 2.14% 1.92% 1.68% 3.97% 3.79% 3.68%
Discount rate - interest cost 1.35 1.25 1.27 3.97 3.79 3.68
Expected rate of return on plan assets 4.70 4.76 4.80
Rate of compensation increase 1.86 1.65 1.68
Interest crediting rate 3.40 3.40 3.40
Health care cost trend rate 6.17 6.17 7.15
PMI’s expected rate of return on pension plan assets is determined by the plan assets’ historical long-term investment performance, current asset allocation and estimates of future long-term returns by asset class.
PMI and certain of its subsidiaries sponsor defined contribution plans. Amounts charged to expense for defined contribution plans totaled $63 million, $66 million and $58 million for the years ended December 31, 2019, 2018 and 2017, respectively.
Plan Assets
PMI’s investment strategy for pension plans is based on an expectation that equity securities will outperform debt securities over the long term. Accordingly, the target allocation of PMI’s plan assets is broadly characterized as approximately 60% in equity securities and approximately 40% in debt securities and other assets. The strategy primarily utilizes indexed U.S. equity securities, international equity securities and investment-grade debt securities. PMI’s plans have no investments in hedge funds, private equity or derivatives. PMI attempts to mitigate investment risk by rebalancing between equity and debt asset classes once a year or as PMI’s contributions and benefit payments are made.
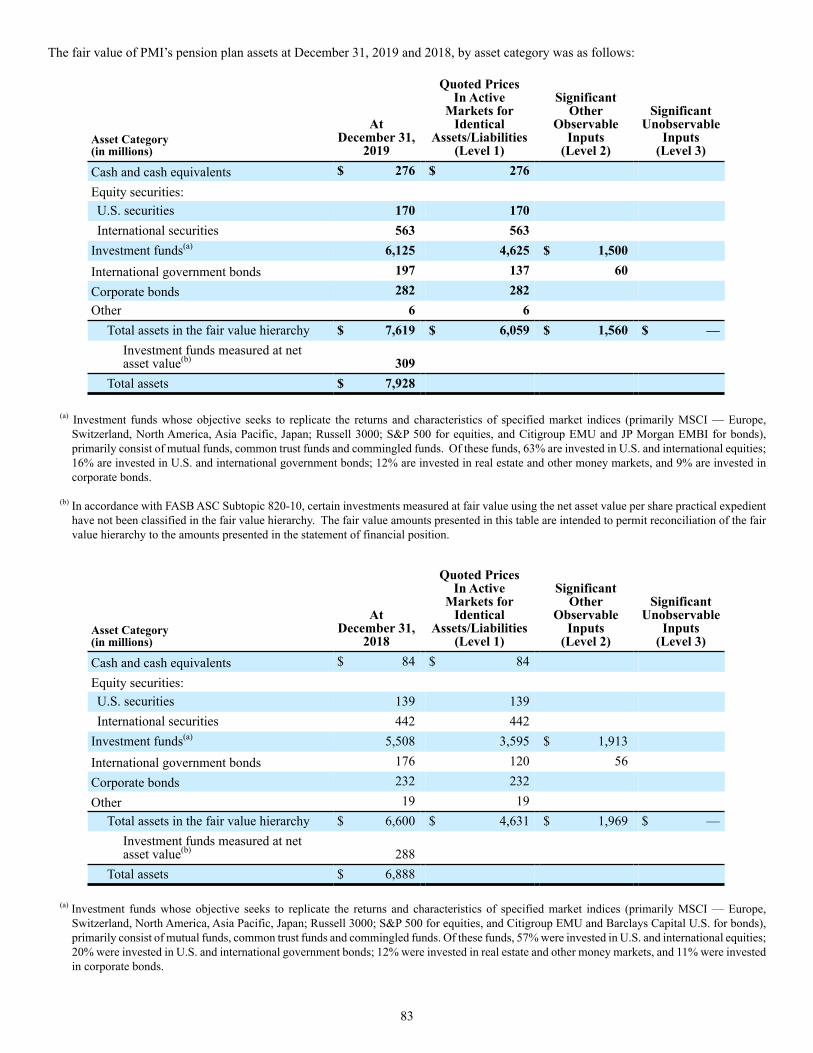
83
The fair value of PMI’s pension plan assets at December 31, 2019 and 2018, by asset category was as follows:
Asset Category(in millions)
AtDecember 31,
2019
Quoted Prices In Active
Markets for Identical
Assets/Liabilities (Level 1)
SignificantOther
ObservableInputs
(Level 2)
Significant Unobservable
Inputs (Level 3)
Cash and cash equivalents $ 276 $ 276Equity securities:U.S. securities 170 170International securities 563 563
Investment funds(a) 6,125 4,625 $ 1,500International government bonds 197 137 60Corporate bonds 282 282Other 6 6
Total assets in the fair value hierarchy $ 7,619 $ 6,059 $ 1,560 $ —Investment funds measured at net asset value(b) 309
Total assets $ 7,928
(a) Investment funds whose objective seeks to replicate the returns and characteristics of specified market indices (primarily MSCI — Europe, Switzerland, North America, Asia Pacific, Japan; Russell 3000; S&P 500 for equities, and Citigroup EMU and JP Morgan EMBI for bonds), primarily consist of mutual funds, common trust funds and commingled funds. Of these funds, 63% are invested in U.S. and international equities; 16% are invested in U.S. and international government bonds; 12% are invested in real estate and other money markets, and 9% are invested in corporate bonds.
(b) In accordance with FASB ASC Subtopic 820-10, certain investments measured at fair value using the net asset value per share practical expedient have not been classified in the fair value hierarchy. The fair value amounts presented in this table are intended to permit reconciliation of the fair value hierarchy to the amounts presented in the statement of financial position.
Asset Category(in millions)
AtDecember 31,
2018
Quoted Prices In Active
Markets for Identical
Assets/Liabilities (Level 1)
SignificantOther
ObservableInputs
(Level 2)
SignificantUnobservable
Inputs(Level 3)
Cash and cash equivalents $ 84 $ 84Equity securities:U.S. securities 139 139International securities 442 442
Investment funds(a) 5,508 3,595 $ 1,913International government bonds 176 120 56Corporate bonds 232 232Other 19 19
Total assets in the fair value hierarchy $ 6,600 $ 4,631 $ 1,969 $ —Investment funds measured at net asset value(b) 288
Total assets $ 6,888
(a) Investment funds whose objective seeks to replicate the returns and characteristics of specified market indices (primarily MSCI — Europe, Switzerland, North America, Asia Pacific, Japan; Russell 3000; S&P 500 for equities, and Citigroup EMU and Barclays Capital U.S. for bonds), primarily consist of mutual funds, common trust funds and commingled funds. Of these funds, 57% were invested in U.S. and international equities; 20% were invested in U.S. and international government bonds; 12% were invested in real estate and other money markets, and 11% were invested in corporate bonds.

84
(b) In accordance with FASB ASC Subtopic 820-10, certain investments measured at fair value using the net asset value per share practical expedient have not been classified in the fair value hierarchy. The fair value amounts presented in this table are intended to permit reconciliation of the fair value hierarchy to the amounts presented in the statement of financial position.
See Note 16. Fair Value Measurements for a discussion of the fair value of pension plan assets.
PMI makes, and plans to make, contributions to the extent that they are tax deductible and to meet specific funding requirements of its funded pension plans. Currently, PMI anticipates making contributions of approximately $77 million in 2020 to its pension plans, based on current tax and benefit laws. However, this estimate is subject to change as a result of changes in tax and other benefit laws, as well as asset performance significantly above or below the assumed long-term rate of return on pension assets, or changes in interest and currency rates.
The estimated future benefit payments from PMI pension plans at December 31, 2019, are as follows:
(in millions)
2020 $ 3172021 3402022 3412023 3512024 3612025 - 2029 2,008
PMI's expected future annual benefit payments for its postretirement health care plans are estimated to be not material through 2029.
Postemployment Benefit Plans
PMI and certain of its subsidiaries sponsor postemployment benefit plans covering substantially all salaried and certain hourly employees. The cost of these plans is charged to expense over the working life of the covered employees. Net postemployment costs were $171 million, $158 million and $144 million for the years ended December 31, 2019, 2018 and 2017, respectively.
The amounts recognized in accrued postemployment costs on PMI's consolidated balance sheets at December 31, 2019 and 2018, were $751 million and $708 million, respectively. The change in the liability is primarily due to actuarial losses of $152 million in 2019 resulting from increased employee severance rate primarily in countries in the European Union segment, coupled with the periodic expense, partially offset by cash payments.
The accrued postemployment costs were determined using a weighted-average discount rate of 3.0% and 3.1% in 2019 and 2018, respectively; an assumed ultimate annual weighted-average turnover rate of 3.0% and 3.2% in 2019 and 2018, respectively; assumed compensation cost increases of 2.6% in 2019 and 2.6% in 2018, and assumed benefits as defined in the respective plans. In accordance with local regulations, certain postemployment plans are funded. As a result, the accrued postemployment costs disclosed above are presented net of the related assets of $40 million and $38 million at December 31, 2019 and 2018, respectively. Postemployment costs arising from actions that offer employees benefits in excess of those specified in the respective plans are charged to expense when incurred.
Comprehensive Earnings (Losses)
The amounts recorded in accumulated other comprehensive losses at December 31, 2019, consisted of the following:
(in millions) PensionPost-
retirementPost-
employment TotalNet losses $ (3,718) $ (63) $ (775) $ (4,556)Prior service cost 3 2 — 5Net transition obligation (4) — — (4)Deferred income taxes 520 24 182 726Losses to be amortized $ (3,199) $ (37) $ (593) $ (3,829)

85
The amounts recorded in accumulated other comprehensive losses at December 31, 2018, consisted of the following:
(in millions) PensionPost-
retirementPost-
employment TotalNet losses $ (3,438) $ (41) $ (702) $ (4,181)Prior service cost (27) 3 — (24)Net transition obligation (4) — — (4)Deferred income taxes 379 20 164 563Losses to be amortized $ (3,090) $ (18) $ (538) $ (3,646)
The amounts recorded in accumulated other comprehensive losses at December 31, 2017, consisted of the following:
(in millions) PensionPost-
retirementPost-
employment TotalNet losses $ (2,624) $ (80) $ (617) $ (3,321)Prior service cost (35) 4 — (31)Net transition obligation (5) — — (5)Deferred income taxes 327 28 186 541Losses to be amortized $ (2,337) $ (48) $ (431) $ (2,816)
The movements in other comprehensive earnings (losses) during the year ended December 31, 2019, were as follows:
(in millions) PensionPost-
retirementPost-
employment Total
Amounts transferred to earnings as components of net periodicbenefit cost:
Amortization:Net losses $ 198 $ 3 $ 77 $ 278Prior service cost 32 (1) — 31
Other income/expense:Net losses 3 — — 3
Deferred income taxes (51) (1) (17) (69)182 1 60 243
Other movements during the year:
Net losses (521) (27) (150) (698)Prior service cost (2) — — (2)Deconsolidation of RBH (net of deferred income taxes) 26 1 27Deferred income taxes 206 6 35 247
(291) (20) (115) (426)
Total movements in other comprehensive earnings (losses) $ (109) $ (19) $ (55) $ (183)

86
The movements in other comprehensive earnings (losses) during the year ended December 31, 2018, were as follows:
(in millions) PensionPost-
retirementPost-
employment Total
Amounts transferred to earnings as components of net periodicbenefit cost:
Amortization:Net losses $ 180 $ 5 $ 62 $ 247Prior service cost — (1) — (1)Net transition obligation 1 — — 1
Other income/expense:Net losses 14 — — 14
Deferred income taxes (28) (1) (14) (43)167 3 48 218
Other movements during the year:Net losses (1,008) 34 (147) (1,121)Prior service cost 8 — — 8Deferred income taxes 80 (7) (8) 65
(920) 27 (155) (1,048)
Total movements in other comprehensive earnings (losses) $ (753) $ 30 $ (107) $ (830)
The movements in other comprehensive earnings (losses) during the year ended December 31, 2017, were as follows:
(in millions) PensionPost-
retirementPost-
employment Total
Amounts transferred to earnings as components of net periodicbenefit cost:
Amortization:Net losses $ 175 $ 5 $ 68 $ 248Prior service cost 5 — — 5
Other income/expense:Net losses 6 — — 6
Deferred income taxes (10) (1) (20) (31)176 4 48 228
Other movements during the year:Net losses 509 (12) 28 525Prior service cost 13 — — 13Deferred income taxes (13) 5 (9) (17)
509 (7) 19 521
Total movements in other comprehensive earnings (losses) $ 685 $ (3) $ 67 $ 749

87
Note 14.
Additional Information:
For the Years Ended December 31,(in millions) 2019 2018 2017
Research and development expense $ 465 $ 383 $ 453
Advertising expense $ 730 $ 896 $ 830
Foreign currency net transaction (gains)/losses $ (95) $ 21 $ 49
Interest expense $ 796 $ 855 $ 1,096
Interest income (226) (190) (182)
Interest expense, net $ 570 $ 665 $ 914
Total lease cost $ 332 (1) $ 312 $ 313
(1) For additional information on total lease costs, see Note 23. Leases.
Note 15.
Financial Instruments:
Overview
PMI operates in markets outside of the United States of America, with manufacturing and sales facilities in various locations around the world. PMI utilizes certain financial instruments to manage foreign currency and interest rate exposure. Derivative financial instruments are used by PMI principally to reduce exposures to market risks resulting from fluctuations in foreign currency exchange and interest rates by creating offsetting exposures. PMI is not a party to leveraged derivatives and, by policy, does not use derivative financial instruments for speculative purposes. Financial instruments qualifying for hedge accounting must maintain a specified level of effectiveness between the hedging instrument and the item being hedged, both at inception and throughout the hedged period. PMI formally documents the nature and relationships between the hedging instruments and hedged items, as well as its risk-management objectives, strategies for undertaking the various hedge transactions and method of assessing hedge effectiveness. Additionally, for hedges of forecasted transactions, the significant characteristics and expected terms of the forecasted transaction must be specifically identified, and it must be probable that each forecasted transaction will occur. If it were deemed probable that the forecasted transaction would not occur, the gain or loss would be recognized in earnings.
PMI uses deliverable and non-deliverable forward foreign exchange contracts, foreign currency swaps and foreign currency options, collectively referred to as foreign exchange contracts ("foreign exchange contracts"), and interest rate contracts to mitigate its exposure to changes in exchange and interest rates from third-party and intercompany actual and forecasted transactions. Both foreign exchange contracts and interest rate contracts are collectively referred to as derivative contracts ("derivative contracts"). The primary currencies to which PMI is exposed include the Euro, Indonesian rupiah, Japanese yen, Mexican peso, Philippine peso, Russian ruble and Swiss franc. At December 31, 2019 and 2018, PMI had contracts with aggregate notional amounts of $24.1 billion and $27.4 billion, respectively. Of the $24.1 billion aggregate notional amount at December 31, 2019, $2.8 billion related to cash flow hedges, $9.9 billion related to hedges of net investments in foreign operations and $11.4 billion related to other derivatives that primarily offset currency exposures on intercompany financing. Of the $27.4 billion aggregate notional amount at December 31, 2018, $3.2 billion related to cash flow hedges, $10.1 billion related to hedges of net investments in foreign operations and $14.1 billion related to other derivatives that primarily offset currency exposures on intercompany financing.

88
The fair value of PMI’s derivative exchange contracts included in the consolidated balance sheet as of December 31, 2019 and 2018, were as follows:
Derivative Assets Derivative LiabilitiesFair Value Fair Value
(in millions)Balance Sheet Classification 2019 2018
Balance Sheet Classification 2019 2018
Derivative contracts designated ashedging instruments
Other currentassets $ 319 $ 54
Other accruedliabilities $ 23 $ 47
Other assets 21 99Income taxes and
other liabilities 301 525Derivative contracts not designated as
hedging instrumentsOther current
assets 50 67Other accrued
liabilities 70 46
Other assets — —Income taxes and
other liabilities 25 13
Total derivatives $ 390 $ 220 $ 419 $ 631
For the years ended December 31, 2019, 2018 and 2017, PMI's cash flow and net investment hedging instruments impacted the consolidated statements of earnings and comprehensive earnings as follows:
(pre-tax, in millions) For the Year Ended December 31,
Amount of Gain/(Loss)Recognized in Other
Comprehensive Earnings/(Losses) on Derivatives
Statement of EarningsClassification of Gain/(Loss)
Reclassified from OtherComprehensive
Earnings/(Losses) intoEarnings
Amount of Gain/(Loss)Reclassified from Other
Comprehensive Earnings/(Losses) into Earnings
2019 2018 2017 2019 2018 2017Derivatives in Cash FlowHedging RelationshipDerivative contracts $ (20) $ 28 $ (52)
Net revenues $ 22 $ 18 $ 60Cost of sales 1 — 1Marketing, administration andresearch costs 2 6 (7)Interest expense, net (8) (1) (41)
Derivatives in NetInvestment HedgingRelationshipDerivative contracts 369 324 (1,644)Total $ 349 $ 352 $ (1,696) $ 17 $ 23 $ 13
Cash Flow Hedges
PMI has entered into derivative contracts to hedge the foreign currency exchange and interest rate risks related to certain forecasted transactions. Gains and losses associated with qualifying cash flow hedge contracts are deferred as components of accumulated other comprehensive losses until the underlying hedged transactions are reported in PMI’s consolidated statements of earnings. As of December 31, 2019, PMI has hedged forecasted transactions for periods not exceeding the next twelve months, with the exception of one derivative contract that expires in May 2024. The impact of these hedges is primarily included in operating cash flows on PMI’s consolidated statements of cash flows.
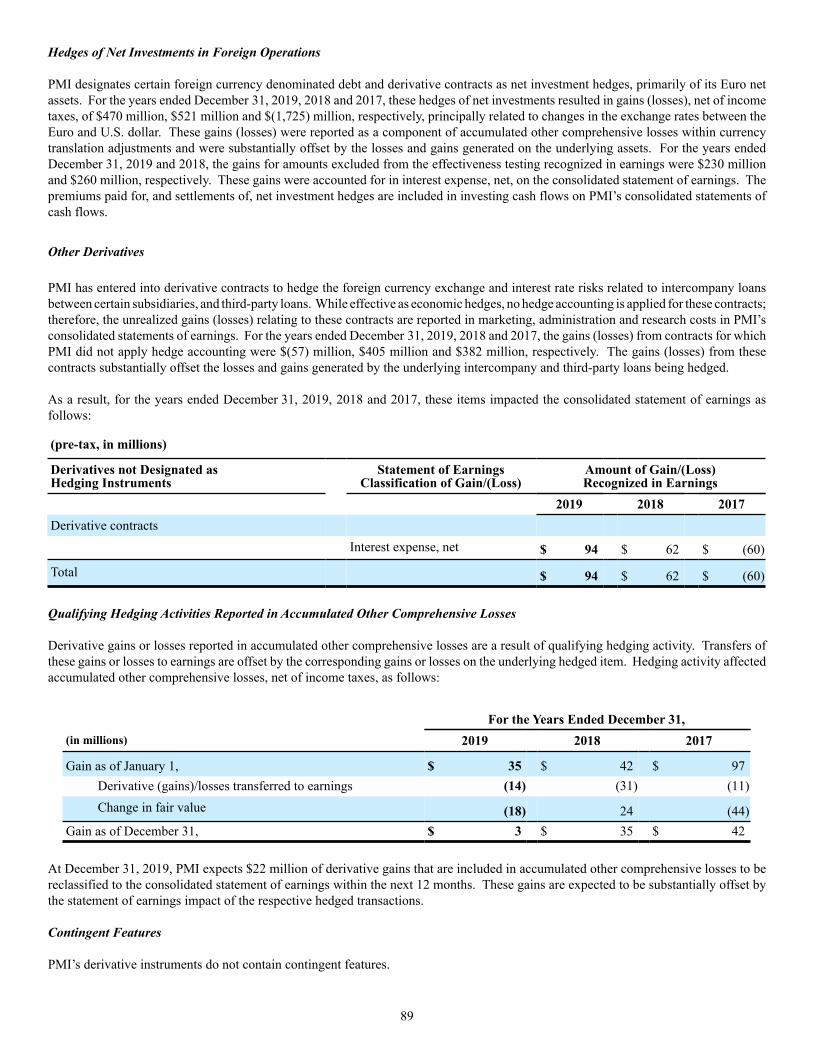
89
Hedges of Net Investments in Foreign Operations
PMI designates certain foreign currency denominated debt and derivative contracts as net investment hedges, primarily of its Euro net assets. For the years ended December 31, 2019, 2018 and 2017, these hedges of net investments resulted in gains (losses), net of income taxes, of $470 million, $521 million and $(1,725) million, respectively, principally related to changes in the exchange rates between the Euro and U.S. dollar. These gains (losses) were reported as a component of accumulated other comprehensive losses within currency translation adjustments and were substantially offset by the losses and gains generated on the underlying assets. For the years ended December 31, 2019 and 2018, the gains for amounts excluded from the effectiveness testing recognized in earnings were $230 millionand $260 million, respectively. These gains were accounted for in interest expense, net, on the consolidated statement of earnings. The premiums paid for, and settlements of, net investment hedges are included in investing cash flows on PMI’s consolidated statements of cash flows.
Other Derivatives
PMI has entered into derivative contracts to hedge the foreign currency exchange and interest rate risks related to intercompany loans between certain subsidiaries, and third-party loans. While effective as economic hedges, no hedge accounting is applied for these contracts; therefore, the unrealized gains (losses) relating to these contracts are reported in marketing, administration and research costs in PMI’s consolidated statements of earnings. For the years ended December 31, 2019, 2018 and 2017, the gains (losses) from contracts for which PMI did not apply hedge accounting were $(57) million, $405 million and $382 million, respectively. The gains (losses) from these contracts substantially offset the losses and gains generated by the underlying intercompany and third-party loans being hedged.
As a result, for the years ended December 31, 2019, 2018 and 2017, these items impacted the consolidated statement of earnings as follows:
(pre-tax, in millions)
Derivatives not Designated as Hedging Instruments
Statement of EarningsClassification of Gain/(Loss)
Amount of Gain/(Loss)Recognized in Earnings
2019 2018 2017Derivative contracts
Interest expense, net $ 94 $ 62 $ (60)
Total $ 94 $ 62 $ (60)
Qualifying Hedging Activities Reported in Accumulated Other Comprehensive Losses
Derivative gains or losses reported in accumulated other comprehensive losses are a result of qualifying hedging activity. Transfers of these gains or losses to earnings are offset by the corresponding gains or losses on the underlying hedged item. Hedging activity affected accumulated other comprehensive losses, net of income taxes, as follows:
For the Years Ended December 31,(in millions) 2019 2018 2017
Gain as of January 1, $ 35 $ 42 $ 97Derivative (gains)/losses transferred to earnings (14) (31) (11)Change in fair value (18) 24 (44)
Gain as of December 31, $ 3 $ 35 $ 42
At December 31, 2019, PMI expects $22 million of derivative gains that are included in accumulated other comprehensive losses to be reclassified to the consolidated statement of earnings within the next 12 months. These gains are expected to be substantially offset by the statement of earnings impact of the respective hedged transactions.
Contingent Features
PMI’s derivative instruments do not contain contingent features.

90
Credit Exposure and Credit Risk
PMI is exposed to credit loss in the event of non-performance by counterparties. While PMI does not anticipate non-performance, its risk is limited to the fair value of the financial instruments less any cash collateral received or pledged. PMI actively monitors its exposure to credit risk through the use of credit approvals and credit limits and by selecting and continuously monitoring a diverse group of major international banks and financial institutions as counterparties.
Fair Value
See Note 16. Fair Value Measurements and Note 19. Balance Sheet Offsetting for additional discussion of derivative financial instruments.
Note 16.
Fair Value Measurements:
The authoritative guidance defines fair value as the exchange price that would be received for an asset or paid to transfer a liability (an exit price) in the principal or most advantageous market for the asset or liability in an orderly transaction between market participants on the measurement date. The guidance also establishes a fair value hierarchy, which requires an entity to maximize the use of observable inputs and minimize the use of unobservable inputs when measuring fair value. The guidance describes three levels of input that may be used to measure fair value, which are as follows:
Level 1 — Quoted prices in active markets for identical assets or liabilities;
Level 2 — Observable inputs other than Level 1 prices, such as quoted prices for similar assets or liabilities; quoted prices in markets that are not active; or other inputs that are observable or can be corroborated by observable market data for substantially the full term of the assets or liabilities; and
Level 3 — Unobservable inputs that are supported by little or no market activity and that are significant to the fair value of the assets or liabilities.
Equity Securities
The fair value of PMI’s equity securities, which are determined by using quoted prices in active markets, have been classified within Level 1.
Derivative Financial Instruments
PMI assesses the fair value of its foreign exchange contracts and interest rate contracts using standard valuation models that use, as their basis, readily observable market inputs. The fair value of PMI’s foreign exchange forward contracts is determined by using the prevailing foreign exchange spot rates and interest rate differentials, and the respective maturity dates of the instruments. The fair value of PMI’s currency options is determined by using a Black-Scholes methodology based on foreign exchange spot rates and interest rate differentials, currency volatilities and maturity dates. PMI’s derivative financial instruments have been classified within Level 2 at December 31, 2019 and 2018. See Note 15. Financial Instruments for additional discussion of derivative financial instruments.
Pension Plan Assets
The fair value of pension plan assets, determined by using readily available quoted market prices in active markets, has been classified within Level 1 of the fair value hierarchy at December 31, 2019 and 2018. The fair value of pension plan assets, determined by using quoted prices in markets that are not active, has been classified within Level 2 at December 31, 2019 and 2018. See Note 13. Benefit Plans for additional discussion of pension plan assets.
Debt
The fair value of PMI’s outstanding debt, which is utilized solely for disclosure purposes, is determined using quotes and market interest rates currently available to PMI for issuances of debt with similar terms and remaining maturities. The aggregate carrying value of PMI’s debt, excluding short-term borrowings and $56 million of finance leases, was $30,651 million at December 31, 2019. The aggregate carrying value of PMI’s debt, excluding short-term borrowings and $33 million of finance leases, was $30,996 million at December 31,

91
2018. The fair value of PMI's outstanding debt, excluding the aforementioned short-term borrowings and finance leases, was classified within Level 1 and Level 2 at December 31, 2019 and 2018.
The aggregate fair values of PMI’s investments in equity securities, derivative financial instruments, pension plan assets and PMI's debt as of December 31, 2019, were as follows:
(in millions)Fair Value at
December 31, 2019
Quoted Prices in Active Markets for
Identical Assets/Liabilities (Level 1)
Significant OtherObservable Inputs
(Level 2)
Significant Unobservable
Inputs (Level 3)
Assets:
Equity securities (1) $ 332 $ 332 $ — $ —Derivative contracts 390 $ — 390 —Pension plan assets 7,619 6,059 1,560 —
Total assets in fair value hierarchy $ 8,341 $ 6,391 $ 1,950 $ —Pension plan assets measured at net
asset value (2) 309
Total assets $ 8,650Liabilities:
Debt $ 32,988 $ 32,821 $ 167 $ —Derivative contracts 419 — 419 —Total liabilities $ 33,407 $ 32,821 $ 586 $ —
(1) Unrealized pre-tax gain of $44 million ($35 million net of tax) on equity securities was recorded in the consolidated statement of earnings for the year ended December 31, 2019.
(2) In accordance with FASB ASC Subtopic 820-10, certain investments measured at fair value using the net asset value per share practical expedient have not been classified in the fair value hierarchy. The fair value amounts presented in these tables are intended to permit reconciliation of the fair value hierarchy to the amounts presented in the statement of financial position.

92
The aggregate fair values of PMI’s investments in equity securities, derivative financial instruments, pension plan assets and PMI's debt as of December 31, 2018 , were as follows:
(in millions)Fair Value at
December 31, 2018
Quoted Prices inActive Markets for
Identical Assets/Liabilities(Level 1)
Significant OtherObservable Inputs
(Level 2)
Significant Unobservable
Inputs (Level 3)
Assets:
Equity securities $ 288 $ 288 $ — $ —Derivative contracts 220 — 220 —Pension plan assets 6,600 4,631 1,969 —
Total assets in fair value hierarchy $ 7,108 $ 4,919 $ 2,189 $ —Pension plan assets measured at net
asset value (1) 288
Total assets $ 7,396
Liabilities:
Debt $ 31,162 $ 30,997 $ 165 $ —Derivative contracts 631 — 631 —Total liabilities $ 31,793 $ 30,997 $ 796 $ —
(1) In accordance with FASB ASC Subtopic 820-10, certain investments measured at fair value using the net asset value per share practical expedient have not been classified in the fair value hierarchy. The fair value amounts presented in these tables are intended to permit reconciliation of the fair value hierarchy to the amounts presented in the statement of financial position.
Note 17.
Accumulated Other Comprehensive Losses:
PMI's accumulated other comprehensive losses, net of taxes, consisted of the following:
(Losses) Earnings At December 31,(in millions) 2019 2018 2017
Currency translation adjustments $ (5,537) $ (6,500) $ (5,761)
Pension and other benefits (3,829) (3,646) (2,816)
Derivatives accounted for as hedges 3 35 42
Total accumulated other comprehensive losses $ (9,363) $ (10,111) $ (8,535)
Reclassifications from Other Comprehensive Earnings
The movements in accumulated other comprehensive losses and the related tax impact, for each of the components above, that are due to current period activity and reclassifications to the income statement, including those related to the deconsolidation of RBH, are shown on the consolidated statements of comprehensive earnings for the years ended December 31, 2019, 2018, and 2017. For the year ended 2017, $2 million of net currency translation adjustment gains/(losses) were transferred from other comprehensive earnings to marketing, administration and research costs in the consolidated statements of earnings, respectively, upon liquidation of subsidiaries. For additional information, see Note 13. Benefit Plans for disclosures related to PMI's pension and other benefits, Note 15. Financial Instruments for disclosures related to derivative financial instruments and Note 22. Deconsolidation of RBH for disclosures related to the deconsolidation of RBH.

93
Note 18.
Contingencies:
Tobacco-Related Litigation
Legal proceedings covering a wide range of matters are pending or threatened against us, and/or our subsidiaries, and/or our indemnitees in various jurisdictions. Our indemnitees include distributors, licensees, and others that have been named as parties in certain cases and that we have agreed to defend, as well as to pay costs and some or all of judgments, if any, that may be entered against them. Pursuant to the terms of the Distribution Agreement between Altria Group, Inc. ("Altria") and PMI, PMI will indemnify Altria and Philip Morris USA Inc. ("PM USA"), a U.S. tobacco subsidiary of Altria, for tobacco product claims based in substantial part on products manufactured by PMI or contract manufactured for PMI by PM USA, and PM USA will indemnify PMI for tobacco product claims based in substantial part on products manufactured by PM USA, excluding tobacco products contract manufactured for PMI.
It is possible that there could be adverse developments in pending cases against us and our subsidiaries. An unfavorable outcome or settlement of pending tobacco-related litigation could encourage the commencement of additional litigation.
Damages claimed in some of the tobacco-related litigation are significant and, in certain cases in Brazil, Canada and Nigeria, range into the billions of U.S. dollars. The variability in pleadings in multiple jurisdictions, together with the actual experience of management in litigating claims, demonstrate that the monetary relief that may be specified in a lawsuit bears little relevance to the ultimate outcome. Much of the tobacco-related litigation is in its early stages, and litigation is subject to uncertainty. However, as discussed below, we have to date been largely successful in defending tobacco-related litigation.
We and our subsidiaries record provisions in the consolidated financial statements for pending litigation when we determine that an unfavorable outcome is probable and the amount of the loss can be reasonably estimated. At the present time, except as stated otherwise in this Note 18. Contingencies, while it is reasonably possible that an unfavorable outcome in a case may occur, after assessing the information available to it (i) management has not concluded that it is probable that a loss has been incurred in any of the pending tobacco-related cases; (ii) management is unable to estimate the possible loss or range of loss for any of the pending tobacco-related cases; and (iii) accordingly, no estimated loss has been accrued in the consolidated financial statements for unfavorable outcomes in these cases, if any. Legal defense costs are expensed as incurred.
It is possible that our consolidated results of operations, cash flows or financial position could be materially affected in a particular fiscal quarter or fiscal year by an unfavorable outcome or settlement of certain pending litigation. Nevertheless, although litigation is subject to uncertainty, we and each of our subsidiaries named as a defendant believe, and each has been so advised by counsel handling the respective cases, that we have valid defenses to the litigation pending against us, as well as valid bases for appeal of adverse verdicts. All such cases are, and will continue to be, vigorously defended. However, we and our subsidiaries may enter into settlement discussions in particular cases if we believe it is in our best interests to do so.
CCAA Proceedings and Stay of Tobacco-Related Cases Pending in Canada
As a result of the Court of Appeal of Quebec’s decision in both the Létourneau and Blais cases described below, our subsidiary, Rothmans, Benson & Hedges Inc. (“RBH”), and the other defendants, JTI Macdonald Corp., and Imperial Tobacco Canada Limited, sought protection in the Ontario Superior Court of Justice under the Companies’ Creditors Arrangement Act (“CCAA”) on March 22, March 8, and March 12, respectively. CCAA is a Canadian federal law that permits a Canadian business to restructure its affairs while carrying on its business in the ordinary course. The initial CCAA order made by the Ontario Superior Court on March 22, 2019 authorizes RBH to pay all expenses incurred in carrying on its business in the ordinary course after the CCAA filing, including obligations to employees, vendors, and suppliers. As further described in Note 22. Deconsolidation of RBH, RBH is now deconsolidated from our consolidated financial statements. As part of the CCAA proceedings, there is currently a comprehensive stay up to and including March 12, 2020 of all tobacco-related litigation pending in Canada against RBH and the other defendants, including PMI and our indemnitees (PM USA and Altria), namely, the smoking and health class actions filed in various Canadian provinces and health care cost recovery actions. These proceedings are presented below under the caption “Stayed Litigation — Canada.” Ernst & Young Inc. has been appointed as monitor of RBH in the CCAA proceedings. In accordance with the CCAA process, as the parties work towards a plan of arrangement or compromise in a confidential mediation, it is anticipated that the court will set additional hearings and further extend the stay of proceedings. On April 17, 2019, the Ontario Superior Court ruled that RBH and the other defendants will not be allowed to file an application to the Supreme Court of Canada for leave to appeal the Court of Appeal’s decision in the Létourneau and the Blais cases so long as the comprehensive stay of all tobacco-related litigation in Canada remains in effect and that the time period to file the application would be extended by the stay period. While RBH believes that the findings of liability and damages in both Létourneau and the Blais cases were incorrect, the CCAA proceedings will provide a forum for RBH to seek resolution through a plan of arrangement or compromise of all tobacco-related
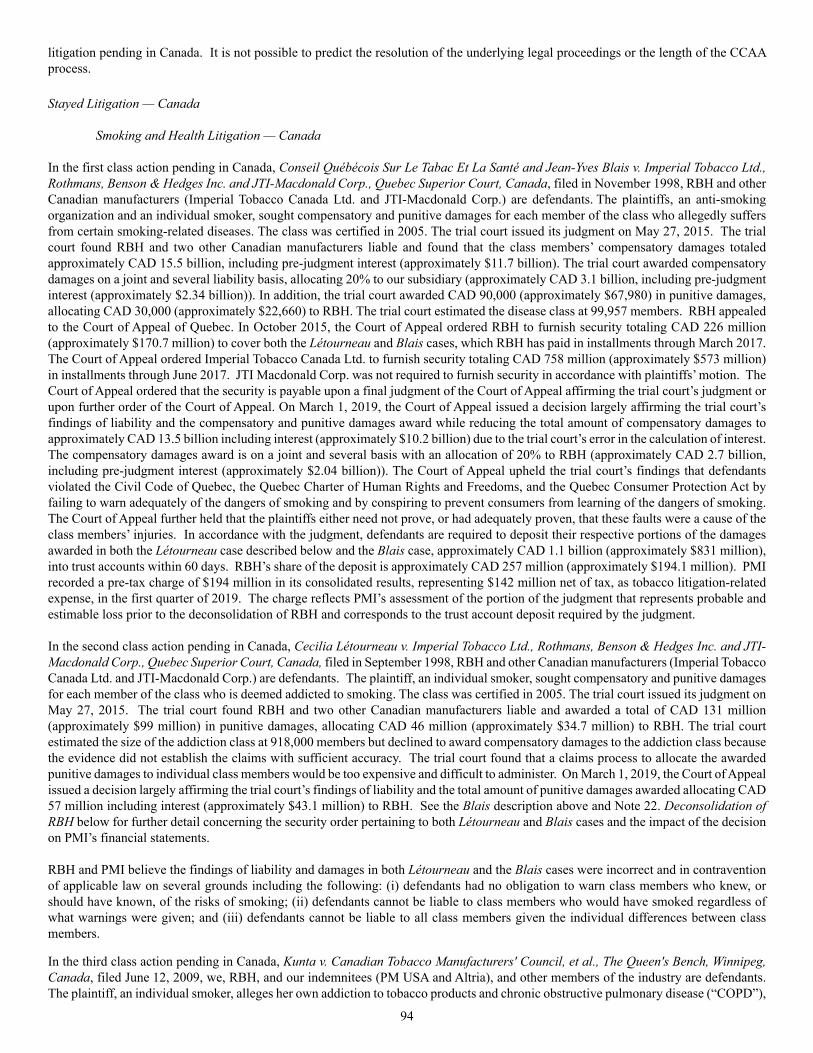
94
litigation pending in Canada. It is not possible to predict the resolution of the underlying legal proceedings or the length of the CCAA process.
Stayed Litigation — Canada
Smoking and Health Litigation — Canada
In the first class action pending in Canada, Conseil Québécois Sur Le Tabac Et La Santé and Jean-Yves Blais v. Imperial Tobacco Ltd.,Rothmans, Benson & Hedges Inc. and JTI-Macdonald Corp., Quebec Superior Court, Canada, filed in November 1998, RBH and other Canadian manufacturers (Imperial Tobacco Canada Ltd. and JTI-Macdonald Corp.) are defendants. The plaintiffs, an anti-smoking organization and an individual smoker, sought compensatory and punitive damages for each member of the class who allegedly suffers from certain smoking-related diseases. The class was certified in 2005. The trial court issued its judgment on May 27, 2015. The trial court found RBH and two other Canadian manufacturers liable and found that the class members’ compensatory damages totaled approximately CAD 15.5 billion, including pre-judgment interest (approximately $11.7 billion). The trial court awarded compensatory damages on a joint and several liability basis, allocating 20% to our subsidiary (approximately CAD 3.1 billion, including pre-judgment interest (approximately $2.34 billion)). In addition, the trial court awarded CAD 90,000 (approximately $67,980) in punitive damages, allocating CAD 30,000 (approximately $22,660) to RBH. The trial court estimated the disease class at 99,957 members. RBH appealed to the Court of Appeal of Quebec. In October 2015, the Court of Appeal ordered RBH to furnish security totaling CAD 226 million(approximately $170.7 million) to cover both the Létourneau and Blais cases, which RBH has paid in installments through March 2017. The Court of Appeal ordered Imperial Tobacco Canada Ltd. to furnish security totaling CAD 758 million (approximately $573 million) in installments through June 2017. JTI Macdonald Corp. was not required to furnish security in accordance with plaintiffs’ motion. The Court of Appeal ordered that the security is payable upon a final judgment of the Court of Appeal affirming the trial court’s judgment or upon further order of the Court of Appeal. On March 1, 2019, the Court of Appeal issued a decision largely affirming the trial court’s findings of liability and the compensatory and punitive damages award while reducing the total amount of compensatory damages to approximately CAD 13.5 billion including interest (approximately $10.2 billion) due to the trial court’s error in the calculation of interest. The compensatory damages award is on a joint and several basis with an allocation of 20% to RBH (approximately CAD 2.7 billion, including pre-judgment interest (approximately $2.04 billion)). The Court of Appeal upheld the trial court’s findings that defendants violated the Civil Code of Quebec, the Quebec Charter of Human Rights and Freedoms, and the Quebec Consumer Protection Act by failing to warn adequately of the dangers of smoking and by conspiring to prevent consumers from learning of the dangers of smoking. The Court of Appeal further held that the plaintiffs either need not prove, or had adequately proven, that these faults were a cause of the class members’ injuries. In accordance with the judgment, defendants are required to deposit their respective portions of the damages awarded in both the Létourneau case described below and the Blais case, approximately CAD 1.1 billion (approximately $831 million), into trust accounts within 60 days. RBH’s share of the deposit is approximately CAD 257 million (approximately $194.1 million). PMI recorded a pre-tax charge of $194 million in its consolidated results, representing $142 million net of tax, as tobacco litigation-related expense, in the first quarter of 2019. The charge reflects PMI’s assessment of the portion of the judgment that represents probable and estimable loss prior to the deconsolidation of RBH and corresponds to the trust account deposit required by the judgment.
In the second class action pending in Canada, Cecilia Létourneau v. Imperial Tobacco Ltd., Rothmans, Benson & Hedges Inc. and JTI-Macdonald Corp., Quebec Superior Court, Canada, filed in September 1998, RBH and other Canadian manufacturers (Imperial Tobacco Canada Ltd. and JTI-Macdonald Corp.) are defendants. The plaintiff, an individual smoker, sought compensatory and punitive damages for each member of the class who is deemed addicted to smoking. The class was certified in 2005. The trial court issued its judgment on May 27, 2015. The trial court found RBH and two other Canadian manufacturers liable and awarded a total of CAD 131 million(approximately $99 million) in punitive damages, allocating CAD 46 million (approximately $34.7 million) to RBH. The trial court estimated the size of the addiction class at 918,000 members but declined to award compensatory damages to the addiction class because the evidence did not establish the claims with sufficient accuracy. The trial court found that a claims process to allocate the awarded punitive damages to individual class members would be too expensive and difficult to administer. On March 1, 2019, the Court of Appeal issued a decision largely affirming the trial court’s findings of liability and the total amount of punitive damages awarded allocating CAD 57 million including interest (approximately $43.1 million) to RBH. See the Blais description above and Note 22. Deconsolidation of RBH below for further detail concerning the security order pertaining to both Létourneau and Blais cases and the impact of the decision on PMI’s financial statements.
RBH and PMI believe the findings of liability and damages in both Létourneau and the Blais cases were incorrect and in contravention of applicable law on several grounds including the following: (i) defendants had no obligation to warn class members who knew, or should have known, of the risks of smoking; (ii) defendants cannot be liable to class members who would have smoked regardless of what warnings were given; and (iii) defendants cannot be liable to all class members given the individual differences between class members.
In the third class action pending in Canada, Kunta v. Canadian Tobacco Manufacturers' Council, et al., The Queen's Bench, Winnipeg, Canada, filed June 12, 2009, we, RBH, and our indemnitees (PM USA and Altria), and other members of the industry are defendants. The plaintiff, an individual smoker, alleges her own addiction to tobacco products and chronic obstructive pulmonary disease (“COPD”),

95
severe asthma, and mild reversible lung disease resulting from the use of tobacco products. She is seeking compensatory and punitive damages on behalf of a proposed class comprised of all smokers, their estates, dependents and family members, as well as restitution of profits, and reimbursement of government health care costs allegedly caused by tobacco products.
In the fourth class action pending in Canada, Adams v. Canadian Tobacco Manufacturers' Council, et al., The Queen's Bench, Saskatchewan, Canada, filed July 10, 2009, we, RBH, and our indemnitees (PM USA and Altria), and other members of the industry are defendants. The plaintiff, an individual smoker, alleges her own addiction to tobacco products and COPD resulting from the use of tobacco products. She is seeking compensatory and punitive damages on behalf of a proposed class comprised of all smokers who have smoked a minimum of 25,000 cigarettes and have allegedly suffered, or suffer, from COPD, emphysema, heart disease, or cancer, as well as restitution of profits.
In the fifth class action pending in Canada, Semple v. Canadian Tobacco Manufacturers' Council, et al., The Supreme Court (trial court), Nova Scotia, Canada, filed June 18, 2009, we, RBH, and our indemnitees (PM USA and Altria), and other members of the industry are defendants. The plaintiff, an individual smoker, alleges his own addiction to tobacco products and COPD resulting from the use of tobacco products. He is seeking compensatory and punitive damages on behalf of a proposed class comprised of all smokers, their estates, dependents and family members, as well as restitution of profits, and reimbursement of government health care costs allegedly caused by tobacco products.
In the sixth class action pending in Canada, Dorion v. Canadian Tobacco Manufacturers' Council, et al., The Queen's Bench, Alberta, Canada, filed June 15, 2009, we, RBH, and our indemnitees (PM USA and Altria), and other members of the industry are defendants. The plaintiff, an individual smoker, alleges her own addiction to tobacco products and chronic bronchitis and severe sinus infections resulting from the use of tobacco products. She is seeking compensatory and punitive damages on behalf of a proposed class comprised of all smokers, their estates, dependents and family members, restitution of profits, and reimbursement of government health care costs allegedly caused by tobacco products. To date, we, our subsidiaries, and our indemnitees have not been properly served with the complaint.
In the seventh class action pending in Canada, McDermid v. Imperial Tobacco Canada Limited, et al., Supreme Court, British Columbia, Canada, filed June 25, 2010, we, RBH, and our indemnitees (PM USA and Altria), and other members of the industry are defendants. The plaintiff, an individual smoker, alleges his own addiction to tobacco products and heart disease resulting from the use of tobacco products. He is seeking compensatory and punitive damages on behalf of a proposed class comprised of all smokers who were alive on June 12, 2007, and who suffered from heart disease allegedly caused by smoking, their estates, dependents and family members, plus disgorgement of revenues earned by the defendants from January 1, 1954, to the date the claim was filed.
In the eighth class action pending in Canada, Bourassa v. Imperial Tobacco Canada Limited, et al., Supreme Court, British Columbia, Canada, filed June 25, 2010, we, RBH, and our indemnitees (PM USA and Altria), and other members of the industry are defendants. The plaintiff, the heir to a deceased smoker, alleges that the decedent was addicted to tobacco products and suffered from emphysema resulting from the use of tobacco products. She is seeking compensatory and punitive damages on behalf of a proposed class comprised of all smokers who were alive on June 12, 2007, and who suffered from chronic respiratory diseases allegedly caused by smoking, their estates, dependents and family members, plus disgorgement of revenues earned by the defendants from January 1, 1954, to the date the claim was filed. In December 2014, plaintiff filed an amended statement of claim.
In the ninth class action pending in Canada, Suzanne Jacklin v. Canadian Tobacco Manufacturers' Council, et al., Ontario Superior Court of Justice, filed June 20, 2012, we, RBH, and our indemnitees (PM USA and Altria), and other members of the industry are defendants. The plaintiff, an individual smoker, alleges her own addiction to tobacco products and COPD resulting from the use of tobacco products. She is seeking compensatory and punitive damages on behalf of a proposed class comprised of all smokers who have smoked a minimum of 25,000 cigarettes and have allegedly suffered, or suffer, from COPD, heart disease, or cancer, as well as restitution of profits.
Health Care Cost Recovery Litigation — Canada
In the first health care cost recovery case pending in Canada, Her Majesty the Queen in Right of British Columbia v. Imperial Tobacco Limited, et al., Supreme Court, British Columbia, Vancouver Registry, Canada, filed January 24, 2001, we, RBH, our indemnitee (PM USA), and other members of the industry are defendants. The plaintiff, the government of the province of British Columbia, brought a claim based upon legislation enacted by the province authorizing the government to file a direct action against cigarette manufacturers to recover the health care costs it has incurred, and will incur, resulting from a “tobacco related wrong.”
In the second health care cost recovery case filed in Canada, Her Majesty the Queen in Right of New Brunswick v. Rothmans Inc., et al., Court of Queen's Bench of New Brunswick, Trial Court, New Brunswick, Fredericton, Canada, filed March 13, 2008, we, RBH, our indemnitees (PM USA and Altria), and other members of the industry are defendants. The claim was filed by the government of the province of New Brunswick based on legislation enacted in the province. This legislation is similar to the law introduced in British Columbia that authorizes the government to file a direct action against cigarette manufacturers to recover the health care costs it has incurred, and will incur, as a result of a “tobacco related wrong.”

96
In the third health care cost recovery case filed in Canada, Her Majesty the Queen in Right of Ontario v. Rothmans Inc., et al., Ontario Superior Court of Justice, Toronto, Canada, filed September 29, 2009, we, RBH, our indemnitees (PM USA and Altria), and other members of the industry are defendants. The claim was filed by the government of the province of Ontario based on legislation enacted in the province. This legislation is similar to the laws introduced in British Columbia and New Brunswick that authorize the government to file a direct action against cigarette manufacturers to recover the health care costs it has incurred, and will incur, as a result of a “tobacco related wrong.”
In the fourth health care cost recovery case filed in Canada, Attorney General of Newfoundland and Labrador v. Rothmans Inc., et al., Supreme Court of Newfoundland and Labrador, St. Johns, Canada, filed February 8, 2011, we, RBH, our indemnitees (PM USA and Altria), and other members of the industry are defendants. The claim was filed by the government of the province of Newfoundland and Labrador based on legislation enacted in the province that is similar to the laws introduced in British Columbia, New Brunswick and Ontario. The legislation authorizes the government to file a direct action against cigarette manufacturers to recover the health care costs it has incurred, and will incur, as a result of a “tobacco related wrong.”
In the fifth health care cost recovery case filed in Canada, Attorney General of Quebec v. Imperial Tobacco Limited, et al., Superior Court of Quebec, Canada, filed June 8, 2012, we, RBH, our indemnitee (PM USA), and other members of the industry are defendants. The claim was filed by the government of the province of Quebec based on legislation enacted in the province that is similar to the laws enacted in several other Canadian provinces. The legislation authorizes the government to file a direct action against cigarette manufacturers to recover the health care costs it has incurred, and will incur, as a result of a “tobacco related wrong.”
In the sixth health care cost recovery case filed in Canada, Her Majesty in Right of Alberta v. Altria Group, Inc., et al., Supreme Court of Queen's Bench Alberta, Canada, filed June 8, 2012, we, RBH, our indemnitees (PM USA and Altria), and other members of the industry are defendants. The claim was filed by the government of the province of Alberta based on legislation enacted in the province that is similar to the laws enacted in several other Canadian provinces. The legislation authorizes the government to file a direct action against cigarette manufacturers to recover the health care costs it has incurred, and will incur, as a result of a “tobacco related wrong.”
In the seventh health care cost recovery case filed in Canada, Her Majesty the Queen in Right of the Province of Manitoba v. Rothmans, Benson & Hedges, Inc., et al., The Queen's Bench, Winnipeg Judicial Centre, Canada, filed May 31, 2012, we, RBH, our indemnitees (PM USA and Altria), and other members of the industry are defendants. The claim was filed by the government of the province of Manitoba based on legislation enacted in the province that is similar to the laws enacted in several other Canadian provinces. The legislation authorizes the government to file a direct action against cigarette manufacturers to recover the health care costs it has incurred, and will incur, as a result of a “tobacco related wrong.”
In the eighth health care cost recovery case filed in Canada, The Government of Saskatchewan v. Rothmans, Benson & Hedges Inc., et al., Queen's Bench, Judicial Centre of Saskatchewan, Canada, filed June 8, 2012, we, RBH, our indemnitees (PM USA and Altria), and other members of the industry are defendants. The claim was filed by the government of the province of Saskatchewan based on legislation enacted in the province that is similar to the laws enacted in several other Canadian provinces. The legislation authorizes the government to file a direct action against cigarette manufacturers to recover the health care costs it has incurred, and will incur, as a result of a “tobacco related wrong.”
In the ninth health care cost recovery case filed in Canada, Her Majesty the Queen in Right of the Province of Prince Edward Island v. Rothmans, Benson & Hedges Inc., et al., Supreme Court of Prince Edward Island (General Section), Canada, filed September 10, 2012, we, RBH, our indemnitees (PM USA and Altria), and other members of the industry are defendants. The claim was filed by the government of the province of Prince Edward Island based on legislation enacted in the province that is similar to the laws enacted in several other Canadian provinces. The legislation authorizes the government to file a direct action against cigarette manufacturers to recover the health care costs it has incurred, and will incur, as a result of a “tobacco related wrong.”
In the tenth health care cost recovery case filed in Canada, Her Majesty the Queen in Right of the Province of Nova Scotia v. Rothmans, Benson & Hedges Inc., et al., Supreme Court of Nova Scotia, Canada, filed January 2, 2015, we, RBH, our indemnitees (PM USA and Altria), and other members of the industry are defendants. The claim was filed by the government of the province of Nova Scotia based on legislation enacted in the province that is similar to the laws enacted in several other Canadian provinces. The legislation authorizes the government to file a direct action against cigarette manufacturers to recover the health care costs it has incurred, and will incur, as a result of a “tobacco related wrong.”
__________

97
The table below lists the number of tobacco-related cases pertaining to combustible products pending against us and/or our subsidiaries or indemnitees as of February 3, 2020, February 4, 2019 and February 9, 2018:¹
Type of Case
Number of CasesPending as of
February 3, 2020
Number of CasesPending as of
February 4, 2019
Number of CasesPending as of
February 9, 2018Individual Smoking and Health Cases 50 55 57Smoking and Health Class Actions 10 10 11Health Care Cost Recovery Actions 17 16 16Label-Related Class Actions — 1 1Individual Label-Related Cases 5 7 1Public Civil Actions 2 2 2
Since 1995, when the first tobacco-related litigation was filed against a PMI entity, 501 Smoking and Health, Label-Related, Health Care Cost Recovery, and Public Civil Actions in which we and/or one of our subsidiaries and/or indemnitees were a defendant have been terminated in our favor. Thirteen cases have had decisions in favor of plaintiffs. Nine of these cases have subsequently reached final resolution in our favor and four remain on appeal.
The table below lists the verdict and significant post-trial developments in the four pending cases where a verdict was returned in favor of the plaintiff:
Date
Location ofCourt/Name of
Plaintiff Type of
Case Verdict Post-Trial
DevelopmentsFebruary 2004
Brazil/The Smoker HealthDefense Association
Class Action
The Civil Court of São Paulofound defendants liablewithout hearing evidence. InApril 2004, the court awarded“moral damages” of R$1,000(approximately $233) persmoker per full year ofsmoking plus interest at therate of 1% per month, as of thedate of the ruling. The courtdid not assess actual damages,which were to be assessed in asecond phase of the case. Thesize of the class was notdefined in the ruling.
Defendants appealed to the São Paulo Court of Appeals, which annulled the ruling in November 2008, finding that the trial court had inappropriately ruled without hearing evidence and returned the case to the trial court for further proceedings. In May 2011, the trial court dismissed the claim. In March 2017, plaintiff filed an en banc appeal to the Superior Court of Justice. In addition, the defendants filed a constitutional appeal to the Federal Supreme Tribunal on the basis that plaintiff did not have standing to bring the lawsuit. Both appeals are still pending.
______¹ Includes cases pending in Canada.

98
Date
Location ofCourt/Name of
Plaintiff Type of
Case Verdict Post-Trial
DevelopmentsMay 27, 2015
Canada/Conseil Québécois Sur Le Tabac Et La Santé and Jean-Yves Blais
Class Action
On May 27, 2015, the Superior Court of the District of Montreal, Province of Quebec ruled in favor of the Blais class on liability and found the class members’ compensatory damages totaled approximately CAD 15.5 billion (approximately $11.7 billion), including pre-judgment interest. The trial court awarded compensatory damages on a joint and several liability basis, allocating 20% to our subsidiary (approximately CAD 3.1 billion including pre-judgment interest (approximately $2.34 billion)). The trial court awarded CAD 90,000 (approximately $67,980) in punitive damages, allocating CAD 30,000 (approximately $22,660) to our subsidiary. The trial court ordered defendants to pay CAD 1 billion (approximately $755.3 million) of the compensatory damage award, CAD 200 million (approximately $151.1 million) of which is our subsidiary’s portion, into a trust within 60 days.
In June 2015, RBH commenced the appellate process with the Court of Appeal of Quebec. On March 1, 2019, the Court of Appeal issued a decision largely affirming the trial court's decision. (See “Stayed Litigation — Canada” for further detail.)

99
Date
Location ofCourt/Name of
Plaintiff Type of
Case Verdict Post-Trial
DevelopmentsMay 27, 2015
Canada/CeciliaLétourneau
Class Action
On May 27, 2015, the Superior Court of the District of Montreal, Province of Quebec ruled in favor of the Létourneau class on liability and awarded a total of CAD 131 million (approximately $99 million) in punitive damages, allocating CAD 46 million (approximately $34.7 million) to RBH. The trial court ordered defendants to pay the full punitive damage award into a trust within 60 days. The court did not order the payment of compensatory damages.
In June 2015, RBH commenced the appellate process with the Court of Appeal of Quebec. On March 1, 2019, the Court of Appeal issued a decision largely affirming the trial court's decision. (See “Stayed Litigation — Canada” for further detail.)
Date
Location ofCourt/Name of
Plaintiff Type of
Case Verdict Post-Trial
DevelopmentsAugust 5, 2016 Argentina/Hugo Lespada Individual
ActionOn August 5, 2016, the CivilCourt No. 14 - Mar del Plata,issued a verdict in favor ofplaintiff, an individual smoker,and awarded him ARS 110,000(approximately $1,825), plusinterest, in compensatory andmoral damages. The trial courtfound that our subsidiaryfailed to warn plaintiff of therisk of becoming addicted tocigarettes.
On August 23, 2016, our subsidiaryfiled its notice of appeal. OnOctober 31, 2017, the Civil andCommercial Court of Appeals ofMar del Plata ruled that plaintiff'sclaim was barred by the statute oflimitations and it reversed the trialcourt's decision. On November 28,2017, plaintiff filed anextraordinary appeal of the reversalof the trial court's decision to theSupreme Court of the Province ofBuenos Aires.
Pending claims related to tobacco products generally fall within the following categories:
Smoking and Health Litigation: These cases primarily allege personal injury and are brought by individual plaintiffs or on behalf of a class or purported class of individual plaintiffs. Plaintiffs' allegations of liability in these cases are based on various theories of recovery, including negligence, gross negligence, strict liability, fraud, misrepresentation, design defect, failure to warn, breach of express and implied warranties, violations of deceptive trade practice laws and consumer protection statutes. Plaintiffs in these cases seek various forms of relief, including compensatory and other damages, and injunctive and equitable relief. Defenses raised in these cases include licit activity, failure to state a claim, lack of defect, lack of proximate cause, assumption of the risk, contributory negligence, and statute of limitations.
As of February 3, 2020, there were a number of smoking and health cases pending against us, our subsidiaries or indemnitees, as follows:

100
• 50 cases brought by individual plaintiffs in Argentina (31), Brazil (5), Canada (2), Chile (5), Costa Rica (1), Italy (1), the Philippines (1), Poland (2), Turkey (1) and Scotland (1), compared with 55 such cases on February 4, 2019, and 57 cases on February 9, 2018; and
• 10 cases brought on behalf of classes of individual plaintiffs in Brazil (1) and Canada (9), compared with 10 such cases on February 4, 2019 and 11 such cases on February 9, 2018.
The class actions pending in Canada are described above under the caption “Smoking and Health Litigation — Canada.”
In the class action pending in Brazil, The Smoker Health Defense Association (ADESF) v. Souza Cruz, S.A. and Philip Morris Marketing, S.A., Nineteenth Lower Civil Court of the Central Courts of the Judiciary District of São Paulo, Brazil, filed July 25, 1995, our subsidiary and another member of the industry are defendants. The plaintiff, a consumer organization, is seeking damages for all addicted smokers and former smokers, and injunctive relief. In 2004, the trial court found defendants liable without hearing evidence and awarded “moral damages” of R$1,000 (approximately $233) per smoker per full year of smoking plus interest at the rate of 1% per month, as of the date of the ruling. The court did not award actual damages, which were to be assessed in the second phase of the case. The size of the class was not estimated. Defendants appealed to the São Paulo Court of Appeals, which annulled the ruling in November 2008, finding that the trial court had inappropriately ruled without hearing evidence and returned the case to the trial court for further proceedings. In May 2011, the trial court dismissed the claim. In February 2015, the appellate court unanimously dismissed plaintiff's appeal. In September 2015, plaintiff appealed to the Superior Court of Justice. In February 2017, the Chief Justice of the Superior Court of Justice denied plaintiff's appeal. In March 2017, plaintiff filed an en banc appeal to the Superior Court of Justice. In addition, the defendants filed a constitutional appeal to the Federal Supreme Tribunal on the basis that plaintiff did not have standing to bring the lawsuit. Both appeals are still pending.
Health Care Cost Recovery Litigation: These cases, brought by governmental and non-governmental plaintiffs, seek reimbursement of health care cost expenditures allegedly caused by tobacco products. Plaintiffs' allegations of liability in these cases are based on various theories of recovery including unjust enrichment, negligence, negligent design, strict liability, breach of express and implied warranties, violation of a voluntary undertaking or special duty, fraud, negligent misrepresentation, conspiracy, public nuisance, defective product, failure to warn, sale of cigarettes to minors, and claims under statutes governing competition and deceptive trade practices. Plaintiffs in these cases seek various forms of relief including compensatory and other damages, and injunctive and equitable relief. Defenses raised in these cases include lack of proximate cause, remoteness of injury, failure to state a claim, adequate remedy at law, “unclean hands” (namely, that plaintiffs cannot obtain equitable relief because they participated in, and benefited from, the sale of cigarettes), and statute of limitations.
As of February 3, 2020, there were 17 health care cost recovery cases pending against us, our subsidiaries or indemnitees in Brazil (1), Canada (10), Korea (1) and Nigeria (5), compared with 16 such cases on February 4, 2019 and 16 such cases on February 9, 2018.
The health care cost recovery actions pending in Canada are described above under the caption “Health Care Cost Recovery Litigation — Canada.”
In the health care cost recovery case in Brazil, The Attorney General of Brazil v. Souza Cruz Ltda., et al., Federal Trial Court, Porto Alegre, Rio Grande do Sul, Brazil, filed May 21, 2019, we, our subsidiaries, and other members of the industry are defendants. Plaintiff seeks reimbursement for the cost of treating alleged smoking-related diseases for the past five years, payment of anticipated costs of treating future alleged smoking-related diseases, and moral damages. Our subsidiaries were served with the complaint. A challenge to the service of PMI as improper is pending.
In the first health care cost recovery case in Nigeria, The Attorney General of Lagos State v. British American Tobacco (Nigeria) Limited, et al., High Court of Lagos State, Lagos, Nigeria, filed March 13, 2008, we and other members of the industry are defendants. Plaintiff seeks reimbursement for the cost of treating alleged smoking-related diseases for the past 20 years, payment of anticipated costs of treating alleged smoking-related diseases for the next 20 years, various forms of injunctive relief, plus punitive damages. We are in the process of making challenges to service and the court's jurisdiction. Currently, the case is stayed in the trial court pending the appeals of certain co-defendants relating to service objections.
In the second health care cost recovery case in Nigeria, The Attorney General of Kano State v. British American Tobacco (Nigeria) Limited, et al., High Court of Kano State, Kano, Nigeria, filed May 9, 2007, we and other members of the industry are defendants. Plaintiff seeks reimbursement for the cost of treating alleged smoking-related diseases for the past 20 years, payment of anticipated costs of treating alleged smoking-related diseases for the next 20 years, various forms of injunctive relief, plus punitive damages. We are in the process of making challenges to service and the court's jurisdiction. Currently, the case is stayed in the trial court pending the appeals of certain co-defendants relating to service objections.
In the third health care cost recovery case in Nigeria, The Attorney General of Gombe State v. British American Tobacco (Nigeria) Limited, et al., High Court of Gombe State, Gombe, Nigeria, filed October 17, 2008, we and other members of the industry are defendants. Plaintiff

101
seeks reimbursement for the cost of treating alleged smoking-related diseases for the past 20 years, payment of anticipated costs of treating alleged smoking-related diseases for the next 20 years, various forms of injunctive relief, plus punitive damages. In February 2011, the court ruled that the plaintiff had not complied with the procedural steps necessary to serve us. As a result of this ruling, plaintiff must re-serve its claim. We have not yet been re-served.
In the fourth health care cost recovery case in Nigeria, The Attorney General of Oyo State, et al., v. British American Tobacco (Nigeria) Limited, et al., High Court of Oyo State, Ibadan, Nigeria, filed May 25, 2007, we and other members of the industry are defendants.Plaintiffs seek reimbursement for the cost of treating alleged smoking-related diseases for the past 20 years, payment of anticipated costs of treating alleged smoking-related diseases for the next 20 years, various forms of injunctive relief, plus punitive damages. We challenged service as improper. In June 2010, the court ruled that plaintiffs did not have leave to serve the writ of summons on the defendants and that they must re-serve the writ. We have not yet been re-served.
In the fifth health care cost recovery case in Nigeria, The Attorney General of Ogun State v. British American Tobacco (Nigeria) Limited, et al., High Court of Ogun State, Abeokuta, Nigeria, filed February 26, 2008, we and other members of the industry are defendants. Plaintiff seeks reimbursement for the cost of treating alleged smoking-related diseases for the past 20 years, payment of anticipated costs of treating alleged smoking-related diseases for the next 20 years, various forms of injunctive relief, plus punitive damages. In May 2010, the trial court rejected our service objections. We have appealed.
In the health care cost recovery case in Korea, the National Health Insurance Service v. KT&G, et. al., filed April 14, 2014, our subsidiary and other Korean manufacturers are defendants. Plaintiff alleges that defendants concealed the health hazards of smoking, marketed to youth, added ingredients to make their products more harmful and addictive, and misled consumers into believing that Lights cigarettes are safer than regular cigarettes. The National Health Insurance Service seeks to recover damages allegedly incurred in treating 3,484patients with small cell lung cancer, squamous cell lung cancer, and squamous cell laryngeal cancer from 2003 to 2012. The case is now in the evidentiary phase.
Label-Related Cases: These cases, brought by individual plaintiffs, or on behalf of a class or purported class of individual plaintiffs, allege that the use of the descriptor “Lights” or other alleged misrepresentations or omissions of labeling information constitute fraudulent and misleading conduct. Plaintiffs' allegations of liability in these cases are based on various theories of recovery including misrepresentation, deception, and breach of consumer protection laws. Plaintiffs seek various forms of relief including restitution, injunctive relief, and compensatory and other damages. Defenses raised include lack of causation, lack of reliance, assumption of the risk, and statute of limitations.
As of February 3, 2020, there were 5 label-related cases brought by individual plaintiffs in Italy (1) and Chile (4) pending against our subsidiaries, compared with 7 such case on February 4, 2019, and 1 such case on February 9, 2018.
An individual plaintiff filed a purported class action certification motion, Aharon Ringer v. Philip Morris Ltd. and Globrands Ltd., on July 18, 2017, in the Central District Court of Israel. Our Israeli affiliate and an Israeli importer and distributor for other multinational tobacco companies were defendants. Plaintiff sought to represent a class of smokers in Israel who have purchased cigarettes imported by defendants since July 18, 2010. Plaintiff estimated the class size to be 7,000,000 smokers. Plaintiff alleged that defendants misled consumers by not disclosing sufficient information about carbon monoxide, tar, and nicotine yields of, and tobacco contained in, the imported cigarettes. Plaintiff sought various forms of relief, including an order for defendants to label cigarette packs in accordance with plaintiff’s demands, and damages for misleading consumers, breach of autonomy and unjust enrichment. In September 2019, plaintiff voluntarily withdrew the class certification motion, and the trial court dismissed the case with prejudice.
Public Civil Actions: Claims have been filed either by an individual, or a public or private entity, seeking to protect collective or individual rights, such as the right to health, the right to information or the right to safety. Plaintiffs' allegations of liability in these cases are based on various theories of recovery including product defect, concealment, and misrepresentation. Plaintiffs in these cases seek various forms of relief including injunctive relief such as banning cigarettes, descriptors, smoking in certain places and advertising, as well as implementing communication campaigns and reimbursement of medical expenses incurred by public or private institutions.
As of February 3, 2020, there were 2 public civil actions pending against our subsidiaries in Argentina (1) and Venezuela (1), compared with 2 such cases on February 4, 2019, and 2 such cases on February 9, 2018.
In the public civil action in Argentina, Asociación Argentina de Derecho de Danos v. Massalin Particulares S.A., et al., Civil Court of Buenos Aires, Argentina, filed February 26, 2007, our subsidiary and another member of the industry are defendants. The plaintiff, a consumer association, seeks the establishment of a relief fund for reimbursement of medical costs associated with diseases allegedly caused by smoking. Our subsidiary filed its answer in September 2007. In March 2010, the case file was transferred to the Federal Court on Administrative Matters after the Civil Court granted plaintiff's request to add the national government as a co-plaintiff in the case. The case is currently awaiting a court decision on the merits.

102
In the public civil action in Venezuela, Federation of Consumers and Users Associations (“FEVACU”), et al. v. National Assembly of Venezuela and the Venezuelan Ministry of Health, Constitutional Chamber of the Venezuelan Supreme Court, filed April 29, 2008, we were not named as a defendant, but the plaintiffs published a notice pursuant to court order, notifying all interested parties to appear in the case. In January 2009, our subsidiary appeared in the case in response to this notice. The plaintiffs purport to represent the right to health of the citizens of Venezuela and claim that the government failed to protect adequately its citizens' right to health. The claim asks the court to order the government to enact stricter regulations on the manufacture and sale of tobacco products. In addition, the plaintiffs ask the court to order companies involved in the tobacco industry to allocate a percentage of their “sales or benefits” to establish a fund to pay for the health care costs of treating smoking-related diseases. In October 2008, the court ruled that plaintiffs have standing to file the claim and that the claim meets the threshold admissibility requirements. In December 2012, the court admitted our subsidiary and BAT's subsidiary as interested third parties. In February 2013, our subsidiary answered the complaint.
Reduced-Risk Products
In Colombia, an individual filed a purported class action, Ana Ferrero Rebolledo vs. Philip Morris Colombia S.A., et al., in April 2019 against our subsidiaries with the Civil Court of Bogota related to the marketing of our Platform 1 product. Plaintiff alleges that our subsidiaries advertise the product in contravention of law and in a manner that misleads consumers by portraying the product in a positive light, and further asserts that the Platform 1 vapor contains many toxic compounds, creates a high level of dependence, and has damaging second-hand effects. Plaintiff seeks injunctive relief and damages on her behalf and on a behalf of two classes (class 1 - all Platform 1 consumers in Colombia who seek damages for the purchase price of the product and personal injuries related to the alleged addiction, and class 2 - all residents of the neighborhood where the advertising allegedly took place who seek damages for exposure to the alleged illegal advertising). Our subsidiaries answered the complaint in January 2020.
Other Litigation
The Department of Special Investigations of the government of Thailand ("DSI") conducted an investigation into alleged underpayment by our subsidiary, Philip Morris (Thailand) Limited ("PM Thailand"), of customs duties and excise taxes relating to imports from the Philippines covering the period 2003-2007. On January 18, 2016, the Public Prosecutor filed charges against our subsidiary and seven former and current employees in the Bangkok Criminal Court alleging that PM Thailand and the individual defendants jointly and with the intention to defraud the Thai government, under-declared import prices of cigarettes to avoid full payment of taxes and duties in connection with import entries of cigarettes from the Philippines during the period of July 2003 to June 2006. The government is seeking a fine of approximately THB 80.8 billion (approximately $2.58 billion). In May 2017, Thailand enacted a new customs act. The new act, which took effect in November 2017, substantially limits the amount of fines that Thailand could seek in these proceedings. PM Thailand believes that its declared import prices are in compliance with the Customs Valuation Agreement of the World Trade Organization and Thai law and that the allegations of the Public Prosecutor are inconsistent with several decisions already taken by Thai Customs and other Thai governmental agencies. Trial in the case began in November 2017 and concluded in September 2019. In November 2019, the trial court found our subsidiary guilty of under-declaration of the prices and imposed a fine of approximately THB 1.2 billion(approximately $38.4 million). The trial court dismissed all charges against the individual defendants. In December 2019, as required by the Thai law, our subsidiary paid the fine. This payment is included in other assets on the consolidated balance sheets and in cash used in operating activities in the consolidated statements of cash flows. Our subsidiary will appeal the trial court’s decision. If our subsidiary ultimately prevails on appeal, then Thailand will be required to return this payment to our subsidiary.
The DSI also conducted an investigation into alleged underpayment by PM Thailand of customs duties and excise taxes relating to imports from Indonesia covering the period 2000-2003. On January 26, 2017, the Public Prosecutor filed charges against PM Thailand and its former Thai employee in the Bangkok Criminal Court alleging that PM Thailand and its former employee jointly and with the intention to defraud the Thai government under-declared import prices of cigarettes to avoid full payment of taxes and duties in connection with import entries during the period from January 2002 to July 2003. The government is seeking a fine of approximately THB 19.8 billion(approximately $633 million). In May 2017, Thailand enacted a new customs act. The new act, which took effect in November 2017, substantially limits the amount of fines that Thailand could seek in these proceedings. PM Thailand believes that its declared import prices are in compliance with the Customs Valuation Agreement of the World Trade Organization and Thai law, and that the allegations of the Public Prosecutor are inconsistent with several decisions already taken by Thai Customs and a Thai court. Trial in the case began in November 2018 and concluded in December 2019. The case is awaiting a court decision in March 2020.
The South Korean Board of Audit and Inspection (“BAI”) conducted an audit of certain Korean government agencies and the tobacco industry into whether inventory movements ahead of the January 1, 2015 increase of cigarette-related taxes by tobacco companies, including Philip Morris Korea Inc. ("PM Korea"), our South Korean affiliate, were in compliance with South Korean tax laws. In November 2016, the tax authorities completed their audit and assessed allegedly underpaid taxes and penalties. In order to avoid nonpayment financial costs, PM Korea paid approximately KRW 272 billion (approximately $227 million), of which KRW 100 billion(approximately $83.5 million) was paid in 2016 and KRW 172 billion (approximately $143.7 million) was paid in the first quarter of 2017. These amounts are included in other assets in the consolidated balance sheets and in cash used in operating activities in the consolidated statements of cash flows. PM Korea appealed the assessments. In January 2020, a trial court ruled that PM Korea did not

103
underpay the approximately KRW 218 billion (approximately $182 million) in taxes that were subject to its jurisdiction. The tax authorities have appealed this decision. If the tax authorities ultimately lose, then they would be required to return the paid amounts to PM Korea. PM Korea's appeal of approximately KRW 54 billion of alleged underpayments (approximately $45 million) is pending at another court. The tax authorities have also referred the matter to the Public Prosecutor. On June 19, 2018, the Public Prosecutor decided not to file criminal charges against PM Korea and/or other alleged co-offenders. The Public Prosecutor also decided not to prosecute PM Korea and its managing director in connection with a criminal complaint against them that had been filed by the South Korean Ministry of Strategy and Finance (“MOSF”). In the criminal complaint, the MOSF alleged that PM Korea exceeded the monthly product withdrawal limits that the MOSF had set in its notice. In March 2019, the Supreme Prosecutor's Office dismissed both the tax authorities' and the MOSF's appeals on the decisions of the Public Prosecutor, concluding the criminal investigations in these matters.
The Moscow Tax Inspectorate for Major Taxpayers (“MTI”) conducted an audit of AO Philip Morris Izhora (“PM Izhora”), our Russian affiliate, for the 2015-2017 financial years. On July 26, 2019, MTI issued its initial assessment, claiming that intercompany sales of cigarettes between PM Izhora and another Russian affiliate prior to excise tax increases and submission by PM Izhora of the maximum retail sales price notifications for cigarettes to the tax authorities were improper under Russian tax laws and resulted in underpayment of excise taxes and VAT. In August 2019, PM Izhora submitted its objections disagreeing with MTI’s allegations set forth in the initial assessment and MTI’s methodology for calculating the alleged underpayments. MTI accepted some of PM Izhora’s arguments and in September 2019, issued the final tax assessment claiming an underpayment of RUB 24.3 billion (approximately $374 million), including penalties and interest. In accordance with Russian tax laws, PM Izhora paid the entire amount of MTI’s final assessment. This amount was neither imposed on, nor concurrent with, the specific revenue-producing transaction, nor was it collected from customers of our Russian affiliates. PMI believes that the loss of $374 million in this matter is probable and estimable. Consequently, in the third quarter of 2019, PMI recorded a pre-tax charge of $374 million, in marketing, administration and research costs in the consolidated statements of earnings, representing $315 million net of income tax. Under the Russian law, PM Izhora has until mid-September 2020 to challenge the final tax assessment to the Federal Tax Service and is considering whether to pursue such challenge.
A putative shareholder class action lawsuit, In re Philip Morris International Inc. Securities Litigation, is pending in the United States District Court for the Southern District of New York, purportedly on behalf of purchasers of Philip Morris International Inc. stock between July 26, 2016 and April 18, 2018. The lawsuit names Philip Morris International Inc. and certain officers and employees as defendants and includes allegations that the defendants made false and/or misleading statements and/or failed to disclose information about PMI’s business, operations, financial condition, and prospects, related to product sales of, and alleged irregularities in clinical studies of, PMI’s Platform 1 product. The lawsuit seeks various forms of relief, including damages. In November 2018, the court consolidated three putative shareholder class action lawsuits with similar allegations previously filed in the Southern District of New York (namely, City of Westland Police and Fire Retirement System v. Philip Morris International Inc., et al, Greater Pennsylvania Carpenters’ Pension Fund v. Philip Morris International Inc., et al., and Gilchrist v. Philip Morris International Inc., et al.) into these proceedings. A putative shareholder class action lawsuit, Rubenstahl v. Philip Morris International Inc., et al., that had been previously filed in December 2017 in the United States District Court for the District of New Jersey, was voluntarily dismissed by the plaintiff due to similar allegations in these proceedings. On February 4, 2020, the court granted defendants’ motion in its entirety, dismissing all but one of the plaintiffs’ claims with prejudice. The court noted that one of plaintiffs’ claims (allegations relating to four non-clinical studies of PMI’s Platform 1 product) did not state a viable claim but allowed plaintiffs to replead that claim by March 3, 2020. We believe that this lawsuit is without merit and, in the event that plaintiffs take further action, will continue to defend it vigorously.
We are also involved in additional litigation arising in the ordinary course of our business. While the outcomes of these proceedings are uncertain, management does not expect that the ultimate outcomes of other litigation, including any reasonably possible losses in excess of current accruals, will have a material adverse effect on our consolidated results of operations, cash flows or financial position.
Note 19.
Balance Sheet Offsetting:
Derivative Financial Instruments
PMI uses foreign exchange contracts and interest rate contracts to mitigate its exposure to changes in exchange and interest rates from third-party and intercompany actual and forecasted transactions. Substantially all of PMI's derivative financial instruments are subject to master netting arrangements, whereby the right to offset occurs in the event of default by a participating party. While these contracts contain the enforceable right to offset through close-out netting rights, PMI elects to present them on a gross basis in the consolidated balance sheets. Collateral associated with these arrangements is in the form of cash and is unrestricted. See Note 15. Financial Instruments for disclosures related to PMI's derivative financial instruments.

104
The effects of these derivative financial instrument assets and liabilities on PMI's consolidated balance sheets were as follows:
(in millions)
GrossAmounts
Recognized
Gross AmountOffset in theConsolidatedBalance Sheet
Net AmountsPresented in the
ConsolidatedBalance Sheet
Gross Amounts Not Offset in theConsolidated Balance Sheet
NetAmount
FinancialInstruments
Cash CollateralReceived/Pledged
At December 31, 2019AssetsDerivative contracts $ 390 $ — $ 390 $ (297) $ (91) $ 2LiabilitiesDerivative contracts $ 419 $ — $ 419 $ (297) $ (59) $ 63
At December 31, 2018AssetsDerivative contracts $ 220 $ — $ 220 $ (124) $ (80) $ 16LiabilitiesDerivative contracts $ 631 $ — $ 631 $ (124) $ (427) $ 80
Note 20.
Sale of Accounts Receivable:
To mitigate risk and enhance cash and liquidity management PMI sells trade receivables to unaffiliated financial institutions. These arrangements allow PMI to sell, on an ongoing basis, certain trade receivables without recourse. The trade receivables sold are generally short-term in nature and are removed from the consolidated balance sheets. PMI sells trade receivables under two types of arrangements, servicing and non-servicing. For servicing arrangements, PMI continues to service the sold trade receivables on an administrative basis and does not act on behalf of the unaffiliated financial institutions. When applicable, a servicing liability is recorded for the estimated fair value of the servicing. The amounts associated with the servicing liability were not material for the years ended December 31, 2019 and 2018. Under the non-servicing arrangements, PMI does not provide any administrative support or servicing after the trade receivables have been sold to the unaffiliated financial institutions.
Cumulative trade receivables sold, including excise taxes, for the years ended December 31, 2019 and 2018, were $10.7 billion and $11.0 billion, respectively. PMI’s operating cash flows were positively impacted by the amount of the trade receivables sold and derecognized from the consolidated balance sheets, which remained outstanding with the unaffiliated financial institutions. The trade receivables sold that remained outstanding under these arrangements as of December 31, 2019, 2018 and 2017, were $0.9 billion, $1.0 billion and $1.1 billion, respectively. The net proceeds received are included in cash provided by operating activities in the consolidated statements of cash flows. The difference between the carrying amount of the trade receivables sold and the sum of the cash received is recorded as a loss on sale of trade receivables within marketing, administration and research costs in the consolidated statements of earnings. For the years ended December 31, 2019, 2018 and 2017 the loss on sale of trade receivables was immaterial.
Note 21.
Asset Impairment and Exit Costs:
Global Manufacturing Infrastructure Optimization
In light of declining PMI cigarette volumes resulting from lower total industry volumes and the shift to smoke-free alternatives, PMI continues to optimize its global manufacturing infrastructure.

105
Germany
On November 4, 2019, PMI announced that, as part of its global manufacturing infrastructure optimization, its German affiliate, Philip Morris Manufacturing GmbH ("PMMG"), reached an agreement with employee representatives to end cigarette production in its factory in Berlin, Germany, by January 1, 2020. As a result of this agreement, during 2019, PMI recorded pre-tax asset impairment and exit costs of $342 million in the European Union segment. This amount included pension and employee separation costs of $251 million, which will be paid in cash, and asset impairment costs of $91 million, primarily related to machinery and equipment, which are non-cash charges.
Other
During 2019, PMI also recorded pre-tax asset impairment and exit costs of $80 million as part of its global manufacturing infrastructure optimization. These costs were related to a cigarette plant closure in Argentina ($15 million), Colombia ($45 million) and Pakistan ($20 million). The charges were reflected in the Latin America & Canada segment (Argentina and Colombia) and the South & Southeast Asia segment (Pakistan).
Asset Impairment and Exit Costs by Segment
During 2019, pre-tax asset impairment and exit costs consisted of the following:
(in millions) 2019Separation programs:
European Union $ 251South & Southeast Asia 3Latin America & Canada 49
Total separation programs 303
Asset impairment chargesEuropean Union 91South & Southeast Asia 17Latin America & Canada 11
Total asset impairment charges 119Asset impairment and exit costs $ 422
The total pre-tax asset impairment and exit costs above were included in marketing, administration and research costs on the consolidated statements of earnings. During 2018 and 2017, PMI did not incur asset impairment and exit costs.
Movement in Exit Cost Liabilities
The movement in exit cost liabilities for the year ended December 31, 2019 was as follows:
(in millions)
Liability balance, January 1, 2019 $ —Charges, net 303Cash spent (49)Currency/other(a) (63)
Liability balance, December 31, 2019 $ 191
(a) Relates primarily to the reclassification of pension amounts.
Future cash payments for exit costs incurred to date are anticipated to be substantially paid by the end of 2021, with approximately $115 million expected to be paid in 2020.
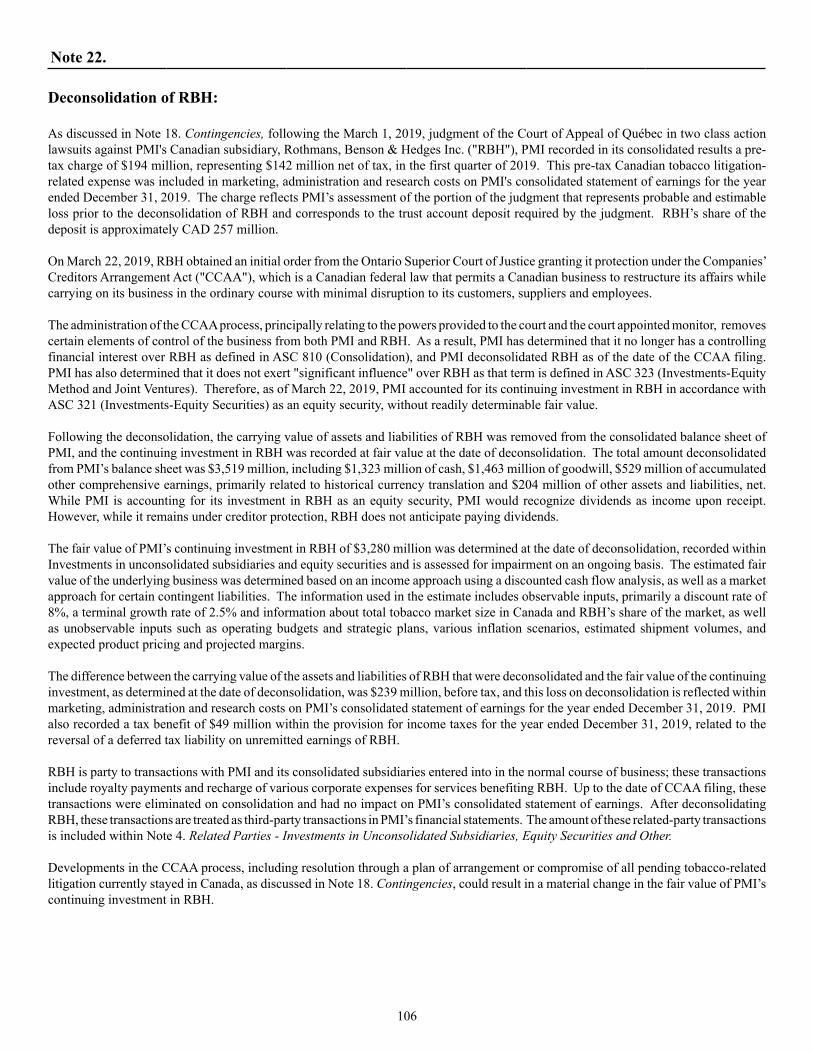
106
Note 22.
Deconsolidation of RBH:
As discussed in Note 18. Contingencies, following the March 1, 2019, judgment of the Court of Appeal of Québec in two class action lawsuits against PMI's Canadian subsidiary, Rothmans, Benson & Hedges Inc. ("RBH"), PMI recorded in its consolidated results a pre-tax charge of $194 million, representing $142 million net of tax, in the first quarter of 2019. This pre-tax Canadian tobacco litigation-related expense was included in marketing, administration and research costs on PMI's consolidated statement of earnings for the year ended December 31, 2019. The charge reflects PMI’s assessment of the portion of the judgment that represents probable and estimable loss prior to the deconsolidation of RBH and corresponds to the trust account deposit required by the judgment. RBH’s share of the deposit is approximately CAD 257 million.
On March 22, 2019, RBH obtained an initial order from the Ontario Superior Court of Justice granting it protection under the Companies’ Creditors Arrangement Act ("CCAA"), which is a Canadian federal law that permits a Canadian business to restructure its affairs while carrying on its business in the ordinary course with minimal disruption to its customers, suppliers and employees.
The administration of the CCAA process, principally relating to the powers provided to the court and the court appointed monitor, removes certain elements of control of the business from both PMI and RBH. As a result, PMI has determined that it no longer has a controlling financial interest over RBH as defined in ASC 810 (Consolidation), and PMI deconsolidated RBH as of the date of the CCAA filing. PMI has also determined that it does not exert "significant influence" over RBH as that term is defined in ASC 323 (Investments-Equity Method and Joint Ventures). Therefore, as of March 22, 2019, PMI accounted for its continuing investment in RBH in accordance with ASC 321 (Investments-Equity Securities) as an equity security, without readily determinable fair value.
Following the deconsolidation, the carrying value of assets and liabilities of RBH was removed from the consolidated balance sheet of PMI, and the continuing investment in RBH was recorded at fair value at the date of deconsolidation. The total amount deconsolidated from PMI’s balance sheet was $3,519 million, including $1,323 million of cash, $1,463 million of goodwill, $529 million of accumulated other comprehensive earnings, primarily related to historical currency translation and $204 million of other assets and liabilities, net. While PMI is accounting for its investment in RBH as an equity security, PMI would recognize dividends as income upon receipt. However, while it remains under creditor protection, RBH does not anticipate paying dividends.
The fair value of PMI’s continuing investment in RBH of $3,280 million was determined at the date of deconsolidation, recorded within Investments in unconsolidated subsidiaries and equity securities and is assessed for impairment on an ongoing basis. The estimated fair value of the underlying business was determined based on an income approach using a discounted cash flow analysis, as well as a market approach for certain contingent liabilities. The information used in the estimate includes observable inputs, primarily a discount rate of 8%, a terminal growth rate of 2.5% and information about total tobacco market size in Canada and RBH’s share of the market, as well as unobservable inputs such as operating budgets and strategic plans, various inflation scenarios, estimated shipment volumes, and expected product pricing and projected margins.
The difference between the carrying value of the assets and liabilities of RBH that were deconsolidated and the fair value of the continuing investment, as determined at the date of deconsolidation, was $239 million, before tax, and this loss on deconsolidation is reflected within marketing, administration and research costs on PMI’s consolidated statement of earnings for the year ended December 31, 2019. PMI also recorded a tax benefit of $49 million within the provision for income taxes for the year ended December 31, 2019, related to the reversal of a deferred tax liability on unremitted earnings of RBH.
RBH is party to transactions with PMI and its consolidated subsidiaries entered into in the normal course of business; these transactions include royalty payments and recharge of various corporate expenses for services benefiting RBH. Up to the date of CCAA filing, these transactions were eliminated on consolidation and had no impact on PMI’s consolidated statement of earnings. After deconsolidating RBH, these transactions are treated as third-party transactions in PMI’s financial statements. The amount of these related-party transactions is included within Note 4. Related Parties - Investments in Unconsolidated Subsidiaries, Equity Securities and Other.
Developments in the CCAA process, including resolution through a plan of arrangement or compromise of all pending tobacco-related litigation currently stayed in Canada, as discussed in Note 18. Contingencies, could result in a material change in the fair value of PMI’s continuing investment in RBH.

107
Note 23.
Leases:
PMI’s operating leases are principally for real estate (office space, warehouses and retail store space) and vehicles. Lease terms range from 1 year to 74 years, some of which include options to renew, which are reasonably certain to be renewed. Lease terms may also include options to terminate the lease. The exercise of a lease renewal or termination option is at PMI’s discretion. PMI’s operating leases at December 31, 2019, were as follows:
(in millions) December 31, 2019Assets:
Other assets $ 766
Liabilities:Current
Accrued liabilities - Other $ 194Noncurrent
Income taxes and other liabilities 569Total lease liabilities $ 763
For information regarding PMI’s immaterial finance leases, see Note 16. Fair Value Measurements.
The components of PMI’s lease cost were as follows for the year ended December 31, 2019:
(in millions) December 31, 2019Operating lease cost $ 242Short-term lease cost 61Variable lease cost 29Total lease cost $ 332
For the year ended December 31, 2019, lease cost of $79 million was recorded in cost of sales and $253 million was recorded in marketing, administration and research cost.
Maturity of PMI’s operating lease liabilities, on an undiscounted basis, as of December 31, 2019, was as follows (as calculated under the new guidance ASC 842 (Leases)):
(in millions) Total2020 $ 2222021 1622022 1242023 922024 66Thereafter 283Total lease payments 949Less: Interest 186Present value of lease liabilities $ 763

108
Minimum rental commitments under non-cancelable operating leases in effect at December 31, 2018, were as follows (as calculated under legacy guidance ASC 840 (Leases)):
(in millions) Total2019 $ 1472020 1032021 732022 522023 43Thereafter 354
$ 772
Other information related to PMI’s operating leases was as follows for the year ended December 31, 2019:
(in millions) December 31, 2019Cash paid for amounts included in the measurement of lease liabilities in Operating cash flows $ 240Leased assets obtained in exchange for new operating lease liabilities $ 221Weighted-average remaining lease term (years) 9.6Weighted-average discount rate(1) 4.4%
(1) PMI’s weighted-average discount rate is based on its estimated pre-tax cost of debt adjusted for country-specific risk.
For further details, see Note 24. New Accounting Standards.
Note 24.
New Accounting Standards:
Recently adopted
On February 25, 2016, the Financial Accounting Standards Board (“FASB”) issued Accounting Standards Update ASU 2016-02, “Leases” (“ASU 2016-02”). ASU 2016-02 requires organizations that lease assets to recognize on the balance sheet the assets and liabilities for the rights and obligations created by those leases. Additionally, ASU 2016-02 modifies current guidance for lessors' accounting. ASU 2016-02 is effective for interim and annual reporting periods beginning on or after January 1, 2019, with early adoption permitted. PMI has identified its lease management system and has identified and evaluated the applicable leases. In addition to the guidance in ASU 2016-02, PMI has evaluated ASU 2018-11, which was issued in July 2018 and provides an optional transitional method. As a result of this evaluation, PMI elected to use the optional transition method, which allows companies to use the effective date as the date of initial application on transition and not adjust comparative period financial information or make the new required disclosures for periods prior to the effective date. Additionally, PMI elected to use the hindsight practical expedient, as well as the package of practical expedients permitted under the transition guidance within the new standard. Upon adoption, PMI recognized lease liabilities and the corresponding right-of-use assets (at the present value of future payments) for predominately all of its operating leases in place at that time. At January 1, 2019, PMI's adoption of ASU 2016-02 resulted in an increase of approximately $0.7 billion on its assets and liabilities in its statement of financial position. ASU 2016-02 did not have a material impact on its results of operations or cash flows. For further details, see Note 23. Leases.
On January 1, 2019, PMI elected to early adopt ASU 2018-15 “Intangibles - Goodwill and Other - Internal - Use Software (Subtopic 350-40): Customer’s Accounting for Implementation Costs Incurred in a Cloud Computing Arrangement That Is a Service Contract.” The adoption of ASU 2018-15 did not have a material impact on PMI's consolidated financial position or results of operations.
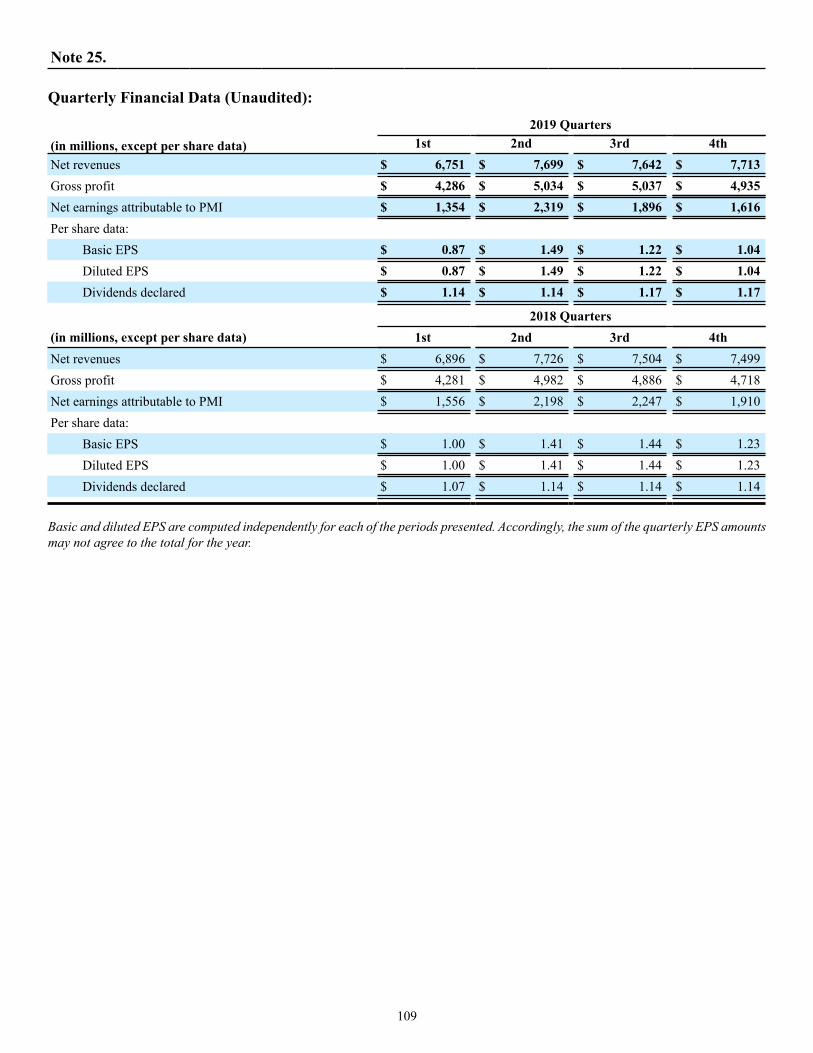
109
Note 25.
Quarterly Financial Data (Unaudited): 2019 Quarters
(in millions, except per share data) 1st 2nd 3rd 4thNet revenues $ 6,751 $ 7,699 $ 7,642 $ 7,713Gross profit $ 4,286 $ 5,034 $ 5,037 $ 4,935Net earnings attributable to PMI $ 1,354 $ 2,319 $ 1,896 $ 1,616Per share data:
Basic EPS $ 0.87 $ 1.49 $ 1.22 $ 1.04Diluted EPS $ 0.87 $ 1.49 $ 1.22 $ 1.04Dividends declared $ 1.14 $ 1.14 $ 1.17 $ 1.17
2018 Quarters(in millions, except per share data) 1st 2nd 3rd 4thNet revenues $ 6,896 $ 7,726 $ 7,504 $ 7,499Gross profit $ 4,281 $ 4,982 $ 4,886 $ 4,718Net earnings attributable to PMI $ 1,556 $ 2,198 $ 2,247 $ 1,910Per share data:
Basic EPS $ 1.00 $ 1.41 $ 1.44 $ 1.23Diluted EPS $ 1.00 $ 1.41 $ 1.44 $ 1.23Dividends declared $ 1.07 $ 1.14 $ 1.14 $ 1.14
Basic and diluted EPS are computed independently for each of the periods presented. Accordingly, the sum of the quarterly EPS amounts may not agree to the total for the year.
110
Report of Independent Registered Public Accounting Firm
To the Board of Directors and Stockholders of Philip Morris International Inc.:
Opinions on the Financial Statements and Internal Control over Financial Reporting
We have audited the accompanying consolidated balance sheets of Philip Morris International Inc. and its subsidiaries (the "Company") as of December 31, 2019 and 2018, and the related consolidated statements of earnings, comprehensive earnings, stockholders’ (deficit) equity and of cash flows for each of the three years in the period ended December 31, 2019, including the related notes (collectively referred to as the “consolidated financial statements”). We also have audited the Company's internal control over financial reporting as of December 31, 2019, based on criteria established in Internal Control - Integrated Framework (2013) issued by the Committee of Sponsoring Organizations of the Treadway Commission (COSO).
In our opinion, the consolidated financial statements referred to above present fairly, in all material respects, the financial position of the Company as of December 31, 2019 and 2018, and the results of its operations and its cash flows for each of the three years in the period ended December 31, 2019 in conformity with accounting principles generally accepted in the United States of America. Also in our opinion, the Company maintained, in all material respects, effective internal control over financial reporting as of December 31, 2019, based on criteria established in Internal Control — Integrated Framework (2013) issued by the COSO.
Basis for Opinions
The Company's management is responsible for these consolidated financial statements, for maintaining effective internal control over financial reporting, and for its assessment of the effectiveness of internal control over financial reporting, included in the accompanying Report of Management on Internal Control over Financial Reporting. Our responsibility is to express opinions on the Company's consolidated financial statements and on the Company’s internal control over financial reporting based on our audits. We are a public accounting firm registered with the Public Company Accounting Oversight Board (United States) (PCAOB) and are required to be independent with respect to the Company in accordance with the U.S. federal securities laws and the applicable rules and regulations of the Securities and Exchange Commission and the PCAOB.
We conducted our audits in accordance with the standards of the PCAOB. Those standards require that we plan and perform the audits to obtain reasonable assurance about whether the consolidated financial statements are free of material misstatement, whether due to error or fraud, and whether effective internal control over financial reporting was maintained in all material respects.
Our audits of the consolidated financial statements included performing procedures to assess the risks of material misstatement of the consolidated financial statements, whether due to error or fraud, and performing procedures that respond to those risks. Such procedures included examining, on a test basis, evidence regarding the amounts and disclosures in the consolidated financial statements. Our audits also included evaluating the accounting principles used and significant estimates made by management, as well as evaluating the overall presentation of the consolidated financial statements. Our audit of internal control over financial reporting included obtaining an understanding of internal control over financial reporting, assessing the risk that a material weakness exists, and testing and evaluating the design and operating effectiveness of internal control based on the assessed risk. Our audits also included performing such other procedures as we considered necessary in the circumstances. We believe that our audits provide a reasonable basis for our opinions.
Definition and Limitations of Internal Control over Financial Reporting
A company’s internal control over financial reporting is a process designed to provide reasonable assurance regarding the reliability of financial reporting and the preparation of financial statements for external purposes in accordance with generally accepted accounting principles. A company’s internal control over financial reporting includes those policies and procedures that (i) pertain to the maintenance of records that, in reasonable detail, accurately and fairly reflect the transactions and dispositions of the assets of the company; (ii) provide reasonable assurance that transactions are recorded as necessary to permit preparation of financial statements in accordance with generally accepted accounting principles, and that receipts and expenditures of the company are being made only in accordance with authorizations of management and directors of the company; and (iii) provide reasonable assurance regarding prevention or timely detection of unauthorized acquisition, use, or disposition of the company’s assets that could have a material effect on the financial statements.

111
Because of its inherent limitations, internal control over financial reporting may not prevent or detect misstatements. Also, projections of any evaluation of effectiveness to future periods are subject to the risk that controls may become inadequate because of changes in conditions, or that the degree of compliance with the policies or procedures may deteriorate.
Critical Audit Matters
The critical audit matters communicated below are matters arising from the current period audit of the consolidated financial statements that were communicated or required to be communicated to the audit committee and that (i) relate to accounts or disclosures that are material to the consolidated financial statements and (ii) involved our especially challenging, subjective, or complex judgments. The communication of critical audit matters does not alter in any way our opinion on the consolidated financial statements, taken as a whole, and we are not, by communicating the critical audit matters below, providing separate opinions on the critical audit matters or on the accounts or disclosures to which they relate.
Fair Value of Equity Investment in Rothmans, Benson & Hedges Inc. ("RBH")
As described in Note 22 to the consolidated financial statements, the Company recorded the fair value of its continuing investment in RBH of $3.28 billion within Investments in unconsolidated subsidiaries and equity securities in the consolidated balance sheets. This investment was recorded as of March 22, 2019, which represented the fair value at the date of deconsolidation. The estimated fair value of the underlying business was determined based on an income approach using a discounted cash flow analysis, as well as a market approach for certain contingent liabilities. The discounted cash flow analysis and market approach include management assumptions relevant for forecasting operating cash flows, which are subject to changes in business conditions, such as volumes, pricing, the terminal growth rate, discount rates, inflation scenarios, and other strategic plans. The difference between the carrying value of the assets and liabilities of RBH that were deconsolidated and the fair value of the continuing investment was recorded as a $239 million pre-tax loss on deconsolidation within marketing, administration and research costs on the Company’s consolidated statement of earnings.
The principal considerations for our determination that performing procedures relating to the deconsolidation of RBH is a critical audit matter are that there was significant judgment by management required when developing the fair value measurement of the continuing investment in RBH. This led to a high degree of auditor subjectivity, judgment and effort in performing procedures and evaluating the estimated fair value of RBH which included significant assumptions related to the terminal growth rate, discount rates, inflation scenarios, and operating cash flow projections; and to evaluate management's estimate of the value of certain contingent liabilities. The audit effort involved the use of professionals with specialized skill and knowledge to assist in evaluating the audit evidence obtained from these procedures.
Addressing the matter involved performing procedures and evaluating audit evidence in connection with forming our overall opinion on the consolidated financial statements. These procedures included testing the effectiveness of controls relating to the estimated fair value of the RBH investment, including controls over the discounted cash flow analysis and market approach, input data and key assumptions utilized in determination of the fair value. These procedures also included, among others, testing management’s process for determining the fair value of the continuing investment in RBH as of the date of deconsolidation. This included evaluating the appropriateness of the discounted cash flow analysis and market approach to value the contingent liabilities including the reasonableness of the input data and significant assumptions used by management in developing the fair value measurement including the terminal growth rate, discount rates, inflation scenarios, operating cash flow projections, market size and market share data. Professionals with specialized skill and knowledge were used to assist in evaluating the Company’s discounted cash flow analysis and market approach, and evaluation of significant assumptions, including the terminal growth rate, discount rates and inflation scenarios utilized by the Company. Evaluating whether the significant assumptions were reasonable involved considering (i) the past performance of the associated Canadian reporting unit, and (ii) whether they were consistent with evidence obtained in other areas of the audit.
Smoking and Health and Health Care Cost Recovery Contingencies
As described in Note 18 to the consolidated financial statements, the Company has 77 smoking and health cases and health care cost recovery actions pending. The Company records provisions in the consolidated financial statements for pending litigation when they determine that an unfavorable outcome is probable and the amount of the loss can be reasonably estimated. Except as stated otherwise in Note 18, while it is reasonably possible that an unfavorable outcome in a case may occur, after assessing the information available, (i) management has not concluded that it is probable that a loss has been incurred in any of the pending smoking and health and health care cost recovery tobacco-related cases; (ii) management is unable to estimate the possible loss or range of loss for any of the pending smoking and health and health care cost recovery tobacco-related cases; and (iii) accordingly, no estimated loss has been accrued in the consolidated financial statements for unfavorable outcomes in these cases, if any.
The principal considerations for our determination that performing procedures relating to smoking and health and health care cost recovery contingencies is a critical audit matter are that there was significant judgment by management when determining the probability of a loss being incurred and an estimate of the amount or range of the potential loss for each case, which in turn led to a high degree of auditor

112
subjectivity, judgment and effort in evaluating management’s assessment related to the loss contingencies associated with smoking and health and health care cost recovery related claims.
Addressing the matter involved performing procedures and evaluating audit evidence in connection with forming our overall opinion on the consolidated financial statements. These procedures included testing the effectiveness of controls relating to management’s evaluation of smoking and health and health care cost recovery litigation matters, including controls over determining the probability and range of loss as well as financial statement disclosures. These procedures also included, among others, evaluating the completeness of the Company’s description of smoking and health and health care cost recovery contingencies, obtaining and evaluating the letters of audit inquiry with external and internal legal counsel, evaluating the reasonableness of management’s assessment regarding whether an unfavorable outcome is reasonably possible or probable and reasonably estimable, and evaluating the sufficiency of the Company’s smoking and health and health care cost recovery contingencies disclosures.
/S/ PRICEWATERHOUSECOOPERS SAPricewaterhouseCoopers SA
/S/ CHAD MUELLER /S/ CLAUDIA BENZChad Mueller Claudia Benz
Lausanne, SwitzerlandFebruary 7, 2020
PricewaterhouseCoopers SA has served as the Company’s auditor since 2008.
113
Report of Management on Internal Control Over Financial Reporting Management of Philip Morris International Inc. (“PMI”) is responsible for establishing and maintaining adequate internal control over financial reporting as defined in Rules 13a-15(f) and 15d-15(f) under the Securities Exchange Act of 1934, as amended. PMI’s internal control over financial reporting is a process designed to provide reasonable assurance regarding the reliability of financial reporting and the preparation of financial statements for external purposes in accordance with accounting principles generally accepted in the United States of America. Internal control over financial reporting includes those written policies and procedures that:
• pertain to the maintenance of records that, in reasonable detail, accurately and fairly reflect the transactions and dispositions of the assets of PMI;
• provide reasonable assurance that transactions are recorded as necessary to permit preparation of financial statements in accordance with accounting principles generally accepted in the United States of America;
• provide reasonable assurance that receipts and expenditures of PMI are being made only in accordance with the authorization of management and directors of PMI; and
• provide reasonable assurance regarding prevention or timely detection of unauthorized acquisition, use or disposition of assets that could have a material effect on the consolidated financial statements.
Internal control over financial reporting includes the controls themselves, monitoring and internal auditing practices and actions taken to correct deficiencies as identified.
Because of its inherent limitations, internal control over financial reporting may not prevent or detect misstatements. Also, projections of any evaluation of effectiveness to future periods are subject to the risk that controls may become inadequate because of changes in conditions, or that the degree of compliance with the policies or procedures may deteriorate.
Management assessed the effectiveness of PMI’s internal control over financial reporting as of December 31, 2019. Management based this assessment on criteria for effective internal control over financial reporting described in Internal Control — Integrated Framework (2013) issued by the Committee of Sponsoring Organizations of the Treadway Commission. Management’s assessment included an evaluation of the design of PMI’s internal control over financial reporting and testing of the operational effectiveness of its internal control over financial reporting. Management reviewed the results of its assessment with the Audit Committee of our Board of Directors.
Based on this assessment, management determined that, as of December 31, 2019, PMI maintained effective internal control over financial reporting.
PricewaterhouseCoopers SA, an independent registered public accounting firm, who audited and reported on the consolidated financial statements of PMI included in this report, has audited the effectiveness of PMI’s internal control over financial reporting as of December 31, 2019, as stated in their report herein.
February 7, 2020

114
Item 9. Changes in and Disagreements with Accountants on Accounting and Financial Disclosure. None.
Item 9A. Controls and Procedures. PMI carried out an evaluation, with the participation of PMI’s management, including PMI’s Chief Executive Officer and Chief Financial Officer, of the effectiveness of PMI’s disclosure controls and procedures (as defined in Rule 13a-15(e) under the Securities Exchange Act of 1934, as amended) as of the end of the period covered by this report. Based upon that evaluation, PMI’s Chief Executive Officer and Chief Financial Officer concluded that PMI’s disclosure controls and procedures are effective. There have been no changes in PMI’s internal control over financial reporting during the most recent fiscal quarter that have materially affected, or are reasonably likely to materially affect, PMI’s internal control over financial reporting. The Report of Management on Internal Control over Financial Reporting and the Report of Independent Registered Public Accounting Firm are included in Item 8.
Item 9B. Other Information. None.
PART III Except for the information relating to the executive officers set forth in Item 10 and the information relating to equity compensation plans set forth in Item 12, the information called for by Items 10-14 is hereby incorporated by reference to PMI’s definitive proxy statement for use in connection with its annual meeting of stockholders to be held on May 6, 2020, that will be filed with the SEC on or about March 26, 2020 (the “proxy statement”), and, except as indicated therein, made a part hereof.

115
Item 10. Directors, Executive Officers and Corporate Governance. Information About Our Executive Officers as of February 6, 2020:
Name Office AgeAndré Calantzopoulos Chief Executive Officer 62Massimo Andolina Senior Vice President, Operations 51Drago Azinovic President, Middle East & Africa Region and PMI Duty Free 57Werner Barth Senior Vice President, Commercial 55Charles Bendotti Senior Vice President, People and Culture 47Frank de Rooij Vice President, Treasury and Corporate Finance 54Frederic de Wilde President, European Union Region 52Marc S. Firestone President, External Affairs and General Counsel 60Stacey Kennedy President, South and Southeast Asia Region 47Martin G. King Chief Financial Officer 55Michael Kunst Senior Vice President, Commercial Transformation 51Andreas Kurali Vice President and Controller 54Bin Li Chief Product Officer 48Marco Mariotti President, Eastern Europe Region 55Mario Masseroli President, Latin America & Canada Region 49Deepak Mishra Chief Strategy Officer 48John O'Mullane Chief Life Sciences Officer 66Jacek Olczak Chief Operating Officer 55Paul Riley President, East Asia and Australia Region 54Marian Salzman Senior Vice President, Global Communications 61Jaime Suarez Chief Digital Officer 46Michael Voegele Chief Technology Officer 47Stefano Volpetti Chief Consumer Officer 48Jerry E. Whitson Deputy General Counsel and Corporate Secretary 64Miroslaw Zielinski Chief New Ventures Officer 58
All of the above-mentioned officers, except Ms. Salzman, Mr. Mishra, Mr. Kunst, Mr. Voegele, Mr. O'Mullane, Mr. Volpetti and Mr. Li, have been employed by us in various capacities during the past five years.
Before joining Philip Morris International Inc. in April 2018, Ms. Salzman headed Havas PR North America, where she had served as Chief Executive Officer from 2011.
Before joining Philip Morris International Inc. in September 2018, Mr. Mishra was Managing Director, Portfolio Operations at Centerbridge Partners, a private equity firm, from 2014, where he led commercial, operational and digital transformation in various business sectors. From 2001 to 2014, Mr. Mishra was Partner and part of the Consumer Goods, Retail and Operations leadership team of McKinsey & Co, where he supported clients in their transformation projects.
Before joining Philip Morris International Inc. in January 2019, Mr. Kunst was Partner at Bain & Company from 2009, most recently working with us on our transformation projects.
Before joining Philip Morris International Inc. in February 2019, Mr. Voegele had served in various senior capacities at Adidas Group from 2011, most recently, as Global CIO and part of the core leadership team at Adidas Group.
Before joining Philip Morris International Inc. in May 2019, Mr. O'Mullane was Global Head SVP Innovation and Development for Consumer Health at Bayer AG from 2014.

116
Before joining Philip Morris International Inc. in June 2019, Mr. Volpetti served in various executive capacities at the Procter & Gamble Company from 1996, most recently, as Vice President of a global business unit. He also served as Chief Marketing Officer at Luxottica Group S.p.A. in 2015.
Before joining Philip Morris International Inc. in August 2019, Mr. Li served in various executive capacities at Harman International, a subsidiary of Samsung Electronics Co. Ltd., from 2010, most recently, as Senior Vice President and General Manager, Consumer Audio Product Development and Operations.
Codes of Conduct and Corporate Governance We have adopted the Philip Morris International Code of Conduct, which complies with requirements set forth in Item 406 of Regulation S-K. This Code of Conduct applies to all of our employees, including our principal executive officer, principal financial officer, principal accounting officer or controller, and persons performing similar functions. We have also adopted a code of business conduct and ethics that applies to the members of our Board of Directors. These documents are available free of charge on our website at www.pmi.com. In addition, we have adopted corporate governance guidelines and charters for our Audit, Finance, Compensation and Leadership Development, Product Innovation and Regulatory Affairs and Nominating and Corporate Governance committees of the Board of Directors. All of these documents are available free of charge on our website at www.pmi.com. Any waiver granted by Philip Morris International Inc. to its principal executive officer, principal financial officer or controller or any person performing similar functions under the Code of Conduct, or certain amendments to the Code of Conduct, will be disclosed on our website at www.pmi.com. The information on our website is not, and shall not be deemed to be, a part of this Report or incorporated into any other filings made with the SEC. Also refer to Board Operations and Governance—Committees of the Board, Election of Directors—Process for Nominating Directors and Election of Directors—Director Nominees and Delinquent Section 16(a) Reports sections of the proxy statement.
Item 11. Executive Compensation. Refer to Compensation Discussion and Analysis and Compensation of Directors sections of the proxy statement.
Item 12. Security Ownership of Certain Beneficial Owners and Management and Related Stockholder Matters.
The number of shares to be issued upon exercise or vesting and the number of shares remaining available for future issuance under PMI’s equity compensation plans at December 31, 2019, were as follows:
Number of Securitiesto be Issued upon
Exercise of OutstandingOptions and Vesting of
RSUs and PSUs(a)
Weighted AverageExercise Price of
Outstanding Options (b)
Number of SecuritiesRemaining Available forFuture Issuance Under
Equity Compensation Plans(excluding Securities
reflected in column (a))(c)
Equity compensation plans approved by stockholders 6,289,960 (1) $ — 21,081,444
(1) Represents 3,725,870 shares of common stock that may be issued upon vesting of the restricted share units and 2,564,090 shares that may be issued upon vesting of the performance share units if maximum performance targets are achieved for each performance cycle. PMI has not granted options since the spin-off from Altria on March 28, 2008.
Also refer to Stock Ownership Information—Ownership of Equity Securities section of the proxy statement.

117
Item 13. Certain Relationships and Related Transactions, and Director Independence. Refer to Related Person Transactions and Code of Conduct and Election of Directors—Independence of Nominees sections of the proxy statement.
Item 14. Principal Accounting Fees and Services. Refer to Audit Committee Matters section of the proxy statement.

118
PART IV
Item 15. Exhibits and Financial Statement Schedules. (a) Index to Consolidated Financial Statements and Schedules
PageConsolidated Statements of Earnings for the years ended December 31, 2019, 2018 and 2017 53Consolidated Statements of Comprehensive Earnings for the years ended December 31, 2019, 2018 and 2017 54Consolidated Balance Sheets at December 31, 2019 and 2018 55 - 56Consolidated Statements of Cash Flows for the years ended December 31, 2019, 2018 and 2017 57 - 58Consolidated Statements of Stockholders’ (Deficit) Equity for the years ended December 31, 2019, 2018 and 2017 59Notes to Consolidated Financial Statements 60 - 109Report of Independent Registered Public Accounting Firm 110 - 112Report of Management on Internal Control Over Financial Reporting 113
Schedules have been omitted either because such schedules are not required or are not applicable.
(b) The following exhibits are filed as part of this Report:
2.1 — Distribution Agreement between Altria Group, Inc. and Philip Morris International Inc. dated January 30, 2008 (incorporated by reference to Exhibit 2.1 to the Registration Statement on Form 10 filed February 7, 2008).
3.1 — Amended and Restated Articles of Incorporation of Philip Morris International Inc. (incorporated by reference to Exhibit 3.1 to the Registration Statement on Form 10 filed February 7, 2008).
3.2 — Amended and Restated By-Laws of Philip Morris International Inc., effective as of March 7, 2019 (incorporated by reference to Exhibit 3.1 to the Current Report on Form 8-K filed March 7, 2019).
4.1 — Specimen Stock Certificate of Philip Morris International Inc. (incorporated by reference to Exhibit 4.1 to the Registration Statement on Form 10 filed February 7, 2008).
4.2 — Indenture dated as of April 25, 2008, between Philip Morris International Inc. and HSBC Bank USA, National Association, as Trustee (incorporated by reference to Exhibit 4.3 to the Registration Statement on Form S-3, dated April 25, 2008).
4.3 — Description of Common Stock.4.4 — Description of Debt Securities.
4.6 — The Registrant agrees to furnish copies of any instruments defining the rights of holders of long-term debt of the Registrant and its consolidated subsidiaries that does not exceed 10 percent of thetotal assets of the Registrant and its consolidated subsidiaries to the Commission upon request.
10.1 — Employee Matters Agreement between Altria Group, Inc. and Philip Morris International Inc., dated as of March 28, 2008 (incorporated by reference to Exhibit 10.2 to the Current Report on Form 8-K filed March 31, 2008).
10.2 — Intellectual Property Agreement between Philip Morris International Inc. and Philip Morris USA Inc., dated as of January 1, 2008 (incorporated by reference to Exhibit 10.4 to the Registration Statement on Form 10 filed March 5, 2008).

119
10.3 — Credit Agreement relating to a US$3,500,000,000 Revolving Credit Facility (including a US$800,000,000 swingline option) dated as of October 25, 2011, among Philip Morris International Inc. and the Initial Lenders named therein and Citibank International plc, as Facility Agent, and Citibank, N.A., as Swingline Agent, and Citigroup Global Markets Limited, Barclays Capital, BNP Paribas, Credit Suisse AG, Cayman Islands Branch, Deutsche Bank Securities Inc., Goldman Sachs International, HSBC Bank PLC, J.P. Morgan Limited, RBS Securities Inc. and Société Générale as Mandated Lead Arrangers and Bookrunners (incorporated by reference to Exhibit 10.1 to the Current Report on Form 8-K filed October 26, 2011).
10.4 __ Amendment No. 1, dated as of August 31, 2012, to the Credit Agreement, dated as of October 25, 2011, among Philip Morris International Inc., the lenders named therein and Citibank International plc, as Facility Agent (incorporated by reference to Exhibit 10.6 to the Quarterly Report on Form 10-Q for the quarter ended September 30, 2012).
10.5 __ Credit Agreement, dated as of February 12, 2013, among Philip Morris International Inc., the lenders named therein and Citibank Europe PLC, UK Branch (formerly, The Royal Bank of Scotland plc), as Administrative Agent (incorporated by reference to Exhibit 10.1 to the Current Report on Form 8-K filed February 15, 2013).
10.6 __ Extension Agreement, effective February 7, 2017, to the Credit Agreement, dated as of February 12, 2013, among Philip Morris International Inc., the lenders party thereto, Citibank Europe PLC, UK Branch (formerly, Citibank International Limited), as administrative agent (incorporated by reference to Exhibit 10.1 to the Current Report on Form 8-K filed January 30, 2017).
10.7 __ Extension Agreement, effective January 31, 2014, to Credit Agreement, dated as of February 12, 2013, among Philip Morris International Inc., the lenders party thereto and Citibank Europe PLC, UK Branch (formerly, The Royal Bank of Scotland plc), as Administrative Agent (incorporated by reference to Exhibit 10.3 to the Quarterly Report on Form 10-Q for the quarter ended March 31, 2014).
10.8 __ Credit Agreement, dated as of February 28, 2014, among Philip Morris International Inc., the lenders named therein, J.P. Morgan Europe Limited, as Facility Agent, and JPMorgan Chase Bank, N.A., as Swingline Agent (incorporated by reference to Exhibit 10.1 to the Current Report on Form 8-K filed March 3, 2014).
10.9 __ Extension Agreement, effective as of February 10, 2015, to Credit Agreement dated as of February 12, 2013, among Philip Morris International Inc., the lenders named therein and Citibank Europe PLC, UK Branch (formerly, The Royal Bank of Scotland plc), as Administrative Agent (incorporated by reference to Exhibit 10.1 to the Current Report on Form 8-K filed January 29, 2015).
10.10 __ Extension Agreement, effective as of February 28, 2015, to the Credit Agreement, dated as of February 28, 2014, among Philip Morris International Inc., the lenders named therein, J.P. Morgan Europe Limited, as Facility Agent, and JPMorgan Chase Bank, N.A. as Swingline Agent (incorporated by reference to Exhibit 10.2 to the Current Report on Form 8-K filed January 29, 2015).
10.11 __ Amendment No. 1, dated as of July 20, 2015, to the Credit Agreement, dated as of February 12, 2013, among Philip Morris International Inc., the lenders named therein, The Royal Bank of Scotland plc, as resigning administrative agent, and Citibank Europe PLC, UK Branch (formerly, Citibank International Limited), as successor administrative agent (incorporated by reference to Exhibit 10.52 to the Annual Report on Form 10-K for the year ended December 31, 2015).
10.12 — Credit Agreement, dated as of October 1, 2015, among Philip Morris International Inc., the lenders named therein, Citibank Europe PLC, UK Branch (formerly, Citibank International Limited), as Facility Agent, and Citibank, N.A., as Swingline Agent (incorporated by reference to Exhibit 10.1 to the Current Report on Form 8-K filed October 5, 2015).
10.13 — Amendment No. 2, effective as of February 9, 2016, to the Credit Agreement dated as of February 12, 2013, with the lenders named therein and Citibank Europe PLC, UK Branch (formerly, Citibank International Limited), as administrative agent (incorporated by reference to Exhibit 10.1 to the Current Report on Form 8-K filed January 28, 2016).

120
10.14 — Extension Agreement, effective as of February 28, 2016, to the Credit Agreement, dated as of February 28, 2014, among Philip Morris International Inc., each lender named therein, J.P. Morgan Europe Limited, as facility agent, and JPMorgan Chase Bank, N.A., as swingline agent (incorporated by reference to Exhibit 10.2 to the Current Report on Form 8-K filed January 28, 2016).
10.15 — Extension Agreement, effective as of October 1, 2016, to the Credit Agreement dated as of October 1, 2015, among Philip Morris International Inc., lenders named therein, Citibank Europe PLC, UK Branch (formerly, Citibank International Limited), as facility agent, and Citibank, N.A., as swingline agent (incorporated by reference to Exhibit 10.1 to the Current Report on Form 8-K filed August 31, 2016).
10.16 — Extension Agreement, effective as of October 1, 2017, to the Credit Agreement, dated as of October 1, 2015, among Philip Morris International Inc., the lenders party thereto and Citibank Europe PLC, UK Branch (formerly, Citibank International Limited), as facility agent, and Citibank N.A., as swingline agent (incorporated by reference to Exhibit 10.1 to the Current Report on Form 8-K filed August 29, 2017).
10.17 — Extension Agreement, effective as of February 6, 2018, to the Credit Agreement, dated as of February 12, 2013, among Philip Morris International Inc., the lenders named therein, Citibank Europe PLC, UK Branch (formerly, Citibank International Limited), as administrative agent (incorporated by reference to Exhibit 10.1 to the Current Report on Form 8-K filed January 29, 2018).
10.18 — Extension Agreement, effective as of February 5, 2019, to the Credit Agreement dated as of February 12, 2013, among Philip Morris International Inc., the lenders named therein, Citibank Europe PLC, UK Branch (formerly, Citibank International Limited), as administrative agent (incorporated by reference to Exhibit 10.1 to the Current Report on Form 8-K filed January 29, 2019).
10.19 — Philip Morris International Inc. Automobile Policy (incorporated by reference to Exhibit 10.8 to the Registration Statement on Form 10 filed February 7, 2008).*
10.20 — Philip Morris International Inc. Amended and Restated Automobile Policy, dated as of October 1, 2019.*
10.21 — Philip Morris International Benefit Equalization Plan, amended and restated (incorporated by reference to Exhibit 10.2 to the Quarterly Report on Form 10-Q for the quarter ended March 31, 2019).*
10.22 — Philip Morris International Inc. 2012 Performance Incentive Plan, effective May 9, 2012 (incorporated by reference to Exhibit A to the Definitive Proxy Statement filed on March 30, 2012).*
10.23 — Philip Morris International Inc. 2017 Performance Incentive Plan, effective May 3, 2017 (incorporated by reference to Exhibit B to the Definitive Proxy Statement filed on March 23, 2017).*
10.24 — Pension Fund of Philip Morris in Switzerland (IC) (incorporated by reference to Exhibit 10.2 to the Quarterly Report on Form 10-Q for the quarter ended March 31, 2015).*
10.25 — Summary of Supplemental Pension Plan of Philip Morris in Switzerland (incorporated by reference to Exhibit 10.1 to the Quarterly Report on Form 10-Q for the quarter ended June 30, 2015).*
10.26 — Form of Restated Employee Grantor Trust Enrollment Agreement (Executive Trust Arrangement) (incorporated by reference to Exhibit 10.18 to the Registration Statement on Form 10 filed February 7, 2008).*
10.27 — Form of Restated Employee Grantor Trust Enrollment Agreement (Secular Trust Arrangement) (incorporated by reference to Exhibit 10.19 to the Registration Statement on Form 10 filed February 7, 2008).*
10.28 — Philip Morris International Inc. 2017 Stock Compensation Plan for Non-Employee Directors (as amended and restated as of January 1, 2018) (incorporated by reference to Exhibit 10.26 to the Annual Report on Form 10-K for the year ended December 31, 2017).*
10.29 — Philip Morris International Inc. 2008 Deferred Fee Plan for Non-Employee Directors (incorporated by reference to Exhibit 10.21 to the Registration Statement on Form 10 filed February 7, 2008).*
121
10.30 — Supplemental Letter to the Employment Agreement (as amended) with André Calantzopoulos (incorporated by reference to Exhibit 10.4 to the Quarterly Report on Form 10-Q for the quarter ended March 31, 2017). The Employment Agreement was previously filed as Exhibit 10.22 to the Registration Statement on Form 10 filed February 7, 2008 and is incorporated by reference to this Exhibit 10.30. The Amendment to the Employment Agreement was previously filed as Exhibit 10.1 to the Current Report on Form 8-K/A filed June 13, 2013, and is incorporated by reference to this Exhibit 10.30.*
10.31 — Supplemental Letter to Employment Agreement with Marc S. Firestone (incorporated by reference to Exhibit 10.5 to the Quarterly Report on Form 10-Q for the quarter ended March 31, 2017). The Employment Agreement was previously filed as Exhibit 10.1 to the Quarterly Report on Form 10-Q for the quarter ended March 31, 2013 and is incorporated by reference to this Exhibit 10.31. The Amendment to the Employment Agreement was previously filed as Exhibit 10.25 to the Annual Report on Form 10-K for the year ended December 31, 2013, and is incorporated by reference to this Exhibit 10.31.*
10.32 — Employment Agreement,with Martin G. King, as of January 1, 2018 (incorporated by reference to Exhibit 10.30 to the Annual Report on Form 10-K for the year ended December 31, 2017).*
10.33 — Supplemental Letter to the Employment Agreement (as amended) with Jacek Olczak (incorporated by reference to Exhibit 10.1 to the Quarterly Report on Form 10-Q for the quarter ended June 30, 2019. The Employment Agreement was previously filed as Exhibit 10.4 to the Quarterly Report on Form 10-Q for the quarter ended June 30, 2012, and is incorporated by reference to this Exhibit 10.33. The Amendment to the Employment Agreement was previously filed as Exhibit 10.33 to the Annual Report on Form 10-K for the year ended December 31, 2013 and is incorporated by reference to this Exhibit 10.33.*
10.34 — Supplemental Letter to the Employment Agreement (as amended) with Miroslaw Zielinski (incorporated by reference to Exhibit 10.2 to the Quarterly Report on Form 10-Q for the quarter ended June 30, 2019). The Employment Agreement was previously filed as Exhibit 10.2 to the Quarterly Report on Form 10-Q for the quarter ended March 31, 2013 and is incorporated by reference to this Exhibit 10.34. The Amendment to the Employment Agreement was previously filed as Exhibit 10.28 to the Annual Report on Form 10-K for the year ended December 31, 2013 and is incorporated by reference to this Exhibit 10.34.*
10.35 — Time Sharing Agreement between PMI Global Services Inc. and Louis C. Camilleri dated August 18, 2010 (incorporated by reference to Exhibit 10.1 to the Current Report on Form 8-K filed August 19, 2010).*
10.36 — Time Sharing Agreement between PMI Global Services Inc. and André Calantzopoulos, dated May 8, 2013 (incorporated by reference to Exhibit 10.1 to the Quarterly Report on Form 10-Q for the quarter ended June 30, 2013).*
10.37 — Amendment No. 1 to the Time Sharing Agreement between PMI Global Services Inc. and André Calantzopoulos, dated December 23, 2014 (incorporated by reference to Exhibit 10.36 to the Annual Report on Form 10-K for the year ended December 31, 2014).*
10.38 — Termination of the Time Sharing Agreement between PMI Global Services Inc. and André Calantzopoulos, dated November 12, 2019.*
10.39 — Agreement with Louis C. Camilleri (incorporated by reference to Exhibit 10.25 to the Registration Statement on Form 10 filed February 7, 2008).*
10.40 — Amended and Restated Supplemental Management Employees’ Retirement Plan (incorporated by reference to Exhibit 10.27 to the Annual Report on Form 10-K for the year ended December 31, 2008).*
10.41 — Supplemental Equalization Plan, amended and restated as of June 29, 2015 (incorporated by reference to Exhibit 10.2 to the Quarterly Report on Form 10-Q for the quarter ended June 30, 2015).*
10.42 — Form of Supplemental Equalization Plan Employee Grantor Trust Enrollment Agreement (Secular Trust) (incorporated by reference to Exhibit 10.31 to the Annual Report on Form 10-K for the year ended December 31, 2008).*
122
10.43 — Form of Supplemental Equalization Plan Employee Grantor Trust Enrollment Agreement (Executive Trust) (incorporated by reference to Exhibit 10.32 to the Annual Report on Form 10-K for the year ended December 31, 2008).*
10.44 — Philip Morris International Inc. Form of Indemnification Agreement with Directors and Executive Officers (incorporated by reference to Exhibit 10.1 to the Current Report on Form 8-K filed September 18, 2009).*
10.45 — Form of Deferred Stock Agreement (2015 Grants) (incorporated by reference to Exhibit 10.1 to the Current Report on Form 8-K filed February 10, 2015).*
10.46 — Philip Morris International Inc. Tax Return Preparation Services Policy (incorporated by reference to Exhibit 10.51 to the Annual Report on Form 10-K for the year ended December 31, 2014).*
10.47 — Form of Restricted Stock Unit Agreement (2017 Grants) (incorporated by reference to Exhibit 10.1 to the Current Report on Form 8-K filed February 7, 2017).*
10.48 — Form of Performance Share Unit Agreement (2017 Grants) (incorporated by reference to Exhibit 10.2 to the Current Report on Form 8-K filed February 7, 2017).*
10.49 — Form of Restricted Stock Unit Agreement (2018 Grants) (incorporated by reference to Exhibit 10.1 to the Current Report on Form 8-K filed February 13, 2018).*
10.50 — Form of Performance Share Unit Agreement (2018 Grants) (incorporated by reference to Exhibit 10.2 to the Current Report on Form 8-K filed February 13, 2018).*
10.51 — Form of Restricted Stock Unit Agreement (2019 Grants) (incorporated by reference to Exhibit 10.1 to the Current Report on Form 8-K filed February 12, 2019).*
10.52 — Form of Performance Share Unit Agreement (2019 Grants) (incorporated by reference to Exhibit 10.2 to the Current Report on Form 8-K filed February 12, 2019).*
21 — Subsidiaries of Philip Morris International Inc.23 — Consent of independent registered public accounting firm.24 — Powers of attorney.
31.1 — Certification of the Registrant’s Chief Executive Officer pursuant to Rule 13a-14(a)/15d-14(a) of the Securities Exchange Act of 1934, as amended, as adopted pursuant to Section 302 of the Sarbanes-Oxley Act of 2002.
31.2 — Certification of the Registrant’s Chief Financial Officer pursuant to Rule 13a-14(a)/15d-14(a) of the Securities Exchange Act of 1934, as amended, as adopted pursuant to Section 302 of the Sarbanes-Oxley Act of 2002.
32.1 — Certification of the Registrant’s Chief Executive Officer pursuant to 18 U.S.C. 1350, as adopted pursuant to Section 906 of the Sarbanes-Oxley Act of 2002.
32.2 — Certification of the Registrant’s Chief Financial Officer pursuant to 18 U.S.C. 1350, as adopted pursuant to Section 906 of the Sarbanes-Oxley Act of 2002.
101.INS — XBRL Instance Document - the instance document does not appear in the Interactive Data File becauseits XBRL tags are embedded within the Inline XBRL document.
101.SCH — XBRL Taxonomy Extension Schema.
101.CAL — XBRL Taxonomy Extension Calculation Linkbase.101.DEF — XBRL Taxonomy Extension Definition Linkbase.101.LAB — XBRL Taxonomy Extension Label Linkbase.101.PRE — XBRL Taxonomy Extension Presentation Linkbase.
104 — Cover Page Interactive Data File (formatted as Inline XBRL and contained in Exhibit 101) * Denotes management contract or compensatory plan or arrangement in which directors or executive officers are eligible to
participate.

123
SIGNATURES Pursuant to the requirements of Section 13 or 15(d) of the Securities Exchange Act of 1934, the registrant has duly caused this report to be signed on its behalf by the undersigned, thereunto duly authorized.
PHILIP MORRIS INTERNATIONAL INC.
By: /s/ ANDRÉ CALANTZOPOULOS
(André CalantzopoulosChief Executive Officer)
Date: February 7, 2020 Pursuant to the requirements of the Securities Exchange Act of 1934, this report has been signed below by the following persons on behalf of the registrant and in the capacities and on the date indicated:
Signature Title Date
/s/ ANDRÉ CALANTZOPOULOS Chief Executive Officer February 7, 2020
(André Calantzopoulos)
/s/ MARTIN G. KING Chief Financial Officer February 7, 2020
(Martin G. King)
/s/ ANDREAS KURALIVice President and Controller February 7, 2020
(Andreas Kurali)
*LOUIS C. CAMILLERI,MASSIMO FERRAGAMO, WERNER GEISSLER,LISA A. HOOK,JENNIFER LI,JUN MAKIHARA, KALPANA MORPARIA,LUCIO A. NOTO,FREDERIK PAULSEN,ROBERT B. POLET,STEPHEN M. WOLF
Directors
*By: /s/ ANDRÉ CALANTZOPOULOS February 7, 2020(André Calantzopoulos
Attorney-in-fact)
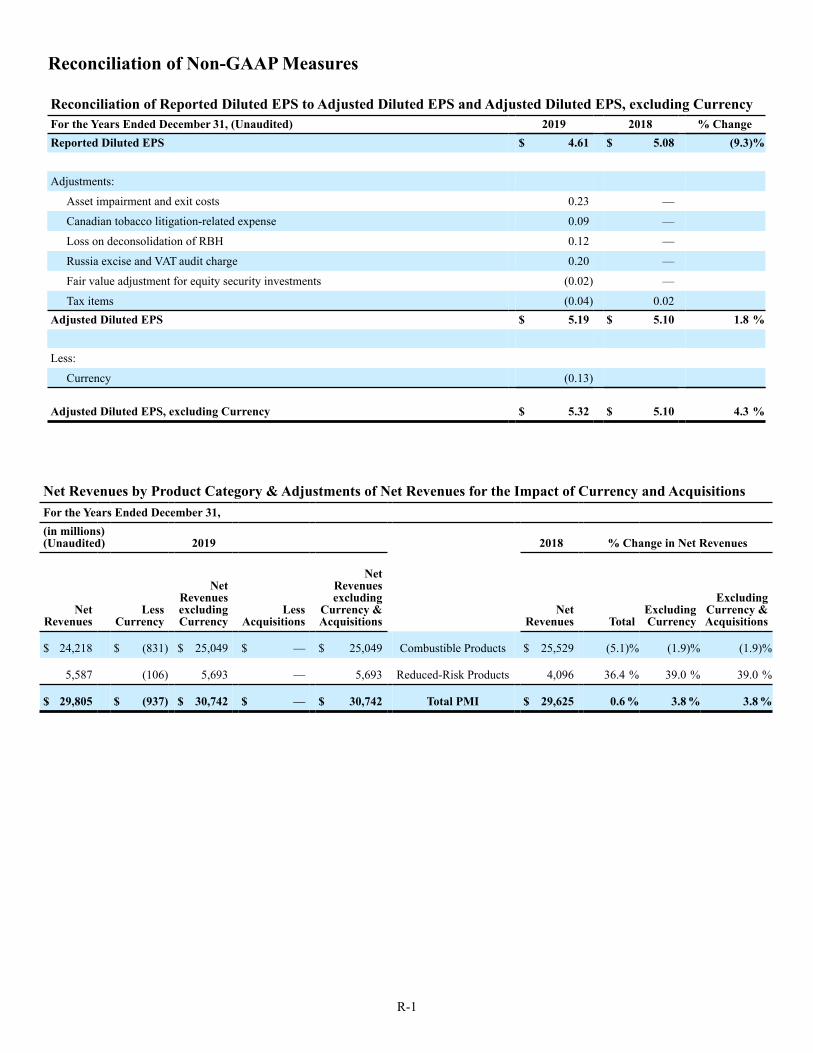
R-1
Reconciliation of Non-GAAP Measures
Reconciliation of Reported Diluted EPS to Adjusted Diluted EPS and Adjusted Diluted EPS, excluding CurrencyFor the Years Ended December 31, (Unaudited) 2019 2018 % ChangeReported Diluted EPS $ 4.61 $ 5.08 (9.3)%
Adjustments:
Asset impairment and exit costs 0.23 —
Canadian tobacco litigation-related expense 0.09 —
Loss on deconsolidation of RBH 0.12 —
Russia excise and VAT audit charge 0.20 —
Fair value adjustment for equity security investments (0.02) —
Tax items (0.04) 0.02Adjusted Diluted EPS $ 5.19 $ 5.10 1.8 %
Less:
Currency (0.13)
Adjusted Diluted EPS, excluding Currency $ 5.32 $ 5.10 4.3 %
Net Revenues by Product Category & Adjustments of Net Revenues for the Impact of Currency and AcquisitionsFor the Years Ended December 31,(in millions)(Unaudited) 2019 2018 % Change in Net Revenues
Net Revenues
LessCurrency
Net Revenues excluding Currency
LessAcquisitions
Net Revenues excluding
Currency & Acquisitions
Net Revenues Total
Excluding Currency
Excluding Currency & Acquisitions
$ 24,218 $ (831) $ 25,049 $ — $ 25,049 Combustible Products $ 25,529 (5.1)% (1.9)% (1.9)%
5,587 (106) 5,693 — 5,693 Reduced-Risk Products 4,096 36.4 % 39.0 % 39.0 %
$ 29,805 $ (937) $ 30,742 $ — $ 30,742 Total PMI $ 29,625 0.6 % 3.8 % 3.8 %

R-2
Adjustments for the Impact of RBH, excluding Currency
For the Years Ended December 31, (in millions, except per share data) (Unaudited) 2019 2018%
Change
Net Revenues $ 29,805 $ 29,625 0.6 %
Net Revenues attributable to RBH (742) (1)
Net Revenues 29,805 28,883 (2) 3.2 %
Less: Currency (937)
Net Revenues, ex. currency $ 30,742 $ 28,883 (2) 6.4 %
Operating Income $ 10,531 $ 11,377 (7.4)%
Less:
Asset impairment and exit costs (422) —
Canadian tobacco litigation-related expense (194) —
Loss on deconsolidation of RBH (239) —
Russia excise and VAT audit charge (374) —
Adjusted Operating Income $ 11,760 $ 11,377 3.4 %
Operating Income attributable to RBH (542) (1)
Adjusted Operating Income 11,760 10,835 (2) 8.5 %
Less: Currency (293)
Adjusted Operating Income, ex. currency $ 12,053 $ 10,835 (2) 11.2 %
Adjusted Operating Income Margin 39.5% (3) 38.4% (4) 1.1
Adjusted Operating Income Margin attributable to RBH (0.9) (1)
Adjusted Operating Income Margin 39.5% 37.5% (2) 2.0
Less: Currency 0.3
Adjusted Operating Income Margin, ex. currency 39.2% 37.5% (2) 1.7
Adjusted Diluted EPS (5) $ 5.19 $ 5.10 1.8 %
Net earnings attributable to RBH (0.26) (1)
Adjusted Diluted EPS $ 5.19 $ 4.84 (2) 7.2 %
Less: Currency (0.13)
Adjusted Diluted EPS, ex. currency $ 5.32 $ 4.84 (2) 9.9 %
Net cash provided by operating activities(6) $ 10,090 $ 9,478 6.5 %
Net cash provided by operating activities attributable to RBH (366) (1)
Net cash provided by operating activities(6) $ 10,090 $ 9,112 (2) 10.7 %
Less: Currency (972)
Net cash provided by operating activities, excluding currency $ 11,062 $ 9,112 (2) 21.4 %
(1) Represents the impact attributable to RBH from March 22, 2018 through end of period date
(2) Pro forma
(3) 2019 Adjusted Operating Income Margin was 39.5%, calculated as 2019 Adjusted Operating Income of $11,760 divided by 2019 Net Revenues of $29,805
(4) 2018 Adjusted Operating Income Margin was 38.4%, calculated as 2018 Adjusted Operating Income of $11,377 divided by 2018 Net Revenues of $29,625
(5) For the calculation, see "Reconciliation of Reported Diluted EPS to Adjusted Diluted EPS and Adjusted Diluted EPS, excluding Currency" in this section
(6) Operating cash flow
Note: Financials attributable to RBH include Duty Free sales in Canada

[THIS PAGE INTENTIONALLY LEFT BLANK]

2019 Philip Morris Annual Report_Feb 25, 2020
Design: RWI www.rwidesign.comPhotography: Vickers & BeechlerPrinter: Phoenix Lithographing, USA© Copyright 2020 Philip Morris International Inc.
Shareholder InformationMailing Addresses
HeadquartersPhilip Morris International Inc.120 Park AvenueNew York, NY 10017-5579 USAwww.pmi.com
Operations CenterPhilip Morris Products S.A.Avenue de Rhodanie 50 1007 LausanneSwitzerlandwww.pmi.com
Independent AuditorsPricewaterhouseCoopers SAAvenue C.F. Ramuz 451001 LausanneSwitzerland
Transfer Agent and RegistrarComputershare Trust Company, N.A.P.O. Box 505005 Louisville, KY 40233-5005 USA
2020 Virtual Annual Meeting of Shareholders The Philip Morris International Inc. Annual Meeting of Shareholders will be held solely online via a live webcast on Wednesday, May 6, 2020, at 9:00 a.m. Eastern Daylight Time.For further information, call toll-free: 1-866-713-8075
Direct Stock Purchase and Dividend Reinvestment PlanPhilip Morris International Inc. offers a Direct Stock Purchase and Dividend Reinvestment Plan, administered by Computershare. For more information, or to purchase shares directly through the Plan, please contact Computershare.
TrademarksTrademarks and service marks in this report are the registered property of, or licensed by, the subsidiaries of Philip Morris International Inc. and are italicized or shown in their logo form.
Stock Exchange ListingsPhilip Morris International Inc. is listed on the New York Stock Exchange (ticker symbol “PM”) and on the SIX Swiss Exchange (ticker symbol “PMI”).
Internet Access Helps Reduce CostsAs a convenience to shareholders and an important cost-reduction measure, you can register to receive future shareholder materials (i.e., Annual Report and proxy statement) via the Internet. Shareholders also can vote their proxies via the Internet. For complete instructions, please visit: www.pmi.com/investors
To eliminate duplicate mailings, please contact Computershare (if you are a registered shareholder) or your broker (if you hold your stock through a brokerage firm).
Additional Information Information on our websites is not, and shall not be deemed to be, a part of this report or incorporated into any filings we make with the SEC.
Shareholder PublicationsPhilip Morris International Inc. makes a variety of publications and reports available. These include the Annual Report, news releases and other publications. For copies, please visit: www.pmi.com/investorsPhilip Morris International Inc. makes available free of charge its filings (including proxy statements and Reports on Forms 10-K, 10-Q and 8-K) with the U.S. Securities and Exchange Commission. For copies, please visit: www.pmi.com/SECfilings
If you do not have Internet access, you may call our Shareholder Publications Center toll-free: 1-866-713-8075
Shareholder Response CenterComputershare Trust Company, N.A., our transfer agent, will answer questions about your accounts, certificates, dividends or the Direct Stock Purchase and Dividend Reinvestment Plan. U.S. and Canadian shareholders may call toll-free: 1-877-745-9350From outside the U.S. or Canada, shareholders may call: 1-781-575-4310Postal address:Computershare Trust Company, N.A.P.O. Box 505005 Louisville, KY 40233-5005 USAE-mail address: [email protected]

2019 Philip Morris Annual Report_Feb 25, 2020
Philip Morris International Inc. 120 Park Avenue New York, NY 10017-5579 USA www.pmi.com
Philip Morris International: Delivering a Smoke-Free FuturePhilip Morris International (PMI) is leading a transformation in the tobacco industry to create a smoke-free future and ultimately replace cigarettes with smoke-free products to the benefit of adults who would otherwise continue to smoke, society, the company and its shareholders. PMI is a leading international tobacco company engaged in the manufacture and sale of cigarettes, as well as smoke-free products and associated electronic devices and accessories, and other nicotine-containing products in markets outside the United States. In addition, PMI ships a version of its IQOS Platform 1 device and its consumables authorized by the U.S. Food and Drug Administration to Altria Group, Inc. for sale in the United States under license. PMI is building a future on a new category of smoke-free products that, while not risk-free, are a much better choice than continuing to smoke. Through multidisciplinary capabilities in product development, state-of-the-art facilities and scientific substantiation, PMI aims to ensure that its smoke-free products meet adult consumer preferences and rigorous regulatory requirements. PMI’s smoke-free IQOS product portfolio includes heat-not-burn and nicotine-containing vapor products. As of December 31, 2019, PMI estimates that approximately 9.7 million adult smokers around the world have already stopped smoking and switched to PMI’s heat-not-burn product, available for sale in 52 markets in key cities or nationwide under the IQOS brand. For more information, please visit www.pmi.com and www.pmiscience.com.
Related Documents


