Silk Purses out of Sows’ Ears: Concrete Structures for High Technology Research and Manufacturing Hal Amick, PhD, PE, Member ACI Michael Gendreau Colin Gordon Associates, Brisbane, CA

Welcome message from author
This document is posted to help you gain knowledge. Please leave a comment to let me know what you think about it! Share it to your friends and learn new things together.
Transcript
Silk Purses out of Sows’ Ears:Concrete Structures for High Technology Research and
Manufacturing
Hal Amick, PhD, PE, Member ACIMichael Gendreau
Colin Gordon Associates, Brisbane, CA

Why I’m here today
• Most of my work involves design or analysis of floor systems for technology facilities
• Concrete is the “go-to” structural material for a wide variety of advanced technology facilities
– Material of choice for high-performance floors
• Applications range from “routine” to “extreme”
What do we mean by “high-performance” floors? (1/2)
• Floor performance in tech buildings defined by generic criteria
• (Ref: H. Amick, M. Gendreau, T. Busch, and C. Gordon, “Evolving criteria for research facilities: vibration,” Proceedings of SPIE Conference 5933: Buildings for Nanoscale Research and Beyond, San Diego, CA, 31 Jul 2005 to 1 Aug 2005)
• Floors with vibration criteria less stringent than VC-D are not high-performance in the present context– e.g., generic laboratories, hospitals, offices, most
factories– these are practical to achieve with conventional
framing of steel or concrete
What do we mean by “high-performance” floors? (2/2)
• We are defining “high-performance” as having a criterion more stringent than (or equal to) VC-D
• NIST-A
• VC-D, VC-E
• VC-F, -G, -H
– Semiconductor production
– Nanometer scale R&D
– R&D on devices such as probes that are assumed vibration-sensitive
– Cutting edge electron microscopy (such as FEI Titan 80-300 TEM)
Differing Objectives (1/2)
Semiconductor world
• Driven by “yield” — production efficiency
• Trend (and thus focus) is to make the facilities bigger and more versatile
• (and with gradually increasing column spacing, because the equipment size is increasing)
– Increasing wafer size in chip manufacture
– Increasing panel size in flat panel manufacturing
– These trends require larger devices and larger robots
• Criteria are currently “frozen” at VC-D, VC-D+ and VC-E (depending on owner preference)

Differing Objectives (2/2)
World of research at nanometer scale
• Driven by “pushing the envelope” and achieving AQAP — as quiet as possible
• Trend has been to make progressively better facilities on progressively worse sites
• Making “increasingly better silk purses out of progressively worse sow’s ears” – Criteria are moving targets, currently at VC-E and/or
NIST-A• Achievable, but challenging
– Newest device criteria give VC-F and VC-G• Is this even achievable??
Today’s topics at a Glance
• Trends in facilities working at the nanometer scale
– Pneumatically isolated keel slabs
– Thick slabs to improve “marginal” sites
– Thick slabs to obtain maximum performance
– Interfacing slabs with electromagnetic shielding
– Isolating utility spaces on thick slabs
• Trends in concrete floors in semiconductor facilities
– “Conventional” facilities: waffle slabs and grillages
– “Stacked” facilities: waffle slab on lowest level; “cheeseslabs” long-span steel trusses for upper levels
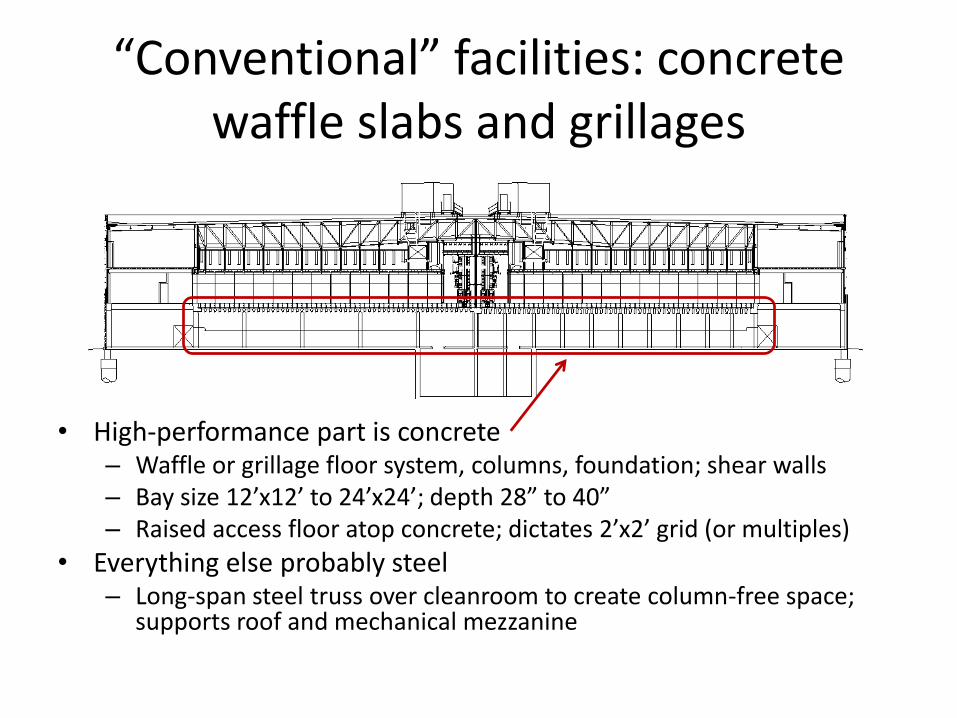
“Conventional” facilities: concrete waffle slabs and grillages
• High-performance part is concrete– Waffle or grillage floor system, columns, foundation; shear walls– Bay size 12’x12’ to 24’x24’; depth 28” to 40”– Raised access floor atop concrete; dictates 2’x2’ grid (or multiples)
• Everything else probably steel– Long-span steel truss over cleanroom to create column-free space;
supports roof and mechanical mezzanine
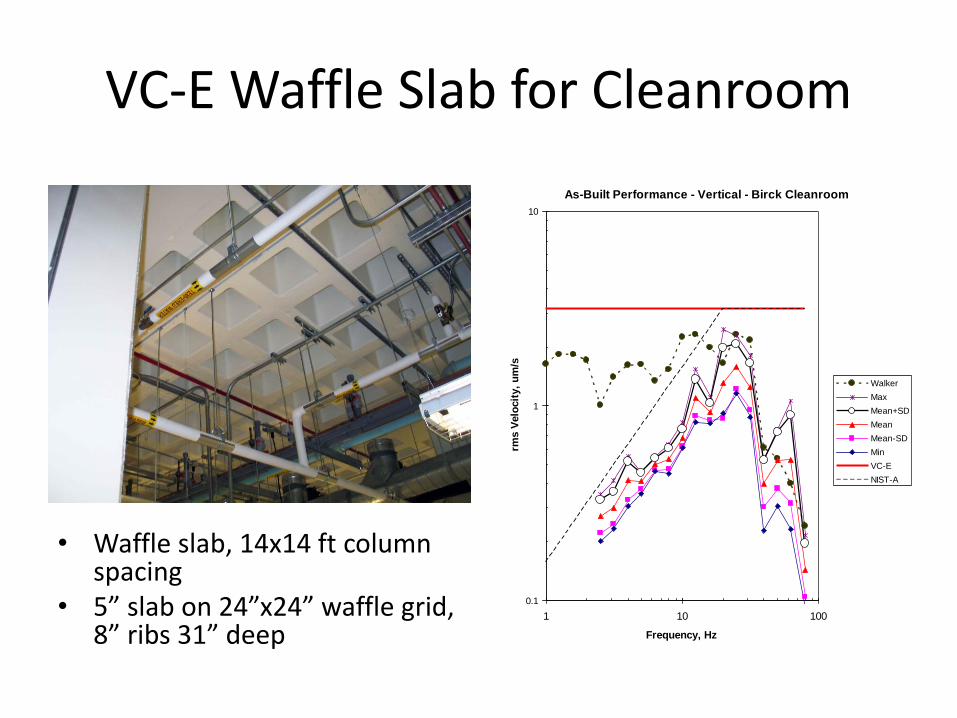
VC-E Waffle Slab for Cleanroom
• Waffle slab, 14x14 ft column spacing
• 5” slab on 24”x24” waffle grid, 8” ribs 31” deep
As-Built Performance - Vertical - Birck Cleanroom
0.1
1
10
1 10 100
Frequency, Hz
rms V
elo
cit
y,
um
/s
Walker
Max
Mean+SD
Mean
Mean-SD
Min
VC-E
NIST-A
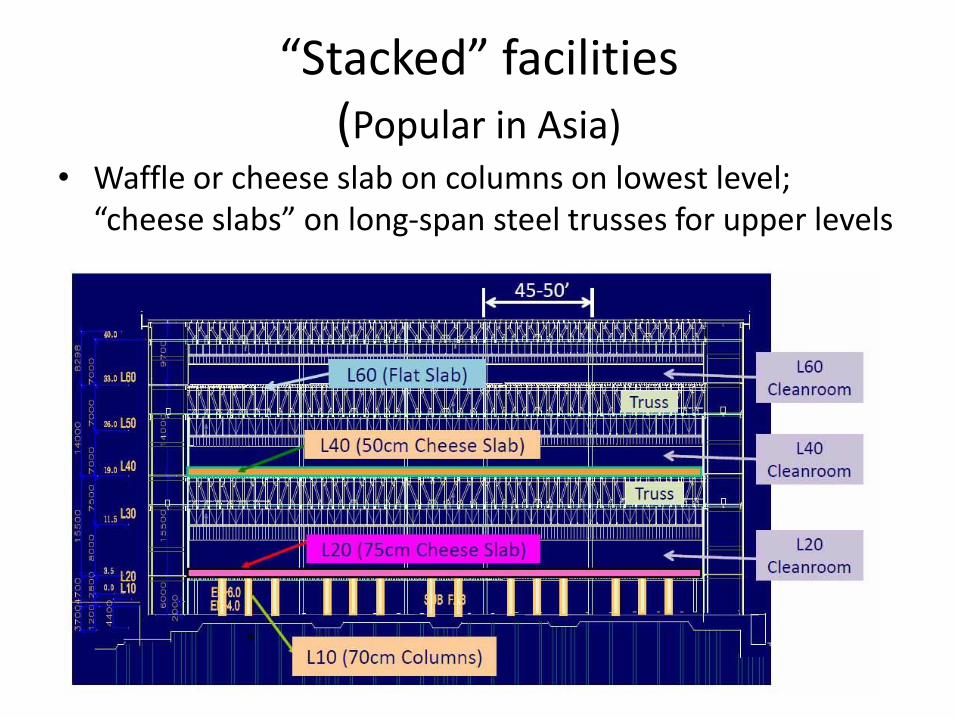
“Stacked” facilities(Popular in Asia)
• Waffle or cheese slab on columns on lowest level; “cheese slabs” on long-span steel trusses for upper levels
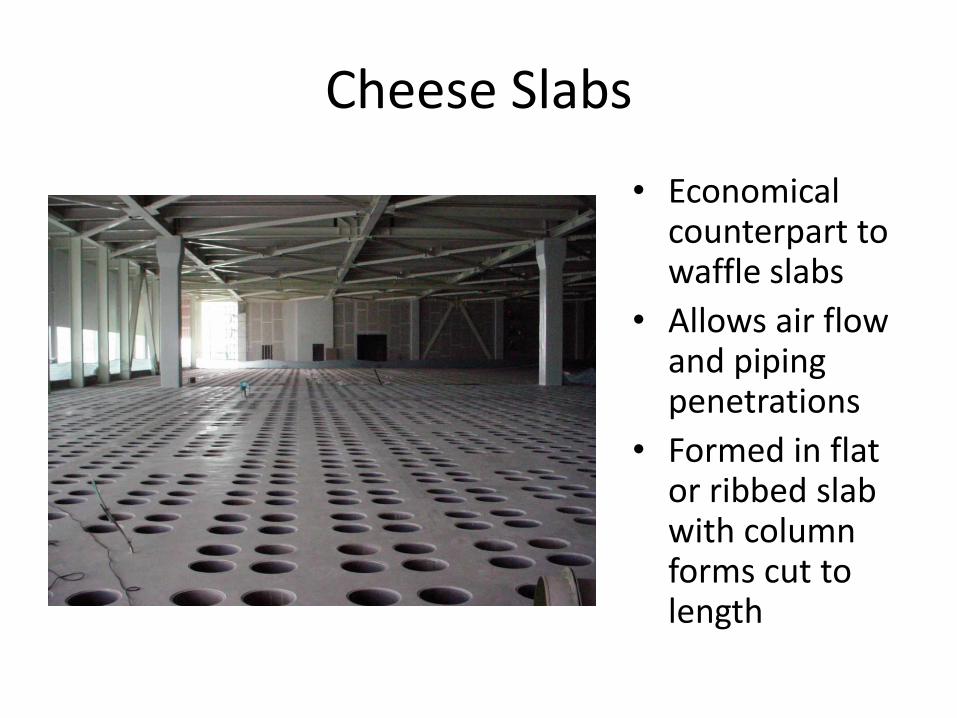
Cheese Slabs
• Economical counterpart to waffle slabs
• Allows air flow and piping penetrations
• Formed in flat or ribbed slab with column forms cut to length
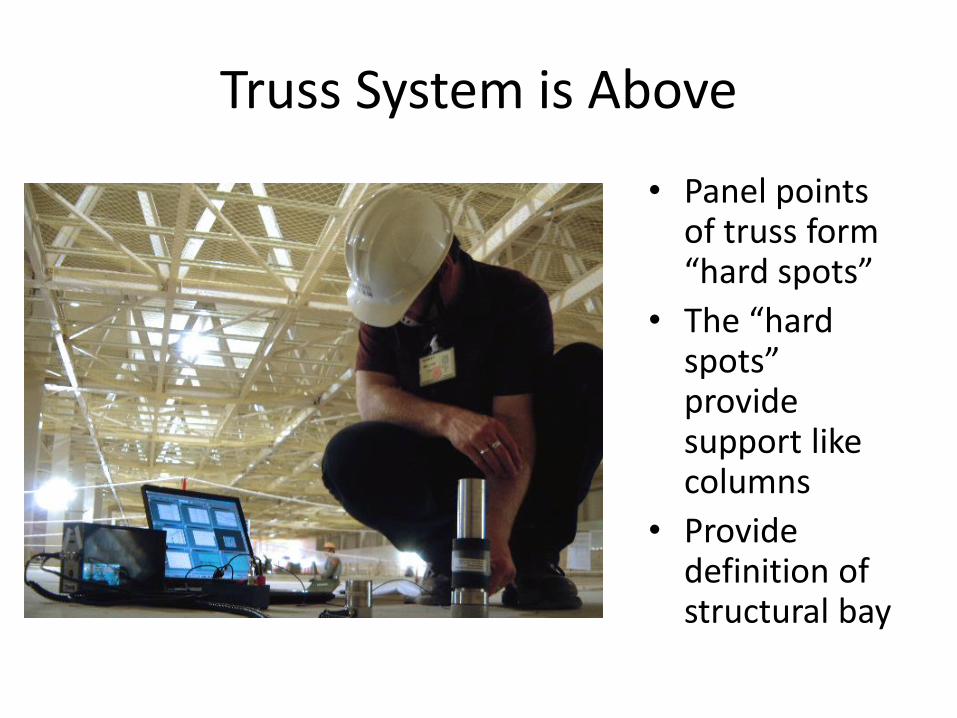
Truss System is Above
• Panel points of truss form “hard spots”
• The “hard spots” provide support like columns
• Provide definition of structural bay
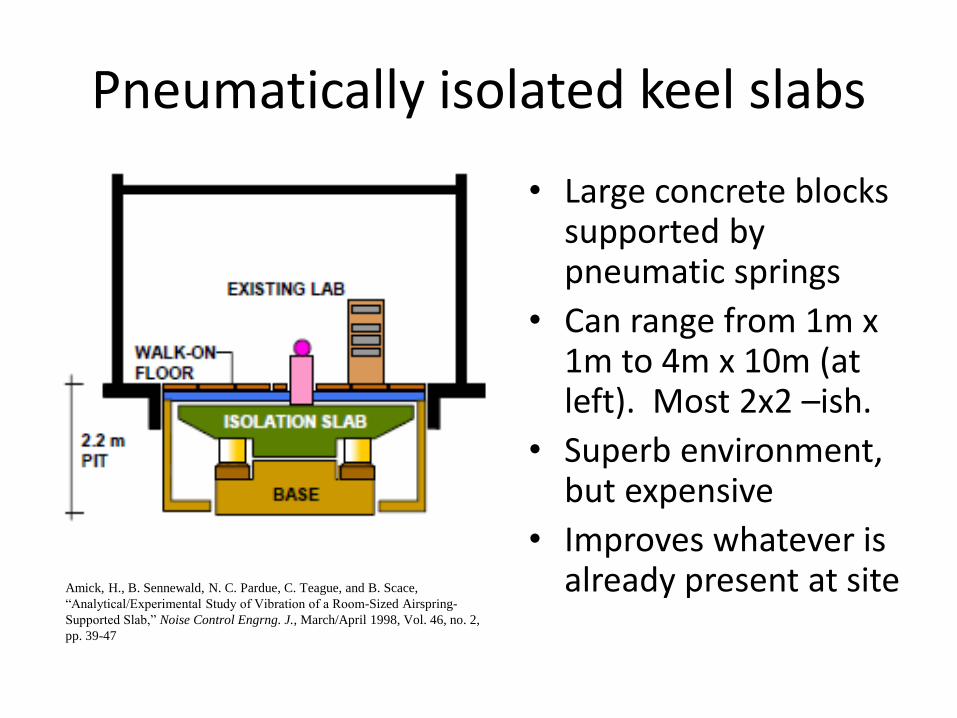
Pneumatically isolated keel slabs
• Large concrete blocks supported by pneumatic springs
• Can range from 1m x 1m to 4m x 10m (at left). Most 2x2 –ish.
• Superb environment, but expensive
• Improves whatever is already present at siteAmick, H., B. Sennewald, N. C. Pardue, C. Teague, and B. Scace,
“Analytical/Experimental Study of Vibration of a Room-Sized Airspring-
Supported Slab,” Noise Control Engrng. J., March/April 1998, Vol. 46, no. 2,
pp. 39-47
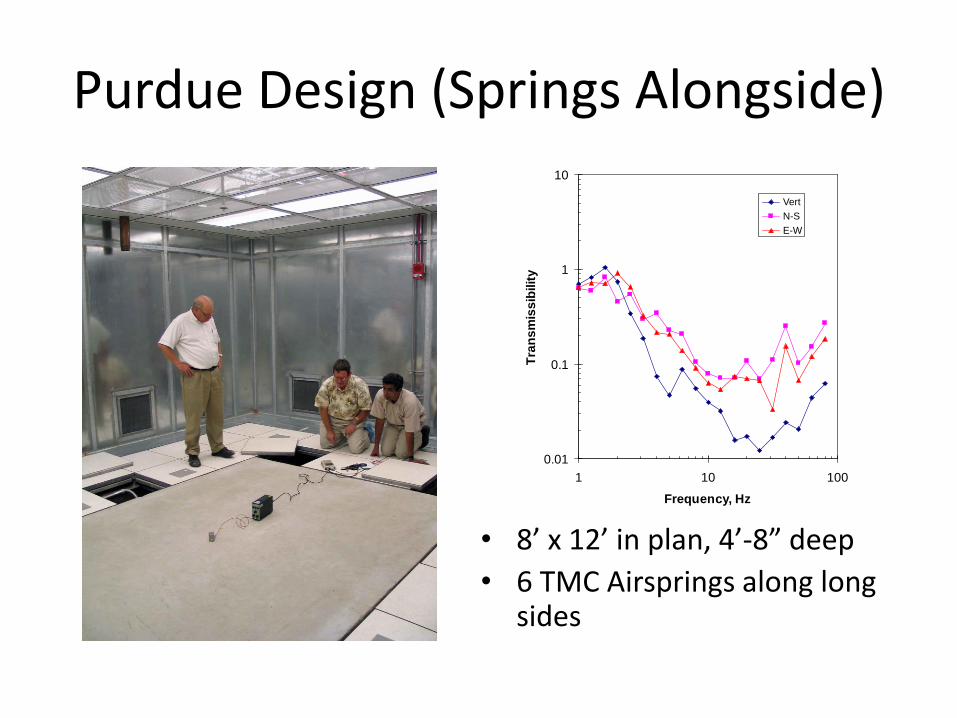
Purdue Design (Springs Alongside)
• 8’ x 12’ in plan, 4’-8” deep
• 6 TMC Airsprings along long sides
0.01
0.1
1
10
1 10 100
Frequency, Hz
Tra
ns
mis
sib
ilit
y
Vert
N-S
E-W
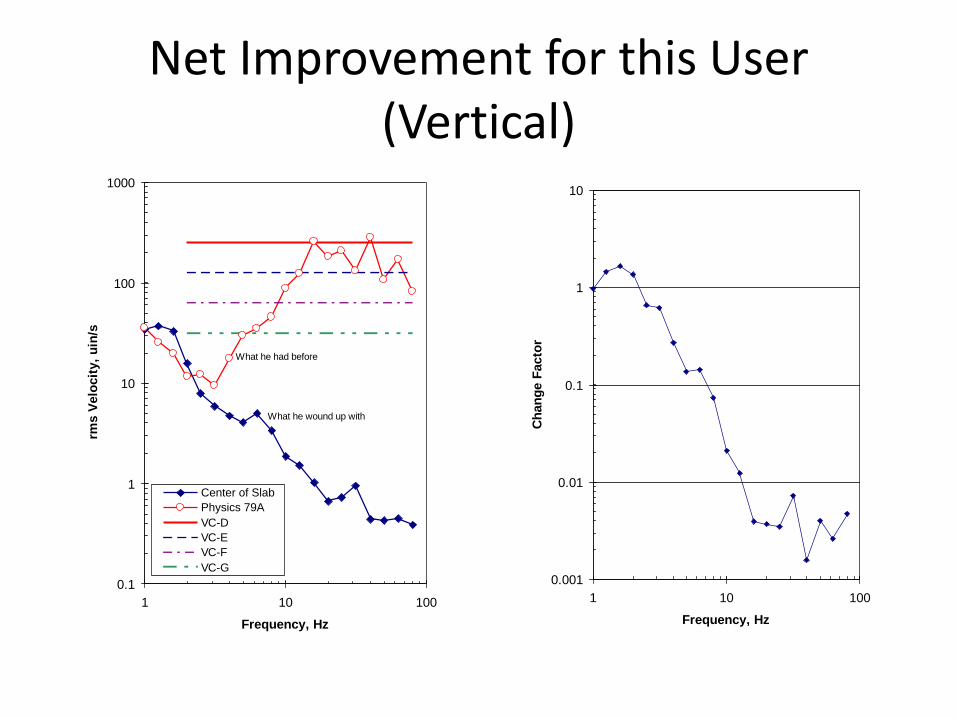
Net Improvement for this User(Vertical)
0.1
1
10
100
1000
1 10 100
Frequency, Hz
rms V
elo
cit
y,
uin
/s
Center of Slab
Physics 79A
VC-D
VC-E
VC-F
VC-G
What he had before
What he wound up with
0.001
0.01
0.1
1
10
1 10 100
Frequency, Hz
Ch
an
ge F
acto
r
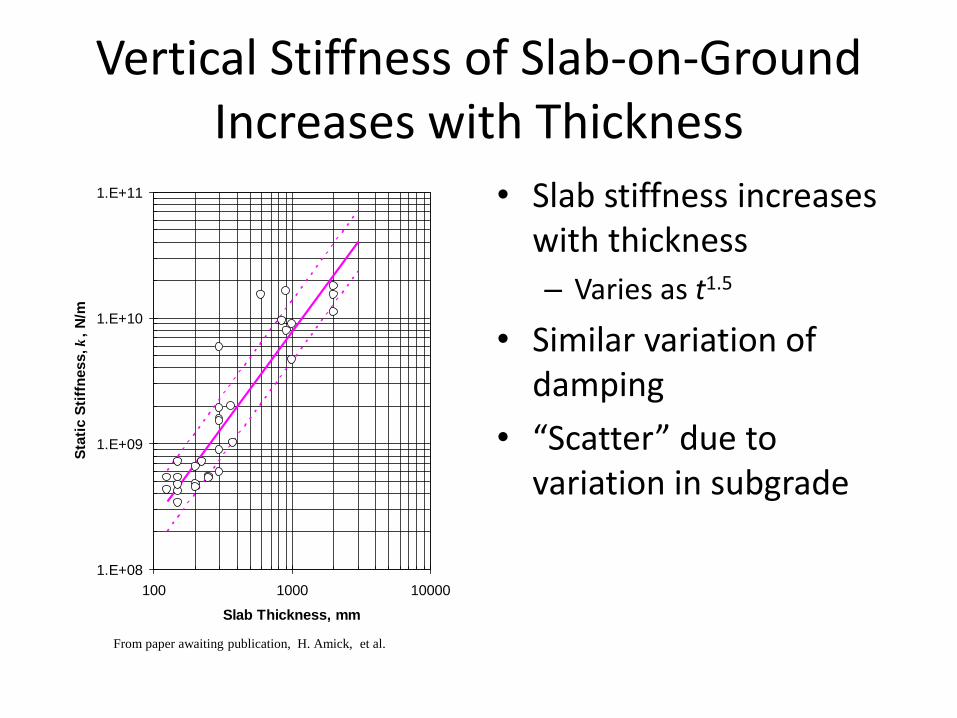
Vertical Stiffness of Slab-on-GroundIncreases with Thickness
• Slab stiffness increases with thickness
– Varies as t1.5
• Similar variation of damping
• “Scatter” due to variation in subgrade
From paper awaiting publication, H. Amick, et al.
1.E+08
1.E+09
1.E+10
1.E+11
100 1000 10000
Slab Thickness, mm
Sta
tic S
tiff
ness, k
, N
/m
Thick slabs to improve “marginal” sites
• Somewhat by trial and error, we have found that we can use thick concrete slabs to improve site vibrations … within certain limits
• Sort of a soil-structure interaction (as we used with nuclear plants) but for somewhat different reasons
• Objective is to “stiffen” the site with respect to Rayleigh waves– 70% of vibration energy
– Specific coupling of vertical and horizontal
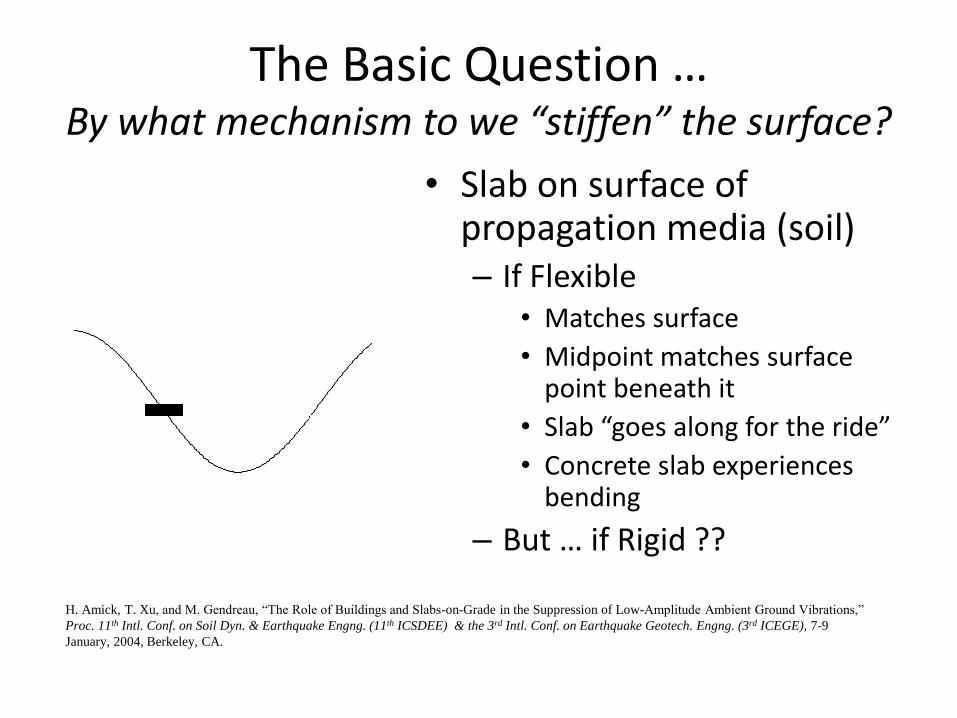
The Basic Question …By what mechanism to we “stiffen” the surface?
• Slab on surface of propagation media (soil)– If Flexible
• Matches surface
• Midpoint matches surface point beneath it
• Slab “goes along for the ride”
• Concrete slab experiences bending
– But … if Rigid ?? -1.5
-1
-0.5
0
0.5
1
1.5
-0.1 0.4 0.9 1.4 1.9
H. Amick, T. Xu, and M. Gendreau, “The Role of Buildings and Slabs-on-Grade in the Suppression of Low-Amplitude Ambient Ground Vibrations,”
Proc. 11th Intl. Conf. on Soil Dyn. & Earthquake Engng. (11th ICSDEE) & the 3rd Intl. Conf. on Earthquake Geotech. Engng. (3rd ICEGE), 7-9
January, 2004, Berkeley, CA.
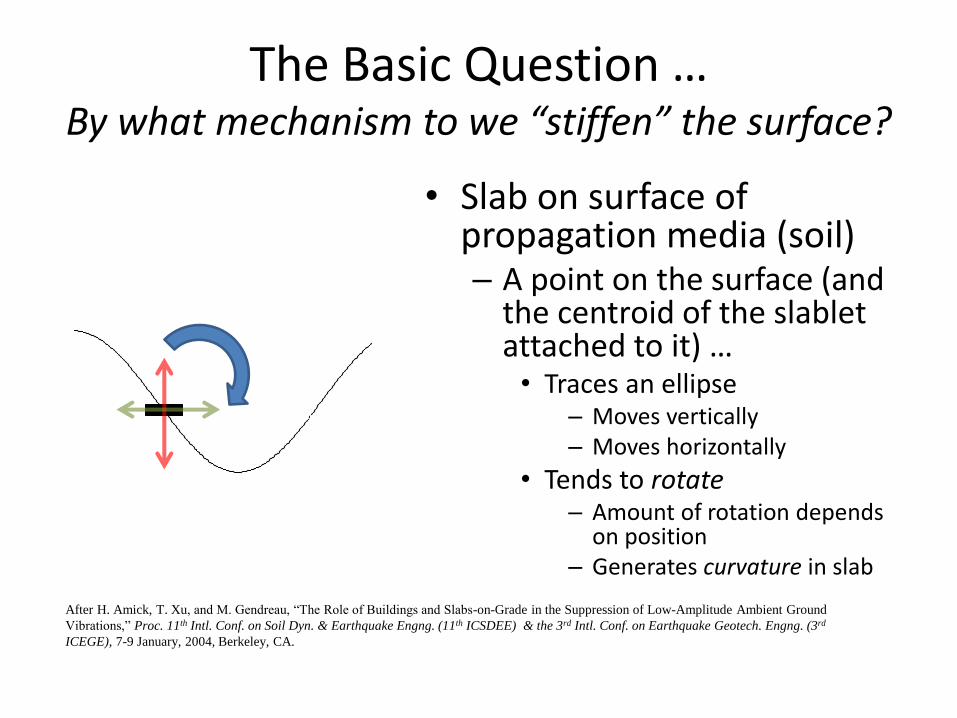
The Basic Question …By what mechanism to we “stiffen” the surface?
• Slab on surface of propagation media (soil)– A point on the surface (and
the centroid of the slabletattached to it) …• Traces an ellipse
– Moves vertically– Moves horizontally
• Tends to rotate– Amount of rotation depends
on position– Generates curvature in slab
-1.5
-1
-0.5
0
0.5
1
1.5
-0.1 0.4 0.9 1.4 1.9
After H. Amick, T. Xu, and M. Gendreau, “The Role of Buildings and Slabs-on-Grade in the Suppression of Low-Amplitude Ambient Ground
Vibrations,” Proc. 11th Intl. Conf. on Soil Dyn. & Earthquake Engng. (11th ICSDEE) & the 3rd Intl. Conf. on Earthquake Geotech. Engng. (3rd
ICEGE), 7-9 January, 2004, Berkeley, CA.
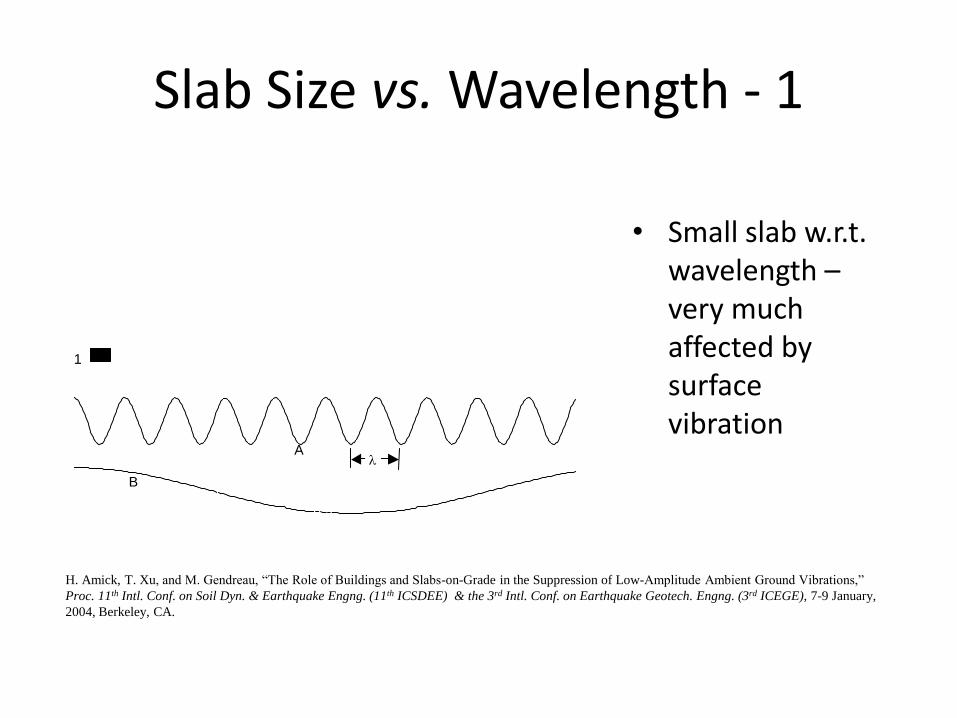
Slab Size vs. Wavelength - 1
-2
-1
0
1
2
3
4
5
-0.1 0.4 0.9 1.4 1.9
1
A
B
• Small slab w.r.t. wavelength –very much affected by surface vibration
H. Amick, T. Xu, and M. Gendreau, “The Role of Buildings and Slabs-on-Grade in the Suppression of Low-Amplitude Ambient Ground Vibrations,”
Proc. 11th Intl. Conf. on Soil Dyn. & Earthquake Engng. (11th ICSDEE) & the 3rd Intl. Conf. on Earthquake Geotech. Engng. (3rd ICEGE), 7-9 January,
2004, Berkeley, CA.
-2
-1
0
1
2
3
4
5
-0.1 0.4 0.9 1.4 1.9
1 2
A
B
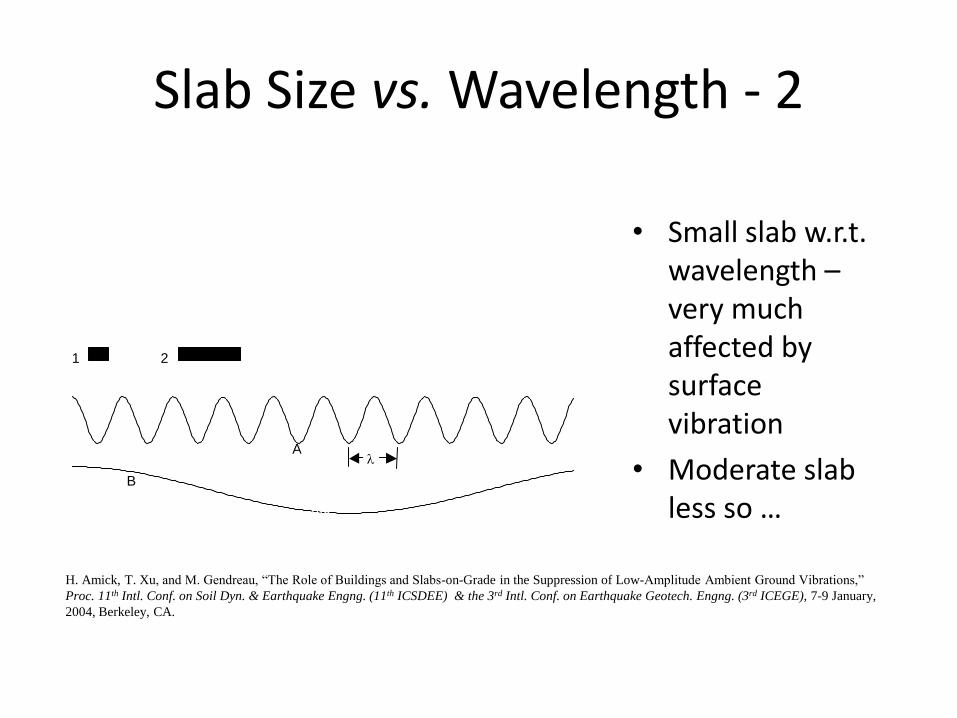
Slab Size vs. Wavelength - 2
• Small slab w.r.t. wavelength –very much affected by surface vibration
• Moderate slab less so …
H. Amick, T. Xu, and M. Gendreau, “The Role of Buildings and Slabs-on-Grade in the Suppression of Low-Amplitude Ambient Ground Vibrations,”
Proc. 11th Intl. Conf. on Soil Dyn. & Earthquake Engng. (11th ICSDEE) & the 3rd Intl. Conf. on Earthquake Geotech. Engng. (3rd ICEGE), 7-9 January,
2004, Berkeley, CA.
-2
-1
0
1
2
3
4
5
-0.1 0.4 0.9 1.4 1.9
1 2 3
A
B
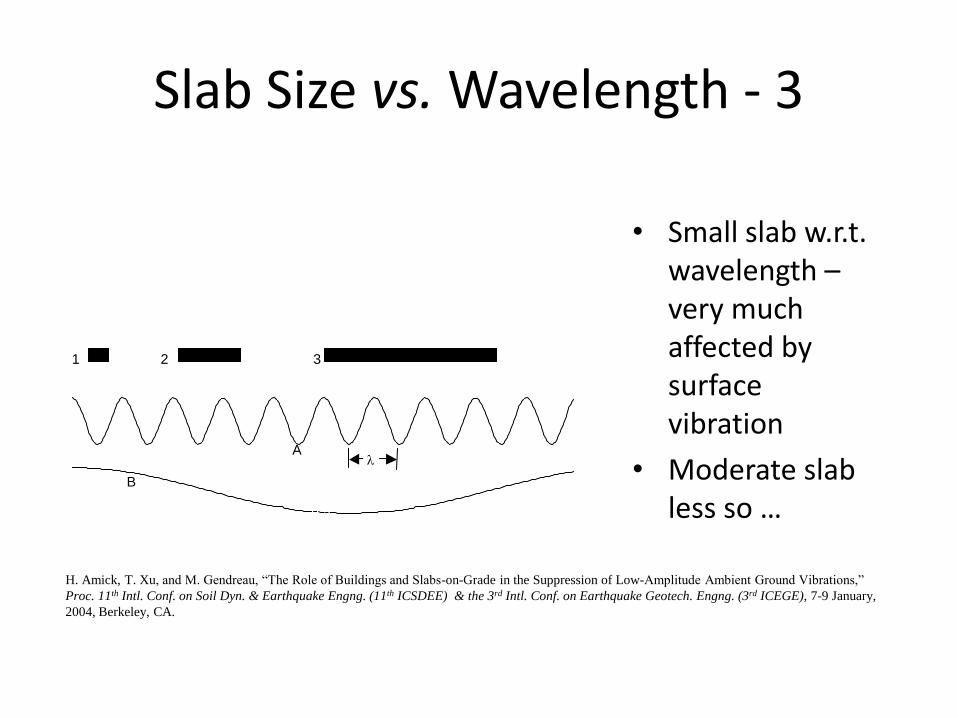
Slab Size vs. Wavelength - 3
• Small slab w.r.t. wavelength –very much affected by surface vibration
• Moderate slab less so …
H. Amick, T. Xu, and M. Gendreau, “The Role of Buildings and Slabs-on-Grade in the Suppression of Low-Amplitude Ambient Ground Vibrations,”
Proc. 11th Intl. Conf. on Soil Dyn. & Earthquake Engng. (11th ICSDEE) & the 3rd Intl. Conf. on Earthquake Geotech. Engng. (3rd ICEGE), 7-9 January,
2004, Berkeley, CA.
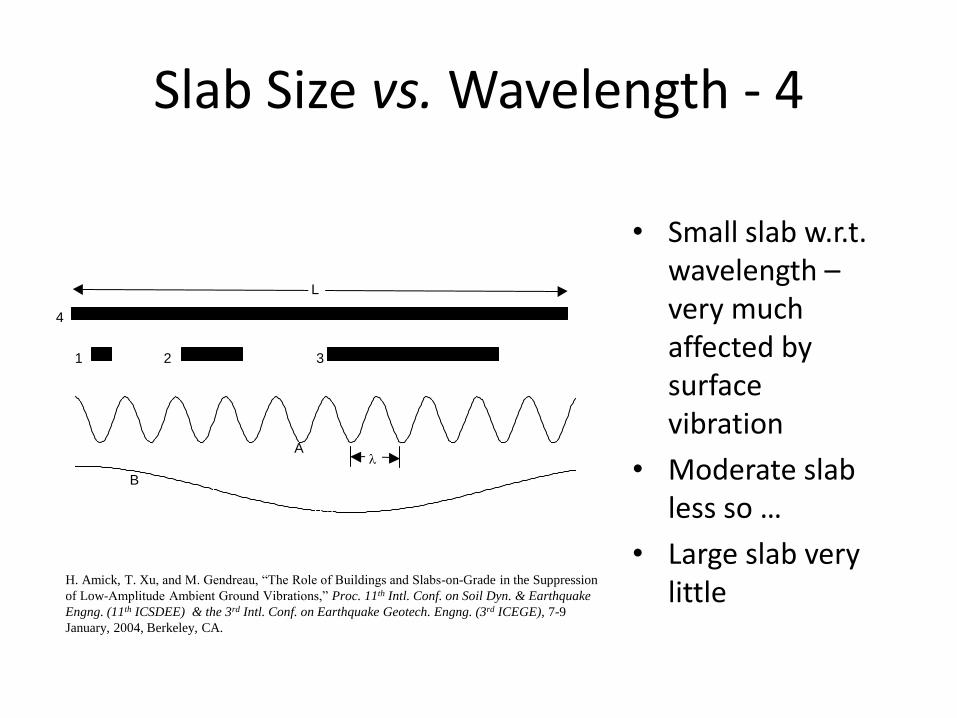
• Small slab w.r.t. wavelength –very much affected by surface vibration
• Moderate slab less so …
• Large slab very little
-2
-1
0
1
2
3
4
5
-0.1 0.4 0.9 1.4 1.9
1 2 3
4
A
B
L
Slab Size vs. Wavelength - 4
H. Amick, T. Xu, and M. Gendreau, “The Role of Buildings and Slabs-on-Grade in the Suppression
of Low-Amplitude Ambient Ground Vibrations,” Proc. 11th Intl. Conf. on Soil Dyn. & Earthquake
Engng. (11th ICSDEE) & the 3rd Intl. Conf. on Earthquake Geotech. Engng. (3rd ICEGE), 7-9
January, 2004, Berkeley, CA.
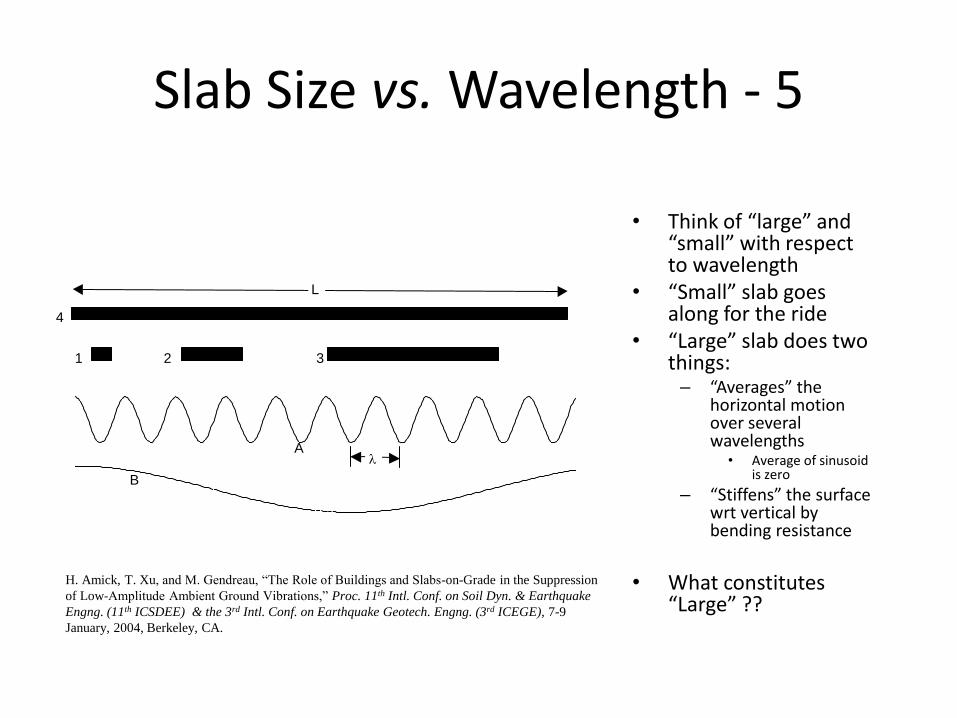
• Think of “large” and “small” with respect to wavelength
• “Small” slab goes along for the ride
• “Large” slab does two things:– “Averages” the
horizontal motion over several wavelengths
• Average of sinusoid is zero
– “Stiffens” the surface wrt vertical by bending resistance
• What constitutes “Large” ??
-2
-1
0
1
2
3
4
5
-0.1 0.4 0.9 1.4 1.9
1 2 3
4
A
B
L
Slab Size vs. Wavelength - 5
H. Amick, T. Xu, and M. Gendreau, “The Role of Buildings and Slabs-on-Grade in the Suppression
of Low-Amplitude Ambient Ground Vibrations,” Proc. 11th Intl. Conf. on Soil Dyn. & Earthquake
Engng. (11th ICSDEE) & the 3rd Intl. Conf. on Earthquake Geotech. Engng. (3rd ICEGE), 7-9
January, 2004, Berkeley, CA.
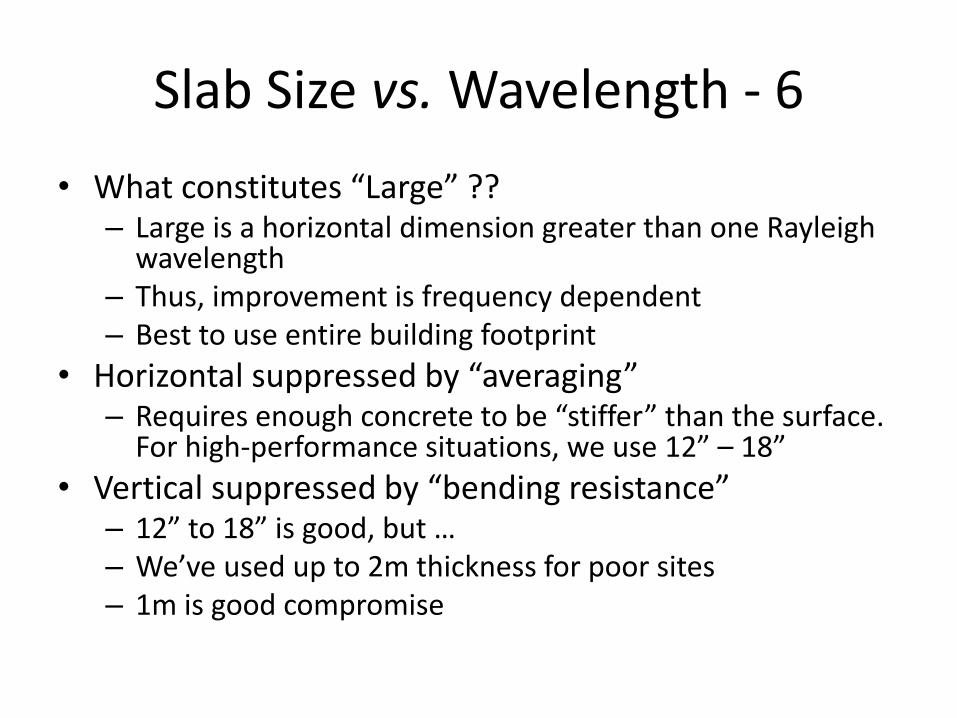
• What constitutes “Large” ??– Large is a horizontal dimension greater than one Rayleigh
wavelength– Thus, improvement is frequency dependent– Best to use entire building footprint
• Horizontal suppressed by “averaging”– Requires enough concrete to be “stiffer” than the surface.
For high-performance situations, we use 12” – 18”
• Vertical suppressed by “bending resistance”– 12” to 18” is good, but …– We’ve used up to 2m thickness for poor sites– 1m is good compromise
Slab Size vs. Wavelength - 6
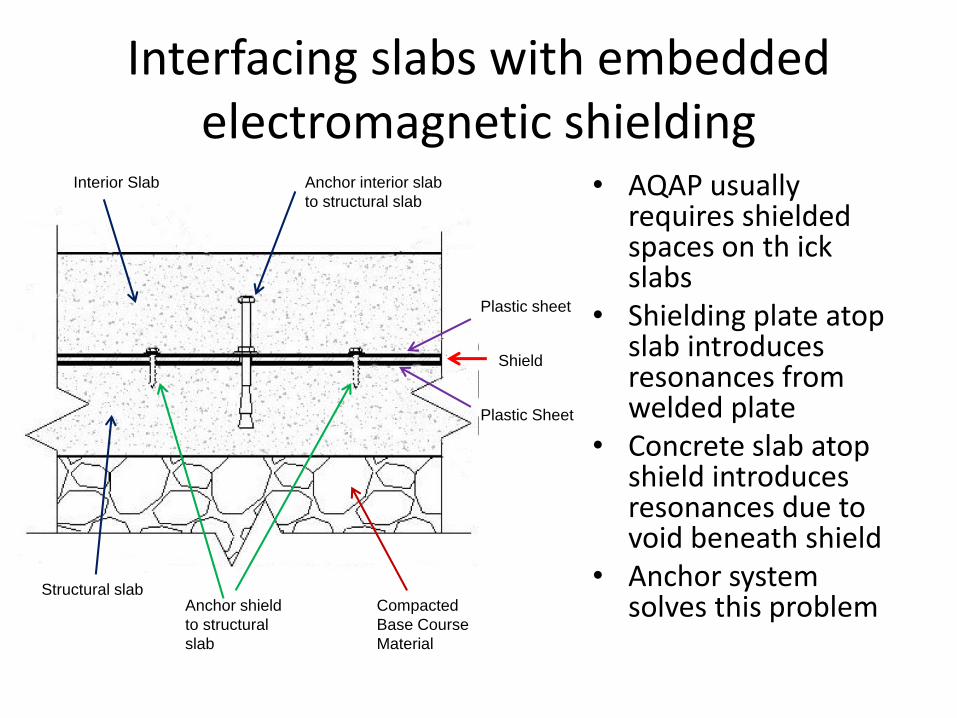
Interfacing slabs with embedded electromagnetic shielding
• AQAP usually requires shielded spaces on th ickslabs
• Shielding plate atop slab introduces resonances from welded plate
• Concrete slab atop shield introduces resonances due to void beneath shield
• Anchor system solves this problemAnchor shield
to structural
slab
Interior Slab
Compacted
Base Course
Material
Structural slab
Anchor interior slab
to structural slab
Plastic sheet
Shield
Plastic Sheet
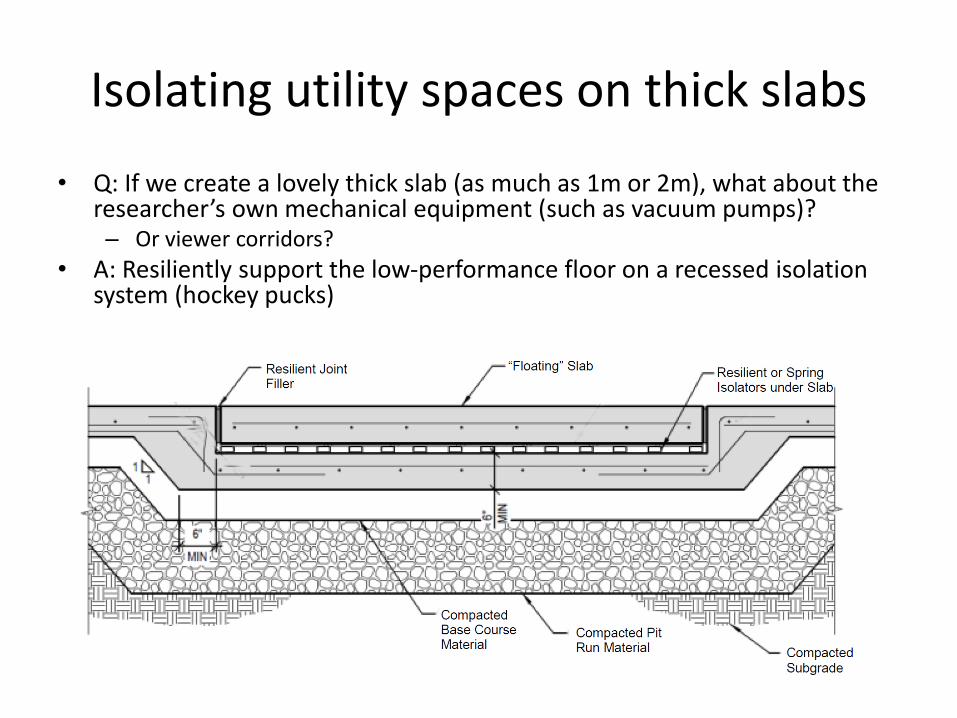
Isolating utility spaces on thick slabs
• Q: If we create a lovely thick slab (as much as 1m or 2m), what about the researcher’s own mechanical equipment (such as vacuum pumps)?– Or viewer corridors?
• A: Resiliently support the low-performance floor on a recessed isolation system (hockey pucks)
Development of Response
Prediction Methods for High
Frequency Floors Subject
to WalkingDi Liu, M.S., Ph.D. Candidate
Brad Davis, Ph.D., S.E.
Thomas M. Murray, Ph.D., P.E.
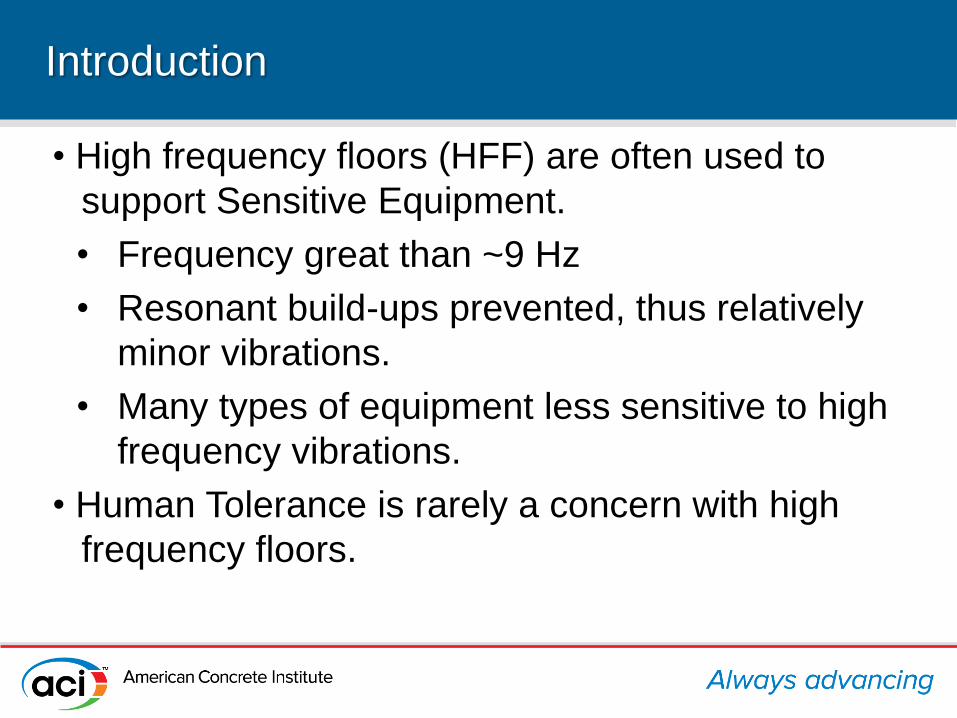
Introduction
• High frequency floors (HFF) are often used to
support Sensitive Equipment.
• Frequency great than ~9 Hz
• Resonant build-ups prevented, thus relatively
minor vibrations.
• Many types of equipment less sensitive to high
frequency vibrations.
• Human Tolerance is rarely a concern with high
frequency floors.
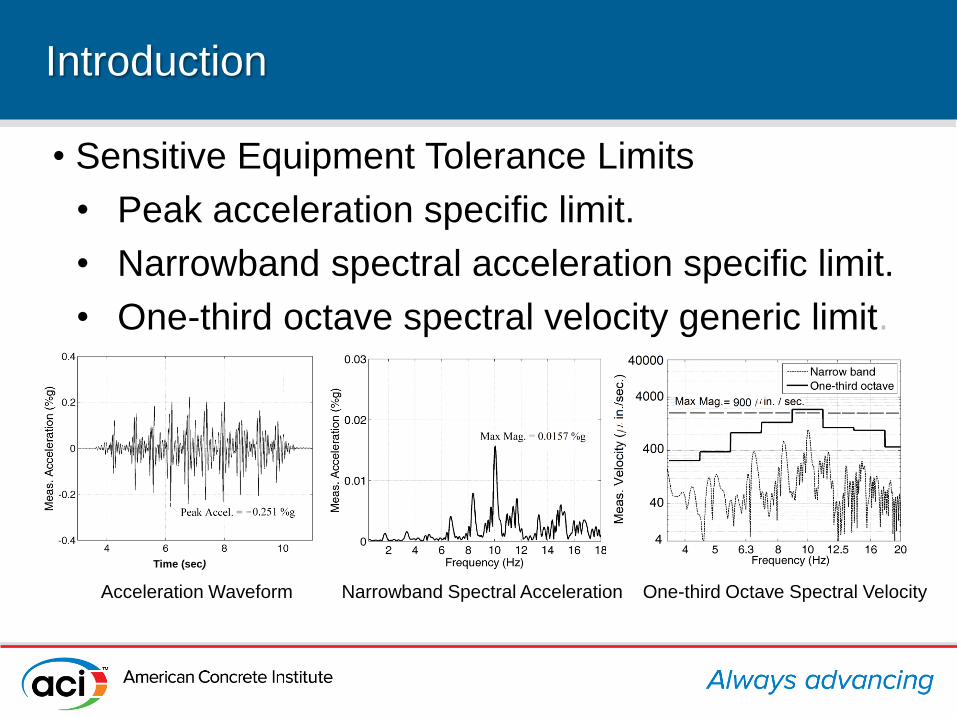
Introduction
• Sensitive Equipment Tolerance Limits
• Peak acceleration specific limit.
• Narrowband spectral acceleration specific limit.
• One-third octave spectral velocity generic limit.
Acceleration Waveform Narrowband Spectral Acceleration One-third Octave Spectral Velocity
Time (sec)
Sensitive Equipment Vibration Limits
• Peak acceleration specific limit or
narrowband spectral acceleration specific
limit usually found in sensitive equipment
technical publications.
• If not available, generic limits can be used for
floor framing design.
Example Waveform Acceleration Limit
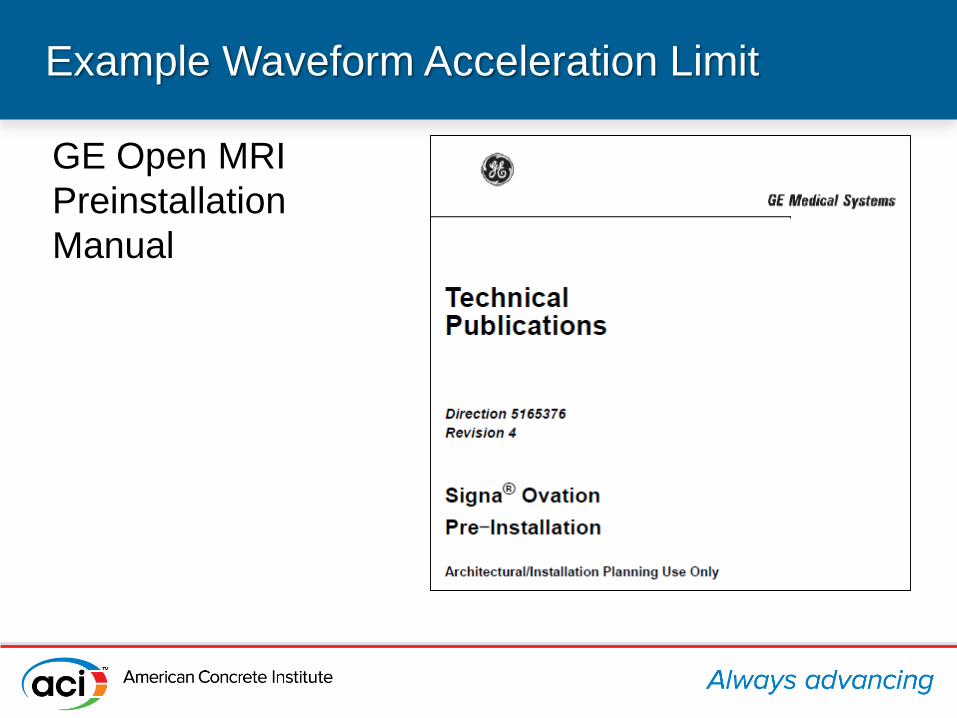
GE Open MRI
Preinstallation
Manual
Example Waveform Acceleration Limit
Example Waveform Acceleration Limit
0 1 2 3 4 5-0.1
-0.05
0
0.05
0.1
X: 1.551
Y: 0.04613
Time (sec.)
Pre
d.
Accele
ration (
%g)
X: 1.5
Y: -0.05374
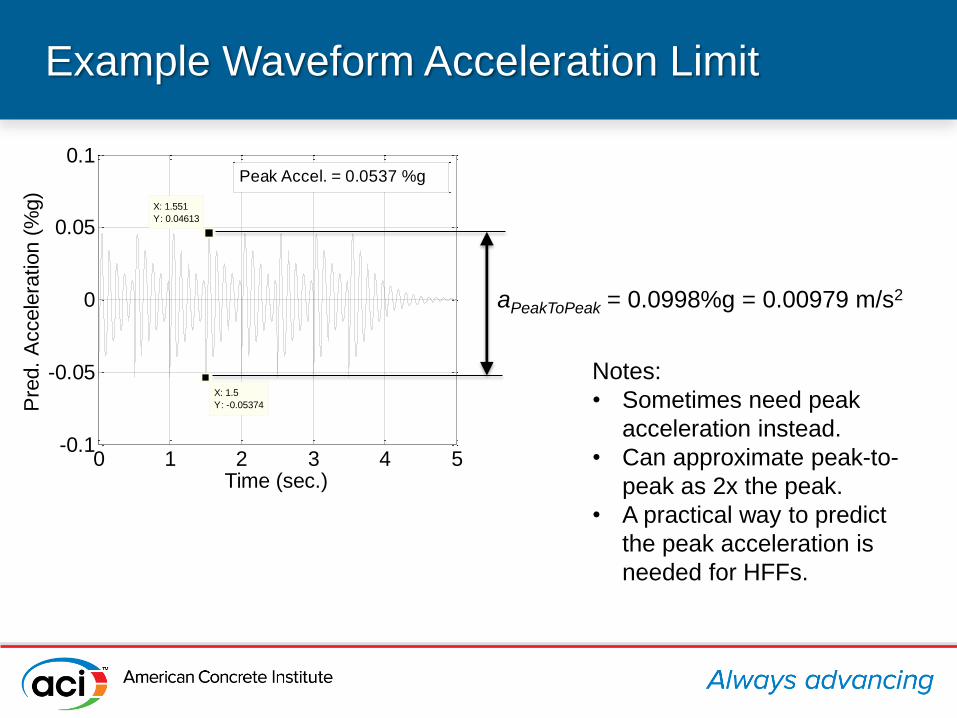
Peak Accel. = 0.0537 %g
aPeakToPeak = 0.0998%g = 0.00979 m/s2
Notes:
• Sometimes need peak
acceleration instead.
• Can approximate peak-to-
peak as 2x the peak.
• A practical way to predict
the peak acceleration is
needed for HFFs.
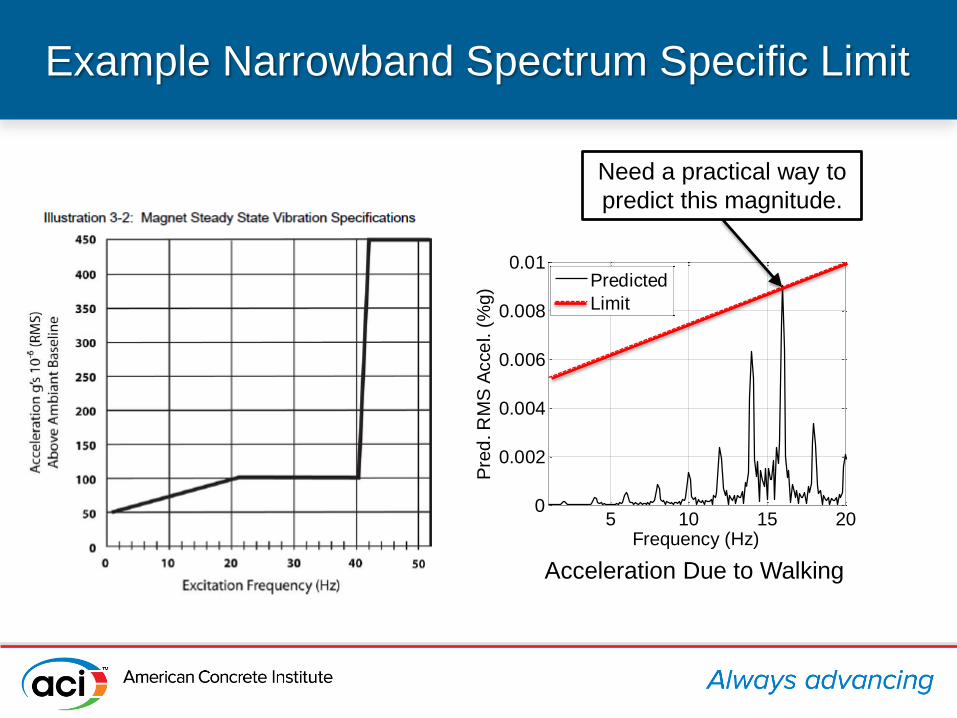
Example Narrowband Spectrum Specific Limit
5 10 15 200
0.002
0.004
0.006
0.008
0.01
Frequency (Hz)
Pre
d. R
MS
Acce
l. (
%g)
Predicted
Limit
Need a practical way to
predict this magnitude.
Acceleration Due to Walking
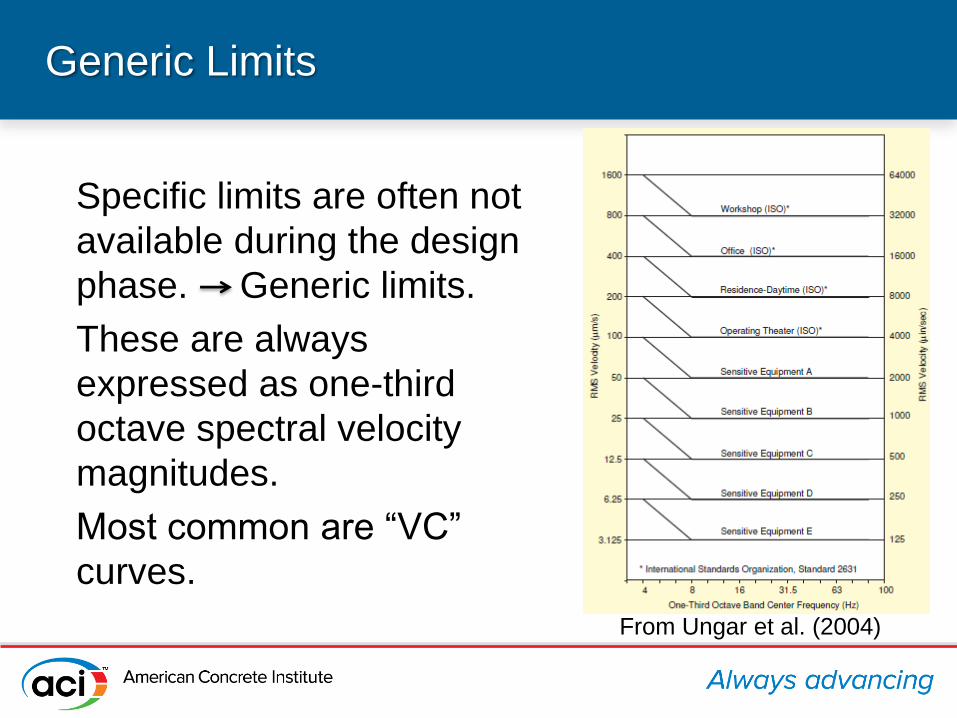
Generic Limits
Specific limits are often not
available during the design
phase. Generic limits.
These are always
expressed as one-third
octave spectral velocity
magnitudes.
Most common are “VC”
curves.
From Ungar et al. (2004)
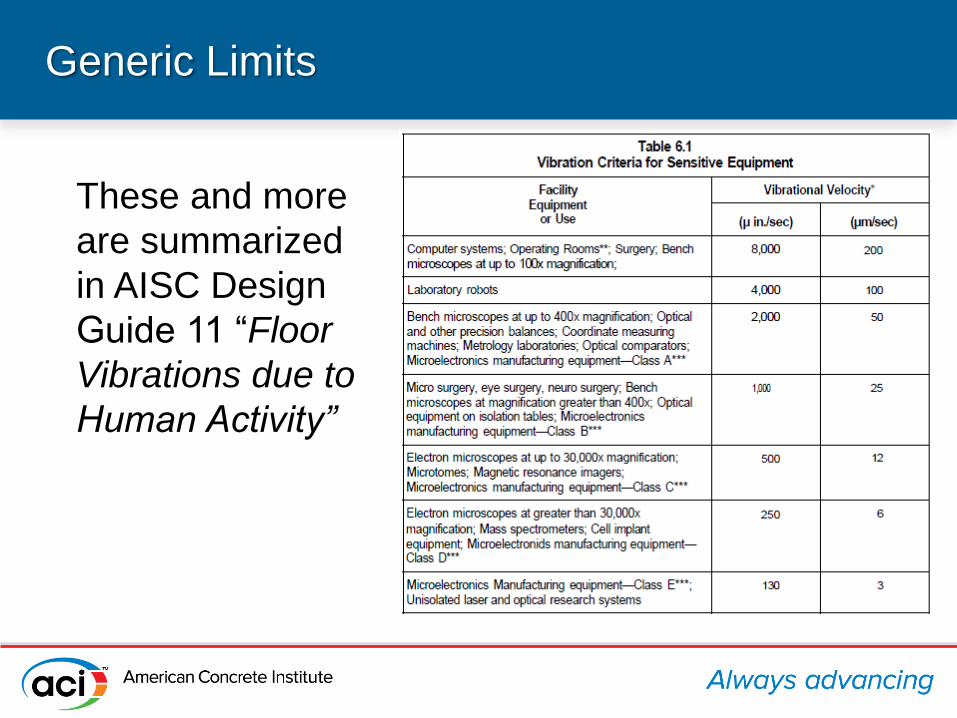
Generic Limits
These and more
are summarized
in AISC Design
Guide 11 “Floor
Vibrations due to
Human Activity”
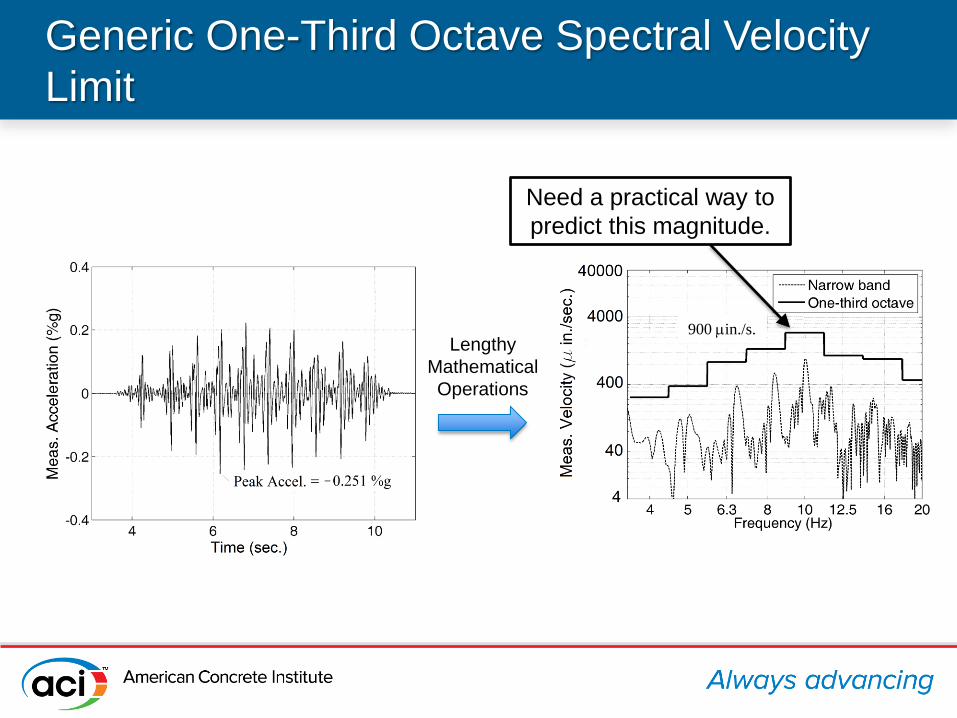
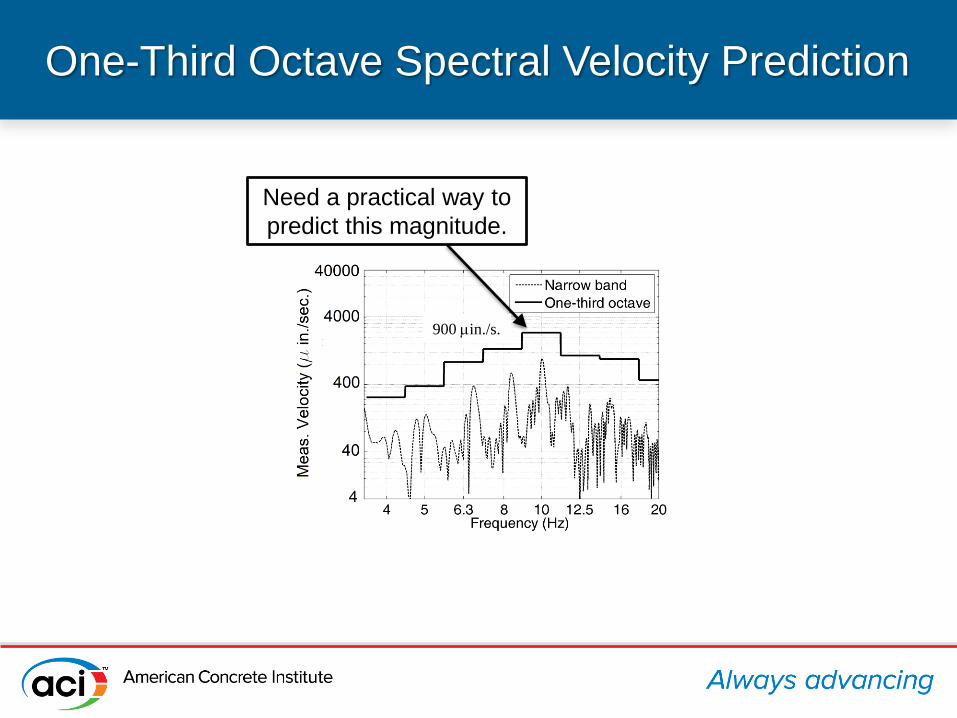
Generic One-Third Octave Spectral Velocity
Limit
Lengthy
Mathematical
Operations
Need a practical way to
predict this magnitude.
900 min./s.
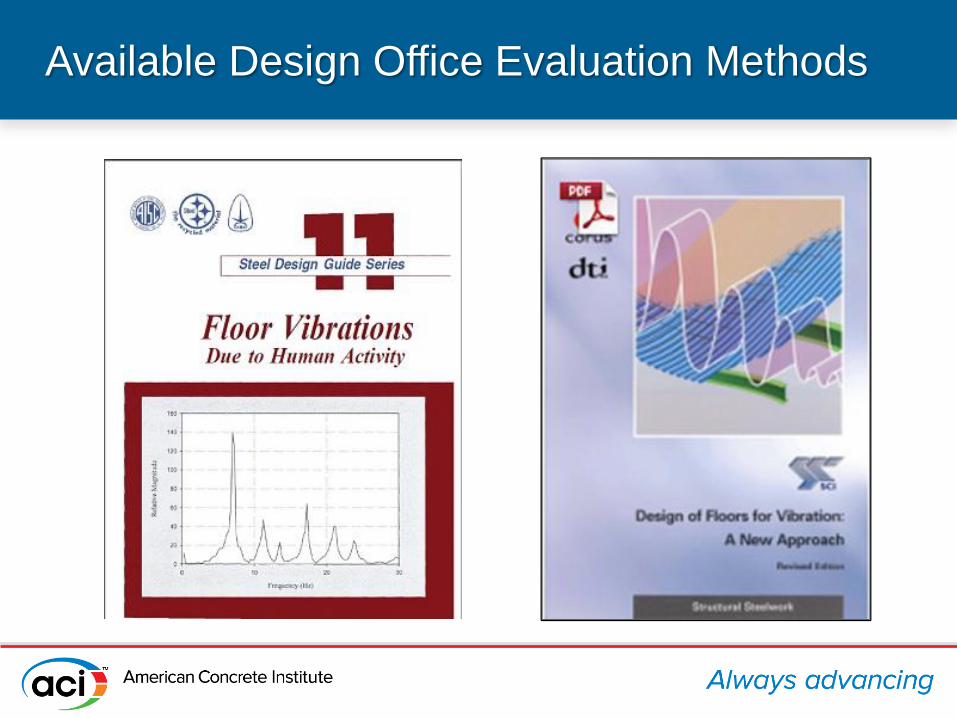
Available Design Office Evaluation Methods
Available Design Office Evaluation Methods
• Overview
– AISC Design Guide 11 Chapter 6 and SCI P354
Simplified Method waveform peak response.
– Both are directly comparable to waveform peak
response limits.
– But are not directly comparable to spectral
acceleration or one-third octave velocity.
– Fourier transforms and bandwidth conversions
are needed to get spectral response predictions.
Impractical for design use. Need for Research
Research at University of Kentucky
• Current Research
– Development of methodology for design office
use for predicted floor response which is directly
comparable to tolerance limits given in terms of
• Waveform peak acceleration
• Narrowband spectral acceleration
• One-third octave spectral velocity
– Combined experimental and analytical program.
Research at University of Kentucky
• Experimental Program
– Five high frequency floor bays in three buildings.
– Natural frequencies measured using EMA or heeldrop
tests
– Responses to walking measured for 89 walking tests
using seven walkers.
• Analytical Program
– Propose prediction methods for determining if steel or
concrete framing satisfies required limits for specific
sensitive equipment or generic limits.
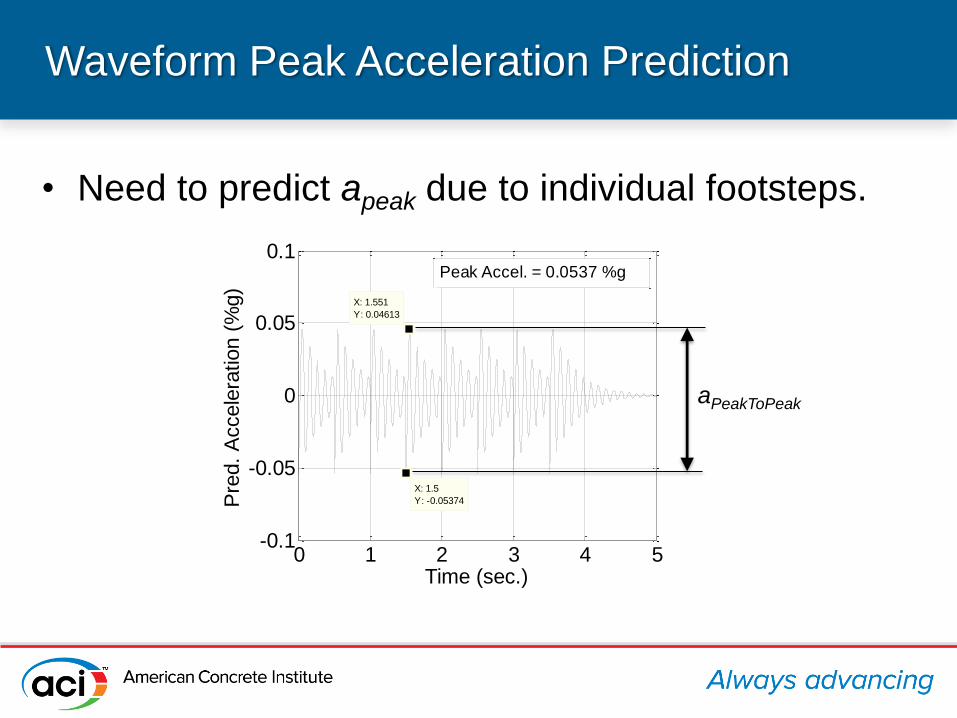
• Need to predict apeak due to individual footsteps.
Waveform Peak Acceleration Prediction
0 1 2 3 4 5-0.1
-0.05
0
0.05
0.1
X: 1.551
Y: 0.04613
Time (sec.)
Pre
d.
Accele
ration (
%g)
X: 1.5
Y: -0.05374
Peak Accel. = 0.0537 %g
aPeakToPeak
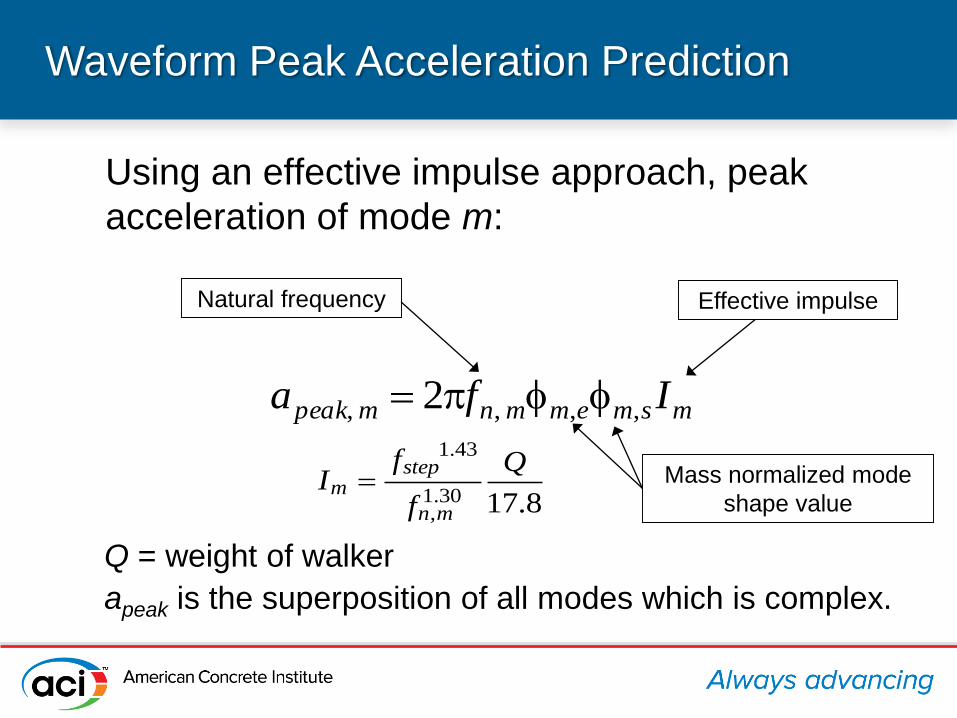
Waveform Peak Acceleration Prediction
Using an effective impulse approach, peak
acceleration of mode m:
msmemmnmpeak Ifa ,,,, 2
Mass normalized mode
shape value
Natural frequency Effective impulse
Q = weight of walker
apeak is the superposition of all modes which is complex.
1.43
1.30, 17.8
stepm
n m
f QI
f
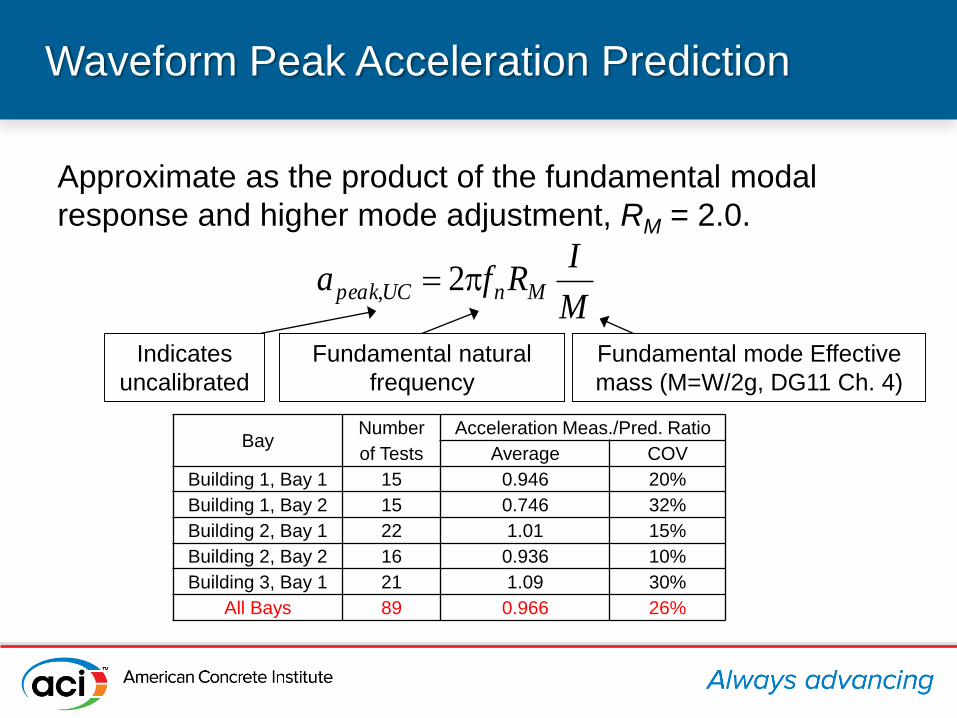
Waveform Peak Acceleration Prediction
Approximate as the product of the fundamental modal
response and higher mode adjustment, RM = 2.0.
M
IRfa MnUCpeak 2,
Indicates
uncalibrated
Fundamental mode Effective
mass (M=W/2g, DG11 Ch. 4)
Fundamental natural
frequency
BayNumber
of Tests
Acceleration Meas./Pred. Ratio
Average COV
Building 1, Bay 1 15 0.946 20%
Building 1, Bay 2 15 0.746 32%
Building 2, Bay 1 22 1.01 15%
Building 2, Bay 2 16 0.936 10%
Building 3, Bay 1 21 1.09 30%
All Bays 89 0.966 26%
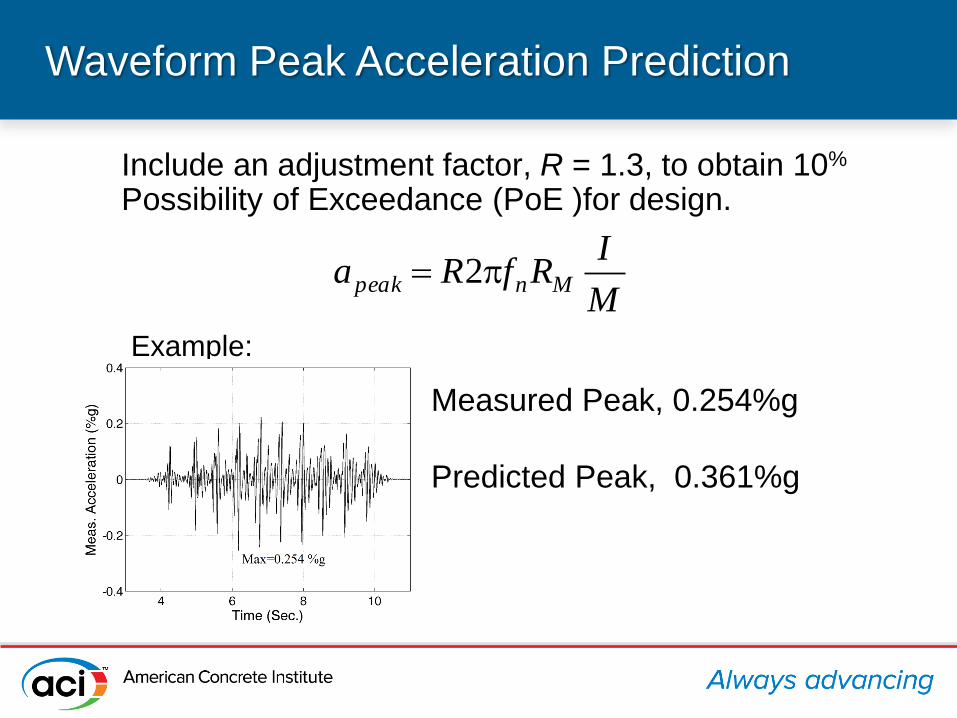
Waveform Peak Acceleration Prediction
Include an adjustment factor, R = 1.3, to obtain 10%
Possibility of Exceedance (PoE )for design.
Example:
M
IRfRa Mnpeak 2
Measured Peak, 0.254%g
Predicted Peak, 0.361%g
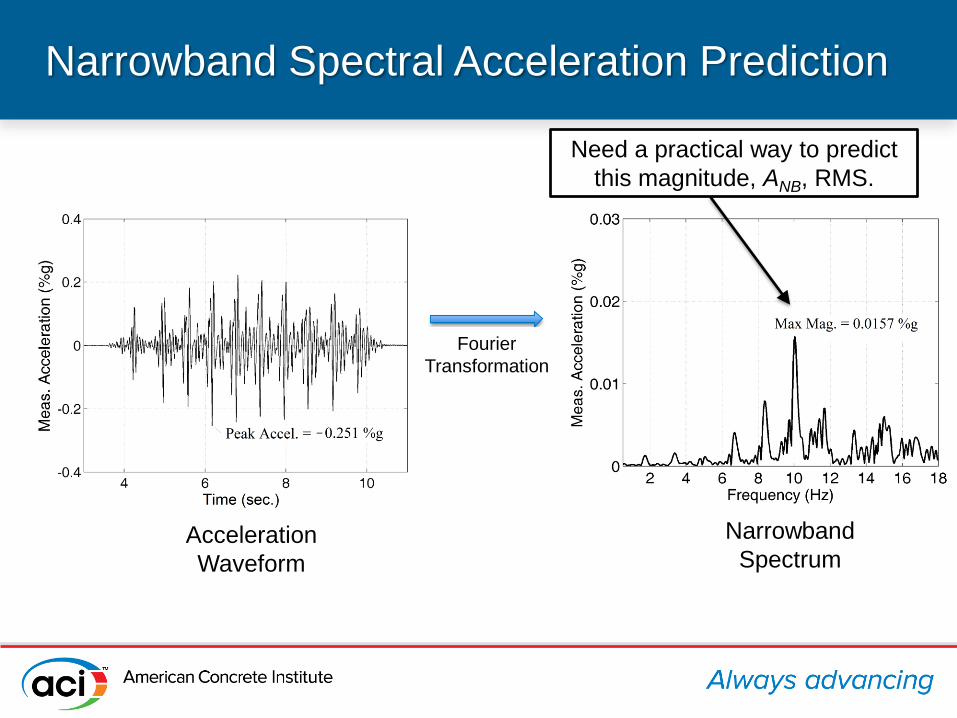
Narrowband Spectral Acceleration Prediction
Need a practical way to predict
this magnitude, ANB, RMS.
Fourier
Transformation
Acceleration
Waveform
Narrowband
Spectrum
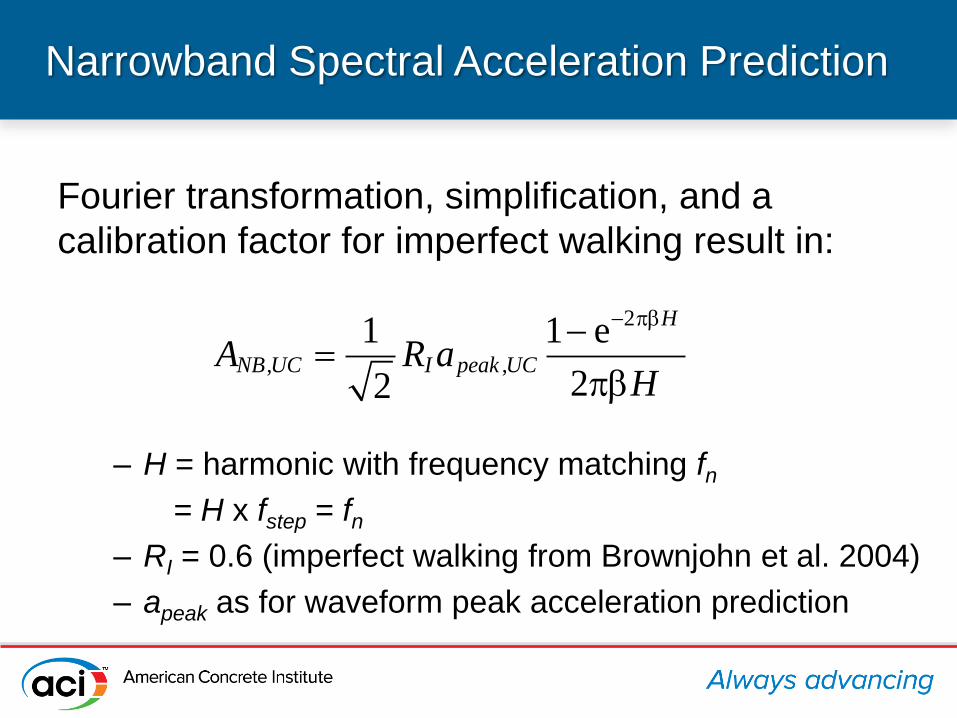
Narrowband Spectral Acceleration Prediction
2
, ,
1 1 e
22
H
NB UC I peak UCA R aH
Fourier transformation, simplification, and a
calibration factor for imperfect walking result in:
– H = harmonic with frequency matching fn
= H x fstep = fn
– RI = 0.6 (imperfect walking from Brownjohn et al. 2004)
– apeak as for waveform peak acceleration prediction
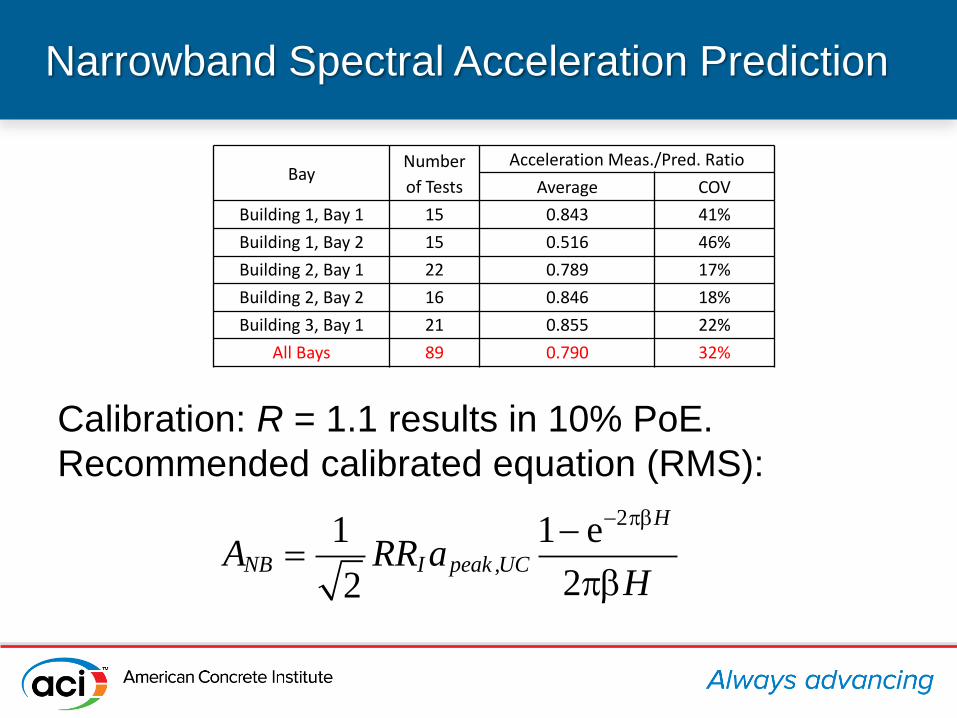
Narrowband Spectral Acceleration Prediction
Calibration: R = 1.1 results in 10% PoE.
Recommended calibrated equation (RMS):
2
,
1 1 e
22
H
NB I peak UCA RR aH
BayNumber
of Tests
Acceleration Meas./Pred. Ratio
Average COV
Building 1, Bay 1 15 0.843 41%
Building 1, Bay 2 15 0.516 46%
Building 2, Bay 1 22 0.789 17%
Building 2, Bay 2 16 0.846 18%
Building 3, Bay 1 21 0.855 22%
All Bays 89 0.790 32%
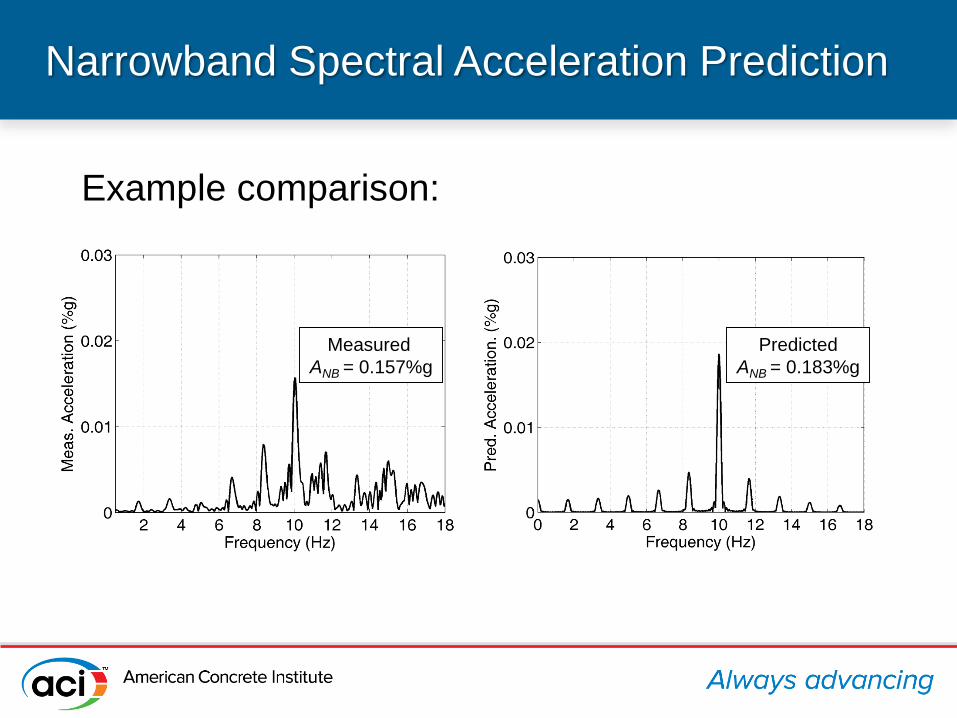
Narrowband Spectral Acceleration Prediction
Example comparison:
Measured
ANB = 0.157%g
Predicted
ANB = 0.183%g
One-Third Octave Spectral Velocity Prediction
Need a practical way to
predict this magnitude.
900 min./s.
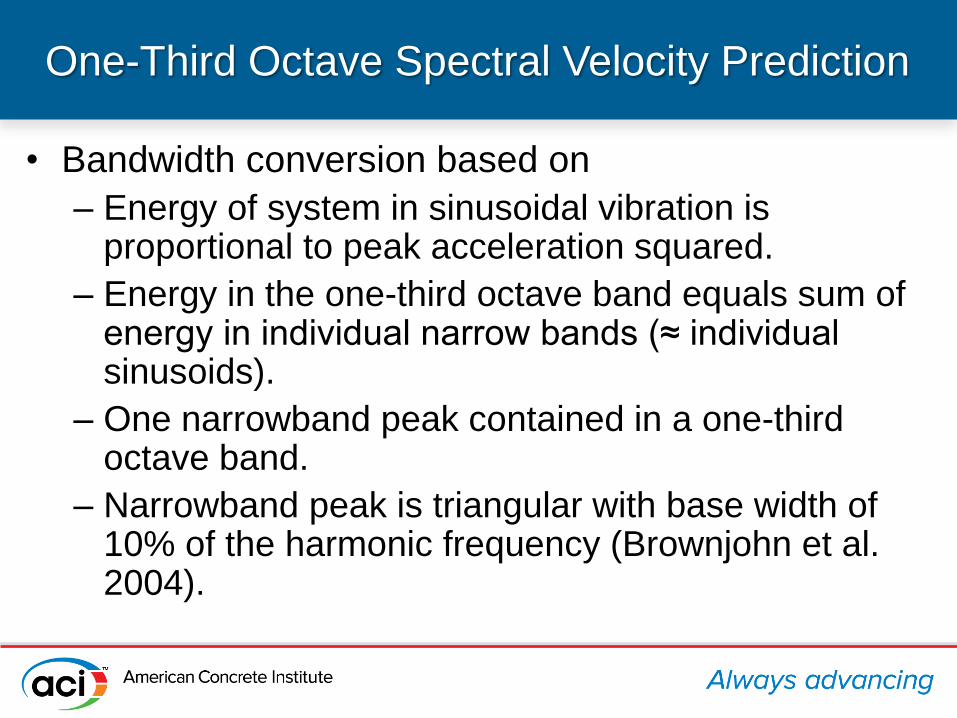
One-Third Octave Spectral Velocity Prediction
• Bandwidth conversion based on
– Energy of system in sinusoidal vibration is proportional to peak acceleration squared.
– Energy in the one-third octave band equals sum of energy in individual narrow bands (≈ individual sinusoids).
– One narrowband peak contained in a one-third octave band.
– Narrowband peak is triangular with base width of 10% of the harmonic frequency (Brownjohn et al. 2004).
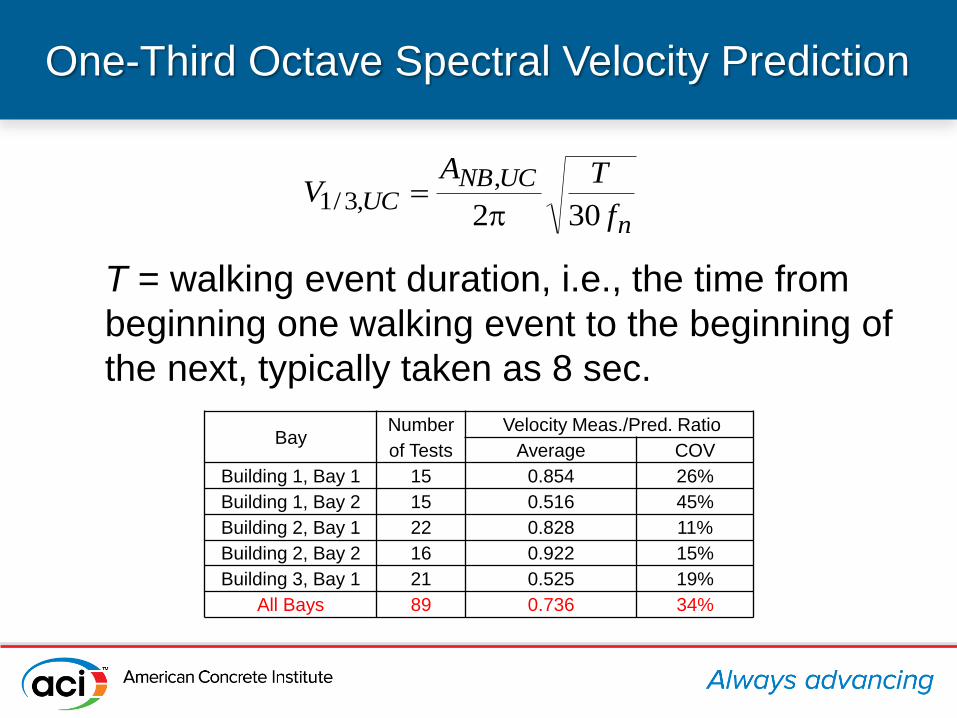
One-Third Octave Spectral Velocity Prediction
n
UCNBUC
f
TAV
302
,,3/1
T = walking event duration, i.e., the time from
beginning one walking event to the beginning of
the next, typically taken as 8 sec.
BayNumber
of Tests
Velocity Meas./Pred. Ratio
Average COV
Building 1, Bay 1 15 0.854 26%
Building 1, Bay 2 15 0.516 45%
Building 2, Bay 1 22 0.828 11%
Building 2, Bay 2 16 0.922 15%
Building 3, Bay 1 21 0.525 19%
All Bays 89 0.736 34%
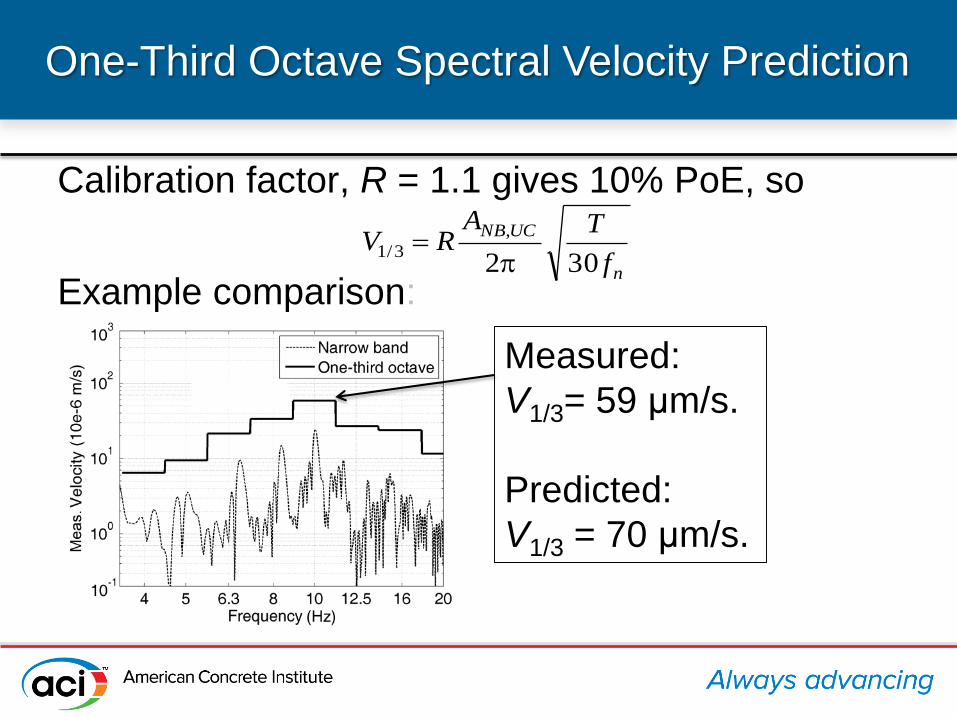
One-Third Octave Spectral Velocity Prediction
Calibration factor, R = 1.1 gives 10% PoE, so
n
UCNB
f
TARV
302
,
3/1
Example comparison:
Measured:
V1/3= 59 μm/s.
Predicted:
V1/3 = 70 μm/s.
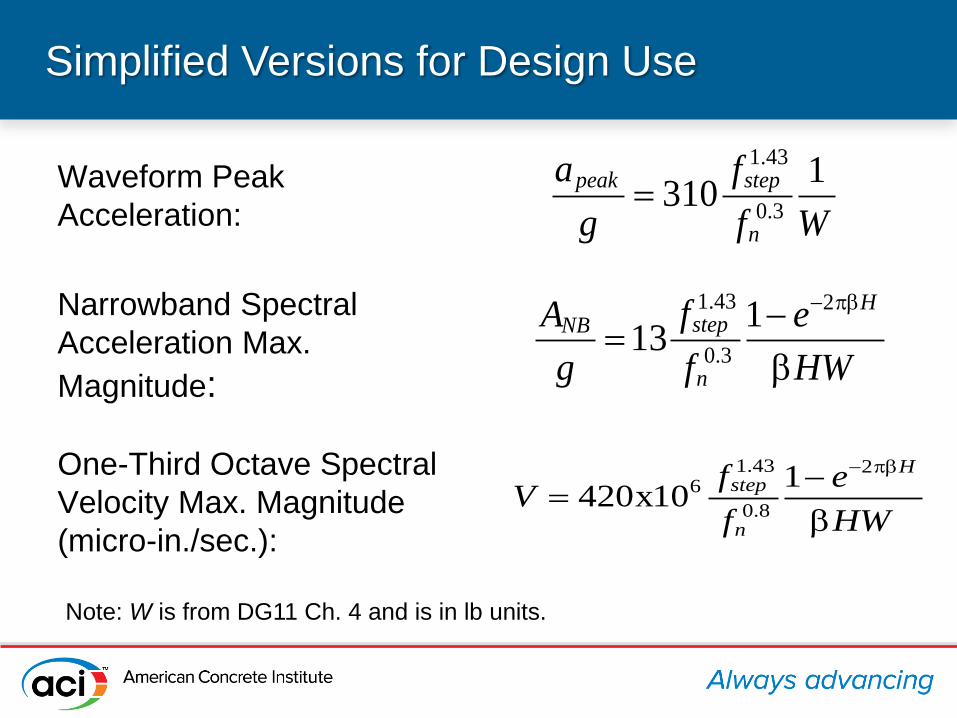
Simplified Versions for Design Use
1.43
0.3
1310
peak step
n
a f
g f W
Waveform Peak
Acceleration:
Note: W is from DG11 Ch. 4 and is in lb units.
Narrowband Spectral
Acceleration Max.
Magnitude:
1.43 2
0.3
113
HstepNB
n
fA e
g f HW
One-Third Octave Spectral
Velocity Max. Magnitude
(micro-in./sec.):
1.43 26
0.8
1420x10
Hstep
n
f eV
f HW
References
Brownjohn, J.M.W., Pavic, A., and Omenzetter, P. (2004). “A Spectral Density Approach
for Modelling Continuous Vertical Forces on Pedestrian Structures Due to Walking.” Can.
J. of Civ. Eng., 31(1), 65-77.
Liu, D. and Davis, B. (2014). "Walking Vibration Response of High-Frequency Floors
Supporting Sensitive Equipment." J. Struct. Eng., (In Press).
Murray, T. M., Allen, D. E., and Unger, E. E. (1997). Steel Design Guide Series 11: Floor
Vibrations Due to Human Activity, American Institute of Steel Construction, Chicago, IL.
Smith, A.L., Hicks, S.J., and Devine, P.J. (2007). Design of Floors for Vibration: A New
Approach, The Steel Construction Institute, Silwood Park, Ascot, Berkshire, UK.
Ungar, E.E., Zapfe, J.A., and Kemp, J.D. (2004). “Predicting Footfall-Induced Vibrations
of Floors.” Sound and Vibration, November, 16-22.
Thank You!!
Walking-Induced
Vibrations;
Bases and Limitations of
Evaluation Criteria and
Prediction Guides
Eric E. Ungar Acentech, [email protected]
Overview
•Vibration Evaluation Criteria
Human Perception and Comfort
Sensitive Equipment
•Prediction Tools and Approaches
Modal Analysis
Footfall Forces and Responses
•Notes regarding Design Guides
AISC Steel Design Guide 11 (1997)
Concrete Centre CCIP-016 (2006)
Steel Construction Institute SCI P354 (2007, rev. 2009)
European Joint Research Centre EUR 24084 EN (2009)
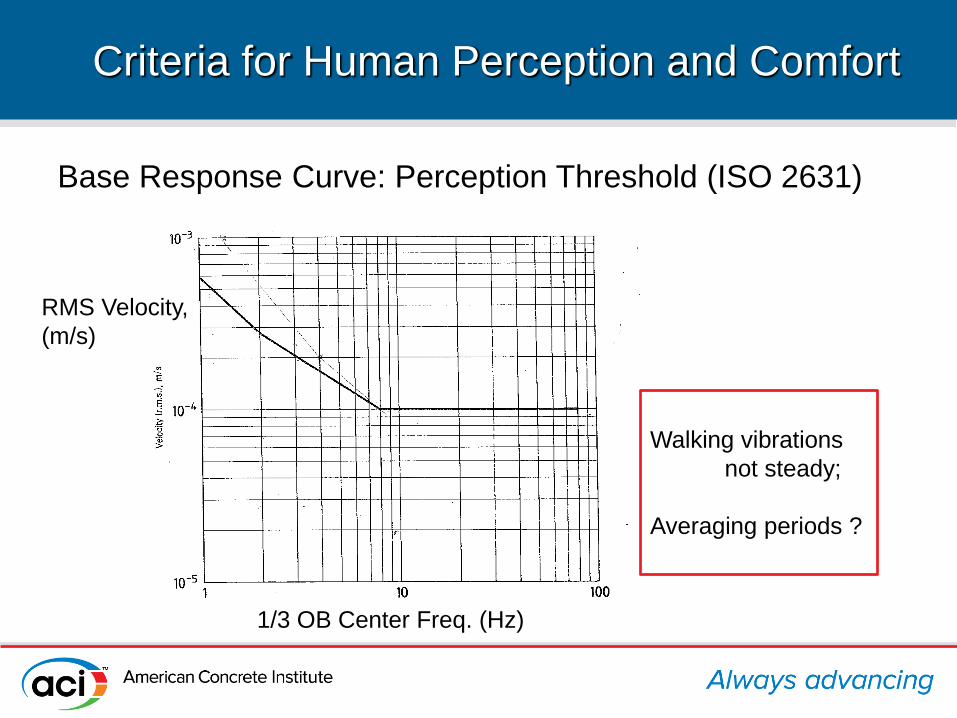
Criteria for Human Perception and Comfort
Base Response Curve: Perception Threshold (ISO 2631)
RMS Velocity,
(m/s)
1/3 OB Center Freq. (Hz)
Walking vibrations
not steady;
Averaging periods ?
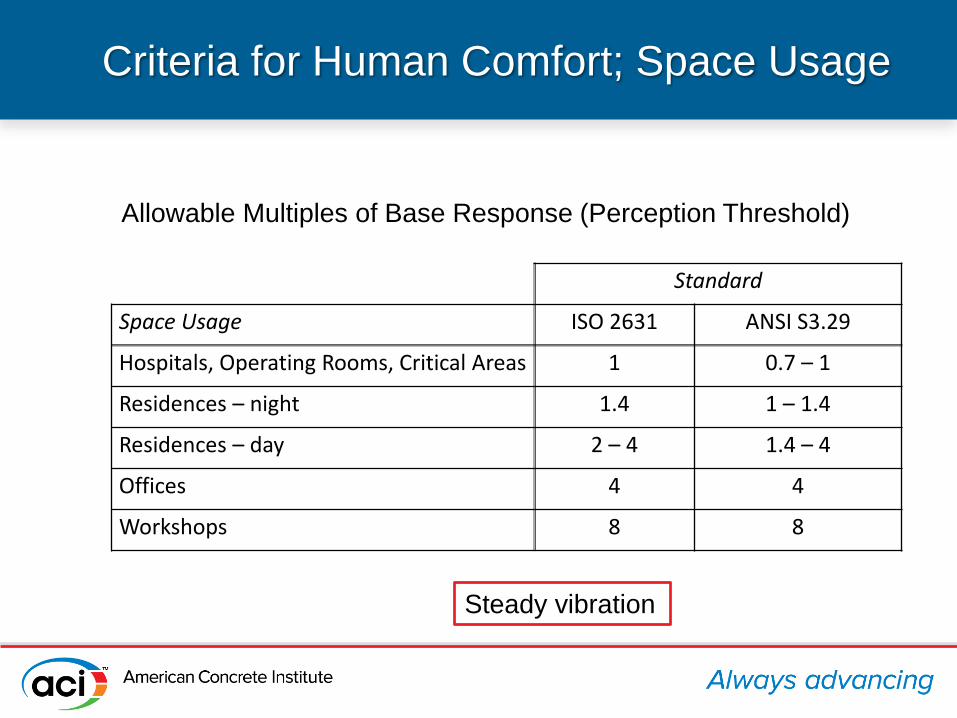
Criteria for Human Comfort; Space Usage
Standard
Space Usage ISO 2631 ANSI S3.29
Hospitals, Operating Rooms, Critical Areas 1 0.7 – 1
Residences – night 1.4 1 – 1.4
Residences – day 2 – 4 1.4 – 4
Offices 4 4
Workshops 8 8
Allowable Multiples of Base Response (Perception Threshold)
Steady vibration
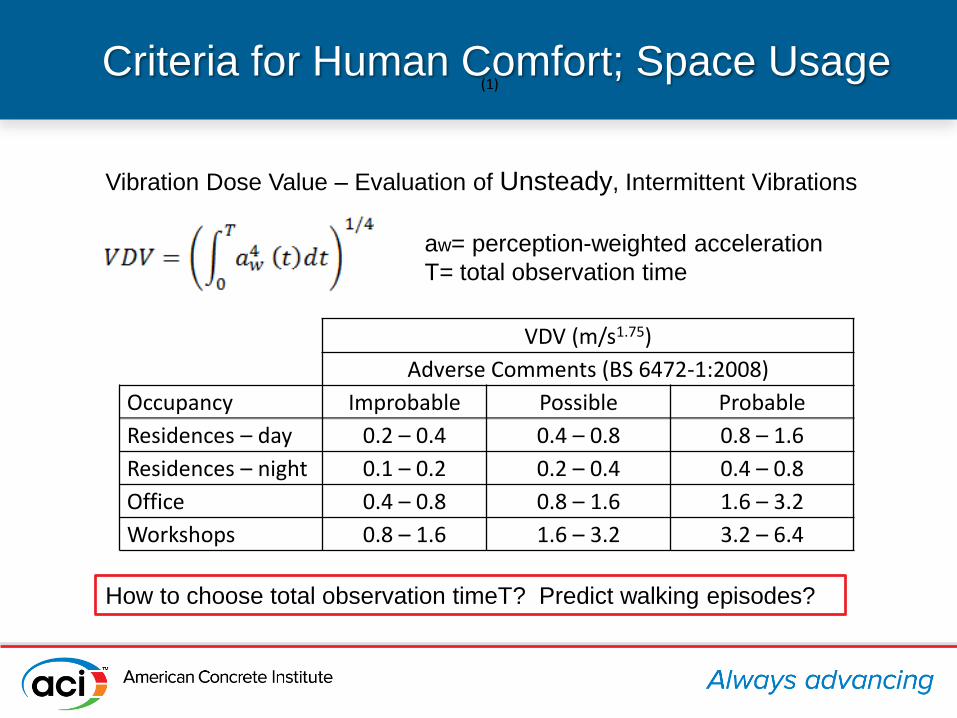
Criteria for Human Comfort; Space Usage(1)
Vibration Dose Value – Evaluation of Unsteady, Intermittent Vibrations
aw= perception-weighted acceleration
T= total observation time
VDV (m/s1.75)
Adverse Comments (BS 6472-1:2008)
Occupancy Improbable Possible Probable
Residences – day 0.2 – 0.4 0.4 – 0.8 0.8 – 1.6
Residences – night 0.1 – 0.2 0.2 – 0.4 0.4 – 0.8
Office 0.4 – 0.8 0.8 – 1.6 1.6 – 3.2
Workshops 0.8 – 1.6 1.6 – 3.2 3.2 – 6.4
How to choose total observation timeT? Predict walking episodes?
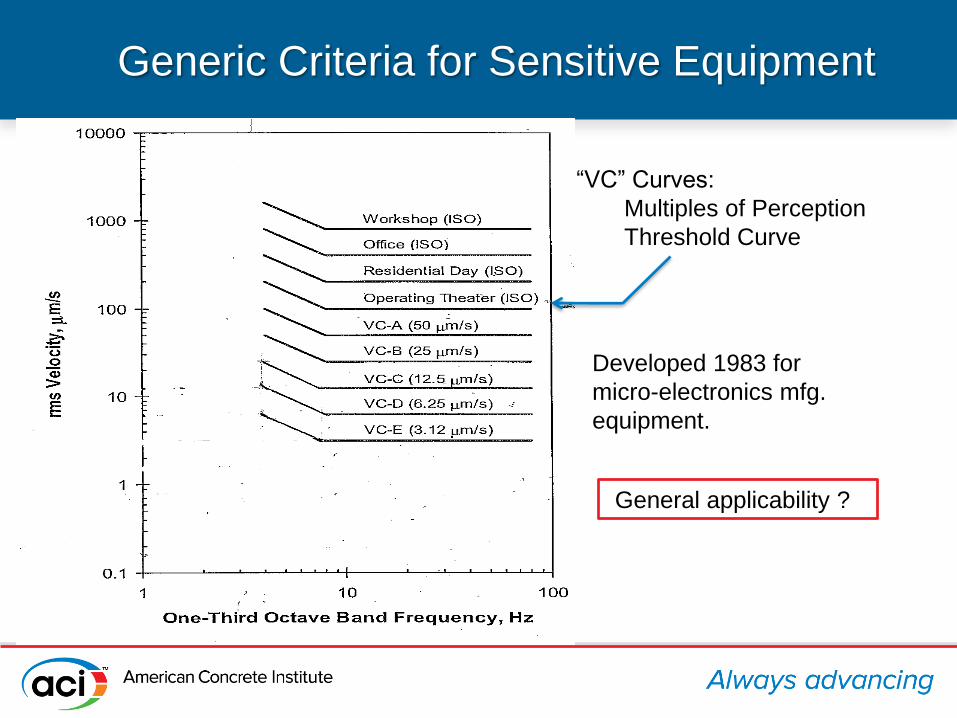
Generic Criteria for Sensitive Equipment
“VC” Curves:
Multiples of Perception
Threshold Curve
Developed 1983 for
micro-electronics mfg.
equipment.
General applicability ?
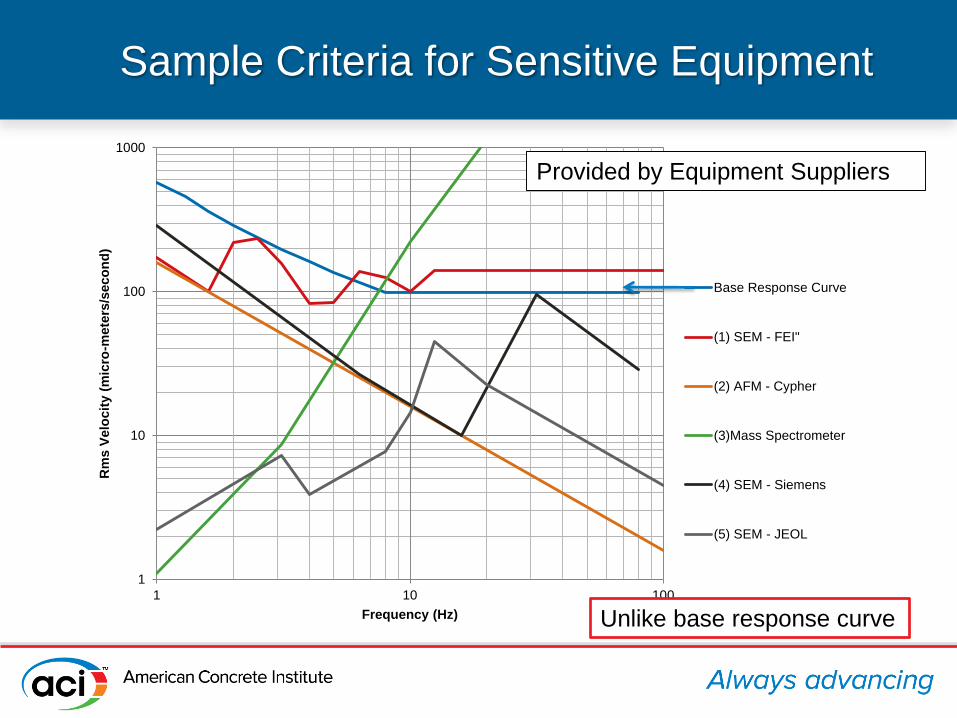
Sample Criteria for Sensitive Equipment
1
10
100
1000
1 10 100
Rm
s V
elo
cit
y (
mic
ro-m
ete
rs/s
eco
nd
)
Frequency (Hz)
Base Response Curve
(1) SEM - FEI"
(2) AFM - Cypher
(3)Mass Spectrometer
(4) SEM - Siemens
(5) SEM - JEOL
Provided by Equipment Suppliers
Unlike base response curve
Criteria from Suppliers of Sensitive Equipment
•Rarely fully defined
•Tend to overstate equipment sensitivity
•Often given only for most sensitive operating mode
•Acceptability of intermittent disturbances not stated
•Questionable basis:
Experimental shaking of multi-ton, multi-dollar instrument?
Uncertainties abound
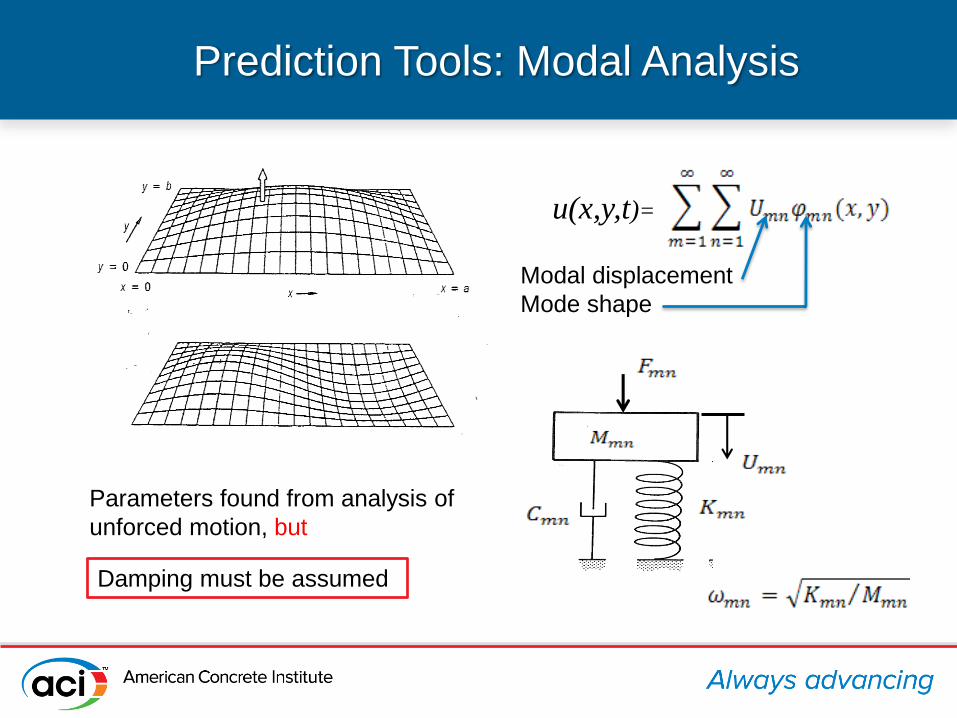
Prediction Tools: Modal Analysis
Modal displacement
Mode shape
Parameters found from analysis of
unforced motion, but
u(x,y,t)=
Damping must be assumed
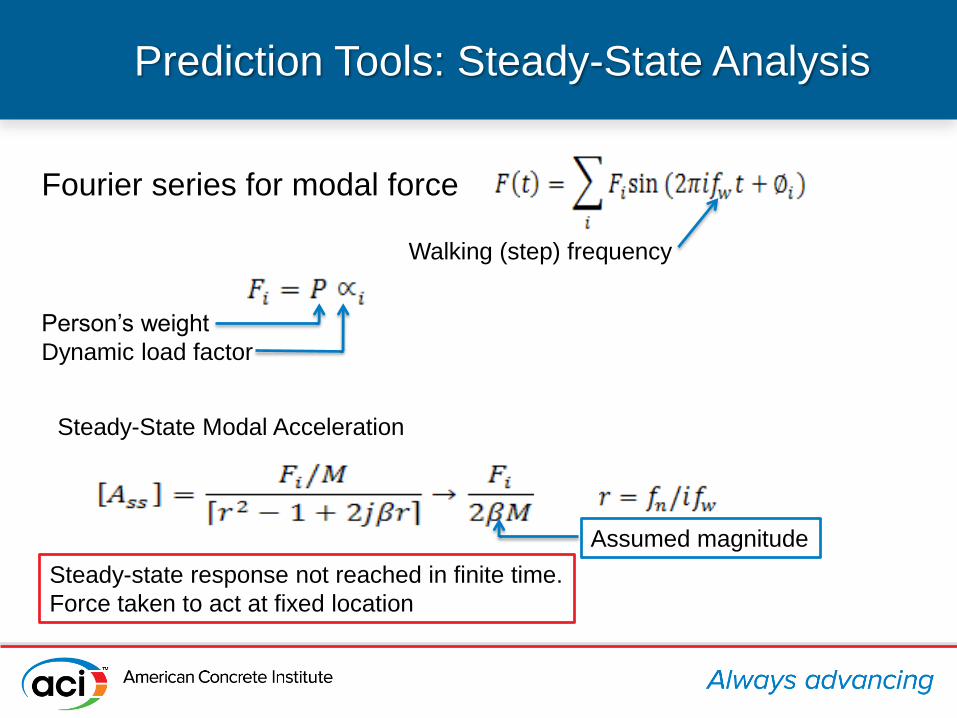
Prediction Tools: Steady-State Analysis
Fourier series for modal force
Walking (step) frequency
Person’s weight
Dynamic load factor
Steady-State Modal Acceleration
Steady-state response not reached in finite time.
Force taken to act at fixed location
Assumed magnitude
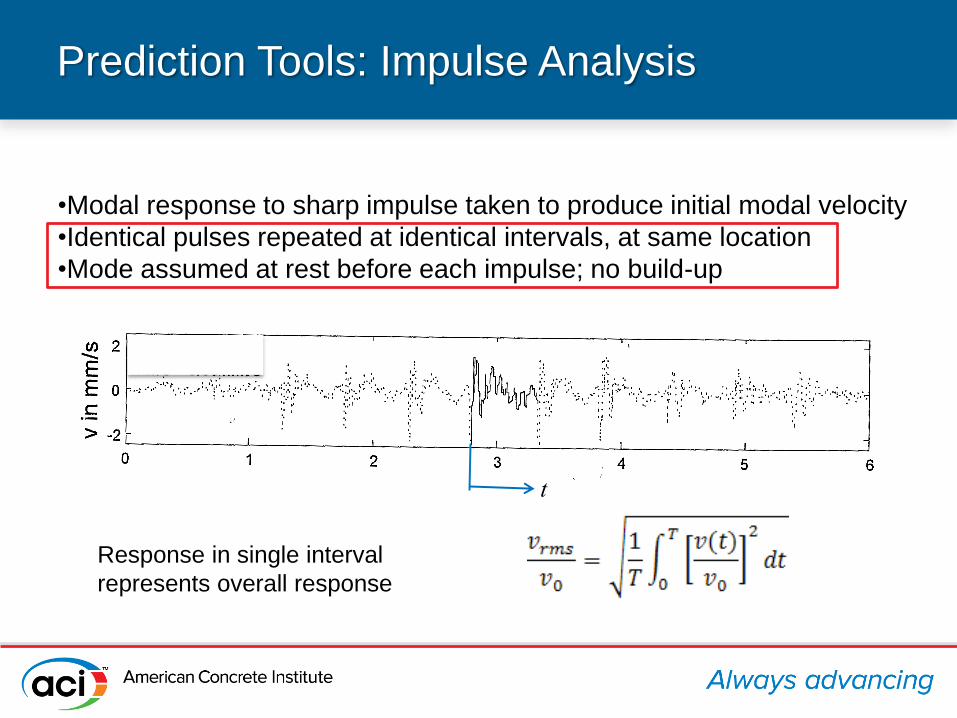
Prediction Tools: Impulse Analysis
•Modal response to sharp impulse taken to produce initial modal velocity
•Identical pulses repeated at identical intervals, at same location
•Mode assumed at rest before each impulse; no build-up
Response in single interval
represents overall response
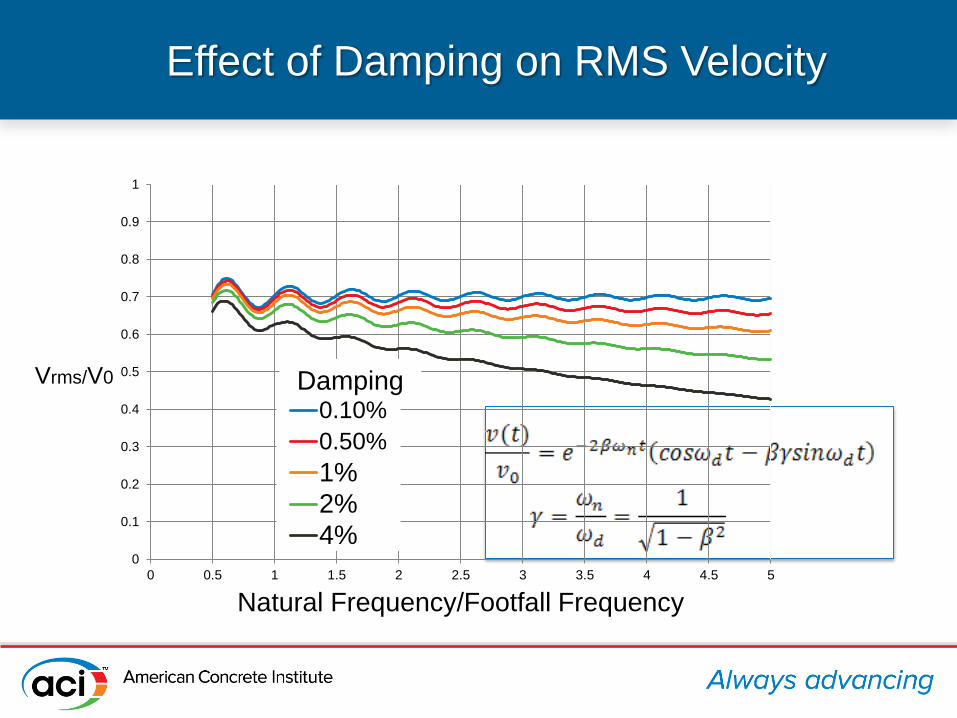
Effect of Damping on RMS Velocity
0
0.1
0.2
0.3
0.4
0.5
0.6
0.7
0.8
0.9
1
0 0.5 1 1.5 2 2.5 3 3.5 4 4.5 5
Vrms/V0
Natural Frequency/Footfall Frequency
0.10%
0.50%
1%2%4%
Damping
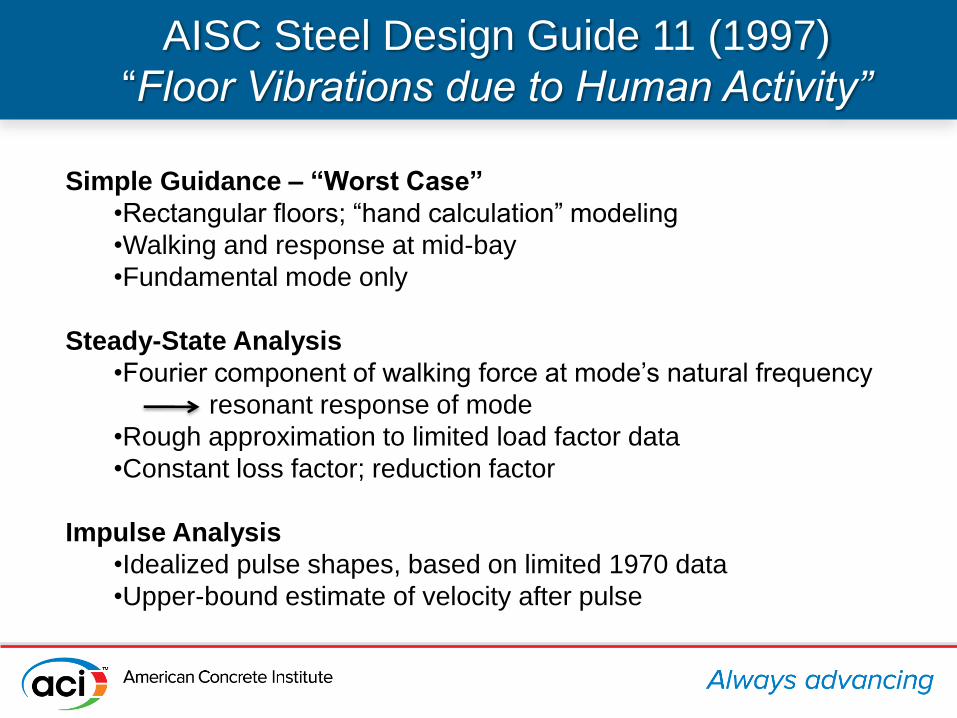
AISC Steel Design Guide 11 (1997)
“Floor Vibrations due to Human Activity”
Simple Guidance – “Worst Case”
•Rectangular floors; “hand calculation” modeling
•Walking and response at mid-bay
•Fundamental mode only
Steady-State Analysis
•Fourier component of walking force at mode’s natural frequency
resonant response of mode
•Rough approximation to limited load factor data
•Constant loss factor; reduction factor
Impulse Analysis
•Idealized pulse shapes, based on limited 1970 data
•Upper-bound estimate of velocity after pulse
Concrete Centre CCIP-016 (2006)“A Design Guide for Footfall Induced Vibrations of Structures”
•Finite-Element-Modeling for modes
•Any excitation and response points
•Ranges of walking speeds.
•Dynamic load factors and effective impulse based on extensive data
•Human comfort/acceptability; can be modified for other criteria
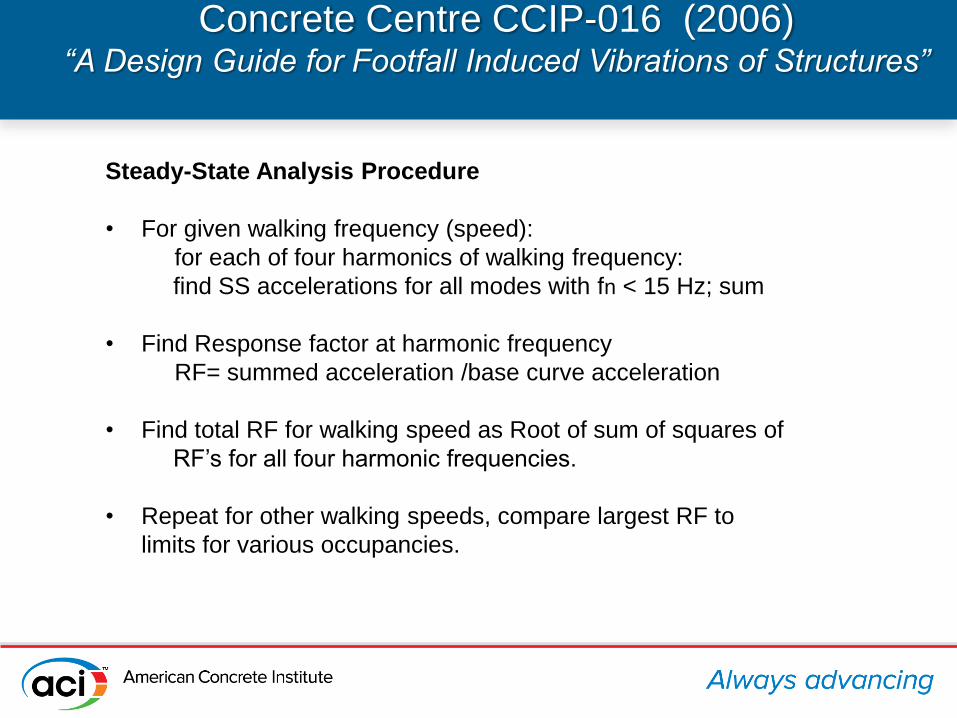
Concrete Centre CCIP-016 (2006)“A Design Guide for Footfall Induced Vibrations of Structures”
Steady-State Analysis Procedure
• For given walking frequency (speed):
for each of four harmonics of walking frequency:
find SS accelerations for all modes with fn < 15 Hz; sum
• Find Response factor at harmonic frequency
RF= summed acceleration /base curve acceleration
• Find total RF for walking speed as Root of sum of squares of
RF’s for all four harmonic frequencies.
• Repeat for other walking speeds, compare largest RF to
limits for various occupancies.
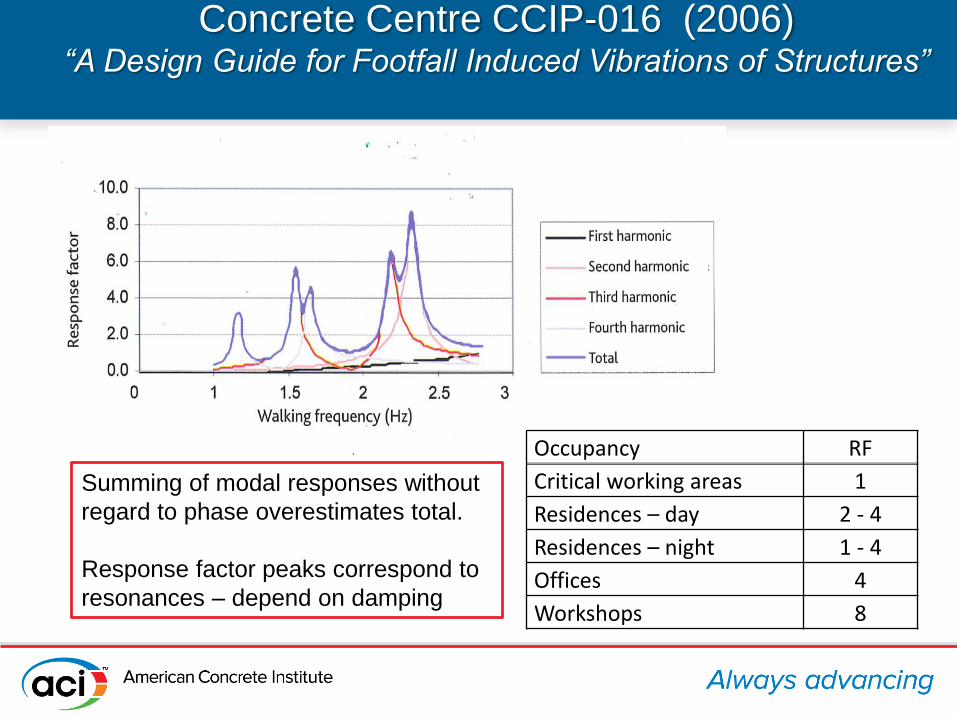
Concrete Centre CCIP-016 (2006)“A Design Guide for Footfall Induced Vibrations of Structures”
Occupancy RF
Critical working areas 1
Residences – day 2 - 4
Residences – night 1 - 4
Offices 4
Workshops 8
Summing of modal responses without
regard to phase overestimates total.
Response factor peaks correspond to
resonances – depend on damping
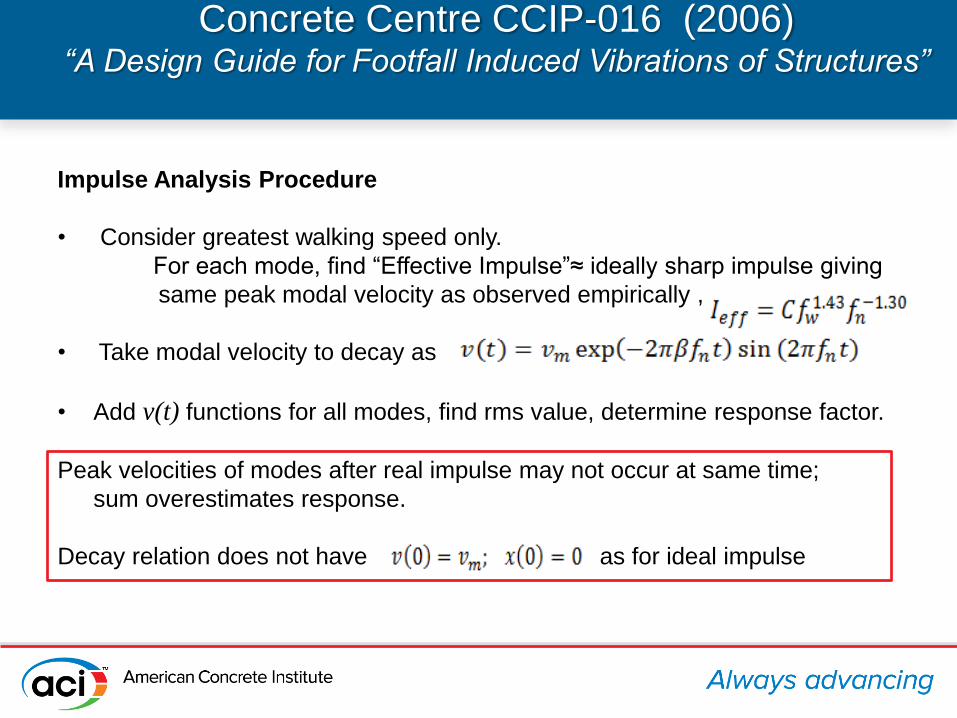
Concrete Centre CCIP-016 (2006)“A Design Guide for Footfall Induced Vibrations of Structures”
Impulse Analysis Procedure
• Consider greatest walking speed only.
For each mode, find “Effective Impulse”≈ ideally sharp impulse giving
same peak modal velocity as observed empirically ,
• Take modal velocity to decay as
• Add v(t) functions for all modes, find rms value, determine response factor.
Peak velocities of modes after real impulse may not occur at same time;
sum overestimates response.
Decay relation does not have as for ideal impulse
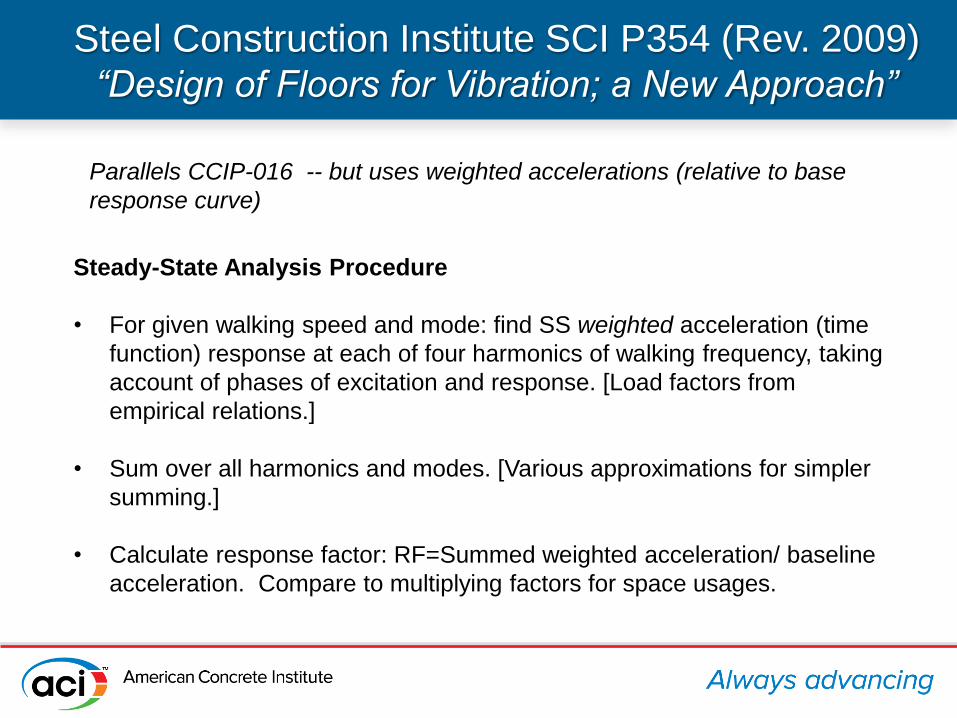
Steel Construction Institute SCI P354 (Rev. 2009)“Design of Floors for Vibration; a New Approach”
Steady-State Analysis Procedure
• For given walking speed and mode: find SS weighted acceleration (time
function) response at each of four harmonics of walking frequency, taking
account of phases of excitation and response. [Load factors from
empirical relations.]
• Sum over all harmonics and modes. [Various approximations for simpler
summing.]
• Calculate response factor: RF=Summed weighted acceleration/ baseline
acceleration. Compare to multiplying factors for space usages.
Parallels CCIP-016 -- but uses weighted accelerations (relative to base
response curve)
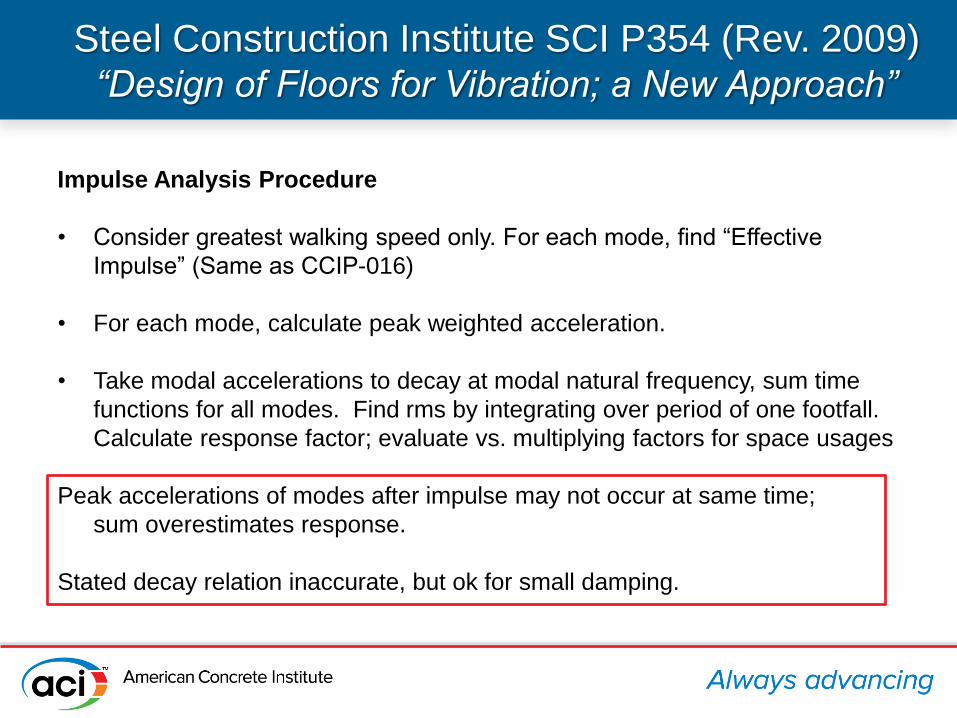
Steel Construction Institute SCI P354 (Rev. 2009)“Design of Floors for Vibration; a New Approach”
Impulse Analysis Procedure
• Consider greatest walking speed only. For each mode, find “Effective
Impulse” (Same as CCIP-016)
• For each mode, calculate peak weighted acceleration.
• Take modal accelerations to decay at modal natural frequency, sum time
functions for all modes. Find rms by integrating over period of one footfall.
Calculate response factor; evaluate vs. multiplying factors for space usages
Peak accelerations of modes after impulse may not occur at same time;
sum overestimates response.
Stated decay relation inaccurate, but ok for small damping.
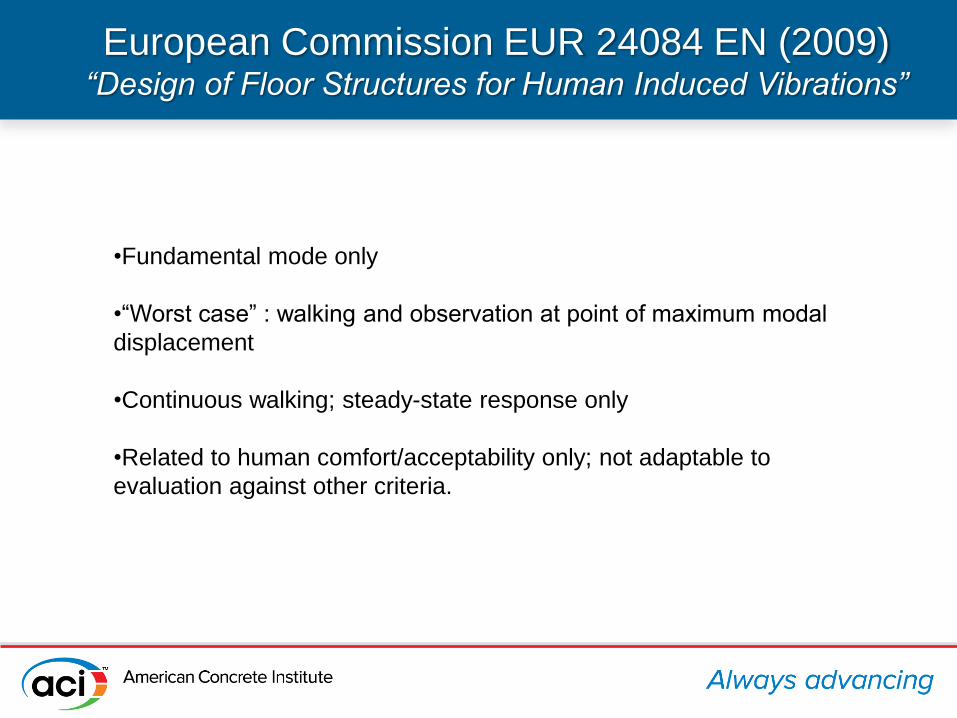
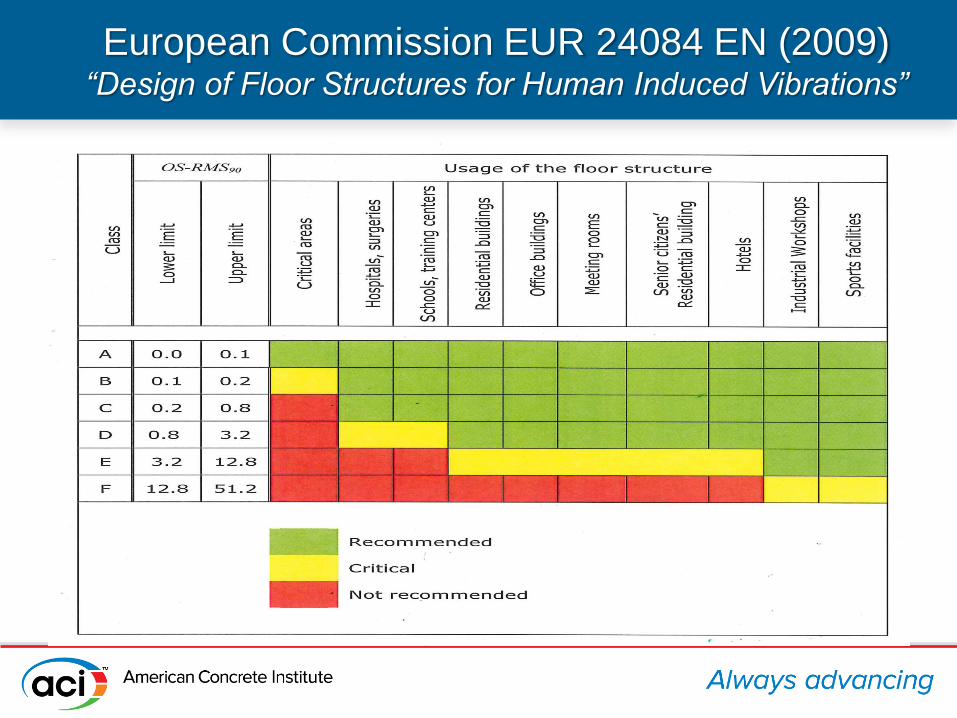
European Commission EUR 24084 EN (2009)“Design of Floor Structures for Human Induced Vibrations”
•Fundamental mode only
•“Worst case” : walking and observation at point of maximum modal
displacement
•Continuous walking; steady-state response only
•Related to human comfort/acceptability only; not adaptable to
evaluation against other criteria.
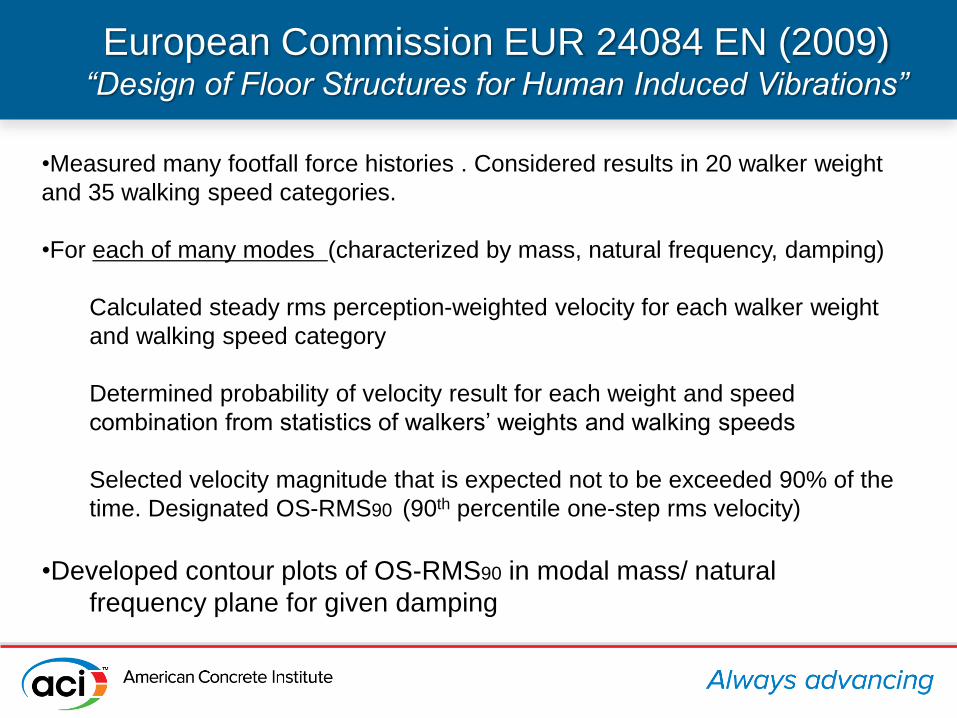
European Commission EUR 24084 EN (2009)“Design of Floor Structures for Human Induced Vibrations”
•Measured many footfall force histories . Considered results in 20 walker weight
and 35 walking speed categories.
•For each of many modes (characterized by mass, natural frequency, damping)
Calculated steady rms perception-weighted velocity for each walker weight
and walking speed category
Determined probability of velocity result for each weight and speed
combination from statistics of walkers’ weights and walking speeds
Selected velocity magnitude that is expected not to be exceeded 90% of the
time. Designated OS-RMS90 (90th percentile one-step rms velocity)
•Developed contour plots of OS-RMS90 in modal mass/ natural
frequency plane for given damping
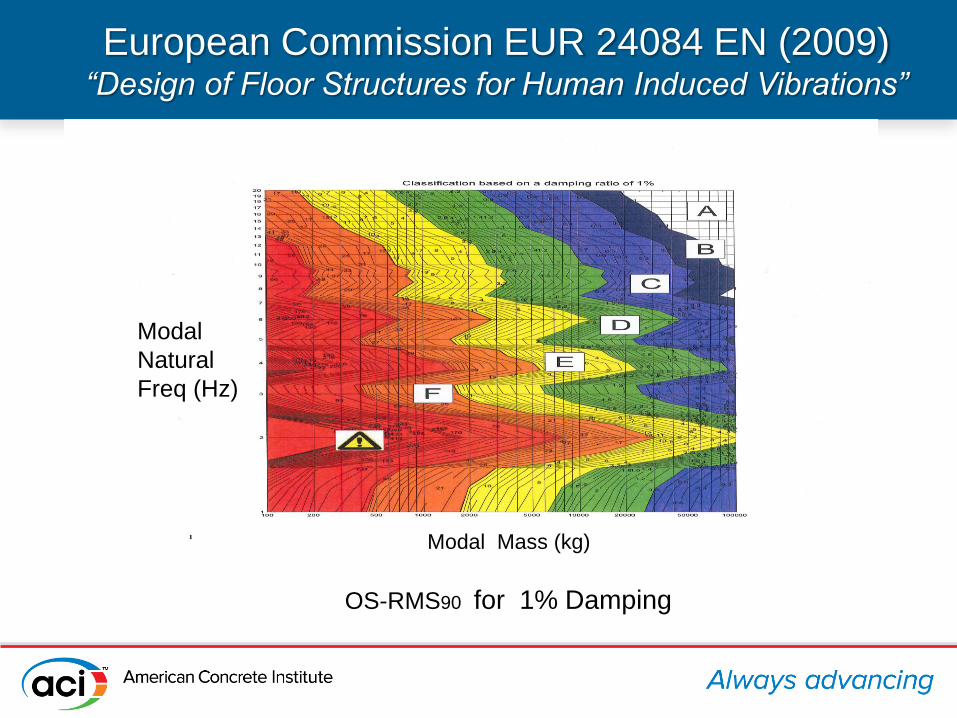
European Commission EUR 24084 EN (2009)“Design of Floor Structures for Human Induced Vibrations”
Modal Mass (kg)
OS-RMS90 for 1% Damping
Modal
Natural
Freq (Hz)
European Commission EUR 24084 EN (2009)“Design of Floor Structures for Human Induced Vibrations”
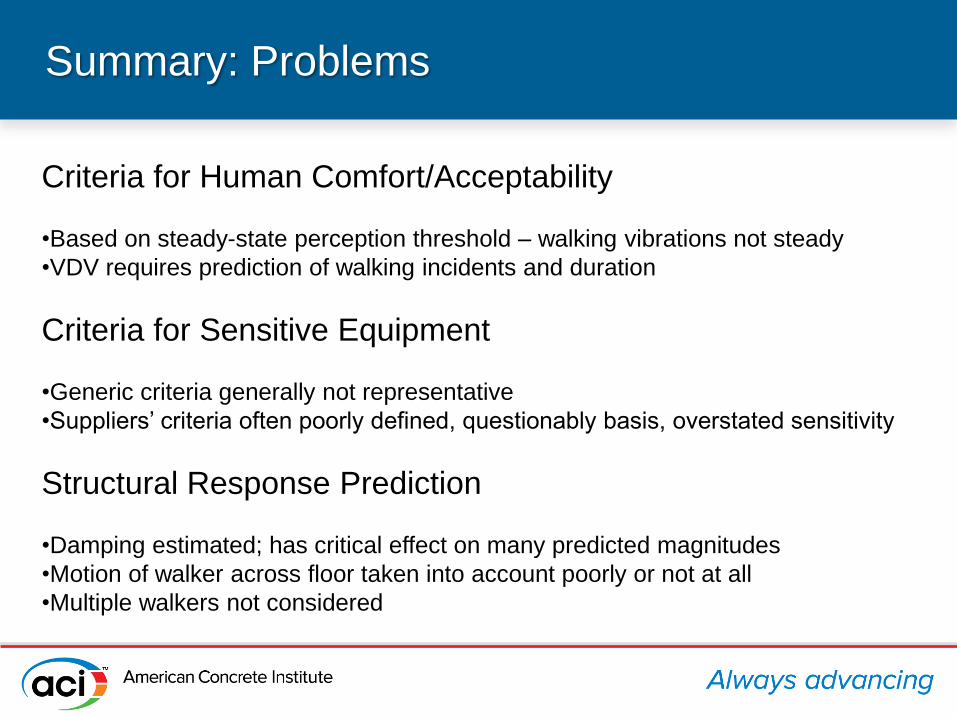
Summary: Problems
Criteria for Human Comfort/Acceptability
•Based on steady-state perception threshold – walking vibrations not steady
•VDV requires prediction of walking incidents and duration
Criteria for Sensitive Equipment
•Generic criteria generally not representative
•Suppliers’ criteria often poorly defined, questionably basis, overstated sensitivity
Structural Response Prediction
•Damping estimated; has critical effect on many predicted magnitudes
•Motion of walker across floor taken into account poorly or not at all
•Multiple walkers not considered
Conclusions
•Prediction and evaluation of vibrations of floors due to
walking involve considerable uncertainties.
•One should not expect results that are as precise and
reliable as those for usual structural calculations.
• Analytical prediction methods can be improved at the
cost of added complexity. Some advances already in
the literature.
Conclusions: What is needed
•Statistical studies of structures in specific categories
to calibrate simple prediction methods, obtain
confidence limits, adjustment factors to predicted
results.
•Better experimentally determined data on damping of
floor structures in specific categories.
•Standards for specifying vibration limits for classes of
sensitive equipment.
•Guidelines for considering effects of multiple walkers.
Development and validation of a physics
based footfall-induced vibration
methodology
Michael WillfordArup
San Francisco
Brief history of my work in floor vibration
• Started in 1981 with the design of the first long-span composite floor
building in Hong Kong
• Became familiar with the design methods of the time through David
Allen at NRC, Canada.
• On the Advisory Committee for the Steel Construction Institute
from1986 as they developed the first footfall vibration design guide in
the UK, published 1989.
• Through 1992 we continued to investigate how ideas in the SCI Guide
could be improved, firstly by better defining an ‘impulsive’ load
function for high frequency floors, and then by using finite element
analysis for irregular and multi-span floors
History of the new methods
• Our new analysis methods were developed (and adopted in Arup
design practice) by 1992
• Footfall force data was updated in 1997 following extensive tests by
Kerr
• Load functions and analysis methods published in final form at London
seminar in 2001
• Adopted by UK Concrete Society for post-tensioned floors in 2005
• Forms basis of UK Concrete Centre Design Guide published in 2006,
including additional design charts
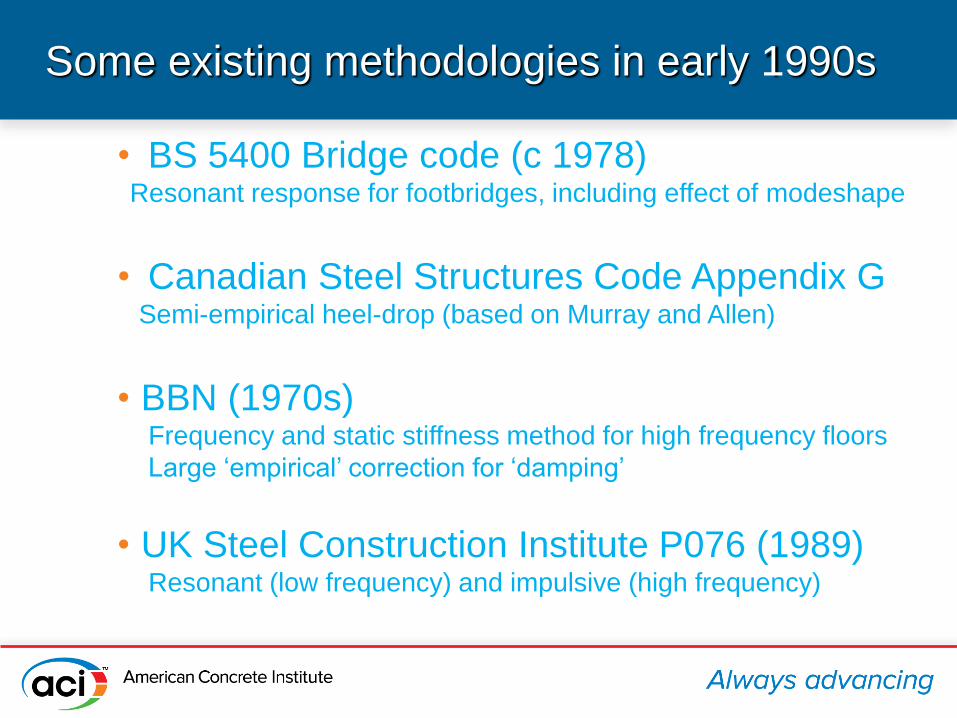
Some existing methodologies in early 1990s
• BS 5400 Bridge code (c 1978)Resonant response for footbridges, including effect of modeshape
• Canadian Steel Structures Code Appendix GSemi-empirical heel-drop (based on Murray and Allen)
• BBN (1970s)Frequency and static stiffness method for high frequency floors
Large ‘empirical’ correction for ‘damping’
• UK Steel Construction Institute P076 (1989)Resonant (low frequency) and impulsive (high frequency)
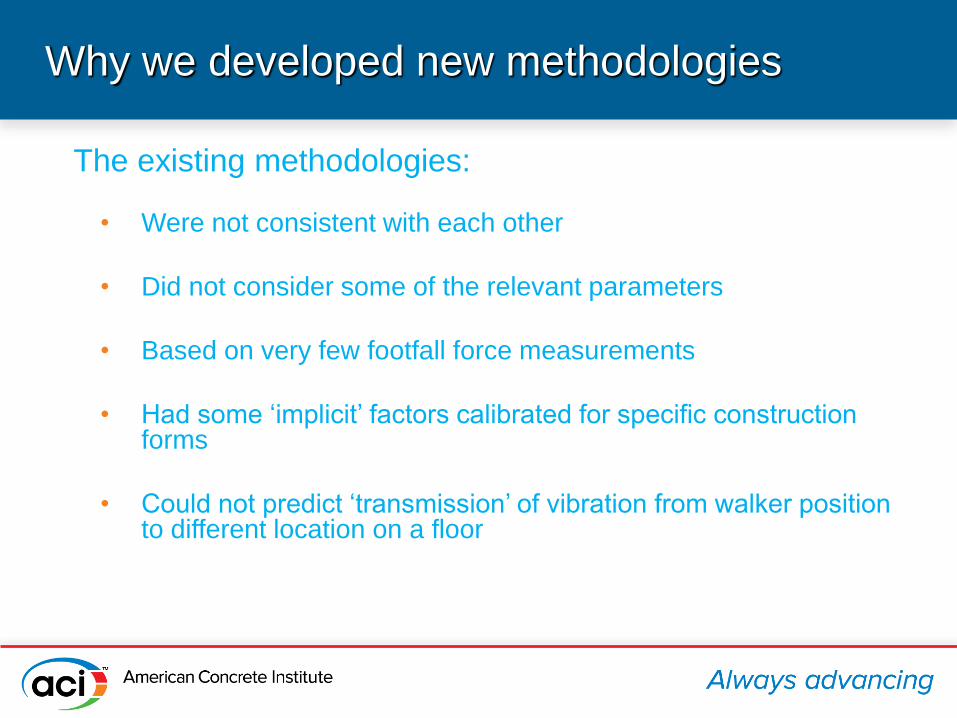
Why we developed new methodologies
• Were not consistent with each other
• Did not consider some of the relevant parameters
• Based on very few footfall force measurements
• Had some ‘implicit’ factors calibrated for specific construction forms
• Could not predict ‘transmission’ of vibration from walker position to different location on a floor
The existing methodologies:
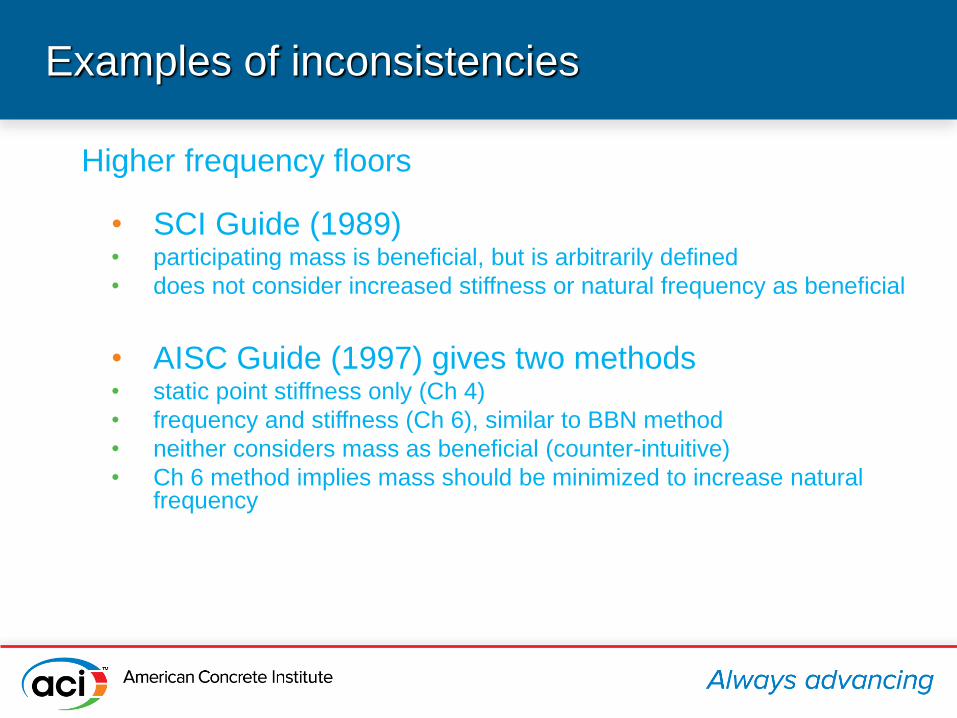
Examples of inconsistencies
• SCI Guide (1989)• participating mass is beneficial, but is arbitrarily defined
• does not consider increased stiffness or natural frequency as beneficial
• AISC Guide (1997) gives two methods• static point stiffness only (Ch 4)
• frequency and stiffness (Ch 6), similar to BBN method
• neither considers mass as beneficial (counter-intuitive)
• Ch 6 method implies mass should be minimized to increase natural frequency
Higher frequency floors
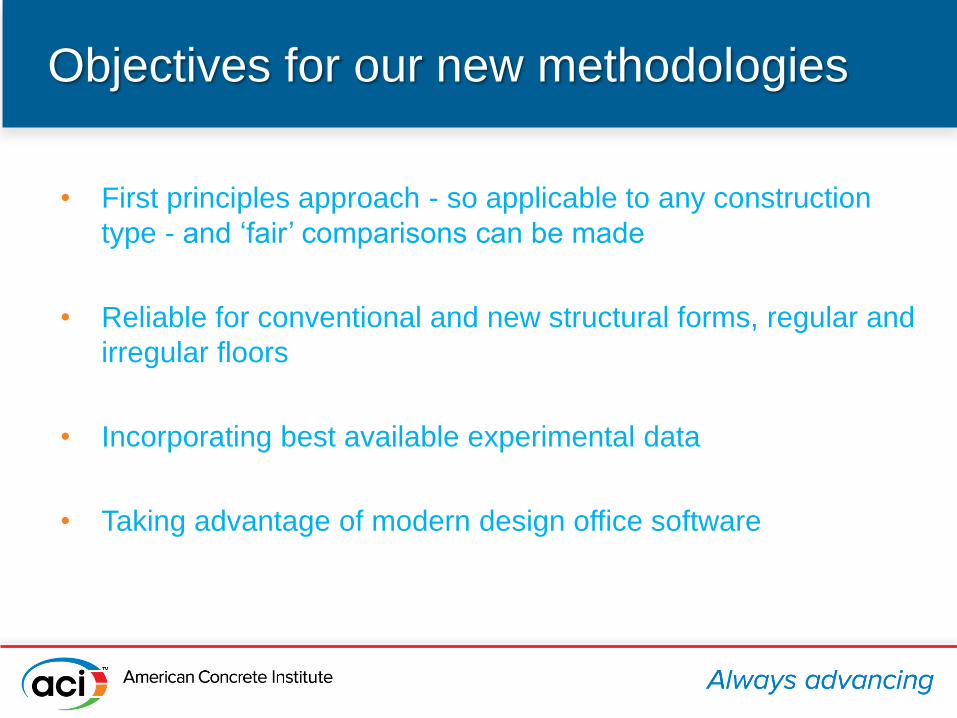
Objectives for our new methodologies
…
• First principles approach - so applicable to any construction
type - and ‘fair’ comparisons can be made
• Reliable for conventional and new structural forms, regular and
irregular floors
• Incorporating best available experimental data
• Taking advantage of modern design office software
Basis of new methodologies
• Performance-based dynamic simulation approach using:• Well established first principles dynamic methods (e.g. modal analysis)
• No empirical factors
• Footfall forces defined with statistical basis
• Validation in many completed buildings and bridges
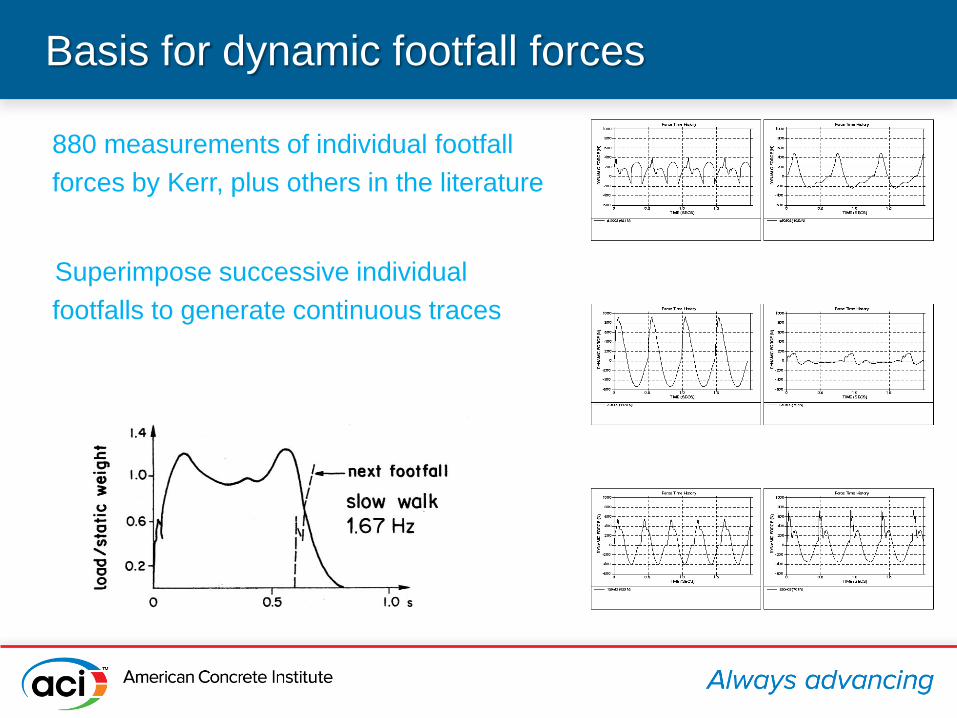
Basis for dynamic footfall forces
880 measurements of individual footfall
forces by Kerr, plus others in the literature
N Superimpose successive individual
footfalls to generate continuous traces
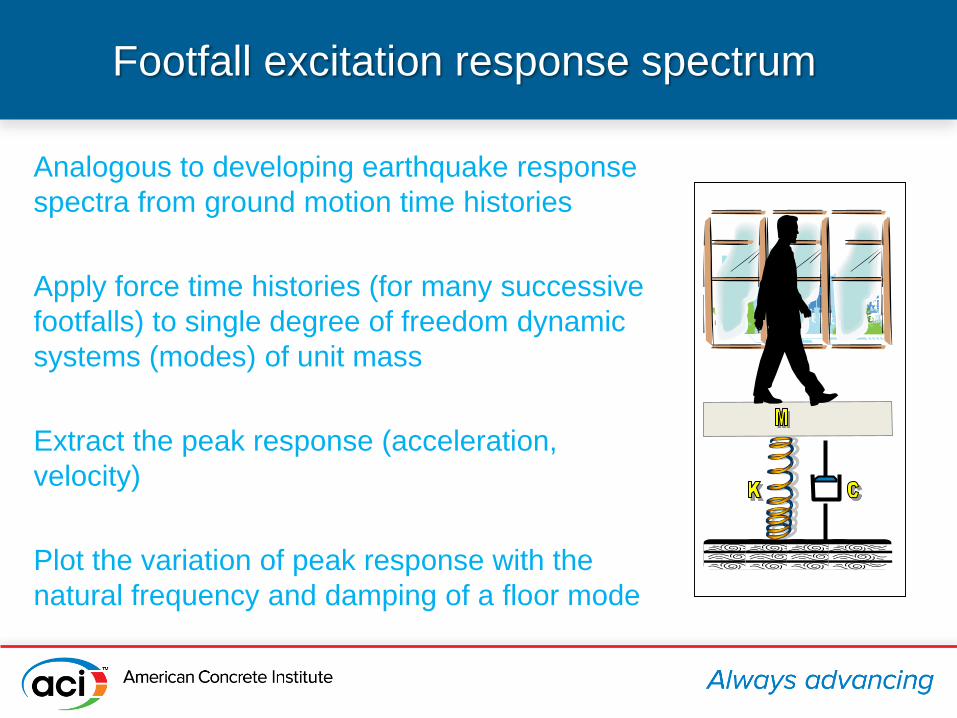
Footfall excitation response spectrum
Analogous to developing earthquake response
spectra from ground motion time histories
Apply force time histories (for many successive
footfalls) to single degree of freedom dynamic
systems (modes) of unit mass
Extract the peak response (acceleration,
velocity)
Plot the variation of peak response with the
natural frequency and damping of a floor mode
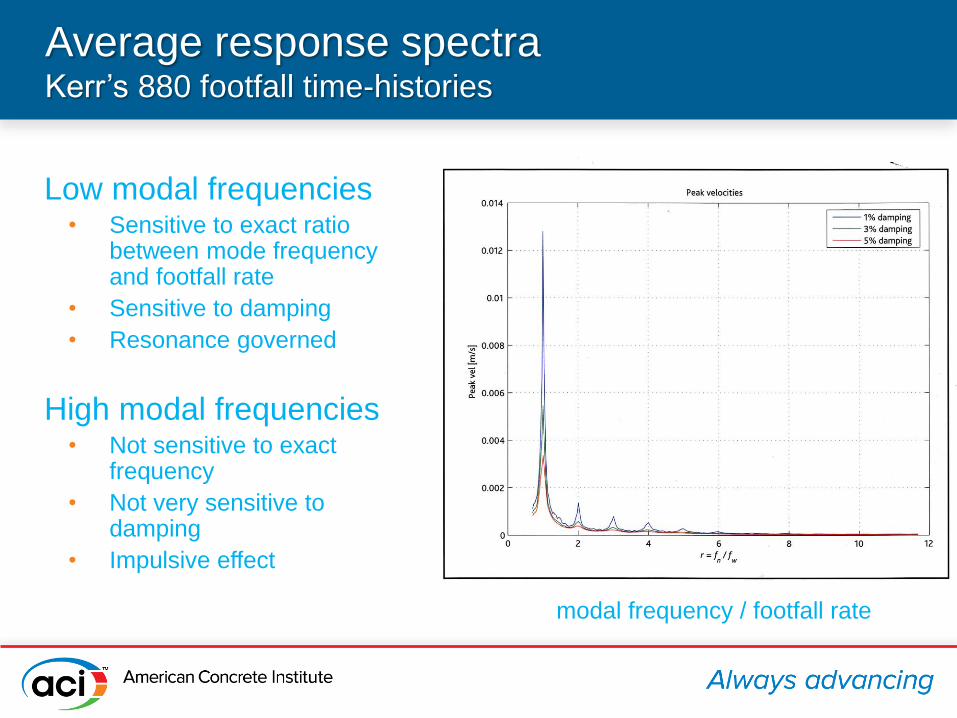
Average response spectraKerr’s 880 footfall time-histories
Low modal frequencies• Sensitive to exact ratio
between mode frequency and footfall rate
• Sensitive to damping
• Resonance governed
High modal frequencies• Not sensitive to exact
frequency
• Not very sensitive to damping
• Impulsive effect
modal frequency / footfall rate
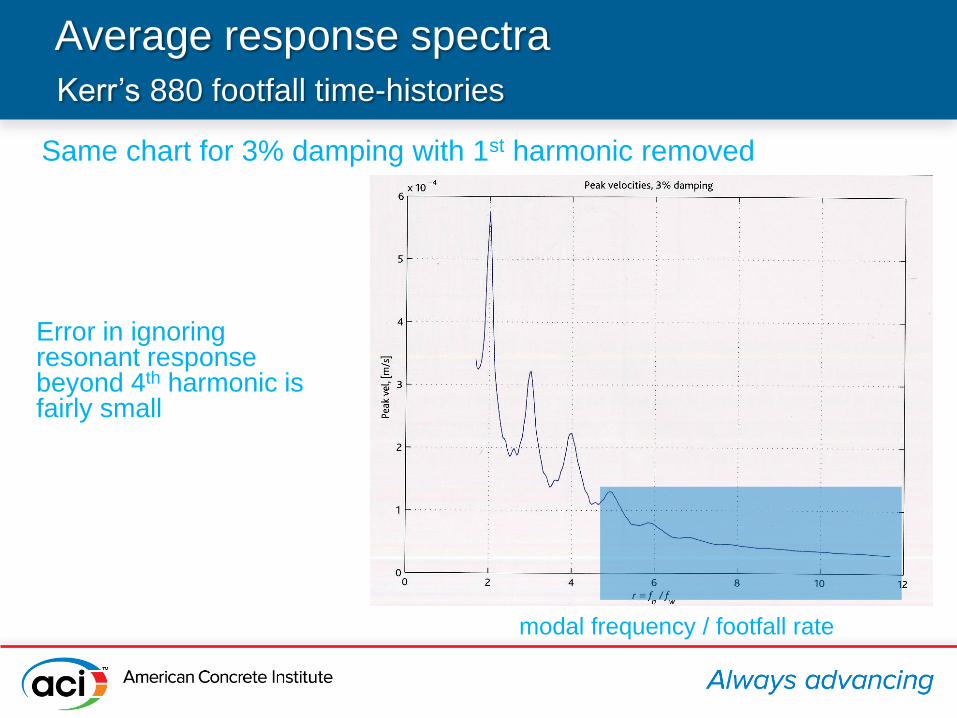
Average response spectra
Kerr’s 880 footfall time-histories
Error in ignoring resonant response beyond 4th harmonic is fairly small
modal frequency / footfall rate
Same chart for 3% damping with 1st harmonic removed
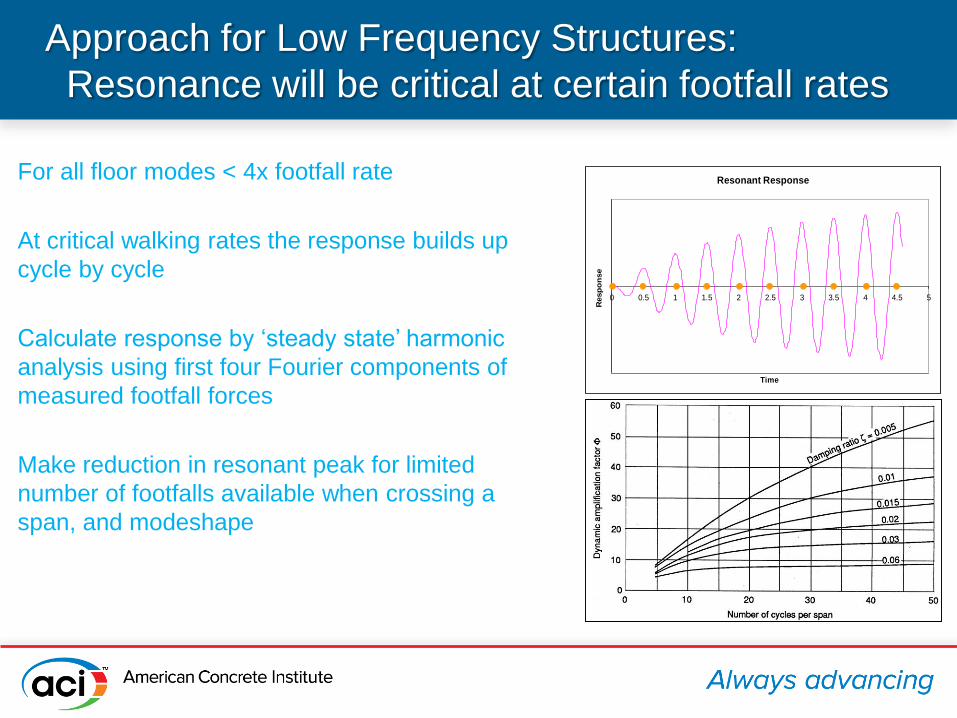
Approach for Low Frequency Structures:
Resonance will be critical at certain footfall rates
For all floor modes < 4x footfall rate
At critical walking rates the response builds up
cycle by cycle
Calculate response by ‘steady state’ harmonic
analysis using first four Fourier components of
measured footfall forces
Make reduction in resonant peak for limited
number of footfalls available when crossing a
span, and modeshape
Resonant Response
0 0.5 1 1.5 2 2.5 3 3.5 4 4.5 5
Time
Resp
on
se
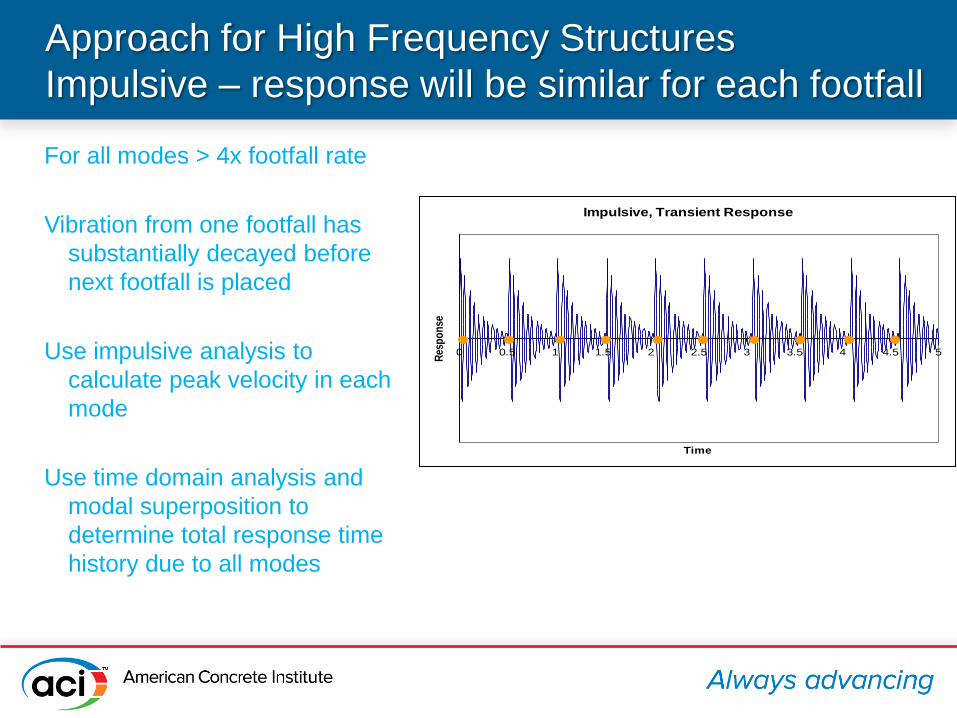
Approach for High Frequency Structures
Impulsive – response will be similar for each footfall
For all modes > 4x footfall rate
Vibration from one footfall has
substantially decayed before
next footfall is placed
Use impulsive analysis to
calculate peak velocity in each
mode
Use time domain analysis and
modal superposition to
determine total response time
history due to all modes
Impulsive, Transient Response
0 0.5 1 1.5 2 2.5 3 3.5 4 4.5 5
TimeR
esp
on
se
Statistical basis for footfall forces
We determined the harmonic and impulsive properties of a large number of continuous footfall force time histories derived by overlapping single footstep measurements:
• Kerr 1997 (over 880 measurements)
• Ellis
• Galbraith and Barton
• Rainer
• Ohlsson
• Wheeler
Determined mean values, coefficients of variation
Proposed ‘Design Values’ having 25% probability of excedance
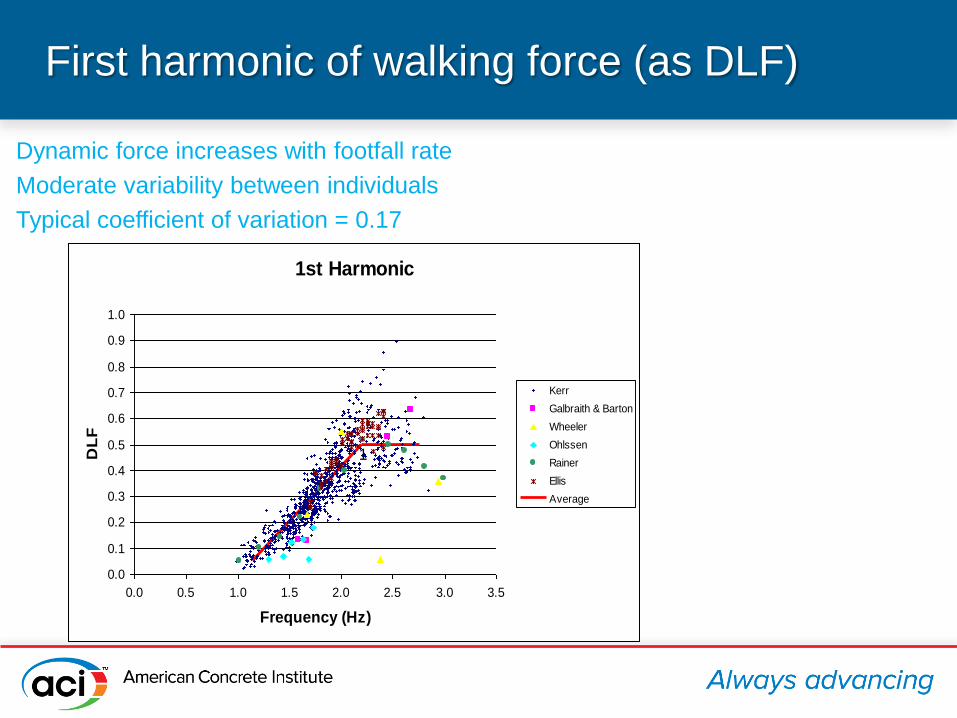
First harmonic of walking force (as DLF)
Dynamic force increases with footfall rate
Moderate variability between individuals
Typical coefficient of variation = 0.17
1st Harmonic
0.0
0.1
0.2
0.3
0.4
0.5
0.6
0.7
0.8
0.9
1.0
0.0 0.5 1.0 1.5 2.0 2.5 3.0 3.5
Frequency (Hz)
DL
F
Kerr
Galbraith & Barton
Wheeler
Ohlssen
Rainer
Ellis
Average
1
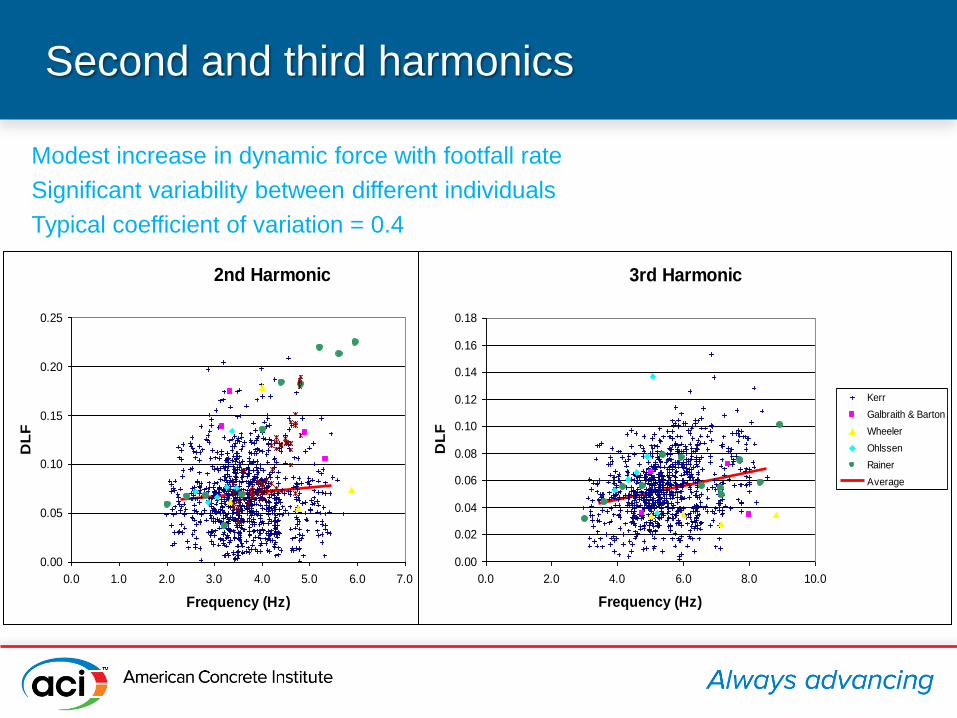
Second and third harmonics
Modest increase in dynamic force with footfall rate
Significant variability between different individuals
Typical coefficient of variation = 0.4
2nd Harmonic
0.00
0.05
0.10
0.15
0.20
0.25
0.0 1.0 2.0 3.0 4.0 5.0 6.0 7.0
Frequency (Hz)
DL
F
Kerr
Galbraith & Barton
Wheeler
Ohlssen
Rainer
Ellis
Average
3rd Harmonic
0.00
0.02
0.04
0.06
0.08
0.10
0.12
0.14
0.16
0.18
0.0 2.0 4.0 6.0 8.0 10.0
Frequency (Hz)
DL
F
Kerr
Galbraith & Barton
Wheeler
Ohlssen
Rainer
Average
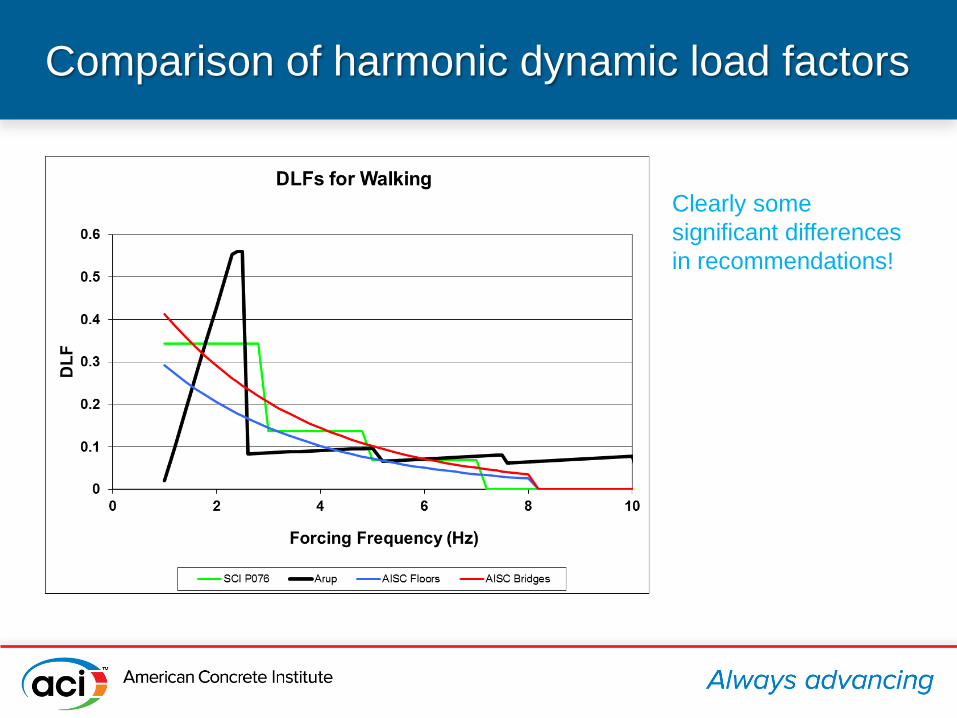
Comparison of harmonic dynamic load factors
Clearly some
significant differences
in recommendations!
High Frequency Floors
Impulsive analysis of footfall traces
• We determined the peak velocity vp due to each footfall force time
history applied to a SDOF mode of natural frequency fn
• We define a single effective impulse that would induce the same
peak velocity. (This is a proxy for the real force function)
• Effective impulse Ie = vp / M
where M is modal mass
• We find that Ie is a function of footfall rate and of mode natural
frequency
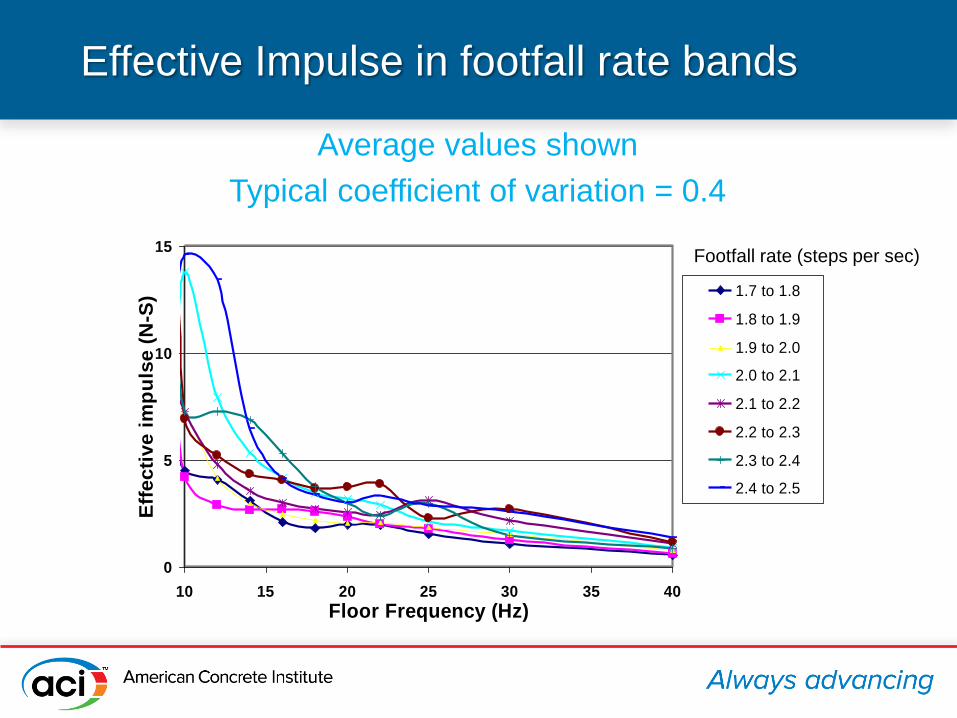
Effective Impulse in footfall rate bands
Average values shown
Typical coefficient of variation = 0.4
0
5
10
15
10 15 20 25 30 35 40
Floor Frequency (Hz)
Eff
ecti
ve i
mp
uls
e (
N-S
) 1.7 to 1.8
1.8 to 1.9
1.9 to 2.0
2.0 to 2.1
2.1 to 2.2
2.2 to 2.3
2.3 to 2.4
2.4 to 2.5
Footfall rate (steps per sec)
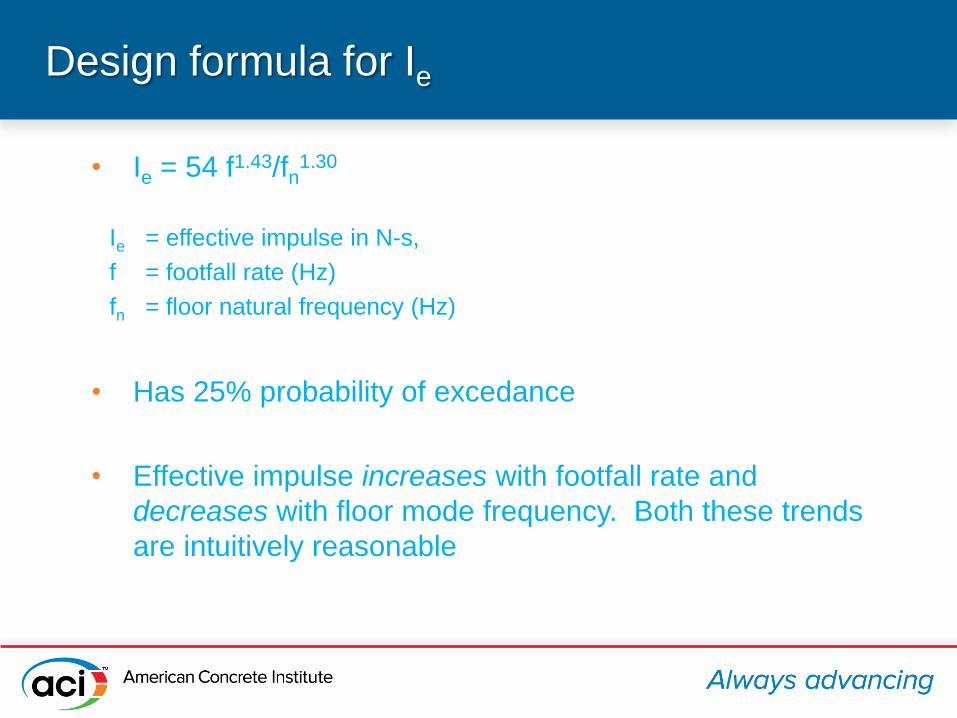
Design formula for Ie
• Ie = 54 f1.43/fn1.30
Ie = effective impulse in N-s,
f = footfall rate (Hz)
fn = floor natural frequency (Hz)
• Has 25% probability of excedance
• Effective impulse increases with footfall rate and
decreases with floor mode frequency. Both these trends
are intuitively reasonable
Basis of response calculations
• Response calculations use classical modal analysis and superposition
theory
• Modal properties of structures (natural frequencies, mode-shapes, modal
masses) may be calculated by hand for simple cases – by finite element
analysis for more complex cases
• Damping must be estimated from measurements on similar structures
• An adequate number of modes must be included in the response
calculation, usually ALL modes with frequencies within a factor of 2 of the
first mode.
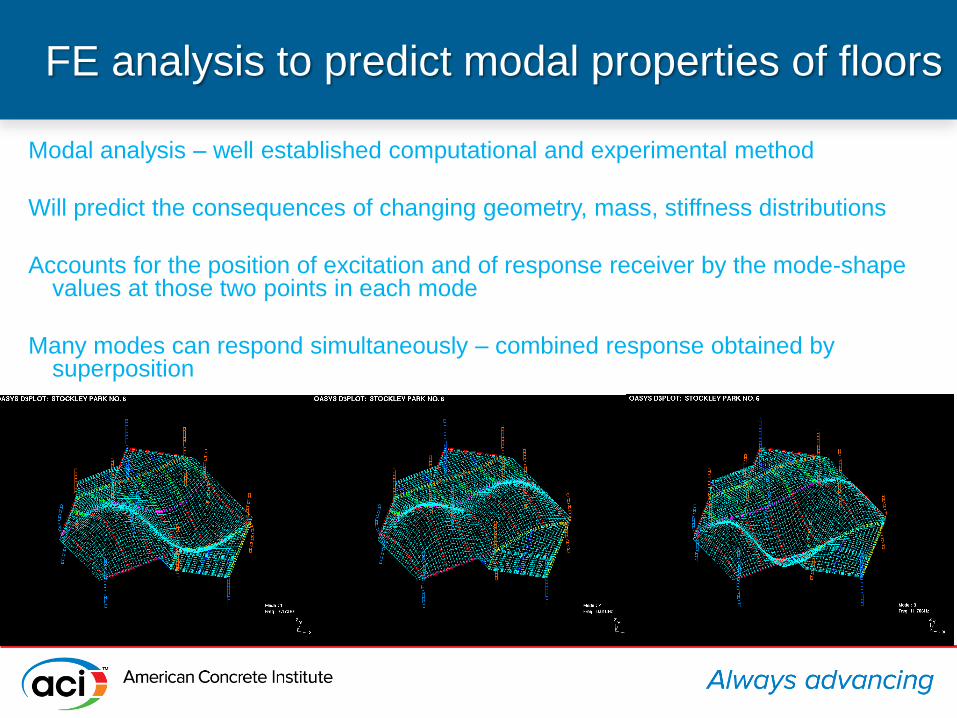
FE analysis to predict modal properties of floors
Modal analysis – well established computational and experimental method
Will predict the consequences of changing geometry, mass, stiffness distributions
Accounts for the position of excitation and of response receiver by the mode-shape values at those two points in each mode
Many modes can respond simultaneously – combined response obtained by superposition The method permits the response at a receiver point to be determined du
walking at a (different) excitation point.
Implementation of Response Calculations
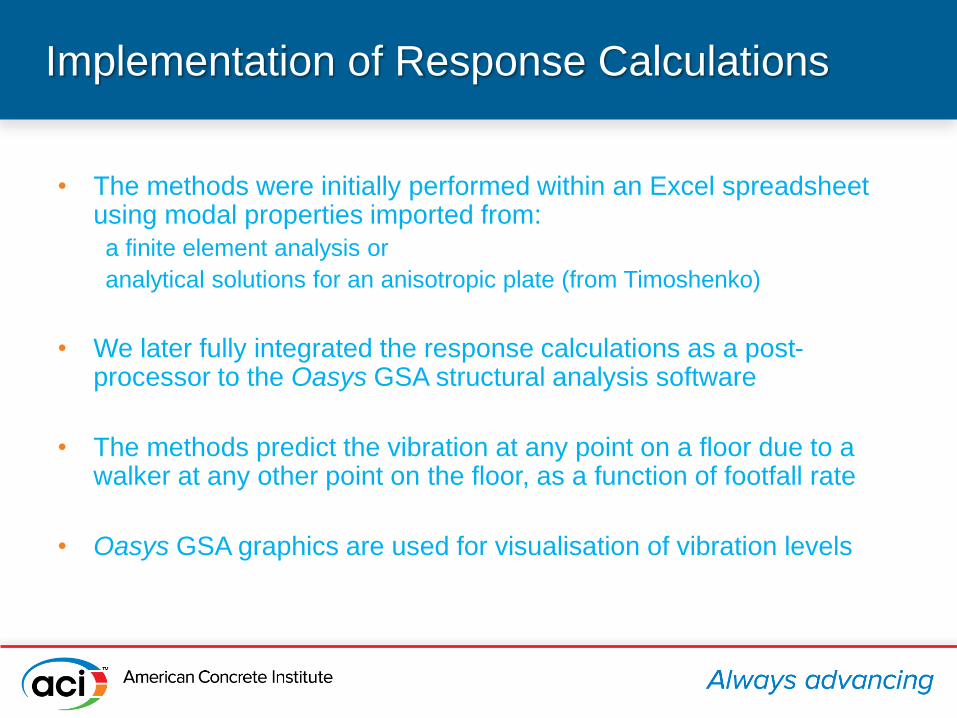
• The methods were initially performed within an Excel spreadsheet using modal properties imported from:
a finite element analysis or
analytical solutions for an anisotropic plate (from Timoshenko)
• We later fully integrated the response calculations as a post-processor to the Oasys GSA structural analysis software
• The methods predict the vibration at any point on a floor due to a walker at any other point on the floor, as a function of footfall rate
• Oasys GSA graphics are used for visualisation of vibration levels
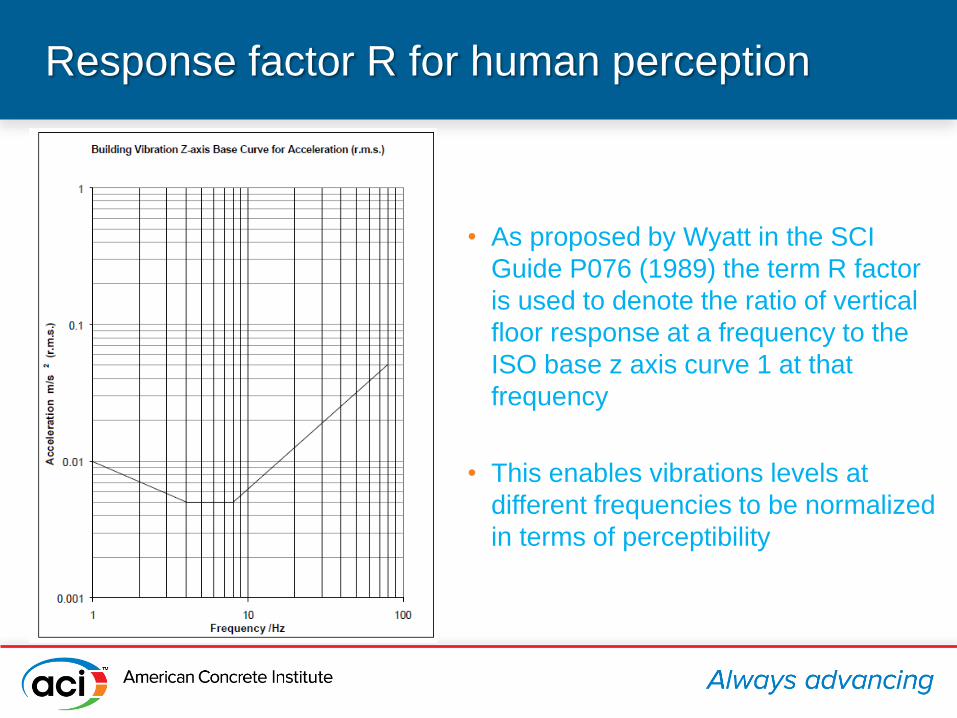
Response factor R for human perception
• As proposed by Wyatt in the SCI
Guide P076 (1989) the term R factor
is used to denote the ratio of vertical
floor response at a frequency to the
ISO base z axis curve 1 at that
frequency
• This enables vibrations levels at
different frequencies to be normalized
in terms of perceptibility
Lower frequency floor calculation procedure
• Steady state calculation is in frequency domain
• For each footfall rate, the ‘complex’ transfer function between the excitation point and the response point is calculated for each participating mode and each of the 4 harmonics
• The steady state response is then calculated exactly for each harmonic of the footfall force. The resonant part of the response is corrected for limited number of footfalls.
• The responses in each harmonic are frequency weighted for human perception (to become R factors)
• The R factors due to each harmonic are combined by the SRSS method to estimate a total perceptibility rating R
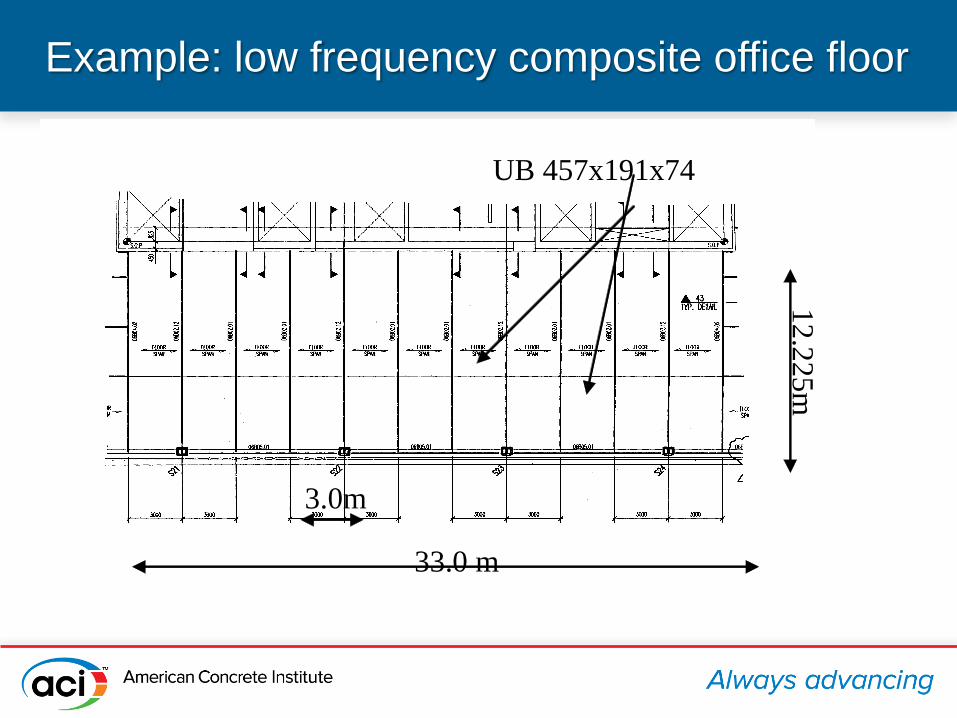
Example: low frequency composite office floor
12
.225
m
33.0 m
UB 457x191x74
3.0m
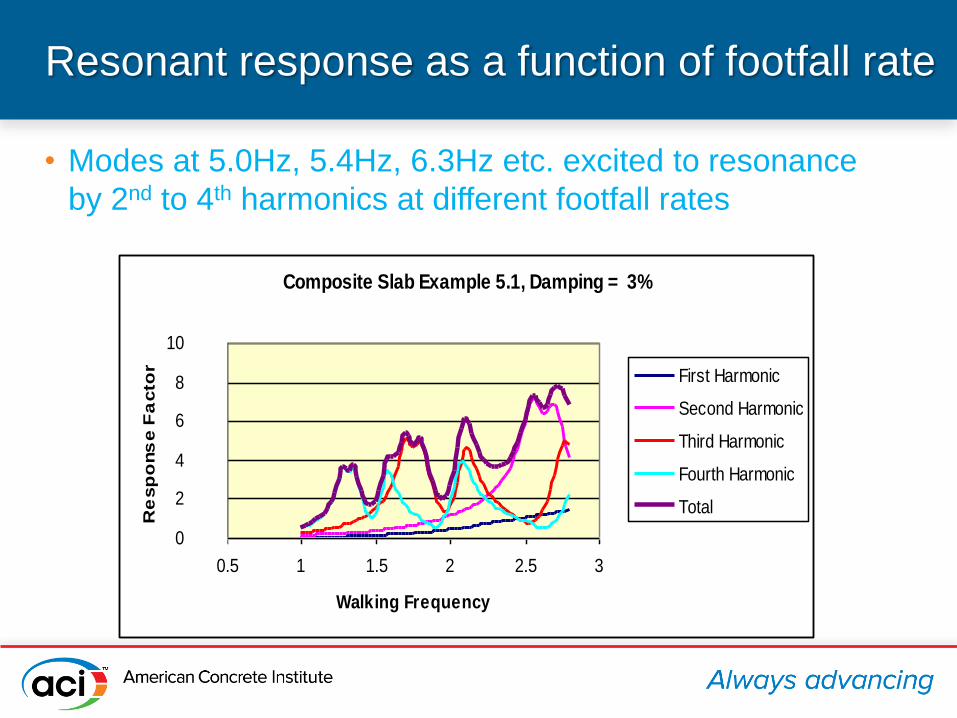
Resonant response as a function of footfall rate
• Modes at 5.0Hz, 5.4Hz, 6.3Hz etc. excited to resonance
by 2nd to 4th harmonics at different footfall rates
Composite Slab Example 5.1, Damping = 3%
0.000
2.000
4.000
6.000
8.000
10.000
0.5 1 1.5 2 2.5 3
Walking Frequency
Re
sp
ons
e F
acto
r
First Harmonic
Second Harmonic
Third Harmonic
Fourth Harmonic
Total
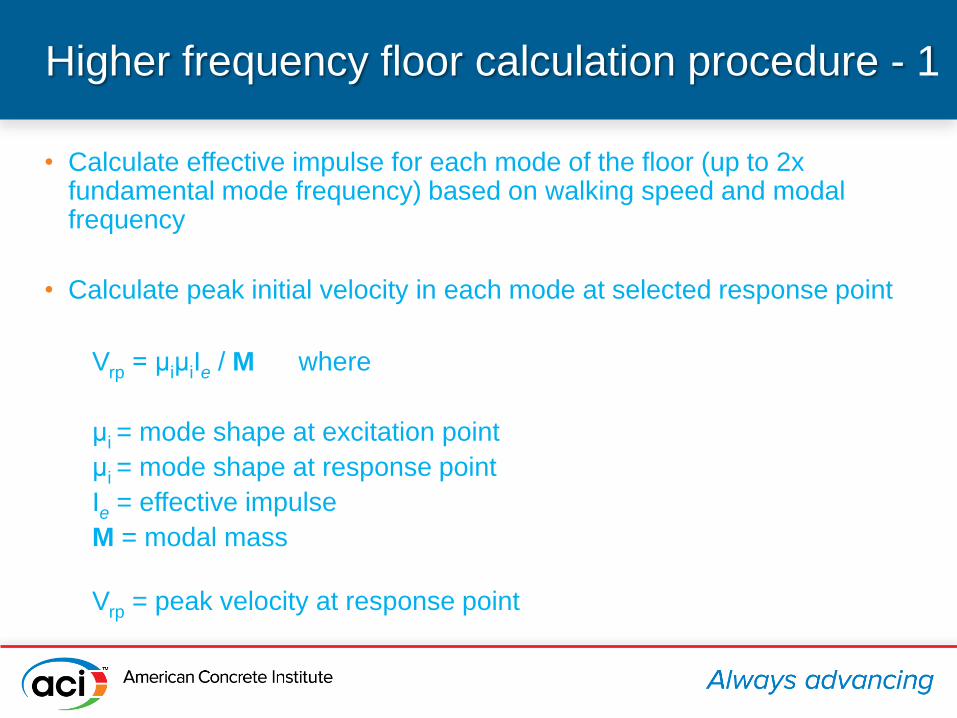
Higher frequency floor calculation procedure - 1
• Calculate effective impulse for each mode of the floor (up to 2x fundamental mode frequency) based on walking speed and modal frequency
• Calculate peak initial velocity in each mode at selected response point
Vrp = μiμiIe / M where
μi = mode shape at excitation point
μi = mode shape at response point
Ie = effective impulse
M = modal mass
Vrp = peak velocity at response point
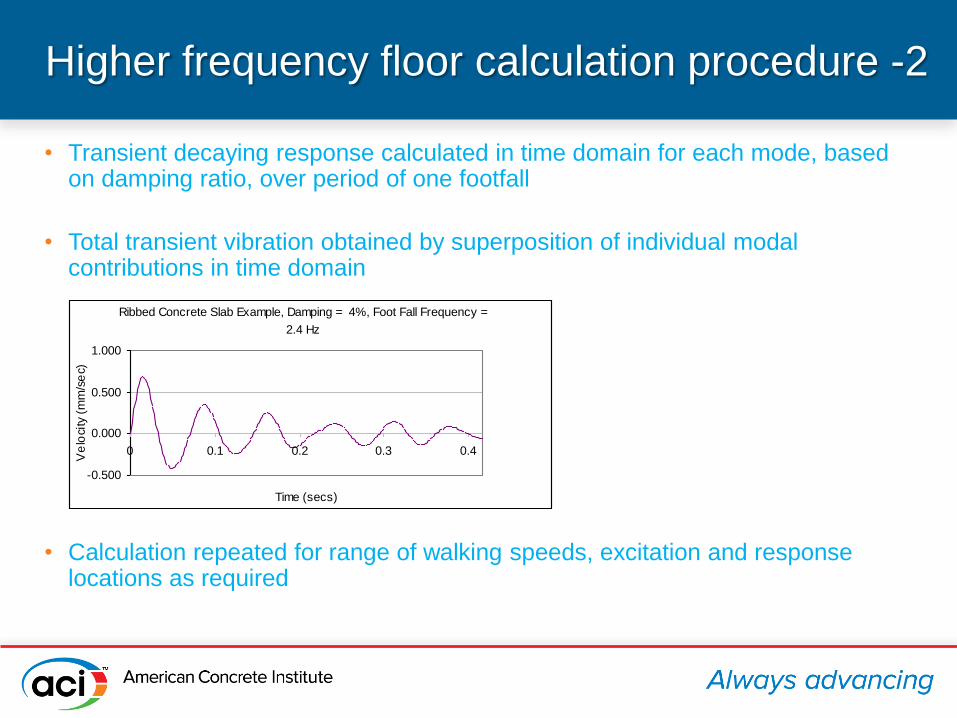
Higher frequency floor calculation procedure -2
• Transient decaying response calculated in time domain for each mode, based on damping ratio, over period of one footfall
• Total transient vibration obtained by superposition of individual modal contributions in time domain
• Calculation repeated for range of walking speeds, excitation and response locations as required
Ribbed Concrete Slab Example, Damping = 4%, Foot Fall Frequency =
2.4 Hz
-0.500
0.000
0.500
1.000
0 0.1 0.2 0.3 0.4
Time (secs)
Ve
loci
ty (
mm
/se
c)
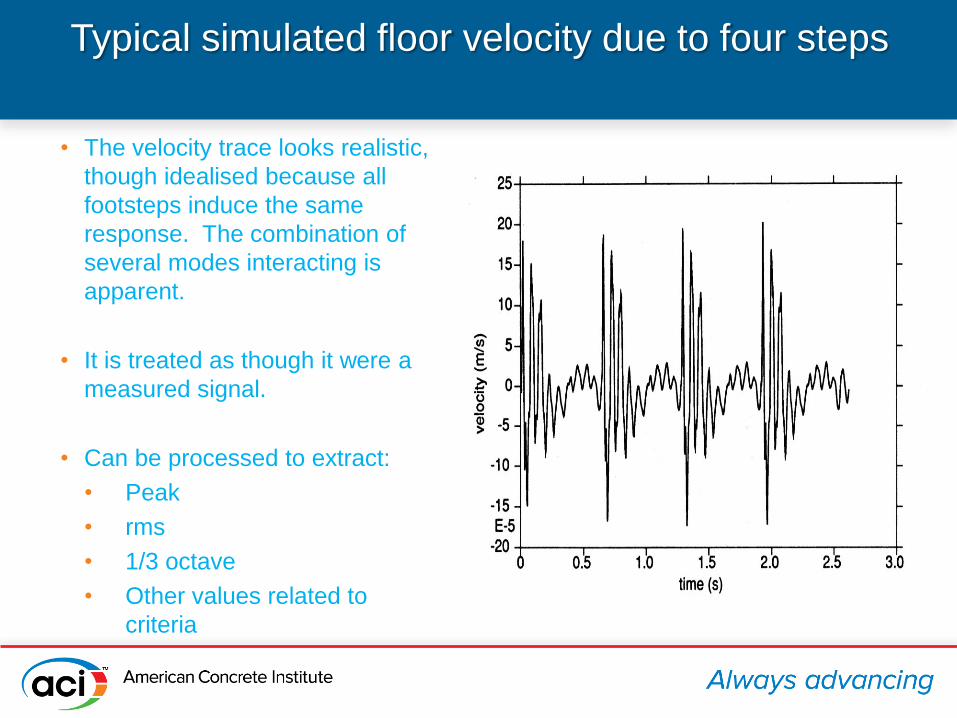
Typical simulated floor velocity due to four steps
• The velocity trace looks realistic,
though idealised because all
footsteps induce the same
response. The combination of
several modes interacting is
apparent.
• It is treated as though it were a
measured signal.
• Can be processed to extract:
• Peak
• rms
• 1/3 octave
• Other values related to
criteria
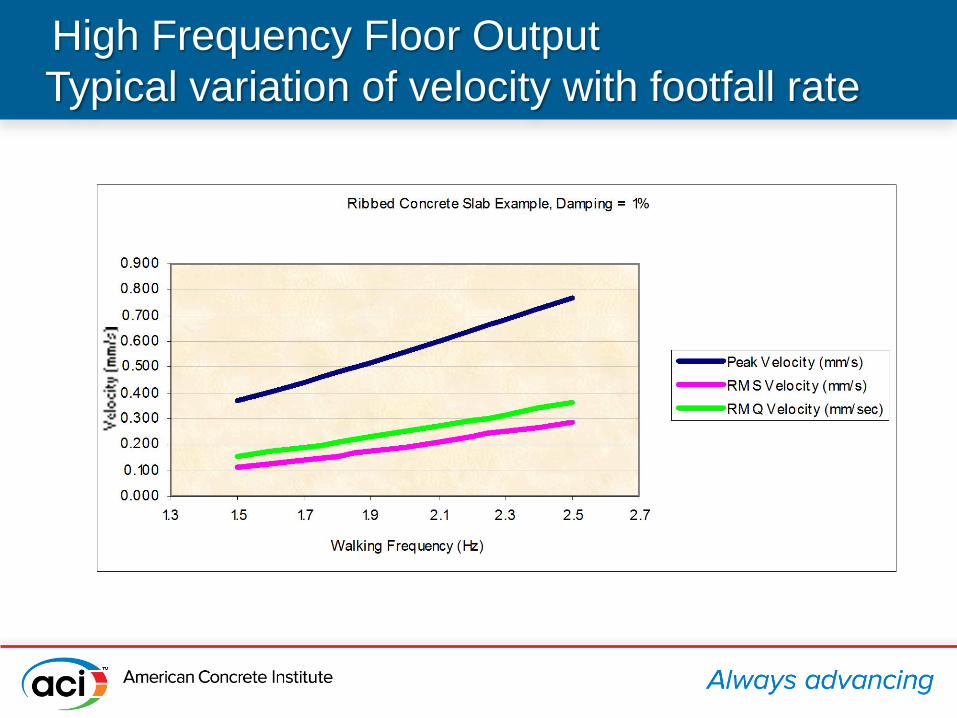
High Frequency Floor Output
Typical variation of velocity with footfall rate
Typical variation with footfall rate
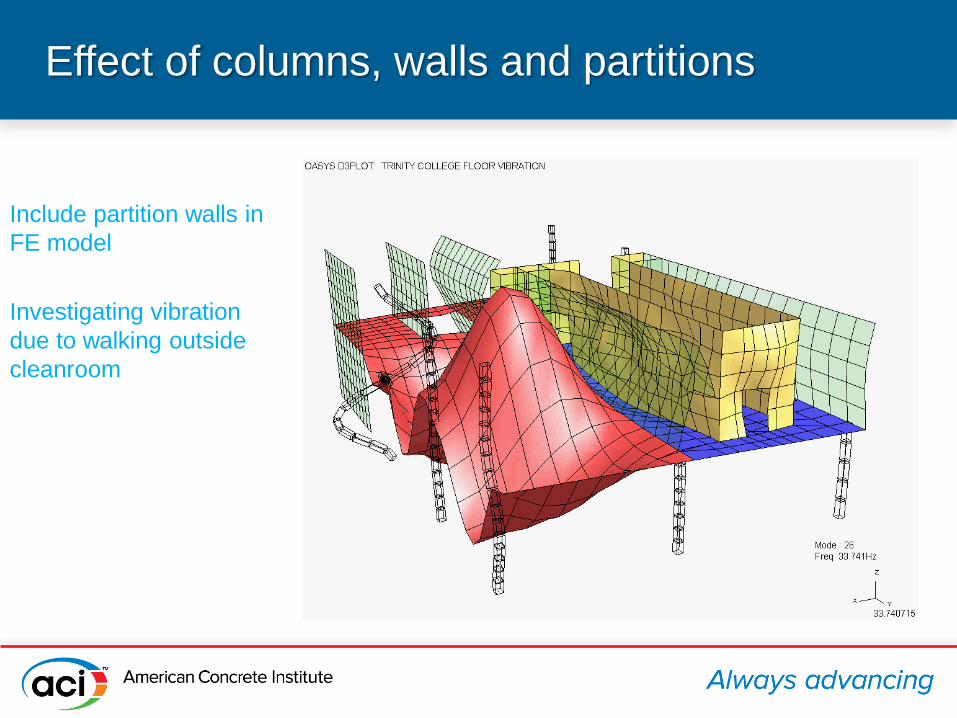
Effect of columns, walls and partitions
Include partition walls in
FE model
Investigating vibration
due to walking outside
cleanroom
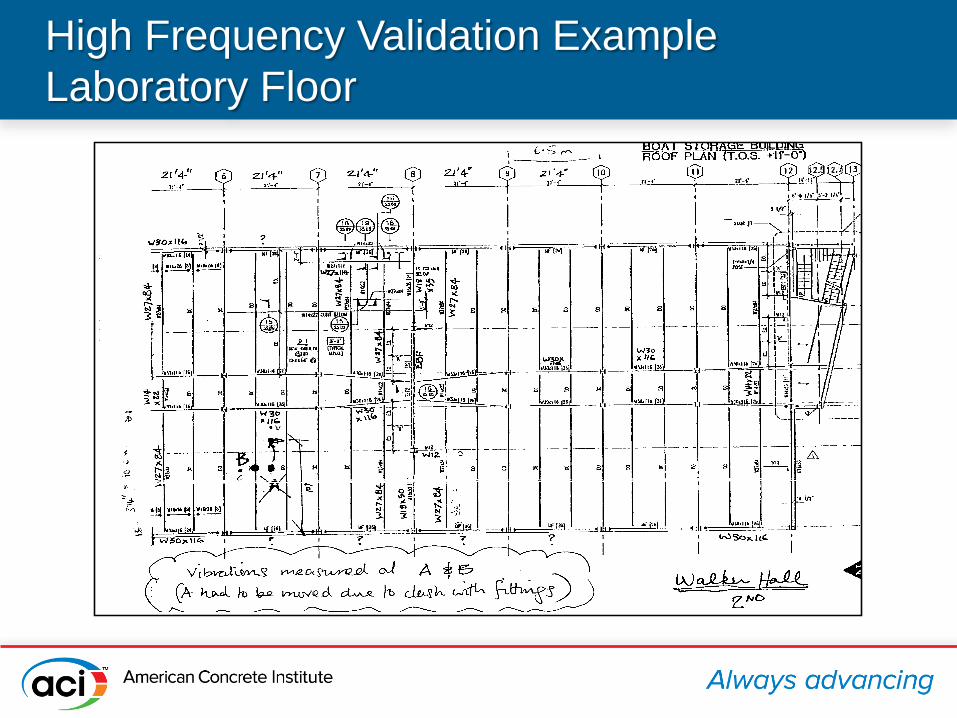
High Frequency Validation Example
Laboratory Floor
Composite construction with 200mm slab
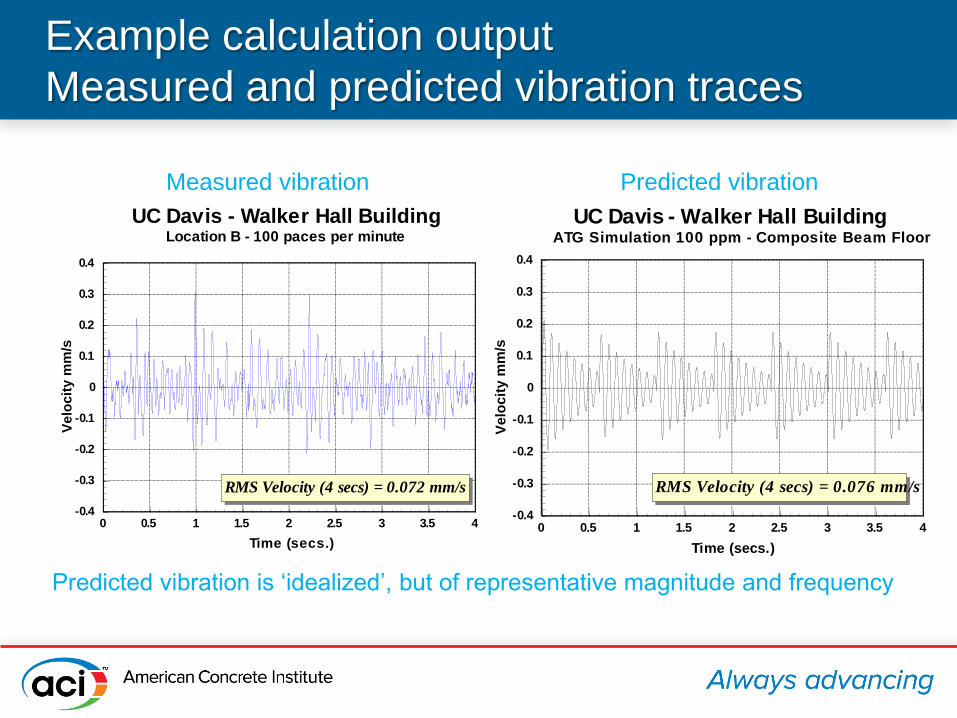
Example calculation output
Measured and predicted vibration traces
Measured vibration Predicted vibration
0 0.5 1 1.5 2 2.5 3 3.5 4
Time (secs.)
-0.4
-0.3
-0.2
-0.1
0
0.1
0.2
0.3
0.4
Ve
loc
ity
mm
/s
UC Davis - Walker Hall BuildingLocation B - 100 paces per minute
RMS Velocity (4 secs) = 0.072 mm/s
UC Davis - Walker Hall BuildingATG Simulation 100 ppm - Composite Beam Floor
Note: ppm equals paces per minute
0 0.5 1 1.5 2 2.5 3 3.5 4
Time (secs.)
-0.4
-0.3
-0.2
-0.1
0
0.1
0.2
0.3
0.4
Velo
cit
y m
m/s
RMS Velocity (4 secs) = 0.076 mm/s
Predicted vibration is ‘idealized’, but of representative magnitude and frequency
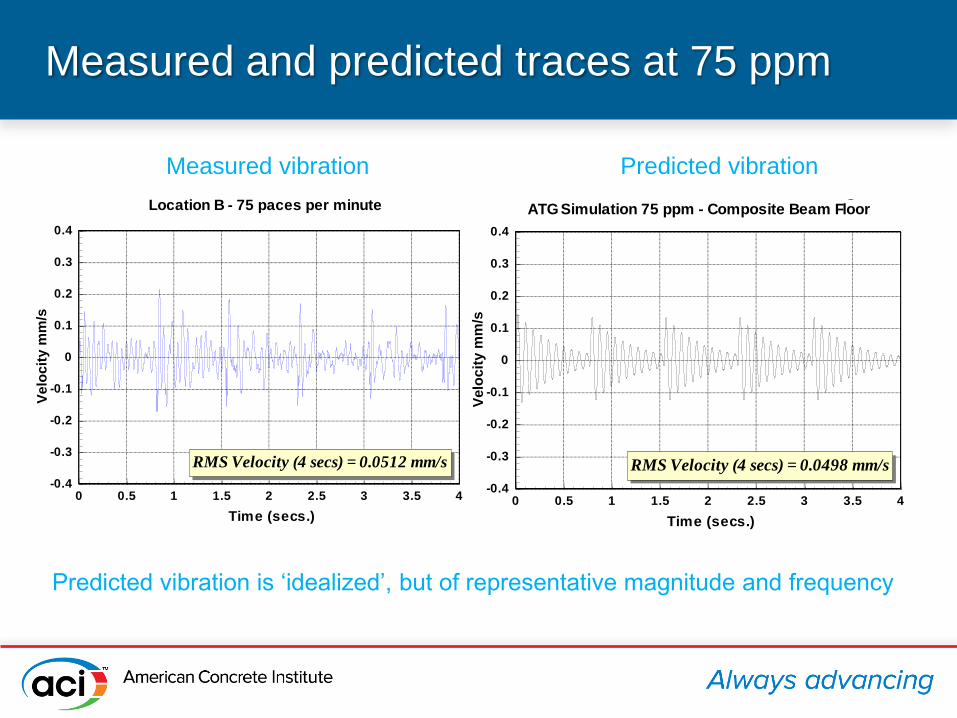
Measured and predicted traces at 75 ppm
0 0.5 1 1.5 2 2.5 3 3.5 4
Time (secs.)
-0.4
-0.3
-0.2
-0.1
0
0.1
0.2
0.3
0.4
Velo
cit
y m
m/s
UC Davis - Walker Hall BuildingATG Simulation 75 ppm - Composite Beam Floor
Note: ppm equals paces per minute
RMS Velocity (4 secs) = 0.0498 mm/s
0 0.5 1 1.5 2 2.5 3 3.5 4
Time (secs.)
-0.4
-0.3
-0.2
-0.1
0
0.1
0.2
0.3
0.4
Ve
loc
ity
mm
/s
UC Davis - Walker Hall BuildingLocation B - 75 paces per minute
RMS Velocity (4 secs) = 0.0512 mm/s
Measured vibration Predicted vibration
Predicted vibration is ‘idealized’, but of representative magnitude and frequency
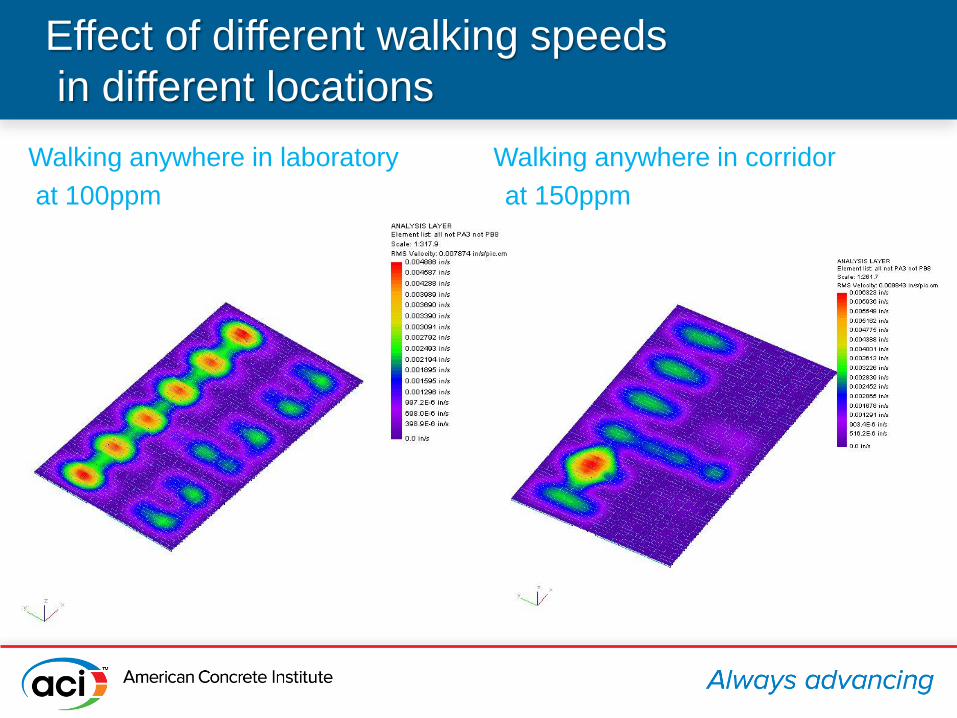
Effect of different walking speeds
in different locations
Walking anywhere in laboratory Walking anywhere in corridor
at 100ppm at 150ppm
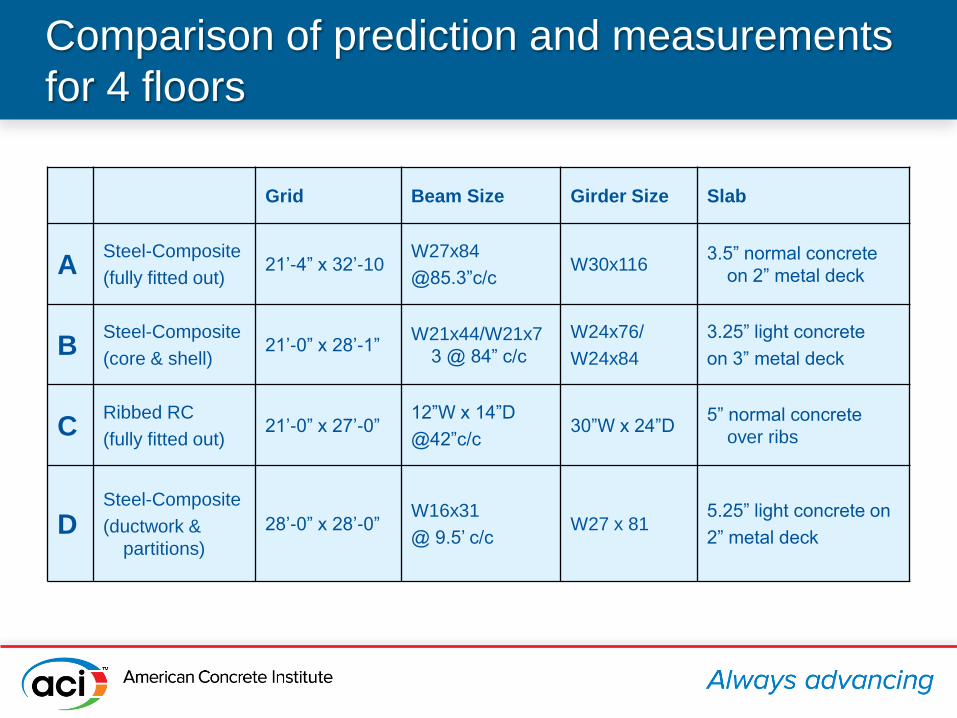
Comparison of prediction and measurements
for 4 floors
Grid Beam Size Girder Size Slab
ASteel-Composite
(fully fitted out)21’-4” x 32’-10
W27x84
@85.3”c/cW30x116
3.5” normal concrete
on 2” metal deck
BSteel-Composite
(core & shell)21’-0” x 28’-1”
W21x44/W21x7
3 @ 84” c/c
W24x76/
W24x84
3.25” light concrete
on 3” metal deck
CRibbed RC
(fully fitted out)21’-0” x 27’-0”
12”W x 14”D
@42”c/c30”W x 24”D
5” normal concrete
over ribs
DSteel-Composite
(ductwork &
partitions)
28’-0” x 28’-0”W16x31
@ 9.5’ c/cW27 x 81
5.25” light concrete on
2” metal deck
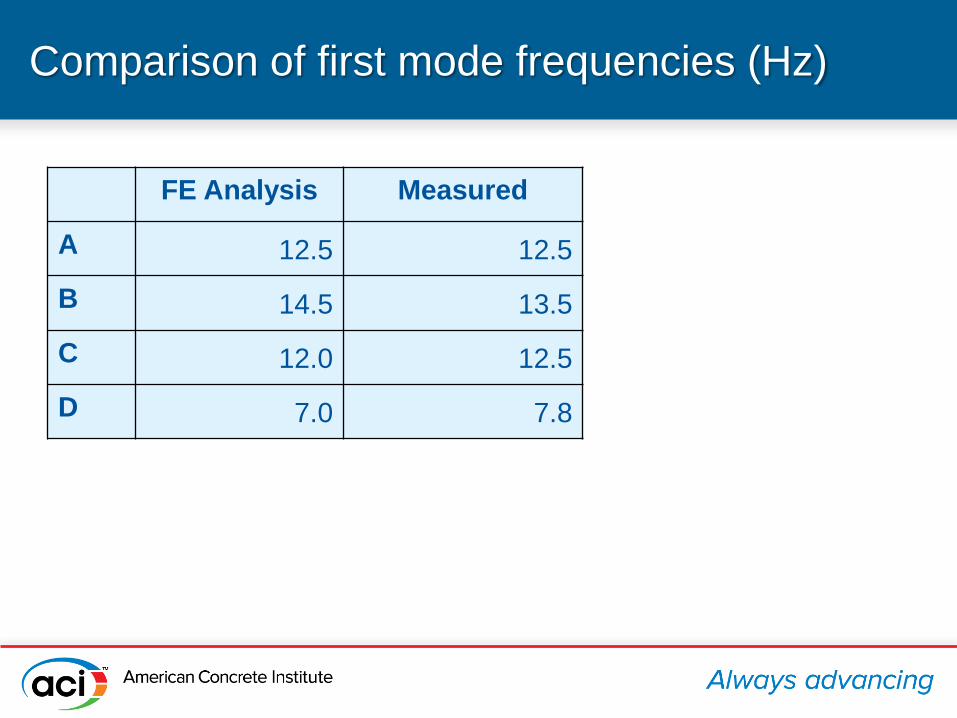
Comparison of first mode frequencies (Hz)
FE Analysis Measured
A 12.5 12.5
B 14.5 13.5
C 12.0 12.5
D 7.0 7.8
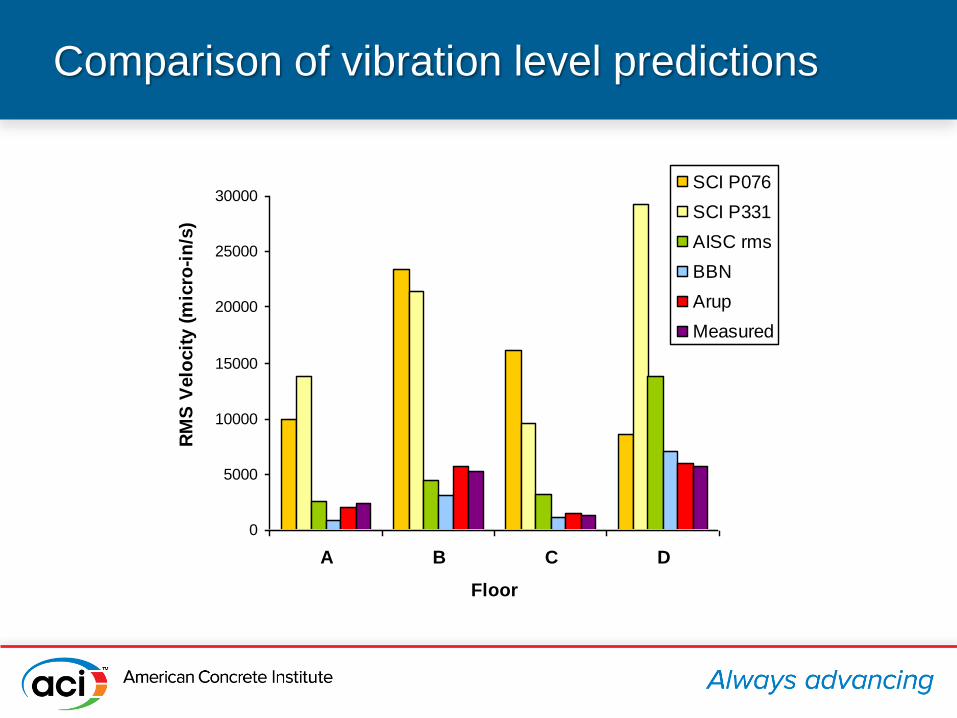
Comparison of vibration level predictions
0
5000
10000
15000
20000
25000
30000
A B C D
Floor
RM
S V
elo
cit
y (
mic
ro-i
n/s
)SCI P076
SCI P331
AISC rms
BBN
Arup
Measured
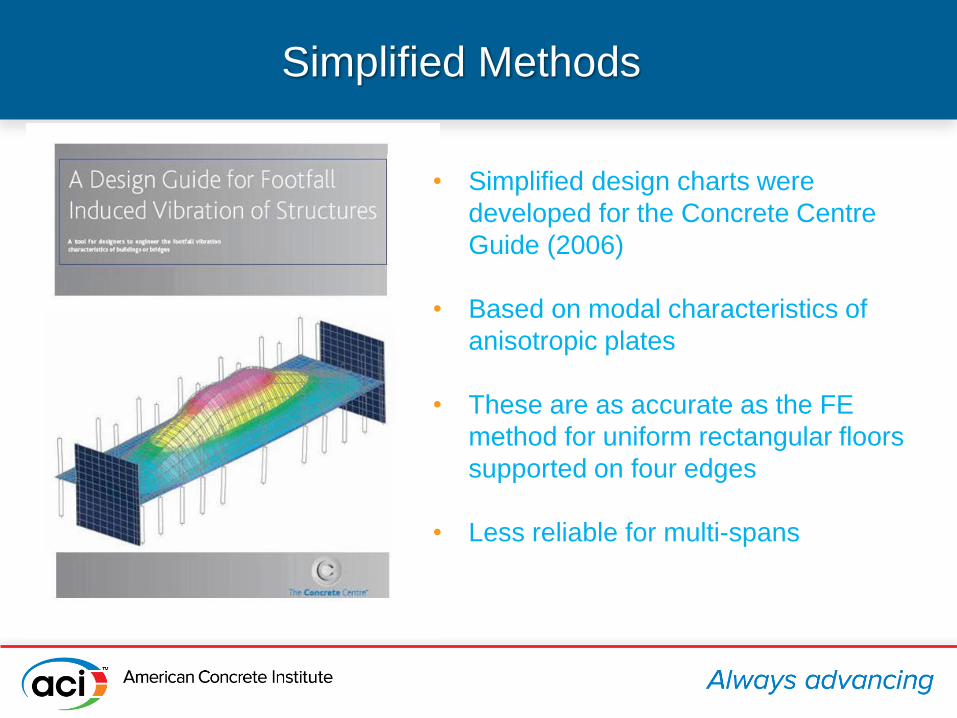
• Simplified design charts were
developed for the Concrete Centre
Guide (2006)
• Based on modal characteristics of
anisotropic plates
• These are as accurate as the FE
method for uniform rectangular floors
supported on four edges
• Less reliable for multi-spans
Simplified Methods
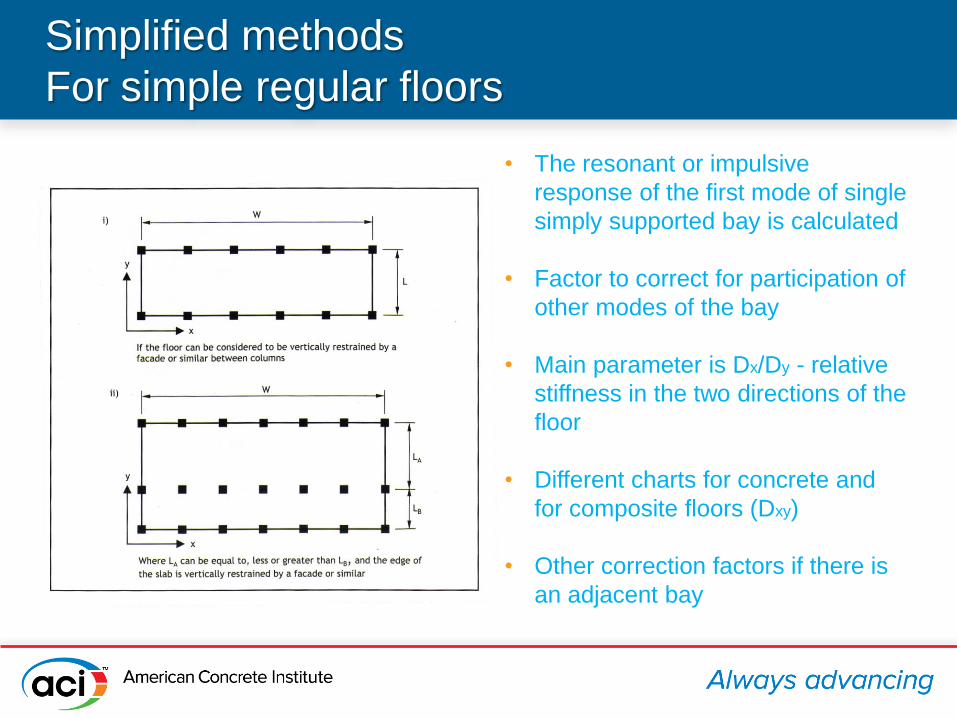
Simplified methods
For simple regular floors
• The resonant or impulsive
response of the first mode of single
simply supported bay is calculated
• Factor to correct for participation of
other modes of the bay
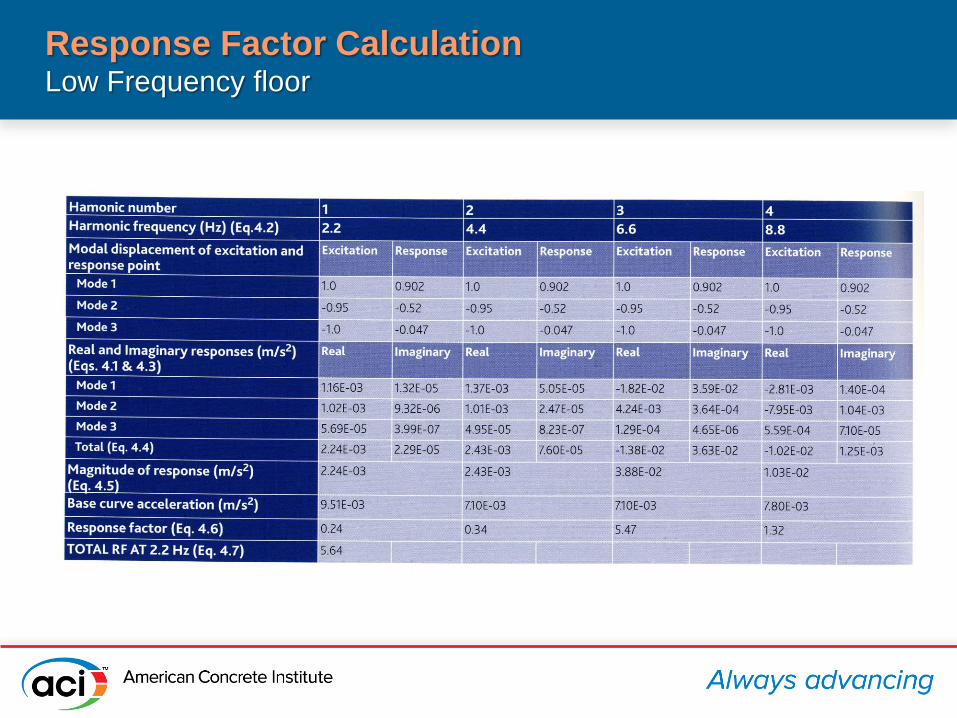
• Main parameter is Dx/Dy - relative
stiffness in the two directions of the
floor
• Different charts for concrete and
for composite floors (Dxy)
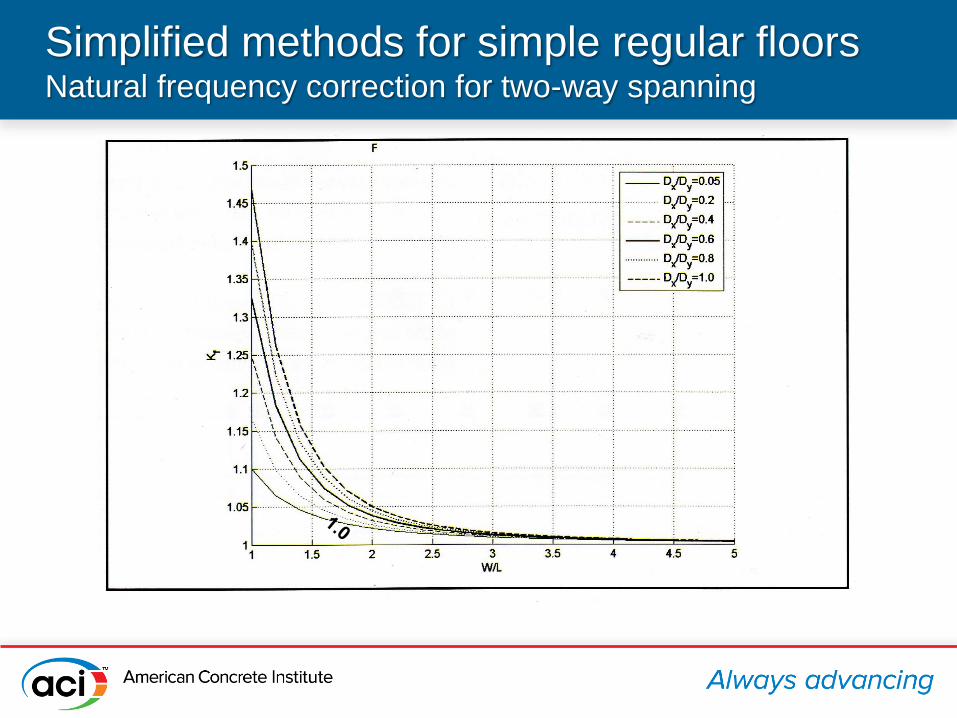
• Other correction factors if there is
an adjacent bay
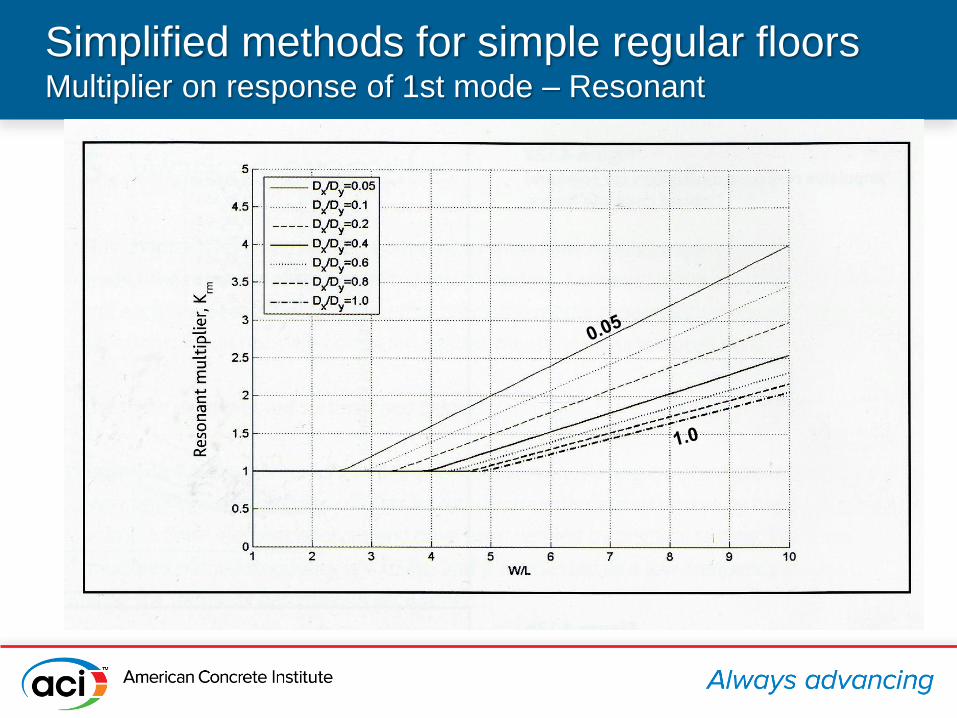
Simplified methods for simple regular floorsMultiplier on response of 1st mode – Resonant
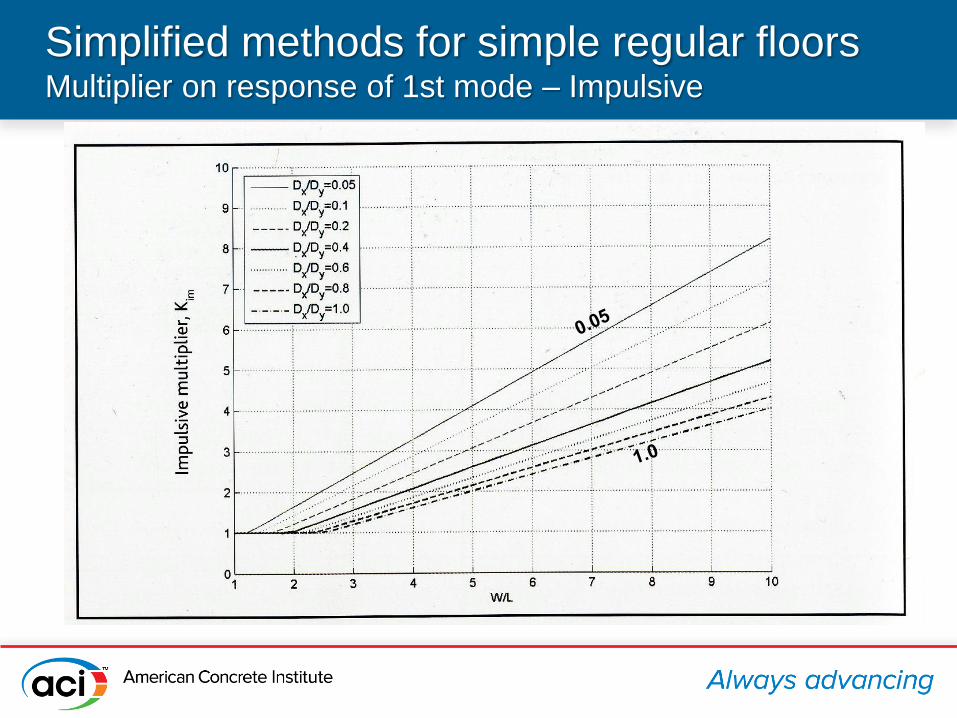
Simplified methods for simple regular floors Multiplier on response of 1st mode – Impulsive
Summary
We have developed and validated new ‘first-principles’ methods to
predict footfall induced vibration
We believe that they are more reliable than other procedures because:
• fully dynamic method using modal response superposition
• can be applied to any structural form or construction material
• excitation forces derived from extensive experimental studies
• can use FE analysis to predict modal properties, and therefore applicable
to multi-span and irregular structures as well as regular floors
Used on numerous projects in Arup offices worldwide for over 12
years, and by other consultants over past 6+ years
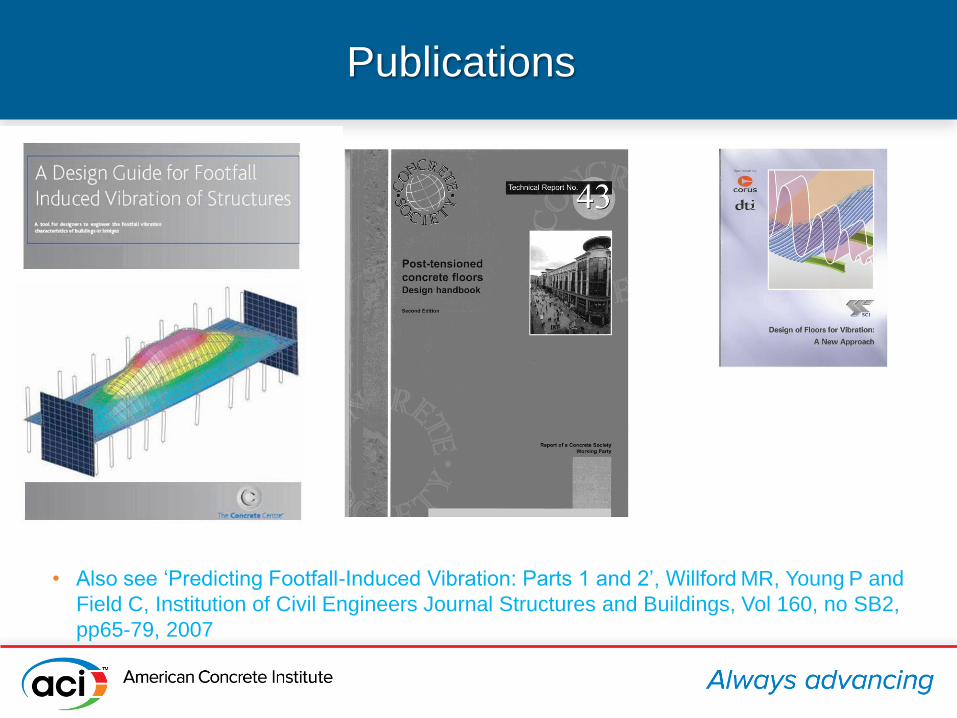
• Also see ‘Predicting Footfall-Induced Vibration: Parts 1 and 2’, Willford MR, Young P and
Field C, Institution of Civil Engineers Journal Structures and Buildings, Vol 160, no SB2,
pp65-79, 2007
Publications
Thank you for your attention
Acknowledgements:
Peter Young and Caroline Field
(My co-workers and authors)
Dr Stuart Kerr
(Supplied the footfall measurements from his PhD measurement program in electronic format)
Prof. Tom Wyatt of Imperial College, London
(Principal Author of 1989 SCI Guide, and Peer Reviewer of our Concrete Centre Guide, 2006)
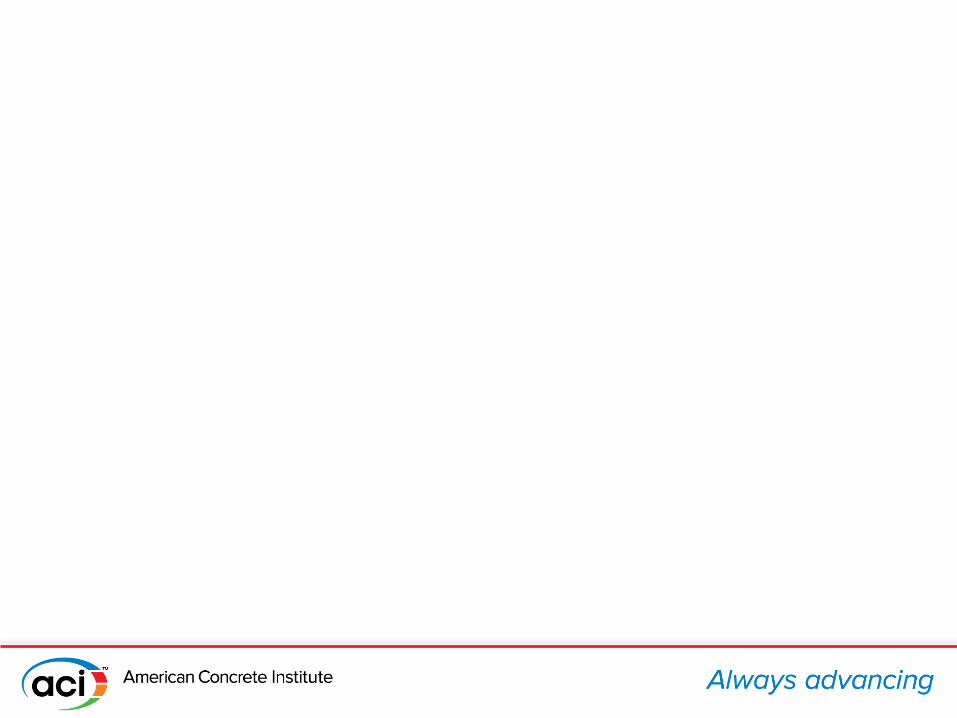
Response Factor Calculation Low Frequency floor
Simplified methods for simple regular floorsNatural frequency correction for two-way spanning
Simplified methods for simple regular floorsNatural frequency correction for continuity with adjacent bay
Related Documents