Aquatic Procedia 4 (2015) 182 – 189 ScienceDirect 2214-241X © 2015 The Authors. Published by Elsevier B.V. This is an open access article under the CC BY-NC-ND license (http://creativecommons.org/licenses/by-nc-nd/4.0/). Peer-review under responsibility of organizing committee of ICWRCOE 2015 doi:10.1016/j.aqpro.2015.02.025 INTERNATIONAL CONFERENCE ON WATER RESOURCES, COASTAL AND OCEAN ENGINEERING (ICWRCOE 2015) Shoreline Change Analysis of Mangalore Coast and Morphometric Analysis of Netravathi-Gurupur and Mulky-Pavanje Spits Ateeth Shetty a,* , K.S. Jayappa a , D.Mitra b a Department of Marine Geology, Mangalore University, Mangalore – 574 199, Karnataka, India b Marine and Atmospheric Sciences Department, Indian Institute of Remote Sensing, Dehradun – 248 001, Uttarakhand, India Abstract Various developmental projects have come up in the coastal zone of Dakshina Kannada and Udupi districts in the last few decades. A number of beaches are subjected to erosion and lots of coastal properties are destroyed specially during SW monsoon season along the Mangalore coast in recent years. In order to protect the beaches and the properties, a number of seawalls - each ranging in length between 100 m and 2500 m - are built since 1980s. A very few of them built scientifically, but most of them are just dumping of granite blocks directly on the shoreline. In the present study, an attempt is made to understand long-term (1967-2013) shoreline changes as well as erosion / deposition patterns due to natural (including sea-level rise) and anthropogenic activities along this coast. The study area extends from Yermal in the north to Talpady in the south covering a total length of 45.63 km. Topomap of 1967 and multi-temporal satellite images have been analyzed using Remote Sensing and GIS techniques to demarcate shoreline positions and to assess the impact of anthropogenic and hydrological factors on coastal morphology of this region. An integrative approach of Remote Sensing and GIS techniques as well as seasonal field studies clearly illustrates the reasons for shoreline and beach morphological changes. Construction of seawalls has resulted in shifting of erosion sites from one place to another adjacent place, whereas, breakwaters have been acting as barriers for littoral drift. Overall, areas subjected to erosion are higher compared to those subjected to accretion in the study area. Applications of Remote Sensing and GIS have led to understanding shoreline and beach morphological changes. These have also provided data analysis tools and methods to evaluate the geospatial patterns in short-term and long-term changes. The results of this study will be useful for shoreline, coastal zone management and implementation of CRZ act. Keywords: Remote Sensing;GIS; Shoreline Changes;Seawalls;Breakwaters. * Corresponding author. E-mail address: [email protected] © 2015 The Authors. Published by Elsevier B.V. This is an open access article under the CC BY-NC-ND license (http://creativecommons.org/licenses/by-nc-nd/4.0/). Peer-review under responsibility of organizing committee of ICWRCOE 2015 Available online at www.sciencedirect.com

Welcome message from author
This document is posted to help you gain knowledge. Please leave a comment to let me know what you think about it! Share it to your friends and learn new things together.
Transcript
Aquatic Procedia 4 ( 2015 ) 182 – 189
ScienceDirect
2214-241X © 2015 The Authors. Published by Elsevier B.V. This is an open access article under the CC BY-NC-ND license (http://creativecommons.org/licenses/by-nc-nd/4.0/).Peer-review under responsibility of organizing committee of ICWRCOE 2015doi: 10.1016/j.aqpro.2015.02.025
INTERNATIONAL CONFERENCE ON WATER RESOURCES, COASTAL AND OCEAN ENGINEERING (ICWRCOE 2015)
Shoreline Change Analysis of Mangalore Coast and Morphometric Analysis of Netravathi-Gurupur and Mulky-Pavanje Spits
Ateeth Shettya,*, K.S. Jayappaa, D.Mitrab aDepartment of Marine Geology, Mangalore University, Mangalore – 574 199, Karnataka, India
bMarine and Atmospheric Sciences Department, Indian Institute of Remote Sensing, Dehradun – 248 001, Uttarakhand, India
Abstract
Various developmental projects have come up in the coastal zone of Dakshina Kannada and Udupi districts in the last few decades. A number of beaches are subjected to erosion and lots of coastal properties are destroyed specially during SW monsoon season along the Mangalore coast in recent years. In order to protect the beaches and the properties, a number of seawalls - each ranging in length between 100 m and 2500 m - are built since 1980s. A very few of them built scientifically, but most of them are just dumping of granite blocks directly on the shoreline. In the present study, an attempt is made to understand long-term (1967-2013) shoreline changes as well as erosion / deposition patterns due to natural (including sea-level rise) and anthropogenic activities along this coast. The study area extends from Yermal in the north to Talpady in the south covering a total length of 45.63 km. Topomap of 1967 and multi-temporal satellite images have been analyzed using Remote Sensing and GIS techniques to demarcate shoreline positions and to assess the impact of anthropogenic and hydrological factors on coastal morphology of this region. An integrative approach of Remote Sensing and GIS techniques as well as seasonal field studies clearly illustrates the reasons for shoreline and beach morphological changes. Construction of seawalls has resulted in shifting of erosion sites from one place to another adjacent place, whereas, breakwaters have been acting as barriers for littoral drift. Overall, areas subjected to erosion are higher compared to those subjected to accretion in the study area. Applications of Remote Sensing and GIS have led to understanding shoreline and beach morphological changes. These have also provided data analysis tools and methods to evaluate the geospatial patterns in short-term and long-term changes. The results of this study will be useful for shoreline, coastal zone management and implementation of CRZ act. © 2015 The Authors. Published by Elsevier B.V. Peer-review under responsibility of organizing committee of ICWRCOE 2015.
Keywords: Remote Sensing;GIS; Shoreline Changes;Seawalls;Breakwaters.
* Corresponding author. E-mail address: [email protected]
© 2015 The Authors. Published by Elsevier B.V. This is an open access article under the CC BY-NC-ND license (http://creativecommons.org/licenses/by-nc-nd/4.0/).Peer-review under responsibility of organizing committee of ICWRCOE 2015
Available online at www.sciencedirect.com
183 Ateeth Shetty et al. / Aquatic Procedia 4 ( 2015 ) 182 – 189
1. Introduction
Coastal areas are very important for human beings since ancient time. About one-third of the human population is living within 100 km from the shoreline. Due to abundant natural resources and urbanization, population increases rapidly on the coastal zones. Various developmental projects have been set up in the coastal zone, placing great pressure on it, leading to diverse coastal hazards like sea erosion, seawater intrusion, coral bleaching, shoreline change etc. Li Ron et al. (2001) state that shoreline is one of the unique features of the earth surface and is one of the 27 features recognized by the International Geographic Data Committee (IGDC). A shoreline is a dynamic system with sediment moving continually, being deposited here and eroded there, as it attempts to establish an equilibrium with respect to available sediment budget and prevailing near shore marine processes (Poulos and Chronis, 2001). Shoreline change monitoring is an issue of concern in coastal management because of the tendency of the ecosystems to support many population (Moran, 2003). The coastal region mainly affected by the cause of wind, tidal current, wave and human factors. So management of coastal region should be considered in a better way and efficiently. According to Griffiths (1988), the coastal zone is increasingly under pressure from human activities such as fishing, coral and sand mining, mangrove harvesting, seaweed farming, sewage disposal, urban expansion and tourism. Of particular note are dynamite fishing, over-harvesting of mangroves, coral and sand mining, all of which have profound negative impacts on coastal stability and are thought to lead to coastal erosion and shoreline change. Among other human activities that impact coastline include dredging and physical development, mineral exploration, and construction of ports and removal of vegetation. It is of paramount importance for coastal settlements to know without bias whether local shorelines are advancing, retreating or stable (Kasinatha et al., 2004). Damming of rivers which cut-off the major source of sediments for many coastal systems and the breakwaters reduce the normal longshore drift (Frihy, 2001). Coastal erosion is a global problem affecting almost every country around the world having a coastline. This problem is expected to accelerate in the future due to the global warming, which most likely will cause a sea-level rise and increase the number of storm events across the globe. Bhat et al. (2000) have studied 100 km stretch of southern Karnataka and reported that the breakwaters of New Mangalore Port, at the mouths of Nethravathi - Gurupur estuaries, Udyavara estuary and seawalls elsewhere have contributed substantially to the modification of shoreline. The use of remote sensing and GIS for mapping and analyzing shoreline changes over a period of time has gained prominence in recent years as high resolution satellite data have become readily available (Adegoke et al., 2010).
2. Scope of the Present Investigation
Based on remote sensing techniques, the present study attempts to understand the long-term shoreline changes (from 1967 to 2013) and the processes that operate in bringing about erosion and deposition along this coastal zone. Topomap of 1967, multi-temporal IRS IC/1D/P6 and Landsat – 5, 8 satellite images have been utilized to demarcate shoreline positions. As various developmental projects have been set up recently in the area, the present study will be very useful to assess the impact of hydrological and morphologic factors modifying the shoreline along this coast. The recent systematic tools of Remote Sensing, GIS and GPS are exceptionally important for coastal environmental studies. In the present study, an attempted is made to monitor shoreline changes along the Mangalore coast and morphological changes of Ullal – Bengre and Mulky - Pavanje spits. The results of this study will be useful for shoreline change detection, coastal zone management and implementation of CRZ act.
3. Study Area
The coastal zone of Dakshina Kannada district extends for over 46 kms, from Latitude 12O45' to 13O11' N and Longitude 74O44' to 74O52' E with the Arabian Sea in the west and the Western Ghats in the east. The study area enjoys tropical hot monsoon climate due to its latitudinal position. The tropical monsoon climate is characterized by heavy rainfall from June to September ranging from 3000 mm to 3900 mm with high temperature all the year round and a relatively constant high humidity. Mangalore is being a major city on the Karnataka coast gaining economic importance due to urbanization and industrialization. The Netravathi and Gurpur (N-G) rivers encircle the city by flowing on its south and north respectively and debouch into the Arabian Sea at its southern side. The

184 Ateeth Shetty et al. / Aquatic Procedia 4 ( 2015 ) 182 – 189
morphological and shoreline changes in this region are dependent on many factors, such as beach erosion/accretion, human interference with natural processes of longshore sediment transport and beach reclamation.
The study area comprising a total length of 45.63 km, extends from Yermal in the north to Talpady in the south (Fig. 1). It is divided into four sectors in order to understand the erosion/accretion patterns, shoreline changes, pollution and impact of anthropogenic activities on beach morphology. Sector-wise information of the study area is provided in Table 1. The beaches are comprising of fine to coarse sand with their width ranging between 20 and 230 m. Bengre and Ullal are the most densely populated zones in the study area. Thannirbhavi and Someshwara beaches have gained recreational importance.
Table 1: Sector-wise information of the study area
Sector Major areas Latitudes / Longitudes Length (km)
A Yermal and Hejamady 13O04' N - 13O11' N / 74O44' E - 74O46' E 10.294
B Sashithulu, Mukka, Surathkal and Panambur 12O56' N - 13O04' N / 74O46' E - 74O48' E 15.937
C Thannirbhavi and Bengre 12O50' N - 12O55' N / 74O48' E - 74O49' E 8.299
D Ullal, Someshwara and Talapady 12O45' N - 12O50' N / 74O49' E - 74O52' E 11.108
Total length 45.638
Fig.1 Study area showing the four sectors, major beaches and estuaries.
185 Ateeth Shetty et al. / Aquatic Procedia 4 ( 2015 ) 182 – 189
4. Materials and Methods
4.1 Satellite data
The IRS IC/1D/P6 - LISS-III and Landsat - 5/8 – TM / OLI satellite data is well suited for generating land-water boundaries because of the strong contrast between land and water in the infrared portion of the electromagnetic spectrum (Charatkar, 2004) and hence they were used in the present study (Table 2).
Table 2: Details of satellite data
Satellite (Sensor) Date of acquisition Spatial resolution
LANDSAT – 5 (TM) 09-01-1991 30 m
IRS 1C/1 D (LISS III) 04-12-2001 23.6 m
IRS P6 (LISS III) 07-12-2005 23.5 m
IRS P6 (LISS III) 23-10-2009 23.5 m
LANDSAT – 8 (OLI) 21-11-2013 30 m
4.2 Topographic map
Survey of India (SOI) topomap nos. 48 L/13 and 48 K/16 of 1967 were used as base maps.
4.3 Methodology and image processing
To eliminate the effect of tidal influence in shoreline change study, low tide satellite data were used. Topomaps of 1967 and satellite images of 1991, 2001, 2005, 2009 and 2013 of the study area were made use of in order to understand long-term and short-term beach morphological and shoreline changes. For this purpose, available cloud-free remote sensing data were analyzed using digital image processing techniques. The topomaps were georeferenced using Erdas Imagine v2010 and projected on geographic projection (Lat/Long) and modified Everest datum. All the satellite images were geometrically corrected (using 18 Ground Control Points (GCP) with Root Mean Square (RMS) error of < 0.5 pixel) with reference to SOI topographic map and False Color Composites (FCCs) were generated on 1:50,000 scale.
4.3.1 Shoreline change
In order to understand the shoreline change, vector layers were created from the above mentioned topomaps and satellite data products using ArcGIS v10.1 software. Permanent vegetation was considered as shoreline and erosion/accretion analysis was carried out for all the four sectors for 1967-1991, 1991-2001, 2001-2005, 2005-2009 and 2009-2013 periods using Union command in ArcGIS. The overlaid image divided automatically into different polygons at the intersect of the input and overlaid polygons. Accordingly, the polygons developed outside the input theme (1967 vector image) were identified as accretion and polygons developed inside the input theme was identified as erosion.
4.3.2 Morphometric analysis of spits
To study the morphometric analysis of spits, vector layers of estuarine mouth, banks and landforms were digitised using topographic maps and satellite images in ArcGIS v10.1 software. The extracted vector layers of different time periods were superimposed to estimate the morphological changes of estuarine mouth and landforms.

186 Ateeth Shetty et al. / Aquatic Procedia 4 ( 2015 ) 182 – 189
5. Results and Discussion
Survey of India topomap (1967 edition) and 1991, 2001, 2005, 2009 and 2013 satellite data were compared quantitatively to demarcate shoreline positions during different time periods. Four sectors have been delineated for Mangalore coast and the changes were mapped as shown in Table 3.
Table 3: Erosion and accretion along Mangalore coast during various time span (area in m2)
Years Sector A Sector B Sector C Sector D
1967-1991 - 157,805 - 348,002 - 227,120 +722,258
1991-2001 - 158,201 - 380,920 - 153,997 - 247,632
2001-2005 - 250,032 - 288,279 +344,953 +350,567
2005-2009 +247,603 +144,817 +109,706 - 379,700
2009-2013 - 56,767 - 158,394 - 135,044 +261,520
- Erosion; + Accretion
Sector A: In sector ‘A’, where Hejamady and Yermal are the major beaches, a total of 157,805 m2 erosion was observed during 1967-1991. During 1991-2001 and 2001-05 erosion of 158,201 m2 and 250,032 m2 respectively are noticed. During 2005-09, an accretion of 247,603 m2 and during 2009-13 an erosion of 56,767 m2 are found. In this sector, maximum erosion has been noticed during 2001-05 (Fig. 2; Table 3). Sector B: During 1967-1991 period, an erosion of 348,002 m2 was recorded in sector ‘B’ where Sashithulu, Mukka, Surathkal and Panambur are the major beaches. In a span of 10 years (1991-2001) this sector has shown a maximum erosion of 380,920 m2. During 2001-05 period also further erosion of 288,279 m2 is found. Later during 2005-09 an accretion of 144,817 m2 was observed. Again during 2009-13 period a total of 158,394 m2 area has been eroded (Fig. 2; Table 3). Sector C: In this sector 227,120 m2 area was found to be eroded during 1967-1991 period where Thannirbhavi and Bengre are the major inhabited areas. Between 1991 and 2001, erosion was about 153,997 m2. During 2001-05 and 2005-09 periods 344,953 m2 and 109,706 m2 areas respectively were noticed to be accreted. During 2009-13 the erosion was about 135,044 m2. Rubble mound breakwaters of 570 m length constructed in late 1960’s, and extended by another 200 m in 1977, has resulted in slight building up of beach face on either side of the approach channel and seaward shifting of shoreline (Jayappa et al., 2003). In this sector, maximum erosion is noticed between 1967 and 1991 (Fig. 2; Table 3). Sector D: During 1967-1991, total accretion of 722,258 m2 was recorded. Ullal, Someshwara and Talapady are the major settlements along this coastline. In a span of 10 years (1991-2001), total erosion was 247,632 m2. During 2001-05 period total of 350,567 m2 area is found to be accreted. During 2005-09, total eroded area was 379,700 m2. During 2009-13, total of 261,520 m2 was accreted. At Ullal, in the last 10-15 years, quite a few small-scale industries and buildings have been constructed. The concentration of industries and disposal of their effluents and municipal drains to estuaries, rivers or near shore waters cause water pollution. The haphazard dumping of fish-wastes near fish landing centers, processing of fish catch and large number of ice factories also cause water pollution. Maximum erosion is noticed from 2005-09 in this sector (Fig. 2; Table 3).
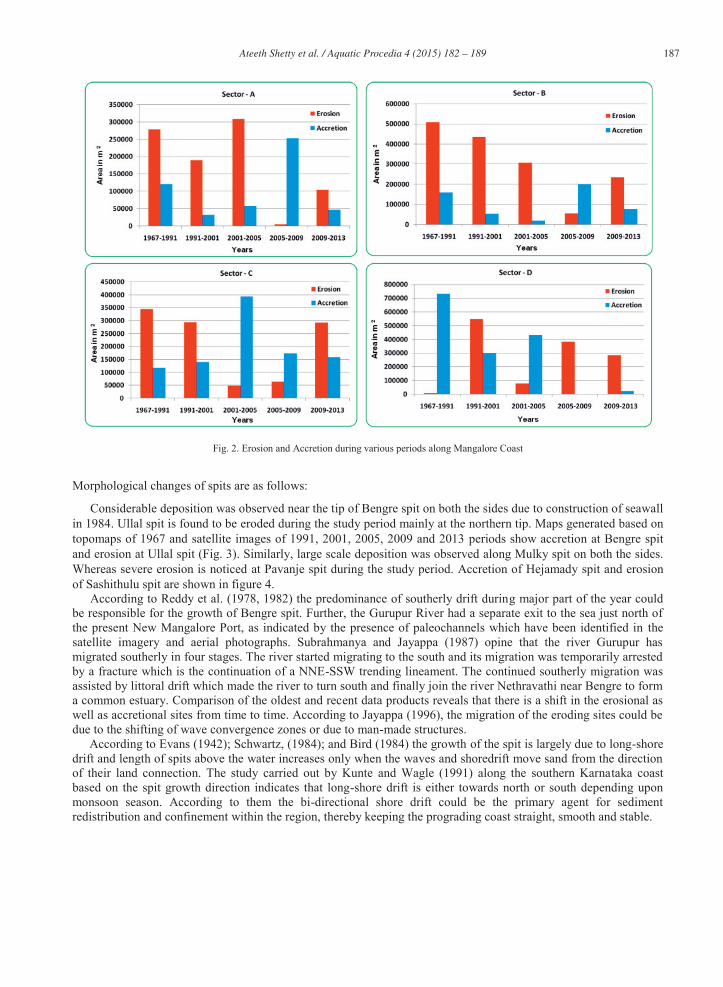
187 Ateeth Shetty et al. / Aquatic Procedia 4 ( 2015 ) 182 – 189
Fig. 2. Erosion and Accretion during various periods along Mangalore Coast
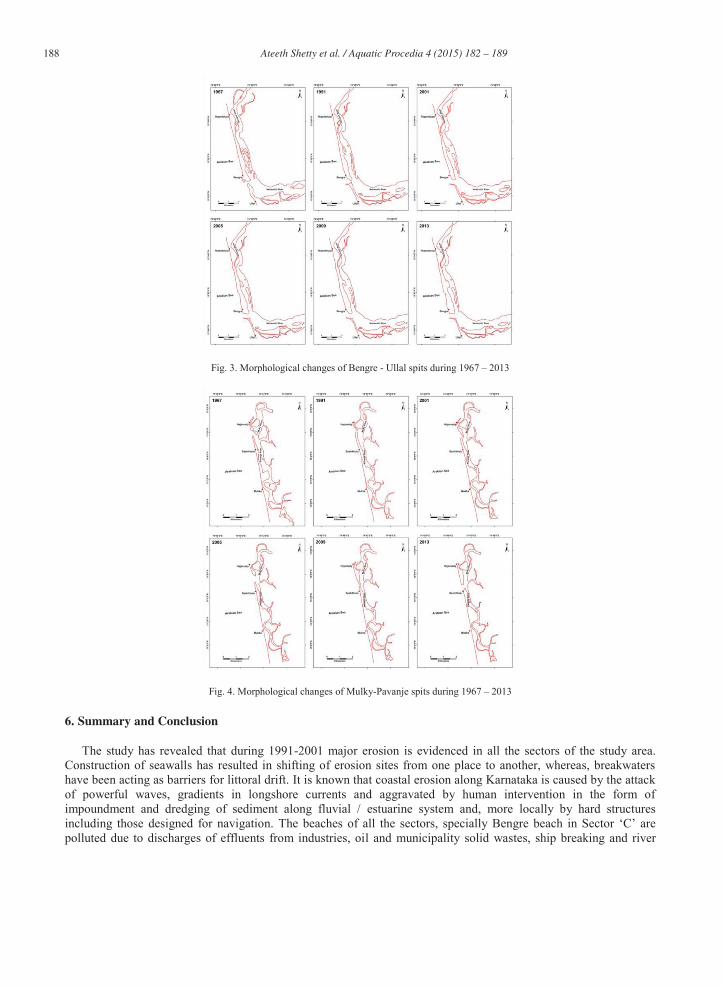
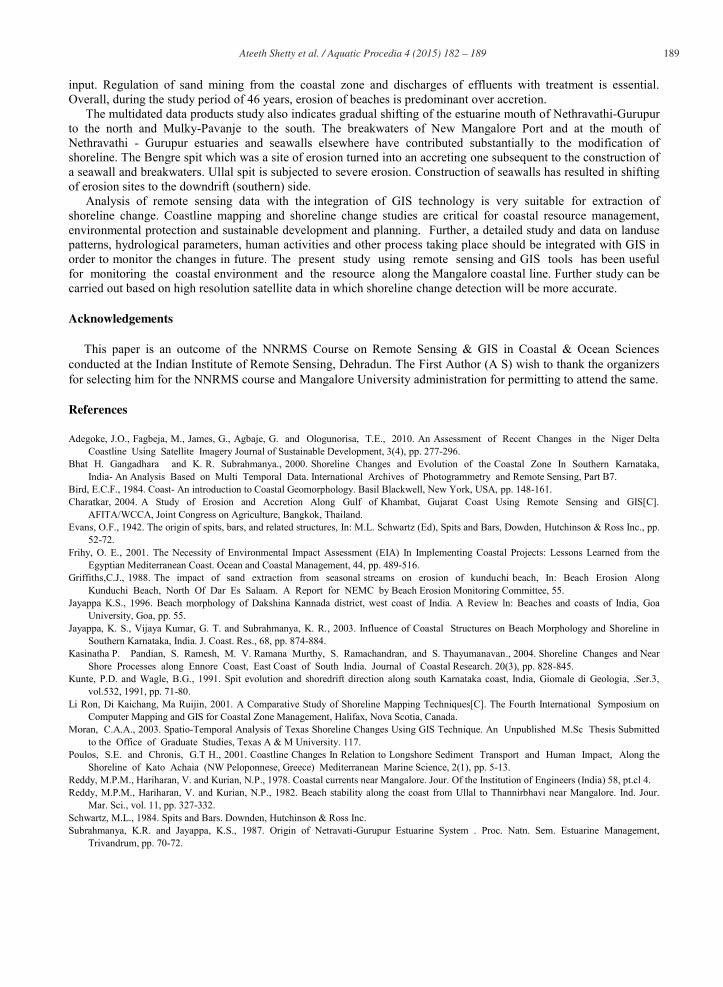
Morphological changes of spits are as follows:
Considerable deposition was observed near the tip of Bengre spit on both the sides due to construction of seawall in 1984. Ullal spit is found to be eroded during the study period mainly at the northern tip. Maps generated based on topomaps of 1967 and satellite images of 1991, 2001, 2005, 2009 and 2013 periods show accretion at Bengre spit and erosion at Ullal spit (Fig. 3). Similarly, large scale deposition was observed along Mulky spit on both the sides. Whereas severe erosion is noticed at Pavanje spit during the study period. Accretion of Hejamady spit and erosion of Sashithulu spit are shown in figure 4.
According to Reddy et al. (1978, 1982) the predominance of southerly drift during major part of the year could be responsible for the growth of Bengre spit. Further, the Gurupur River had a separate exit to the sea just north of the present New Mangalore Port, as indicated by the presence of paleochannels which have been identified in the satellite imagery and aerial photographs. Subrahmanya and Jayappa (1987) opine that the river Gurupur has migrated southerly in four stages. The river started migrating to the south and its migration was temporarily arrested by a fracture which is the continuation of a NNE-SSW trending lineament. The continued southerly migration was assisted by littoral drift which made the river to turn south and finally join the river Nethravathi near Bengre to form a common estuary. Comparison of the oldest and recent data products reveals that there is a shift in the erosional as well as accretional sites from time to time. According to Jayappa (1996), the migration of the eroding sites could be due to the shifting of wave convergence zones or due to man-made structures.
According to Evans (1942); Schwartz, (1984); and Bird (1984) the growth of the spit is largely due to long-shore drift and length of spits above the water increases only when the waves and shoredrift move sand from the direction of their land connection. The study carried out by Kunte and Wagle (1991) along the southern Karnataka coast based on the spit growth direction indicates that long-shore drift is either towards north or south depending upon monsoon season. According to them the bi-directional shore drift could be the primary agent for sediment redistribution and confinement within the region, thereby keeping the prograding coast straight, smooth and stable.
188 Ateeth Shetty et al. / Aquatic Procedia 4 ( 2015 ) 182 – 189
Fig. 3. Morphological changes of Bengre - Ullal spits during 1967 – 2013
Fig. 4. Morphological changes of Mulky-Pavanje spits during 1967 – 2013
6. Summary and Conclusion
The study has revealed that during 1991-2001 major erosion is evidenced in all the sectors of the study area. Construction of seawalls has resulted in shifting of erosion sites from one place to another, whereas, breakwaters have been acting as barriers for littoral drift. It is known that coastal erosion along Karnataka is caused by the attack of powerful waves, gradients in longshore currents and aggravated by human intervention in the form of impoundment and dredging of sediment along fluvial / estuarine system and, more locally by hard structures including those designed for navigation. The beaches of all the sectors, specially Bengre beach in Sector ‘C’ are polluted due to discharges of effluents from industries, oil and municipality solid wastes, ship breaking and river
189 Ateeth Shetty et al. / Aquatic Procedia 4 ( 2015 ) 182 – 189
input. Regulation of sand mining from the coastal zone and discharges of effluents with treatment is essential. Overall, during the study period of 46 years, erosion of beaches is predominant over accretion.
The multidated data products study also indicates gradual shifting of the estuarine mouth of Nethravathi-Gurupur to the north and Mulky-Pavanje to the south. The breakwaters of New Mangalore Port and at the mouth of Nethravathi - Gurupur estuaries and seawalls elsewhere have contributed substantially to the modification of shoreline. The Bengre spit which was a site of erosion turned into an accreting one subsequent to the construction of a seawall and breakwaters. Ullal spit is subjected to severe erosion. Construction of seawalls has resulted in shifting of erosion sites to the downdrift (southern) side.
Analysis of remote sensing data with the integration of GIS technology is very suitable for extraction of shoreline change. Coastline mapping and shoreline change studies are critical for coastal resource management, environmental protection and sustainable development and planning. Further, a detailed study and data on landuse patterns, hydrological parameters, human activities and other process taking place should be integrated with GIS in order to monitor the changes in future. The present study using remote sensing and GIS tools has been useful for monitoring the coastal environment and the resource along the Mangalore coastal line. Further study can be carried out based on high resolution satellite data in which shoreline change detection will be more accurate.
Acknowledgements
This paper is an outcome of the NNRMS Course on Remote Sensing & GIS in Coastal & Ocean Sciences conducted at the Indian Institute of Remote Sensing, Dehradun. The First Author (A S) wish to thank the organizers for selecting him for the NNRMS course and Mangalore University administration for permitting to attend the same.
References
Adegoke, J.O., Fagbeja, M., James, G., Agbaje, G. and Ologunorisa, T.E., 2010. An Assessment of Recent Changes in the Niger Delta Coastline Using Satellite Imagery Journal of Sustainable Development, 3(4), pp. 277-296.
Bhat H. Gangadhara and K. R. Subrahmanya., 2000. Shoreline Changes and Evolution of the Coastal Zone In Southern Karnataka, India- An Analysis Based on Multi Temporal Data. International Archives of Photogrammetry and Remote Sensing, Part B7.
Bird, E.C.F., 1984. Coast- An introduction to Coastal Geomorphology. Basil Blackwell, New York, USA, pp. 148-161. Charatkar, 2004. A Study of Erosion and Accretion Along Gulf of Khambat, Gujarat Coast Using Remote Sensing and GIS[C].
AFITA/WCCA, Joint Congress on Agriculture, Bangkok, Thailand. Evans, O.F., 1942. The origin of spits, bars, and related structures, In: M.L. Schwartz (Ed), Spits and Bars, Dowden, Hutchinson & Ross Inc., pp.
52-72. Frihy, O. E., 2001. The Necessity of Environmental Impact Assessment (EIA) In Implementing Coastal Projects: Lessons Learned from the
Egyptian Mediterranean Coast. Ocean and Coastal Management, 44, pp. 489-516. Griffiths,C.J., 1988. The impact of sand extraction from seasonal streams on erosion of kunduchi beach, In: Beach Erosion Along
Kunduchi Beach, North Of Dar Es Salaam. A Report for NEMC by Beach Erosion Monitoring Committee, 55. Jayappa K.S., 1996. Beach morphology of Dakshina Kannada district, west coast of India. A Review ln: Beaches and coasts of India, Goa
University, Goa, pp. 55. Jayappa, K. S., Vijaya Kumar, G. T. and Subrahmanya, K. R., 2003. Influence of Coastal Structures on Beach Morphology and Shoreline in
Southern Karnataka, India. J. Coast. Res., 68, pp. 874-884. Kasinatha P. Pandian, S. Ramesh, M. V. Ramana Murthy, S. Ramachandran, and S. Thayumanavan., 2004. Shoreline Changes and Near
Shore Processes along Ennore Coast, East Coast of South India. Journal of Coastal Research. 20(3), pp. 828-845. Kunte, P.D. and Wagle, B.G., 1991. Spit evolution and shoredrift direction along south Karnataka coast, India, Giomale di Geologia, .Ser.3,
vol.532, 1991, pp. 71-80. Li Ron, Di Kaichang, Ma Ruijin, 2001. A Comparative Study of Shoreline Mapping Techniques[C]. The Fourth International Symposium on
Computer Mapping and GIS for Coastal Zone Management, Halifax, Nova Scotia, Canada. Moran, C.A.A., 2003. Spatio-Temporal Analysis of Texas Shoreline Changes Using GIS Technique. An Unpublished M.Sc Thesis Submitted
to the Office of Graduate Studies, Texas A & M University. 117. Poulos, S.E. and Chronis, G.T H., 2001. Coastline Changes In Relation to Longshore Sediment Transport and Human Impact, Along the
Shoreline of Kato Achaia (NW Peloponnese, Greece) Mediterranean Marine Science, 2(1), pp. 5-13. Reddy, M.P.M., Hariharan, V. and Kurian, N.P., 1978. Coastal currents near Mangalore. Jour. Of the Institution of Engineers (India) 58, pt.cl 4. Reddy, M.P.M., Hariharan, V. and Kurian, N.P., 1982. Beach stability along the coast from Ullal to Thannirbhavi near Mangalore. Ind. Jour.
Mar. Sci., vol. 11, pp. 327-332. Schwartz, M.L., 1984. Spits and Bars. Downden, Hutchinson & Ross Inc. Subrahmanya, K.R. and Jayappa, K.S., 1987. Origin of Netravati-Gurupur Estuarine System . Proc. Natn. Sem. Estuarine Management,
Trivandrum, pp. 70-72.
Related Documents