CLARKSON RESEARCH SERVICES LTD Hamburg Schifffahrts-Dialog 17 th April 2014 Shipping Markets: In the Middle of a Revolution? Martin Stopford President, Clarkson Research Macr-managements meets micro-management

Welcome message from author
This document is posted to help you gain knowledge. Please leave a comment to let me know what you think about it! Share it to your friends and learn new things together.
Transcript

CLARKSON RESEARCH SERVICES LTD
Hamburg Schifffahrts-Dialog 17th April 2014
Shipping
Markets:
In the Middle of
a Revolution?
Martin Stopford President,
Clarkson Research
Macr-m
anagem
ents
meets
mic
ro-m
anagem
ent

CLARKSON RESEARCH SERVICES LTD
1. Market Overview
2. The Case for Change
3. Four Questions for the Future:- 4.1 What will the trade scenario be like?
4.2 Fossil Fuels – impact of high prices?
4.3 Diminishing marginal returns?
4.4 Micromanagement -key to the future?
The challenge
is to change
The big picture trends in the shipping industry today & tomorrow
CLARKSON RESEARCH SERVICES LTD
I LOVE
SHIPPING I still don’t
seem to be
making any
money
Bankers
arrested
my ships
I made
millions on
timecharters
A charming young
man at an equity
fund offered me
$1 billion, sir

CLARKSON RESEARCH SERVICES LTD
Crude Tanker, Bulk Carrier & Container Earnings
0
20
40
60
80
Jan
-90
Jan
-91
Jan
-92
Jan
-93
Jan
-94
Jan
-95
Jan
-96
Jan
-97
Jan
-98
Jan
-99
Jan
-00
Jan
-01
Jan
-02
Jan
-03
Jan
'04
Jan
'05
Jan
'06
Jan
'07
Jan
'08
Jan
'09
Jan
'10
Jan
'11
Jan
'12
Jan
'13
Jan
'14
$000/day
Containership
Bulk Carrier $000/day
Crude Tanker $000/day
Compares average earnings over the last 12 months for crude tankers,
Bulkers & containerships under 3500 TEU
Depreciation –
over 20 yrs
OPEX
Updated March 2014
12 month earnings smooths the bumps, showing what owners are banking
Container12 month earnings trend

CLARKSON RESEARCH SERVICES LTD
-18
-13
-8
-3
2
7
12
17
2000
2001
2002
2003
2004
2005
2006
2007
2008
2009
2010
2011
2012
2013
2014
OECD
Asia less China & JapanChina
1. Sea trade follows GNP cycles 2) Cycle every 7 years 3) Now in 6th
year of growth
% growth
World Economy Edging Up
China slowing
OECD
recovering
Credit
Crisis Dot.com
Crisis
Updated Mar 2014
CLARKSON RESEARCH SERVICES LTD
-5%
0%
5%
10%
15%19
9019
9119
9219
9319
9419
9519
9619
9719
9819
9920
0020
0120
0220
0320
0420
0520
0620
0720
0820
0920
1020
1120
1220
13
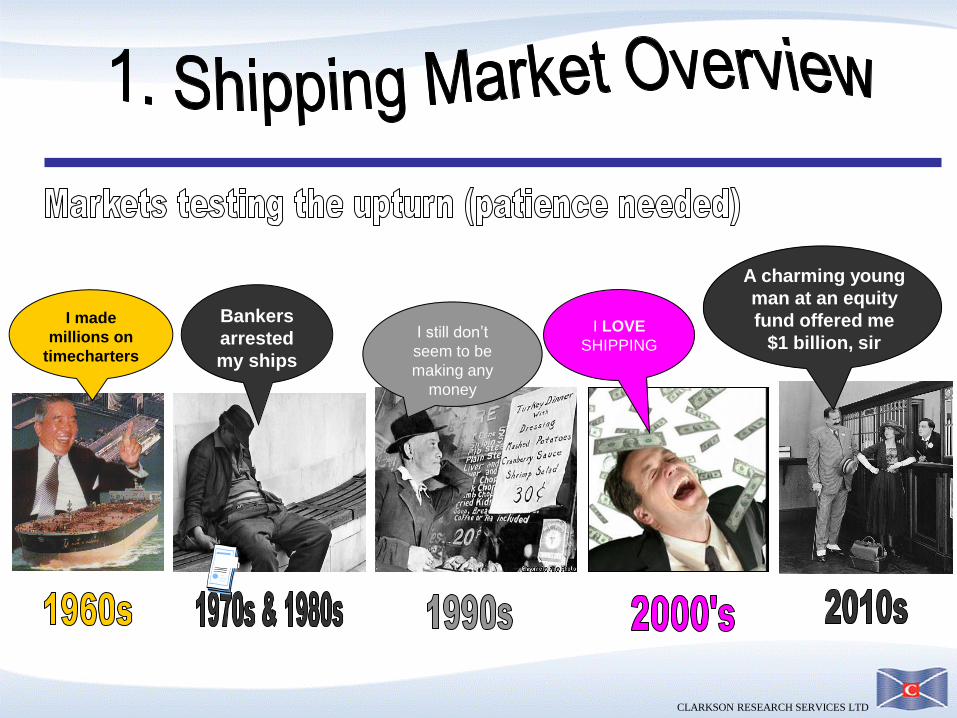
Crude Oil Imports% growth
Trend 2-3% pa
Crude Oil Imports Trend Still Disappointing
Trade into the Atlantic
has stalled and the only
growth is from Asia

CLARKSON RESEARCH SERVICES LTD
-5%
0%
5%
10%
15%19
9019
9119
9219
9319
9419
9519
9619
9719
9819
9920
0020
0120
0220
0320
0420
0520
0620
0720
0820
0920
1020
1120
1220
1320
14
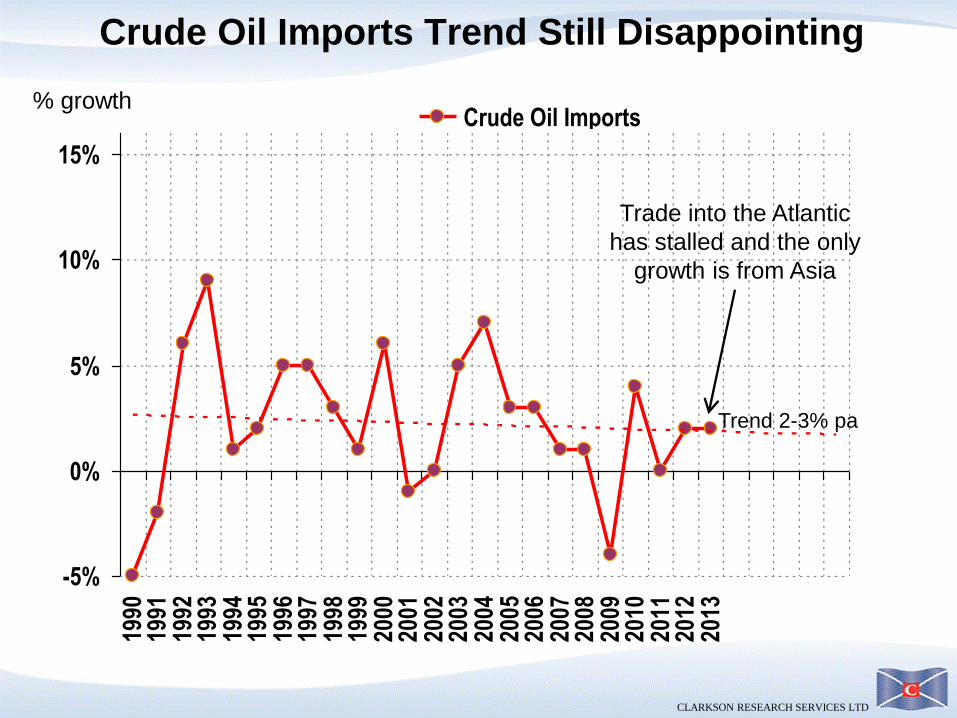
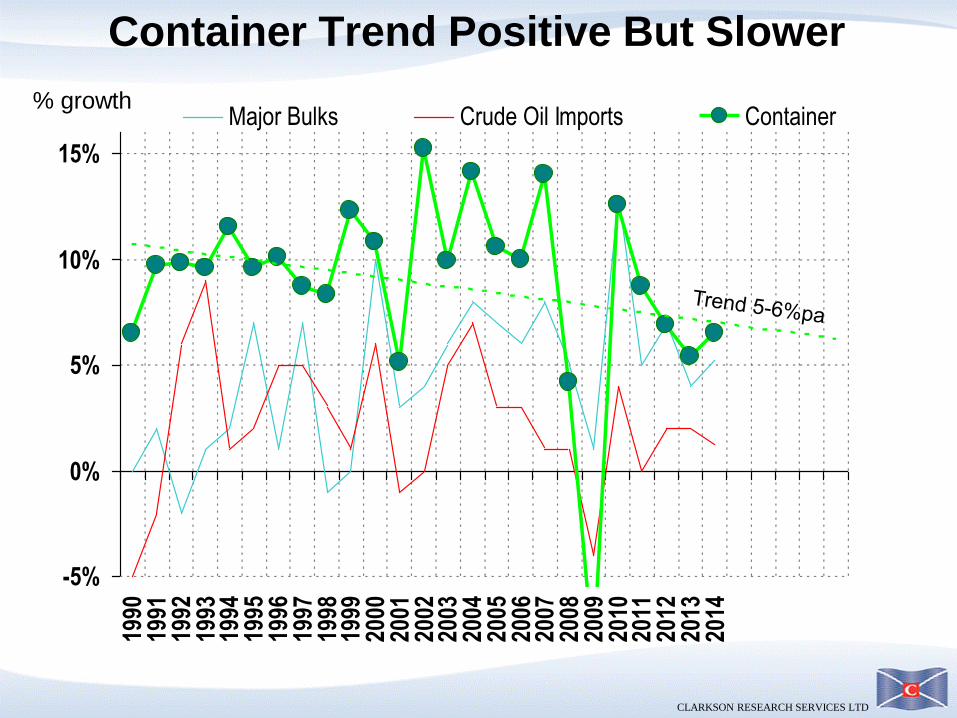
Major Bulks Crude Oil Imports% growth
Dry Bulk Growth Trend Positive
CLARKSON RESEARCH SERVICES LTD
-5%
0%
5%
10%
15%19
9019
9119
9219
9319
9419
9519
9619
9719
9819
9920
0020
0120
0220
0320
0420
0520
0620
0720
0820
0920
1020
1120
1220
1320
14
Major Bulks Crude Oil Imports Container% growth
Container Trend Positive But Slower

CLARKSON RESEARCH SERVICES LTD
0
200
400
600
800
1,000
1,200
1,400
1,6001
96
31
96
51
96
71
96
91
97
11
97
31
97
51
97
71
97
91
98
11
98
31
98
51
98
71
98
91
99
11
99
31
99
51
99
71
99
92
00
12
00
32
00
52
00
72
00
92
01
12
01
3
-6%
-4%
-2%
0%
2%
4%
6%
8%
10%
12%
14%
16%
World Merchant Fleet Growth Million dwt (year end)
Growth rate of the
fleet (right axis)
Has dropped below
4%pa but still
above 1990s rate
% fleet growth
CLARKSON RESEARCH SERVICES LTD
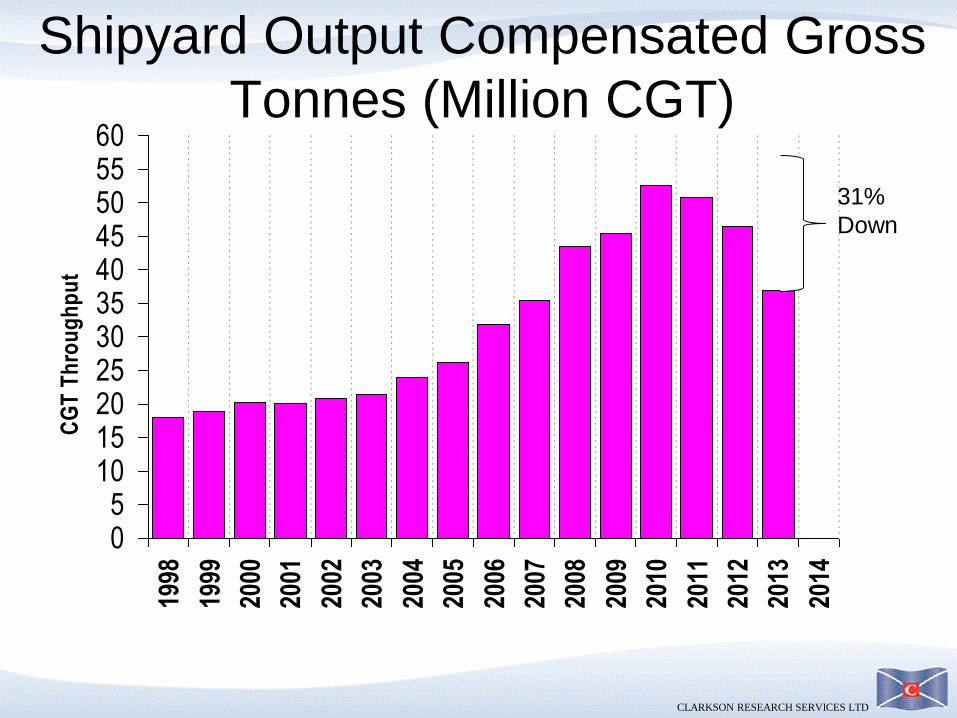
Shipyard Output Compensated Gross
Tonnes (Million CGT)
05
1015202530354045505560
1998
1999
2000
2001
2002
2003
2004
2005
2006
2007
2008
2009
2010
2011
2012
2013
2014
CG
T T
hro
ug
hp
ut
31%
Down

CLARKSON RESEARCH SERVICES LTD
Laid Up Tonnage
0.0
10.0
20.0
30.0
40.0
50.0
60.0
70.0
80.0
90.0
100.0
1971
1973
1975
1977
1979
1981
1983
1985
1987
1989
1991
1993
1995
1997
1999
2001
2003
2005
2007
2009
2011
2013
M d
wt
Bulkers TankersShows tonnage of ships laid up on a monthly basis
Laid up tonnage (not
really tracked) is still low.
Surplus absorbed by
slow steaming, waiting
etc
% on T/C

CLARKSON RESEARCH SERVICES LTD
World Fleet
0
20
40
60
80
100
120
140
160
180
Other
Bulk Carriers
Tankers
Not much scope for
demolition
This chart shows the fleet by year of build.
Today there is little tonnage over 20 years old to support demolition
Age profile of the world fleet
CLARKSON RESEARCH SERVICES LTD
0
10
20
30
40
50
60
70
80
90
100Ja
n-9
0
Jan-9
2
Jan-9
4
Jan '9
6
Jan-9
8
Jan-0
0
Jan-0
2
Jan-0
4
Jan '0
6
Jan '0
8
Jan '1
0
Jan '1
2
June '1
3
pri
ce $
mil
lio
n
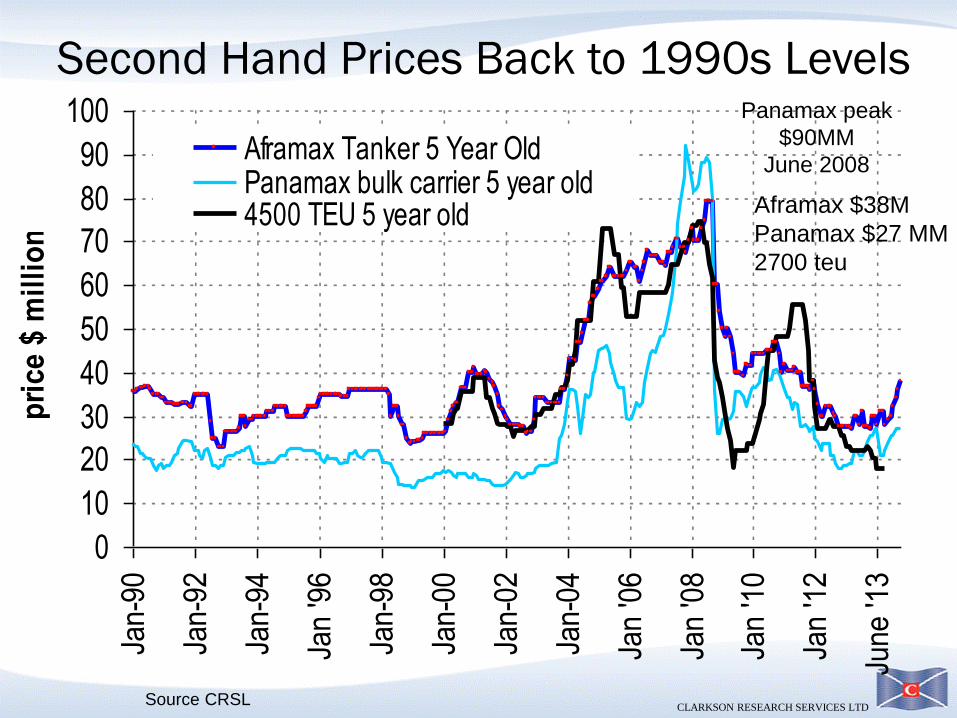
Aframax Tanker 5 Year OldPanamax bulk carrier 5 year old4500 TEU 5 year old
Panamax peak
$90MM
June 2008
Second Hand Prices Back to 1990s Levels
Source CRSL
Aframax $38M
Panamax $27 MM
2700 teu

CLARKSON RESEARCH SERVICES LTD
0
20
40
60
80
100
120
140
1967 1972 1977 1982 1987 1992 1997 2002 2007 2012
$ millionVLCC Suezmax Aframax Tanker
Products Capesize Panamax Bulk
30,000 dwt bulker 1600 TEU 6700 TEU
Source: Compiled from several sources including Fearnleys, CRSL
Shipbuilding Prices Edging Up
Aframax
$54.5 MM
Panamax
$29.5 MM
CLARKSON RESEARCH SERVICES LTD
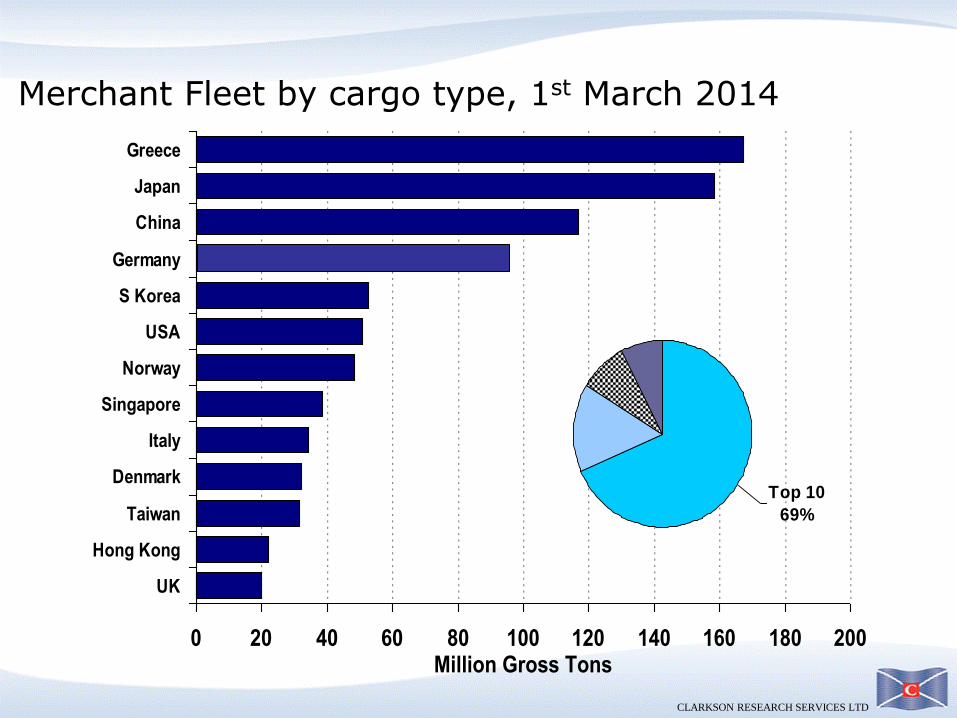
0 20 40 60 80 100 120 140 160 180 200
Greece
Japan
China
Germany
S Korea
USA
Norway
Singapore
Italy
Denmark
Taiwan
Hong Kong
UK
Million Gross Tons
Top 10
69%
Merchant Fleet by cargo type, 1st March 2014

CLARKSON RESEARCH SERVICES LTD
Shipping – Many Small Companies
Company Size** Number of
Companies
Number of
vessels m.GT
% of fleet
(no. of vessels)
% of fleet
(GT)
Ships per
Company
Small (1-5) 5,577 9,818 167.0 25% 15% 1.8
Small (6-10) 999 5,878 124.5 15% 11% 6.0
Medium (11-20) 657 7,405 192.0 19% 17% 11.3
Large (21-50) 373 8,326 300.3 21% 27% 22.3
Very Large (51-100) 101 5,196 183.7 13% 17% 51.4
XXL (100+) 22 2,899 141.2 7% 13% 131.8
Total 7,729 39,522 1108.7 5.1
*Based on Beneficial Owner, excludes unknown owners
World fleet by company size vessels >2,000 GT
**Company size based on full fleet >100 GT

CLARKSON RESEARCH SERVICES LTD
• In 1790 shipping had not changed for centuries
• Small wooden ships were built of expensive imported timber (see right)
• masts, timber spars and hessian ropes restricted size to 300 tonnes.
• Today we have MOVED ON…
Source: Biblioteque Nationale, Paris, Photo M. Cabaud Even with a crane
it took four men to
handle this bundle
So where do we go next?
CLARKSON RESEARCH SERVICES LTD
0
100
200
300
400
500
600
1741
1751
1761
1771
1781
1791
1803
1811
1821
1831
1841
1851
1861
1871
1881
1891
1901
1911
1921
1931
1941
1951
1961
1971
1981
1991
2001
2011
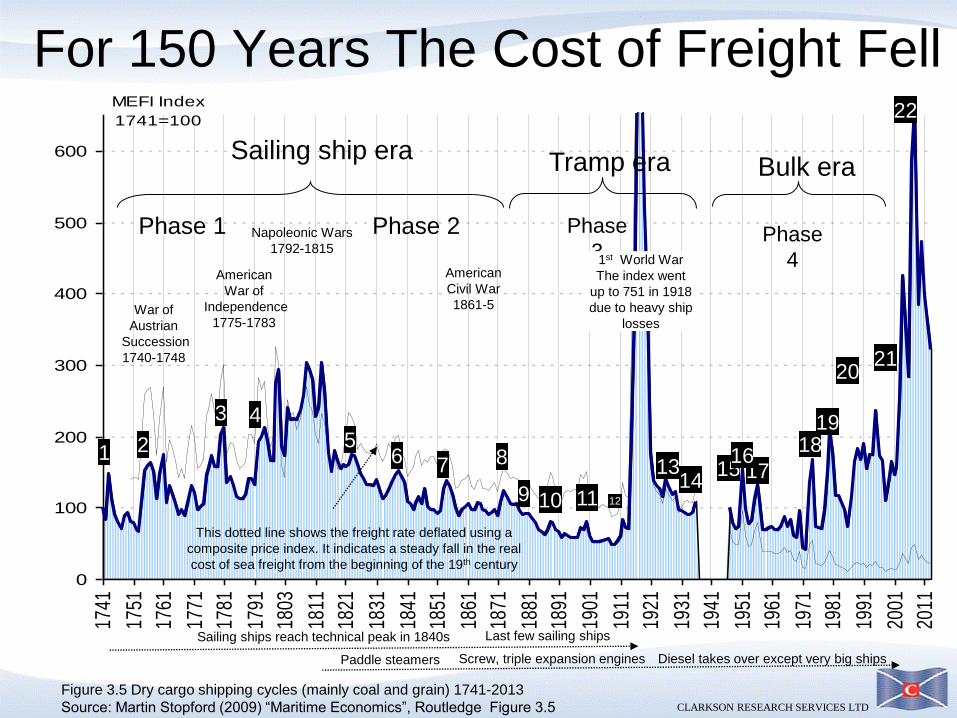
MEFI Index
1741=100
1 2
3 4
7 8
10 11 12
13 14 17 15
16 18
19
20 21
22
Sailing ship era
Phase 1 Phase 2
Tramp era
Phase
3
6 5
Napoleonic Wars
1792-1815
War of
Austrian
Succession
1740-1748
American
War of
Independence
1775-1783
American
Civil War
1861-5
1st World War
The index went
up to 751 in 1918
due to heavy ship
losses
Figure 3.5 Dry cargo shipping cycles (mainly coal and grain) 1741-2013
Source: Martin Stopford (2009) “Maritime Economics”, Routledge Figure 3.5
Sailing ships reach technical peak in 1840s Last few sailing ships
Paddle steamers Screw, triple expansion engines Diesel takes over except very big ships
This dotted line shows the freight rate deflated using a
composite price index. It indicates a steady fall in the real
cost of sea freight from the beginning of the 19th century
9
For 150 Years The Cost of Freight Fell
Bulk era
Phase
4
CLARKSON RESEARCH SERVICES LTD
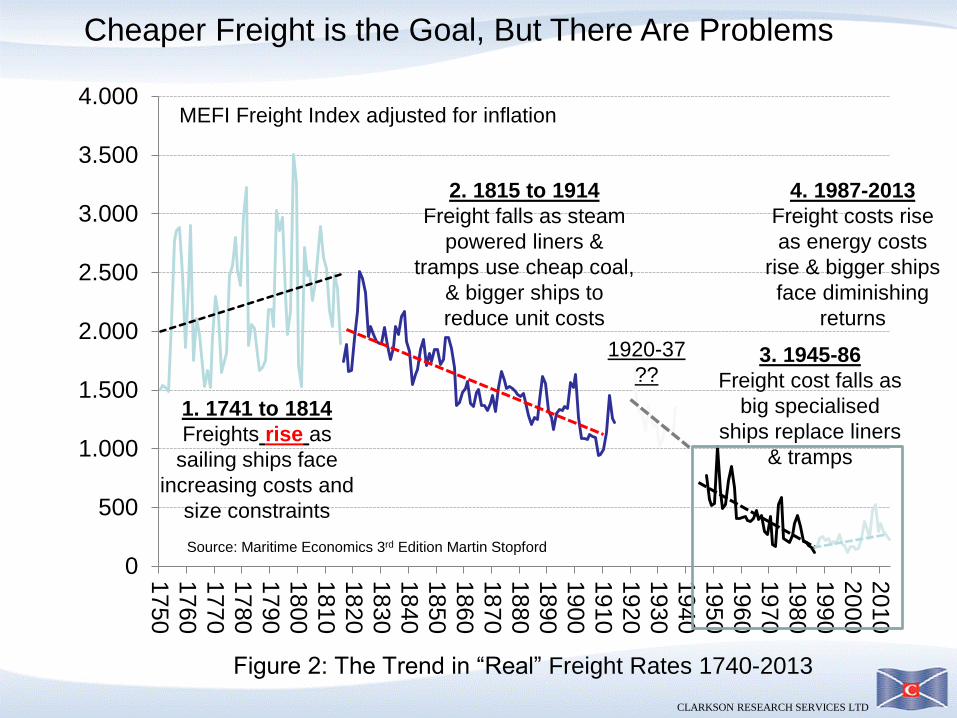
Figure 2: The Trend in “Real” Freight Rates 1740-2013
0
500
1.000
1.500
2.000
2.500
3.000
3.500
4.000
1750
1760
1770
1780
1790
1800
1810
1820
1830
1840
1850
1860
1870
1880
1890
1900
1910
1920
1930
1940
1950
1960
1970
1980
1990
2000
2010
Source: Maritime Economics 3rd Edition Martin Stopford
MEFI Freight Index adjusted for inflation
1. 1741 to 1814
Freights rise as
sailing ships face
increasing costs and
size constraints
2. 1815 to 1914
Freight falls as steam
powered liners &
tramps use cheap coal,
& bigger ships to
reduce unit costs
3. 1945-86
Freight cost falls as
big specialised
ships replace liners
& tramps
4. 1987-2013
Freight costs rise
as energy costs
rise & bigger ships
face diminishing
returns
1920-37
??
Cheaper Freight is the Goal, But There Are Problems

CLARKSON RESEARCH SERVICES LTD
Trends in “Real” Freight Rates 1947-2013
0
100
200
300
400
500
600
700
800
900
1000
1947
1951
1955
1959
1963
1967
1971
1975
1979
1983
1987
1991
1995
1999
2003
2007
2011
Source: Maritime Economics 3rd Edition Martin Stopford
MEFI Freight Index deflated by price index
1945-86
Mechanization of cargo
handling & bigger ships
reduce unit freight costs by
75% between 1947 and
1987
1987-2013
Rising oil fuel prices; &
diminishing returns from
bigger ships increase
freight costs by 66%
CLARKSON RESEARCH SERVICES LTD
Fifty years ago the
next phase was big
ships, big hubs and
East-West Trade.
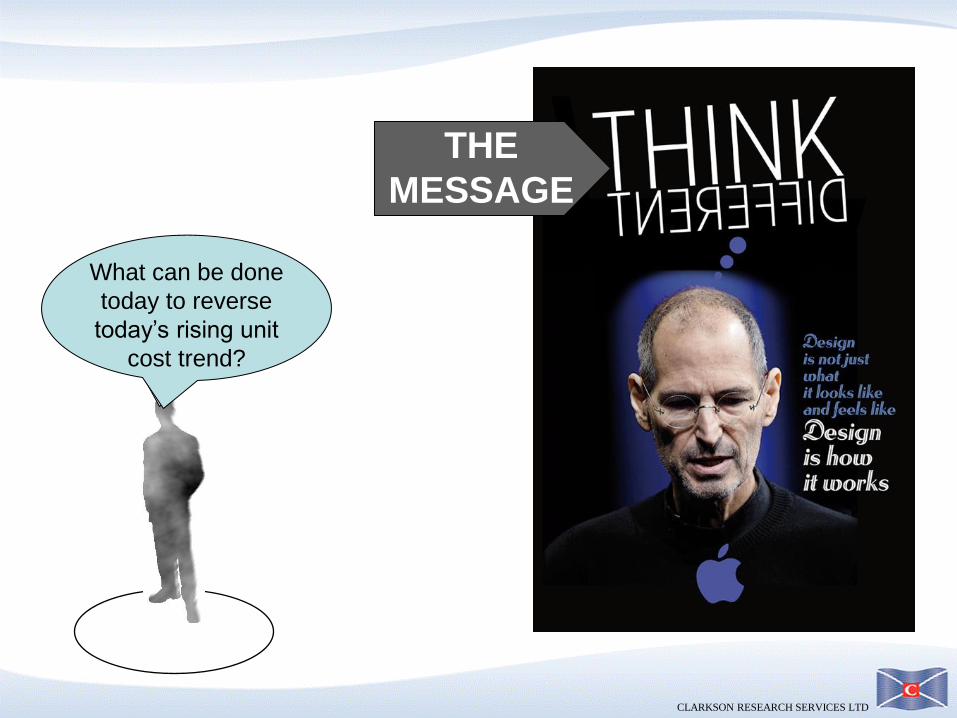
What can be done
today to reverse
today’s rising unit
cost trend?
THE
MESSAGE

CLARKSON RESEARCH SERVICES LTD
Europe’s Voyages of discovery
24/04/2014 ©Martin Stopford 22
Ship
pin
g D
rivers
Tomorrow’s Trade
Fossil Fuels
Mechanization
Information
MEGA TREND
ignore
Sometimes CHANGE is
the only option
CLARKSON RESEARCH SERVICES LTD
4/24/2014 23
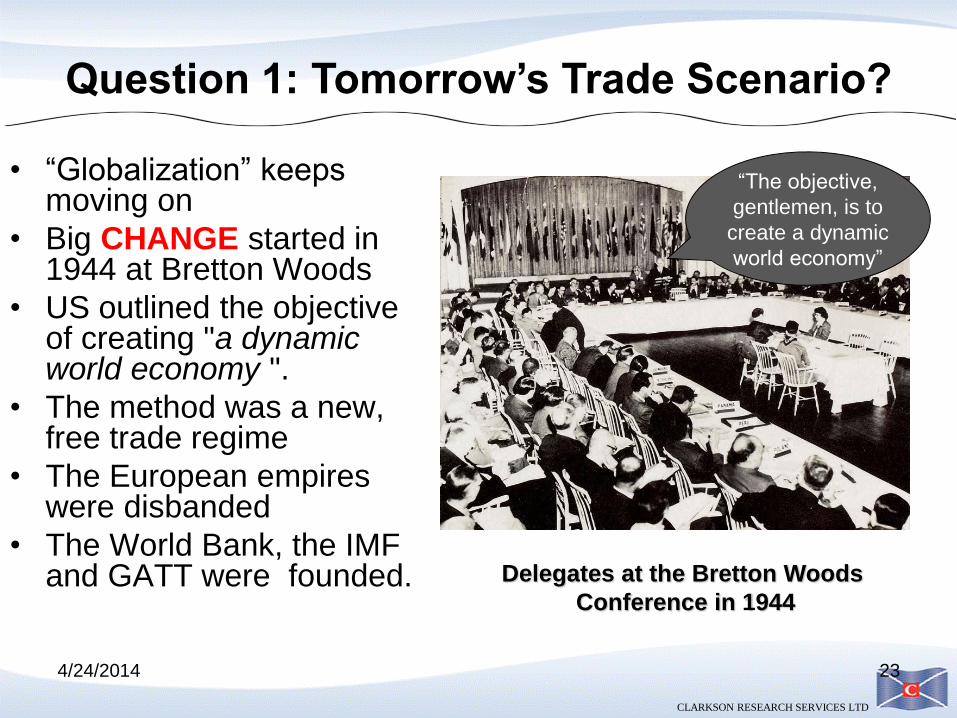
• “Globalization” keeps moving on
• Big CHANGE started in 1944 at Bretton Woods
• US outlined the objective of creating "a dynamic world economy ".
• The method was a new, free trade regime
• The European empires were disbanded
• The World Bank, the IMF and GATT were founded. Delegates at the Bretton Woods
Conference in 1944
“The objective,
gentlemen, is to
create a dynamic
world economy”
Question 1: Tomorrow’s Trade Scenario?

CLARKSON RESEARCH SERVICES LTD
Volume of Trade is Growing
• Sea trade increased from 500 Mt in 1950 to 7 Bt in 2005 (Figure 1.11).
• Growth led by Europe and Japan.
• Multinationals expanded steel, aluminum, oil using imported materials.
• Big ships reduced sea transport costs 0
1
2
3
4
5
6
7
8
9
19
50
19
60
19
70
19
80
19
90
20
00
20
10
Bill
ion
to
ns
of
carg
o
Source: United Nations Statistical Yearbooks
Europe
S.America
N.America
Africa
Asia
M. East Oceania Russia
In 55 years after the 2nd
world war seaborne imports
grew at 4.7% per annum,
except for a major recession
1979-87 when trade did not
increase
Figure 3 Seaborne imports by region 1950-2010

CLARKSON RESEARCH SERVICES LTD
Balance of Global Trade is Changing
0%
10%
20%
30%
40%
50%
60%
70%
80%
90%
100%
1950 1960 1970 1980 1990 2000 2010
Atlantic
Shows the of Atlantic and Pacific Trade volume as a % of world trade
Atlantic Cargo has
fallen from 80% of world
trade to 46% in 2013
Pacific cargo
has increased
from 18% to
53% in 2013

CLARKSON RESEARCH SERVICES LTD
Future Trade Scenario Problematic? It’s the Field of Dreams Scenario
0
5
10
15
20
25
30
1950
1955
1960
1965
1970
1975
1980
1985
1990
1995
2000
2005
2010
2015
2020
2025
2030
2035
2040
2045
2050
2055
Bil
lio
n t
on
s t
rad
e
Total Trade
Sea Trade Scenario
26 billion tons of trade in 2055
may be too extreme. How can
the 50% cut in carbon footprint
be achieved?
How long to double again?
This shows 30 years,
averaging 2.25% pa
Cargo doubled from 5 bn to
10bn tonnes in 18 years
4.4%pa
CLARKSON RESEARCH SERVICES LTD
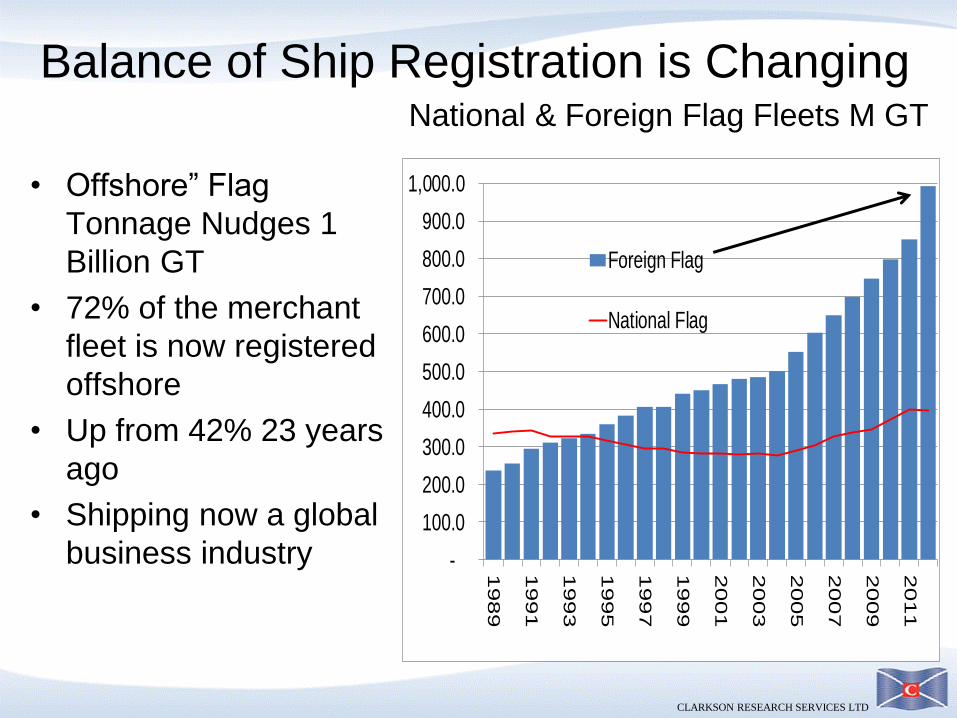
Balance of Ship Registration is Changing
• Offshore” Flag
Tonnage Nudges 1
Billion GT
• 72% of the merchant
fleet is now registered
offshore
• Up from 42% 23 years
ago
• Shipping now a global
business industry -
100.0
200.0
300.0
400.0
500.0
600.0
700.0
800.0
900.0
1,000.0
1989
19
91
1993
1995
1997
1999
2001
2003
2005
2007
2009
2011
Foreign Flag
National Flag
National & Foreign Flag Fleets M GT
CLARKSON RESEARCH SERVICES LTD
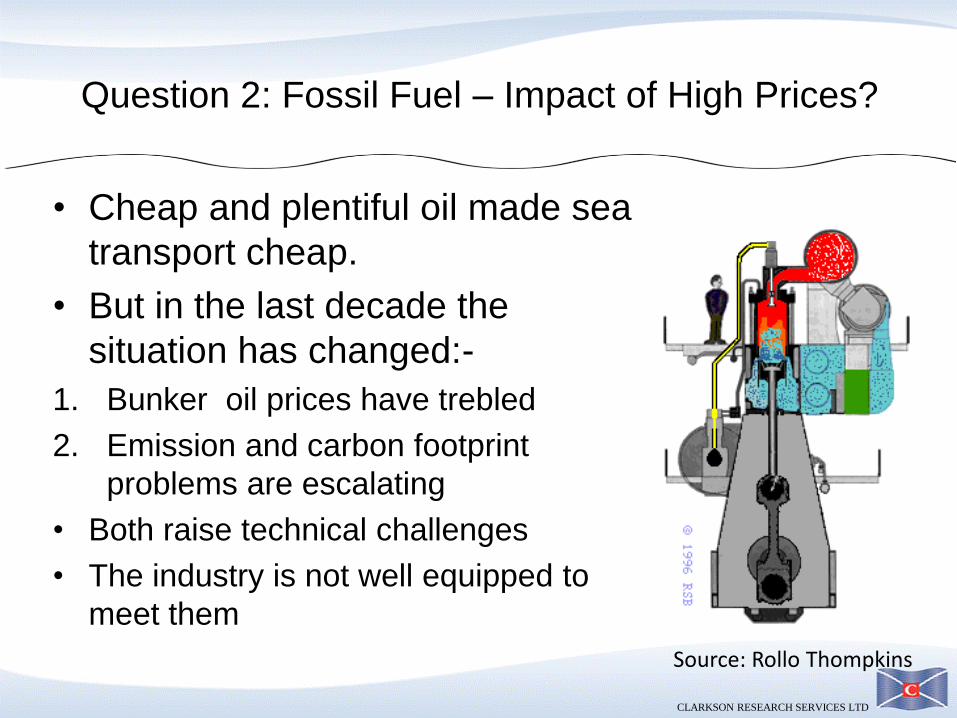
Question 2: Fossil Fuel – Impact of High Prices?
• Cheap and plentiful oil made sea
transport cheap.
• But in the last decade the
situation has changed:-
1. Bunker oil prices have trebled
2. Emission and carbon footprint
problems are escalating
• Both raise technical challenges
• The industry is not well equipped to
meet them
Source: Rollo Thompkins

CLARKSON RESEARCH SERVICES LTD
Today’s Oil Prices are Problematic
0
10
20
30
40
50
60
70
80
90
100
110
120
13018
6118
6718
7318
7918
8518
9118
9719
0319
0919
1519
2119
2719
3319
3919
4519
5119
5719
6319
6919
7519
8119
8719
9319
9920
0520
11
$ p
er b
arre
l
$ money of the day
Cheap oil encouraged bigger, faster ships
Bigger ships
can’t deal
with this cost
increase
CLARKSON RESEARCH SERVICES LTD
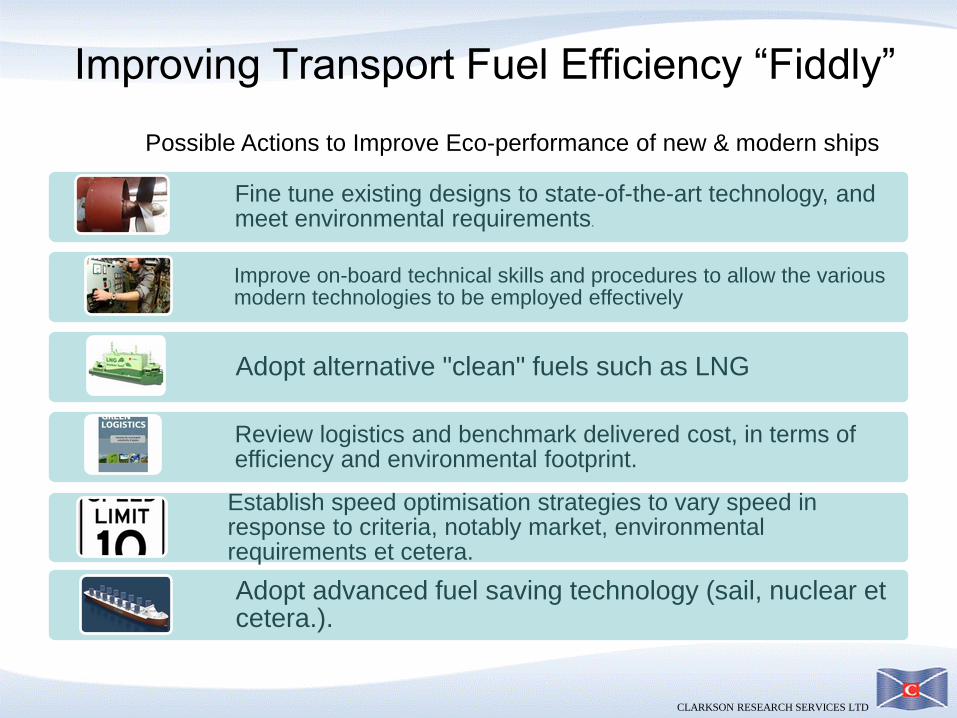
Improving Transport Fuel Efficiency “Fiddly”
Fine tune existing designs to state-of-the-art technology, and meet environmental requirements.
Improve on-board technical skills and procedures to allow the various modern technologies to be employed effectively
Adopt alternative "clean" fuels such as LNG
Review logistics and benchmark delivered cost, in terms of efficiency and environmental footprint.
Establish speed optimisation strategies to vary speed in response to criteria, notably market, environmental requirements et cetera.
Adopt advanced fuel saving technology (sail, nuclear et cetera.).
Possible Actions to Improve Eco-performance of new & modern ships

CLARKSON RESEARCH SERVICES LTD
Question 3: Diminishing Marginal Returns?
• In 1950 mechanization of
cargo handling was urgently
needed to carry rapidly
growing trade
• Ships were spending half
their time handling cargo
• Multinational cargo
companies drove the
process.
• Bigger, faster ships;
integrated cargo handling;
coastal processing plants
produced major cost savings
4/24/2014 31
Malcolm McLean, 1956, inventor of containerisation Complex cargo handling on Norwegian liner 1954 –
Ports were congested & ships unproductive

CLARKSON RESEARCH SERVICES LTD
Diminishing Returns From Size Increase
• Mechanization technology
is mature.
• Economies of scale face
diminishing returns.
• Cost saving of 5,000 dwt
size increase falls from
12% to 1.4% (blue bars)
• New ways to cut transport
costs are needed
• “Micro management” is the
best possibility
-14%
-12%
-10%
-8%
-6%
-4%
-2%
0% -
50
100
150
200
250
35
50
65
80
95
11
0
12
5
14
0
15
5
17
0
Saving % (right axis)
Unit Cost/$/dwt (left axis)
Bulk carrier size 000 Dwt
Figure 6: Bulk Carrier Economies of Scale
BLUE BARS SHOW COST SAVINGS
DIMINISH AS SHIPS GETS BIGGER
CLARKSON RESEARCH SERVICES LTD
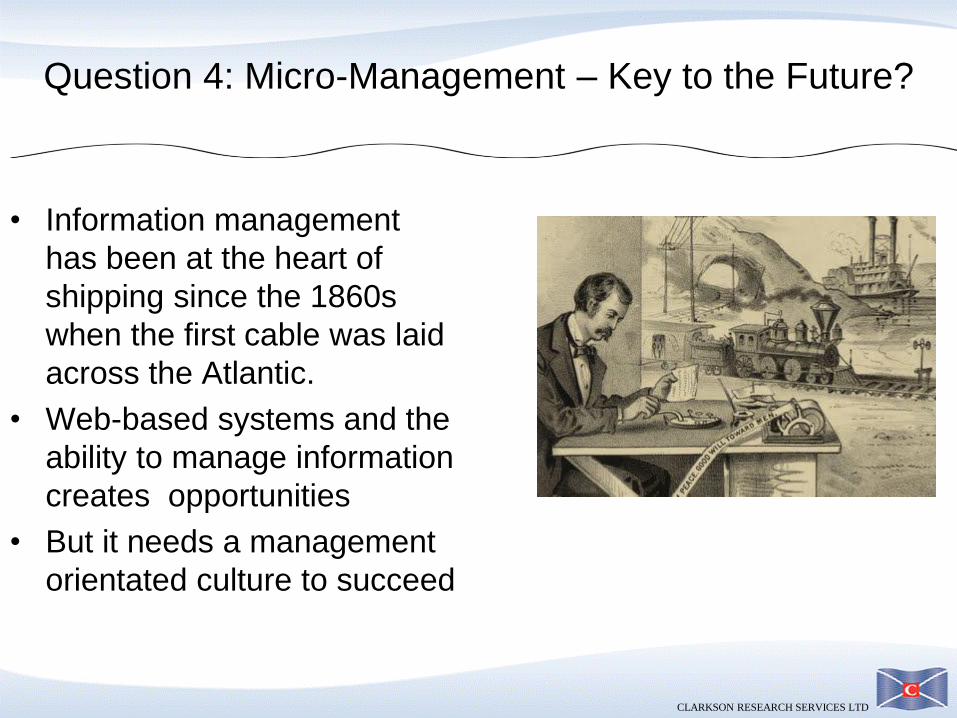
Question 4: Micro-Management – Key to the Future?
• Information management
has been at the heart of
shipping since the 1860s
when the first cable was laid
across the Atlantic.
• Web-based systems and the
ability to manage information
creates opportunities
• But it needs a management
orientated culture to succeed

CLARKSON RESEARCH SERVICES LTD
Information Technology & Micro-Management
Fibre optic cable network
Gordon
Moore
Invented “Moore’s Law”

CLARKSON RESEARCH SERVICES LTD
• The sea transport business is at the end of a
major phase dominated by mechanization of
cargo transport
• Today’s market based system focusses too
much on capital and not enough on the
management of transport
• After a century of freight cost reduction, freight
costs increasing due to the diminishing
marginal return on investment in ever-bigger
ships and rising fuel cost
• If cargo volume doubles in 30 years we need
more efficient transport; cheaper freight;
smaller carbon footprint; zero pollution,
• Shipping needs a vision: micro management of
freight transport, building on the information
revolution--- and more engineers!
• But to do this the shipping industry needs a
management REVOLUTION
Shipping cycles
manage
investment, but
investors
MANAGE
strategy
CLARKSON RESEARCH SERVICES LTD
Seven Pressures for Change
1. Ship Technology Mature
2. Low returns
3. Energy costs high & rising
4. Climate Change
5. Geopolitics
6. Market driven business
7. China maturing
When Alexander saw the breadth of his domain he wept, for there
were no more worlds to conquer

CLARKSON RESEARCH SERVICES LTD
150 Years of Global Information….
10
33 33
39
50
90 90 92
90 89 89 89
-
10
20
30
40
50
60
70
80
90
100
1870
1883
1884
1885
1886
1900
1901
1902
1903
1904
1905
1906
Number messages (millions)
• In 1855 the first cable was laid across the Atlantic, but after 40 days it stopped working.
• In 1866 another successful trans-Atlantic cable was laid.
• In 1871 a cable was laid to India and Hong Kong
• By 1897 162,000 nautical miles of cable had been laid
• The impact on shipping logistics was profound
Source: Encyclopaedia Britannica 1910

CLARKSON RESEARCH SERVICES LTD
020406080
100120140160180200220240
19
60
19
65
19
70
19
75
19
80
19
85
19
90
19
95
20
00
20
05
20
10
20
15
20
20
20
25
20
30
20
35
Oil
Pri
ce/b
arr
el
Oil Price Future actual
1993 forecast 1994 forecast
1995 forecast 1998 forecast
2000 forecast 2004 forecast
2006 forecast 2007 forecast
2008 forecast 2010 "Current Policies"
Source: BP energy review
2008
2007
2006
Oil Price Estimates “Unreliable”
2010
2005 & earlier
Related Documents