Annual Review 2020 SHIPPING AND SHIPBUILDING MARKETS

Welcome message from author
This document is posted to help you gain knowledge. Please leave a comment to let me know what you think about it! Share it to your friends and learn new things together.
Transcript
Annual Review
2020
SHIPPING AND SHIPBUILDING MARKETS
Shipping & Shipbuilding Markets
The BRS Group is a diversified global shipping services group offering a range of maritime activities which complement its core shipbroking business. In addition to Shipbroking and Yacht Brokerage, the Group’s activities include Freight Futures (FFA’s), Software Technology and Market Intelligence.
530 Employees worldwide
210Shipbrokers
100Assets transactions per year
5,500Chartering transactions per year
BRS GROUP - Annual review 2020 1
Shipbuilding
Dry Bulk
Tanker
Chemicals & Small Tankers
LPG
LNG
Offshore
Cruise
Ship Finance
Containerships
Ro-Ro
Car Carrier
Contents
.................. 05
......................... 33
............................. 45
............... 59
.................................. 65
.................................. 71
......................... 77
.............................. 85
.................. 91
.............. 97
............................ 107
................... 113
SUSTAINABLE SHIPPING
The world has woken up to the environmental damage mankind has brought
on itself and despite the tepid leadership our governmental organizations have
shown, the general population has identified emissions in all their forms as being
one of the root causes of a pending climate disaster. Investors, universities and
their students, the consumer and the manufacturing industry have all decided
that if governments can’t or won’t put meaningful measures in place to limit
global warming, there will be economic sanctions enforced by the consumption
choices of the world’s citizens. The latest restrictions on the emissions from
shipping came into force with IMO2020 but companies, countries, ports and
zones are pushing for much tighter restrictions. There is the perception that
emissions are causing global warming. As casualties grow, this will strengthen
rising sea levels and consequential risk of low-lying land being submerged,
increased extreme weather events impacting all corners of the globe be it fires,
droughts, floods, hurricanes or typhoons. The consequences of these are the
transfer of populations and sadly the loss of human life.
If shipping was a country it would be the 6th largest polluter in the world and
no doubt shipping, like other industries which heavily contribute to emissions,
will have to invest more in Research and Development and find new ways of
transporting by sea while emitting less.
SHORTER ASSET LIFE
The useable life of an asset can no longer be the standard 25 to 30 years
which owners used to amortize their assets, as like technology and consumer
goods, it will shorten significantly. Already financing seems to be limited to
7 to 10 years with the leasing houses who are now responsible for the lion’s
share of financing in the maritime world. Shorter shelf life, means less risk,
but higher costs. Combine this with ‘sustainable lending’ and we should see
a far less speculative industry and one that requires end users and financial
leases or charters to guarantee a return on ever more expensive technologically
advanced vessels.
On the other hand, there is a current of thought that foresees extending asset
lives with refitting and upgrading. In any case, it will require constant investment
and owners will only undertake it if there is a guaranteed payback or penalty
for not adopting the technology.
ADJUSTEMENT OF YARD CAPACITY
Before building too many ships, the Asians (particularly the Chinese who
opened themselves to the world at the end of the last century) built too many
shipyards. During 2019, shipbuilding nations and particularly China, continued
to rationalize yard capacity through mergers and bankruptcies in order that
their yards be not only profitable, but capable and responsible for providing
sufficient capacity to renew and to innovate on a much shorter cycle.
DATA: ARTIFICIAL INTELLIGENCE
Shipping markets are becoming more financially sophisticated and freight
hedging tools are becoming mainstream. They will soon be essential in every
owner’s and charterer’s maritime endeavours. When used correctly, they
permit protection and assure the financial returns required to keep up with
technological innovations.
It is no wonder that the owner operator model, that
requires hedging with FFA’s and using options to make and
secure significant profits, has led to very big discrepancies
between the results received by owners, freight traders
and commodity giants. The most successful users are often
the most sophisticated with the best access to data and the
resources to correctly interpret it.
ENERGY: THE UNKNOWN
It is certain that fuel for transporting by sea will not be
the same in the future as it has been for the last 100
years. To meet the ambitious targets set by the IMO of
reducing CO2 emissions by 50% over 2008-2050, other
energies will undoubtedly play a larger and larger role in
ocean transportation. It will be sometime before any one
energy source replaces oil but a multitude of possibilities
are starting to emerge: natural gas, hydrogen, wind, solar,
methane, methanol, ammonia, LPG all with their economic
restrictions and potentials.
Innovation is leading to a less speculative market, be it
driven by shipyards, citizen pressure to curb emissions
sustainable financing, or by improved data transparency
and tools to monitor and evaluate technology and
commercial practices. The oil majors, the miners, the mega
container carriers are already increasingly working hand in
hand with yards and owners to prod our industry towards
a future where it is capable of meeting future global
transportation requirements efficiently and sustainably.
Indeed, an industry that can accurately calculate its
environmental savings and the associated costs, is a big
step ahead in materializing returns on its efforts.
GHG emissions represent a serious challenge for shipping. If
this challenge is not taken seriously, it might simply reduce
the reliance on international shipping as a transportation
mode and support recent calls for de-globalisation. The
shipping community needs to reconquer public opinion
as transportation at sea remains the most economical
transportation per ton-mile in terms of energy use.
We are starting to leave the boom and bust shipping
cycle to concentrate on innovation, technology, data
and financial tools where returns can be foreseen and
anticipated. Accordingly, shipping and the environment
will be better off as a result.
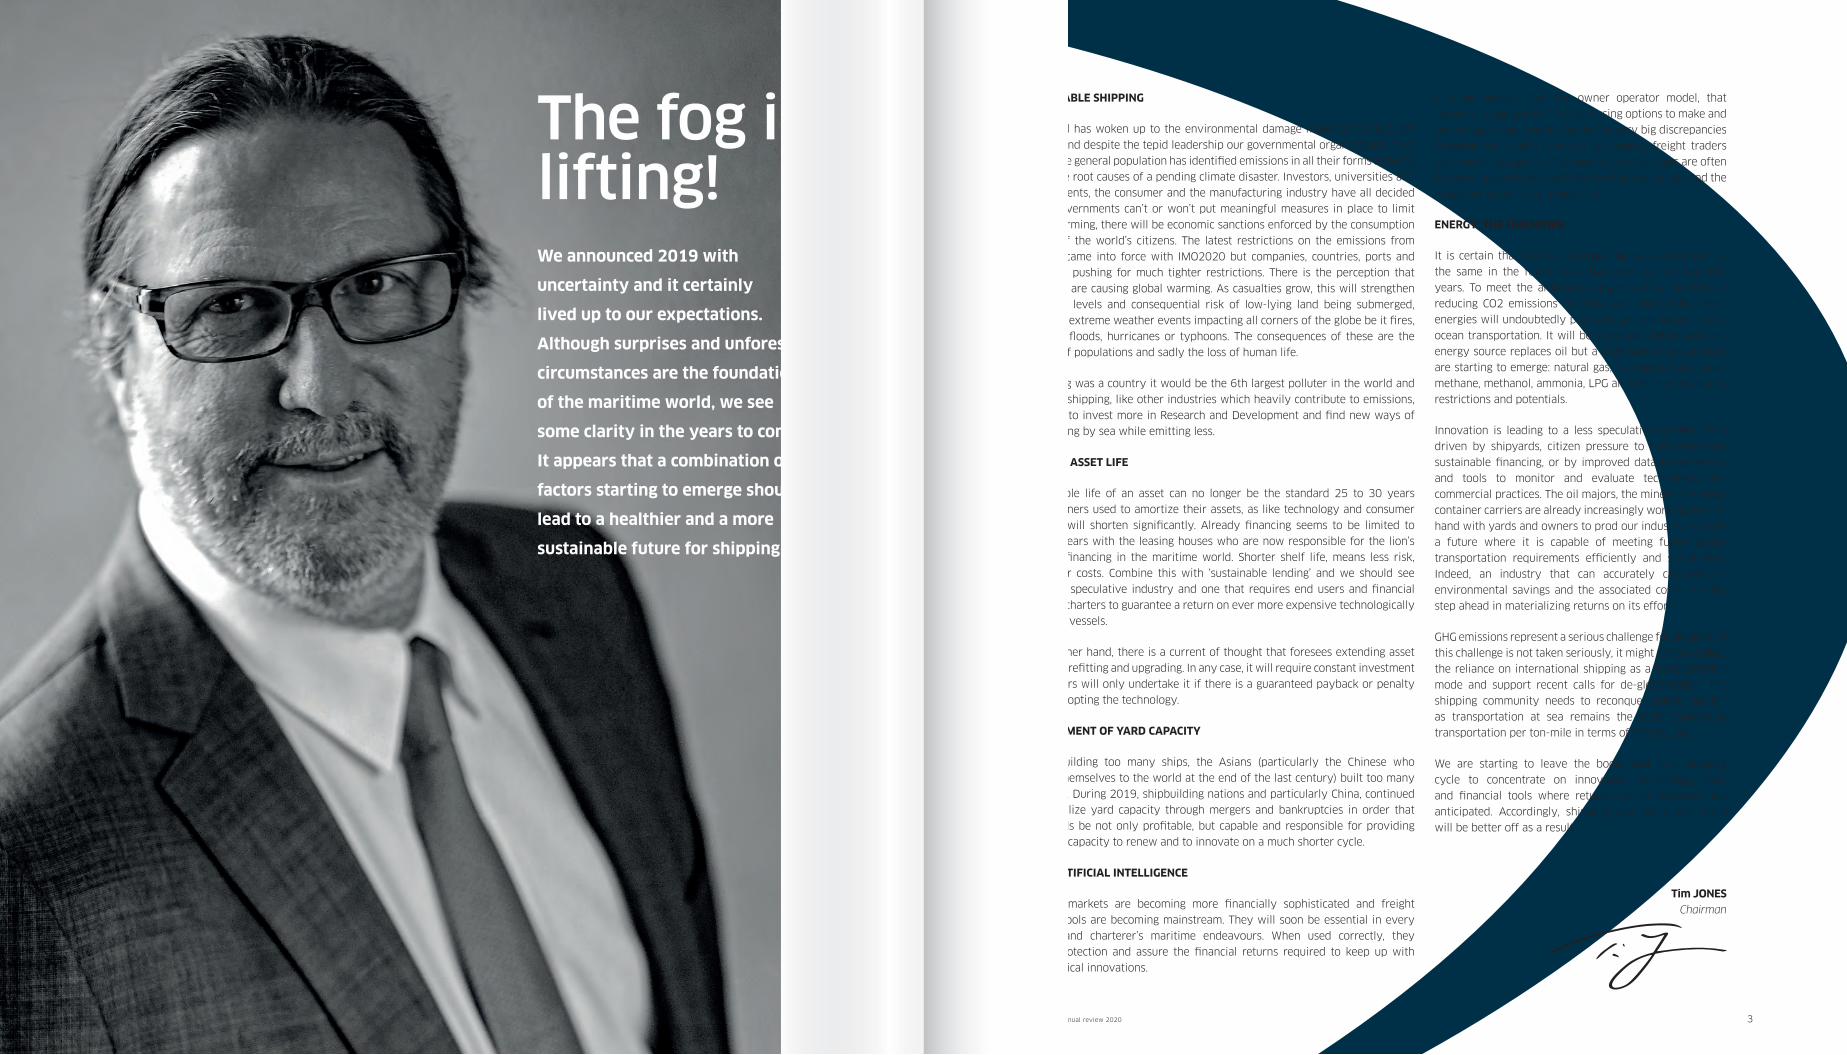
Tim JONES
Chairman
3BRS GROUP - Annual review 20202
We announced 2019 with
uncertainty and it certainly
lived up to our expectations.
Although surprises and unforeseen
circumstances are the foundations
of the maritime world, we see
some clarity in the years to come.
It appears that a combination of
factors starting to emerge should
lead to a healthier and a more
sustainable future for shipping.
The fog is lifting!
Shipbuilding
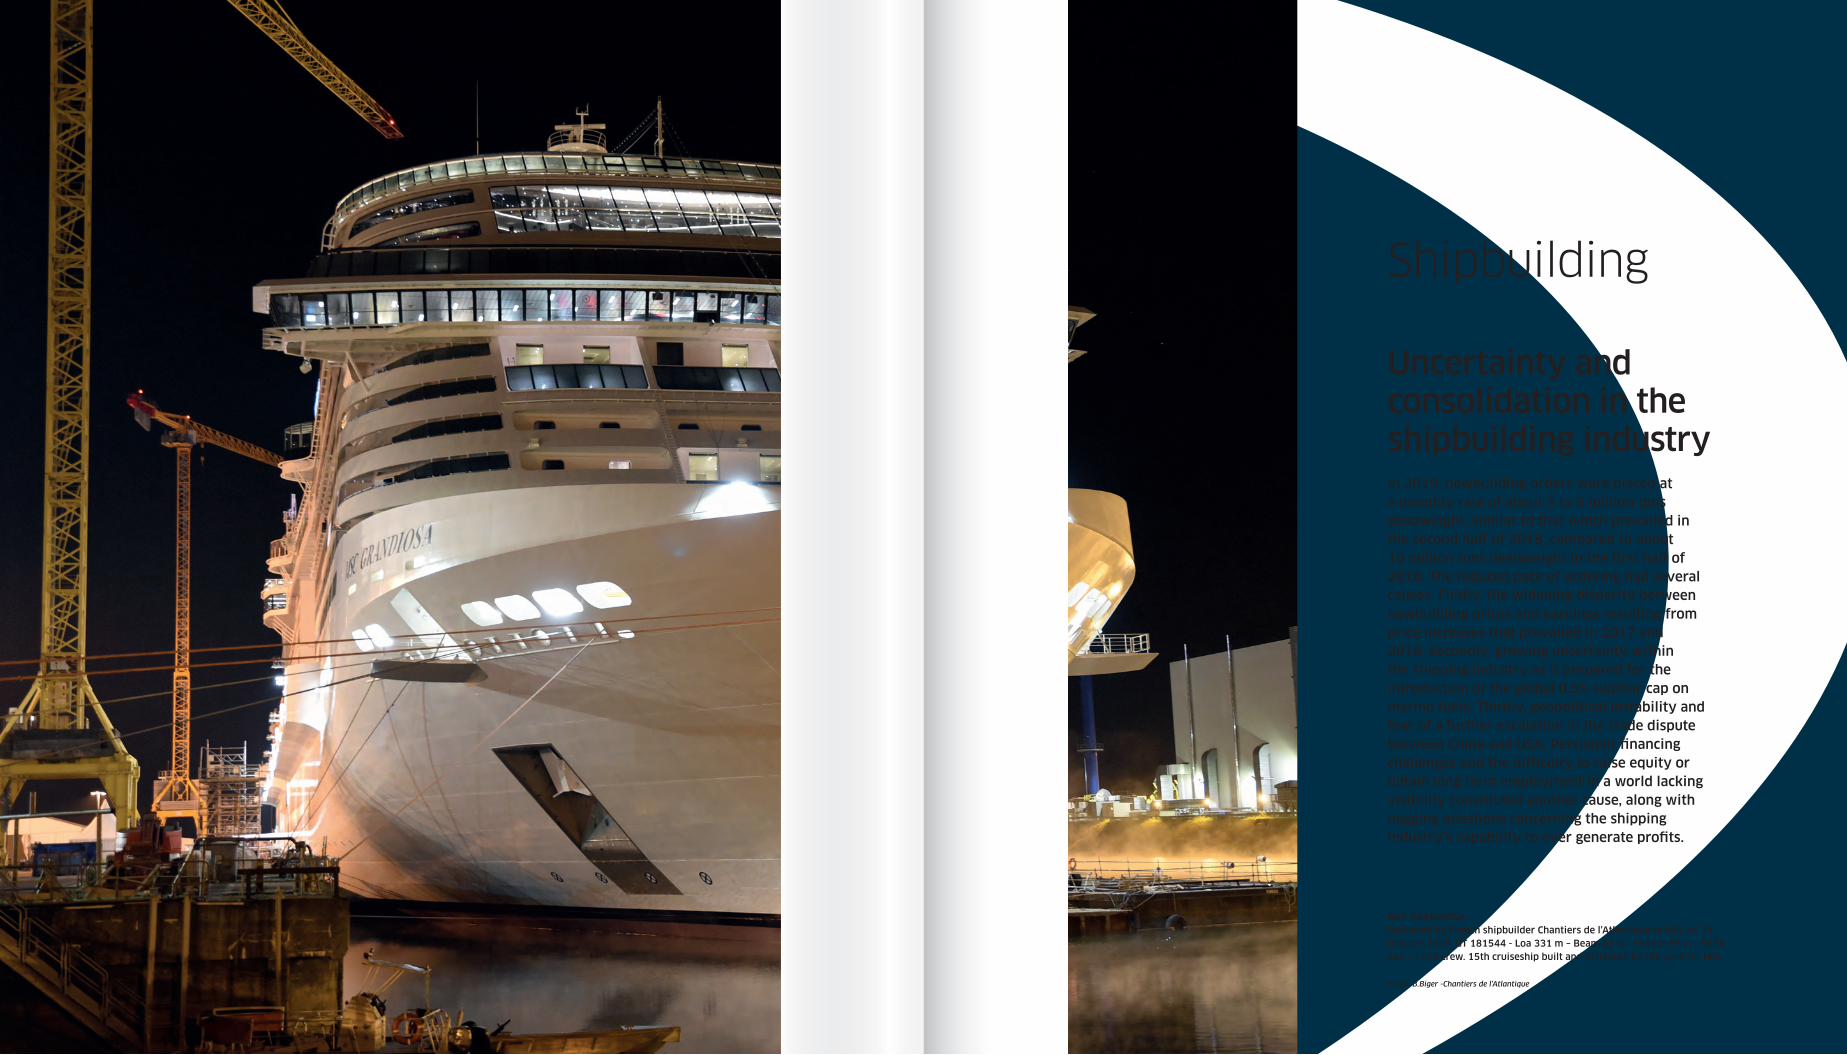
MSC GRANDIOSA Delivered by French shipbuilder Chantiers de l’Atlantique to MSC on 31 October 2019. GT 181544 - Loa 331 m – Beam 43 m – Height 67 m - 6634 pax – 1704 crew. 15th cruiseship built and delivered by the yard for MSC.
Photo: B.Biger -Chantiers de l’Atlantique
In 2019, newbuilding orders were placed at a monthly rate of about 5 to 6 million tons deadweight, similar to that which prevailed in the second half of 2018, compared to about 10 million tons deadweight in the first half of 2018. The reduced pace of ordering had several causes. Firstly, the widening disparity between newbuilding prices and earnings resulting from price increases that prevailed in 2017 and 2018. Secondly, growing uncertainty within the shipping industry as it prepared for the introduction of the global 0.5% sulphur cap on marine fuels. Thirdly, geopolitical instability and fear of a further escalation in the trade dispute between China and USA. Persistent financing challenges and the difficulty to raise equity or obtain long term employment in a world lacking visibility constituted another cause, along with nagging questions concerning the shipping industry’s capability to ever generate profits.
Uncertainty and consolidation in the shipbuilding industry

In consequence, newbuilding orders declined significantly from 93.8 million tons deadweight (1272 ships) in 2018 to 73.2 million tons deadweight (1028 ships) in 2019. Demand for bulkers, container carriers and special ships followed this global downward trend and receded sharply. However, demand for tankers increased substantially thanks to a much better freight market, especially during the second half of the year. It is always interesting to note how quickly the shipping market commits to huge investments that will last a generation, based on a temporary change of sentiment in the freight market.
In spite of lower global demand, newbuilding prices hardly diminished (by about 5%), with yards considering prices to be already depressed enough given increased building costs driven by higher steel prices, new regulations and renewed pressure from marine equipment suppliers that they had to contend with. Prices softened less in the tanker segment and more in the bulker and container carrier segments.
The three Asian shipbuilding giants, representing more than 95% of the global orderbook by deadweight, continued to fight fiercely in a poor market. In 2019, China improved its existing top position with a further increase to 45.4% of market share. In second place, Korea maintained its market share at 28.1%, while Japan’s market share in third place slipped back to 22 %. The "rest of the world" (RoW) and Europe registered a 2.6% and 1.9% share of the global market, respectively.
After having declined in 2018 to 79.2 million deadweight as a result of the reduction in newbuilding orders in 2016 (32.6m dwt), newbuilding deliveries rebounded in 2019 to 97.6 million deadweight, reflecting the dynamism in newbuilding orders seen in 2017 and 2018 (79m dwt and 93.8m dwt). As a consequence of the imbalance between deliveries and newbuilding orders, the global orderbook decreased from 225.7 million deadweight end of 2018 to 201.2 million deadweight end of 2019. Meanwhile, the world fleet has continued to increase uninterrupted since 1993, growing in 2019 from 1,852 million deadweight (37,588 ships) to 1,934 million deadweight (38,449 ships).
If shipowners shifted away from shipbuilders last year, the second-hand market followed the same trend as 2018 in respect of deadweight exchanged, with 146.6 million deadweight in sales in 2019 versus 146.2 million deadweight in 2018. Sales slightly decreased in term of number of ships sold (2,780 vs 2,883) however.
6 7
SHIPBUILDINGKEY POINTS OF 2019
KEY POINTS OF 2019
Orderbook 2018 2019
China
Market share 43.0% 45.4%
Ships 1309 1206
m dwt 97.1 91.4
Korea
Market share 27.8% 28.1%
Ships 460 483
m dwt 62.7 56.6
Japan
Market share 24.2% 22.0%
Ships 741 625
m dwt 54.9 44.1
Europe
Market share 1.6% 1.9%
Ships 288 285
m dwt 3.6 3.9
ROW
Market share 3.3% 2.6%
Ships 226 187
m dwt 7.4 5.2
Summary 2018 2019
OrdersShips 1,272 1,028
m dwt 93.8 73.2
DeliveriesShips 1,151 1,266
m dwt 79.2 97.6
OrderbookShips 3,024 2,786
m dwt 225.7 201.2
Active FleetShips 37,588 38,449
m dwt 1,852.6 1,933.8
Orderbook/Active FleetShips 8.0% 7.2%
m dwt 12.2% 10.4%
Deliveries vs demolitions
Million dwt
Deliveries Fleet EvolutionDemolitions
Fleet evolution
Million dwt
Demolitions
0
20
40
60
80
100
120
140
160
180
Million dwt
Deliveries vs.
-80
-60
-40
-20
2003 2004 2005 2006 2007 2008 2009 2010 2011 2012 2013 2014 2015 2016 2019
800
1,000
1,200
1,400
1,600
1,800
0
200
400
600
-100
200 2,000
Fleet
2017 2018
0
50
100
150
200
250
300
Million dwtOrders
2003 2004 2005 2006 2007 2008 2009 2010 2011 2012 2013 2014 2015 2016 20192017 2018
Million dwt
Orders
Million dwt
Million dwt
Demolitions
0
20
40
60
80
100
120
140
160
180
Million dwt
Deliveries vs.
-80
-60
-40
-20
2003 2004 2005 2006 2007 2008 2009 2010 2011 2012 2013 2014 2015 2016 2019
800
1,000
1,200
1,400
1,600
1,800
0
200
400
600
-100
200 2,000
Fleet
2017 2018
0
50
100
150
200
250
300
Million dwtOrders
2003 2004 2005 2006 2007 2008 2009 2010 2011 2012 2013 2014 2015 2016 20192017 2018
BRS GROUP - Annual review 2020 BRS GROUP - Annual review 2020
SHIPBUILDINGKEY POINTS OF 2019
Containers OthersBulk Tanker
2018 2019
GT Dwt N° Ships GT Dwt N° Ships
Market Sales 93,350,590 146,224,032 2,883 92,295,104 146,626,204 2,780
Demolition Sales 12,044,517 20,914,799 226 3,720,014 5,692,169 96
NB Resales 10,603,026 16,828,220 166 8,833,669 14,344,794 163
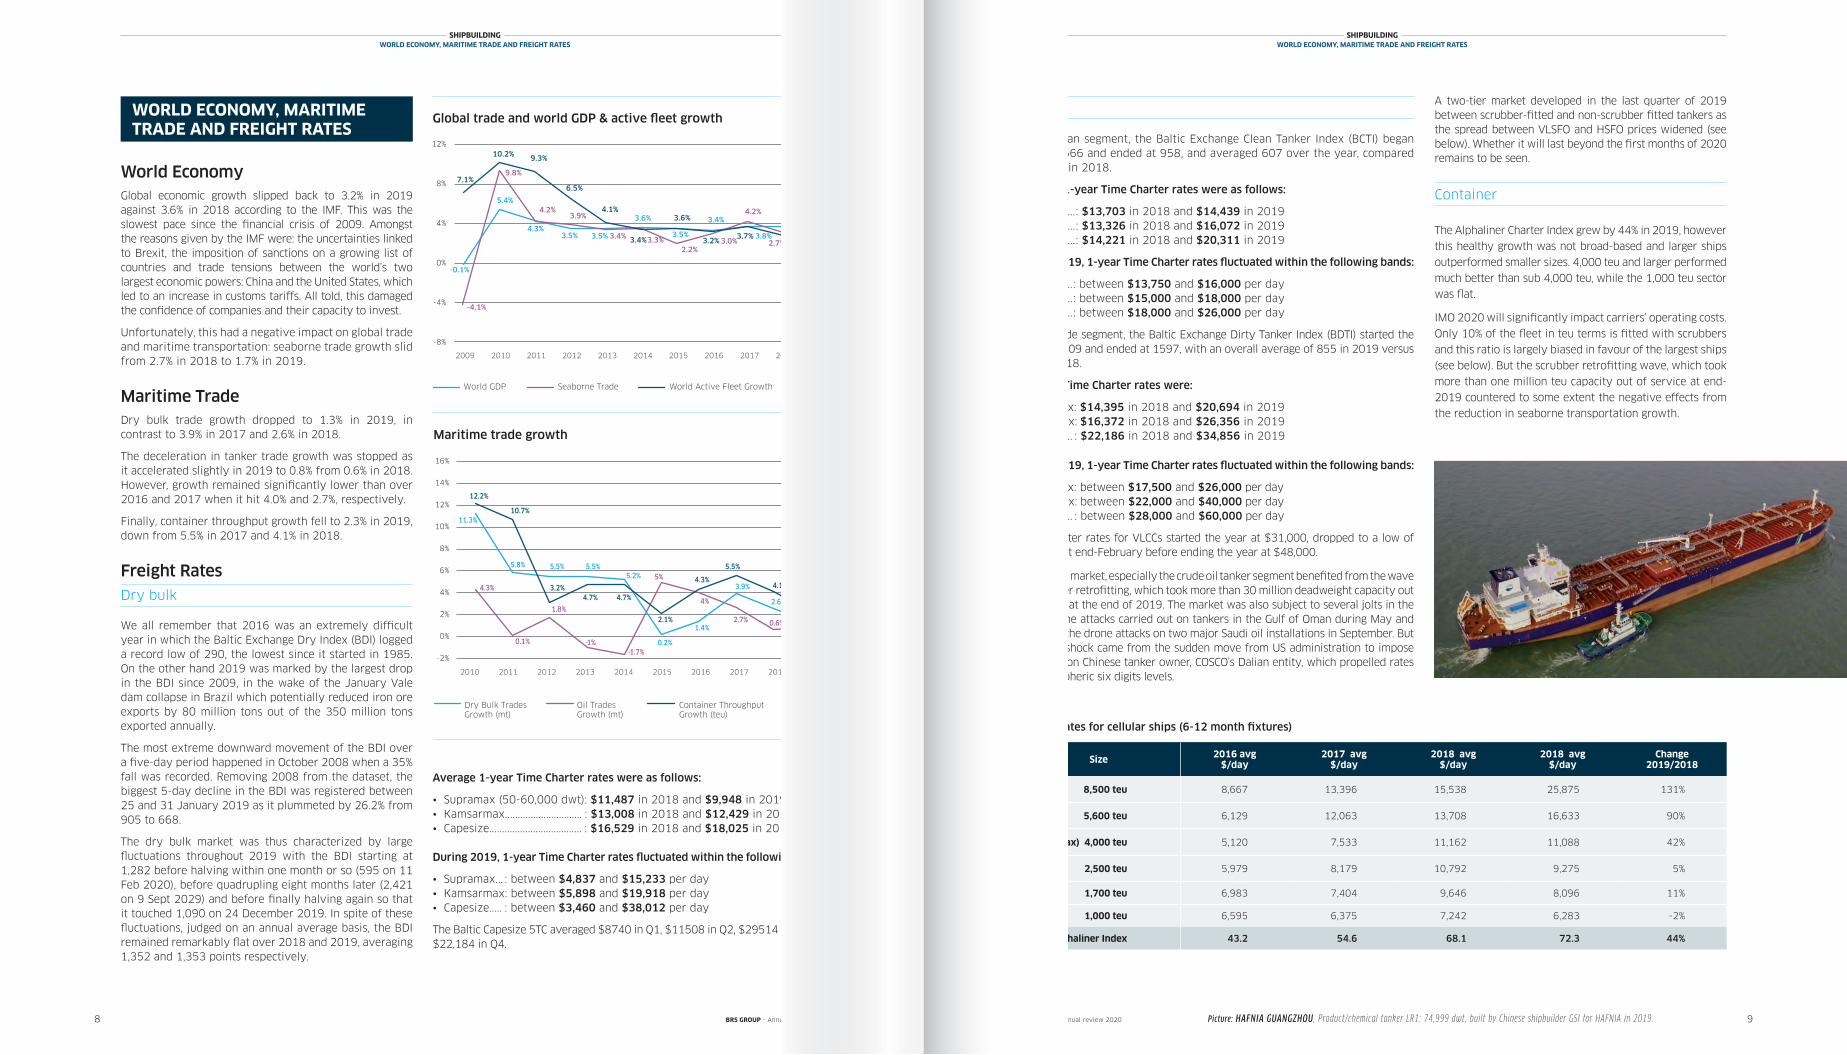
World EconomyGlobal economic growth slipped back to 3.2% in 2019 against 3.6% in 2018 according to the IMF. This was the slowest pace since the financial crisis of 2009. Amongst the reasons given by the IMF were: the uncertainties linked to Brexit, the imposition of sanctions on a growing list of countries and trade tensions between the world’s two largest economic powers: China and the United States, which led to an increase in customs tariffs. All told, this damaged the confidence of companies and their capacity to invest.
Unfortunately, this had a negative impact on global trade and maritime transportation: seaborne trade growth slid from 2.7% in 2018 to 1.7% in 2019.
Maritime TradeDry bulk trade growth dropped to 1.3% in 2019, in contrast to 3.9% in 2017 and 2.6% in 2018.
The deceleration in tanker trade growth was stopped as it accelerated slightly in 2019 to 0.8% from 0.6% in 2018. However, growth remained significantly lower than over 2016 and 2017 when it hit 4.0% and 2.7%, respectively.
Finally, container throughput growth fell to 2.3% in 2019, down from 5.5% in 2017 and 4.1% in 2018.
Freight RatesDry bulk
We all remember that 2016 was an extremely difficult year in which the Baltic Exchange Dry Index (BDI) logged a record low of 290, the lowest since it started in 1985. On the other hand 2019 was marked by the largest drop in the BDI since 2009, in the wake of the January Vale dam collapse in Brazil which potentially reduced iron ore exports by 80 million tons out of the 350 million tons exported annually.
The most extreme downward movement of the BDI over a five-day period happened in October 2008 when a 35% fall was recorded. Removing 2008 from the dataset, the biggest 5-day decline in the BDI was registered between 25 and 31 January 2019 as it plummeted by 26.2% from 905 to 668.
The dry bulk market was thus characterized by large fluctuations throughout 2019 with the BDI starting at 1,282 before halving within one month or so (595 on 11 Feb 2020), before quadrupling eight months later (2,421 on 9 Sept 2029) and before finally halving again so that it touched 1,090 on 24 December 2019. In spite of these fluctuations, judged on an annual average basis, the BDI remained remarkably flat over 2018 and 2019, averaging 1,352 and 1,353 points respectively.
8 9
SHIPBUILDINGWORLD ECONOMY, MARITIME TRADE AND FREIGHT RATES
WORLD ECONOMY, MARITIME TRADE AND FREIGHT RATES
Global trade and world GDP & active fleet growthGlobal Trade and World GDP & Active Fleet Growth
World GDP Seaborne Trade World Active Fleet Growth
-0.1%
5.4%
4.3%3.5% 3.5%
3.6%
3.5%
3.4%
3.8%
3.6%
-4.1%
9.8%
4.2%3.9%
3.4% 3.3%2.2%
3.0%
4.2%
2.7%
7.1%
10.2% 9.3%
6.5%
4.1%
3.4%
3.6%
3.2%3.7%
2.8%
-8%
-4%
0%
4%
8%
12%
2009 2010 2011 2012 2013 2014 2015 2016 2017 2018
3.2%
1.7%
4.4%
2019
0
20
100
Alphaliner Charter Index since 2010
2010 2011 2012 2013 2014 2015 2016 2017
0
50
100
150
200
250
300
Alphaliner Charter Index since 2010
2000 2001 2002 2003 2004 2005 2006 2007 2008 2009 2010 2011 2012 2013 2014 2015 2016 2017
40
60
80
120
2011 2012 2013 2014 2015 2016 20182009 2010
Seaborne Trade World Active Fleet GrowthWorld GDP
Maritime trade growth
Oil TradesGrowth (mt)
Container ThroughputGrowth (teu)
Dry Bulk TradesGrowth (mt)
-2%
0%
2%
4%
6%
8%
10%
12%
14%
16%
Maritime Trade Growth
Dry Bulk Trades Growth (Mt) Oil Trades Growth (Mt) Container Throughput Growth (Teu)
11.3%
5.8% 5.5% 5.5%5.2%
0.2%
1.4%
3.9%
2.6%
1.3%
4.3%
0.1%
1.8%
-1%-1.7%
5%
4%
2.7% 0.6%0.8%
12.2%
10.7%
3.2%4.7% 4.7%
2.1%
4.3%
5.5%
4.1%
2.3%
Tanker
In the clean segment, the Baltic Exchange Clean Tanker Index (BCTI) began 2019 at 666 and ended at 958, and averaged 607 over the year, compared with 579 in 2018.
Average 1-year Time Charter rates were as follows:
• MR2.........: $13,703 in 2018 and $14,439 in 2019• LR1..........: $13,326 in 2018 and $16,072 in 2019• LR1..........: $14,221 in 2018 and $20,311 in 2019
During 2019, 1-year Time Charter rates fluctuated within the following bands:
• MR2........: between $13,750 and $16,000 per day• LR1.........: between $15,000 and $18,000 per day• LR1.........: between $18,000 and $26,000 per day
In the crude segment, the Baltic Exchange Dirty Tanker Index (BDTI) started the year at 1009 and ended at 1597, with an overall average of 855 in 2019 versus 798 in 2018.
Average Time Charter rates were:
• Aframax: $14,395 in 2018 and $20,694 in 2019• Suezmax: $16,372 in 2018 and $26,356 in 2019• VLCC....... : $22,186 in 2018 and $34,856 in 2019
During 2019, 1-year Time Charter rates fluctuated within the following bands:
• Aframax: between $17,500 and $26,000 per day• Suezmax: between $22,000 and $40,000 per day• VLCC....... : between $28,000 and $60,000 per day
Time Charter rates for VLCCs started the year at $31,000, dropped to a low of $28,000 at end-February before ending the year at $48,000.
The tanker market, especially the crude oil tanker segment benefited from the wave of scrubber retrofitting, which took more than 30 million deadweight capacity out of service at the end of 2019. The market was also subject to several jolts in the wake of the attacks carried out on tankers in the Gulf of Oman during May and June and the drone attacks on two major Saudi oil installations in September. But the main shock came from the sudden move from US administration to impose sanctions on Chinese tanker owner, COSCO’s Dalian entity, which propelled rates to stratospheric six digits levels.
A two-tier market developed in the last quarter of 2019 between scrubber-fitted and non-scrubber fitted tankers as the spread between VLSFO and HSFO prices widened (see below). Whether it will last beyond the first months of 2020 remains to be seen.
Container
The Alphaliner Charter Index grew by 44% in 2019, however
this healthy growth was not broad-based and larger ships
outperformed smaller sizes. 4,000 teu and larger performed
much better than sub 4,000 teu, while the 1,000 teu sector
was flat.
IMO 2020 will significantly impact carriers’ operating costs.
Only 10% of the fleet in teu terms is fitted with scrubbers
and this ratio is largely biased in favour of the largest ships
(see below). But the scrubber retrofitting wave, which took
more than one million teu capacity out of service at end-
2019 countered to some extent the negative effects from
the reduction in seaborne transportation growth.
Average 1-year Time Charter rates were as follows:
• Supramax (50-60,000 dwt): $11,487 in 2018 and $9,948 in 2019• Kamsarmax.............................. : $13,008 in 2018 and $12,429 in 2019 • Capesize.................................... : $16,529 in 2018 and $18,025 in 2019
During 2019, 1-year Time Charter rates fluctuated within the following bands:
• Supramax... : between $4,837 and $15,233 per day• Kamsarmax: between $5,898 and $19,918 per day• Capesize..... : between $3,460 and $38,012 per day
The Baltic Capesize 5TC averaged $8740 in Q1, $11508 in Q2, $29514 in Q3, and $22,184 in Q4.
SHIPBUILDINGWORLD ECONOMY, MARITIME TRADE AND FREIGHT RATES
Size 2016 avg$/day
2017 avg$/day
2018 avg $/day
2018 avg $/day
Change2019/2018
8,500 teu 8,667 13,396 15,538 25,875 131%
5,600 teu 6,129 12,063 13,708 16,633 90%
(Panamax) 4,000 teu 5,120 7,533 11,162 11,088 42%
2,500 teu 5,979 8,179 10,792 9,275 5%
1,700 teu 6,983 7,404 9,646 8,096 11%
1,000 teu 6,595 6,375 7,242 6,283 -2%
Alphaliner Index 43.2 54.6 68.1 72.3 44%
Charter rates for cellular ships (6-12 month fixtures)
2017
BRS GROUP - Annual review 2020 BRS GROUP - Annual review 2020
2019
2011 2012 2013 2014 2015 2016 20182010 2017 2019
Picture: HAFNIA GUANGZHOU , Product/chemical tanker LR1: 74,999 dwt, built by Chinese shipbuilder GSI for HAFNIA in 2019.

1110 11
SHIPBUILDINGORDERS AND ORDERBOOKS
SHIPBUILDINGORDERS AND ORDERBOOKS
-
5
10
15
20
25
30
VLCC Suezmax Aframax / LR2 Panamax / LR1 MR Handy Capesize Panamax Supramax Handysize Containership
Million dwt
New Orders for Standard Vessels per Year
2017 2018 2019
0
20
40
60
80
100
120
Chemical carriers stainlesssteel
LPG carriers LNG carriers Ferries & Ro-pax Ro-ro Car carriers Cruise vessels
no.ships
New Orders for Specialised Vessels per Year
2017 2018 2019
39
38 56
1
75
65
80
66 107
36
91
24
43
58
37
16
7
27
VLCC Suezmax Aframax/LR2 Panamax/LR1 MR Handy Capesize Panamax Supramax Handysize Containership
New orders for standard vessels per yearMillion dwt
Orders and orderbooks for standard vesselsNewbuilding orders decreased by 22% in 2019 to reach 72 million deadweight. 2019 figure is the third lowest over the last 10 years and well below the average of 90.2 million deadweight posted over the same period. While orders for bulkers and container carriers decreased last year by a half and a third respectively, those for tankers increased by about a fifth.
Tanker Summary 2018 2019
Orders m dwt 24.4 29.9
Deliveries m dwt 29.3 38.6
Orderbook m dwt 68.3 59.7
Active Fleet m dwt 575.3 608.6
Orderbook/Active Fleet 11.9% 9.9%
Chinam dwt 16.9 18.7
Market share 24.7% 31.3%
Koream dwt 34.2 27.3
Market share 50.1% 45.7%
Japanm dwt 12.9 10.5
Market share 18.9% 17.6%
Container Summary 2018 2019
Orders m dwt 13.9 9.0
Deliveries m dwt 14.2 11.2
Orderbook m dwt 29.7 27.5
Active Fleet m dwt 266.5 275.0
Orderbook/Active Fleet 11.1% 10.0%
Chinam dwt 11 10.2
Market share 37.0% 37.1%
Koream dwt 12.3 12
Market share 41.4% 43.6%
Japanm dwt 5.6 4.6
Market share 18.8% 16.7%
Tanker deliveries rebounded from 29.3 million deadweight in 2018 to 38.6 million deadweight in 2019. The active tanker fleet grew from 575.3 million deadweight at the end of 2018 to 608.6 million deadweight at the close of 2019. The tanker orderbook represented about 9.9% of the active tanker fleet at year-end, distributed as follows:
• MR1: orderbook 0.2m dwt; fleet 19.6m dwt; ratio 0.6%
• MR2: orderbook 7.7m dwt; fleet 78.2m dwt; ratio 4.7%
• Panamax and LR1: orderbook 1.1m dwt; fleet 33.3m dwt; ratio 1.9%
• Aframax and LR2: orderbook 11.2m dwt; fleet 113m dwt; ratio 4.8%
• Suezmax and LR3: orderbook 11.7m dwt; fleet 93.5m dwt; ratio 3.5%
• VLCC: orderbook 23.9m dwt; fleet 242m dwt; ratio 9%
Korea continued to dominate the segment but conceded market share which dropped from 50.1% in 2018 to 45.7% in 2019. China saw its market share rise from 24.7% in 2018 to 31.3% in 2019 while Japan succeeded in maintaining its market share at 17.6%.
Containerships orders dropped in 2019, following two years of recovery, from 13.9 million deadweight in 2018 to 9 million deadweight, a figure also well below the 2010-19 average of 12.4 million deadweight.
2017 was marked by groundbreaking orders of Very Large Containerships (VLCS) of 23,500 teu (400m length overall and 61m beam) by MSC, CMA CGM and Imabari Zosen (total 22). These were then followed in 2018 by Hyundai Merchant Marine which ordered 12 containerships of 23,000 teu. In 2019 Evergreen ordered 10 ships of about 23,750 teu and MSC 5 ships of about 23,650 teu. But the focus of the year was more on the segments between 13,300 and 18,000 teu, 11,000 and 12,500 teu and 1,000 and 3,000 teu. It is interesting to note that there is basically no newbuilding activity between 4,000 and 10,000 teu.
In contrast to the bulker and tanker segments, container carrier deliveries declined in 2019 to 11.2 million deadweight from 14.2 million deadweight in 2018. The active container carrier fleet grew from 266 million deadweight at end-2018 to 275 million deadweight at end-2019. The orderbook represented about 9.9% of the active fleet at year end.
In 2019, Korea succeeded in raising its market share to 43.4% from 41.2% in 2018. This was to the detriment of Japan, whose market share fell from 19.2% to 17.7%. China consolidated its share at 37.1%.
New orders per year (2010-2019)
Bulker orders were halved from 46.4 million deadweight in 2018 to 24.6 million deadweight in 2019, a level well below the 2010-19 average of 44.5 million deadweight.
All bulker sizes were affected by this downward trend except for the over-panamax segment (85,000 to 100,000 dwt) which saw more newbuilding activity in 2019.
A total of 41.1 million deadweight was delivered in 2019 versus 28.2 million deadweight in 2018. The chiseling effect of less orders and more deliveries meant the dry bulk orderbook dropped to 92.1 million deadweight from 108.7 million deadweight whereas the dry bulk active fleet continued to grow from 835 million deadweight to 868 million deadweight.
Tonnage on order represented 10.6% of the active bulker fleet at end 2019, broken down as follows::
• Handysize and Handymax: orderbook 6.1m dwt; fleet 122.1m dwt; ratio 5.0%
• Supramax and Ultramax: orderbook 15.0m dwt; fleet 175.5m dwt; ratio 8.6%
• Panamax and Kamsarmax: orderbook 18.5m dwt; fleet 176.2m dwt; ratio 10.5%
• Post-Panamax and Babycape: orderbook 5.6m dwt; fleet 56.5m dwt; ratio 11.6%
• Capesize and Newcastlemax: orderbook 31.5m dwt; fleet 255.4m dwt; ratio 12.4%
• VLOC: orderbook 14.5m dwt; fleet 77.8m dwt; ratio 18.7%
Chinese shipbuilders once more consolidated their share of the dry bulk market at 63.1% in 2019, while Japan’s market share was maintained at 29.8% and Korea’s decreased to 4.0%.
Tanker orders increased in 2019 to 29.9 million deadweight (24.4m dwt in 2018) a figure above the average of the last ten years (26.3m).
This was notably the case for suezmaxes, where contracted volumes doubled and for the aframax/LR2 segment where contracted volumes almost tripled.
Bulk Summary 2018 2019
Orders m dwt 46.4 24.6
Deliveries m dwt 28.2 41.1
Orderbook m dwt 108.7 92.1
Active Fleet m dwt 834.5 867.8
Orderbook/Active Fleet 13.0% 10.6%
Chinam dwt 65.7 58.1
Market share 60.5% 63.1%
Koream dwt 5.3 3.7
Market share 4.9% 4.0%
Japanm dwt 33.9 27.5
Market share 31.2% 29.8%
ORDERS AND ORDERBOOKS
2017 2018 2019
m dwt 2010 2011 2012 2013 2014 2015 2016 2017 2018 2019
Tanker 88.6 39.8 24.0 75.7 57.4 34.9 16.6 37.1 46.4 24.6
Bulk 29.6 8.6 13.2 33.6 32.6 50.9 11.4 29.9 24.4 29.9
Container 7.3 21.0 3.5 22.9 12.6 22.9 3.1 8.6 13.9 9.0
Other ships 4.4 6.7 6.0 8.9 12.3 7.1 1.7 3.8 9.0 9.7
Total 129.9 76.1 46.7 141.1 114.8 115.6 32.8 79.0 93.8 73.2
Existing
Size range teu ships teu
18,000-24,763 115 2,311,701
13,300-17,999 212 3,092,691
12,500-13,299 82 1,069,278
10,000-12,499 154 1,645,412
7,500-9,999 486 4,281,666
5,100-7,499 448 2,785,467
4,000-5,099 635 2,871,233
3,000-3,999 249 863,649
2,000-2,999 665 1,698,380
1,500-1,999 570 984,966
1,000-1,499 704 817,526
500-999 670 500,864
100-499 195 65,873
Total 5,185 22,988,706
Orderbook O / E
ships teu %
37 863,652 37.4%
48 713,412 23.1%
5 63,450 5.9%
38 452,050 27.5%
0 0 0.0%
0 0 0.0%
2 8,038 0.3%
10 30,488 3.5%
114 284,237 16.7%
54 96,533 9.8%
51 57,443 7.0%
4 2,489 0.5%
5 896 1.4%
368 2,572,688 11.2%
Orders in 2019
ships teu
15 355,888
22 331,500
- -
8 94,800
- -
- -
- -
- -
23 55,358
13 23 496
20 21,736
- -
1 300
102 883,078
BRS GROUP - Annual review 2020 BRS GROUP - Annual review 2020
Picture: TUKUMA ARTICA , Container carrier, ice class +1A Polar code, 2,150 teu. Built and delivered in January 2020 by Chinese shipbuilder GWS to Royal Artic Line. Designed by Deltamarin. Photo: Royal Artic Line.
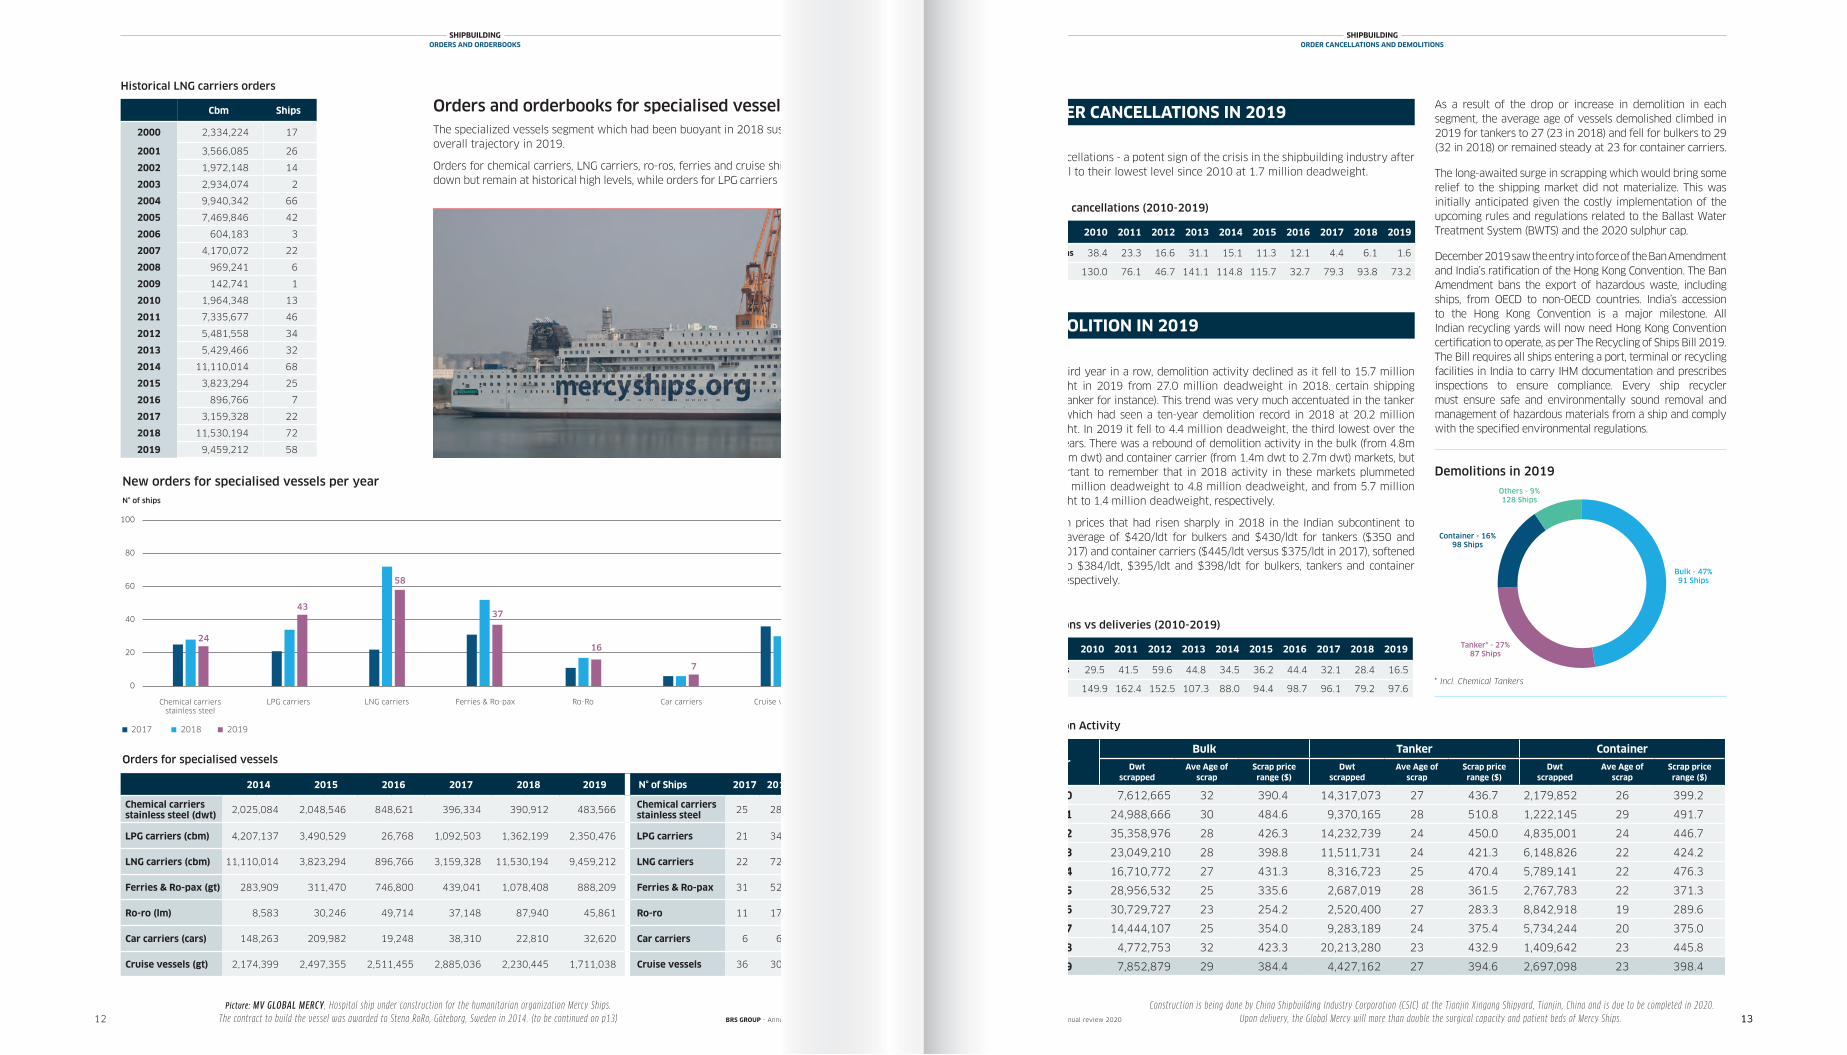
Cbm Ships
2000 2,334,224 17
2001 3,566,085 26
2002 1,972,148 14
2003 2,934,074 2
2004 9,940,342 66
2005 7,469,846 42
2006 604,183 3
2007 4,170,072 22
2008 969,241 6
2009 142,741 1
2010 1,964,348 13
2011 7,335,677 46
2012 5,481,558 34
2013 5,429,466 32
2014 11,110,014 68
2015 3,823,294 25
2016 896,766 7
2017 3,159,328 22
2018 11,530,194 72
2019 9,459,212 58
1312 13
SHIPBUILDINGORDERS AND ORDERBOOKS
Order cancellations - a potent sign of the crisis in the shipbuilding industry after 2008 - fell to their lowest level since 2010 at 1.7 million deadweight.
ORDER CANCELLATIONS IN 2019
m dwt 2010 2011 2012 2013 2014 2015 2016 2017 2018 2019
Cancellations 38.4 23.3 16.6 31.1 15.1 11.3 12.1 4.4 6.1 1.6
Orders 130.0 76.1 46.7 141.1 114.8 115.7 32.7 79.3 93.8 73.2
Orders for specialised vessels
New orders for specialised vessels per yearN° of ships
Chemical carriersstainless steel
LPG carriers LNG carriers Ferries & Ro-pax Ro-Ro Car carriers Cruise vessels
2017 2018 2019
-
5
10
15
20
25
30
VLCC Suezmax Aframax / LR2 Panamax / LR1 MR Handy Capesize Panamax Supramax Handysize Containership
Million dwt
New Orders for Standard Vessels per Year
2017 2018 2019
0
20
40
60
80
100
120
Chemical carriers stainlesssteel
LPG carriers LNG carriers Ferries & Ro-pax Ro-ro Car carriers Cruise vessels
no.ships
New Orders for Specialised Vessels per Year
2017 2018 2019
39
38 56
1
75
65
80
66 107
36
91
24
43
58
37
16
7
27
2014 2015 2016 2017 2018 2019 N° of Ships 2017 2018 2019
Chemical carriers stainless steel (dwt) 2,025,084 2,048,546 848,621 396,334 390,912 483,566 Chemical carriers
stainless steel 25 28 24
LPG carriers (cbm) 4,207,137 3,490,529 26,768 1,092,503 1,362,199 2,350,476 LPG carriers 21 34 43
LNG carriers (cbm) 11,110,014 3,823,294 896,766 3,159,328 11,530,194 9,459,212 LNG carriers 22 72 58
Ferries & Ro-pax (gt) 283,909 311,470 746,800 439,041 1,078,408 888,209 Ferries & Ro-pax 31 52 37
Ro-ro (lm) 8,583 30,246 49,714 37,148 87,940 45,861 Ro-ro 11 17 16
Car carriers (cars) 148,263 209,982 19,248 38,310 22,810 32,620 Car carriers 6 6 7
Cruise vessels (gt) 2,174,399 2,497,355 2,511,455 2,885,036 2,230,445 1,711,038 Cruise vessels 36 30 27
Orders vs cancellations (2010-2019)
Historical LNG carriers orders
SHIPBUILDINGORDER CANCELLATIONS AND DEMOLITIONS
For the third year in a row, demolition activity declined as it fell to 15.7 million deadweight in 2019 from 27.0 million deadweight in 2018. certain shipping markets (tanker for instance). This trend was very much accentuated in the tanker segment which had seen a ten-year demolition record in 2018 at 20.2 million deadweight. In 2019 it fell to 4.4 million deadweight, the third lowest over the last ten years. There was a rebound of demolition activity in the bulk (from 4.8m dwt to 7.9m dwt) and container carrier (from 1.4m dwt to 2.7m dwt) markets, but it is important to remember that in 2018 activity in these markets plummeted from 14.4 million deadweight to 4.8 million deadweight, and from 5.7 million deadweight to 1.4 million deadweight, respectively.
Demolition prices that had risen sharply in 2018 in the Indian subcontinent to reach an average of $420/ldt for bulkers and $430/ldt for tankers ($350 and $375 in 2017) and container carriers ($445/ldt versus $375/ldt in 2017), softened in 2019 to $384/ldt, $395/ldt and $398/ldt for bulkers, tankers and container carriers, respectively.
DEMOLITION IN 2019
m dwt 2010 2011 2012 2013 2014 2015 2016 2017 2018 2019
Demolitions 29.5 41.5 59.6 44.8 34.5 36.2 44.4 32.1 28.4 16.5
Deliveries 149.9 162.4 152.5 107.3 88.0 94.4 98.7 96.1 79.2 97.6
Demolitions vs deliveries (2010-2019)
YearBulk Tanker Container
Dwtscrapped
Ave Age of scrap
Scrap price range ($)
Dwtscrapped
Ave Age of scrap
Scrap price range ($)
Dwtscrapped
Ave Age of scrap
Scrap price range ($)
2010 7,612,665 32 390.4 14,317,073 27 436.7 2,179,852 26 399.2
2011 24,988,666 30 484.6 9,370,165 28 510.8 1,222,145 29 491.7
2012 35,358,976 28 426.3 14,232,739 24 450.0 4,835,001 24 446.7
2013 23,049,210 28 398.8 11,511,731 24 421.3 6,148,826 22 424.2
2014 16,710,772 27 431.3 8,316,723 25 470.4 5,789,141 22 476.3
2015 28,956,532 25 335.6 2,687,019 28 361.5 2,767,783 22 371.3
2016 30,729,727 23 254.2 2,520,400 27 283.3 8,842,918 19 289.6
2017 14,444,107 25 354.0 9,283,189 24 375.4 5,734,244 20 375.0
2018 4,772,753 32 423.3 20,213,280 23 432.9 1,409,642 23 445.8
2019 7,852,879 29 384.4 4,427,162 27 394.6 2,697,098 23 398.4
Orders and orderbooks for specialised vesselsThe specialized vessels segment which had been buoyant in 2018 sustained its overall trajectory in 2019.
Orders for chemical carriers, LNG carriers, ro-ros, ferries and cruise ships cooled down but remain at historical high levels, while orders for LPG carriers increased.
Demolitions in 2019
Tanker* - 27% 87 Ships
Container - 16% 98 Ships
Others - 9% 128 Ships
Bulk - 47% 91 Ships
* Incl. Chemical Tankers
Picture: MV GLOBAL MERCY , Hospital ship under construction for the humanitarian organization Mercy Ships.The contract to build the vessel was awarded to Stena RoRo, Göteborg, Sweden in 2014. (to be continued on p13)
Demolition Activity
BRS GROUP - Annual review 2020 BRS GROUP - Annual review 2020
As a result of the drop or increase in demolition in each segment, the average age of vessels demolished climbed in 2019 for tankers to 27 (23 in 2018) and fell for bulkers to 29 (32 in 2018) or remained steady at 23 for container carriers.
The long-awaited surge in scrapping which would bring some relief to the shipping market did not materialize. This was initially anticipated given the costly implementation of the upcoming rules and regulations related to the Ballast Water Treatment System (BWTS) and the 2020 sulphur cap.
December 2019 saw the entry into force of the Ban Amendment and India’s ratification of the Hong Kong Convention. The Ban Amendment bans the export of hazardous waste, including ships, from OECD to non-OECD countries. India’s accession to the Hong Kong Convention is a major milestone. All Indian recycling yards will now need Hong Kong Convention certification to operate, as per The Recycling of Ships Bill 2019. The Bill requires all ships entering a port, terminal or recycling facilities in India to carry IHM documentation and prescribes inspections to ensure compliance. Every ship recycler must ensure safe and environmentally sound removal and management of hazardous materials from a ship and comply with the specified environmental regulations.
Construction is being done by China Shipbuilding Industry Corporation (CSIC) at the Tianjin Xingang Shipyard, Tianjin, China and is due to be completed in 2020. Upon delivery, the Global Mercy will more than double the surgical capacity and patient beds of Mercy Ships.

2000 2001 2002 2003 2004 2005 2006 2007 2008 2009 2010 2011 2012 2013 2014 2015 2016 2017
Active building facilities per year & region (excluding offshore)Million dwt
South Korea N° of facilities
Million dwt
0rders
2000 2001 2002 2003 2004 2005 2006 2007 2008 2009 2010 2011 2012 2013 2014 2015 2016 2017 2018
0
50
100
150
200
250
300
Bulk Tanker Container Others
When orders exceed deliveries, NB prices start to rise
When deliveries exceed orders, NB prices start to fall
NB prices rise again
-
100
200
300
400
500
600
700
800
N° of facilitiesMillion dwt
Historical Building Facilities per year & main areas (Excluding offshore)
CHINA JAPAN SOUTH KOREA EUROPE ROW N° of World Active Shipyards
-
50
100
150
200
250
300
350
2000 2001 2002 2003 2004 2005 2006 2007 2008 2009 2010 2011 2012 2013 2014 2015 2016 2017 2018
270
684
281
Deliveries
N° of facilities
Japan Europe ROWChina
1514 15
SHIPBUILDINGSHIPBUILDING CAPACITY
SHIPBUILDINGDELIVERIES AND WORLDWIDE SHIPBUILDING CAPACITY IN 2017
Picture: HOLLANDIA SEAWAYS , delivered by Chinese shipbuilder Jinling to DFDS on 10 October 2019. Loa 237.4 m – Beam 34 m – 6700 lm or 450 trailers.3rd roro built and delivered by the yard for DFDS.
In South Korea, annual production which more than doubled between 2006 and 2011 from 25.0 million deadweight to 53.4 million deadweight rebounded to 32.4 million deadweight after having fallen quite significantly from 30.8 million deadweight in 2017 to 19.0 million deadweight in 2018.
In Japan, annual output which increased by 10% between 2006 and 2011 from 28.9 to 31.9 million deadweight bounced back from 20.1 million deadweight in 2018 to 24.5 million deadweight in 2019.
It is notable that the number of active building facilities (yards that either won new contracts and/or delivered tonnage during a given year) dropped from 330 in 2018 to 281 in 2019, significantly lower than its peak of 684 in 2007.
Ship deliveries in China, Korea & Japan (2009-2019)
Following stronger demand in 2018, shipbuilders had succeeded in raising newbuilding prices by some 10% across the board. However, in 2019 lower demand put newbuilding prices under pressure again. This was less apparent in the tanker segment where prices remained almost stable but more pronounced in the bulker and container carrier segments where discounts of about 5% could be seen. It was very difficult for yards to reduce prices further to attract new contracts as their building costs were also on the rise, with changes in regulations, the supply and installation of BWTS, Tier III requirements and scrubber ready or LNG ready notations all needing to be costed for and coped with.
NEWBUILDING PRICES IN 2019
2018
Daily exchange rates with $Million $
2014 2015 2016 2017 20182014 2015 2016 2017 2018 2019
Daily Exchange rates with US$
100 Yen 1000 Won 10 Yuan 1 EUR
1,111.8
109.7
0.87
6.87
1,154.1
108.6
0.89
6.96
0.50
0.60
0.70
0.80
0.90
1.00
1.10
1.20
1.30
1.40
1,000 Won
BRS GROUP - Annual review 2020 BRS GROUP - Annual review 2020
The only solace for shipbuilders came from a stronger US dollar, which saw Chinese and Korean currencies respectively go from 6.87 Yuan/$ and 1,112 Won/$ at the beginning of the year to 6.96 Yuan/$ and 1,154 Won/$ by the end of the year.
Prices in the second-hand market followed a similar pattern as the charter markets. Tanker prices increased by double digit rates during the year with a low at the beginning of 2019 and a high at the end of the year, whereas bulker prices (except for the panamax segment) went down through the year to end up by a few percent below the levels experienced at the beginning of the year.
Sharp reduction in the number of active building facilities from a peak of 684 in 2007. Down to 281 in 2019
2019
10 Yuan100 Yen 1 Eur
2019
Total deliveries increased to 97.6 million deadweight in 2019, compared with 79.2 million deadweight in 2018. This was divided into 41.1 million deadweight of bulk carriers (28.2m dwt in 2018), 38.6 million deadweight of tankers (29.3m dwt in 2018) and 11.2 million deadweight of containerships (14.2m dwt in 2018).
In China, annual shipbuilding production which increased by about 440% between 2006 and 2011 from 12.7 million deadweight to 69.0 million deadweight inched up from 34.7 million deadweight in 2018 to 36.2 million deadweight in 2019.
DELIVERIES AND WORLDWIDE SHIPBUILDING CAPACITY IN 2019
Deliveries (million dwt) 2009 2013 2014 2015 2016 2017 2018 2019
China 36.4 43.1 35.6 37.9 35.8 38.4 34.7 36.2
South Korea 43.0 33.4 24.5 29.2 35.9 30.8 19.0 32.4
Japan 29.2 25.0 22.4 21.1 21.6 20.2 20.1 24.5
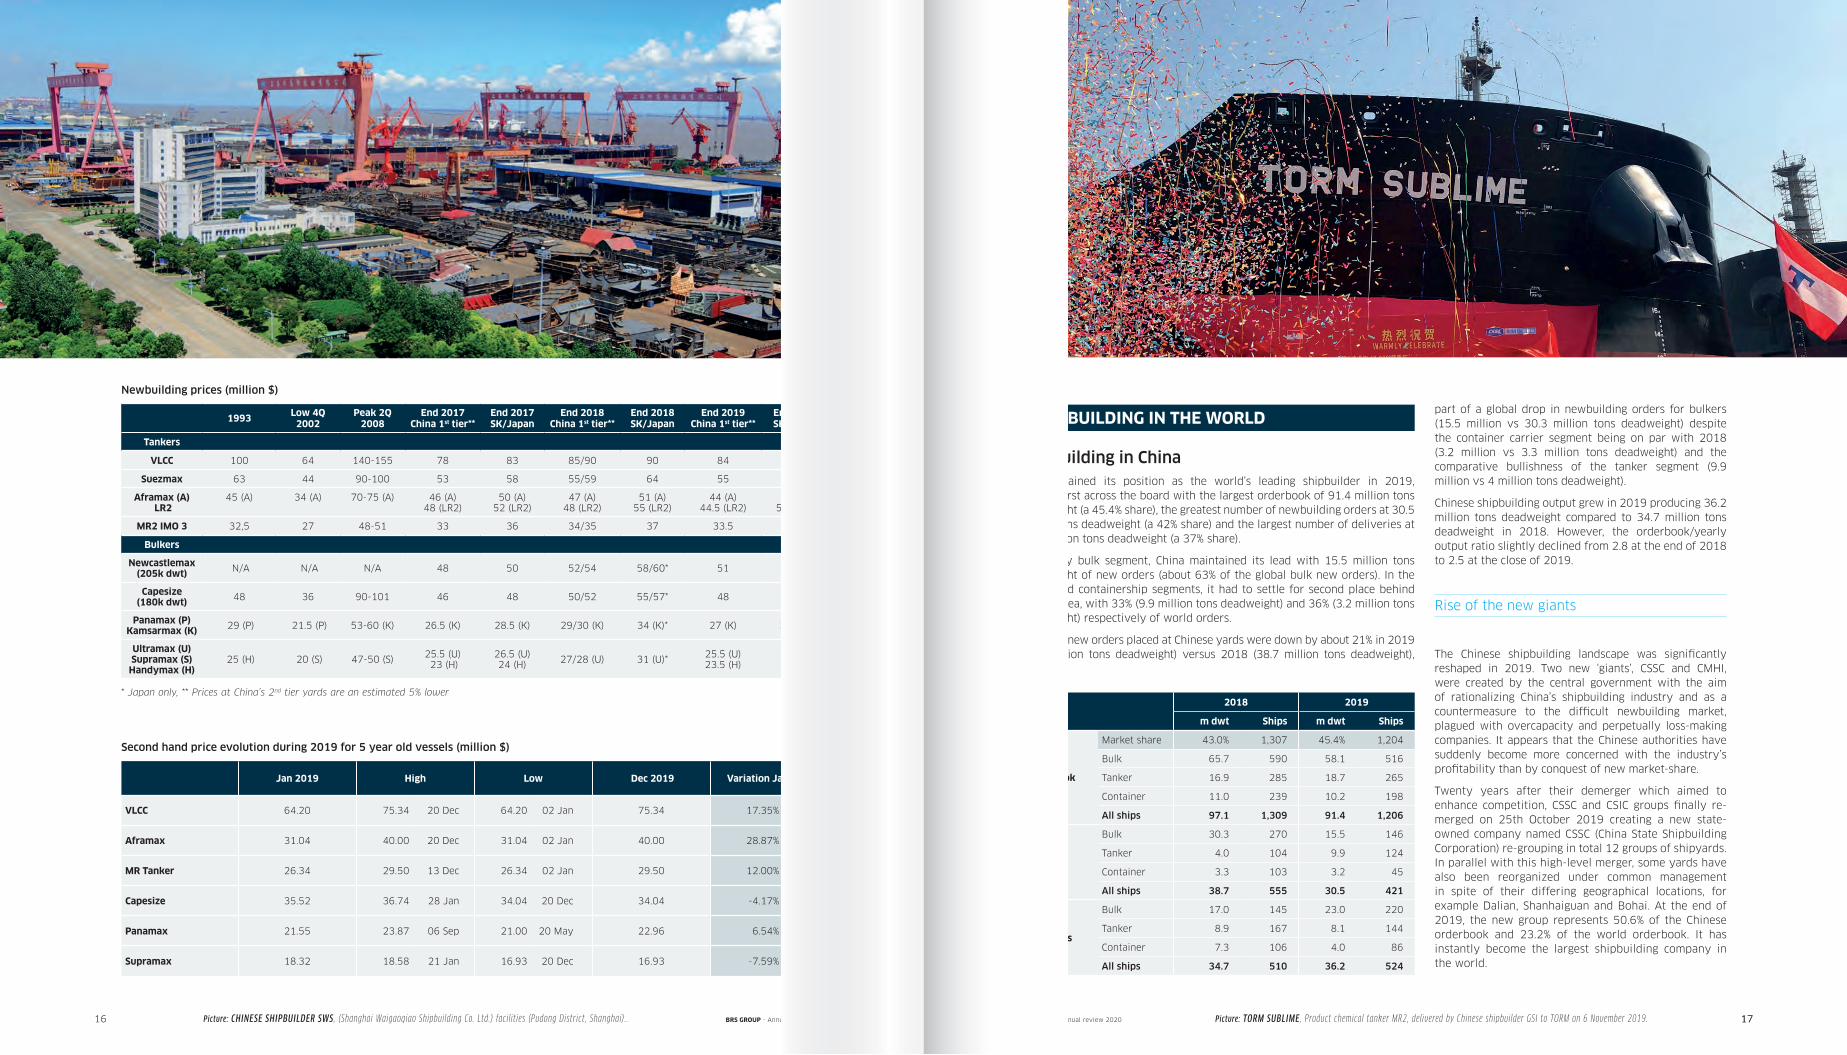
Shipbuilding in ChinaChina retained its position as the world’s leading shipbuilder in 2019, ranking first across the board with the largest orderbook of 91.4 million tons deadweight (a 45.4% share), the greatest number of newbuilding orders at 30.5 million tons deadweight (a 42% share) and the largest number of deliveries at 36.2 million tons deadweight (a 37% share).
In the dry bulk segment, China maintained its lead with 15.5 million tons deadweight of new orders (about 63% of the global bulk new orders). In the tanker and containership segments, it had to settle for second place behind South Korea, with 33% (9.9 million tons deadweight) and 36% (3.2 million tons deadweight) respectively of world orders.
However, new orders placed at Chinese yards were down by about 21% in 2019 (30.5 million tons deadweight) versus 2018 (38.7 million tons deadweight),
1716 17
SHIPBUILDINGNEWBUILDING PRICES IN 2019
SHIPBUILDING IN THE WORLD
China2018 2019
m dwt Ships m dwt Ships
Orderbook
Market share 43.0% 1,307 45.4% 1,204
Bulk 65.7 590 58.1 516
Tanker 16.9 285 18.7 265
Container 11.0 239 10.2 198
All ships 97.1 1,309 91.4 1,206
Orders
Bulk 30.3 270 15.5 146
Tanker 4.0 104 9.9 124
Container 3.3 103 3.2 45
All ships 38.7 555 30.5 421
Deliveries
Bulk 17.0 145 23.0 220
Tanker 8.9 167 8.1 144
Container 7.3 106 4.0 86
All ships 34.7 510 36.2 524
part of a global drop in newbuilding orders for bulkers (15.5 million vs 30.3 million tons deadweight) despite the container carrier segment being on par with 2018 (3.2 million vs 3.3 million tons deadweight) and the comparative bullishness of the tanker segment (9.9 million vs 4 million tons deadweight).
Chinese shipbuilding output grew in 2019 producing 36.2 million tons deadweight compared to 34.7 million tons deadweight in 2018. However, the orderbook/yearly output ratio slightly declined from 2.8 at the end of 2018 to 2.5 at the close of 2019.
Picture: TORM SUBLIME , Product chemical tanker MR2, delivered by Chinese shipbuilder GSI to TORM on 6 November 2019.Picture: CHINESE SHIPBUILDER SWS , (Shanghai Waigaoqiao Shipbuilding Co. Ltd.) facilities (Pudong District, Shanghai)..
1993Low 4Q
2002Peak 2Q
2008End 2017
China 1st tier**End 2017SK/Japan
End 2018China 1st tier**
End 2018SK/Japan
End 2019China 1st tier**
End 2019SK/Japan
Tankers
VLCC 100 64 140-155 78 83 85/90 90 84 90/95
Suezmax 63 44 90-100 53 58 55/59 64 55 63/65
Aframax (A) LR2
45 (A) 34 (A) 70-75 (A) 46 (A)48 (LR2)
50 (A)52 (LR2)
47 (A)48 (LR2)
51 (A)55 (LR2)
44 (A)44.5 (LR2)
53 (A)55 (LR2)
MR2 IMO 3 32,5 27 48-51 33 36 34/35 37 33.5 36
Bulkers
Newcastlemax (205k dwt) N/A N/A N/A 48 50 52/54 58/60* 51 63*
Capesize (180k dwt) 48 36 90-101 46 48 50/52 55/57* 48 60*
Panamax (P) Kamsarmax (K) 29 (P) 21.5 (P) 53-60 (K) 26.5 (K) 28.5 (K) 29/30 (K) 34 (K)* 27 (K) 35 (K)*
Ultramax (U) Supramax (S)
Handymax (H) 25 (H) 20 (S) 47-50 (S) 25.5 (U)
23 (H)26.5 (U)24 (H) 27/28 (U) 31 (U)* 25.5 (U)
23.5 (H)32 (U) 26 (H)
Newbuilding prices (million $)
* Japan only, ** Prices at China’s 2nd tier yards are an estimated 5% lower
Jan 2019 High Low Dec 2019 Variation Jan- Dec
VLCC 64.20 75.34 20 Dec 64.20 02 Jan 75.34 17.35%
Aframax 31.04 40.00 20 Dec 31.04 02 Jan 40.00 28.87%
MR Tanker 26.34 29.50 13 Dec 26.34 02 Jan 29.50 12.00%
Capesize 35.52 36.74 28 Jan 34.04 20 Dec 34.04 -4.17%
Panamax 21.55 23.87 06 Sep 21.00 20 May 22.96 6.54%
Supramax 18.32 18.58 21 Jan 16.93 20 Dec 16.93 -7.59%
Second hand price evolution during 2019 for 5 year old vessels (million $)
BRS GROUP - Annual review 2020 BRS GROUP - Annual review 2020
Rise of the new giants
The Chinese shipbuilding landscape was significantly reshaped in 2019. Two new ‘giants’, CSSC and CMHI, were created by the central government with the aim of rationalizing China’s shipbuilding industry and as a countermeasure to the difficult newbuilding market, plagued with overcapacity and perpetually loss-making companies. It appears that the Chinese authorities have suddenly become more concerned with the industry’s profitability than by conquest of new market-share.
Twenty years after their demerger which aimed to enhance competition, CSSC and CSIC groups finally re-merged on 25th October 2019 creating a new state-owned company named CSSC (China State Shipbuilding Corporation) re-grouping in total 12 groups of shipyards. In parallel with this high-level merger, some yards have also been reorganized under common management in spite of their differing geographical locations, for example Dalian, Shanhaiguan and Bohai. At the end of 2019, the new group represents 50.6% of the Chinese orderbook and 23.2% of the world orderbook. It has instantly become the largest shipbuilding company in the world.
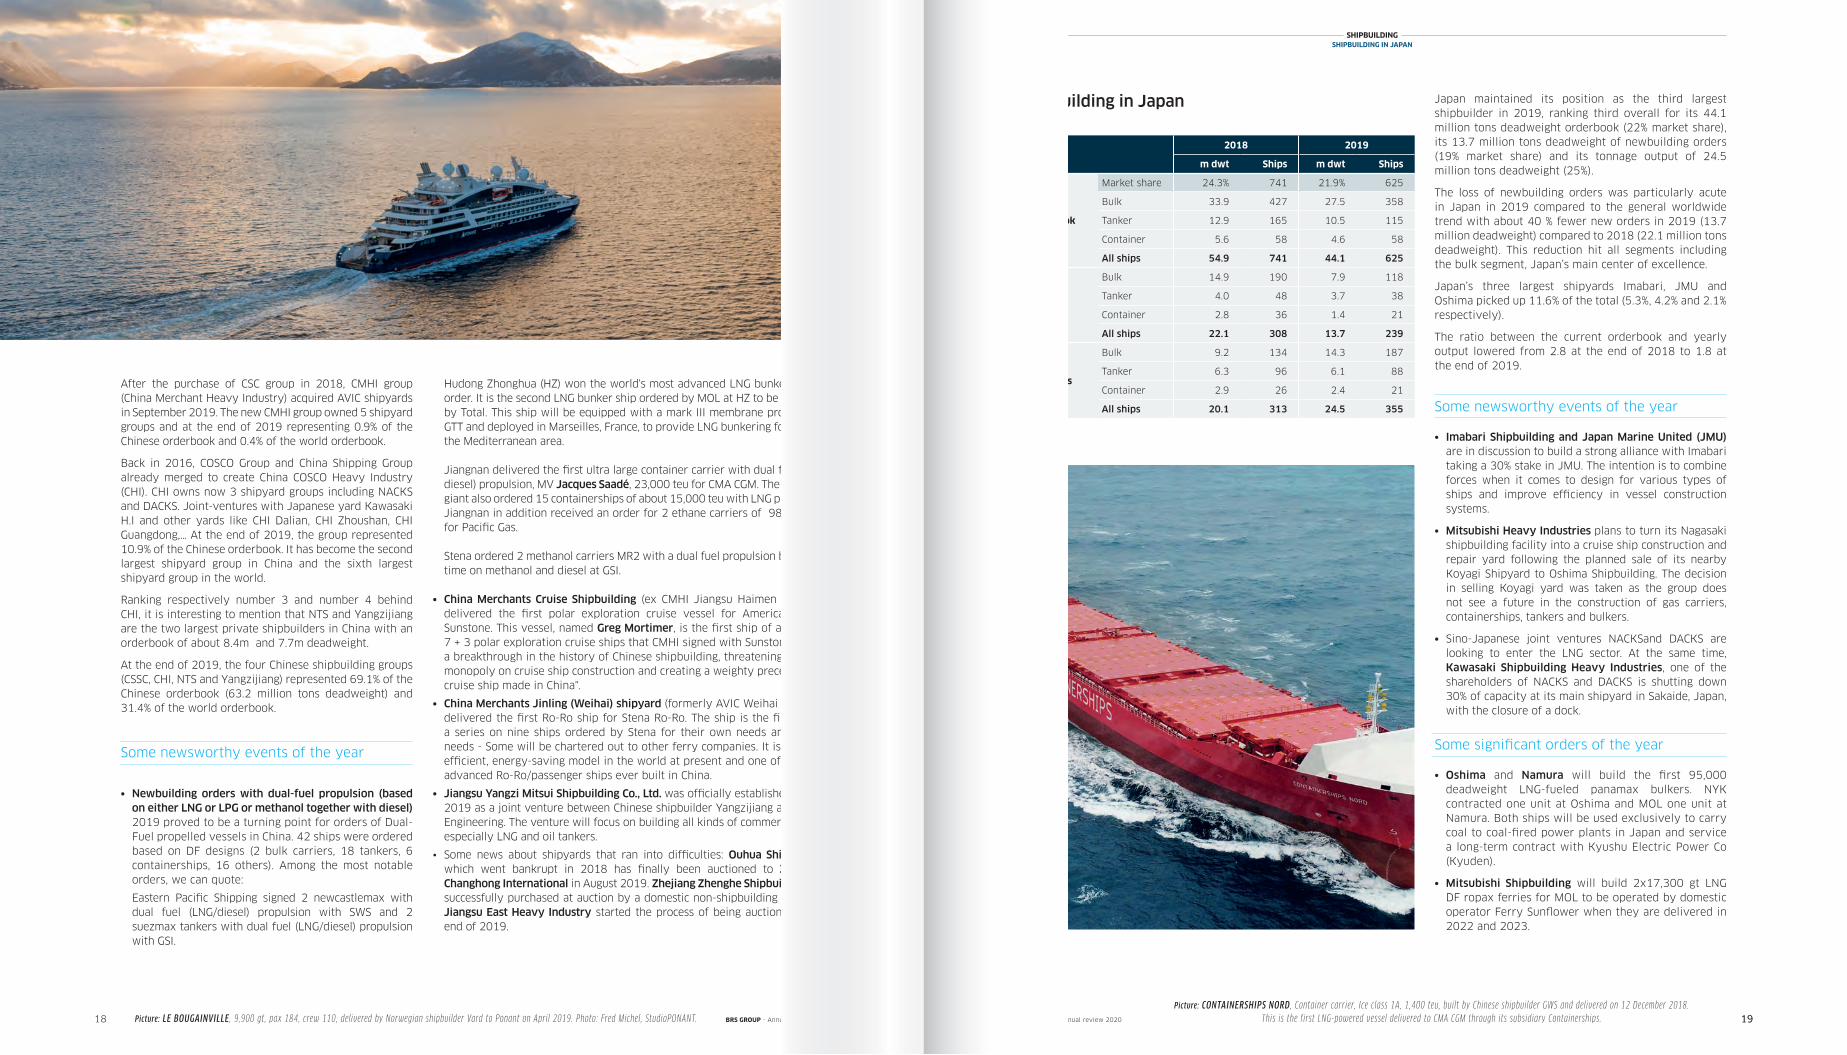
Shipbuilding in Japan
1918 19
SHIPBUILDINGSHIPBUILDING IN CHINA
SHIPBUILDINGSHIPBUILDING IN JAPAN
Picture: LE BOUGAINVILLE , 9,900 gt, pax 184, crew 110, delivered by Norwegian shipbuilder Vard to Ponant on April 2019. Photo: Fred Michel, StudioPONANT. BRS GROUP - Annual review 2020 BRS GROUP - Annual review 2020
Some newsworthy events of the year
• Newbuilding orders with dual-fuel propulsion (based on either LNG or LPG or methanol together with diesel) 2019 proved to be a turning point for orders of Dual-Fuel propelled vessels in China. 42 ships were ordered based on DF designs (2 bulk carriers, 18 tankers, 6 containerships, 16 others). Among the most notable orders, we can quote:
Eastern Pacific Shipping signed 2 newcastlemax with dual fuel (LNG/diesel) propulsion with SWS and 2 suezmax tankers with dual fuel (LNG/diesel) propulsion with GSI.
Hudong Zhonghua (HZ) won the world's most advanced LNG bunkering ship order. It is the second LNG bunker ship ordered by MOL at HZ to be chartered by Total. This ship will be equipped with a mark III membrane provided by GTT and deployed in Marseilles, France, to provide LNG bunkering for ships in the Mediterranean area.
Jiangnan delivered the first ultra large container carrier with dual fuel (LNG/diesel) propulsion, MV Jacques Saadé, 23,000 teu for CMA CGM. The container giant also ordered 15 containerships of about 15,000 teu with LNG propulsion. Jiangnan in addition received an order for 2 ethane carriers of 98,000 cbm for Pacific Gas.
Stena ordered 2 methanol carriers MR2 with a dual fuel propulsion based this time on methanol and diesel at GSI.
• China Merchants Cruise Shipbuilding (ex CMHI Jiangsu Haimen shipyard) delivered the first polar exploration cruise vessel for American owner Sunstone. This vessel, named Greg Mortimer, is the first ship of a series of 7 + 3 polar exploration cruise ships that CMHI signed with Sunstone. This is a breakthrough in the history of Chinese shipbuilding, threatening Europe’s monopoly on cruise ship construction and creating a weighty precedent – "a cruise ship made in China".
• China Merchants Jinling (Weihai) shipyard (formerly AVIC Weihai shipyard) delivered the first Ro-Ro ship for Stena Ro-Ro. The ship is the first out of a series on nine ships ordered by Stena for their own needs and others’ needs - Some will be chartered out to other ferry companies. It is the most efficient, energy-saving model in the world at present and one of the most advanced Ro-Ro/passenger ships ever built in China.
• Jiangsu Yangzi Mitsui Shipbuilding Co., Ltd. was officially established in May 2019 as a joint venture between Chinese shipbuilder Yangzijiang and Mitsui Engineering. The venture will focus on building all kinds of commercial ships, especially LNG and oil tankers.
• Some news about shipyards that ran into difficulties: Ouhua Shipbuilding which went bankrupt in 2018 has finally been auctioned to Zhoushan Changhong International in August 2019. Zhejiang Zhenghe Shipbuilding was successfully purchased at auction by a domestic non-shipbuilding company. Jiangsu East Heavy Industry started the process of being auctioned at the end of 2019.
After the purchase of CSC group in 2018, CMHI group (China Merchant Heavy Industry) acquired AVIC shipyards in September 2019. The new CMHI group owned 5 shipyard groups and at the end of 2019 representing 0.9% of the Chinese orderbook and 0.4% of the world orderbook.
Back in 2016, COSCO Group and China Shipping Group already merged to create China COSCO Heavy Industry (CHI). CHI owns now 3 shipyard groups including NACKS and DACKS. Joint-ventures with Japanese yard Kawasaki H.I and other yards like CHI Dalian, CHI Zhoushan, CHI Guangdong,… At the end of 2019, the group represented 10.9% of the Chinese orderbook. It has become the second largest shipyard group in China and the sixth largest shipyard group in the world.
Ranking respectively number 3 and number 4 behind CHI, it is interesting to mention that NTS and Yangzijiang are the two largest private shipbuilders in China with an orderbook of about 8.4m and 7.7m deadweight.
At the end of 2019, the four Chinese shipbuilding groups (CSSC, CHI, NTS and Yangzijiang) represented 69.1% of the Chinese orderbook (63.2 million tons deadweight) and 31.4% of the world orderbook.
Japan maintained its position as the third largest shipbuilder in 2019, ranking third overall for its 44.1 million tons deadweight orderbook (22% market share), its 13.7 million tons deadweight of newbuilding orders (19% market share) and its tonnage output of 24.5 million tons deadweight (25%).
The loss of newbuilding orders was particularly acute in Japan in 2019 compared to the general worldwide trend with about 40 % fewer new orders in 2019 (13.7 million deadweight) compared to 2018 (22.1 million tons deadweight). This reduction hit all segments including the bulk segment, Japan’s main center of excellence.
Japan’s three largest shipyards Imabari, JMU and Oshima picked up 11.6% of the total (5.3%, 4.2% and 2.1% respectively).
The ratio between the current orderbook and yearly output lowered from 2.8 at the end of 2018 to 1.8 at the end of 2019.
Some newsworthy events of the year
• Imabari Shipbuilding and Japan Marine United (JMU) are in discussion to build a strong alliance with Imabari taking a 30% stake in JMU. The intention is to combine forces when it comes to design for various types of ships and improve efficiency in vessel construction systems.
• Mitsubishi Heavy Industries plans to turn its Nagasaki shipbuilding facility into a cruise ship construction and repair yard following the planned sale of its nearby Koyagi Shipyard to Oshima Shipbuilding. The decision in selling Koyagi yard was taken as the group does not see a future in the construction of gas carriers, containerships, tankers and bulkers.
• Sino-Japanese joint ventures NACKSand DACKS are looking to enter the LNG sector. At the same time, Kawasaki Shipbuilding Heavy Industries, one of the shareholders of NACKS and DACKS is shutting down 30% of capacity at its main shipyard in Sakaide, Japan, with the closure of a dock.
Some significant orders of the year
• Oshima and Namura will build the first 95,000 deadweight LNG-fueled panamax bulkers. NYK contracted one unit at Oshima and MOL one unit at Namura. Both ships will be used exclusively to carry coal to coal-fired power plants in Japan and service a long-term contract with Kyushu Electric Power Co (Kyuden).
• Mitsubishi Shipbuilding will build 2x17,300 gt LNG DF ropax ferries for MOL to be operated by domestic operator Ferry Sunflower when they are delivered in 2022 and 2023.
Japan2018 2019
m dwt Ships m dwt Ships
Orderbook
Market share 24.3% 741 21.9% 625
Bulk 33.9 427 27.5 358
Tanker 12.9 165 10.5 115
Container 5.6 58 4.6 58
All ships 54.9 741 44.1 625
Orders
Bulk 14.9 190 7.9 118
Tanker 4.0 48 3.7 38
Container 2.8 36 1.4 21
All ships 22.1 308 13.7 239
Deliveries
Bulk 9.2 134 14.3 187
Tanker 6.3 96 6.1 88
Container 2.9 26 2.4 21
All ships 20.1 313 24.5 355
Picture: CONTAINERSHIPS NORD , Container carrier, Ice class 1A, 1,400 teu, built by Chinese shipbuilder GWS and delivered on 12 December 2018.This is the first LNG-powered vessel delivered to CMA CGM through its subsidiary Containerships.
2120 21
SHIPBUILDINGSHIPBUILDING IN SOUTH KOREA
Most newsworthy events of the year
Consolidation, Restructurings and Bankruptcies The Korean shipbuilding industry has not completely finalized its reorganization. The merger of HHI and DSME is still subject to approval from antitrust regulators in South Korea and other countries. Medium size yards are struggling for their survival.
After the March 2019 acquisition contract signing for Daewoo Shipbuilding & Marine Engineering (DSME) by Hyundai Heavy Industry (HHI), the completion of the merger remains outstanding. Internally, both management teams are facing strong resistance from the unions and DSME workers in particular. Externally the deal needs to be approved by antitrust watchdogs in several countries. The resistance of just one country would be enough to revoke the deal. If the merger is finally approved, it will create the second largest shipbuilding group in the world with a current orderbook evaluated at 27.5% of the world orderbook.
Pending approval of the deal, Korea’s shipbuilding industry continues its difficult transformation:
Hyundai Heavy Industries (HHI) secured some 50.4% of new orders placed in Korea in 2019 (64% if we include DSME new orders) versus 45.7% in 2018. The group has maintained its sales target for 2020 at the same 2019 level of $15.9 billion, even though it did not meet that goal in 2019, finishing the year with only $12 billion in orders. This can be explained by HHI’s expectation of more new orders created by the proliferation of stricter environmental regulations.
Samsung HI (SHI) almost met their sales target for 2019 with $7.1 billion vs 7.8 billion in 2018 mainly thanks to an order for 6 mega containerships from Evergreen and an order for 10 LNG-fueled aframax from their compatriot Sinokor.
Daewoo Shipbuilding and Marine Engineering (DSME) secured 25.9% of new orders placed in Korea in 2019 with a total of $6.88 billion achieving about 83% of their annual sales target of 8.3 billion. DSME is aiming for more than $7 billion of orders in 2020.
Hyundai Mipo Dockyard (HMD) continued to dominate the medium size shipyard segment (below kamsarmax size), collecting about 85% of new orders placed at Korean yards in 2019. It won 49 orders in 2019 against 54 in 2018, representing about 70% of its building capacity. Its main product remains the MR tanker and together with its Vietnamese company (HVS), it succeeded in winning about 48% of MR orders placed worldwide.
Daehan Shipbuilding is now focused on the construction of two types of standard tankers (aframax/LR2 and suezmax) and secured orders for 6 aframax and 6 suezmax in 2019. They have 20 ships in their orderbook at the beginning of 2020 which puts them in quite a comfortable position for the years to come.
STX Offshore & Shipbuilding (STX) which used to be in 2012 the fourth largest shipbuilding group in the world now concentrates only on MR tankers and secured 6 units in 2019 from three different owners. The yard succeeded in maintaining the same level of orders compared to last year.
Dae Sun Shipbuilding and Engineering secured 5 new orders in 2019 just as in 2018 – 3 handy tankers, 1 small ferry and 1 small LPG. Dae Sun has been selected by their compatriot GS Caltex to build their first LPG carrier (3,500 cbm).
Samkang Shipbuilding & Construction is mainly involved in steel-pipe production and the manufacture of ship blocks for domestic shipyards. It is currently building a 4,000 deadweight chemical tanker for a domestic owner at its existing site.
Sungdong Shipbuilding & Marine Engineering which in the late noughties was one the 10 largest shipbuilders in the world, finally found a new buyer. Having sought bankruptcy protection nearly two years ago, creditors after the fourth tentative acquisition attempt gave the green light to a local consortium to take
Shipbuilding in South KoreaKorea maintained its position as the second largest shipbuilder in 2019, ranking second overall for its 56.6 million deadweight orderbook (28% market share), its 26.3 million tons deadweight of newbuilding orders (36% market share) and its tonnage output 32.4 million tons deadweight (33%).
In the tanker and container carrier segments, Korea maintained its lead with 15.5 million tons deadweight of new orders (about 26 % of the global tanker orderbook) and 4.4 million tons deadweight of new orders (about 16% of the global container orderbook). As for previous years, Korean yards have only a marginal stake in the dry bulk segment, to the benefit of their Chinese and Japanese competitors, but this is largely compensated for by their dominant position in the construction of sophisticated LNG carriers (45 new units out of 58 worldwide in 2019).
In line with the global downward trend, Korean yards lost new orders in 2019 but only about 13.5% (26.3 million tons deadweight) compared to 2018 (30.4 million tons deadweight).
A sign of the ongoing consolidation in the country’s shipbuilding industry, 94% of orders in 2019 were secured by the Big Three, with Hyundai Heavy Industry netting 50.4%, DSME 25.9%, and Samsung 17.7%.
Korean shipbuilding output increased remarkably from 19 million to 32.4 million tons deadweight, but order to yearly output ratio decreased to dangerous low levels from 3.4 at end 2018 to 1.7 at the end of 2019.
South Korea2018 2019
m dwt Ships m dwt Ships
Orderbook
Market share 27.8% 460 28.1% 483
Bulk 5.3 19 3.7 15
Tanker 34.2 207 27.3 200
Container 12.3 95 12.0 96
All ships 62.7 460 56.6 483
Orders
Bulk 0.4 4 0.4 2
Tanker 15.6 99 15.5 121
Container 7.3 66 4.4 40
Gas 6.1 69 4.7 54
All ships 30.4 254 26.3 243
Deliveries
Bulk 0.7 3 2.0 6
Tanker 11.9 100 22.5 128
Container 2.7 18 4.7 39
Gas 3.7 53 3.2 43
All ships 19.0 178 32.4 220
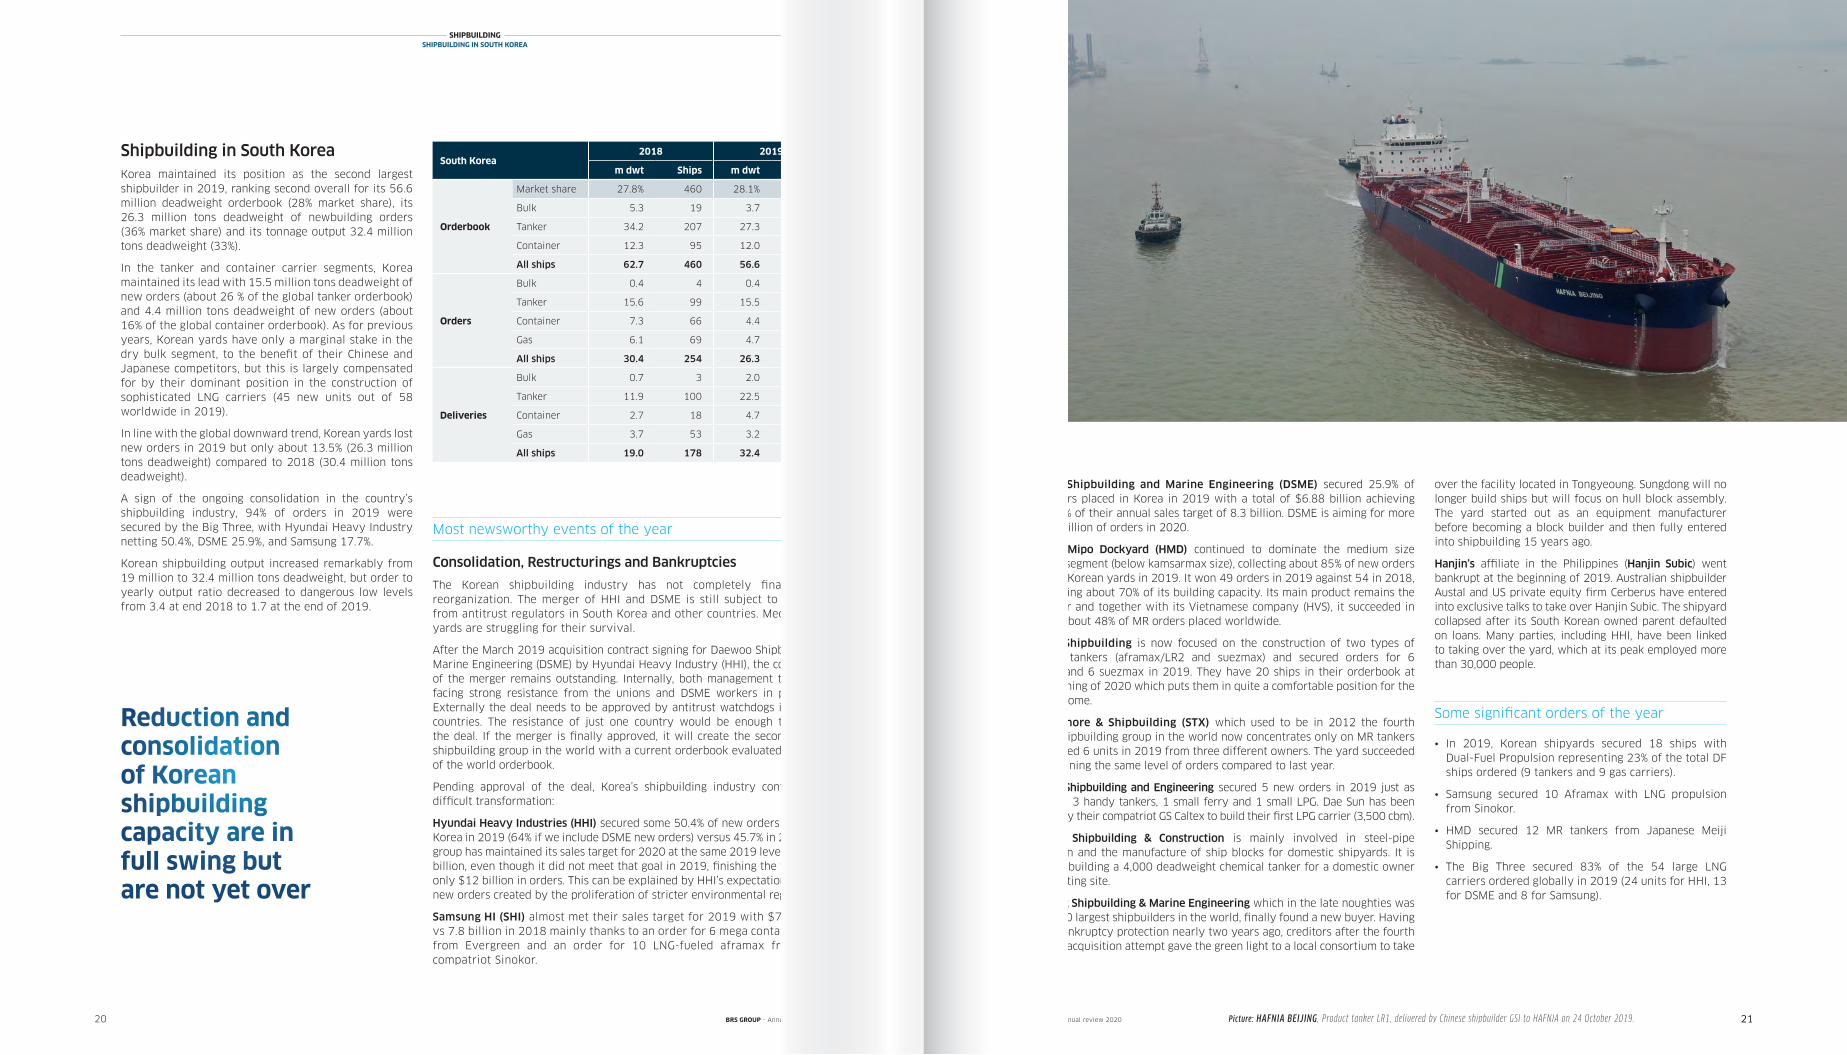
Picture: HAFNIA BEIJING , Product tanker LR1, delivered by Chinese shipbuilder GSI to HAFNIA on 24 October 2019.BRS GROUP - Annual review 2020 BRS GROUP - Annual review 2020
over the facility located in Tongyeoung. Sungdong will no longer build ships but will focus on hull block assembly. The yard started out as an equipment manufacturer before becoming a block builder and then fully entered into shipbuilding 15 years ago.
Hanjin’s affiliate in the Philippines (Hanjin Subic) went bankrupt at the beginning of 2019. Australian shipbuilder Austal and US private equity firm Cerberus have entered into exclusive talks to take over Hanjin Subic. The shipyard collapsed after its South Korean owned parent defaulted on loans. Many parties, including HHI, have been linked to taking over the yard, which at its peak employed more than 30,000 people.
Some significant orders of the year
• In 2019, Korean shipyards secured 18 ships with Dual-Fuel Propulsion representing 23% of the total DF ships ordered (9 tankers and 9 gas carriers).
• Samsung secured 10 Aframax with LNG propulsion from Sinokor.
• HMD secured 12 MR tankers from Japanese Meiji Shipping.
• The Big Three secured 83% of the 54 large LNG carriers ordered globally in 2019 (24 units for HHI, 13 for DSME and 8 for Samsung).
Reduction and consolidation of Korean shipbuildingcapacity are in full swing but are not yet over

Shipbuilding in Europe
2322 23
SHIPBUILDINGSHIPBUILDING IN EUROPE
It is necessary to drop deadweight (DEADWEIGHT) and instead view shipbuilding through the lens of gross tons (GT) to enhance understanding of the relative importance of the European versus Asian shipbuilding industry. This way an improved impression of the high-value vessels in question, with a very low deadweight, can be obtained; a cruise ship of about 200,000 GT has a current value of about 1 billion euro, equivalent to the price of 40 ultramax bulkers, but a deadweight of only 10,000 deadweight versus 250,000 deadweight!
When ranked by GT produced rather than deadweight, Europe claims its place among the world’s main shipbuilding nations, particularly when the comparative value of European-built GT is factored for. In 2019, China, Korea, Japan and Europe respectively accounted for 58.3, 45.0, 26.7, 12.6 million GT of orderbook. European shipyards saw their market share in gross ton (GT) increase in 2019 from 7.7% to 8.7% mainly due to the number of additional cruise ships ordered in 2019 (21 ships).
However, the downward trend in cruise ship orders seems to be confirmed (21 in 2019, 28 in 2018, 30 in 2017, 25 in 2016, 21 in 2015, 16 in 2014, 10 in 2013 and 4 in 2012). The three major specialist cruise ship builders: Fincantieri / Vard, Meyer Werft and Chantiers de l’Atlantique, received 16 orders, while the remaining 5 orders were shared by four other European shipyards.
The orderbook of the three major European cruise ship builders now stretches well into the late 2020s. Chantiers de l’Atlantique announced at the beginning of 2020 that a letter of intent had been signed with MSC for a new batch
of cruise vessels, the last of which will be delivered in 2030! A delivery so far in advance is unheard of and shows how different the fundamentals of the shipbuilding industry have become in Europe and in Asia.
The outlook is not universally bright, however. There is a strong divide in Europe between successful yards and their less successful counterparts. Alongside fortunate shipyards that have specialized in the construction of sophisticated cruise ships for a long time, there are also shipyards that have ventured into this new segment on the back of the expedition cruise boom and failed. The case of Spanish shipyard Barreras serves as a poignant reminder – it would have gone bankrupt in 2019 were it not rescued by Ritz Carlton which placed there a cruiseship order. Likewise, Norwegian shipyard Kleven Verft ran into difficulties and was taken over by the Norwegian shipping company Hurtingen to complete construction of the cruise ships already on order. At the beginning of 2020, it was announced that Croatia’s DIV Group (that owns Croatian shipyard Brodosplit) had entered into a preliminary agreement to take over Kleven Verft from Hurtigruten.
A group of yards in Croatia - Uljanik and 3Maj - also filed for bankruptcy. It seems that 3Maj might find a way out and restart, but for the time being Uljanik appears to be in a severely compromised state.
In Germany, Siem Europe signed an agreement with Tennor (ex Sapinda Holding B.V.) for the sale of a majority stake in German shipyard Flensburger Schiffbau-Gesellschaft (FSG) while Siem Europe holding the remainder. After becoming a shareholder in 2014, Siem Europe became also one of FSG’s largest customers. This included the construction of eight large roll-on/roll-off freighters, with all but one now delivered. FSG built up a reputation within the ferry and ro-pax sector for building highly efficient tonnage but has been facing extensive competition from Chinese yards such as Avic Weihai, GSI, Xiamen over the last years. The Ropax ferry Honfleur for Brittany Ferries is currently in the phase of extensive outfitting and commissioning alongside the commissioning work of the RoRo Leevsten and the work on construction of the last unit for SIEM has been partially rescheduled.
SHIPBUILDINGSHIPBUILDING IN EUROPE
Picture: CASTILLO DE ARTEAGA , Product tanker MR1, delivered by Chinese shipbuilder DSI (Shanhaiguan) to Empresa Naviera Elcano on 24 October 2019.
Most newsworthy events of the year
• Italy retained its top spot amongst European shipbuilding nations on the basis of GT ranking in 2019 thanks to its ‘flagship’ shipbuilding group Fincantieri, the largest cruise ship builder in the world with a total of 37 large units to be delivered before 2027. Fincantieri finalized the take-over of its affiliate Norwegian group Vard and subsequent to its restructuring efforts the group decided to sell two of its Norwegian facilities, Aukra and Brevik.
• France followed in second place thanks to its leading shipyard Chantiers de l’Atlantique which secured 5 additional cruise ship orders in 2019 and enjoys a total orderbook of 13 large cruise units to be delivered before 2027. After the exit of its main shareholders, the Korean shipbuilding group STX, the company is temporarily 84.3% owned by the French State, the rest being shared between Naval Group (11.7%), local companies (1.6%) and employees (2.4%). Discussions with Fincantieri which was supposed to take a majority stake of 50% have so far failed for several reasons including criticism made at European levels against a dominant, even monopolistic, position (according to major cruise shipowners) that would result from an association between Fincantieri, Vard and Chantiers de l’Atlantique; a lack of national independence for a domestic French shipbuilder that also builds for the French Navy and has a useful tool knowledge for the construction of certain military ships; the unique expertise of Chantiers de l’Atlantique in the construction of giant cruise ships at a time when Fincantieri has decided to sell cruise ship designs to a Chinese shipyard; resistance from the unions and the fact that the yard management succeeded in accruing a deep industrial expertise that needs to be retained in France. Interesting to note that the shipbuilder launched into offshore wind power to diversify its revenues and more traditional offshore work. A market of the future, with strong regional spinoffs, at a time when relocation of industrial activity is a major theme of the political debate.
Important to mention this year that the Piriou family decided to transfer control of the French shipyard to the management of the company thus closing a family cycle initiated with the creation of the company in 1965. Established in Europe, Africa and Asia, Piriou shipyard has some 900 employees and has built and deli-vered since its creation more than 500 ships, including 430 in France.
BRS GROUP - Annual review 2020 BRS GROUP - Annual review 2020
N° of ships1 1.5 2 2.5 3 3.5
Orderbook of European shipyards 2019
Ukraine
United Kingdom
Portugal
Azerbaijan
Poland
Germany
Romania
Netherlands
Spain
Turkey
Croatia
Norway
Finland
Russia
Germany
France
Italy
Million gt
0 0.5 4
ships
42
12
23
47
11
28
13
38
8
32
7
2
6
8
3
2
2
N°
Ukraine
United Kingdom
Portugal
Azerbaijan
Poland
Germany
Romania
Netherlands
Spain
Turkey
Croatia
Norway
Finland
Russia
Germany
France
Italy
Orderbook of European shipyards 2019 (million GT) • Germany maintained its position in third place thanks to two prolific shipyards, Meyer Weft and MV Werften.
Meyer Werft continue to be one of the best shipbuilders in the world of cruise vessels. End of 2018, they delivered MV AIDAnova, the largest and cleanest cruise ship ever built in Germany. It is the world’s first ever ocean liner with an LNG drive system, which fully prevents the release of particulate matter and sulphur oxides and significantly reduces the emission of nitrogen oxides and carbon dioxide. Thanks to this technology, AIDAnova is the first cruise ship to be awarded the Blauer Engel environmental seal by the German government. Two structurally identical sister ships are set to follow in 2021 and 2023.
German shipyard MV Werften, consisting of three shipyards respectively Wismar, Stralsund and Varnemunde was purchased by the Asian group Genting Hong Kong from Nordic Group back in 2016 and continues to strengthen its position in the construction of cruise ships. The construction in mega-sections of the first giant ocean liner MV Global Dream underwent an important stage with the huge central section of the future Global Dream left the MV Werften shipyard in Rostock (Warnemünde) to join the Wismar shipyard.
Shipbuilding in
Europe China Japan South Korea
2018 2019 2018 2019 2018 2019 2018 2019
m gt Ships m gt Ships m gt Ships m gt Ships m gt Ships m gt Ships m gt Ships m gt Ships
Market share 7.7% 288 8.7% 285 38.5% 1309 39.9% 1206 21.7% 741 18.3% 625 29.1% 460 30.8% 483
Bulk 0.03 5 0.03 3 35.6 590 31.3 516 18.8 427 15.4 358 2.7 19 1.9 15
Tanker 1.1 51 1.2 54 9.8 285 10.7 265 6.9 165 5.6 115 18.2 207 14.7 200
Container 0.01 2 0.01 2 10.1 239 9.4 198 5.3 58 3.9 58 11.8 95 11.5 96
Cruise 9.7 102 9.6 104 0.4 6 0.4 10 0 0 0 0 0 0 0 0
All ships 12.1 288 12.6 285 61.0 1309 58.3 1206 34.3 741 26.7 625 46.1 460 45.0 483
Bulk 0.01 3 0.01 2 16.3 270 8.4 146 8.3 190 4.5 118 0.2 4 0.2 2
Tanker 0.2 10 0.3 16 2.4 104 5.5 124 2.1 48 2.0 38 8.4 99 8.3 121
Container 0 1 0 0 2.8 103 3.0 45 2.3 36 1.2 21 7.0 66 4.3 40
Cruise 1.9 28 1.6 21 0.3 2 0.1 5 0 0 0 0 0 0 0 0
All ships 2.8 103 2.9 80 23.8 555 19.6 421 13.1 308 8.5 239 24.1 254 20.2 243
Bulk 0 0 0.01 4 9.1 145 12.7 220 5.2 134 7.9 187 0.4 3 1.0 6
Tanker 0.3 14 0.3 13 5.0 167 4.6 144 3.5 96 3.3 88 6.3 100 11.8 128
Container 0 0 0 0 6.6 106 3.7 86 3.0 26 2.5 21 2.6 18 4.5 39
Cruise 1.3 12 1.6 21 0 0 0.01 1 0.1 1 0.1 2 0 0 0 0
All ships 1.9 55 2.4 83 22.5 510 22.3 524 14.4 313 16.1 355 13.9 178 21.3 220
Ord
erb
oo
kO
rder
sD
eliv
erie
s Million Gt
2524 25
• Russia’s shipbuilding industry, fourth in European GT ranking, is the European leader in terms of deadweight in 2019, with the largest deadweight orderbook 1.65m deadweight. Its position is not only due to the large domestic orders placed since 2017 by Rosneft, Sovcomflot and recently Novatek at state-owned Zvezda Far Eastern Shipyard (22 ships including 5 LNG carriers, 10 aframax, 6 MR and 1 small tanker) but also to the numerous new orders secured by other Russian shipyards such as Nevskiy, Okskaya, Tretiye and Volgogradskiy (18 units).
• In Finland, Meyer Turku Oy (ex Masa Yards, Kvaerner Masa Yards, Aker Finnyards, Aker Yards, STX Finland) delivered to Costa Cruises the Costa Smeralda, Costa's new flagship and its first LNG-powered vessel. This is the second LNG-powered ship after the AIDA brand's new AIDAnova, the world's first LNG-fueled cruise ship. In 2019, Meyer Turku also received a new order for a cruise ship of 200,000 gt.
Rauma Marine Constructions (RMC) was founded in 2014 and specialised in the construction and maintenance of multi-purpose icebreakers, car and passenger ferries, and vessels for use by the armed forces. They are the only domestically-owned shipbuilding company Rauma Marine Constructions (RMC and signed with the Finnish Defence Forces a construction agreement regarding the new Pohjanmaa-class corvettes for the Finnish Navy. RMC received two additional new orders from Kvarken Link and Tallink, a Ropax of 24,300 gt on one side and a Ferry of 49,134 gt on the other side.
Arctech Helsinki Shipyard focuses primarily on icebreakers and other ice going vessels for arctic conditions. Due to the economic sanctions against its Russian owner, the company was forced to transfer its shipbuilding business in Finland to a successor company, Helsinki Shipyard, which was then sold to a private Russian owner. Helsinki SY also get two new orders for cruise ships of 10,700 gt each.
Shipbuilding in the Rest of the World
The orderbook for shipyards in the Rest of the World (RoW) continues to crumble from 7.4 million tons deadweight in 2018 to 5.2 million tons deadweight in 2019. RoW market share dropped from 3.3% to 2.6%.
Deliveries also decreased, from 4.6 million tons deadweight in 2018 to 3.5 million deadweight in 2019. Consequently, the ratio between the current orderbook and yearly output shrank to 1.5 in 2019 against 1.9 in 2018.
The collapse of Philippines shipyard Hanjin Subic in 2019 had a major impact on RoW performance as it was a great contributor, representing about 30% of RoW new orders in 2017 (no new order in 2018). CSBC (Taiwan), another great contributor did not manage to secure orders in 2019 despite accounting for 50% of RoW new orders in 2018. At the end of 2019, 13 RoW shipyards secured new orders, with 89% of them placed in just 2 shipyards: Tsuneishi Cebu (Philippines) with 56% and Hyundai Vinashin (Vietnam) with 33%.
ROW2018 2019
m dwt Ships m dwt Ships
Orderbook
Market share 3.3% 226 2.6% 187
Bulk 3.7 52 2.8 49
Tanker 2.4 65 1.3 46
Container 0.8 25 0.7 21
All ships 7.4 226 5.2 187
Orders
Bulk 0.8 14 0.9 20
Tanker 0.4 10 0.3 10
Container 0.4 12 0 0
All ships 1.7 52 1.3 45
Deliveries
Bulk 1.3 21 1.8 23
Tanker 1.7 34 1.4 29
Container 1.3 15 0.1 4
All ships 4.6 95 3.5 84
Orderbook Rest of the World 2019 (by million dwt)
Million dwt
India
Argentina
Indonesia
United States
Bangladesh
Brazil
Taiwan
Vietnam
PhilippinesPhilippines
Vietnam
Taiwan
Brazil
Bangladesh
India
Million dwt
Orderbook rest of the world 2019
United States
Argentina
Indonesia
0 0.5 1 1.5 2 2.5
39
28
12
7
52
5
12
2
18
shipsN°
Most newsworthy events of the year
• The Philippines remains by far the leader of the Rest of the World shipbuilding group, with 41.4% of the total orderbook, despite the collapse of Hanjin Subic. This compares to 56% in 2017 and 30% in 2016. Its orderbook is split 99.9% for Tsuneishi Cebu and 0.1% for Austal Philippines.
Hanjin Subic applied for rehabilitation at the end of 2018 after having defaulted on $400 million of bank loans. This procedure is in line with the so-called ‘rehabilitation proceeding’ in Korea, where insolvent companies may ask for court and creditors’ approval to restructure debts.
• Vietnam retained its second position in 2019 thanks to Hyundai Vinashin which owned 99.7% of the orderbook. After the bankruptcy of Triyards, there are some other foreign controlled shipyards such as Damen, Vard and Piriou all together with about 30 other small shipyards.
• Taiwan maintained its third place thanks to orders secured by CSBC back in 2018. In 2019, CSBC did not succeed in locking in any new orders. Evergreen, a compatriot containerships’ operator and usually CSBC’s main client, finally secured their 2019 container carrier orders in Korea and China thanks to competitive pricing and improved ship quality: 4x1,800 teu at HMD, 6x23,000 teu at Samsung, 2x23,000 teu at Hudong-Zhonghua and 2x23,000 teu at Jiangnan.
• Brazil’s orderbook continues to shrink. No orders have been taken since 2016, and only one shipyard Eisa Ilha still has orders (7 units).
• Bangladesh remained in fifth place thanks to Bashundara Group which secured 7 mini Bulk for its own account. Bangladesh now has an orderbook of 53 units under construction at 8 different shipyards.
• Singapore is still grappling with the difficult offshore market but is finding leeway in the emerging LNG bunkering market with an orderbook of 6 ships (3 small ferries at Sembcorp Marine and 3 small LNG carriers at Keppel Singmarine and Sembcorp Marine).
Picture: ROSSI A. DESGAGNÉS , Ice class 1A, dual fuel/LNG 15,000 dwt, devlivered by Turkish shipbuilder Besiktas to Transport Desgagnés International on May 2019.
Cheap labour is not a recipe for success in
the shipbuilding industry
SHIPBUILDINGSHIPBUILDING IN THE REST OF THE WORLD
BRS GROUP - Annual review 2020 BRS GROUP - Annual review 2020
• The Norwegian shipbuilding industry continued to suffer from the continuing effects of deep crisis in its reference market, the oil & gas sector and from the costs incurred by its entry into the cruise shipbuilding market.
• The situation in Croatia became critical in 2019 with the bankruptcy of Uljanik and 3 Maj shipyards leaving only 2 shipyards (Brodosplit and Trogir) remaining active. It looks as though 3Maj could restart however.
• Turkey’s shipbuilders secured a number of newbuildings in 2019, all ships below 20 000 deadweight including dry cargo vessels, tankers, fishing vesselsbut also small ferries and even small cruise ferries. Turkey can count with shipyards having an international reputation such as Atlas, Cemre, Gemak, RMK, Sedef, Tersan. Some have a mix of activities combining shiprepairs, conversions and newbuildings. Some yards like Besiktas decided in 2019 to focus on shiprepair, scrubber retrofitting and conversions. One of the difficulties met by the Turkish shipbuilding industry in 2019 was the greater difficulty in obtaining bank refund guarantees acceptable on the international scene in a context of political uncertainties.
• Spain, which was in third position in 2018 by deadweight ranking, disappeared from the top 10 in 2019 after Navantia delivered its last Suezmax to Spanish owner Ibaizabal. Navantia remains one of the world few able to engineer and execute complex upgrades (ropax/ special tonnages). But Spain can also count with very dynamic yards such as Gondan, Freire, Metalships, Murueta, Zamacona that are specialized in fishing, service, offshore vessels. Sestao based in Bilbao that has been under administration for some time is trying to find a buyer that could maintain an industrial and shipbuilding activity in the area.
• Dutch shipbuilders are well known for their specialization in designing and building environmentally friendly and cost-effective ships. in a range typically upto to 20 000 dwt of different types: cargo vessels, multipurpose vessels which are able to carry project cargo, containers, geared vessels, mini-bulkers but also tankers and even extremely innovative LNG bunker tankers, gas carriers, offshore vessels, service vessels, tugs, inland navigation vessels, dredgers at renowned shipyards such Royal IHC, Damen, Bodewes, TB shipyard, Ferus Smit, Royal Niestern… Interesting to note that three main historical clients (Boskalis/ Van Oord/ Deme) of Royal IHC became shareholders of the yard in 2019.
• Romania succeeded in maintaining a strong orderbook at Constanta including 5 x 41 000 tons deadweight tankers from Tangent Marine and the order of two 1000 lane meters Ro-Ros at Damen-Mangalia from Canadian Seaspan Ferries. Damen and Seadream signed a contract in 2019 for the construction of a cruise ship but that contract never came into force unfortunately.
N° of ships
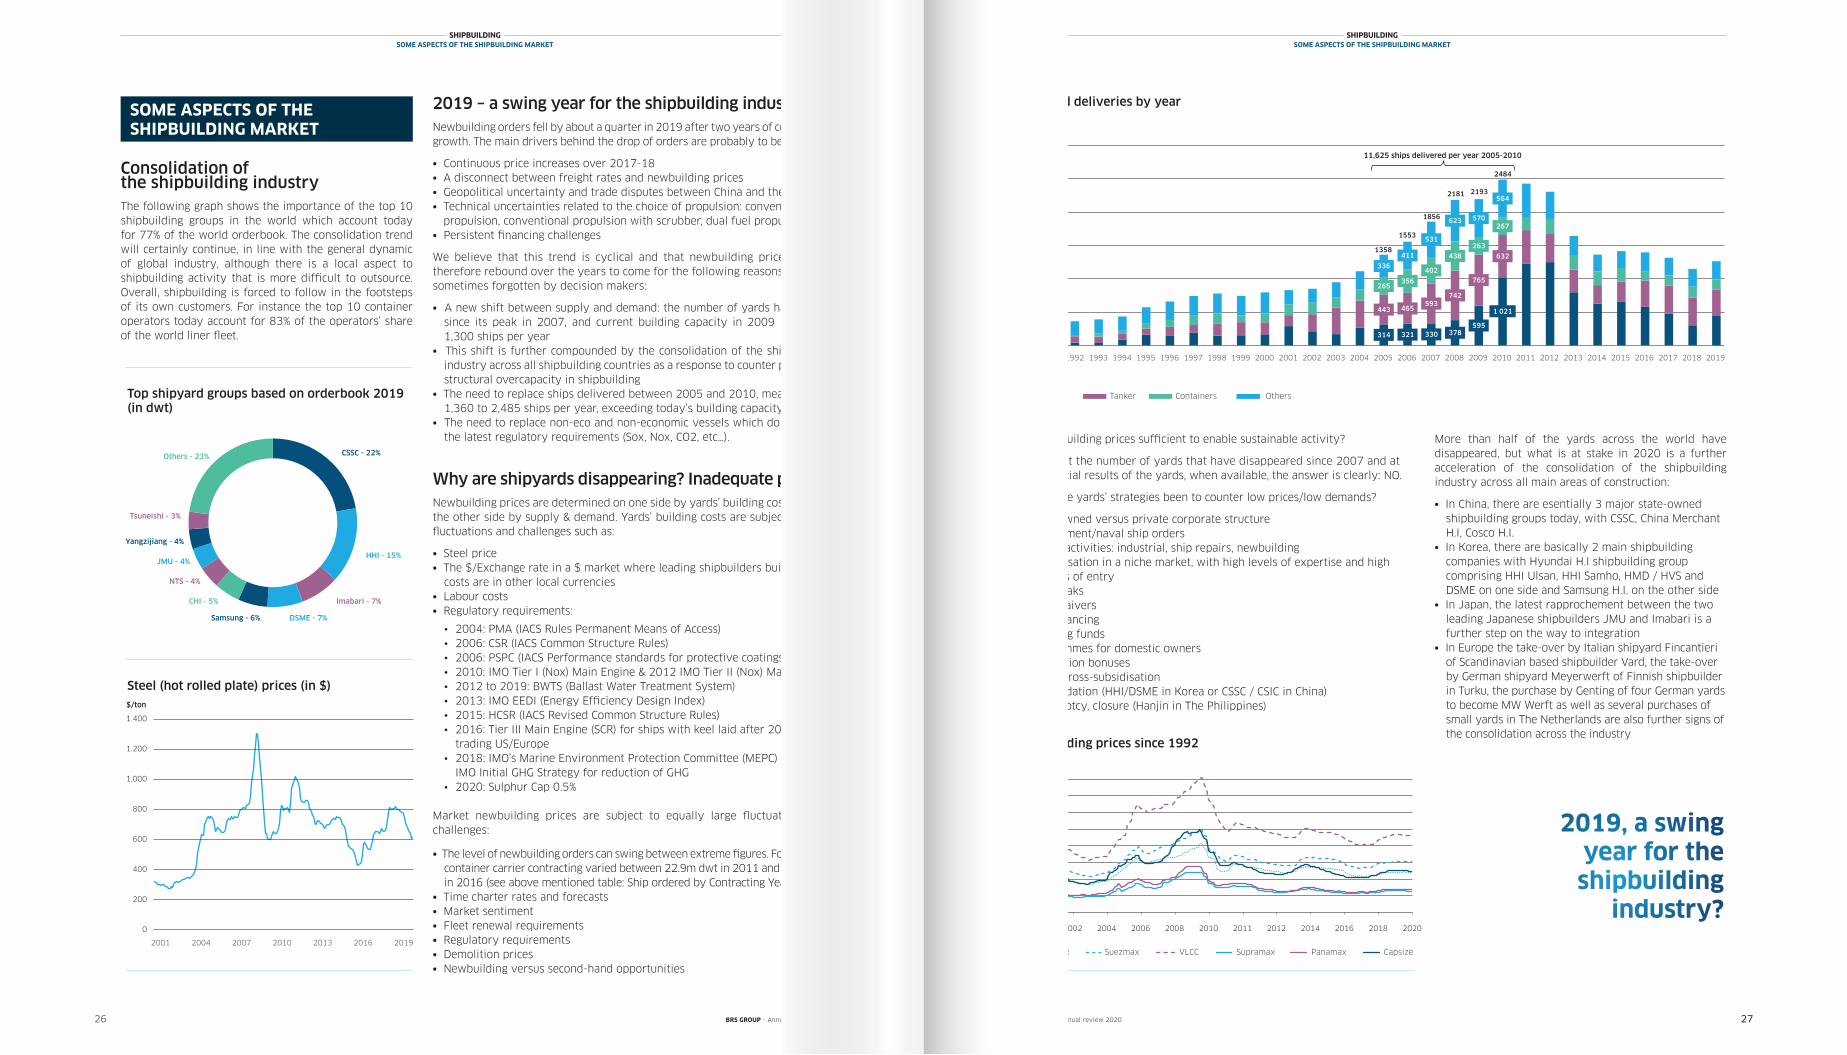
Consolidation of the shipbuilding industry The following graph shows the importance of the top 10 shipbuilding groups in the world which account today for 77% of the world orderbook. The consolidation trend will certainly continue, in line with the general dynamic of global industry, although there is a local aspect to shipbuilding activity that is more difficult to outsource. Overall, shipbuilding is forced to follow in the footsteps of its own customers. For instance the top 10 container operators today account for 83% of the operators’ share of the world liner fleet.
2019 – a swing year for the shipbuilding industry? Newbuilding orders fell by about a quarter in 2019 after two years of continuous growth. The main drivers behind the drop of orders are probably to be found in:
• Continuous price increases over 2017-18• A disconnect between freight rates and newbuilding prices • Geopolitical uncertainty and trade disputes between China and the US• Technical uncertainties related to the choice of propulsion: conventional propulsion, conventional propulsion with scrubber, dual fuel propulsion
• Persistent financing challenges
We believe that this trend is cyclical and that newbuilding prices should therefore rebound over the years to come for the following reasons, that are sometimes forgotten by decision makers:
• A new shift between supply and demand: the number of yards has halved since its peak in 2007, and current building capacity in 2009 is around 1,300 ships per year
• This shift is further compounded by the consolidation of the shipbuilding industry across all shipbuilding countries as a response to counter prevailing structural overcapacity in shipbuilding
• The need to replace ships delivered between 2005 and 2010, meaning 1,360 to 2,485 ships per year, exceeding today’s building capacity
• The need to replace non-eco and non-economic vessels which do not meet the latest regulatory requirements (Sox, Nox, CO2, etc…).
Why are shipyards disappearing? Inadequate pricing Newbuilding prices are determined on one side by yards’ building costs and on the other side by supply & demand. Yards’ building costs are subject to large fluctuations and challenges such as:
• Steel price • The $/Exchange rate in a $ market where leading shipbuilders building
costs are in other local currencies• Labour costs• Regulatory requirements:
• 2004: PMA (IACS Rules Permanent Means of Access)• 2006: CSR (IACS Common Structure Rules)• 2006: PSPC (IACS Performance standards for protective coatings)• 2010: IMO Tier I (Nox) Main Engine & 2012 IMO Tier II (Nox) Main Engine• 2012 to 2019: BWTS (Ballast Water Treatment System)• 2013: IMO EEDI (Energy Efficiency Design Index)• 2015: HCSR (IACS Revised Common Structure Rules)• 2016: Tier III Main Engine (SCR) for ships with keel laid after 2016,
trading US/Europe• 2018: IMO’s Marine Environment Protection Committee (MEPC) adopted
IMO Initial GHG Strategy for reduction of GHG• 2020: Sulphur Cap 0.5%
Market newbuilding prices are subject to equally large fluctuations and challenges:
• The level of newbuilding orders can swing between extreme figures. For instance container carrier contracting varied between 22.9m dwt in 2011 and 1.6m dwt in 2016 (see above mentioned table: Ship ordered by Contracting Year)
• Time charter rates and forecasts • Market sentiment• Fleet renewal requirements• Regulatory requirements • Demolition prices• Newbuilding versus second-hand opportunities
2726 27
SHIPBUILDINGSOME ASPECTS OF THE SHIPBUILDING MARKET
2019, a swing year for the shipbuilding
industry?
SHIPBUILDINGSOME ASPECTS OF THE SHIPBUILDING MARKET
Are newbuilding prices sufficient to enable sustainable activity?
Looking at the number of yards that have disappeared since 2007 and at the financial results of the yards, when available, the answer is clearly: NO.
What have yards’ strategies been to counter low prices/low demands?
• State owned versus private corporate structure • Government/naval ship orders• Mix of activities: industrial, ship repairs, newbuilding• Specialisation in a niche market, with high levels of expertise and high
barriers of entry• Tax breaks• Debt waivers• Soft financing• Shipping funds• Programmes for domestic owners• Demolition bonuses• Group cross-subsidisation• Consolidation (HHI/DSME in Korea or CSSC / CSIC in China)• Bankruptcy, closure (Hanjin in The Philippines)
BRS GROUP - Annual review 2020 BRS GROUP - Annual review 2020
Top shipyard groups based on orderbook 2019(in dwt)
Million $
0
20
40
60
80
100
120
140
160
180
Newbuilding prices since 2000
2000 2002 2004 2006 2008 2010 2011 2012 2014 2020
Aframax Suezmax VLCC Supramax Panamax Capesize
2016 2018
SOME ASPECTS OF THE SHIPBUILDING MARKET
Shipyard deliveries by year N° of ships
2000 2001 2002 2003 2004 2005 2006 2007 2008 2009 2010 2011 2012 2013 2014 2015 2016 2017 2018
Million dwt
0rders
2000 2001 2002 2003 2004 2005 2006 2007 2008 2009 2010 2011 2012 2013 2014 2015 2016 2017 2018
0
50
100
150
200
250
300
Bulk Tanker Container Others
N° of ships
1991 1993 1995 1997 1999 2001 2003 2005 2007 2009 2011 2013 2015 2017 20181992 1994 1996 1998 2000 2002 2004 2006 2008 2010 2012 2014 2016 2019
Bulk Tanker Container Others
0
500
1,000
1,500
2,000
2,500
3,000
314 321 330 378595
1 021443 465593
742
765
632
265356
402
438
263
267
336
411
531
623 570
564
Shipyard Deliveries by year
11,625 ships delivered between 2005 and 2010
1358
1553
1856
2181 2193
2484
Containers OthersBulk Tanker
20191991 1992 1993 1994 1995 1996 1997 1998 1999
11,625 ships delivered per year 2005-2010
More than half of the yards across the world have disappeared, but what is at stake in 2020 is a further acceleration of the consolidation of the shipbuilding industry across all main areas of construction:
• In China, there are esentially 3 major state-owned shipbuilding groups today, with CSSC, China Merchant H.I, Cosco H.I.
• In Korea, there are basically 2 main shipbuilding companies with Hyundai H.I shipbuilding group comprising HHI Ulsan, HHI Samho, HMD / HVS and DSME on one side and Samsung H.I. on the other side
• In Japan, the latest rapprochement between the two leading Japanese shipbuilders JMU and Imabari is a further step on the way to integration
• In Europe the take-over by Italian shipyard Fincantieri of Scandinavian based shipbuilder Vard, the take-over by German shipyard Meyerwerft of Finnish shipbuilder in Turku, the purchase by Genting of four German yards to become MW Werft as well as several purchases of small yards in The Netherlands are also further signs of the consolidation across the industry
Steel (hot rolled plate) prices (in $)
NTS - 4%
CSSC - 22% Others - 23%
HHI - 15%
Yangzijiang - 4%
JMU - 4%
CHI - 5%
Tsuneishi - 3%
DSME - 7% Samsung - 6%
Imabari - 7%
$/ton
2001 2004 2007 2010 2013 2016 2019
200
400
600
800
1.000
1.200
1.400
0
Steel (hot rolled plate) prices (in $)
$/ton
2004 2007 2010 2013 20192001 2016Panamax CapsizeSupramaxSuezmax VLCCAframax
Newbuilding prices since 1992Million $
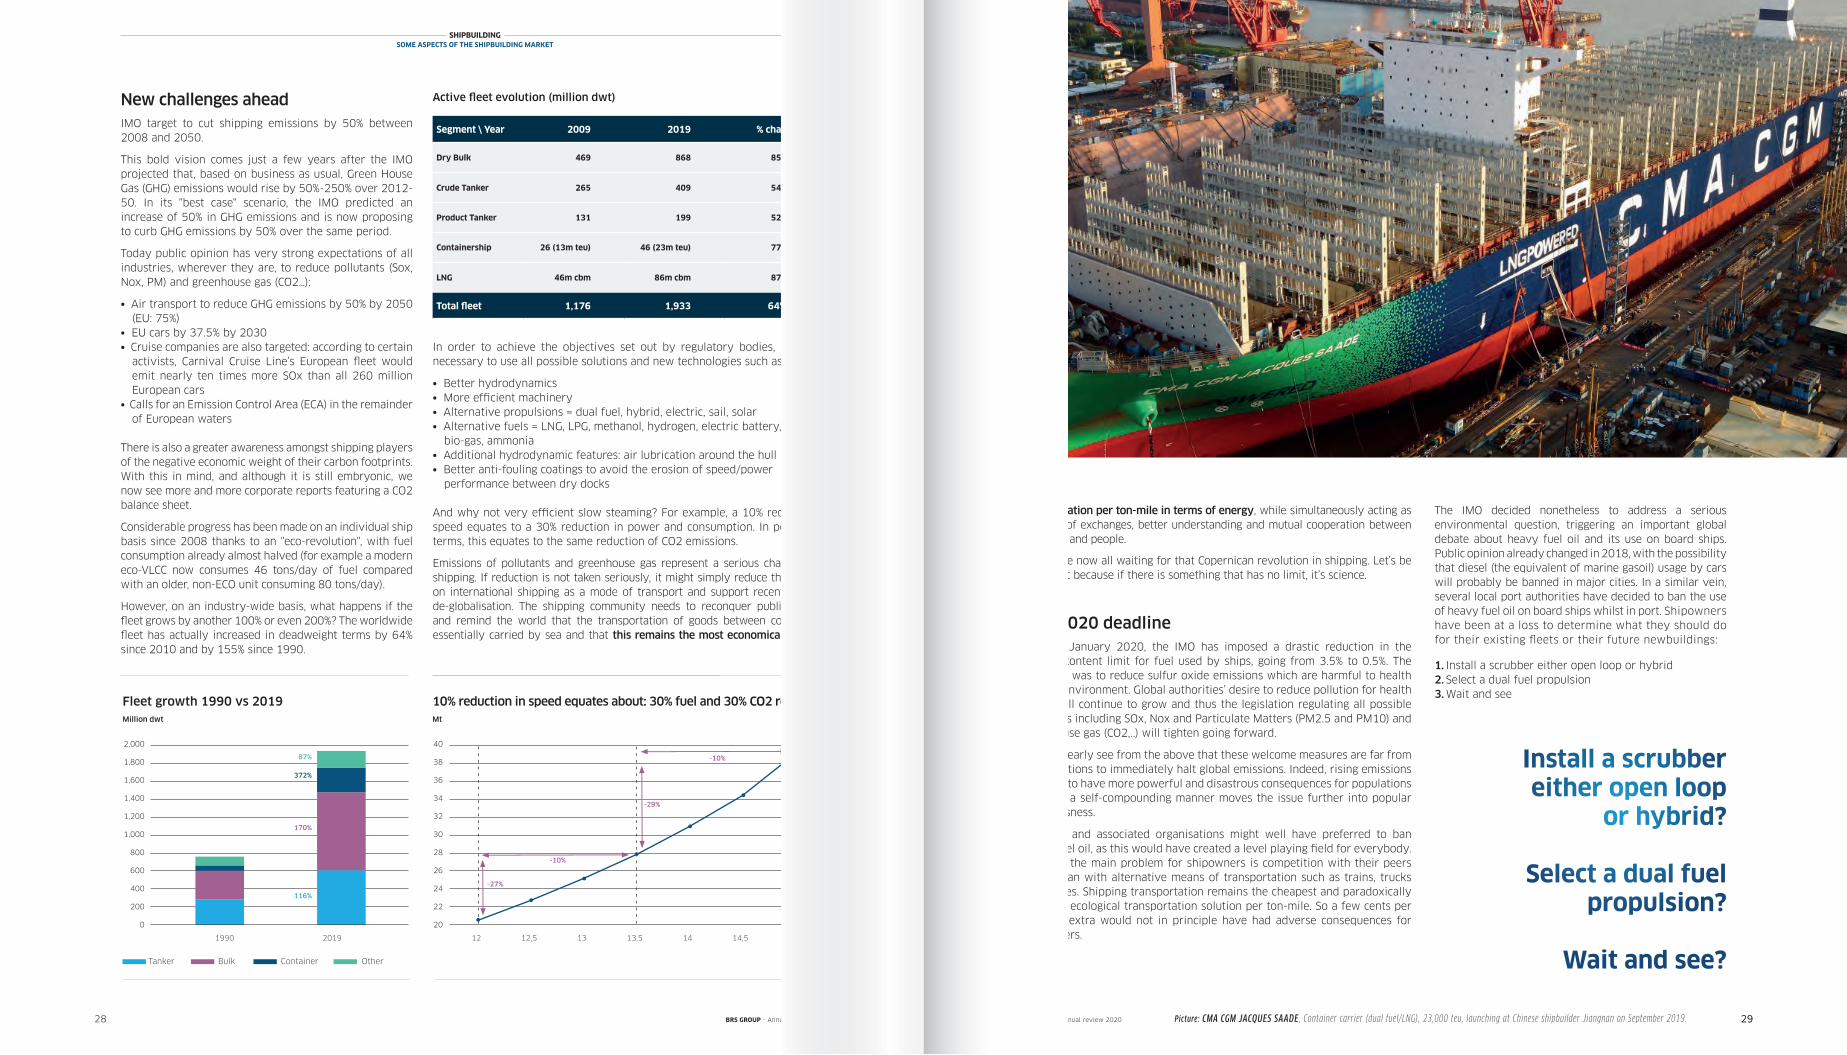
2928 29
SHIPBUILDINGSOME ASPECTS OF THE SHIPBUILDING MARKET
BRS GROUP - Annual review 2020 BRS GROUP - Annual review 2020
New challenges ahead IMO target to cut shipping emissions by 50% between 2008 and 2050.
This bold vision comes just a few years after the IMO projected that, based on business as usual, Green House Gas (GHG) emissions would rise by 50%-250% over 2012-50. In its "best case" scenario, the IMO predicted an increase of 50% in GHG emissions and is now proposing to curb GHG emissions by 50% over the same period.
Today public opinion has very strong expectations of all industries, wherever they are, to reduce pollutants (Sox, Nox, PM) and greenhouse gas (CO2…):
• Air transport to reduce GHG emissions by 50% by 2050 (EU: 75%)
• EU cars by 37.5% by 2030• Cruise companies are also targeted: according to certain
activists, Carnival Cruise Line’s European fleet would emit nearly ten times more SOx than all 260 million European cars
• Calls for an Emission Control Area (ECA) in the remainder of European waters
There is also a greater awareness amongst shipping players of the negative economic weight of their carbon footprints. With this in mind, and although it is still embryonic, we now see more and more corporate reports featuring a CO2 balance sheet.
Considerable progress has been made on an individual ship basis since 2008 thanks to an "eco-revolution", with fuel consumption already almost halved (for example a modern eco-VLCC now consumes 46 tons/day of fuel compared with an older, non-ECO unit consuming 80 tons/day).
However, on an industry-wide basis, what happens if the fleet grows by another 100% or even 200%? The worldwide fleet has actually increased in deadweight terms by 64% since 2010 and by 155% since 1990.
In order to achieve the objectives set out by regulatory bodies, it will be necessary to use all possible solutions and new technologies such as:
• Better hydrodynamics• More efficient machinery• Alternative propulsions = dual fuel, hybrid, electric, sail, solar• Alternative fuels = LNG, LPG, methanol, hydrogen, electric battery, bio-fuel,
bio-gas, ammonia• Additional hydrodynamic features: air lubrication around the hull• Better anti-fouling coatings to avoid the erosion of speed/power
performance between dry docks
And why not very efficient slow steaming? For example, a 10% reduction in speed equates to a 30% reduction in power and consumption. In percentage terms, this equates to the same reduction of CO2 emissions.
Emissions of pollutants and greenhouse gas represent a serious challenge for shipping. If reduction is not taken seriously, it might simply reduce the reliance on international shipping as a mode of transport and support recent calls for de-globalisation. The shipping community needs to reconquer public opinion and remind the world that the transportation of goods between countries is essentially carried by sea and that this remains the most economical mode of
Picture: CMA CGM JACQUES SAADE , Container carrier (dual fuel/LNG), 23,000 teu, launching at Chinese shipbuilder Jiangnan on September 2019.
Active fleet evolution (million dwt)
Fleet growth 1990 vs 2019Million dwt
transportation per ton-mile in terms of energy, while simultaneously acting as a vector of exchanges, better understanding and mutual cooperation between countries and people.
So, we are now all waiting for that Copernican revolution in shipping. Let’s be optimistic because if there is something that has no limit, it’s science.
10% reduction in speed equates about: 30% fuel and 30% CO2 reductionMt
The IMO decided nonetheless to address a serious environmental question, triggering an important global debate about heavy fuel oil and its use on board ships. Public opinion already changed in 2018, with the possibility that diesel (the equivalent of marine gasoil) usage by cars will probably be banned in major cities. In a similar vein, several local port authorities have decided to ban the use of heavy fuel oil on board ships whilst in port. Shipowners have been at a loss to determine what they should do for their existing fleets or their future newbuildings:
1. Install a scrubber either open loop or hybrid2. Select a dual fuel propulsion 3. Wait and see
Install a scrubber either open loop
or hybrid?
Select a dual fuel propulsion?
Wait and see?
IMO 2020 deadline Since 1st January 2020, the IMO has imposed a drastic reduction in the sulphur content limit for fuel used by ships, going from 3.5% to 0.5%. The objective was to reduce sulfur oxide emissions which are harmful to health and the environment. Global authorities’ desire to reduce pollution for health issues will continue to grow and thus the legislation regulating all possible pollutants including SOx, Nox and Particulate Matters (PM2.5 and PM10) and greenhouse gas (CO2,..) will tighten going forward.
But we clearly see from the above that these welcome measures are far from final solutions to immediately halt global emissions. Indeed, rising emissions continue to have more powerful and disastrous consequences for populations which in a self-compounding manner moves the issue further into popular consciousness.
The IMO and associated organisations might well have preferred to ban heavy fuel oil, as this would have created a level playing field for everybody. After all, the main problem for shipowners is competition with their peers rather than with alternative means of transportation such as trains, trucks and planes. Shipping transportation remains the cheapest and paradoxically the most ecological transportation solution per ton-mile. So a few cents per ton-mile extra would not in principle have had adverse consequences for shipowners.
Segment \ Year 2009 2019 % change
Dry Bulk 469 868 85%
Crude Tanker 265 409 54%
Product Tanker 131 199 52%
Containership 26 (13m teu) 46 (23m teu) 77%
LNG 46m cbm 86m cbm 87%
Total fleet 1,176 1,933 64%
Million dwt
1990 2019
200
600
1,000
1,400
1,600
2,000
1,800
0
400
800
1,200
116%
170%
372%
87%
Fleet growth 1990 vs 2019
Tanker Bulk Container Other
1990 2019
Container OtherBulkTanker
Million dwt
22
26
30
34
36
40
38
20
24
28
32
12 12,5 13,5 14,5 1513 14
NB Fuel comsumption comparison
Eco Design
-10%
-10%
-29%
-27%
12,5 13 13,5 14 1512 14,5 knot
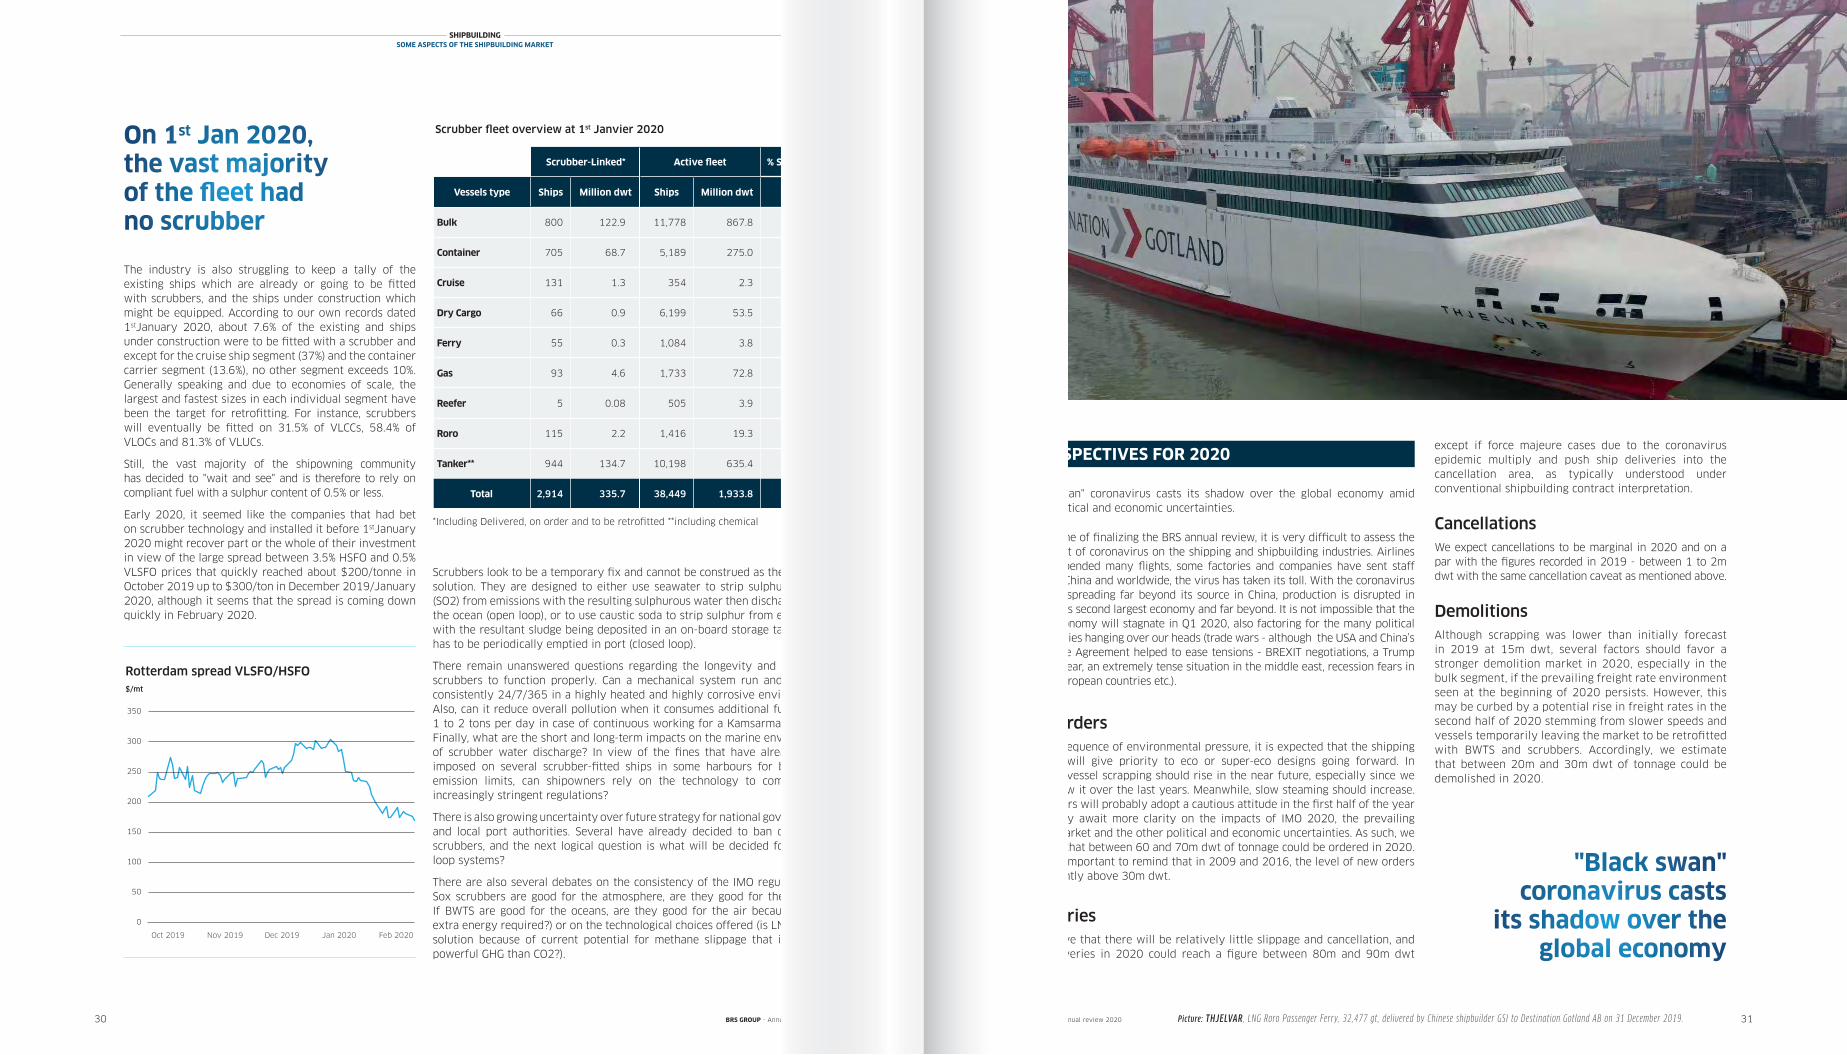
Scrubber fleet overview at 1st Janvier 2020
30 31
SHIPBUILDINGSOME ASPECTS OF THE SHIPBUILDING MARKET
SHIPBUILDINGPERSPECTIVES FOR 2020
Picture: THJELVAR , LNG Roro Passenger Ferry, 32,477 gt, delivered by Chinese shipbuilder GSI to Destination Gotland AB on 31 December 2019.
except if force majeure cases due to the coronavirus epidemic multiply and push ship deliveries into the cancellation area, as typically understood under conventional shipbuilding contract interpretation.
CancellationsWe expect cancellations to be marginal in 2020 and on a par with the figures recorded in 2019 - between 1 to 2m dwt with the same cancellation caveat as mentioned above.
DemolitionsAlthough scrapping was lower than initially forecast in 2019 at 15m dwt, several factors should favor a stronger demolition market in 2020, especially in the bulk segment, if the prevailing freight rate environment seen at the beginning of 2020 persists. However, this may be curbed by a potential rise in freight rates in the second half of 2020 stemming from slower speeds and vessels temporarily leaving the market to be retrofitted with BWTS and scrubbers. Accordingly, we estimate that between 20m and 30m dwt of tonnage could be demolished in 2020.
"Black swan" coronavirus casts
its shadow over the global economy
BRS GROUP - Annual review 2020 BRS GROUP - Annual review 2020
"Black swan" coronavirus casts its shadow over the global economy amid other political and economic uncertainties.
At this time of finalizing the BRS annual review, it is very difficult to assess the full impact of coronavirus on the shipping and shipbuilding industries. Airlines have suspended many flights, some factories and companies have sent staff home. In China and worldwide, the virus has taken its toll. With the coronavirus outbreak spreading far beyond its source in China, production is disrupted in the world’s second largest economy and far beyond. It is not impossible that the global economy will stagnate in Q1 2020, also factoring for the many political uncertainties hanging over our heads (trade wars - although the USA and China’s Phase One Agreement helped to ease tensions - BREXIT negotiations, a Trump election year, an extremely tense situation in the middle east, recession fears in certain European countries etc.).
New ordersAs a consequence of environmental pressure, it is expected that the shipping industry will give priority to eco or super-eco designs going forward. In principle vessel scrapping should rise in the near future, especially since we hardly saw it over the last years. Meanwhile, slow steaming should increase. Shipowners will probably adopt a cautious attitude in the first half of the year while they await more clarity on the impacts of IMO 2020, the prevailing freight market and the other political and economic uncertainties. As such, we estimate that between 60 and 70m dwt of tonnage could be ordered in 2020. It is also important to remind that in 2009 and 2016, the level of new orders were slightly above 30m dwt.
DeliveriesWe believe that there will be relatively little slippage and cancellation, and that deliveries in 2020 could reach a figure between 80m and 90m dwt
PERSPECTIVES FOR 2020
The industry is also struggling to keep a tally of the existing ships which are already or going to be fitted with scrubbers, and the ships under construction which might be equipped. According to our own records dated 1stJanuary 2020, about 7.6% of the existing and ships under construction were to be fitted with a scrubber and except for the cruise ship segment (37%) and the container carrier segment (13.6%), no other segment exceeds 10%. Generally speaking and due to economies of scale, the largest and fastest sizes in each individual segment have been the target for retrofitting. For instance, scrubbers will eventually be fitted on 31.5% of VLCCs, 58.4% of VLOCs and 81.3% of VLUCs.
Still, the vast majority of the shipowning community has decided to "wait and see" and is therefore to rely on compliant fuel with a sulphur content of 0.5% or less.
Early 2020, it seemed like the companies that had bet on scrubber technology and installed it before 1stJanuary 2020 might recover part or the whole of their investment in view of the large spread between 3.5% HSFO and 0.5% VLSFO prices that quickly reached about $200/tonne in October 2019 up to $300/ton in December 2019/January 2020, although it seems that the spread is coming down quickly in February 2020.
Scrubbers look to be a temporary fix and cannot be construed as the ultimate solution. They are designed to either use seawater to strip sulphur dioxide (SO2) from emissions with the resulting sulphurous water then discharged into the ocean (open loop), or to use caustic soda to strip sulphur from emissions, with the resultant sludge being deposited in an on-board storage tank which has to be periodically emptied in port (closed loop).
There remain unanswered questions regarding the longevity and ability of scrubbers to function properly. Can a mechanical system run and perform consistently 24/7/365 in a highly heated and highly corrosive environment? Also, can it reduce overall pollution when it consumes additional fuel (about 1 to 2 tons per day in case of continuous working for a Kamsarmax bulker). Finally, what are the short and long-term impacts on the marine environment of scrubber water discharge? In view of the fines that have already been imposed on several scrubber-fitted ships in some harbours for breach of emission limits, can shipowners rely on the technology to comply with increasingly stringent regulations?
There is also growing uncertainty over future strategy for national governments and local port authorities. Several have already decided to ban open-loop scrubbers, and the next logical question is what will be decided for closed-loop systems?
There are also several debates on the consistency of the IMO regulations (if Sox scrubbers are good for the atmosphere, are they good for the oceans? If BWTS are good for the oceans, are they good for the air because of the extra energy required?) or on the technological choices offered (is LNG a good solution because of current potential for methane slippage that is a more powerful GHG than CO2?).
On 1st Jan 2020,the vast majority of the fleet hadno scrubber
Rotterdam spread VLSFO/HSFO$/mt
Nov 2019 Dec 2019 Jan 2020 Feb 2020Oct 2019Oct 2019 Nov 2019 Dec 2019 Jan 2020 Feb 2020
0
50
100
150
200
250
300
350
$/Mt
Rotterdam Spread VLSFO/HSFO
Scrubber-Linked*
Vessels type Ships Million dwt
Bulk 800 122.9
Container 705 68.7
Cruise 131 1.3
Dry Cargo 66 0.9
Ferry 55 0.3
Gas 93 4.6
Reefer 5 0.08
Roro 115 2.2
Tanker** 944 134.7
Total 2,914 335.7
Active fleet % Scrubbers
Ships Million dwt Ships
11,778 867.8 6.8%
5,189 275.0 13.6%
354 2.3 37.0%
6,199 53.5 1.1%
1,084 3.8 5.1%
1,733 72.8 5.4%
505 3.9 1.0%
1,416 19.3 8.1%
10,198 635.4 9.3%
38,449 1,933.8 7.6%
*Including Delivered, on order and to be retrofitted **including chemical

Dry Bulk
From 0 to 1002019 was a tale of two halves as the dry bulk market faced the consequences of the Brumadinho dam failure early in the year, however with volumes picking up gradually and a significant amount of tonnage out for scrubber retrofitting, rates recovered swiftly to reach multi-year heights.
33
MINERAL SUBICCapesize bulk carrier, 179,397 dwt, delivered in 2011 by Hanjin Busan shipyard, owned by Bocimar.
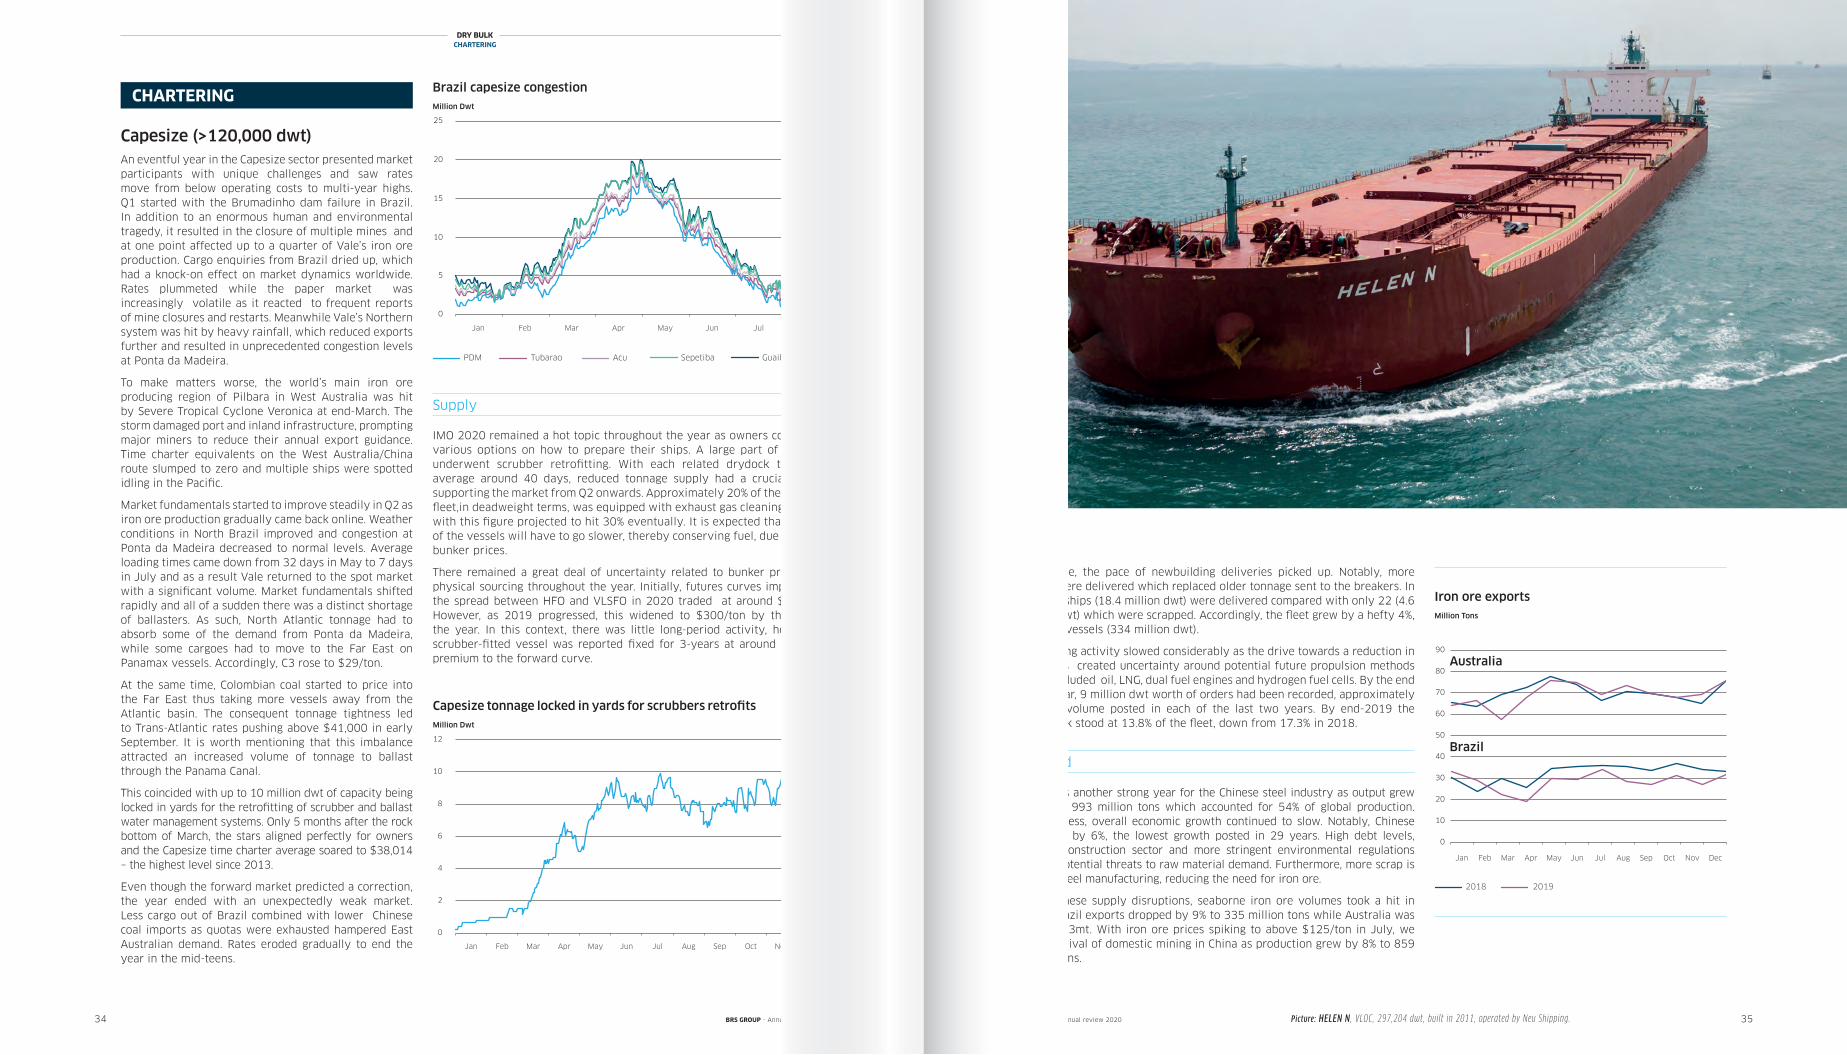
3534
DRY BULKCHARTERING
DRY BULKCHARTERING
Capesize (>120,000 dwt)An eventful year in the Capesize sector presented market participants with unique challenges and saw rates move from below operating costs to multi-year highs. Q1 started with the Brumadinho dam failure in Brazil. In addition to an enormous human and environmental tragedy, it resulted in the closure of multiple mines and at one point affected up to a quarter of Vale’s iron ore production. Cargo enquiries from Brazil dried up, which had a knock-on effect on market dynamics worldwide. Rates plummeted while the paper market was increasingly volatile as it reacted to frequent reports of mine closures and restarts. Meanwhile Vale’s Northern system was hit by heavy rainfall, which reduced exports further and resulted in unprecedented congestion levels at Ponta da Madeira.
To make matters worse, the world’s main iron ore producing region of Pilbara in West Australia was hit by Severe Tropical Cyclone Veronica at end-March. The storm damaged port and inland infrastructure, prompting major miners to reduce their annual export guidance. Time charter equivalents on the West Australia/China route slumped to zero and multiple ships were spotted idling in the Pacific.
Market fundamentals started to improve steadily in Q2 as iron ore production gradually came back online. Weather conditions in North Brazil improved and congestion at Ponta da Madeira decreased to normal levels. Average loading times came down from 32 days in May to 7 days in July and as a result Vale returned to the spot market with a significant volume. Market fundamentals shifted rapidly and all of a sudden there was a distinct shortage of ballasters. As such, North Atlantic tonnage had to absorb some of the demand from Ponta da Madeira, while some cargoes had to move to the Far East on Panamax vessels. Accordingly, C3 rose to $29/ton.
At the same time, Colombian coal started to price into the Far East thus taking more vessels away from the Atlantic basin. The consequent tonnage tightness led to Trans-Atlantic rates pushing above $41,000 in early September. It is worth mentioning that this imbalance attracted an increased volume of tonnage to ballast through the Panama Canal.
This coincided with up to 10 million dwt of capacity being locked in yards for the retrofitting of scrubber and ballast water management systems. Only 5 months after the rock bottom of March, the stars aligned perfectly for owners and the Capesize time charter average soared to $38,014 – the highest level since 2013.
Even though the forward market predicted a correction, the year ended with an unexpectedly weak market. Less cargo out of Brazil combined with lower Chinese coal imports as quotas were exhausted hampered East Australian demand. Rates eroded gradually to end the year in the mid-teens.
CHARTERING
Supply
IMO 2020 remained a hot topic throughout the year as owners considered various options on how to prepare their ships. A large part of the fleet underwent scrubber retrofitting. With each related drydock taking on average around 40 days, reduced tonnage supply had a crucial role in supporting the market from Q2 onwards. Approximately 20% of the Capesize fleet,in deadweight terms, was equipped with exhaust gas cleaning systems with this figure projected to hit 30% eventually. It is expected that the rest of the vessels will have to go slower, thereby conserving fuel, due to higher bunker prices.
There remained a great deal of uncertainty related to bunker pricing and physical sourcing throughout the year. Initially, futures curves implied that the spread between HFO and VLSFO in 2020 traded at around $200/ton. However, as 2019 progressed, this widened to $300/ton by the end of the year. In this context, there was little long-period activity, however a scrubber-fitted vessel was reported fixed for 3-years at around a $5,000 premium to the forward curve.
Meanwhile, the pace of newbuilding deliveries picked up. Notably, more VLOC’s were delivered which replaced older tonnage sent to the breakers. In total, 75 ships (18.4 million dwt) were delivered compared with only 22 (4.6 million dwt) which were scrapped. Accordingly, the fleet grew by a hefty 4%, to 1,647 vessels (334 million dwt).
Contracting activity slowed considerably as the drive towards a reduction in emissions created uncertainty around potential future propulsion methods which included oil, LNG, dual fuel engines and hydrogen fuel cells. By the end of the year, 9 million dwt worth of orders had been recorded, approximately half the volume posted in each of the last two years. By end-2019 the orderbook stood at 13.8% of the fleet, down from 17.3% in 2018.
Demand
2019 was another strong year for the Chinese steel industry as output grew by 7% to 993 million tons which accounted for 54% of global production. Nevertheless, overall economic growth continued to slow. Notably, Chinese GDP rose by 6%, the lowest growth posted in 29 years. High debt levels, slowing construction sector and more stringent environmental regulations remain potential threats to raw material demand. Furthermore, more scrap is used in steel manufacturing, reducing the need for iron ore.
Due to these supply disruptions, seaborne iron ore volumes took a hit in 2019. Brazil exports dropped by 9% to 335 million tons while Australia was flat at 843mt. With iron ore prices spiking to above $125/ton in July, we saw a revival of domestic mining in China as production grew by 8% to 859 million tons.
Brazil capesize congestionMillion Dwt
0
5
10
15
20
25
Jan Fev Mar Apr May Jun Jul Aug
Million dwt
Brazil Capesize Congestion
Tubarao Acu
0
5
10
15
20
25
30
35
40
Jan
Fev
Mar
Apr
May
Jun
Jul
Aug
Sep
Oct
Nov
Dec
2018 2019
Million ton
Brazil Iron Ore Exports
0
10
20
30
40
50
60
70
80
90
2018 2019
Million ton
Australia Iron Ore Exports
Jan
Fev
Mar
Apr
May
Jun
Jul
Aug
Sep
Oct
Nov
Dec
0
2
4
6
8
12
Jan Fev Mar Apr May Jun Jul Aug
Million dwt
Capesize Tonnage Locked in Yards for Retro�ts
10
Sep Oct Nov Dec
Sepetiba
Picture: HELEN N , VLOC, 297,204 dwt, built in 2011, operated by Neu Shipping.
Jan Feb AugJunApr JulMayMar
BRS GROUP - Annual review 2020 BRS GROUP - Annual review 2020
PDM Tubarao SepetibaAcu Guaiba
Capesize tonnage locked in yards for scrubbers retrofitsMillion Dwt
0
5
10
15
20
25
Jan Fev Mar Apr May Jun Jul Aug
Million dwt
Brazil Capesize Congestion
Tubarao Acu
0
5
10
15
20
25
30
35
40
Jan
Fev
Mar
Apr
May
Jun
Jul
Aug
Sep
Oct
Nov
Dec
2018 2019
Million ton
Brazil Iron Ore Exports
0
10
20
30
40
50
60
70
80
90
2018 2019
Million ton
Australia Iron Ore Exports
Jan
Fev
Mar
Apr
May
Jun
Jul
Aug
Sep
Oct
Nov
Dec
0
2
4
6
8
12
Jan Fev Mar Apr May Jun Jul Aug
Million dwt
Capesize Tonnage Locked in Yards for Retro�ts
10
Sep Oct Nov Dec
Sepetiba
Jan Feb AugJunApr JulMayMar DecOct NovSep
Jan Feb AugJunApr JulMayMar DecOct NovSep
2018 2019
Iron ore exportsMillion Tons
0
10
20
30
40
50
60
70
80
90
2018 2019
Million ton
Iron Ore Exports
Jan
Fev
Mar
Apr
May
Jun
Jul
Aug
Sep
Oct
Nov
Dec
Brazil
Australia Australia
Brazil
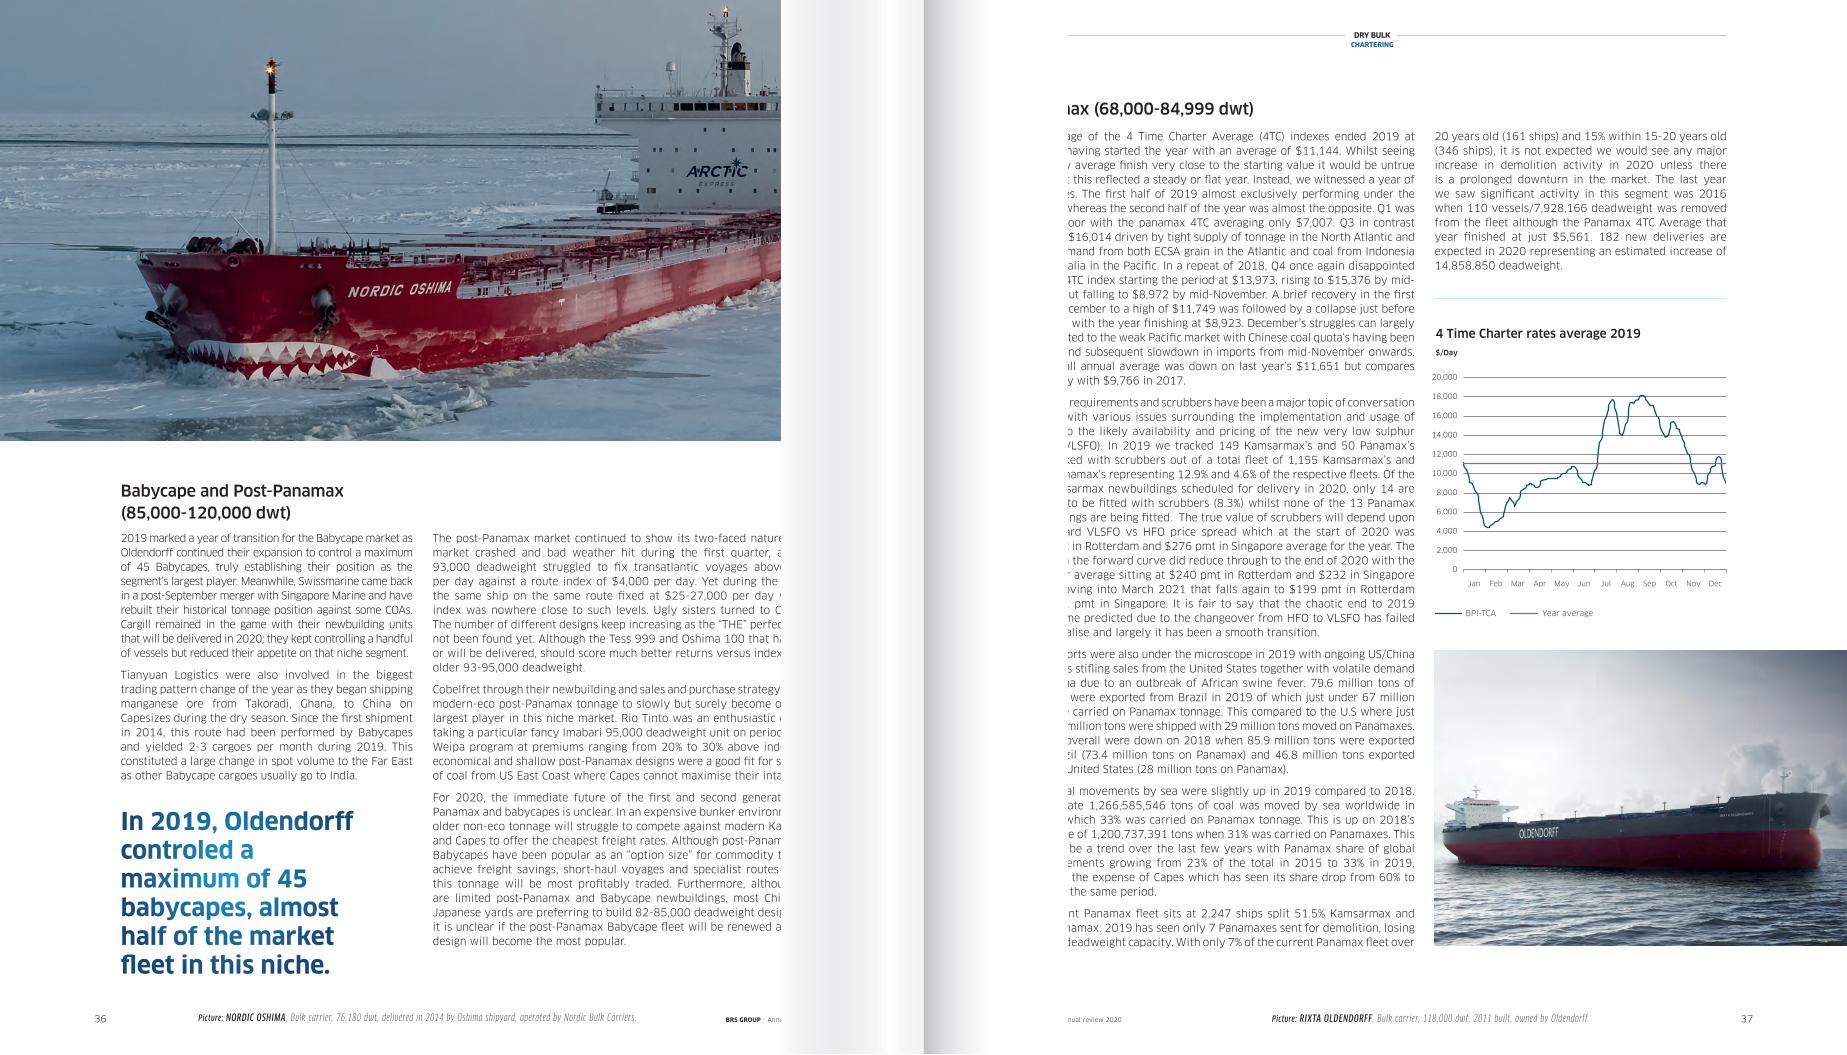
36 37
Babycape and Post-Panamax(85,000-120,000 dwt)2019 marked a year of transition for the Babycape market as Oldendorff continued their expansion to control a maximum of 45 Babycapes, truly establishing their position as the segment’s largest player. Meanwhile, Swissmarine came back in a post-September merger with Singapore Marine and have rebuilt their historical tonnage position against some COAs. Cargill remained in the game with their newbuilding units that will be delivered in 2020; they kept controlling a handful of vessels but reduced their appetite on that niche segment.
Tianyuan Logistics were also involved in the biggest trading pattern change of the year as they began shipping manganese ore from Takoradi, Ghana, to China on Capesizes during the dry season. Since the first shipment in 2014, this route had been performed by Babycapes and yielded 2-3 cargoes per month during 2019. This constituted a large change in spot volume to the Far East as other Babycape cargoes usually go to India.
The post-Panamax market continued to show its two-faced nature. As the market crashed and bad weather hit during the first quarter, a Chinese 93,000 deadweight struggled to fix transatlantic voyages above $1,000 per day against a route index of $4,000 per day. Yet during the Q3 push, the same ship on the same route fixed at $25-27,000 per day when the index was nowhere close to such levels. Ugly sisters turned to Cinderella. The number of different designs keep increasing as the “THE” perfect one has not been found yet. Although the Tess 999 and Oshima 100 that have been, or will be delivered, should score much better returns versus index than the older 93-95,000 deadweight.
Cobelfret through their newbuilding and sales and purchase strategy, acquired modern-eco post-Panamax tonnage to slowly but surely become one of the largest player in this niche market. Rio Tinto was an enthusiastic charterer, taking a particular fancy Imabari 95,000 deadweight unit on period for their Weipa program at premiums ranging from 20% to 30% above index. These economical and shallow post-Panamax designs were a good fit for shipments of coal from US East Coast where Capes cannot maximise their intake.
For 2020, the immediate future of the first and second generation post-Panamax and babycapes is unclear. In an expensive bunker environment, this older non-eco tonnage will struggle to compete against modern Kamsarmax and Capes to offer the cheapest freight rates. Although post-Panamaxes and Babycapes have been popular as an “option size” for commodity traders to achieve freight savings, short-haul voyages and specialist routes is where this tonnage will be most profitably traded. Furthermore, although there are limited post-Panamax and Babycape newbuildings, most Chinese and Japanese yards are preferring to build 82-85,000 deadweight designs. Thus, it is unclear if the post-Panamax Babycape fleet will be renewed and which design will become the most popular.
Panamax (68,000-84,999 dwt)
The average of the 4 Time Charter Average (4TC) indexes ended 2019 at $11,111 having started the year with an average of $11,144. Whilst seeing the yearly average finish very close to the starting value it would be untrue to suggest this reflected a steady or flat year. Instead, we witnessed a year of two halves. The first half of 2019 almost exclusively performing under the average, whereas the second half of the year was almost the opposite. Q1 was notably poor with the panamax 4TC averaging only $7,007. Q3 in contrast averaged $16,014 driven by tight supply of tonnage in the North Atlantic and strong demand from both ECSA grain in the Atlantic and coal from Indonesia and Australia in the Pacific. In a repeat of 2018, Q4 once again disappointed with the 4TC index starting the period at $13,973, rising to $15,376 by mid-October but falling to $8,972 by mid-November. A brief recovery in the first half of December to a high of $11,749 was followed by a collapse just before Christmas with the year finishing at $8,923. December’s struggles can largely be attributed to the weak Pacific market with Chinese coal quota’s having been reached and subsequent slowdown in imports from mid-November onwards. The overall annual average was down on last year’s $11,651 but compares favourably with $9,766 in 2017.
2020 fuel requirements and scrubbers have been a major topic of conversation in 2019 with various issues surrounding the implementation and usage of same, also the likely availability and pricing of the new very low sulphur fuel oil (VLSFO). In 2019 we tracked 149 Kamsarmax’s and 50 Panamax’s being linked with scrubbers out of a total fleet of 1,155 Kamsarmax’s and 1,092 Panamax’s representing 12.9% and 4.6% of the respective fleets. Of the 169 Kamsarmax newbuildings scheduled for delivery in 2020, only 14 are reported to be fitted with scrubbers (8.3%) whilst none of the 13 Panamax newbuildings are being fitted. The true value of scrubbers will depend upon the forward VLSFO vs HFO price spread which at the start of 2020 was $270 pmt in Rotterdam and $276 pmt in Singapore average for the year. The spread on the forward curve did reduce through to the end of 2020 with the December average sitting at $240 pmt in Rotterdam and $232 in Singapore whilst moving into March 2021 that falls again to $199 pmt in Rotterdam and $191 pmt in Singapore. It is fair to say that the chaotic end to 2019 which some predicted due to the changeover from HFO to VLSFO has failed to materialise and largely it has been a smooth transition.
Grain exports were also under the microscope in 2019 with ongoing US/China trade talks stifling sales from the United States together with volatile demand from China due to an outbreak of African swine fever. 79.6 million tons of soybeans were exported from Brazil in 2019 of which just under 67 million tons were carried on Panamax tonnage. This compared to the U.S where just under 43 million tons were shipped with 29 million tons moved on Panamaxes. Volumes overall were down on 2018 when 85.9 million tons were exported from Brazil (73.4 million tons on Panamax) and 46.8 million tons exported from the United States (28 million tons on Panamax).
Global coal movements by sea were slightly up in 2019 compared to 2018. We estimate 1,266,585,546 tons of coal was moved by sea worldwide in 2019 of which 33% was carried on Panamax tonnage. This is up on 2018’s final figure of 1,200,737,391 tons when 31% was carried on Panamaxes. This seems to be a trend over the last few years with Panamax share of global coal movements growing from 23% of the total in 2015 to 33% in 2019, mainly at the expense of Capes which has seen its share drop from 60% to 42% over the same period.
The current Panamax fleet sits at 2,247 ships split 51.5% Kamsarmax and 48.5% Panamax. 2019 has seen only 7 Panamaxes sent for demolition, losing 513,099 deadweight capacity. With only 7% of the current Panamax fleet over
20 years old (161 ships) and 15% within 15-20 years old (346 ships), it is not expected we would see any major increase in demolition activity in 2020 unless there is a prolonged downturn in the market. The last year we saw significant activity in this segment was 2016 when 110 vessels/7,928,166 deadweight was removed from the fleet although the Panamax 4TC Average that year finished at just $5,561. 182 new deliveries are expected in 2020 representing an estimated increase of 14,858,850 deadweight.
DRY BULKCHARTERING
BRS GROUP - Annual review 2020 BRS GROUP - Annual review 2020Picture: NORDIC OSHIMA , Bulk carrier, 76,180 dwt, delivered in 2014 by Oshima shipyard, operated by Nordic Bulk Carriers.
4 Time Charter rates average 2019$/Day
BPI-TCA Year Average
$/day
Panamax 4TC rates and average 2019
Jan
Fev
Mar
Apr
May
Jun
Jul
Aug
Sep
Oct
Nov
Dec
0
2,000
4,000
6,000
8,000
10,000
12,000
14,000
16,000
20,000
18,000
Jan Feb AugJunApr JulMayMar DecOct NovSep
BPI-TCA Year average
Picture: RIXTA OLDENDORFF , Bulk carrier, 118,000 dwt, 2011 built, owned by Oldendorff.
In 2019, Oldendorff controled a maximum of 45 babycapes, almost half of the market fleet in this niche.
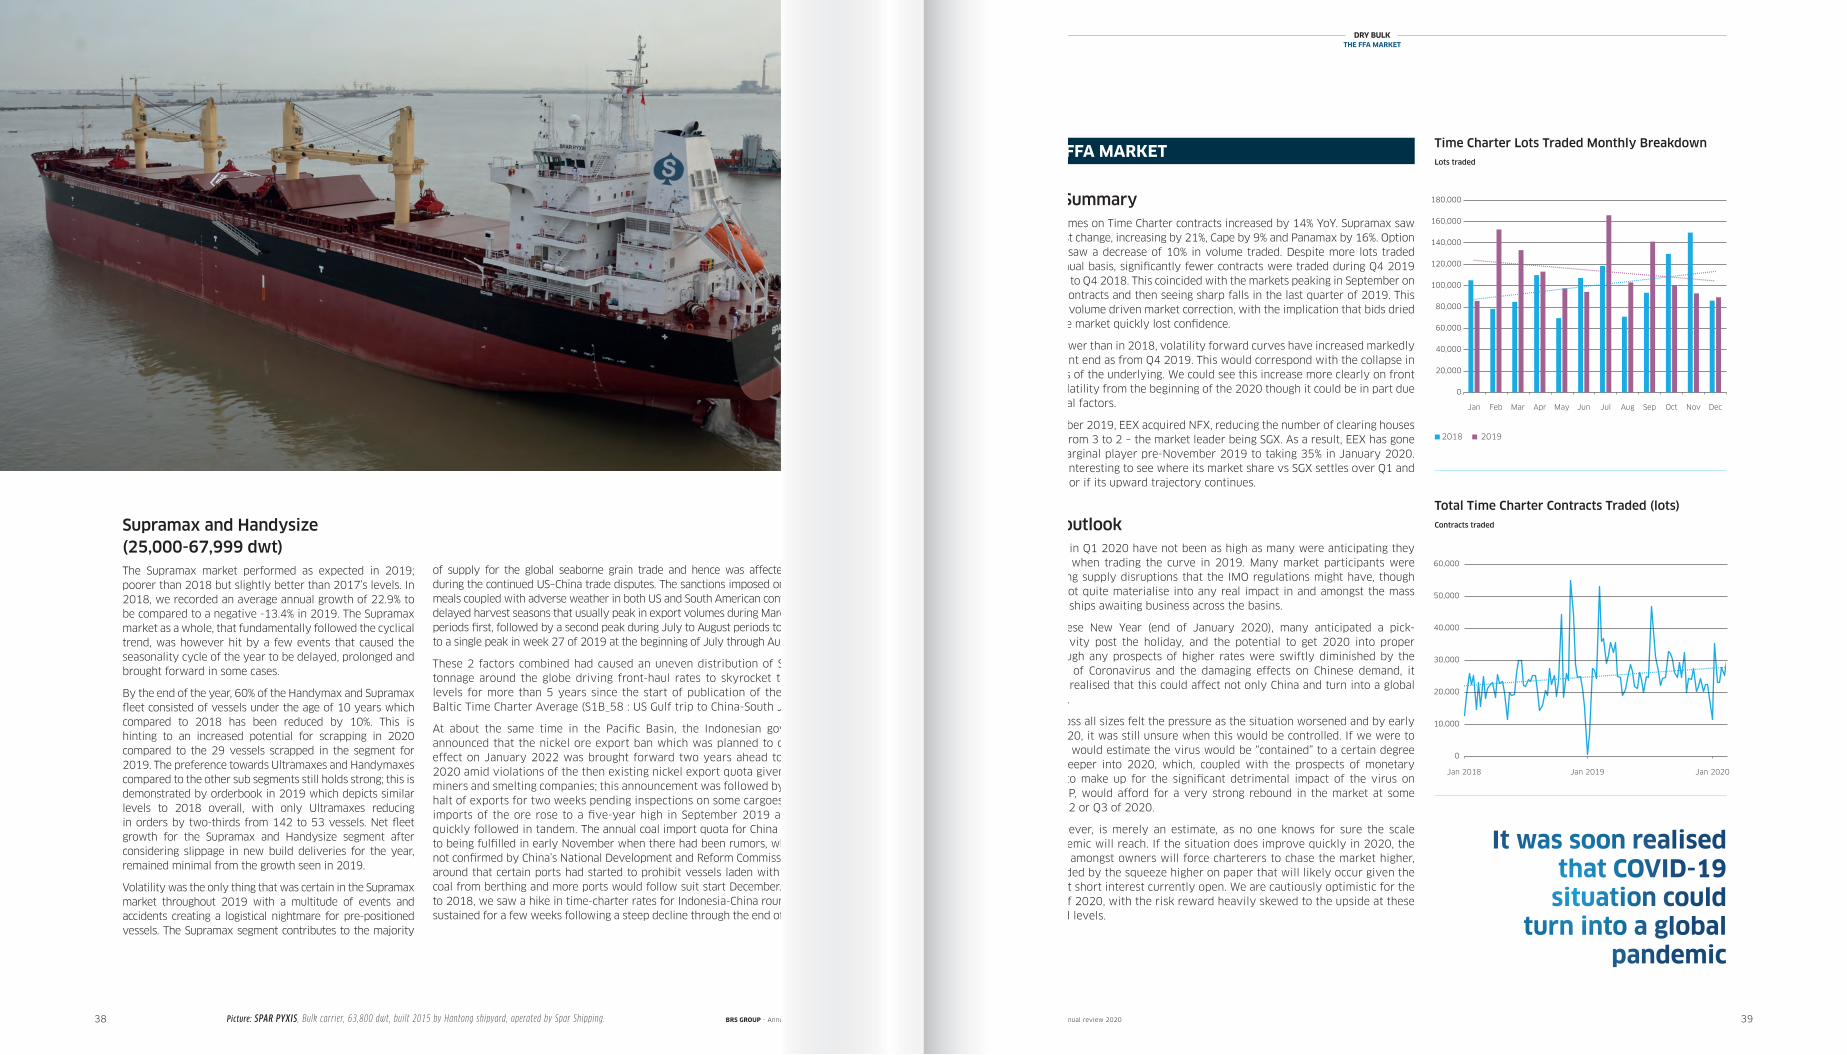
Picture: SPAR PYXIS , Bulk carrier, 63,800 dwt, built 2015 by Hantong shipyard, operated by Spar Shipping.38 39
DRY BULKTHE FFA MARKET
Supramax and Handysize (25,000-67,999 dwt)The Supramax market performed as expected in 2019; poorer than 2018 but slightly better than 2017’s levels. In 2018, we recorded an average annual growth of 22.9% to be compared to a negative -13.4% in 2019. The Supramax market as a whole, that fundamentally followed the cyclical trend, was however hit by a few events that caused the seasonality cycle of the year to be delayed, prolonged and brought forward in some cases.
By the end of the year, 60% of the Handymax and Supramax fleet consisted of vessels under the age of 10 years which compared to 2018 has been reduced by 10%. This is hinting to an increased potential for scrapping in 2020 compared to the 29 vessels scrapped in the segment for 2019. The preference towards Ultramaxes and Handymaxes compared to the other sub segments still holds strong; this is demonstrated by orderbook in 2019 which depicts similar levels to 2018 overall, with only Ultramaxes reducing in orders by two-thirds from 142 to 53 vessels. Net fleet growth for the Supramax and Handysize segment after considering slippage in new build deliveries for the year, remained minimal from the growth seen in 2019.
Volatility was the only thing that was certain in the Supramax market throughout 2019 with a multitude of events and accidents creating a logistical nightmare for pre-positioned vessels. The Supramax segment contributes to the majority
of supply for the global seaborne grain trade and hence was affected heavily during the continued US–China trade disputes. The sanctions imposed on soybean meals coupled with adverse weather in both US and South American continent had delayed harvest seasons that usually peak in export volumes during March to April periods first, followed by a second peak during July to August periods to converge to a single peak in week 27 of 2019 at the beginning of July through August.
These 2 factors combined had caused an uneven distribution of Supramax tonnage around the globe driving front-haul rates to skyrocket to highest levels for more than 5 years since the start of publication of the relevant Baltic Time Charter Average (S1B_58 : US Gulf trip to China-South Japan).
At about the same time in the Pacific Basin, the Indonesian government announced that the nickel ore export ban which was planned to come into effect on January 2022 was brought forward two years ahead to January 2020 amid violations of the then existing nickel export quota given to some miners and smelting companies; this announcement was followed by a partial halt of exports for two weeks pending inspections on some cargoes. Chinese imports of the ore rose to a five-year high in September 2019 and prices quickly followed in tandem. The annual coal import quota for China was close to being fulfilled in early November when there had been rumors, which were not confirmed by China’s National Development and Reform Commission, going around that certain ports had started to prohibit vessels laden with imported coal from berthing and more ports would follow suit start December. Similarly to 2018, we saw a hike in time-charter rates for Indonesia-China rounds which sustained for a few weeks following a steep decline through the end of the year.
2019 Summary Total Volumes on Time Charter contracts increased by 14% YoY. Supramax saw the biggest change, increasing by 21%, Cape by 9% and Panamax by 16%. Option contracts saw a decrease of 10% in volume traded. Despite more lots traded on an annual basis, significantly fewer contracts were traded during Q4 2019 compared to Q4 2018. This coincided with the markets peaking in September on all three contracts and then seeing sharp falls in the last quarter of 2019. This was not a volume driven market correction, with the implication that bids dried up and the market quickly lost confidence.
Slightly lower than in 2018, volatility forward curves have increased markedly on the front end as from Q4 2019. This would correspond with the collapse in the values of the underlying. We could see this increase more clearly on front month volatility from the beginning of the 2020 though it could be in part due to seasonal factors.
In November 2019, EEX acquired NFX, reducing the number of clearing houses for FFAs from 3 to 2 – the market leader being SGX. As a result, EEX has gone from a marginal player pre-November 2019 to taking 35% in January 2020. It will be interesting to see where its market share vs SGX settles over Q1 and Q2 2020, or if its upward trajectory continues.
2020 outlook
The rates in Q1 2020 have not been as high as many were anticipating they would be when trading the curve in 2019. Many market participants were anticipating supply disruptions that the IMO regulations might have, though this did not quite materialise into any real impact in and amongst the mass supply of ships awaiting business across the basins.
Into Chinese New Year (end of January 2020), many anticipated a pick-up in activity post the holiday, and the potential to get 2020 into proper gear. Though any prospects of higher rates were swiftly diminished by the spreading of Coronavirus and the damaging effects on Chinese demand, it was soon realised that this could affect not only China and turn into a global pandemic.
Rates across all sizes felt the pressure as the situation worsened and by early March 2020, it was still unsure when this would be controlled. If we were to guess, we would estimate the virus would be “contained” to a certain degree moving deeper into 2020, which, coupled with the prospects of monetary stimulus to make up for the significant detrimental impact of the virus on global GDP, would afford for a very strong rebound in the market at some stage in Q2 or Q3 of 2020.
This, however, is merely an estimate, as no one knows for sure the scale this pandemic will reach. If the situation does improve quickly in 2020, the optimism amongst owners will force charterers to chase the market higher, compounded by the squeeze higher on paper that will likely occur given the significant short interest currently open. We are cautiously optimistic for the balance of 2020, with the risk reward heavily skewed to the upside at these supressed levels.
THE FFA MARKETTime Charter Lots Traded Monthly BreakdownLots traded
Total Time Charter Contracts Traded (lots)
BRS GROUP - Annual review 2020 BRS GROUP - Annual review 2020
It was soon realised that COVID-19
situation could turn into a global
pandemic
Lots
TC Lots Traded Monthly Breakdown
Jan
Fev
Mar
Apr
May
Jun
Jul
Aug
Sep
Oct
Nov
Dec
0
20,000
40,000
60,000
80,000
100,000
120,000
140,000
160,000
180,000
2018 2019
Contracts
Total TC Contracts Traded (lots)
0
10,000
20,000
30,000
40,000
50,000
60,000
Jan 2018 Jan 2019 Jan 2020Jan Feb AugJunApr JulMayMar DecOct NovSep
2018 2019
Contracts traded
Lots
TC Lots Traded Monthly Breakdown
Jan
Fev
Mar
Apr
May
Jun
Jul
Aug
Sep
Oct
Nov
Dec
0
20,000
40,000
60,000
80,000
100,000
120,000
140,000
160,000
180,000
2018 2019
Contracts
Total TC Contracts Traded (lots)
0
10,000
20,000
30,000
40,000
50,000
60,000
Jan 2018 Jan 2019 Jan 2020Jan 2018 Jan 2020Jan 2019
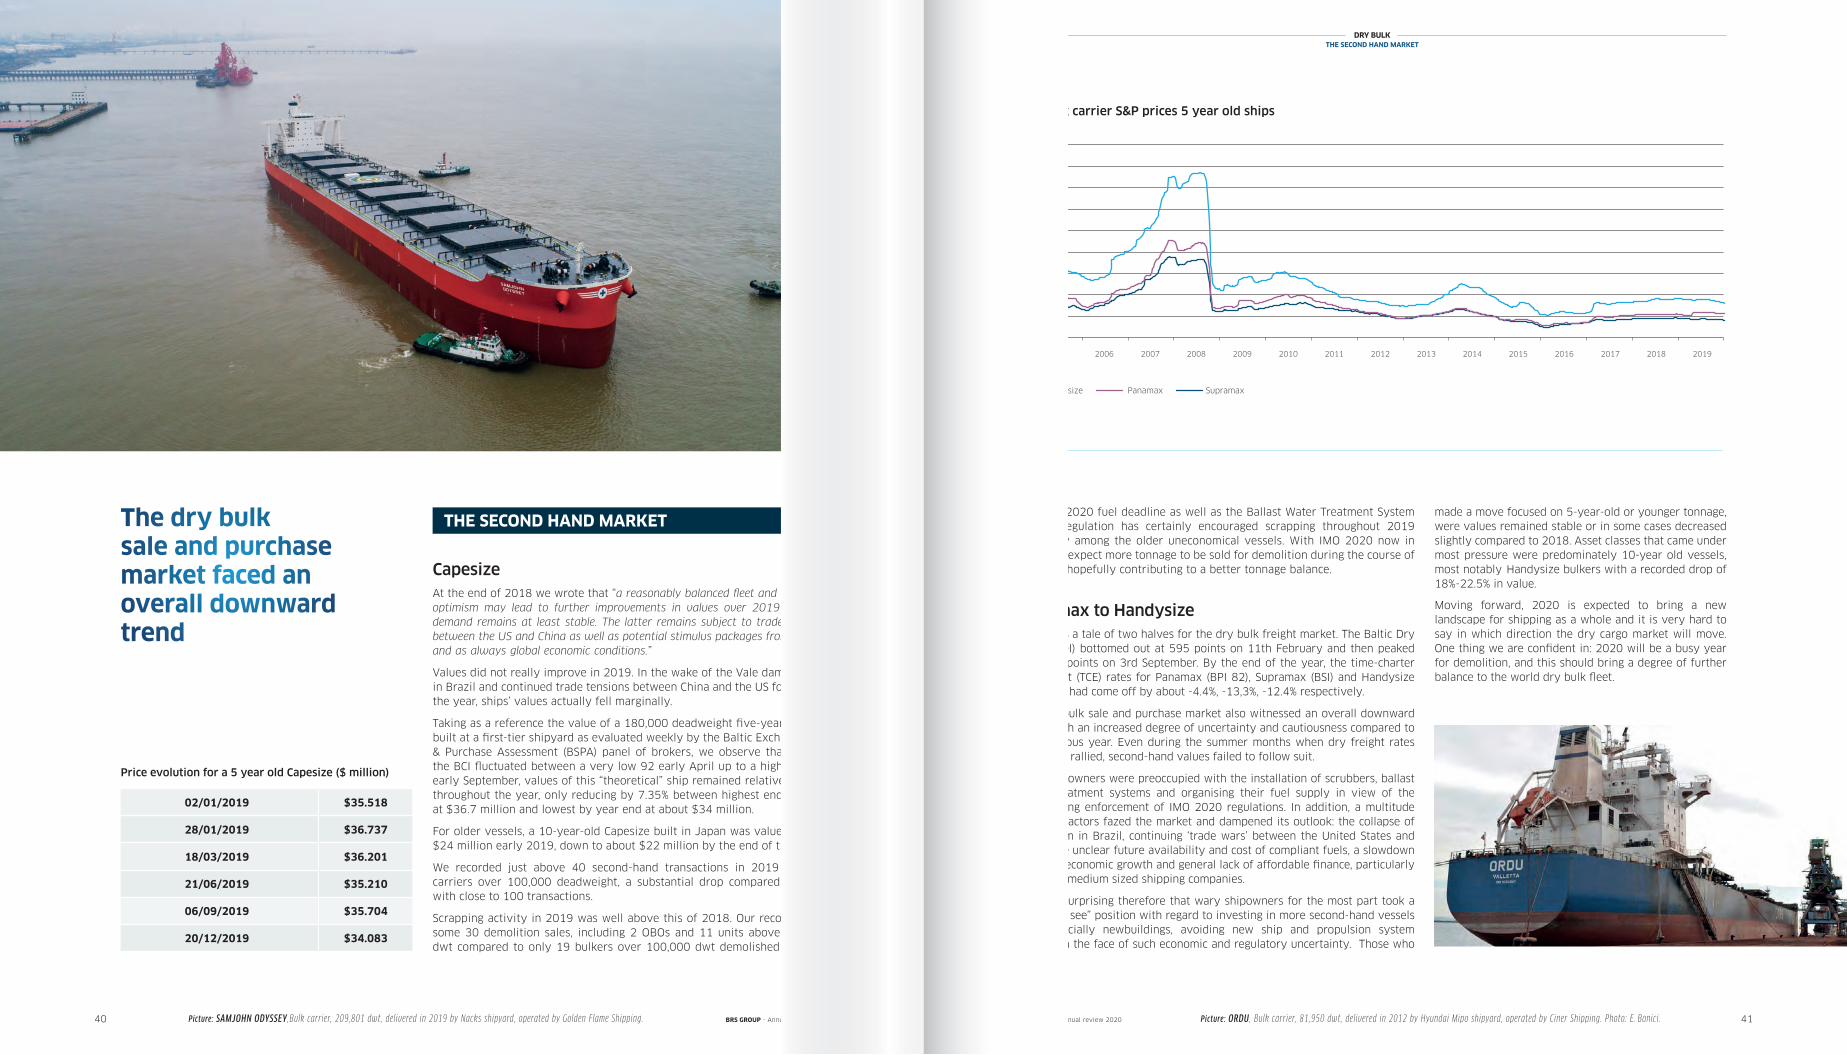
DRY BULKTHE SECOND HAND MARKET
40 41
Capesize At the end of 2018 we wrote that “a reasonably balanced fleet and measured optimism may lead to further improvements in values over 2019 provided demand remains at least stable. The latter remains subject to trade tensions between the US and China as well as potential stimulus packages from Beijing, and as always global economic conditions.”
Values did not really improve in 2019. In the wake of the Vale dam collapse in Brazil and continued trade tensions between China and the US for most of the year, ships’ values actually fell marginally.
Taking as a reference the value of a 180,000 deadweight five-year-old ship built at a first-tier shipyard as evaluated weekly by the Baltic Exchange Sale & Purchase Assessment (BSPA) panel of brokers, we observe that even if the BCI fluctuated between a very low 92 early April up to a high of 5043 early September, values of this “theoretical” ship remained relatively stable throughout the year, only reducing by 7.35% between highest end-January at $36.7 million and lowest by year end at about $34 million.
For older vessels, a 10-year-old Capesize built in Japan was valued around $24 million early 2019, down to about $22 million by the end of the year.
We recorded just above 40 second-hand transactions in 2019 for bulk carriers over 100,000 deadweight, a substantial drop compared to 2018 with close to 100 transactions.
Scrapping activity in 2019 was well above this of 2018. Our records show some 30 demolition sales, including 2 OBOs and 11 units above 200,000 dwt compared to only 19 bulkers over 100,000 dwt demolished in 2018.
THE SECOND HAND MARKET
02/01/2019 $35.518
28/01/2019 $36.737
18/03/2019 $36.201
21/06/2019 $35.210
06/09/2019 $35.704
20/12/2019 $34.083
The IMO 2020 fuel deadline as well as the Ballast Water Treatment System (BWTS) regulation has certainly encouraged scrapping throughout 2019 especially among the older uneconomical vessels. With IMO 2020 now in force, we expect more tonnage to be sold for demolition during the course of the year, hopefully contributing to a better tonnage balance.
Panamax to Handysize 2019 was a tale of two halves for the dry bulk freight market. The Baltic Dry Index (BDI) bottomed out at 595 points on 11th February and then peaked at 2,501 points on 3rd September. By the end of the year, the time-charter equivalent (TCE) rates for Panamax (BPI 82), Supramax (BSI) and Handysize (BHSI 38) had come off by about -4.4%, -13,3%, -12.4% respectively.
The dry bulk sale and purchase market also witnessed an overall downward trend, with an increased degree of uncertainty and cautiousness compared to the previous year. Even during the summer months when dry freight rates unusually rallied, second-hand values failed to follow suit.
Most shipowners were preoccupied with the installation of scrubbers, ballast water treatment systems and organising their fuel supply in view of the forthcoming enforcement of IMO 2020 regulations. In addition, a multitude of other factors fazed the market and dampened its outlook: the collapse of Vale’s dam in Brazil, continuing ‘trade wars’ between the United States and China, the unclear future availability and cost of compliant fuels, a slowdown in global economic growth and general lack of affordable finance, particularly for small/medium sized shipping companies.
It is not surprising therefore that wary shipowners for the most part took a “wait and see” position with regard to investing in more second-hand vessels and especially newbuildings, avoiding new ship and propulsion system designs in the face of such economic and regulatory uncertainty. Those who
The dry bulk sale and purchase market faced an overall downward trend
Price evolution for a 5 year old Capesize ($ million)
Picture: ORDU , Bulk carrier, 81,950 dwt, delivered in 2012 by Hyundai Mipo shipyard, operated by Ciner Shipping. Photo: E. Bonici.BRS GROUP - Annual review 2020 BRS GROUP - Annual review 2020Picture: SAMJOHN ODYSSEY ,Bulk carrier, 209,801 dwt, delivered in 2019 by Nacks shipyard, operated by Golden Flame Shipping.
Dry bulk carrier S&P prices 5 year old shipsMillion $
$/day
Dry bulk FFA rates by segment
Capesize BCI 5TC Panamax BPI - TCA Supramax BSI58 - TCA
0
5,000
10,000
15,000
20,000
25,000
30,000
35,000
0
100,000
200,000
300,000
400,000
500,000
600,000
Capesize Panamax Supramax
Lots Traded
Dry bulk FFA volumes by segment
2017 2018
Million $
Dry Bulk Carrier S&P Prices - 5 years
Capesize Panamax Supramax
2013 2014 2015 2016 2017 20182007 2008 2009 2010 2011 20122005 2006 2019
0
20
40
60
80
100
120
140
160
180
0
100
200
300
400
600
800
2019
$/ldt
Dry Bulk Carrier Demolition Prices
Subcontinent
1995 1999 2003 2007 20152011
500
700
Capesize Panamax Supramax
2013 2014 2015 2016 2017 20182007 2008 2009 2010 2011 20122005 2006 2019
DRY BULKTHE SECOND HAND MARKET
made a move focused on 5-year-old or younger tonnage, were values remained stable or in some cases decreased slightly compared to 2018. Asset classes that came under most pressure were predominately 10-year old vessels, most notably Handysize bulkers with a recorded drop of 18%-22.5% in value.
Moving forward, 2020 is expected to bring a new landscape for shipping as a whole and it is very hard to say in which direction the dry cargo market will move. One thing we are confident in: 2020 will be a busy year for demolition, and this should bring a degree of further balance to the world dry bulk fleet.
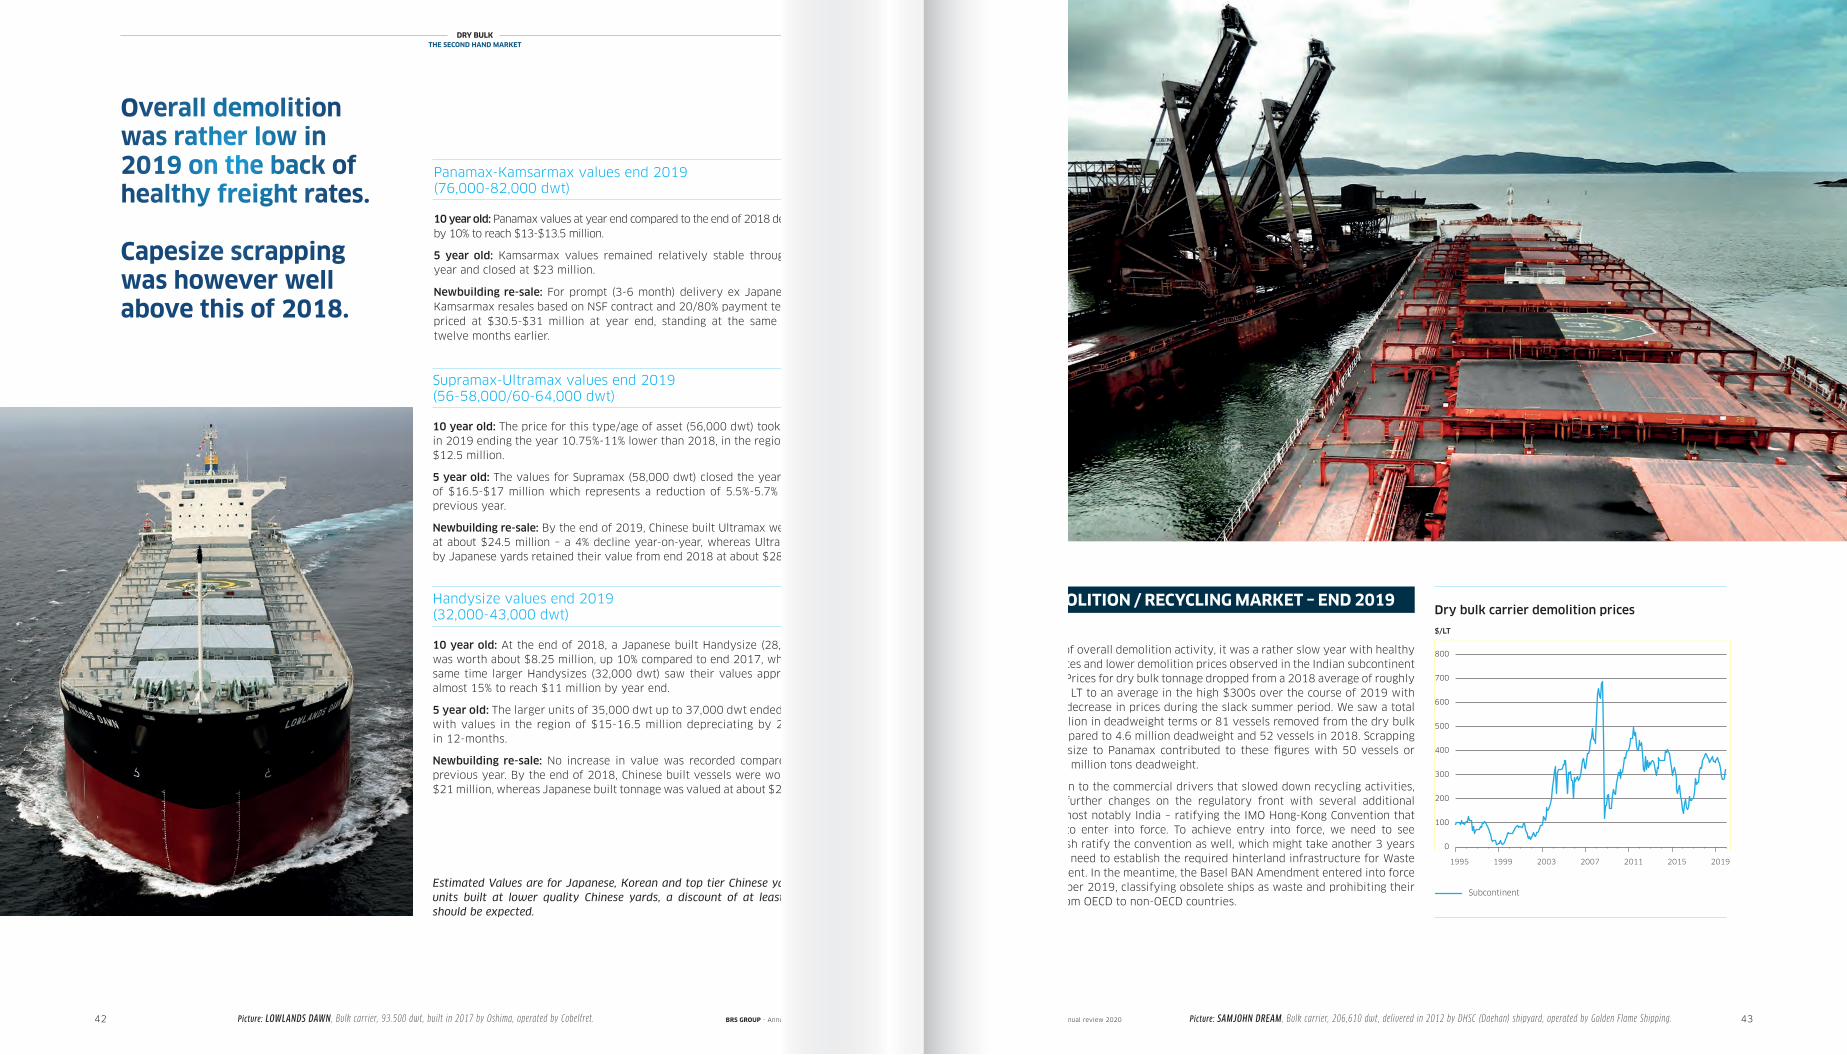
42 43
Supramax-Ultramax values end 2019(56-58,000/60-64,000 dwt)
10 year old: The price for this type/age of asset (56,000 dwt) took a tumble in 2019 ending the year 10.75%-11% lower than 2018, in the region of $12-$12.5 million.
5 year old: The values for Supramax (58,000 dwt) closed the year at levels of $16.5-$17 million which represents a reduction of 5.5%-5.7% from the previous year.
Newbuilding re-sale: By the end of 2019, Chinese built Ultramax were priced at about $24.5 million – a 4% decline year-on-year, whereas Ultramax built by Japanese yards retained their value from end 2018 at about $28 million.
Handysize values end 2019(32,000-43,000 dwt)
10 year old: At the end of 2018, a Japanese built Handysize (28,000 dwt) was worth about $8.25 million, up 10% compared to end 2017, while at the same time larger Handysizes (32,000 dwt) saw their values appreciate by almost 15% to reach $11 million by year end.
5 year old: The larger units of 35,000 dwt up to 37,000 dwt ended the year with values in the region of $15-16.5 million depreciating by 2.9%-3.2% in 12-months.
Newbuilding re-sale: No increase in value was recorded compared to the previous year. By the end of 2018, Chinese built vessels were worth about $21 million, whereas Japanese built tonnage was valued at about $23 million.
Overall demolition was rather low in 2019 on the back of healthy freight rates.
Capesize scrapping was however well above this of 2018.
DRY BULKTHE SECOND HAND MARKET
Picture: SAMJOHN DREAM , Bulk carrier, 206,610 dwt, delivered in 2012 by DHSC (Daehan) shipyard, operated by Golden Flame Shipping.Picture: LOWLANDS DAWN , Bulk carrier, 93.500 dwt, built in 2017 by Oshima, operated by Cobelfret.
Estimated Values are for Japanese, Korean and top tier Chinese yards – for units built at lower quality Chinese yards, a discount of at least 10-15% should be expected.
BRS GROUP - Annual review 2020 BRS GROUP - Annual review 2020
Panamax-Kamsarmax values end 2019(76,000-82,000 dwt)
10 year old: Panamax values at year end compared to the end of 2018 depreciated by 10% to reach $13-$13.5 million.
5 year old: Kamsarmax values remained relatively stable throughout the year and closed at $23 million.
Newbuilding re-sale: For prompt (3-6 month) delivery ex Japanese yards, Kamsarmax resales based on NSF contract and 20/80% payment terms were priced at $30.5-$31 million at year end, standing at the same levels as twelve months earlier.
Dry bulk carrier demolition prices
$/LT
In terms of overall demolition activity, it was a rather slow year with healthy freight rates and lower demolition prices observed in the Indian subcontinent markets. Prices for dry bulk tonnage dropped from a 2018 average of roughly $420 per LT to an average in the high $300s over the course of 2019 with a severe decrease in prices during the slack summer period. We saw a total of 7.8 million in deadweight terms or 81 vessels removed from the dry bulk fleet, compared to 4.6 million deadweight and 52 vessels in 2018. Scrapping of Handysize to Panamax contributed to these figures with 50 vessels or about 1.9 million tons deadweight.
In addition to the commercial drivers that slowed down recycling activities, we saw further changes on the regulatory front with several additional states – most notably India – ratifying the IMO Hong-Kong Convention that has still to enter into force. To achieve entry into force, we need to see Bangladesh ratify the convention as well, which might take another 3 years given the need to establish the required hinterland infrastructure for Waste management. In the meantime, the Basel BAN Amendment entered into force in December 2019, classifying obsolete ships as waste and prohibiting their export from OECD to non-OECD countries.
DEMOLITION / RECYCLING MARKET – END 2019
$/day
Dry bulk FFA rates by segment
Capesize BCI 5TC Panamax BPI - TCA Supramax BSI58 - TCA
0
5,000
10,000
15,000
20,000
25,000
30,000
35,000
0
100,000
200,000
300,000
400,000
500,000
600,000
Capesize Panamax Supramax
Lots Traded
Dry bulk FFA volumes by segment
2017 2018
Million $
Dry Bulk Carrier S&P Prices - 5 years
Capesize Panamax Supramax
2013 2014 2015 2016 2017 20182007 2008 2009 2010 2011 20122005 2006 2019
0
20
40
60
80
100
120
140
160
180
0
100
200
300
400
600
800
2019
$/ldt
Dry Bulk Carrier Demolition Prices
Subcontinent
1995 1999 2003 2007 20152011
500
700
Subcontinent
1995 1999 2003 2007 201920152011
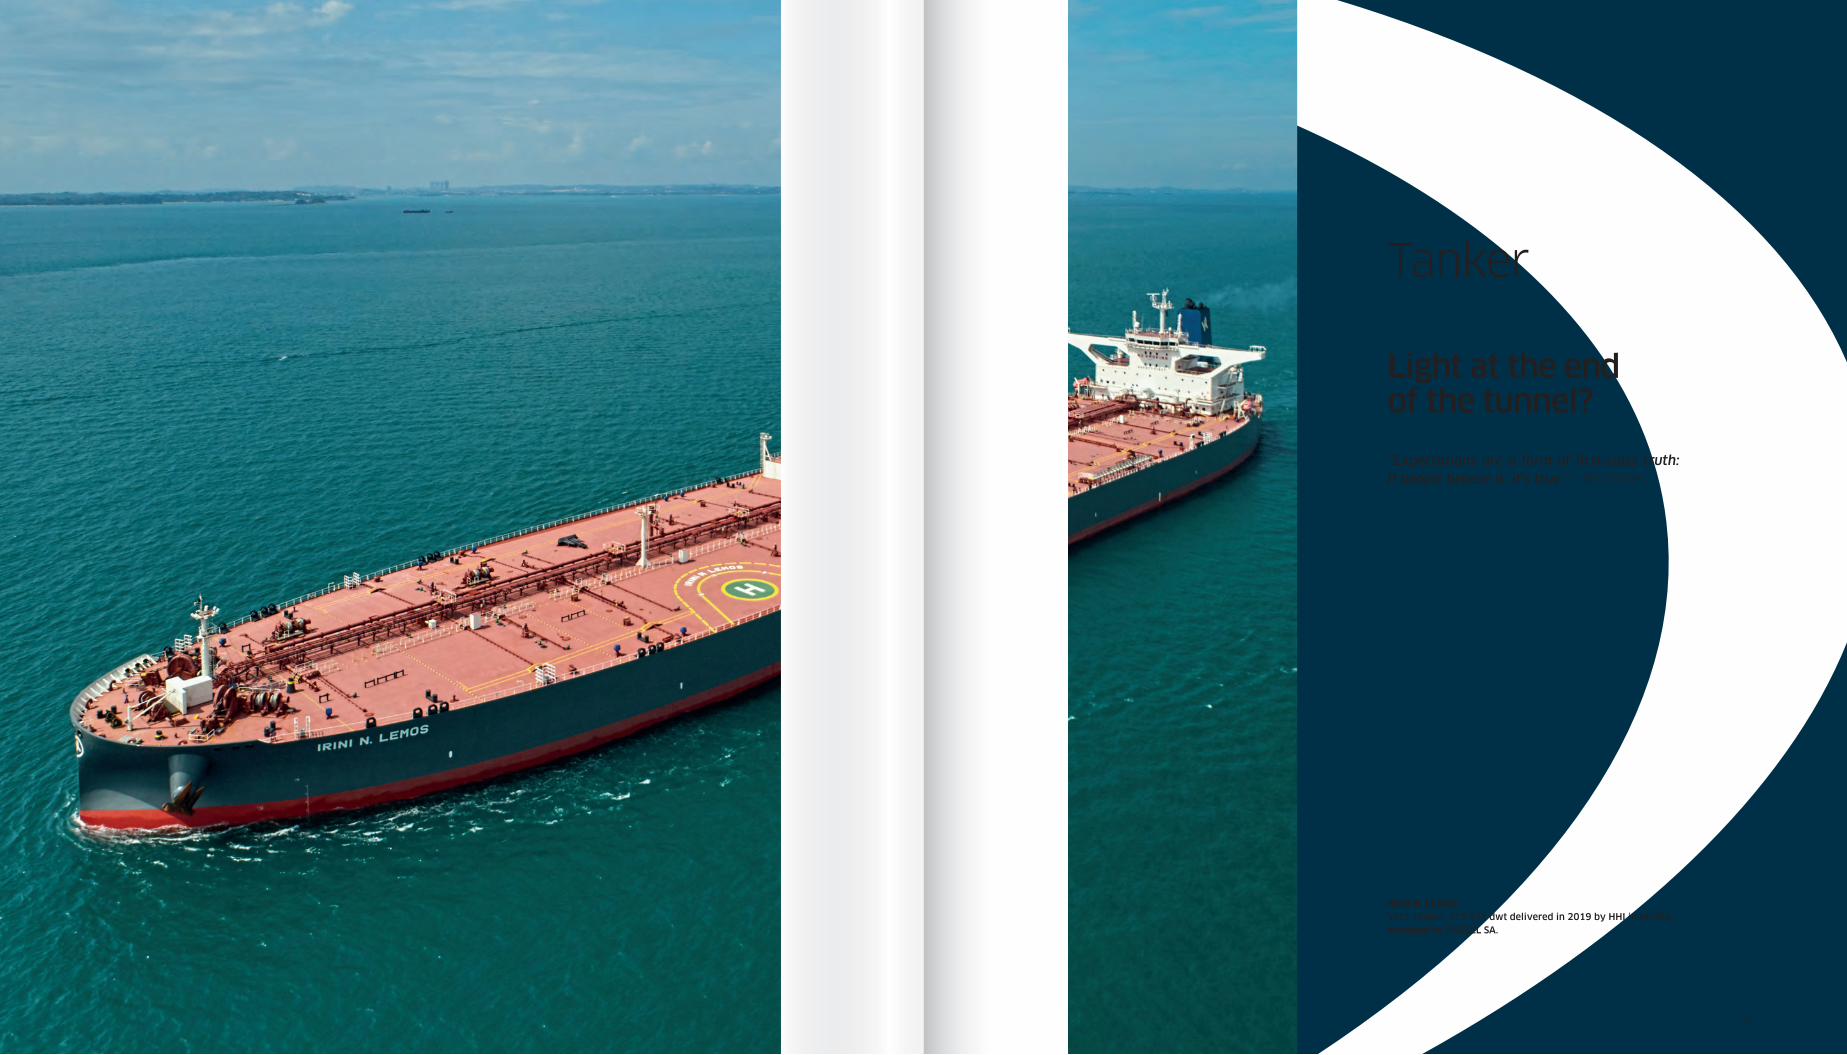
Tanker
45
Light at the end of the tunnel?
“Expectations are a form of first-class truth: If people believe it, it's true.” - Bill Gates.
IRINI N. LEMOSVLCC Tanker, 319,191 dwt delivered in 2019 by HHI in KOREA, managed by ENESEL SA.
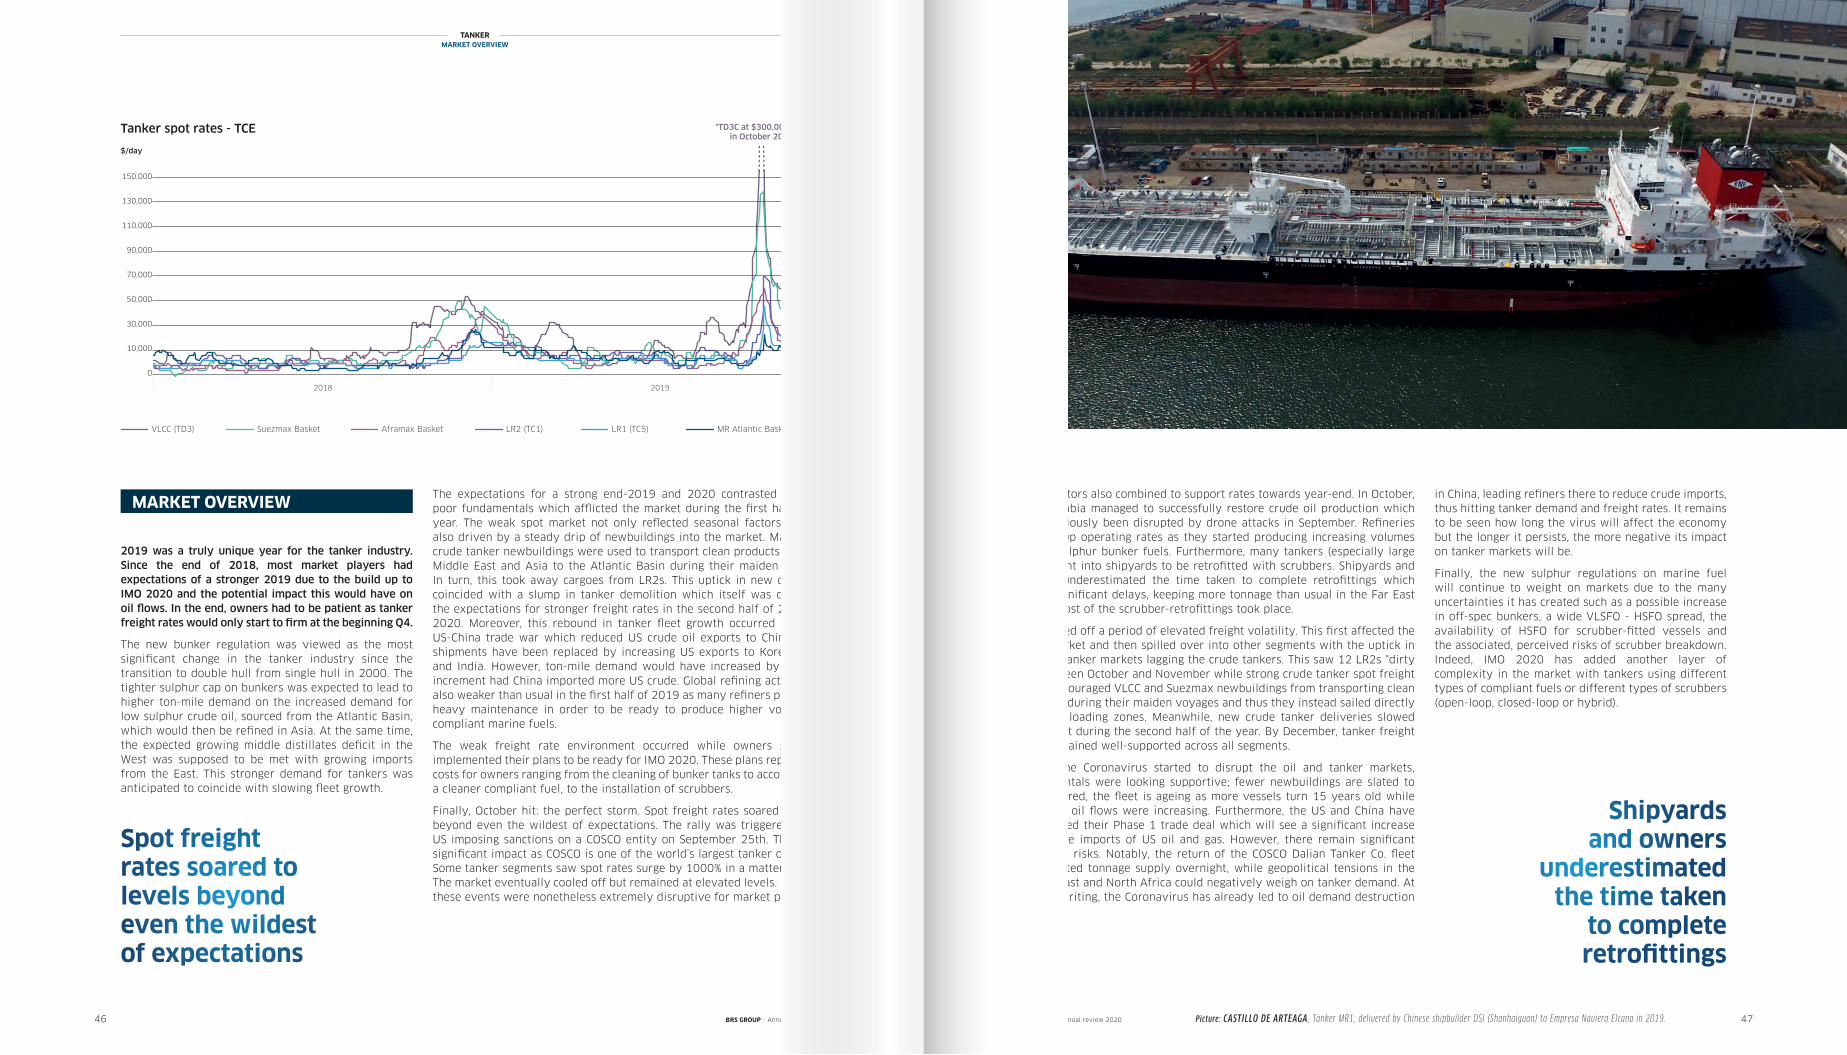
$/DAY TANKER SPOT RATES -TCE
VLCC (TD3) -TCE Suezmax Basket - TCE Aframax Basket - TCE LR2 (TC1) - TCE LR1 (TC5) - TCE MR Atlantic Basket
Jan 2018 Jan 2020
10,000
50,000
70,000
90,000
150,000
110,000
0
130,000
30,000
Spot freight rates soared to levels beyond even the wildest of expectations
46 47
TANKERMARKET OVERVIEW
in China, leading refiners there to reduce crude imports, thus hitting tanker demand and freight rates. It remains to be seen how long the virus will affect the economy but the longer it persists, the more negative its impact on tanker markets will be.
Finally, the new sulphur regulations on marine fuel will continue to weight on markets due to the many uncertainties it has created such as a possible increase in off-spec bunkers, a wide VLSFO - HSFO spread, the availability of HSFO for scrubber-fitted vessels and the associated, perceived risks of scrubber breakdown. Indeed, IMO 2020 has added another layer of complexity in the market with tankers using different types of compliant fuels or different types of scrubbers (open-loop, closed-loop or hybrid).
Picture: CASTILLO DE ARTEAGA , Tanker MR1, delivered by Chinese shipbuilder DSI (Shanhaiguan) to Empresa Naviera Elcano in 2019.
Other factors also combined to support rates towards year-end. In October, Saudi Arabia managed to successfully restore crude oil production which had previously been disrupted by drone attacks in September. Refineries ramped up operating rates as they started producing increasing volumes of low sulphur bunker fuels. Furthermore, many tankers (especially large ones) went into shipyards to be retrofitted with scrubbers. Shipyards and owners underestimated the time taken to complete retrofittings which led to significant delays, keeping more tonnage than usual in the Far East where most of the scrubber-retrofittings took place.
This kicked off a period of elevated freight volatility. This first affected the VLCC market and then spilled over into other segments with the uptick in product tanker markets lagging the crude tankers. This saw 12 LR2s "dirty up" between October and November while strong crude tanker spot freight rates discouraged VLCC and Suezmax newbuildings from transporting clean products during their maiden voyages and thus they instead sailed directly to crude loading zones. Meanwhile, new crude tanker deliveries slowed somewhat during the second half of the year. By December, tanker freight rates remained well-supported across all segments.
Before the Coronavirus started to disrupt the oil and tanker markets, fundamentals were looking supportive; fewer newbuildings are slated to be delivered, the fleet is ageing as more vessels turn 15 years old while seaborne oil flows were increasing. Furthermore, the US and China have now signed their Phase 1 trade deal which will see a significant increase in Chinese imports of US oil and gas. However, there remain significant downside risks. Notably, the return of the COSCO Dalian Tanker Co. fleet has boosted tonnage supply overnight, while geopolitical tensions in the Middle East and North Africa could negatively weigh on tanker demand. At time of writing, the Coronavirus has already led to oil demand destruction
Shipyards and owners
underestimatedthe time taken
to complete retrofittings
BRS GROUP - Annual review 2020 BRS GROUP - Annual review 2020
The expectations for a strong end-2019 and 2020 contrasted with the poor fundamentals which afflicted the market during the first half of the year. The weak spot market not only reflected seasonal factors but was also driven by a steady drip of newbuildings into the market. Many large crude tanker newbuildings were used to transport clean products from the Middle East and Asia to the Atlantic Basin during their maiden voyages. In turn, this took away cargoes from LR2s. This uptick in new deliveries coincided with a slump in tanker demolition which itself was driven by the expectations for stronger freight rates in the second half of 2019 and 2020. Moreover, this rebound in tanker fleet growth occurred amid the US-China trade war which reduced US crude oil exports to China. These shipments have been replaced by increasing US exports to Korea, Japan and India. However, ton-mile demand would have increased by a higher increment had China imported more US crude. Global refining activity was also weaker than usual in the first half of 2019 as many refiners performed heavy maintenance in order to be ready to produce higher volumes of compliant marine fuels.
The weak freight rate environment occurred while owners gradually implemented their plans to be ready for IMO 2020. These plans represented costs for owners ranging from the cleaning of bunker tanks to accommodate a cleaner compliant fuel, to the installation of scrubbers.
Finally, October hit: the perfect storm. Spot freight rates soared to levels beyond even the wildest of expectations. The rally was triggered by the US imposing sanctions on a COSCO entity on September 25th. This had a significant impact as COSCO is one of the world’s largest tanker operators. Some tanker segments saw spot rates surge by 1000% in a matter of days. The market eventually cooled off but remained at elevated levels. However, these events were nonetheless extremely disruptive for market players.
MARKET OVERVIEW
Tanker spot rates - TCE
$/day
VLCC (TD3) Suezmax Basket Aframax Basket LR2 (TC1) LR1 (TC5) MR Atlantic Basket
2018 2019
2019 was a truly unique year for the tanker industry. Since the end of 2018, most market players had expectations of a stronger 2019 due to the build up to IMO 2020 and the potential impact this would have on oil flows. In the end, owners had to be patient as tanker freight rates would only start to firm at the beginning Q4.
The new bunker regulation was viewed as the most significant change in the tanker industry since the transition to double hull from single hull in 2000. The tighter sulphur cap on bunkers was expected to lead to higher ton-mile demand on the increased demand for low sulphur crude oil, sourced from the Atlantic Basin, which would then be refined in Asia. At the same time, the expected growing middle distillates deficit in the West was supposed to be met with growing imports from the East. This stronger demand for tankers was anticipated to coincide with slowing fleet growth.
*TD3C at $300,000/day in October 2019

48 49
TANKERCHARTERING
One of the most significant changes for the VLCC market in 2019 came from increased geopolitical tensions and the shift from tariff imposition to the imposition of sanctions. The fourth quarter was the strongest quarter seen in years and this came after the US administration imposed sanctions on COSCO Dalian Tanker Co. which had the effect of immediately removing 26 VLCCs from the global fleet and saw fleet fundamentals shift rapidly. Global oil demand remained steady throughout the year but with new Chinese teapot refineries adding an additional 800 kb/d of new capacity, tonnage demand remained strong to that effect. Changes in trade patterns also became more apparent in 2019. With purchases of Iranian oil now non-existent and with Venezuelan oil now also under strict sanction, US exports have become more important as a source of incremental ton mile demand. US crude oil production rose by an average of 1.2 mb/d in 2019 and according to benchmark forecasters this is set to rise by a further 3.9mb/d by 2024.
Overall, 2019 was a good year for VLCCs. The uncertainty which was felt at the start in January diminished as the year progressed so that by the start of 2020, owners appeared ready to face the sulphur cap regulation while rates remain at healthy levels. As the cloud of uncertainty surrounding IMO 2020 lifts, prices of VLSFO are soaring and scrubber fitted VLCCs are benefitting from bunker savings. The time has come and the market feels ready to face the future. However, by the time of writing, the outbreak of the coronavirus in China has the potential to derail the positive expectations of owners, albeit temporarily.
Suezmax
Again in 2019, the Suezmax market like all other tanker trades has been marked by geopolitical instability and action. One key element of such strengthened earnings has come from tonnage supply, or the lack of such, for that matter. The first 8 months were marked by relatively stable earnings which were higher than during the same period of 2018, yet this stability would remain short-lived to some extent. The predicted delays linked to scrubber retrofits around the summer months had reduced tonnage supply by around 10% by
September 2019. What is more, the sanctions imposed on COSCO Dalian Tanker Co. and the subsequent uncertainty around the matter tied together with the aforementioned shortage of tonnage, propelled freight rates and earnings to record levels, surpassing the $100,000/day mark for a short period in October. From there on, earnings across all regions have increased while gaining more stability, thus giving a brighter outlook for 2020.
The supply-side was an especially important factor in Q4. On a year-on-year basis, the available fleet of suezmax tankers has not changed much with the global fleet (including shuttle tankers) at the end of 2019 comprised of 596 units with an average age of 9.6 years, compared with 572 ships with an average age of 8.9 years at end-2018, thus equating with growth of 4.2%. This change is explained by the 26 newbuildings which hit the water in 2019 net of the 7 vessels scrapped during the year. In view of IMO 2020 regulations, not all ships which planned to install a scrubber had been fitted as of 1st January 2020. However, in the end, one third of the fleet - 34% to be precise - will be scrubber-fitted. This portion is no surprise considering the number of ships regularly engaged in long-haul business and an expected bunker price spread between HSFO and VLSFO of between $250 and $350/mt.
On the demand side, the prevailing trade dynamics noted over the last couple of years will continue with Asian buyers having a healthy appetite for West African, Latin American and US crudes. One should not forget the sweeter blends from Europe or Russia, demand for which remained strong throughout 2019. When looking at volumes shipped into Europe, the main outlet for Suezmaxes globally, crude sourced from West Africa remained stable while exports from the US Gulf have increased to a certain extent. Around one suezmax cargo per week in the US Gulf is now destined for Europe and this trend is likely to increase at the expense of Middle Eastern crudes which are now largely destined for the Far East.
All the above factors and influences have made 2019 one of the best years since 2015 for owners. Average earnings registered during 2019 - roughly $26,000/day - doubled compared with 2018 (average $13,000/day). Taking it from loss making to (some) profit, mainly due to the October spike and Q4 earnings. As for the first 8 months of 2019, the TCE was oscillating between $15,000 and $20,000 per day on front haul voyages.
At the time of writing in early January 2020, the IMO regulations had already come into play and rates had increased drastically. However, the real impact of a "bunker surcharge" on freight levels remains surprisingly unknown. On the other hand, owners with scrubber-fitted ships are very satisfied with their decision and investment, as the TCE difference between those fitted and not-fitted with scrubbers had risen to $15,000/day in favour of those with a gas treatment system on board, making the return on investment looking even better than expected!
Aframax
The expectations were certainly high for 2019 and what a year it has been. Various geopolitical and unforeseen events marked the past 12 months across all shipping sizes and one of the most important occurrences in the Baltic was the chloride contamination in April 2019. This cut exports from Ust Luga to one third of the usual program for the months of July and August which hampered any hope of a good summer market. TD17 from April-September 2019 averaged TCE $10,139/day which wasn’t anything for owners to rejoice over, but this would all change come Q4 2019.
One important factor to consider over the last 4 months of 2019 is the difficulty for traders to sell Urals crude oil in North West Europe, which means other outlets needed to be found. The increase in deliveries from the Baltic to the
Mediterranean versus last year is huge with 108 voyages in 2019 compared with only 35 voyages in 2018 (+209%) and when VLCC’s and Suezmaxes became too expensive to export to China, the Aframaxes became the tanker of choice to sail east. In 2019 we saw the highest number of Aframaxes fixed in the last 5 years from the Baltic to China (10 voyages) and the overall increase in ton miles has contributed to the high freight rates of Q4.
The North Sea underwent a significant change as well with Equinor’s Johan Sverdrup oil field coming online in Q4. The full capacity will only be reached in mid-2020 but we can already feel the increase in demand with current export levels at 300 kb/day. Larger sizes have so far been preferred since this grade appeals to Asian refiners but it has also been processed by local refiners thereby increasing regional Aframax demand and this will only intensify in 2020.
Overall, last year was a good comeback for owners. The opening up of Libya gave some extra enquiry in the Mediterranean market and certainly helped push hire rates up.
The first half of Q1 had the expected "winter premium" with rates trading at WS100 levels for 100 ktons in the Mediterranean. Q2 was the most difficult for owners who had to accept very low TCEs of around $3,000/day in the Mediterranean but the following quarter proved to be very proliferous, trading at post WS200 levels.
Interestingly enough, during the third quarter, we saw some CPC Suezmax stems broken into Aframax stems, which also helped propel Cross-Black Sea rates higher. The winter period had the expected weather disruptions with ports closing and the Turkish straits delays reaching up to 10 days north and 7 days south. The latter made charterers either replace or cover their stems Cross-Black Sea for forward dates. We observed some increase in fuel oil enquiries, especially towards the east which was driven by the impending new bunker requirements as well as a lack of VLSFO towards the end of the year. Lastly, certain owners ‘dirtied up’ their clean vessels at end-year as Aframax rates commanded a significant premium versus LR2s. Nonetheless this only had a minor effect on the tonnage list and on Aframax rates.
As we enter 2020, the largest shift since single to double hull is now upon us with the IMO 2020 regulations in full swing. The momentum across all segments and sizes has sent shockwaves through tanker markets and if most of 2020 will be like this, owners are in for one of the best years over the last decade.
Crude TankersVLCC
As a whole, despite elevated newbuildings hitting the water, VLCC spot rates were more encouraging during 2019 than in previous years. 68 VLCC newbuildings were delivered in 2019, the highest figure since 1976. These deliveries were concentrated in the first half of 2019. The average TCE for the Baltic Exchange TD3C route (Ras Tanura to Ningbo, 270,000mt) in 2019 was $38,078/day compared with $18,802/day in 2018. When analysed further, 1Q19 rates held up as the market rolled over from a strong end to 2018. Accordingly, the TCE average for 1Q19 ($27,947/day) was significantly higher than for the same period in 2018 ($8,147)
From here on, rates lost some traction as demand contracted while 40 newbuildings were injected into the market during 1H19. Nonetheless, earnings were marginally higher than those seen in 2018 with an average TCE of $12,522/day for 2Q19 compared with $9,106/day in 2Q18.
When taking a step back to 2018, the market expected that rates would strengthen during 2019 in the wake of tonnage supply being cut by vessels entering dry dock to be retrofitted with scrubbers. Despite 59 VLCCs entering yards during the year, it must be said that this fundamental change in tonnage supply did not have the expected impact on rates. Retrofits were relatively evenly spread with Q3 seeing the most retrofitting compared to other quarters. The expectations for stronger rates also led to a drop in VLCC scrapping with only 4 units sent to the breakers last year compared with 32 in 2018.
The largestshift since single to double hull is
now upon us
Picture: SEAFAITH , Aframax Tanker, 111,964 dwt, 2020 built, owned by Thenamaris. BRS GROUP - Annual review 2020 BRS GROUP - Annual review 2020
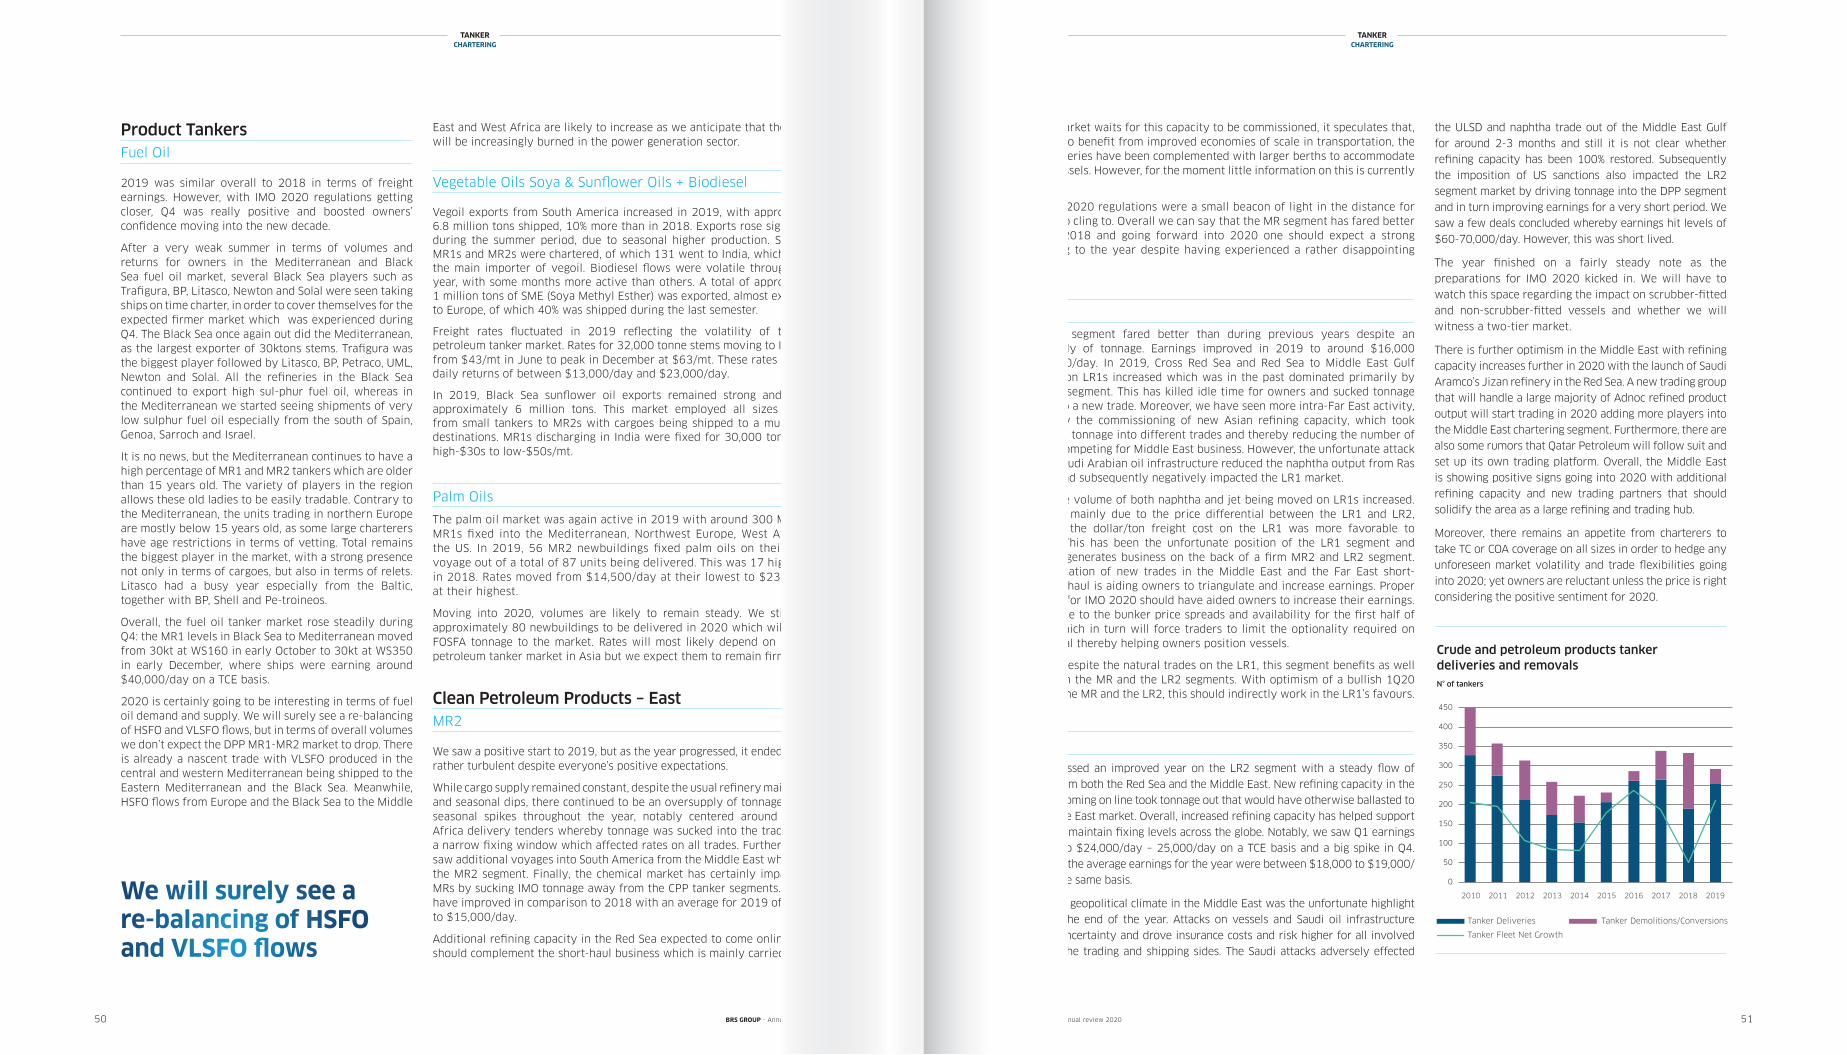
As the market waits for this capacity to be commissioned, it speculates that, in order to benefit from improved economies of scale in transportation, the new refineries have been complemented with larger berths to accommodate larger vessels. However, for the moment little information on this is currently available.
The IMO 2020 regulations were a small beacon of light in the distance for owners to cling to. Overall we can say that the MR segment has fared better than in 2018 and going forward into 2020 one should expect a strong beginning to the year despite having experienced a rather disappointing Q4 2019.
LR1
The LR1 segment fared better than during previous years despite an oversupply of tonnage. Earnings improved in 2019 to around $16,000 - $17,000/day. In 2019, Cross Red Sea and Red Sea to Middle East Gulf voyages on LR1s increased which was in the past dominated primarily by the MR2 segment. This has killed idle time for owners and sucked tonnage away into a new trade. Moreover, we have seen more intra-Far East activity, driven by the commissioning of new Asian refining capacity, which took ballasting tonnage into different trades and thereby reducing the number of vessels competing for Middle East business. However, the unfortunate attack on key Saudi Arabian oil infrastructure reduced the naphtha output from Ras Tanura and subsequently negatively impacted the LR1 market.
In Q4, the volume of both naphtha and jet being moved on LR1s increased. This was mainly due to the price differential between the LR1 and LR2, whereby the dollar/ton freight cost on the LR1 was more favorable to traders. This has been the unfortunate position of the LR1 segment and at times generates business on the back of a firm MR2 and LR2 segment. A combination of new trades in the Middle East and the Far East short- and long-haul is aiding owners to triangulate and increase earnings. Proper planning for IMO 2020 should have aided owners to increase their earnings. This is due to the bunker price spreads and availability for the first half of 1Q20, which in turn will force traders to limit the optionality required on every deal thereby helping owners position vessels.
Overall, despite the natural trades on the LR1, this segment benefits as well from both the MR and the LR2 segments. With optimism of a bullish 1Q20 on both the MR and the LR2, this should indirectly work in the LR1’s favours.
LR2
We witnessed an improved year on the LR2 segment with a steady flow of
cargos from both the Red Sea and the Middle East. New refining capacity in the
Far East coming on line took tonnage out that would have otherwise ballasted to
the Middle East market. Overall, increased refining capacity has helped support
rates and maintain fixing levels across the globe. Notably, we saw Q1 earnings
at close to $24,000/day – 25,000/day on a TCE basis and a big spike in Q4.
However, the average earnings for the year were between $18,000 to $19,000/
day on the same basis.
The tense geopolitical climate in the Middle East was the unfortunate highlight
towards the end of the year. Attacks on vessels and Saudi oil infrastructure
created uncertainty and drove insurance costs and risk higher for all involved
on both the trading and shipping sides. The Saudi attacks adversely effected
East and West Africa are likely to increase as we anticipate that the product will be increasingly burned in the power generation sector.
Vegetable Oils Soya & Sunflower Oils + Biodiesel
Vegoil exports from South America increased in 2019, with approximately 6.8 million tons shipped, 10% more than in 2018. Exports rose significantly during the summer period, due to seasonal higher production. Some 227 MR1s and MR2s were chartered, of which 131 went to India, which remains the main importer of vegoil. Biodiesel flows were volatile throughout the year, with some months more active than others. A total of approximately 1 million tons of SME (Soya Methyl Esther) was exported, almost exclusively to Europe, of which 40% was shipped during the last semester.
Freight rates fluctuated in 2019 reflecting the volatility of the clean petroleum tanker market. Rates for 32,000 tonne stems moving to India rose from $43/mt in June to peak in December at $63/mt. These rates produced daily returns of between $13,000/day and $23,000/day.
In 2019, Black Sea sunflower oil exports remained strong and reached approximately 6 million tons. This market employed all sizes of ships from small tankers to MR2s with cargoes being shipped to a multitude of destinations. MR1s discharging in India were fixed for 30,000 tons around high-$30s to low-$50s/mt.
Palm Oils
The palm oil market was again active in 2019 with around 300 MR2s and MR1s fixed into the Mediterranean, Northwest Europe, West Africa and the US. In 2019, 56 MR2 newbuildings fixed palm oils on their maiden voyage out of a total of 87 units being delivered. This was 17 higher than in 2018. Rates moved from $14,500/day at their lowest to $23,000/day at their highest.
Moving into 2020, volumes are likely to remain steady. We still expect approximately 80 newbuildings to be delivered in 2020 which will provide FOSFA tonnage to the market. Rates will most likely depend on the clean petroleum tanker market in Asia but we expect them to remain firm.
Clean Petroleum Products – EastMR2
We saw a positive start to 2019, but as the year progressed, it ended up being rather turbulent despite everyone’s positive expectations.
While cargo supply remained constant, despite the usual refinery maintenance and seasonal dips, there continued to be an oversupply of tonnage. We saw seasonal spikes throughout the year, notably centered around the East Africa delivery tenders whereby tonnage was sucked into the trade around a narrow fixing window which affected rates on all trades. Furthermore, we saw additional voyages into South America from the Middle East which aided the MR2 segment. Finally, the chemical market has certainly impacted the MRs by sucking IMO tonnage away from the CPP tanker segments. Earnings have improved in comparison to 2018 with an average for 2019 of $14,000 to $15,000/day.
Additional refining capacity in the Red Sea expected to come online shortly should complement the short-haul business which is mainly carried by MRs.
Product TankersFuel Oil
2019 was similar overall to 2018 in terms of freight earnings. However, with IMO 2020 regulations getting closer, Q4 was really positive and boosted owners’ confidence moving into the new decade.
After a very weak summer in terms of volumes and returns for owners in the Mediterranean and Black Sea fuel oil market, several Black Sea players such as Trafigura, BP, Litasco, Newton and Solal were seen taking ships on time charter, in order to cover themselves for the expected firmer market which was experienced during Q4. The Black Sea once again out did the Mediterranean, as the largest exporter of 30ktons stems. Trafigura was the biggest player followed by Litasco, BP, Petraco, UML, Newton and Solal. All the refineries in the Black Sea continued to export high sul-phur fuel oil, whereas in the Mediterranean we started seeing shipments of very low sulphur fuel oil especially from the south of Spain, Genoa, Sarroch and Israel.
It is no news, but the Mediterranean continues to have a high percentage of MR1 and MR2 tankers which are older than 15 years old. The variety of players in the region allows these old ladies to be easily tradable. Contrary to the Mediterranean, the units trading in northern Europe are mostly below 15 years old, as some large charterers have age restrictions in terms of vetting. Total remains the biggest player in the market, with a strong presence not only in terms of cargoes, but also in terms of relets. Litasco had a busy year especially from the Baltic, together with BP, Shell and Pe-troineos.
Overall, the fuel oil tanker market rose steadily during Q4: the MR1 levels in Black Sea to Mediterranean moved from 30kt at WS160 in early October to 30kt at WS350 in early December, where ships were earning around $40,000/day on a TCE basis.
2020 is certainly going to be interesting in terms of fuel oil demand and supply. We will surely see a re-balancing of HSFO and VLSFO flows, but in terms of overall volumes we don’t expect the DPP MR1-MR2 market to drop. There is already a nascent trade with VLSFO produced in the central and western Mediterranean being shipped to the Eastern Mediterranean and the Black Sea. Meanwhile, HSFO flows from Europe and the Black Sea to the Middle
50 51
TANKERCHARTERING
TANKERCHARTERING
the ULSD and naphtha trade out of the Middle East Gulf
for around 2-3 months and still it is not clear whether
refining capacity has been 100% restored. Subsequently
the imposition of US sanctions also impacted the LR2
segment market by driving tonnage into the DPP segment
and in turn improving earnings for a very short period. We
saw a few deals concluded whereby earnings hit levels of
$60-70,000/day. However, this was short lived.
The year finished on a fairly steady note as the
preparations for IMO 2020 kicked in. We will have to
watch this space regarding the impact on scrubber-fitted
and non-scrubber-fitted vessels and whether we will
witness a two-tier market.
There is further optimism in the Middle East with refining
capacity increases further in 2020 with the launch of Saudi
Aramco’s Jizan refinery in the Red Sea. A new trading group
that will handle a large majority of Adnoc refined product
output will start trading in 2020 adding more players into
the Middle East chartering segment. Furthermore, there are
also some rumors that Qatar Petroleum will follow suit and
set up its own trading platform. Overall, the Middle East
is showing positive signs going into 2020 with additional
refining capacity and new trading partners that should
solidify the area as a large refining and trading hub.
Moreover, there remains an appetite from charterers to
take TC or COA coverage on all sizes in order to hedge any
unforeseen market volatility and trade flexibilities going
into 2020; yet owners are reluctant unless the price is right
considering the positive sentiment for 2020.
We will surely see a re-balancing of HSFO and VLSFO flows
BRS GROUP - Annual review 2020 BRS GROUP - Annual review 2020
20192010 2011 2012 2013 2014 2015 2016 2017
N° of Tankers
Crude and Petroleum Products Tankers Deliveries and Removals
Tanker Deliveries Tanker Demolitions/Conversions
Tanker Fleet Net Growth
20180
50
100
200
300
450
400
150
250
350
Crude and petroleum products tanker deliveries and removalsN° of tankers
Tanker Deliveries Tanker Demolitions/Conversions
Tanker Fleet Net Growth
2010 2011 2012 2013 2014 2015 2016 2017 2018 2019
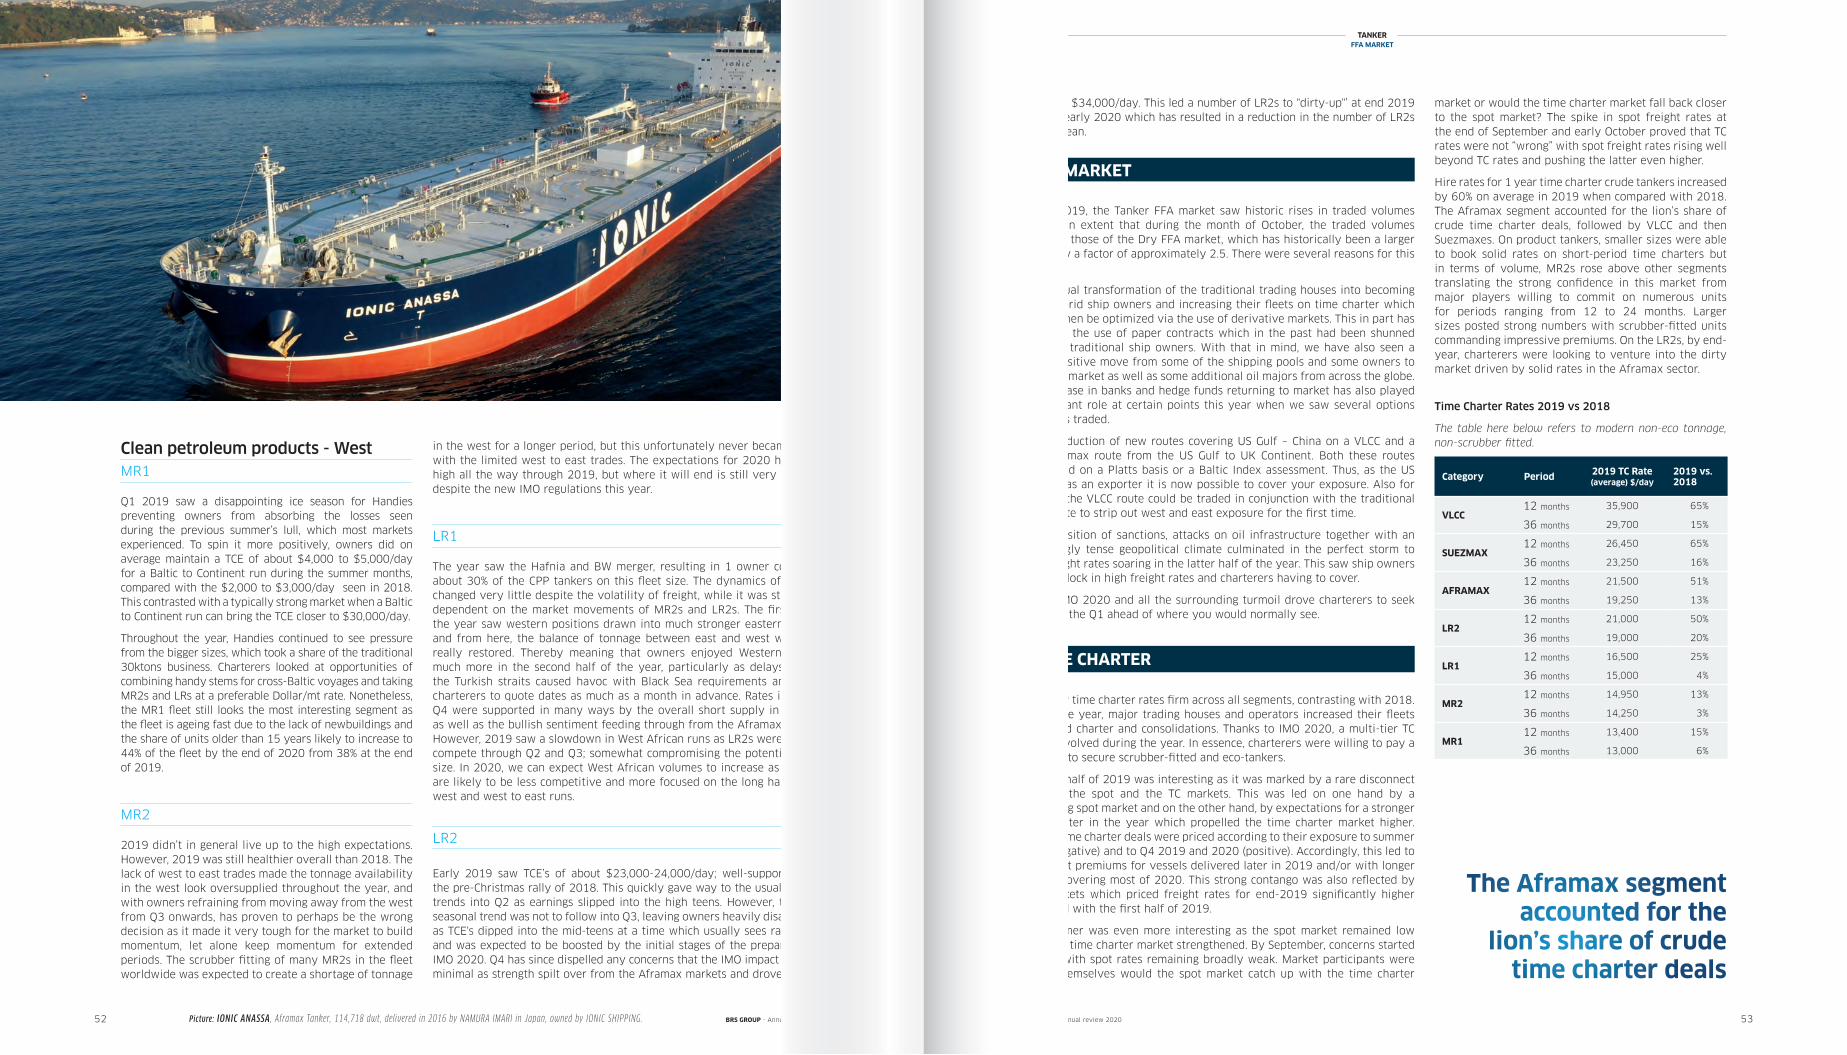
Clean petroleum products - WestMR1
Q1 2019 saw a disappointing ice season for Handies preventing owners from absorbing the losses seen during the previous summer’s lull, which most markets experienced. To spin it more positively, owners did on average maintain a TCE of about $4,000 to $5,000/day for a Baltic to Continent run during the summer months, compared with the $2,000 to $3,000/day seen in 2018. This contrasted with a typically strong market when a Baltic to Continent run can bring the TCE closer to $30,000/day.
Throughout the year, Handies continued to see pressure from the bigger sizes, which took a share of the traditional 30ktons business. Charterers looked at opportunities of combining handy stems for cross-Baltic voyages and taking MR2s and LRs at a preferable Dollar/mt rate. Nonetheless, the MR1 fleet still looks the most interesting segment as the fleet is ageing fast due to the lack of newbuildings and the share of units older than 15 years likely to increase to 44% of the fleet by the end of 2020 from 38% at the end of 2019.
MR2
2019 didn’t in general live up to the high expectations. However, 2019 was still healthier overall than 2018. The lack of west to east trades made the tonnage availability in the west look oversupplied throughout the year, and with owners refraining from moving away from the west from Q3 onwards, has proven to perhaps be the wrong decision as it made it very tough for the market to build momentum, let alone keep momentum for extended periods. The scrubber fitting of many MR2s in the fleet worldwide was expected to create a shortage of tonnage
in the west for a longer period, but this unfortunately never became reality with the limited west to east trades. The expectations for 2020 have been high all the way through 2019, but where it will end is still very uncertain despite the new IMO regulations this year.
LR1
The year saw the Hafnia and BW merger, resulting in 1 owner controlling about 30% of the CPP tankers on this fleet size. The dynamics of this size changed very little despite the volatility of freight, while it was still largely dependent on the market movements of MR2s and LR2s. The first half of the year saw western positions drawn into much stronger eastern markets and from here, the balance of tonnage between east and west was never really restored. Thereby meaning that owners enjoyed Western markets much more in the second half of the year, particularly as delays through the Turkish straits caused havoc with Black Sea requirements and forced charterers to quote dates as much as a month in advance. Rates in Q3 and Q4 were supported in many ways by the overall short supply in the west as well as the bullish sentiment feeding through from the Aframax markets. However, 2019 saw a slowdown in West African runs as LR2s were ready to compete through Q2 and Q3; somewhat compromising the potential of this size. In 2020, we can expect West African volumes to increase as the LR2s are likely to be less competitive and more focused on the long haul east to west and west to east runs.
LR2
Early 2019 saw TCE’s of about $23,000-24,000/day; well-supported after the pre-Christmas rally of 2018. This quickly gave way to the usual seasonal trends into Q2 as earnings slipped into the high teens. However, this same seasonal trend was not to follow into Q3, leaving owners heavily disappointed as TCE's dipped into the mid-teens at a time which usually sees rates spike; and was expected to be boosted by the initial stages of the preparation for IMO 2020. Q4 has since dispelled any concerns that the IMO impact would be minimal as strength spilt over from the Aframax markets and drove earnings
52 53
to around $34,000/day. This led a number of LR2s to "dirty-up"’ at end 2019 and into early 2020 which has resulted in a reduction in the number of LR2s trading clean.
market or would the time charter market fall back closer to the spot market? The spike in spot freight rates at the end of September and early October proved that TC rates were not “wrong” with spot freight rates rising well beyond TC rates and pushing the latter even higher.
Hire rates for 1 year time charter crude tankers increased by 60% on average in 2019 when compared with 2018. The Aframax segment accounted for the lion’s share of crude time charter deals, followed by VLCC and then Suezmaxes. On product tankers, smaller sizes were able to book solid rates on short-period time charters but in terms of volume, MR2s rose above other segments translating the strong confidence in this market from major players willing to commit on numerous units for periods ranging from 12 to 24 months. Larger sizes posted strong numbers with scrubber-fitted units commanding impressive premiums. On the LR2s, by end-year, charterers were looking to venture into the dirty market driven by solid rates in the Aframax sector.
During 2019, the Tanker FFA market saw historic rises in traded volumes to such an extent that during the month of October, the traded volumes exceeded those of the Dry FFA market, which has historically been a larger market by a factor of approximately 2.5. There were several reasons for this increase:
The gradual transformation of the traditional trading houses into becoming more hybrid ship owners and increasing their fleets on time charter which have to then be optimized via the use of derivative markets. This in part has increased the use of paper contracts which in the past had been shunned by many traditional ship owners. With that in mind, we have also seen a recent positive move from some of the shipping pools and some owners to enter the market as well as some additional oil majors from across the globe. The increase in banks and hedge funds returning to market has also played a significant role at certain points this year when we saw several options structures traded.
The introduction of new routes covering US Gulf – China on a VLCC and a new Aframax route from the US Gulf to UK Continent. Both these routes are quoted on a Platts basis or a Baltic Index assessment. Thus, as the US emerges as an exporter it is now possible to cover your exposure. Also for example the VLCC route could be traded in conjunction with the traditional TD3C route to strip out west and east exposure for the first time.
The imposition of sanctions, attacks on oil infrastructure together with an increasingly tense geopolitical climate culminated in the perfect storm to send freight rates soaring in the latter half of the year. This saw ship owners trying to lock in high freight rates and charterers having to cover.
Finally IMO 2020 and all the surrounding turmoil drove charterers to seek cover for the Q1 ahead of where you would normally see.
FFA MARKET
Category Period 2019 TC Rate (average) $/day
2019 vs. 2018
VLCC12 months 35,900 65%
36 months 29,700 15%
SUEZMAX12 months 26,450 65%
36 months 23,250 16%
AFRAMAX12 months 21,500 51%
36 months 19,250 13%
LR212 months 21,000 50%
36 months 19,000 20%
LR112 months 16,500 25%
36 months 15,000 4%
MR212 months 14,950 13%
36 months 14,250 3%
MR112 months 13,400 15%
36 months 13,000 6%
TANKERFFA MARKET
Time Charter Rates 2019 vs 2018
The table here below refers to modern non-eco tonnage, non-scrubber fitted.
Picture: IONIC ANASSA , Aframax Tanker, 114,718 dwt, delivered in 2016 by NAMURA IMARI in Japan, owned by IONIC SHIPPING. BRS GROUP - Annual review 2020 BRS GROUP - Annual review 2020
2019 saw time charter rates firm across all segments, contrasting with 2018. During the year, major trading houses and operators increased their fleets via period charter and consolidations. Thanks to IMO 2020, a multi-tier TC market evolved during the year. In essence, charterers were willing to pay a premium to secure scrubber-fitted and eco-tankers.
The first half of 2019 was interesting as it was marked by a rare disconnect between the spot and the TC markets. This was led on one hand by a weakening spot market and on the other hand, by expectations for a stronger market later in the year which propelled the time charter market higher. Indeed, time charter deals were priced according to their exposure to summer 2019 (negative) and to Q4 2019 and 2020 (positive). Accordingly, this led to significant premiums for vessels delivered later in 2019 and/or with longer periods covering most of 2020. This strong contango was also reflected by FFA markets which priced freight rates for end-2019 significantly higher compared with the first half of 2019.
The summer was even more interesting as the spot market remained low while the time charter market strengthened. By September, concerns started to arise with spot rates remaining broadly weak. Market participants were asking themselves would the spot market catch up with the time charter
TIME CHARTER
The Aframax segment accounted for the
lion’s share of crude time charter deals
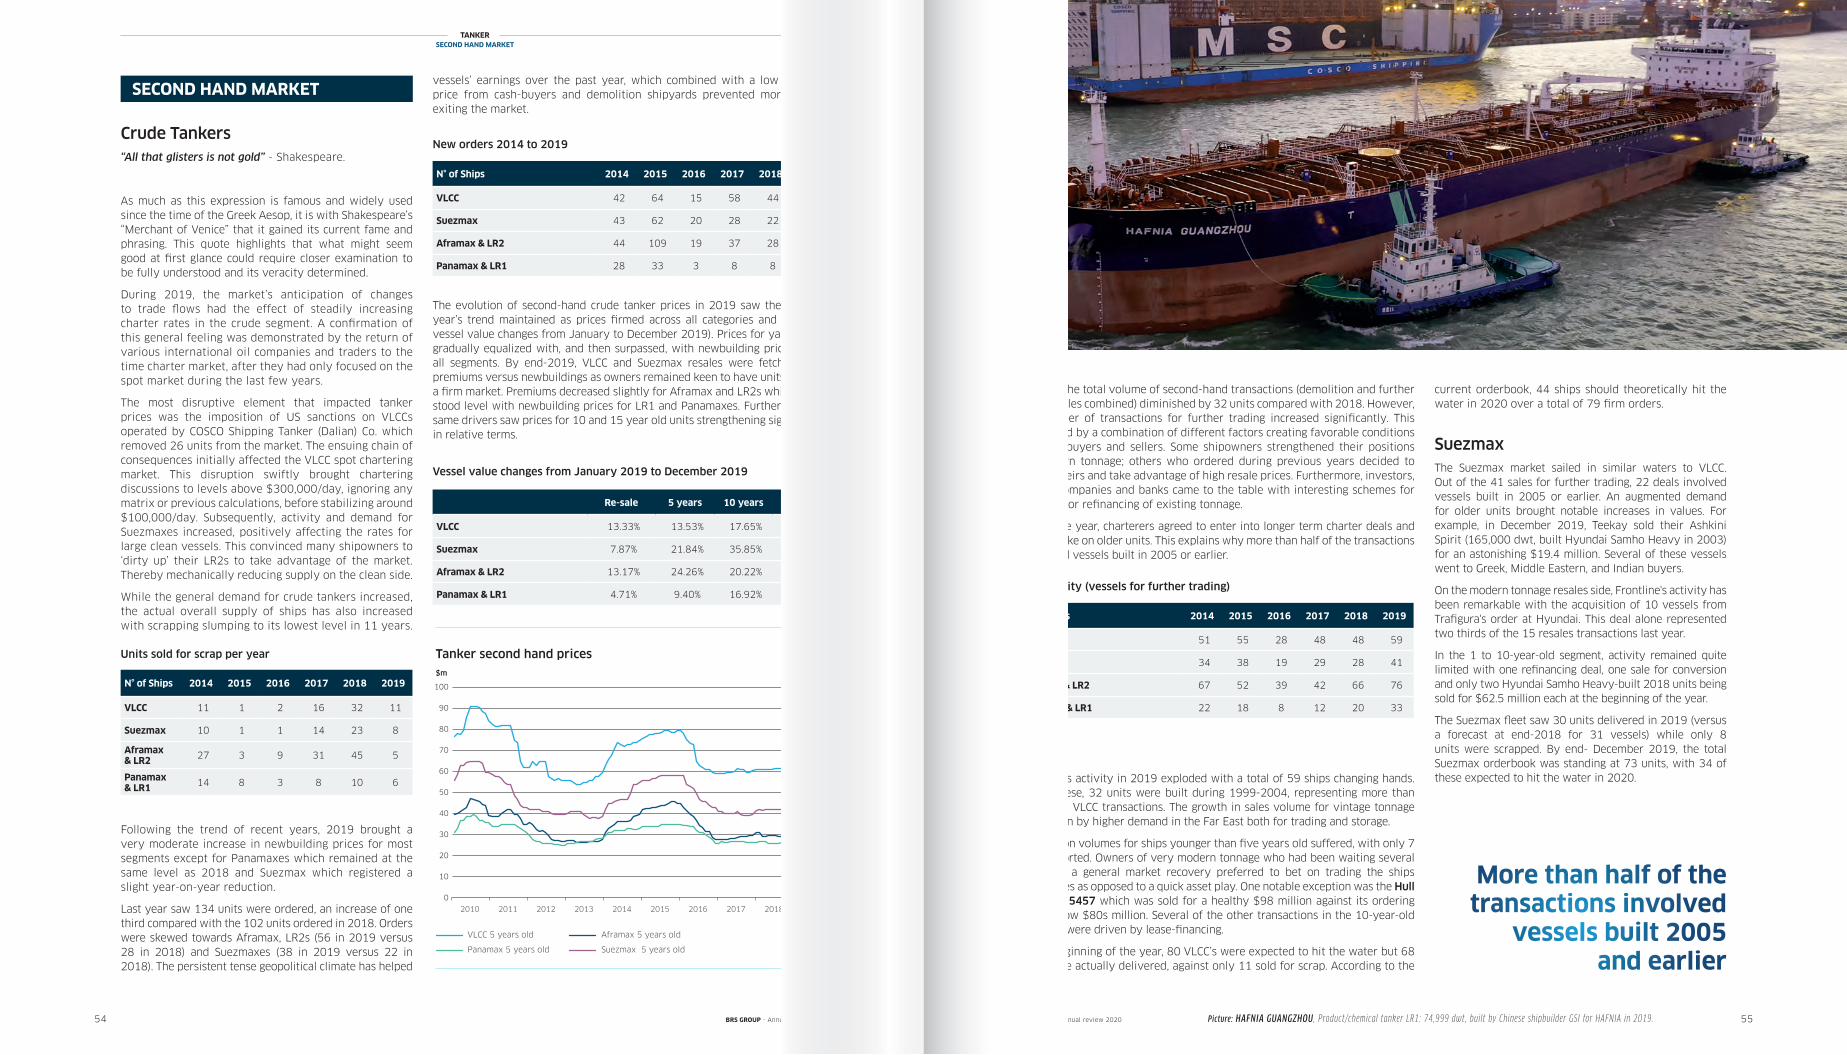
Crude Tankers“All that glisters is not gold” - Shakespeare.
As much as this expression is famous and widely used since the time of the Greek Aesop, it is with Shakespeare’s “Merchant of Venice” that it gained its current fame and phrasing. This quote highlights that what might seem good at first glance could require closer examination to be fully understood and its veracity determined.
During 2019, the market’s anticipation of changes to trade flows had the effect of steadily increasing charter rates in the crude segment. A confirmation of this general feeling was demonstrated by the return of various international oil companies and traders to the time charter market, after they had only focused on the spot market during the last few years.
The most disruptive element that impacted tanker prices was the imposition of US sanctions on VLCCs operated by COSCO Shipping Tanker (Dalian) Co. which removed 26 units from the market. The ensuing chain of consequences initially affected the VLCC spot chartering market. This disruption swiftly brought chartering discussions to levels above $300,000/day, ignoring any matrix or previous calculations, before stabilizing around $100,000/day. Subsequently, activity and demand for Suezmaxes increased, positively affecting the rates for large clean vessels. This convinced many shipowners to ‘dirty up’ their LR2s to take advantage of the market. Thereby mechanically reducing supply on the clean side.
While the general demand for crude tankers increased, the actual overall supply of ships has also increased with scrapping slumping to its lowest level in 11 years.
Following the trend of recent years, 2019 brought a very moderate increase in newbuilding prices for most segments except for Panamaxes which remained at the same level as 2018 and Suezmax which registered a slight year-on-year reduction.
Last year saw 134 units were ordered, an increase of one third compared with the 102 units ordered in 2018. Orders were skewed towards Aframax, LR2s (56 in 2019 versus 28 in 2018) and Suezmaxes (38 in 2019 versus 22 in 2018). The persistent tense geopolitical climate has helped
54 55
TANKERSECOND HAND MARKET
Picture: HAFNIA GUANGZHOU , Product/chemical tanker LR1: 74,999 dwt, built by Chinese shipbuilder GSI for HAFNIA in 2019.
N° of Ships 2014 2015 2016 2017 2018 2019
VLCC 11 1 2 16 32 11
Suezmax 10 1 1 14 23 8
Aframax & LR2 27 3 9 31 45 5
Panamax & LR1 14 8 3 8 10 6
In 2019, the total volume of second-hand transactions (demolition and further trading sales combined) diminished by 32 units compared with 2018. However, the number of transactions for further trading increased significantly. This was fueled by a combination of different factors creating favorable conditions for both buyers and sellers. Some shipowners strengthened their positions on modern tonnage; others who ordered during previous years decided to lighten theirs and take advantage of high resale prices. Furthermore, investors, leasing companies and banks came to the table with interesting schemes for financing or refinancing of existing tonnage.
During the year, charterers agreed to enter into longer term charter deals and even to take on older units. This explains why more than half of the transactions concerned vessels built in 2005 or earlier.
S&P activity (vessels for further trading)
Vessel value changes from January 2019 to December 2019
Re-sale 5 years 10 years 15 years
VLCC 13.33% 13.53% 17.65% 33.33%
Suezmax 7.87% 21.84% 35.85% 41.54%
Aframax & LR2 13.17% 24.26% 20.22% 32.74%
Panamax & LR1 4.71% 9.40% 16.92% 33.33%
N° of Ships 2014 2015 2016 2017 2018 2019
VLCC 51 55 28 48 48 59
Suezmax 34 38 19 29 28 41
Aframax & LR2 67 52 39 42 66 76
Panamax & LR1 22 18 8 12 20 33
VLCC VLCC sales activity in 2019 exploded with a total of 59 ships changing hands. Out of these, 32 units were built during 1999-2004, representing more than 50% of all VLCC transactions. The growth in sales volume for vintage tonnage was driven by higher demand in the Far East both for trading and storage.
Transaction volumes for ships younger than five years old suffered, with only 7 sales reported. Owners of very modern tonnage who had been waiting several years for a general market recovery preferred to bet on trading the ships themselves as opposed to a quick asset play. One notable exception was the Hull DAEWOO 5457 which was sold for a healthy $98 million against its ordering price of low $80s million. Several of the other transactions in the 10-year-old segment, were driven by lease-financing.
At the beginning of the year, 80 VLCC’s were expected to hit the water but 68 units were actually delivered, against only 11 sold for scrap. According to the
More than half of the transactions involved
vessels built 2005 and earlier
The evolution of second-hand crude tanker prices in 2019 saw the previous year’s trend maintained as prices firmed across all categories and ages (see vessel value changes from January to December 2019). Prices for yard resales gradually equalized with, and then surpassed, with newbuilding prices across all segments. By end-2019, VLCC and Suezmax resales were fetching 6-7% premiums versus newbuildings as owners remained keen to have units entering a firm market. Premiums decreased slightly for Aframax and LR2s while resales stood level with newbuilding prices for LR1 and Panamaxes. Furthermore, the same drivers saw prices for 10 and 15 year old units strengthening significantly in relative terms.
New orders 2014 to 2019
SECOND HAND MARKET
current orderbook, 44 ships should theoretically hit the water in 2020 over a total of 79 firm orders.
Suezmax The Suezmax market sailed in similar waters to VLCC. Out of the 41 sales for further trading, 22 deals involved vessels built in 2005 or earlier. An augmented demand for older units brought notable increases in values. For example, in December 2019, Teekay sold their Ashkini Spirit (165,000 dwt, built Hyundai Samho Heavy in 2003) for an astonishing $19.4 million. Several of these vessels went to Greek, Middle Eastern, and Indian buyers.
On the modern tonnage resales side, Frontline's activity has been remarkable with the acquisition of 10 vessels from Trafigura's order at Hyundai. This deal alone represented two thirds of the 15 resales transactions last year.
In the 1 to 10-year-old segment, activity remained quite limited with one refinancing deal, one sale for conversion and only two Hyundai Samho Heavy-built 2018 units being sold for $62.5 million each at the beginning of the year.
The Suezmax fleet saw 30 units delivered in 2019 (versus a forecast at end-2018 for 31 vessels) while only 8 units were scrapped. By end- December 2019, the total Suezmax orderbook was standing at 73 units, with 34 of these expected to hit the water in 2020.
Units sold for scrap per year
N° of Ships 2014 2015 2016 2017 2018 2019
VLCC 42 64 15 58 44 39
Suezmax 43 62 20 28 22 38
Aframax & LR2 44 109 19 37 28 56
Panamax & LR1 28 33 3 8 8 1
$m
2010 2011 2012 2013 2014 2015 2016 2017 2018 2019
10
20
30
40
50
60
70
80
90
100
0
VLCC 5 years old Suezmax 5 years old
Aframax 5 years old Panamax 5 years old
Tanker second-hand prices
$m
2013 2014 2015 2016 2017
Tanker second hand prices
2019
Panamax 5 years old Suezmax 5 years old
VLCC 5 years old Aframax 5 years old
2010 2011 2012
BRS GROUP - Annual review 2020 BRS GROUP - Annual review 2020
vessels’ earnings over the past year, which combined with a low recycling price from cash-buyers and demolition shipyards prevented more vessels exiting the market.
2018
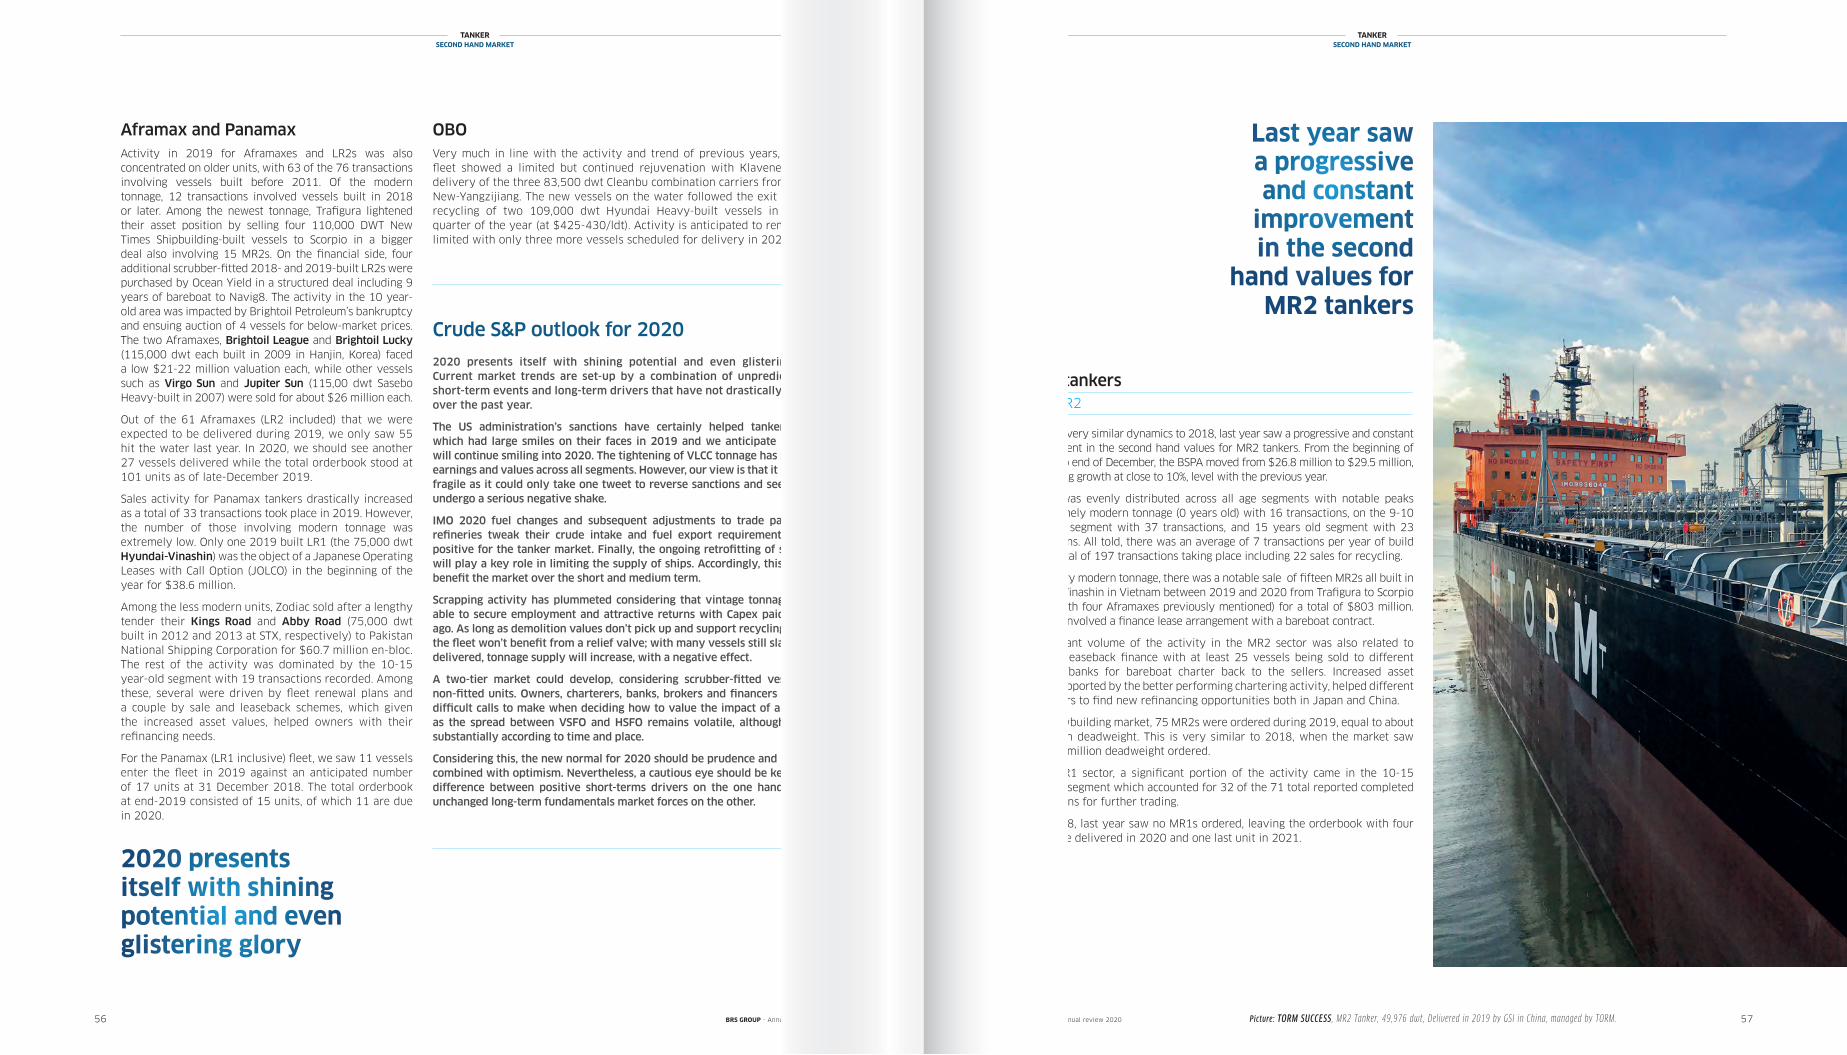
TANKERSECOND HAND MARKET
TANKERSECOND HAND MARKET
56 57Picture: TORM SUCCESS , MR2 Tanker, 49,976 dwt, Delivered in 2019 by GSI in China, managed by TORM.
Aframax and Panamax Activity in 2019 for Aframaxes and LR2s was also concentrated on older units, with 63 of the 76 transactions involving vessels built before 2011. Of the modern tonnage, 12 transactions involved vessels built in 2018 or later. Among the newest tonnage, Trafigura lightened their asset position by selling four 110,000 DWT New Times Shipbuilding-built vessels to Scorpio in a bigger deal also involving 15 MR2s. On the financial side, four additional scrubber-fitted 2018- and 2019-built LR2s were purchased by Ocean Yield in a structured deal including 9 years of bareboat to Navig8. The activity in the 10 year-old area was impacted by Brightoil Petroleum’s bankruptcy and ensuing auction of 4 vessels for below-market prices. The two Aframaxes, Brightoil League and Brightoil Lucky (115,000 dwt each built in 2009 in Hanjin, Korea) faced a low $21-22 million valuation each, while other vessels such as Virgo Sun and Jupiter Sun (115,00 dwt Sasebo Heavy-built in 2007) were sold for about $26 million each.
Out of the 61 Aframaxes (LR2 included) that we were expected to be delivered during 2019, we only saw 55 hit the water last year. In 2020, we should see another 27 vessels delivered while the total orderbook stood at 101 units as of late-December 2019.
Sales activity for Panamax tankers drastically increased as a total of 33 transactions took place in 2019. However, the number of those involving modern tonnage was extremely low. Only one 2019 built LR1 (the 75,000 dwt Hyundai-Vinashin) was the object of a Japanese Operating Leases with Call Option (JOLCO) in the beginning of the year for $38.6 million.
Among the less modern units, Zodiac sold after a lengthy tender their Kings Road and Abby Road (75,000 dwt built in 2012 and 2013 at STX, respectively) to Pakistan National Shipping Corporation for $60.7 million en-bloc. The rest of the activity was dominated by the 10-15 year-old segment with 19 transactions recorded. Among these, several were driven by fleet renewal plans and a couple by sale and leaseback schemes, which given the increased asset values, helped owners with their refinancing needs.
For the Panamax (LR1 inclusive) fleet, we saw 11 vessels enter the fleet in 2019 against an anticipated number of 17 units at 31 December 2018. The total orderbook at end-2019 consisted of 15 units, of which 11 are due in 2020.
Last year saw a progressive and constant
improvement in the second
hand values for MR2 tankers
BRS GROUP - Annual review 2020 BRS GROUP - Annual review 2020
OBO Very much in line with the activity and trend of previous years, the OBO fleet showed a limited but continued rejuvenation with Klaveness taking delivery of the three 83,500 dwt Cleanbu combination carriers from Jiangsu New-Yangzijiang. The new vessels on the water followed the exit for green recycling of two 109,000 dwt Hyundai Heavy-built vessels in the first quarter of the year (at $425-430/ldt). Activity is anticipated to remain very limited with only three more vessels scheduled for delivery in 2020.
Crude S&P outlook for 2020
2020 presents itself with shining potential and even glistering glory. Current market trends are set-up by a combination of unpredicted past short-term events and long-term drivers that have not drastically changed over the past year.
The US administration’s sanctions have certainly helped tanker owners which had large smiles on their faces in 2019 and we anticipate that they will continue smiling into 2020. The tightening of VLCC tonnage has benefited earnings and values across all segments. However, our view is that it is all very fragile as it could only take one tweet to reverse sanctions and see markets undergo a serious negative shake.
IMO 2020 fuel changes and subsequent adjustments to trade patterns as refineries tweak their crude intake and fuel export requirements will be positive for the tanker market. Finally, the ongoing retrofitting of scrubbers will play a key role in limiting the supply of ships. Accordingly, this will also benefit the market over the short and medium term.
Scrapping activity has plummeted considering that vintage tonnage is now able to secure employment and attractive returns with Capex paid-off long ago. As long as demolition values don’t pick up and support recycling activity, the fleet won’t benefit from a relief valve; with many vessels still slated to be delivered, tonnage supply will increase, with a negative effect.
A two-tier market could develop, considering scrubber-fitted vessels and non-fitted units. Owners, charterers, banks, brokers and financers will have difficult calls to make when deciding how to value the impact of a scrubber as the spread between VSFO and HSFO remains volatile, although varying substantially according to time and place.
Considering this, the new normal for 2020 should be prudence and reflection combined with optimism. Nevertheless, a cautious eye should be kept on the difference between positive short-terms drivers on the one hand and the unchanged long-term fundamentals market forces on the other.
Clean tankersMR1/MR2
Following very similar dynamics to 2018, last year saw a progressive and constant improvement in the second hand values for MR2 tankers. From the beginning of January to end of December, the BSPA moved from $26.8 million to $29.5 million, maintaining growth at close to 10%, level with the previous year.
Activity was evenly distributed across all age segments with notable peaks for extremely modern tonnage (0 years old) with 16 transactions, on the 9-10 years old segment with 37 transactions, and 15 years old segment with 23 transactions. All told, there was an average of 7 transactions per year of build with a total of 197 transactions taking place including 22 sales for recycling.
On the very modern tonnage, there was a notable sale of fifteen MR2s all built in Hyundai Vinashin in Vietnam between 2019 and 2020 from Trafigura to Scorpio (jointly with four Aframaxes previously mentioned) for a total of $803 million. This deal involved a finance lease arrangement with a bareboat contract.
A significant volume of the activity in the MR2 sector was also related to sale and leaseback finance with at least 25 vessels being sold to different investors/banks for bareboat charter back to the sellers. Increased asset values, supported by the better performing chartering activity, helped different shipowners to find new refinancing opportunities both in Japan and China.
In the newbuilding market, 75 MR2s were ordered during 2019, equal to about 3.7 million deadweight. This is very similar to 2018, when the market saw some 3.5 million deadweight ordered.
In the MR1 sector, a significant portion of the activity came in the 10-15 years old segment which accounted for 32 of the 71 total reported completed transactions for further trading.
As in 2018, last year saw no MR1s ordered, leaving the orderbook with four units to be delivered in 2020 and one last unit in 2021.
2020 presents itself with shining potential and even glistering glory

Chemicals & Small Tankers
Headwinds still prevailing for chemical shipowners2019 was again marked by overcapacity in the chemical tanker market. Initially, owners were cautiously optimistic after several difficult years although their hopes did not fully materialise. There were some positive signs such as falling newbuilding deliveries during the year, but the general tone was still an imbalance between supply and demand.
59
MOSTRAUMChemical/Oil tanker, 10,556 dwt, delivered in 2019 by Chinese shipyard Avic Dingheng to Utkilen Shipping AS.
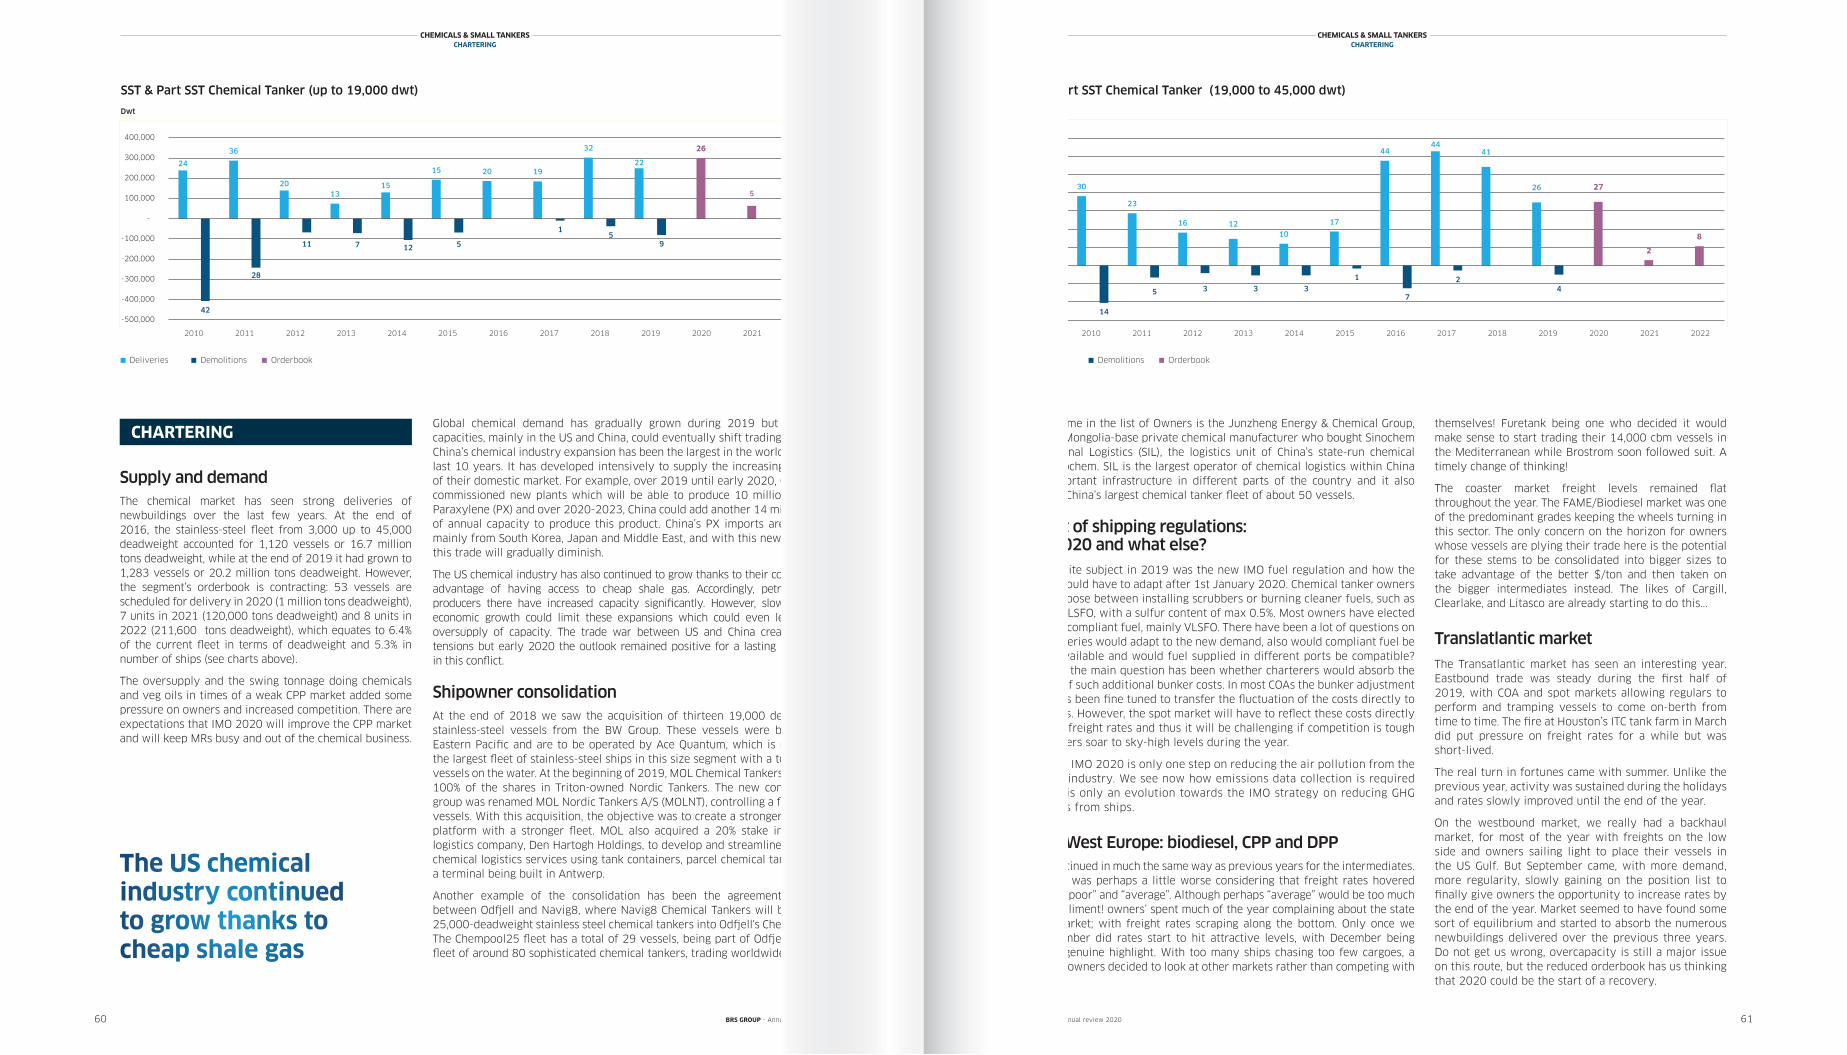
-500,000
-400,000
-300,000
-200,000
-100,000
-
100,000
200,000
300,000
400,000
dwt
SST & Part SST Chemical Tanker Fleet - Deliveries, Demolitions & Orderbook per year(up to 18,999 dwt)
2010 2011 2012 2013 2014 2015 2016 2017 2018 2019 2022
Deliveries Orderbook Demolitions
2020 2021
24
36
2013
15
15 20 19
32
22
2266
5
0
42
28
11 7 12 5
15
9
-600,000
-
400,000
1,000,000
1,400,000
2010 2011 2012 2013 2014 2015 2016 2017 2018 2019 2022
dwt
SST & Part SST Chemical Tanker Fleet - Deliveries , Demolitions & Orderbook per year (19,000 to 45,000 dwt)
Deliveries Orderbook Demolitions
2020 2021
1,200,000
600,000
200,000
800,000
-400,000
-200,000
22
30
23
16 1210
17
4444
41
26 2277
88
14
5 3 3 3
1
7
24
Supply and demandThe chemical market has seen strong deliveries of newbuildings over the last few years. At the end of 2016, the stainless-steel fleet from 3,000 up to 45,000 deadweight accounted for 1,120 vessels or 16.7 million tons deadweight, while at the end of 2019 it had grown to 1,283 vessels or 20.2 million tons deadweight. However, the segment’s orderbook is contracting: 53 vessels are scheduled for delivery in 2020 (1 million tons deadweight), 7 units in 2021 (120,000 tons deadweight) and 8 units in 2022 (211,600 tons deadweight), which equates to 6.4% of the current fleet in terms of deadweight and 5.3% in number of ships (see charts above).
The oversupply and the swing tonnage doing chemicals and veg oils in times of a weak CPP market added some pressure on owners and increased competition. There are expectations that IMO 2020 will improve the CPP market and will keep MRs busy and out of the chemical business.
CHARTERINGGlobal chemical demand has gradually grown during 2019 but the new capacities, mainly in the US and China, could eventually shift trading patterns. China’s chemical industry expansion has been the largest in the world over the last 10 years. It has developed intensively to supply the increasing demand of their domestic market. For example, over 2019 until early 2020, China has commissioned new plants which will be able to produce 10 million tons of Paraxylene (PX) and over 2020-2023, China could add another 14 million tons of annual capacity to produce this product. China’s PX imports are sourced mainly from South Korea, Japan and Middle East, and with this new capacity, this trade will gradually diminish.
The US chemical industry has also continued to grow thanks to their competitive advantage of having access to cheap shale gas. Accordingly, petrochemical producers there have increased capacity significantly. However, slower global economic growth could limit these expansions which could even lead to an oversupply of capacity. The trade war between US and China created some tensions but early 2020 the outlook remained positive for a lasting resolution in this conflict.
Shipowner consolidationAt the end of 2018 we saw the acquisition of thirteen 19,000 deadweight stainless-steel vessels from the BW Group. These vessels were bought by Eastern Pacific and are to be operated by Ace Quantum, which is managing the largest fleet of stainless-steel ships in this size segment with a total of 33 vessels on the water. At the beginning of 2019, MOL Chemical Tankers acquired 100% of the shares in Triton-owned Nordic Tankers. The new consolidated group was renamed MOL Nordic Tankers A/S (MOLNT), controlling a fleet of 75 vessels. With this acquisition, the objective was to create a stronger business platform with a stronger fleet. MOL also acquired a 20% stake in a Dutch logistics company, Den Hartogh Holdings, to develop and streamline its liquid chemical logistics services using tank containers, parcel chemical tankers and a terminal being built in Antwerp.
Another example of the consolidation has been the agreement reached between Odfjell and Navig8, where Navig8 Chemical Tankers will bring four 25,000-deadweight stainless steel chemical tankers into Odfjell's Chempool25. The Chempool25 fleet has a total of 29 vessels, being part of Odfjell’s global fleet of around 80 sophisticated chemical tankers, trading worldwide.
A new name in the list of Owners is the Junzheng Energy & Chemical Group, an Inner Mongolia-base private chemical manufacturer who bought Sinochem International Logistics (SIL), the logistics unit of China’s state-run chemical giant Sinochem. SIL is the largest operator of chemical logistics within China with important infrastructure in different parts of the country and it also operates China’s largest chemical tanker fleet of about 50 vessels.
Impact of shipping regulations:IMO 2020 and what else?The favorite subject in 2019 was the new IMO fuel regulation and how the market would have to adapt after 1st January 2020. Chemical tanker owners had to choose between installing scrubbers or burning cleaner fuels, such as MGO or VLSFO, with a sulfur content of max 0.5%. Most owners have elected to burn a compliant fuel, mainly VLSFO. There have been a lot of questions on how refineries would adapt to the new demand, also would compliant fuel be widely available and would fuel supplied in different ports be compatible? However, the main question has been whether charterers would absorb the entirety of such additional bunker costs. In most COAs the bunker adjustment clause has been fine tuned to transfer the fluctuation of the costs directly to charterers. However, the spot market will have to reflect these costs directly in higher freight rates and thus it will be challenging if competition is tough and bunkers soar to sky-high levels during the year.
However, IMO 2020 is only one step on reducing the air pollution from the shipping industry. We see now how emissions data collection is required and this is only an evolution towards the IMO strategy on reducing GHG emissions from ships.
North West Europe: biodiesel, CPP and DPP2019 continued in much the same way as previous years for the intermediates. Indeed, it was perhaps a little worse considering that freight rates hovered between “poor” and “average”. Although perhaps “average” would be too much of a compliment! owners’ spent much of the year complaining about the state of the market; with freight rates scraping along the bottom. Only once we hit November did rates start to hit attractive levels, with December being the sole genuine highlight. With too many ships chasing too few cargoes, a couple of owners decided to look at other markets rather than competing with
themselves! Furetank being one who decided it would make sense to start trading their 14,000 cbm vessels in the Mediterranean while Brostrom soon followed suit. A timely change of thinking!
The coaster market freight levels remained flat throughout the year. The FAME/Biodiesel market was one of the predominant grades keeping the wheels turning in this sector. The only concern on the horizon for owners whose vessels are plying their trade here is the potential for these stems to be consolidated into bigger sizes to take advantage of the better $/ton and then taken on the bigger intermediates instead. The likes of Cargill, Clearlake, and Litasco are already starting to do this...
Translatlantic market
The Transatlantic market has seen an interesting year. Eastbound trade was steady during the first half of 2019, with COA and spot markets allowing regulars to perform and tramping vessels to come on-berth from time to time. The fire at Houston’s ITC tank farm in March did put pressure on freight rates for a while but was short-lived.
The real turn in fortunes came with summer. Unlike the previous year, activity was sustained during the holidays and rates slowly improved until the end of the year.
On the westbound market, we really had a backhaul market, for most of the year with freights on the low side and owners sailing light to place their vessels in the US Gulf. But September came, with more demand, more regularity, slowly gaining on the position list to finally give owners the opportunity to increase rates by the end of the year. Market seemed to have found some sort of equilibrium and started to absorb the numerous newbuildings delivered over the previous three years. Do not get us wrong, overcapacity is still a major issue on this route, but the reduced orderbook has us thinking that 2020 could be the start of a recovery.
60 61
CHEMICALS & SMALL TANKERSCHARTERING
CHEMICALS & SMALL TANKERSCHARTERING
SST & Part SST Chemical Tanker (up to 19,000 dwt)
Dwt
-500,000
-400,000
-300,000
-200,000
-100,000
-
100,000
200,000
300,000
400,000
dwt
SST & Part SST Chemical Tanker Fleet - Deliveries, Demolitions & Orderbook per year(up to 18,999 dwt)
2010 2011 2012 2013 2014 2015 2016 2017 2018 2019 2022
Deliveries Orderbook Demolitions
2020 2021
24
36
2013
15
15 20 19
32
22
2266
5
0
42
28
11 7 12 5
15
9
-600,000
-
400,000
1,000,000
1,400,000
2010 2011 2012 2013 2014 2015 2016 2017 2018 2019 2022
dwt
SST & Part SST Chemical Tanker Fleet - Deliveries , Demolitions & Orderbook per year (19,000 to 45,000 dwt)
Deliveries Orderbook Demolitions
2020 2021
1,200,000
600,000
200,000
800,000
-400,000
-200,000
22
30
23
16 1210
17
4444
41
26 2277
88
14
5 3 3 3
1
7
24
SST & Part SST Chemical Tanker (19,000 to 45,000 dwt)
Dwt
2018 2019 20202010 2011 2012 2013 2014 2015 2016 2017 2021 2022
BRS GROUP - Annual review 2020 BRS GROUP - Annual review 2020
Deliveries Demolitions Orderbook
2018 2019 20202010 2011 2012 2013 2014 2015 2016 2017 2021 2022
Deliveries Demolitions Orderbook
The US chemical industry continued to grow thanks to cheap shale gas

Small tankers and chemical carriers (3,000-25,000 dwt)2019 marked a return to normal levels of activity as witnessed at the end of the 2010’s with some 110 sales recorded during the year (including 33 stainless steel vessels).
The gigantic enbloc sale of thirteen stainless steel so-called “J-19” units from BW to Eastern Pacific in January 2019 was the last of the series, as Chinese and Japanese leasing institutions have left the small tanker/chemical scene and massively made it to the crude and container markets.
As a further illustration of a constantly ageing fleet, the average age of vessels sold continued to decrease, reaching 14 years in 2019 (13 years in 2018, 12 in 2017 and 11 in 2016). Buyers buy what they can afford and what they can finance in an uncertain environment. The orderbook remains quite timid and represents not more than 5.6% of the active fleet.
The average size of coated tankers sold in this segment is now 10,000 dwt. This demonstrates buyers’ greater appetite for larger sizes offering better returns/Opex ratio than the smaller units which are clearly facing challenging times with respect to operational competitiveness.
Bunker prices have been a little sweeter to owners and the yearly average stood at $347/ton for heavy fuel oil (HFO) basis Rotterdam delivery (15% cheaper than in 2018). This converts to more than a $1,000 saving per day sailing for a laden coated 13,000 dwt vessel.
Scrapping has been a little disappointing with only 40 vessels sent to the scrapyards. Owners naturally tried to stretch vessels’ deployment as late as possible before the Sulphur doomsday of 31 December 2019. Consequently, more than 70% of this scrapping activity occurred during the second half of the year. Overall, demolition represented a mere 440,000 dwt (1.0% of the active fleet), even a little less than in 2018. The average age of scrap remained unchanged and alarmingly high at 32 years.
The bitumen tanker market remains under significant stress although the demand-side fundamentals for the product itself are quite positive. Infrastructure investments are picking up again in Europe after a long pause of public spending in the post-2008 financial meltdown era. Major road construction projects are on the rise in several areas (Southern Europe, Russia, India, Egypt etc.). On the supply side however, the bitumen segment is locked in overcapacity. Contrary to the small coated and stainless-steel markets, the quality of tonnage built by Chinese yards for local speculative investors is nearly on a par with that of vessels contracted by owners from the Western hemisphere. These Chinese built ships now belong to the eligible fleet to some extent. These extra deliveries weigh on rates on a global scale: during 2016-17, no less than 17 new vessels representing 155,000 dwt have been delivered to Chinese investors.
In 2017 the order book represented 13 times the scrapping activity of that year. However, 2018 and 2019 saw no ordering and almost no scrapping either (only one ship demolished). No addition to the fleet is expected in 2020 and beyond. Quite predictably, second-hand sales prices showed a dramatic dive (15% to 25% depending on size and vintage). New orders have taken a pause since 2018 but we expect them to start again for vessels of no less than 10,000 dwt (a size able to meet the demand for longer routes due the shrinking number of bitumen-producing refineries).
62 63
SECOND HAND MARKET
ConclusionAs we wrote early 2019, we forecast 2020 to be the year of the phoenix for small tankers (especially coated units) and bitumen tankers. The intermediate period when LSFO/HFO/MDO bunkers will coexist should mechanically increase the demand for transport thanks to the higher segregation required. Bunkering bottlenecks may artificially reduce the supply of tonnage while slow steaming should also play a role. Furthermore, we expect more owners to lower their rate of utilization rather than accepting to ballast. This should support rates on a face-value basis (with longer waiting times between spot shipments) and potentially entice charterers to finally resort to period time-charters to secure the youngest or most fuel-efficient units.
Considering these assumptions, the implementation of the Sulphur cap will probably be the Deus Ex-Machina that will save owners from their own collective lack of cautiousness observed in the past with their regular waves of excessive ordering. Those have wiped out any sense of the supply/demand balance during the last decade and have ultimately been cruel to the owners themselves. We expect 2020 to be a better year for owners’ returns who should resort more to shipbuilding given the aging fleet (60.3% of which will be already more than 15 years old by the end of 2020). Furthermore, dual fuel engines are also expected to gradually increase their market share in the orderbook.
Let’s hope they will resist over ordering and, as Albert Einstein never actually said himself, "The definition of insanity is doing the same thing over and over again and expecting different results.”
Far East Asia marketsThe Far East Asia markets were firm in the early part of 2019. The introduction of ECAs in China, Taiwan and Hong Kong on 1st January 2019 required ships transiting these waters to use bunker fuels with sulphur content of 0.5% or less which caused some upward pressure on freight rates. Bad weather in early 2019 saw space getting tight for vessels trading in the region. Spot activities in the Intra-Far East trade lanes picked up after the Chinese new-year holidays with tonnage for March being quickly booked. The summer season was poor, most owners struggled to fill up their space with lower freight rates until the typhoon season came which resulted in extensive delays and freight rates rising accordingly.
Bunker prices became a focus in negotiations during Q4 as the IMO’s 2020 0.5% global sulfur cap loomed large. In November, we saw an increase of about $3-5 per ton in freight rates as owners switched from high to low sulphur fuels for intra-Asia trade. It is anticipated that due to the switch to compliant bunker fuels, owners will maintain a freight premium for at least the first few months of 2020.
Chinese domestic marketThe total capacity of the domestic fleet remained stable in 2019 as very limited resources were allocated for the new buildings. The fundamental demand was also underpinned by the stable macro-economic picture. Meanwhile, bunker prices were relatively stable throughout the year. All told, average freight levels remained relatively flat compared
In 2018 and 2019, there was
no ordering and almost no
scrapping either
CHEMICALS & SMALL TANKERSCHARTERING
CHEMICALS & SMALL TANKERSSECOND HAND MARKET
ConclusionOvercapacity has been the major concern in the chemical tanker market during the past few years and this remained the case in 2019. However, the figures are showing that the newbuilding fever seems behind us and that the orderbook has contracted sharply. Looking into the future, owners will have to deal with weaker global economic growth, which could induce weaker chemical demand. Meanwhile, geopolitical tensions such as those placed on Iran, changes in commercial agreements such as Brexit, the US next election and maybe even stricter environmental legislation will also exert influence on the sector. However, we expect to see a better-balanced market as the demand for chemicals is projected to be stronger than the expected growth in the chemical tanker fleet. Meanwhile, IMO 2020 continues to provide hopes that a firming clean tanker market will see less MR tonnage looking to enter the chemical market. The question is whether 2020 will be the turning point for the tailwinds.
Picture: ATLANTIS ALHAMBRA , Chemical/Oil tanker, 6,435 dwt, built in 2009 by Yildirim Tersanesi in Turkey, operated by Atlantis Tankers Group. BRS GROUP - Annual review 2020 BRS GROUP - Annual review 2020
with 2018. Last year also saw some new refineries and chemical plants commissioned. These large-scale, privately owned and fully integrated refinery and chemical projects had a significant influence on product flows. Early 2020, Dalian Hengli and Zhejiang Petroleum and Chemical were ramping-up their output. More and more of these types of projects are expected to come into operation over the next few years including ShengHong Petrochemical and Hengyi Petrochemical. These private integrated projects can produce a whole series of products from upstream raw materials to downstream products. China will become more and more self-sufficient and less dependent on imports. This will increase the demand for domestic shipping.
Turning a cornerEventually, after many years of false hopes and false dawns, 2019 went down as the year when the LPG market turned as tanker demand finally rose to meet fleet capacity. Indeed, over 2016-18 strong tonnage growth which consistently outpaced demand growth, had acted as a millstone to rates. As this weight was discarded, rates were able to strengthen from early-year onwards so that when they faced headwinds in seasonally weaker demand or demand / supply imbalances, they did not return to the depths plumbed over the previous few years. Accordingly, this saw the Baltic Exchange Liquid Petroleum Gas Index (BLPG), the LPG market benchmark, average 58k per day, its highest since 2015 and 67% higher than across 2018.
65
LPG
SEASPEEDLPG Tanker, 37,390 cbm, delivered in 2017 by Hyundai Mipo Dockyard to Thenamaris.
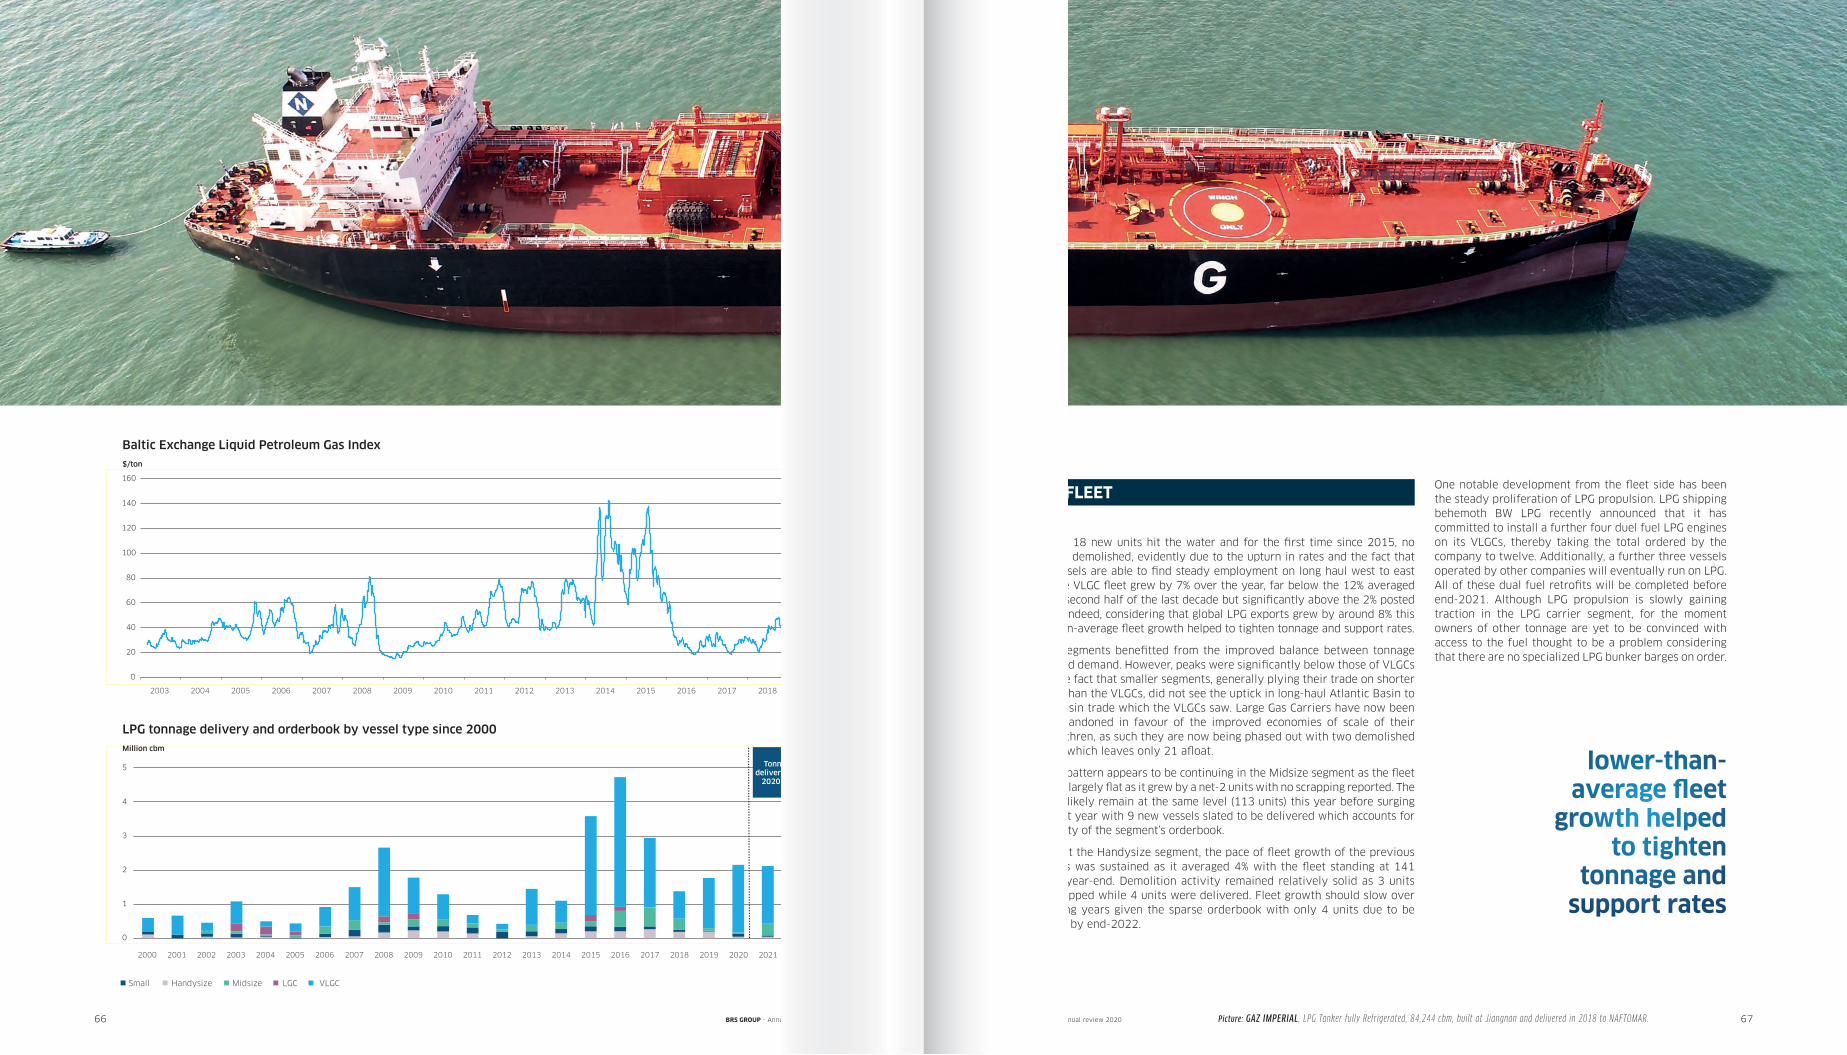
cbm
LPG delivery breakdown and orderbook by vessel type since 2000
2000 2001 2002 2003 2004 2005 2006 2007 2008 2009 2010 2011 2012 2013 2014 2015 2016 2017 2018 2019 2020 2021 2022
25
10
24 20
1
0
500,000
1,000,000
1,500,000
2,000,000
2,500,000
2017 2018 2019 2020 2021
CbmVLGC Deliveries & Orderbook
0
20
40
60
80
100
120
140
160
2003 2004 2005 2006 2007 2008 2009 2010 2011 2012 2013 2014 2015 2017 2018
$/ton Baltic Exchange Liquid Petroleum Gas Index
2016 2019
0
1
2
3
4
5
6
handysize small midsize lgc vlgc
20182003 2004 2005 2006 2007 2008 2009 2010 2011 2012 2013 2014 2015 2016 2019
66 67Picture: GAZ IMPERIAL , LPG Tanker fully Refrigerated, 84,244 cbm, built at Jiangnan and delivered in 2018 to NAFTOMAR.
One notable development from the fleet side has been the steady proliferation of LPG propulsion. LPG shipping behemoth BW LPG recently announced that it has committed to install a further four duel fuel LPG engines on its VLGCs, thereby taking the total ordered by the company to twelve. Additionally, a further three vessels operated by other companies will eventually run on LPG. All of these dual fuel retrofits will be completed before end-2021. Although LPG propulsion is slowly gaining traction in the LPG carrier segment, for the moment owners of other tonnage are yet to be convinced with access to the fuel thought to be a problem considering that there are no specialized LPG bunker barges on order.
cbm
LPG delivery breakdown and orderbook by vessel type since 2000
2000 2001 2002 2003 2004 2005 2006 2007 2008 2009 2010 2011 2012 2013 2014 2015 2016 2017 2018 2019 2020 2021 2022
25
10
24 20
1
0
500,000
1,000,000
1,500,000
2,000,000
2,500,000
2017 2018 2019 2020 2021
CbmVLGC Deliveries & Orderbook
0
20
40
60
80
100
120
140
160
2003 2004 2005 2006 2007 2008 2009 2010 2011 2012 2013 2014 2015 2017 2018
$/ton Baltic Exchange Liquid Petroleum Gas Index
2016 2019
0
1
2
3
4
5
6
handysize small midsize lgc vlgc
Baltic Exchange Liquid Petroleum Gas Index$/ton
Small Handysize Midsize
LPG tonnage delivery and orderbook by vessel type since 2000Million cbm
2000 2003 2004 2005 2006 2007 2008 2009 2010 2011 2012 2013 2014 2015 2016 20202017 2018 201920022001
Tonnage to bedelivered between
2020 and 2022
LGC VLGC
lower-than-average fleet
growth helped to tighten
tonnage and support rates
2017
BRS GROUP - Annual review 2020 BRS GROUP - Annual review 2020
Last year, 18 new units hit the water and for the first time since 2015, no VLGC was demolished, evidently due to the upturn in rates and the fact that these vessels are able to find steady employment on long haul west to east trade. The VLGC fleet grew by 7% over the year, far below the 12% averaged over the second half of the last decade but significantly above the 2% posted in 2018. Indeed, considering that global LPG exports grew by around 8% this lower-than-average fleet growth helped to tighten tonnage and support rates.
Smaller segments benefitted from the improved balance between tonnage supply and demand. However, peaks were significantly below those of VLGCs due to the fact that smaller segments, generally plying their trade on shorter voyages than the VLGCs, did not see the uptick in long-haul Atlantic Basin to Pacific Basin trade which the VLGCs saw. Large Gas Carriers have now been all-but-abandoned in favour of the improved economies of scale of their VLGC brethren, as such they are now being phased out with two demolished last year which leaves only 21 afloat.
A similar pattern appears to be continuing in the Midsize segment as the fleet remained largely flat as it grew by a net-2 units with no scrapping reported. The fleet will likely remain at the same level (113 units) this year before surging again next year with 9 new vessels slated to be delivered which accounts for the entirety of the segment’s orderbook.
Looking at the Handysize segment, the pace of fleet growth of the previous few years was sustained as it averaged 4% with the fleet standing at 141 units by year-end. Demolition activity remained relatively solid as 3 units were scrapped while 4 units were delivered. Fleet growth should slow over the coming years given the sparse orderbook with only 4 units due to be delivered by end-2022.
THE FLEET
20222021

LPGCHARTERING
68 69Picture: GASCHEM RHONE , LPG Tanker, 6,460 cbm, delivered in 2008 by Severnav to Hartmann and commercially operated by Gaschem Services.
2019 saw a reduction in the general activity across the second hand market with only slightly more than 90 units changing hands, representing a decrease of about 10% in the number of transactions compared with 2018. Overall the increased chartering market for bigger units did not translate into increased sales and purchasing activity due to rising price expectations. In the Midsize segments a number of existing players left while new players entered which saw a slight uptick in activity levels despite the fact that prices generally held steady at 2018 levels. Finally, the number of transactions for further trading held steady in the smaller segments both in terms of pricing and number of vessels sold.
A common underlying factor for the different segment is found in the drop in the demolition values which kept cash buyers and demolition yards more cautious. This saw less vessels exiting the market than over previous years.
VLGC – 75,000 cbm + An increase in VLGC chartering has led to a reduction in the number of transactions in the segment with only a total of 20 confirmed sales. The overall increase in rates from about $20,000/day to $40,000/day has led to a difference in the expectations of buyers and sellers. Thereby making it more difficult to find common ground and thus the ticket to purchase secondhand tonnage.
The only transaction reported for modern tonnage was a Hyundai Samho Heavy VGLC sold by Trafigura to a Japanese Leasing house on a 15 years leaseback basis for $73.5 million. If there were more transactions this could represent a reduction of the prices from 2018 but given the specific financial nature of the deal it is not possible to use it as a reference point for all modern tonnage.
To complete the picture, six transactions took place in the early 2000-built segment, and nine in the early 90s-built segment, with most of them destined to head to the Far East for further trading.
A notable development in the 10-15 years old age range, was that Eastern Pacific joined the LGC Owners by adding 3 Hyundai Heavy Ulsan 2009-built units to their fleet for a rumored $45 million each.
Midsize – 24,000 to 42,999 cbm 2019 was an interesting year also for the Midsize segment. While overall activity was reduced to less than ten confirmed transactions, there was less demolition and fragmented activity over the various age classes.
Among the notable transactions involving modern tonnage was the sale with 10-year leaseback from Navigator to Ocean Yield of the 2016-built dual-fuel HFO/Ethane Navigator Aurora. The deal for this Jiangnan Shipyard-constructed vessel was reported at $69.75 million.
Among the slightly older units, K Line sold their two last 2007 built 38,000 cbm-capacity carriers to Stealth and Naviera Transoceanica for about $20 million each, thereby exiting the Midsize segment for the time being.
Handysize – 13,001 to 23,999 cbm 2019 was particularly interesting for the Handysize segment with ten transactions taking place. A Nantong Cimc Sinopacific resale was reportedly sold to Hartman with a 10% discount from the original contractual price of about $50 million. Two early 2000-built units found a new life in Indonesia with prices in the mid $10 million range. Meanwhile, four transactions for 90s-built units were reported with half of them going to Vietnam, and three 80s units were sold for demotion.
Small LPG – 13,000 cbm and below
Following lively activity in the small vessel segment during 2018, momentum was maintained in 2019. Although the number of units sold for demolition dropped by almost 50%, some compensation came from an increase in the number of vessels sold for further trading. All told, this supported activity so that more than 50 transactions were reported in 2019.
Among modern tonnage, two events were particularly no-table last year. Firstly EPIC Gas’s purchase of four 2015-built pressurized 11,000 cbm units from Petredec. Secondly, Unigas’ Pool Partners acquisition of eight 2013/2014-built Nantong Sinopacific 12,000 cbm Ethylene carriers for about $25 million each, representing a $13 million discount from their ordering price.
A significant portion of the activity on older tonnage involved Far Eastern Buyers for local trade, very much in line with the trend of previous years.
SECOND HAND MARKET
10
20
30
40
50
60
0
2010 2011 2012 2013 2014 2015 2016 2017 2018 2019
U.S. Exports to ROW of LPG U.S. Exports to China of LPG
Million barrels per month
US LPG export to China and the rest of the world
100
200
300
400
500
600
700
US$/MT
Saudi Arabia propane & butane prices
Propane Butane
Million barrels/month
US LPG export to China and the Rest of the World
2011
Chinese charterers continued to shun US LPG in view of the escalating US – China trade war
BRS GROUP - Annual review 2020 BRS GROUP - Annual review 2020
incremental supplies from the US. One sign of this was the development of a joint LPG shipping venture between the UAE’s ADNOC Logistics & Services and Chinese firm Wanhua Chemical, backed by a 10-year LPG supply contract and involving the operation of two VLGCs.
Away from the two big stories of China (demand) and the US (supply), the picture was less positive with the growth seen over the previous couple of years in the production and exports of LPG from certain countries slowing. For example, production and exports of Saudi Arabian LPG were disrupted by the September attack on the Abqaiq oil processing plant. Meanwhile, supply from other OPEC countries such as Algeria disappointed in the wake of their oil supply-limiting deal.
Another notable shift was the emergence of Canada as an LPG exporter. The completion of the Ridley Island Propane Export Terminal in British Columbia saw Western Canadian producers finally able to access lucrative Pacific Basin markets rather than being tied to the whims of the US market. Flows from Western Canada should continue to rise towards 75 kb/d by the end of 2020 as the Price Rupert terminal comes online. All of this supply is expected to be shipped by VLGCs to Asia.
2019 will likely be remembered as the year that prices and arbitrage mattered little since it was largely geopolitics, trade wars and sanctions which dictated LPG trade flows.
Even considering their growth over the previous five years, 2019 saw US LPG exports go from strength to strength and hit an astounding 1.8 mb/d, more double the volume of four years previous. Consequently this was the largest source of ton mile demand growth in the sector last year. However, while China previously purchased a large proportion of incremental US LPG exports, last year Chinese charterers continued to shun US LPG in view of the escalating US – China trade war which saw Beijing hike punitive import tariffs on imports of US butane and propane. Therefore, US LPG market players had to work to find new markets with flows to Europe, Western Africa and elsewhere in Asia consequently picking up.
As China continued to expand its petrochemical capacity apace, it increased its LPG imports by around 50 kb/d. As it looked beyond the US to supply incremental demand, China hiked its imports from Iran by 30% so that by the end of the year they hit 150 kb/d. This was helped by Iranian suppliers aggressively marketing their LPG with prices sitting below comparable Middle Eastern supplies. Indeed, in view of tighter US sanctions, China remained one of only a few willing buyers of Iranian LPG, although it had curbed purchases by about half by the end of the year in the wake of maintenance and likely US political pressure. Heading into 2020 it looks as though following their Phase 1 trade deal, LPG flows between the US and China will resume, potentially exceeding the record 120 kb/d which was imported in 2017. Considering the US administration’s well-publicised objective of forcing Iran’s energy exports to zero, it seems plausible that the reemergence of imports of US LPG will see Chinese imports of Iranian LPG slump further.
China appears to be looking more and more towards the Middle East for supply considering the shorter voyage distance compared with the Atlantic Basin and the fact that its needs future needs (Chinese LPG imports are expected to grow by 25% over 2020-25) are likely to outstrip
CHARTERING
2010 201520132012 2014 201920172016 2018
US exports to China of LPGUS exports to ROW of LPG
71
LNG
2019: a year of performanceLNG supply reached 360 million tons in 2019, an increase of around 40 million tons compared with 2018. The commercial startup of new liquefaction plants reached a record in 2019 surpassing the previous high posted in 2009.
SCF LA PEROUSE174,000 cbm membrane LNG Carrier built by Hyundai Heavy Industries, to be delivered to Sovcomflot in 2020.
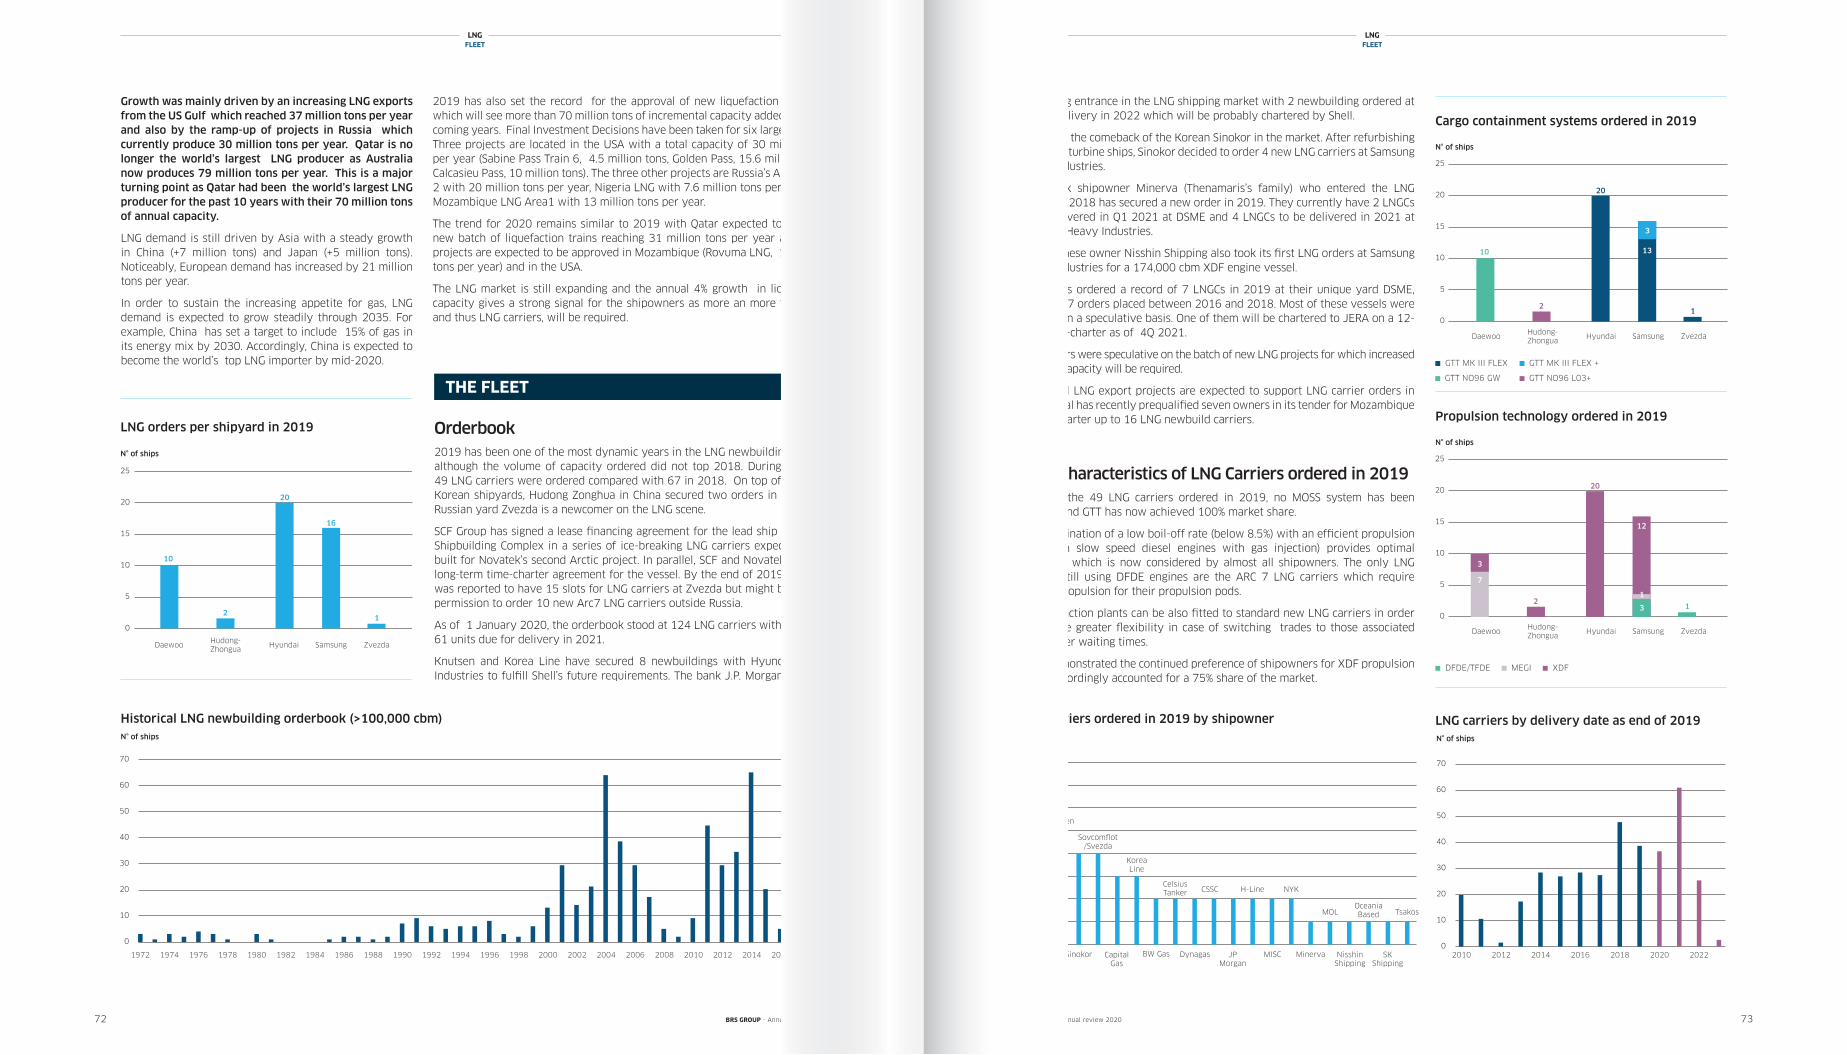
interesting entrance in the LNG shipping market with 2 newbuilding ordered at SHI for delivery in 2022 which will be probably chartered by Shell.
2019 saw the comeback of the Korean Sinokor in the market. After refurbishing old steam turbine ships, Sinokor decided to order 4 new LNG carriers at Samsung Heavy Industries.
The Greek shipowner Minerva (Thenamaris’s family) who entered the LNG market in 2018 has secured a new order in 2019. They currently have 2 LNGCs to be delivered in Q1 2021 at DSME and 4 LNGCs to be delivered in 2021 at Samsung Heavy Industries.
The Japanese owner Nisshin Shipping also took its first LNG orders at Samsung Heavy Industries for a 174,000 cbm XDF engine vessel.
Maran Gas ordered a record of 7 LNGCs in 2019 at their unique yard DSME, following 7 orders placed between 2016 and 2018. Most of these vessels were ordered on a speculative basis. One of them will be chartered to JERA on a 12-year time-charter as of 4Q 2021.
Most orders were speculative on the batch of new LNG projects for which increased shipping capacity will be required.
Additional LNG export projects are expected to support LNG carrier orders in 2020. Total has recently prequalified seven owners in its tender for Mozambique LNG to charter up to 16 LNG newbuild carriers.
Main Characteristics of LNG Carriers ordered in 2019Amongst the 49 LNG carriers ordered in 2019, no MOSS system has been ordered and GTT has now achieved 100% market share.
The combination of a low boil-off rate (below 8.5%) with an efficient propulsion (based on slow speed diesel engines with gas injection) provides optimal efficiency which is now considered by almost all shipowners. The only LNG carriers still using DFDE engines are the ARC 7 LNG carriers which require electric propulsion for their propulsion pods.
Re-liquefaction plants can be also fitted to standard new LNG carriers in order to provide greater flexibility in case of switching trades to those associated with longer waiting times.
2019 demonstrated the continued preference of shipowners for XDF propulsion which accordingly accounted for a 75% share of the market.
LNGFLEET
72 73
0
25
50
75
100
125
150
175
200
Jan- Feb- Mar- Apr- May- Jun- Jul- Aug- Sep- Oct- Nov- Dec-
K$/dayLNG spot rate in 2019
Proxy spot index 174Kcbm XDF
0
5
10
15
20
25
N° of shipsPropulsion technology ordered in 2019
XDF MEGI DFDE/TFDE
0
5
10
15
20
25
N° of shipsCargo containment systems ordered in 2019
GTT MK III FLEX GTT MK III FLEX + GTT NO96 GW
Daewoo Hyundai ZvezdaHudong-Zhonghua Samsung
10
2
20
1
GTT NO96 L03+
13
3
Daewoo Hyundai ZvezdaHudong-Zhonghua Samsung
2
20
1
12
3
1
7
3
0
1
2
3
4
5
N° of shipsLNG carriers ordered in 2019 by shipowner
6
7
8
Maran GazOceania Based TsakosKnutsen
SK Shipping
0
10
20
30
40
50
60
70
N° of vessels
Historical LNG newbuilding activity
20191972 1975 1980 1985 1990 1995 2005 2010 20152000
THE FLEET
0
10
20
30
40
50
60
70
N° of vessels
LNG carriers by delivery date as of 31 december 2019
1910 2023
2016
Historical LNG newbuilding orderbook (>100,000 cbm)N° of ships
20191972 1976 1980 1984 1988 1992 1996 2000 2004 2008 2012 20141974 1978 1982 1986 1990 1994 1998 2002 2006 2010
2019 has also set the record for the approval of new liquefaction capacity which will see more than 70 million tons of incremental capacity added over the coming years. Final Investment Decisions have been taken for six large projects. Three projects are located in the USA with a total capacity of 30 million tons per year (Sabine Pass Train 6, 4.5 million tons, Golden Pass, 15.6 million tons , Calcasieu Pass, 10 million tons). The three other projects are Russia’s Arctic LNG-2 with 20 million tons per year, Nigeria LNG with 7.6 million tons per year and Mozambique LNG Area1 with 13 million tons per year.
The trend for 2020 remains similar to 2019 with Qatar expected to launch a new batch of liquefaction trains reaching 31 million tons per year and other projects are expected to be approved in Mozambique (Rovuma LNG, 15 million tons per year) and in the USA.
The LNG market is still expanding and the annual 4% growth in liquefaction capacity gives a strong signal for the shipowners as more an more ton-miles, and thus LNG carriers, will be required.
LNGFLEET
Orderbook2019 has been one of the most dynamic years in the LNG newbuilding market, although the volume of capacity ordered did not top 2018. During the year, 49 LNG carriers were ordered compared with 67 in 2018. On top of the three Korean shipyards, Hudong Zonghua in China secured two orders in 2019 and Russian yard Zvezda is a newcomer on the LNG scene.
SCF Group has signed a lease financing agreement for the lead ship at Zvezda Shipbuilding Complex in a series of ice-breaking LNG carriers expected to be built for Novatek’s second Arctic project. In parallel, SCF and Novatek signed a long-term time-charter agreement for the vessel. By the end of 2019, Novatek was reported to have 15 slots for LNG carriers at Zvezda but might be seeking permission to order 10 new Arc7 LNG carriers outside Russia.
As of 1 January 2020, the orderbook stood at 124 LNG carriers with a peak of 61 units due for delivery in 2021.
Knutsen and Korea Line have secured 8 newbuildings with Hyundai Heavy Industries to fulfill Shell’s future requirements. The bank J.P. Morgan made an
THE FLEET
0
25
50
75
100
125
150
175
200
Jan- Feb- Mar- Apr- May- Jun- Jul- Aug- Sep- Oct- Nov- Dec-
K$/dayLNG spot rate in 2019
Proxy spot index 174Kcbm XDF
0
5
10
15
20
25
N° of shipsPropulsion technology ordered in 2019
XDF MEGI DFDE/TFDE
0
5
10
15
20
25
N° of shipsCargo containment systems ordered in 2019
GTT MK III FLEX GTT MK III FLEX + GTT NO96 GW
Daewoo Hyundai ZvezdaHudong-Zhonghua Samsung
10
2
20
1
GTT NO96 L03+
13
3
Daewoo Hyundai ZvezdaHudong-Zhonghua Samsung
2
20
1
12
3
1
7
3
0
1
2
3
4
5
N° of shipsLNG carriers ordered in 2019 by shipowner
6
7
8
Maran GazOceania Based TsakosKnutsen
SK Shipping
0
10
20
30
40
50
60
70
N° of vessels
Historical LNG newbuilding activity
20191972 1975 1980 1985 1990 1995 2005 2010 20152000
THE FLEET
0
10
20
30
40
50
60
70
N° of vessels
LNG carriers by delivery date as of 31 december 2019
1910 2023 Maran Gas
Knutsen
Sinokor
Celsius Tanker
JPMorgan
Minerva
Oceania BasedMOL Tsakos
LNG carriers ordered in 2019 by shipowner
BW Gas Dynagas
H-Line
KoreaLine
MISC
0
5
10
15
20
25
N° of shipsLNG orders by shipyard in 2019
Daewoo Hyundai ZvezdaHudong-Zhonghua Samsung
10
2
20
16
1
0
2
4
6
8
10
12
2018 2019
K$/day???LNG ??? 2019
NWEJKM HH
Samsung ZvezdaDaewoo
LNG orders per shipyard in 2019
0
25
50
75
100
125
150
175
200
Jan- Feb- Mar- Apr- May- Jun- Jul- Aug- Sep- Oct- Nov- Dec-
K$/dayLNG spot rate in 2019
Proxy spot index 174Kcbm XDF
0
5
10
15
20
25
N° of shipsPropulsion technology ordered in 2019
XDF MEGI DFDE/TFDE
0
5
10
15
20
25
N° of shipsCargo containment systems ordered in 2019
GTT MK III FLEX GTT MK III FLEX + GTT NO96 GW
Daewoo Hyundai ZvezdaHudong-Zhonghua Samsung
10
2
20
1
GTT NO96 L03+
13
3
Daewoo Hyundai ZvezdaHudong-Zhonghua Samsung
2
20
1
12
3
1
7
3
0
1
2
3
4
5
N° of shipsLNG carriers ordered in 2019 by shipowner
6
7
8
Maran GazOceania Based TsakosKnutsen
SK Shipping
0
10
20
30
40
50
60
70
N° of vessels
Historical LNG newbuilding activity
20191972 1975 1980 1985 1990 1995 2005 2010 20152000
THE FLEET
0
10
20
30
40
50
60
70
N° of vessels
LNG carriers by delivery date as of 31 december 2019
1910 2023
Cargo containment systems ordered in 2019
GTT MK III FLEX GTT MK III FLEX +
GTT NO96 GW
N° of ships
0
25
50
75
100
125
150
175
200
Jan- Feb- Mar- Apr- May- Jun- Jul- Aug- Sep- Oct- Nov- Dec-
K$/dayLNG spot rate in 2019
Proxy spot index 174Kcbm XDF
0
5
10
15
20
25
N° of shipsPropulsion technology ordered in 2019
XDF MEGI DFDE/TFDE
0
5
10
15
20
25
N° of shipsCargo containment systems ordered in 2019
GTT MK III FLEX GTT MK III FLEX + GTT NO96 GW
Daewoo Hyundai ZvezdaHudong-Zhonghua Samsung
10
2
20
1
GTT NO96 L03+
13
3
Daewoo Hyundai ZvezdaHudong-Zhonghua Samsung
2
20
1
12
3
1
7
3
0
1
2
3
4
5
N° of shipsLNG carriers ordered in 2019 by shipowner
6
7
8
Maran GazOceania Based TsakosKnutsen
SK Shipping
0
10
20
30
40
50
60
70
N° of vessels
Historical LNG newbuilding activity
20191972 1975 1980 1985 1990 1995 2005 2010 20152000
THE FLEET
0
10
20
30
40
50
60
70
N° of vessels
LNG carriers by delivery date as of 31 december 2019
1910 2023
Propulsion technology ordered in 2019
DFDE/TFDE MEGI
N° of ships
N° of ships
N° of ships
BRS GROUP - Annual review 2020 BRS GROUP - Annual review 2020
Growth was mainly driven by an increasing LNG exports from the US Gulf which reached 37 million tons per year and also by the ramp-up of projects in Russia which currently produce 30 million tons per year. Qatar is no longer the world’s largest LNG producer as Australia now produces 79 million tons per year. This is a major turning point as Qatar had been the world’s largest LNG producer for the past 10 years with their 70 million tons of annual capacity.
LNG demand is still driven by Asia with a steady growth in China (+7 million tons) and Japan (+5 million tons). Noticeably, European demand has increased by 21 million tons per year.
In order to sustain the increasing appetite for gas, LNG demand is expected to grow steadily through 2035. For example, China has set a target to include 15% of gas in its energy mix by 2030. Accordingly, China is expected to become the world’s top LNG importer by mid-2020.
Hudong-Zhongua
Hyundai
Capital Gas
Sovcomflot/Svezda
CSSC NYK
Nisshin Shipping
SKShipping
0
25
50
75
100
125
150
175
200
Jan- Feb- Mar- Apr- May- Jun- Jul- Aug- Sep- Oct- Nov- Dec-
K$/dayLNG spot rate in 2019
Proxy spot index 174Kcbm XDF
0
5
10
15
20
25
N° of shipsPropulsion technology ordered in 2019
XDF MEGI DFDE/TFDE
0
5
10
15
20
25
N° of shipsCargo containment systems ordered in 2019
GTT MK III FLEX GTT MK III FLEX + GTT NO96 GW
Daewoo Hyundai ZvezdaHudong-Zhonghua Samsung
10
2
20
1
GTT NO96 L03+
13
3
Daewoo Hyundai ZvezdaHudong-Zhonghua Samsung
2
20
1
12
3
1
7
3
0
1
2
3
4
5
N° of shipsLNG carriers ordered in 2019 by shipowner
6
7
8
Maran GazOceania Based TsakosKnutsen
SK Shipping
0
10
20
30
40
50
60
70
N° of vessels
Historical LNG newbuilding activity
20191972 1975 1980 1985 1990 1995 2005 2010 20152000
THE FLEET
0
10
20
30
40
50
60
70
N° of vessels
LNG carriers by delivery date as of 31 december 2019
1910 2023
LNG carriers by delivery date as end of 2019N° of ships
20202012 2014 2016 2018 20222010
Samsung ZvezdaDaewooHudong-Zhongua
Hyundai
GTT NO96 L03+
Samsung ZvezdaDaewooHudong-Zhongua
Hyundai
XDF
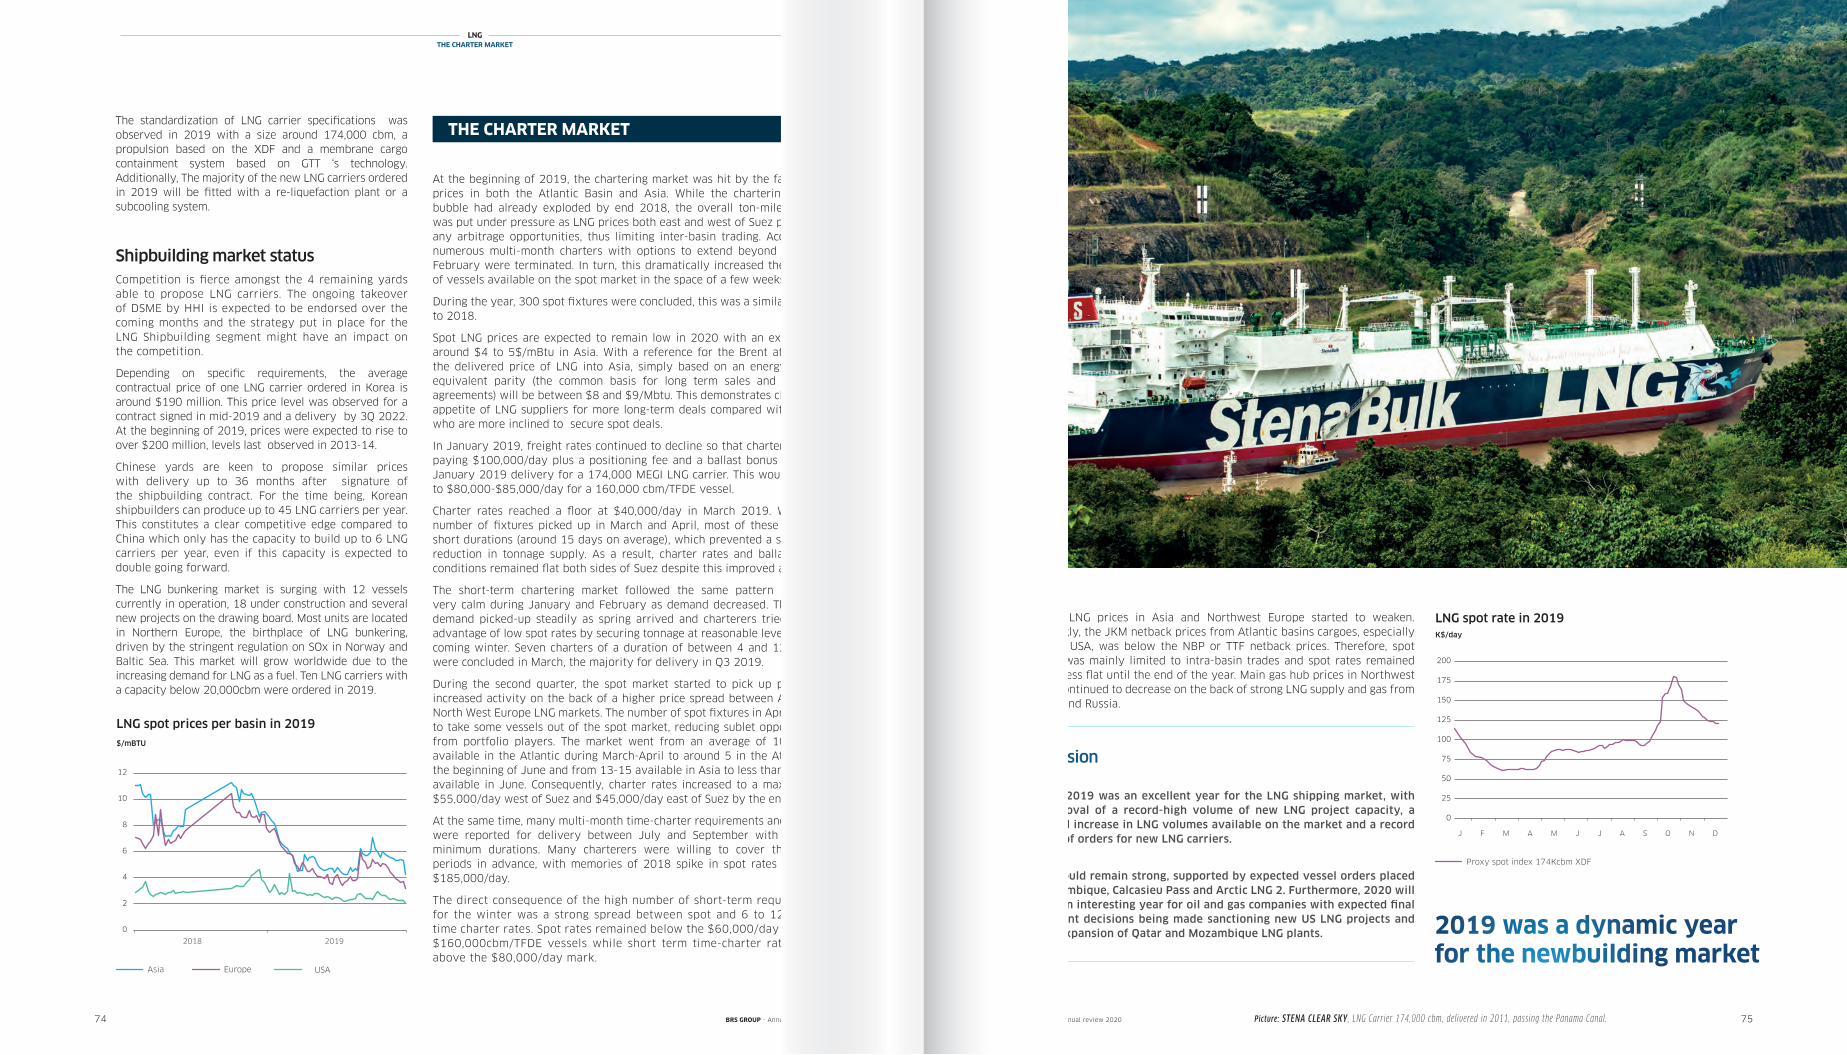
LNGTHE CHARTER MARKET
74 75
In June, LNG prices in Asia and Northwest Europe started to weaken. Accordingly, the JKM netback prices from Atlantic basins cargoes, especially from the USA, was below the NBP or TTF netback prices. Therefore, spot tonnage was mainly limited to intra-basin trades and spot rates remained more or less flat until the end of the year. Main gas hub prices in Northwest Europe continued to decrease on the back of strong LNG supply and gas from Norway and Russia.
Conclusion
All told, 2019 was an excellent year for the LNG shipping market, with the approval of a record-high volume of new LNG project capacity, a sustained increase in LNG volumes available on the market and a record number of orders for new LNG carriers.
2020 should remain strong, supported by expected vessel orders placed for Mozambique, Calcasieu Pass and Arctic LNG 2. Furthermore, 2020 will also be an interesting year for oil and gas companies with expected final investment decisions being made sanctioning new US LNG projects and for the expansion of Qatar and Mozambique LNG plants.
At the beginning of 2019, the chartering market was hit by the fall in LNG prices in both the Atlantic Basin and Asia. While the chartering market bubble had already exploded by end 2018, the overall ton-mile demand was put under pressure as LNG prices both east and west of Suez prevented any arbitrage opportunities, thus limiting inter-basin trading. Accordingly, numerous multi-month charters with options to extend beyond January/February were terminated. In turn, this dramatically increased the number of vessels available on the spot market in the space of a few weeks.
During the year, 300 spot fixtures were concluded, this was a similar volume to 2018.
Spot LNG prices are expected to remain low in 2020 with an expectation around $4 to 5$/mBtu in Asia. With a reference for the Brent at $60/bbl the delivered price of LNG into Asia, simply based on an energy-content equivalent parity (the common basis for long term sales and purchase agreements) will be between $8 and $9/Mbtu. This demonstrates clearly the appetite of LNG suppliers for more long-term deals compared with buyers who are more inclined to secure spot deals.
In January 2019, freight rates continued to decline so that charterers were paying $100,000/day plus a positioning fee and a ballast bonus with late January 2019 delivery for a 174,000 MEGI LNG carrier. This would equate to $80,000-$85,000/day for a 160,000 cbm/TFDE vessel.
Charter rates reached a floor at $40,000/day in March 2019. While the number of fixtures picked up in March and April, most of these were for short durations (around 15 days on average), which prevented a significant reduction in tonnage supply. As a result, charter rates and ballast bonus conditions remained flat both sides of Suez despite this improved activity.
The short-term chartering market followed the same pattern as 2018: very calm during January and February as demand decreased. Thereafter, demand picked-up steadily as spring arrived and charterers tried to take advantage of low spot rates by securing tonnage at reasonable levels for the coming winter. Seven charters of a duration of between 4 and 12 months were concluded in March, the majority for delivery in Q3 2019.
During the second quarter, the spot market started to pick up pace with increased activity on the back of a higher price spread between Asian and North West Europe LNG markets. The number of spot fixtures in April started to take some vessels out of the spot market, reducing sublet opportunities from portfolio players. The market went from an average of 10 vessels available in the Atlantic during March-April to around 5 in the Atlantic by the beginning of June and from 13-15 available in Asia to less than 10 units available in June. Consequently, charter rates increased to a maximum of $55,000/day west of Suez and $45,000/day east of Suez by the end of May.
At the same time, many multi-month time-charter requirements and fixtures were reported for delivery between July and September with 6-month minimum durations. Many charterers were willing to cover the winter periods in advance, with memories of 2018 spike in spot rates to above $185,000/day.
The direct consequence of the high number of short-term requirements for the winter was a strong spread between spot and 6 to 12 months time charter rates. Spot rates remained below the $60,000/day mark for $160,000cbm/TFDE vessels while short term time-charter rates stood above the $80,000/day mark.
2019 was a dynamic yearfor the newbuilding market
THE CHARTER MARKET
Picture: STENA CLEAR SKY , LNG Carrier 174,000 cbm, delivered in 2011, passing the Panama Canal.BRS GROUP - Annual review 2020 BRS GROUP - Annual review 2020
The standardization of LNG carrier specifications was observed in 2019 with a size around 174,000 cbm, a propulsion based on the XDF and a membrane cargo containment system based on GTT ‘s technology. Additionally, The majority of the new LNG carriers ordered in 2019 will be fitted with a re-liquefaction plant or a subcooling system.
Shipbuilding market statusCompetition is fierce amongst the 4 remaining yards able to propose LNG carriers. The ongoing takeover of DSME by HHI is expected to be endorsed over the coming months and the strategy put in place for the LNG Shipbuilding segment might have an impact on the competition.
Depending on specific requirements, the average contractual price of one LNG carrier ordered in Korea is around $190 million. This price level was observed for a contract signed in mid-2019 and a delivery by 3Q 2022. At the beginning of 2019, prices were expected to rise to over $200 million, levels last observed in 2013-14.
Chinese yards are keen to propose similar prices with delivery up to 36 months after signature of the shipbuilding contract. For the time being, Korean shipbuilders can produce up to 45 LNG carriers per year. This constitutes a clear competitive edge compared to China which only has the capacity to build up to 6 LNG carriers per year, even if this capacity is expected to double going forward.
The LNG bunkering market is surging with 12 vessels currently in operation, 18 under construction and several new projects on the drawing board. Most units are located in Northern Europe, the birthplace of LNG bunkering, driven by the stringent regulation on SOx in Norway and Baltic Sea. This market will grow worldwide due to the increasing demand for LNG as a fuel. Ten LNG carriers with a capacity below 20,000cbm were ordered in 2019.
0
5
10
15
20
25
N° of shipsLNG orders by shipyard in 2019
Daewoo Hyundai ZvezdaHudong-Zhonghua Samsung
10
2
20
16
1
0
2
4
6
8
10
12
2018 2019
K$/day???LNG ??? 2019
NWEJKM HH
2018 2019
$/mBTU
LNG spot prices per basin in 2019
USAAsia Europe
0
25
50
75
100
125
150
175
200
Jan- Feb- Mar- Apr- May- Jun- Jul- Aug- Sep- Oct- Nov- Dec-
K$/dayLNG spot rate in 2019
Proxy spot index 174Kcbm XDF
0
5
10
15
20
25
N° of shipsPropulsion technology ordered in 2019
XDF MEGI DFDE/TFDE
0
5
10
15
20
25
N° of shipsCargo containment systems ordered in 2019
GTT MK III FLEX GTT MK III FLEX + GTT NO96 GW
Daewoo Hyundai ZvezdaHudong-Zhonghua Samsung
10
2
20
1
GTT NO96 L03+
13
3
Daewoo Hyundai ZvezdaHudong-Zhonghua Samsung
2
20
1
12
3
1
7
3
0
1
2
3
4
5
N° of shipsLNG carriers ordered in 2019 by shipowner
6
7
8
Maran GazOceania Based TsakosKnutsen
SK Shipping
0
10
20
30
40
50
60
70
N° of vessels
Historical LNG newbuilding activity
20191972 1975 1980 1985 1990 1995 2005 2010 20152000
THE FLEET
0
10
20
30
40
50
60
70
N° of vessels
LNG carriers by delivery date as of 31 december 2019
1910 2023
K$/day
LNG spot rate in 2019
Proxy spot index 174Kcbm XDF
J F M A M J J A S O N D
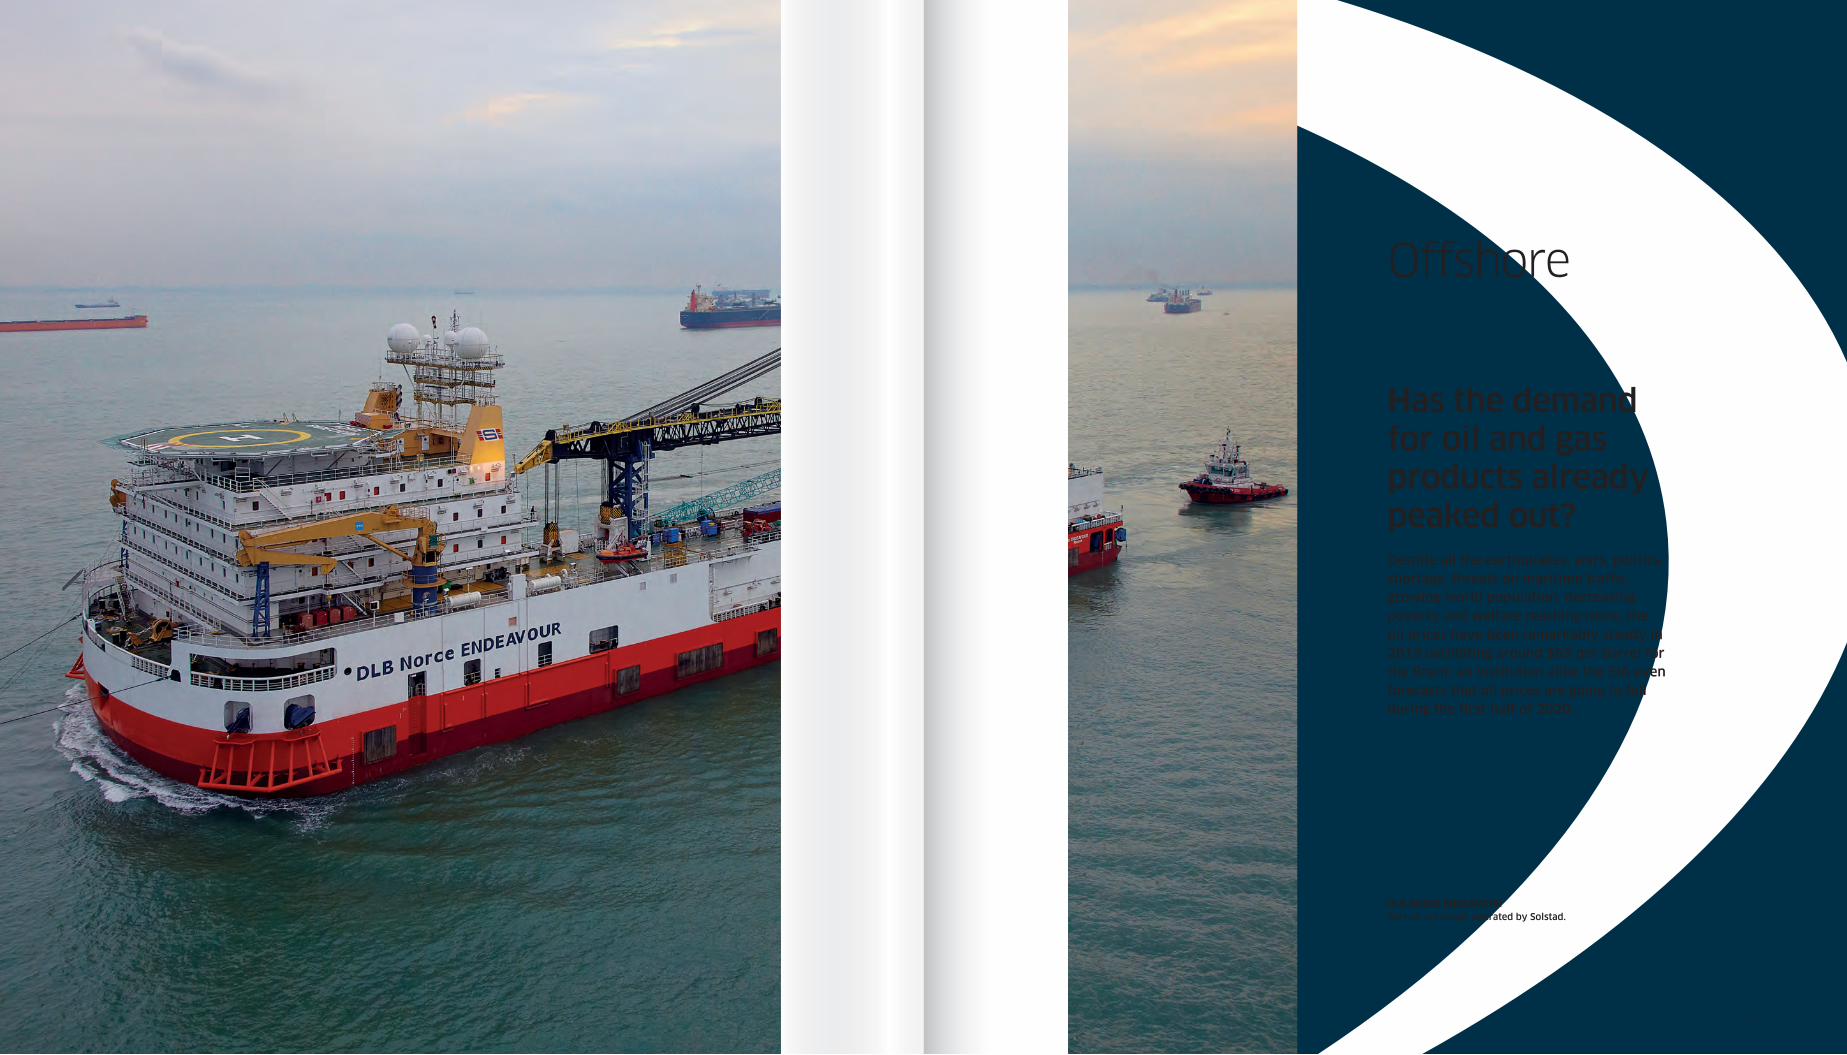
Offshore
Has the demand for oil and gas products already peaked out? Despite all the earthquakes, wars, politics, shortage, threats on maritime traffic, growing world population, decreasing poverty and welfare reaching more, the oil prices have been remarkably steady in 2019 oscillating around $65 per barrel for the Brent; an institution alike the EIA even forecasts that oil prices are going to fall during the first half of 2020.
DLB NORCE ENDEAVOUR Derrick lay barge, operated by Solstad.
77
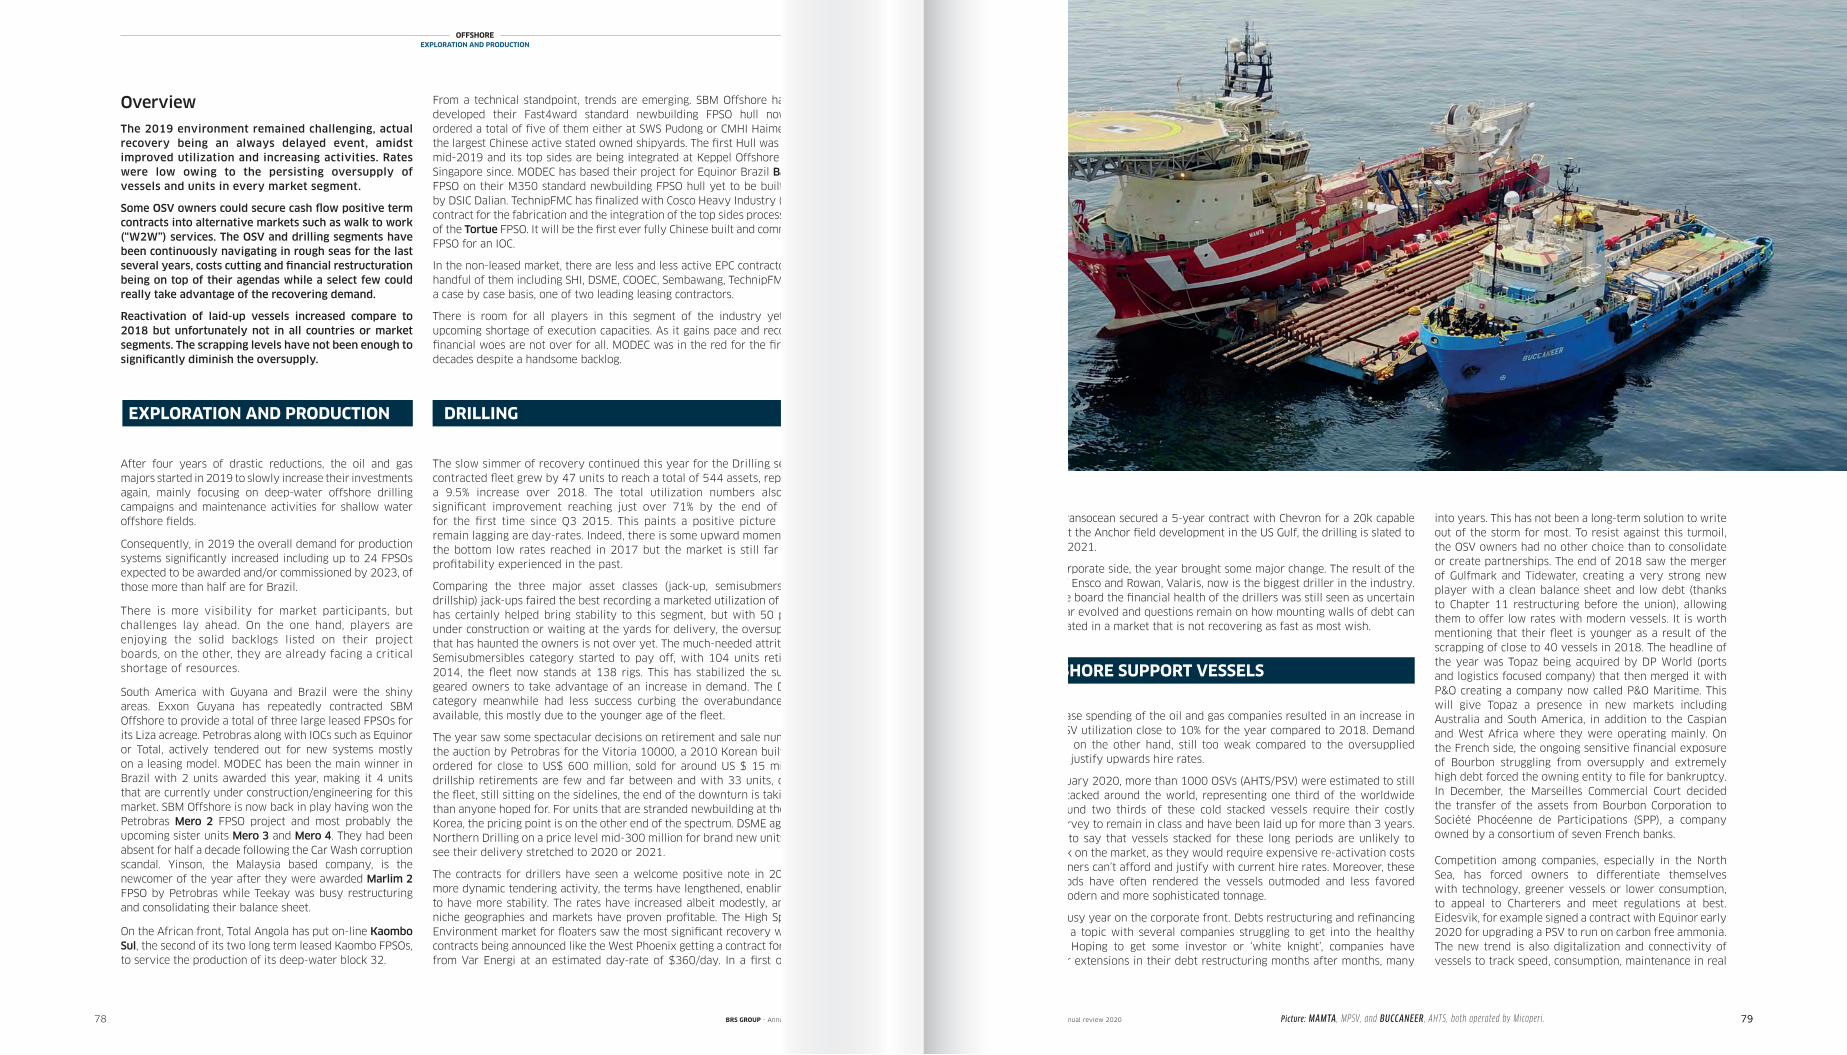
After four years of drastic reductions, the oil and gas majors started in 2019 to slowly increase their investments again, mainly focusing on deep-water offshore drilling campaigns and maintenance activities for shallow water offshore fields.
Consequently, in 2019 the overall demand for production systems significantly increased including up to 24 FPSOs expected to be awarded and/or commissioned by 2023, of those more than half are for Brazil.
There is more visibility for market participants, but challenges lay ahead. On the one hand, players are enjoying the solid backlogs listed on their project boards, on the other, they are already facing a critical shortage of resources.
South America with Guyana and Brazil were the shiny areas. Exxon Guyana has repeatedly contracted SBM Offshore to provide a total of three large leased FPSOs for its Liza acreage. Petrobras along with IOCs such as Equinor or Total, actively tendered out for new systems mostly on a leasing model. MODEC has been the main winner in Brazil with 2 units awarded this year, making it 4 units that are currently under construction/engineering for this market. SBM Offshore is now back in play having won the Petrobras Mero 2 FPSO project and most probably the upcoming sister units Mero 3 and Mero 4. They had been absent for half a decade following the Car Wash corruption scandal. Yinson, the Malaysia based company, is the newcomer of the year after they were awarded Marlim 2 FPSO by Petrobras while Teekay was busy restructuring and consolidating their balance sheet.
On the African front, Total Angola has put on-line Kaombo Sul, the second of its two long term leased Kaombo FPSOs, to service the production of its deep-water block 32.
From a technical standpoint, trends are emerging. SBM Offshore has further developed their Fast4ward standard newbuilding FPSO hull now having ordered a total of five of them either at SWS Pudong or CMHI Haimen, two of the largest Chinese active stated owned shipyards. The first Hull was delivered mid-2019 and its top sides are being integrated at Keppel Offshore & Marine Singapore since. MODEC has based their project for Equinor Brazil Bacalhau 1 FPSO on their M350 standard newbuilding FPSO hull yet to be built in China by DSIC Dalian. TechnipFMC has finalized with Cosco Heavy Industry (“CHI”) the contract for the fabrication and the integration of the top sides process modules of the Tortue FPSO. It will be the first ever fully Chinese built and commissioned FPSO for an IOC.
In the non-leased market, there are less and less active EPC contractors with a handful of them including SHI, DSME, COOEC, Sembawang, TechnipFMC and, on a case by case basis, one of two leading leasing contractors.
There is room for all players in this segment of the industry yet with an upcoming shortage of execution capacities. As it gains pace and recovers, the financial woes are not over for all. MODEC was in the red for the first time in decades despite a handsome backlog.
The slow simmer of recovery continued this year for the Drilling sector. The contracted fleet grew by 47 units to reach a total of 544 assets, representing a 9.5% increase over 2018. The total utilization numbers also showed significant improvement reaching just over 71% by the end of the year for the first time since Q3 2015. This paints a positive picture but what remain lagging are day-rates. Indeed, there is some upward momentum from the bottom low rates reached in 2017 but the market is still far from the profitability experienced in the past.
Comparing the three major asset classes (jack-up, semisubmersible, and drillship) jack-ups faired the best recording a marketed utilization of 86%. This has certainly helped bring stability to this segment, but with 50 plus units under construction or waiting at the yards for delivery, the oversupply story that has haunted the owners is not over yet. The much-needed attrition in the Semisubmersibles category started to pay off, with 104 units retired since 2014, the fleet now stands at 138 rigs. This has stabilized the supply and geared owners to take advantage of an increase in demand. The Drill-ships category meanwhile had less success curbing the overabundance of units available, this mostly due to the younger age of the fleet.
The year saw some spectacular decisions on retirement and sale numbers like the auction by Petrobras for the Vitoria 10000, a 2010 Korean built drillship ordered for close to US$ 600 million, sold for around US $ 15 million. But drillship retirements are few and far between and with 33 units, or 32% of the fleet, still sitting on the sidelines, the end of the downturn is taking longer than anyone hoped for. For units that are stranded newbuilding at the yards in Korea, the pricing point is on the other end of the spectrum. DSME agreed with Northern Drilling on a price level mid-300 million for brand new units that will see their delivery stretched to 2020 or 2021.
The contracts for drillers have seen a welcome positive note in 2019. Amid more dynamic tendering activity, the terms have lengthened, enabling owners to have more stability. The rates have increased albeit modestly, and certain niche geographies and markets have proven profitable. The High Spec/Harsh Environment market for floaters saw the most significant recovery with major contracts being announced like the West Phoenix getting a contract for 16 Wells from Var Energi at an estimated day-rate of $360/day. In a first of its kind
7978 79
OFFSHOREEXPLORATION AND PRODUCTION
DRILLING
Overview
The 2019 environment remained challenging, actual recovery being an always delayed event, amidst improved utilization and increasing activities. Rates were low owing to the persisting oversupply of vessels and units in every market segment.
Some OSV owners could secure cash flow positive term contracts into alternative markets such as walk to work (“W2W”) services. The OSV and drilling segments have been continuously navigating in rough seas for the last several years, costs cutting and financial restructuration being on top of their agendas while a select few could really take advantage of the recovering demand.
Reactivation of laid-up vessels increased compare to 2018 but unfortunately not in all countries or market segments. The scrapping levels have not been enough to significantly diminish the oversupply.
BRS GROUP - Annual review 2020
project, Transocean secured a 5-year contract with Chevron for a 20k capable drillship at the Anchor field development in the US Gulf, the drilling is slated to start mid-2021.
On the corporate side, the year brought some major change. The result of the merger of Ensco and Rowan, Valaris, now is the biggest driller in the industry. Across the board the financial health of the drillers was still seen as uncertain as the year evolved and questions remain on how mounting walls of debt can be negotiated in a market that is not recovering as fast as most wish.
The increase spending of the oil and gas companies resulted in an increase in overall OSV utilization close to 10% for the year compared to 2018. Demand remained, on the other hand, still too weak compared to the oversupplied market to justify upwards hire rates.
As of January 2020, more than 1000 OSVs (AHTS/PSV) were estimated to still be cold stacked around the world, representing one third of the worldwide fleet. Around two thirds of these cold stacked vessels require their costly 5-year survey to remain in class and have been laid up for more than 3 years. Needless to say that vessels stacked for these long periods are unlikely to come back on the market, as they would require expensive re-activation costs which owners can’t afford and justify with current hire rates. Moreover, these long periods have often rendered the vessels outmoded and less favored against modern and more sophisticated tonnage.
It was a busy year on the corporate front. Debts restructuring and refinancing has been a topic with several companies struggling to get into the healthy cashflow. Hoping to get some investor or ‘white knight’, companies have sought for extensions in their debt restructuring months after months, many
OFFSHORE SUPPORT VESSELS
EXPLORATION AND PRODUCTION
into years. This has not been a long-term solution to write out of the storm for most. To resist against this turmoil, the OSV owners had no other choice than to consolidate or create partnerships. The end of 2018 saw the merger of Gulfmark and Tidewater, creating a very strong new player with a clean balance sheet and low debt (thanks to Chapter 11 restructuring before the union), allowing them to offer low rates with modern vessels. It is worth mentioning that their fleet is younger as a result of the scrapping of close to 40 vessels in 2018. The headline of the year was Topaz being acquired by DP World (ports and logistics focused company) that then merged it with P&O creating a company now called P&O Maritime. This will give Topaz a presence in new markets including Australia and South America, in addition to the Caspian and West Africa where they were operating mainly. On the French side, the ongoing sensitive financial exposure of Bourbon struggling from oversupply and extremely high debt forced the owning entity to file for bankruptcy. In December, the Marseilles Commercial Court decided the transfer of the assets from Bourbon Corporation to Société Phocéenne de Participations (SPP), a company owned by a consortium of seven French banks.
Competition among companies, especially in the North Sea, has forced owners to differentiate themselves with technology, greener vessels or lower consumption, to appeal to Charterers and meet regulations at best. Eidesvik, for example signed a contract with Equinor early 2020 for upgrading a PSV to run on carbon free ammonia. The new trend is also digitalization and connectivity of vessels to track speed, consumption, maintenance in real
Picture: MAMTA , MPSV, and BUCCANEER , AHTS, both operated by Micoperi.BRS GROUP - Annual review 2020
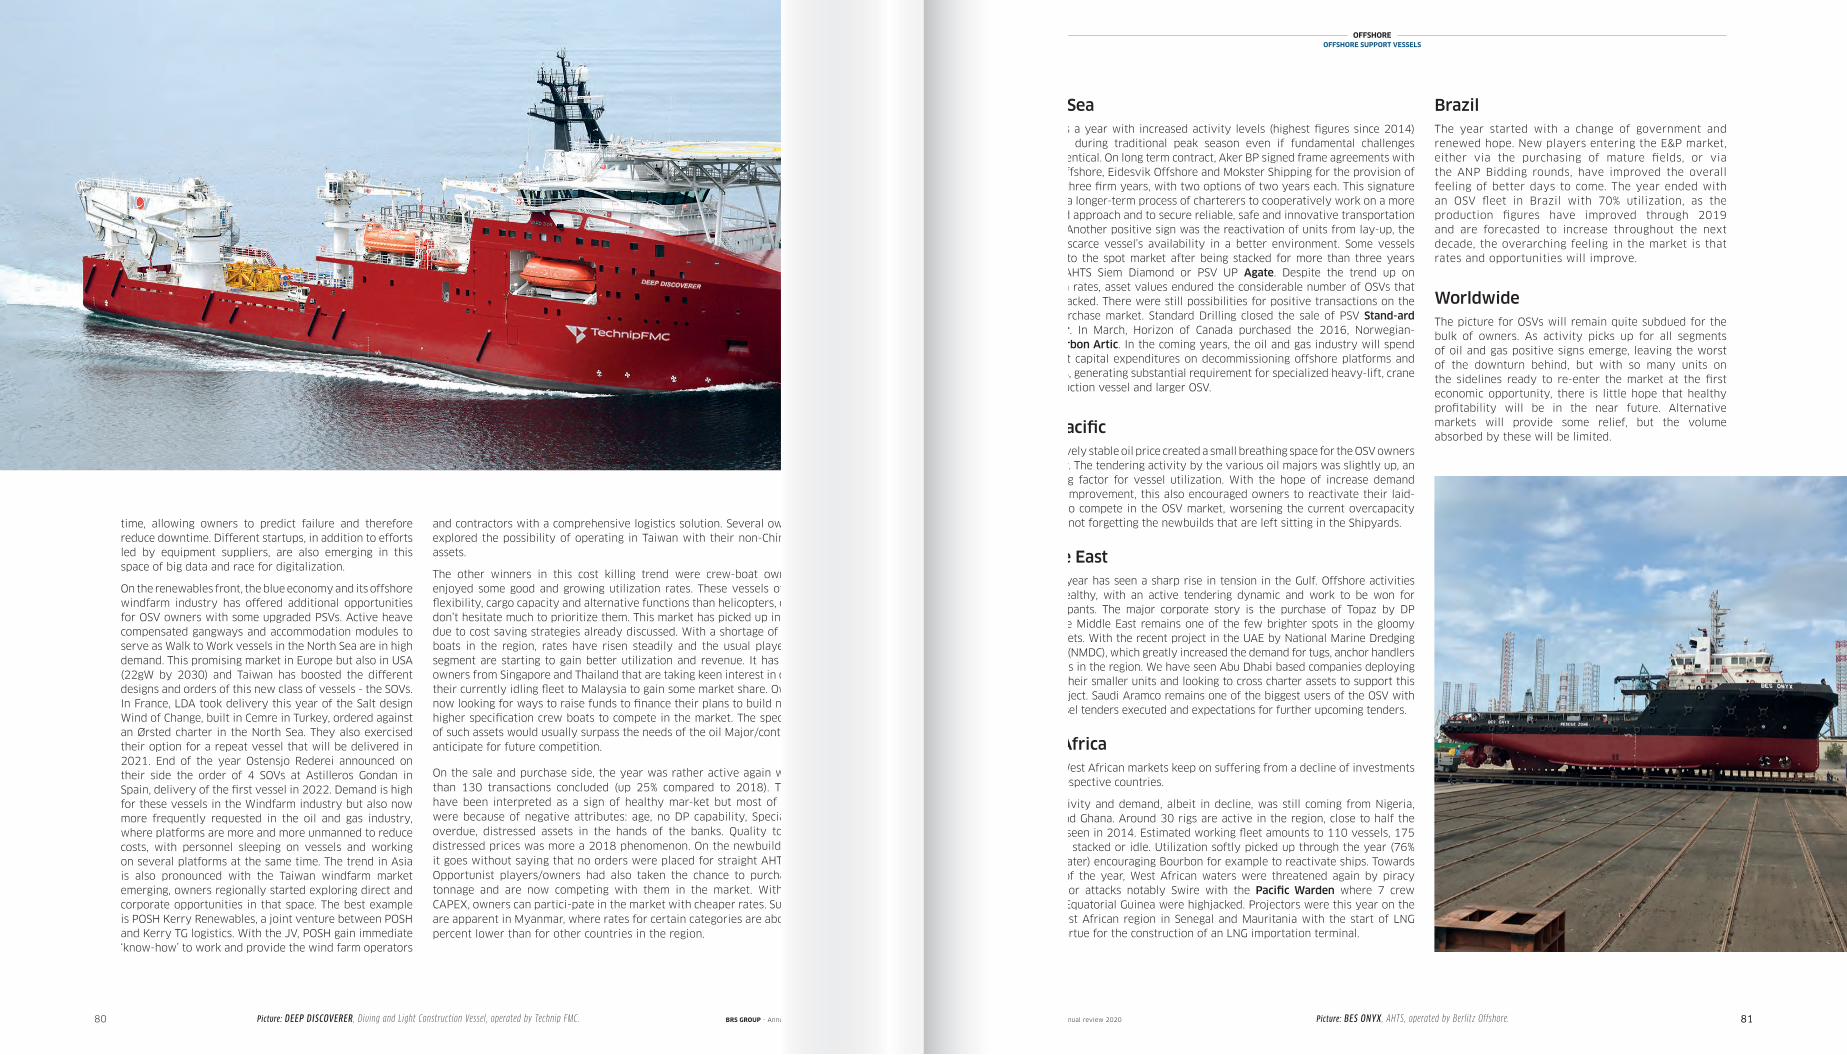
8180 81
OFFSHOREOFFSHORE SUPPORT VESSELS
and contractors with a comprehensive logistics solution. Several owners also explored the possibility of operating in Taiwan with their non-Chinese built assets.
The other winners in this cost killing trend were crew-boat owners who enjoyed some good and growing utilization rates. These vessels offer more flexibility, cargo capacity and alternative functions than helicopters, oil Majors don’t hesitate much to prioritize them. This market has picked up in Malaysia due to cost saving strategies already discussed. With a shortage of fast crew boats in the region, rates have risen steadily and the usual players in the segment are starting to gain better utilization and revenue. It has attracted owners from Singapore and Thailand that are taking keen interest in deploying their currently idling fleet to Malaysia to gain some market share. Owners are now looking for ways to raise funds to finance their plans to build newer and higher specification crew boats to compete in the market. The specifications of such assets would usually surpass the needs of the oil Major/contractors to anticipate for future competition.
On the sale and purchase side, the year was rather active again with more than 130 transactions concluded (up 25% compared to 2018). This could have been interpreted as a sign of healthy mar-ket but most of the sales were because of negative attributes: age, no DP capability, Special Survey overdue, distressed assets in the hands of the banks. Quality tonnage at distressed prices was more a 2018 phenomenon. On the newbuilding front, it goes without saying that no orders were placed for straight AHTS or PSV. Opportunist players/owners had also taken the chance to purchase older tonnage and are now competing with them in the market. With a lower CAPEX, owners can partici-pate in the market with cheaper rates. Such trends are apparent in Myanmar, where rates for certain categories are about 20-30 percent lower than for other countries in the region.
North Sea 2019 was a year with increased activity levels (highest figures since 2014) especially during traditional peak season even if fundamental challenges remain identical. On long term contract, Aker BP signed frame agreements with Solstad Offshore, Eidesvik Offshore and Mokster Shipping for the provision of PSVs for three firm years, with two options of two years each. This signature is part of a longer-term process of charterers to cooperatively work on a more integrated approach and to secure reliable, safe and innovative transportation of cargo. Another positive sign was the reactivation of units from lay-up, the result of scarce vessel’s availability in a better environment. Some vessels returned to the spot market after being stacked for more than three years such as AHTS Siem Diamond or PSV UP Agate. Despite the trend up on utilization rates, asset values endured the considerable number of OSVs that remain stacked. There were still possibilities for positive transactions on the sale & purchase market. Standard Drilling closed the sale of PSV Stand-ard Supporter. In March, Horizon of Canada purchased the 2016, Norwegian-built Bourbon Artic. In the coming years, the oil and gas industry will spend significant capital expenditures on decommissioning offshore platforms and structures, generating substantial requirement for specialized heavy-lift, crane or construction vessel and larger OSV.
Asia Pacific The relatively stable oil price created a small breathing space for the OSV owners regionally. The tendering activity by the various oil majors was slightly up, an ecouraging factor for vessel utilization. With the hope of increase demand and rate improvement, this also encouraged owners to reactivate their laid-up units to compete in the OSV market, worsening the current overcapacity situation, not forgetting the newbuilds that are left sitting in the Shipyards.
Middle East The past year has seen a sharp rise in tension in the Gulf. Offshore activities remain healthy, with an active tendering dynamic and work to be won for all participants. The major corporate story is the purchase of Topaz by DP world. The Middle East remains one of the few brighter spots in the gloomy OSV markets. With the recent project in the UAE by National Marine Dredging Company (NMDC), which greatly increased the demand for tugs, anchor handlers and barges in the region. We have seen Abu Dhabi based companies deploying many of their smaller units and looking to cross charter assets to support this major project. Saudi Aramco remains one of the biggest users of the OSV with multi vessel tenders executed and expectations for further upcoming tenders.
West Africa Overall, West African markets keep on suffering from a decline of investments in their respective countries.
Major activity and demand, albeit in decline, was still coming from Nigeria, Angola and Ghana. Around 30 rigs are active in the region, close to half the numbers seen in 2014. Estimated working fleet amounts to 110 vessels, 175 being still stacked or idle. Utilization softly picked up through the year (76% for Tidewater) encouraging Bourbon for example to reactivate ships. Towards the end of the year, West African waters were threatened again by piracy attempts or attacks notably Swire with the Pacific Warden where 7 crew offshore Equatorial Guinea were highjacked. Projectors were this year on the upper West African region in Senegal and Mauritania with the start of LNG project Tortue for the construction of an LNG importation terminal.
Picture: BES ONYX , AHTS, operated by Berlitz Offshore.
time, allowing owners to predict failure and therefore reduce downtime. Different startups, in addition to efforts led by equipment suppliers, are also emerging in this space of big data and race for digitalization.
On the renewables front, the blue economy and its offshore windfarm industry has offered additional opportunities for OSV owners with some upgraded PSVs. Active heave compensated gangways and accommodation modules to serve as Walk to Work vessels in the North Sea are in high demand. This promising market in Europe but also in USA (22gW by 2030) and Taiwan has boosted the different designs and orders of this new class of vessels - the SOVs. In France, LDA took delivery this year of the Salt design Wind of Change, built in Cemre in Turkey, ordered against an Ørsted charter in the North Sea. They also exercised their option for a repeat vessel that will be delivered in 2021. End of the year Ostensjo Rederei announced on their side the order of 4 SOVs at Astilleros Gondan in Spain, delivery of the first vessel in 2022. Demand is high for these vessels in the Windfarm industry but also now more frequently requested in the oil and gas industry, where platforms are more and more unmanned to reduce costs, with personnel sleeping on vessels and working on several platforms at the same time. The trend in Asia is also pronounced with the Taiwan windfarm market emerging, owners regionally started exploring direct and corporate opportunities in that space. The best example is POSH Kerry Renewables, a joint venture between POSH and Kerry TG logistics. With the JV, POSH gain immediate ‘know-how’ to work and provide the wind farm operators
Brazil The year started with a change of government and renewed hope. New players entering the E&P market, either via the purchasing of mature fields, or via the ANP Bidding rounds, have improved the overall feeling of better days to come. The year ended with an OSV fleet in Brazil with 70% utilization, as the production figures have improved through 2019 and are forecasted to increase throughout the next decade, the overarching feeling in the market is that rates and opportunities will improve.
Worldwide The picture for OSVs will remain quite subdued for the bulk of owners. As activity picks up for all segments of oil and gas positive signs emerge, leaving the worst of the downturn behind, but with so many units on the sidelines ready to re-enter the market at the first economic opportunity, there is little hope that healthy profitability will be in the near future. Alternative markets will provide some relief, but the volume absorbed by these will be limited.
BRS GROUP - Annual review 2020 BRS GROUP - Annual review 2020Picture: DEEP DISCOVERER , Diving and Light Construction Vessel, operated by Technip FMC.

The subsea segment has been the theater of multiple opposite movements and of contradictory signals. Amongst the most noticeable, TechnipFMC shareholders have agreed upon a plan to reverse the previous merger which will result in two companies to form respectively an offshore and on-shore pure EPC company listed and headquartered in Paris, Technip Energies, and a subsea player, TechnipFMC, listed in NYC and Paris and headquartered in Houston. Bells rung over the previous merger between Technip and FMC. It is a clear objection to the capitalistic approach of the integrated business model; all the more that the alliance between Subsea7 and Schlumberger that combines subsea production systems with riser, umbilical, and installation expertise, has proven to be successful.
McDermott has been on the edge of a financial collapse throughout the year pursuant to the catastrophic consequences of its merge with CB&I. In early December 2019, its common stocks had fallen below the minimum of US$ 1 per share over more than one month, US$ 1 being the minimum share value to be continuously listed on the NYSE. At time of this review, McDermott has filed under US Chapter 11 in a controlled manner since it simultaneously agreed upon a restructuring package with all of its main creditors.
It nevertheless poses multiple challenges to the offshore industries, as McDermott is one of the world top five offshore contractors holding a large backlog, sometimes secured at discounted rates. Customers continue to investigate with the other main players seeking for potential backup execution solutions.
The overall demand for subsea installation services has incrementally increased though it remains below the required level to trigger an increase of profitability and rates. This persistent weakness of the demand with unclear forecast has led some to secure alternative employment of their major units, such as installation of windmill foundations, with revenues that barely cover their costs. This was the case of Dutch contractor Heerema, which on a separate note took delivery of the massive semi-submersible crane vessel Sleipnir equipped with two 10 000 tons at 27 meters Huisman crane with a bearing.
The world demand for land reclaim and dredging services bottomed out in 2018 and has been increasing all throughout 2019. It is expected to steadily grow over the next decade, mainly driven by the demand for land reclaim. Broadening and protecting the coastal lines is a permanent concern on the back of the constantly increasing world city dwelling population that lives close to shores.
We expect more and more involvement from the local, regional contractors who have access to finance and specialized tonnage.
The state controlled CHEC (“China Harbor Engineering”) has reinforced its leading position in terms of market share. Some of the other international contractors, Jan de Nul, DEME, Van Oord, Boskalis, Great Lake Dredge & Dock, Penta Ocean Construction and Hyundai Engineering benefit from their strong financial structure to continue to renew and modernize their dredging fleet.
Cutter suction dredgers were less demanded than the other type of units.
In 2019, the offshore renewables market has mainly flown the European or the Taiwanese flags. It has provided good utilization albeit moderate rates and solid positive margins. It remains very competitive, safe for a few heavy lifting units that could benefit from their unique features and windows of availability.
8382 83
SUBSEA & OFFSHORE CONSTRUCTIONAs discussed previously, there is no shortage of players from other depressed markets entering in order to compete for some renewables business.
Van Oord is now front runner in the industry as both an offshore windfarm construction and operations contractor.
The European contractors have been particularly active in commissioning, upgrading and ordering new heavy-duty offshore units: JDN ordered the Voltaire at Cosco. It is going to be the world biggest Wind Turbine Installation Vessel able to handle the heaviest future units of more than 15MW. The same company also ordered a large installation vessel Les Alizés at CMHI. She shall be equipped with a fully compensated 5 000 tons Huisman mast crane with a lifting height that surpasses the other heavy lifting mono-hull vessels. She will be delivered in 2022.
DEME, subsidiary GeoSea, was busy commissioning the main crane on its new build Orion whilst the Antwerp based contractor has not taken delivery yet of the world most powerful cutter suction dredger Spartacus built and commissioned by Royal IHC, a key supplier to the dredging industry. Van Oord, Boskalis and DEME have agreed to join as new direct stakeholders of the struggling yard.
Owners and contractors are now facing two major challenges: to keep navigating through narrow financial straits, not to say dire, after years of a terrible downturn, and to maintain skills and motivation amongst teams and crew still exposed to a mediocre market visibility. No one would really dare say today “solid recovery is in sight”, recovery would mean that well managed companies would generate positive cash flows with all-costs and restructured debts covered.
The industries have lost a considerable amount of skilled workforce and managing personnel, most of them will never come back. There are already spots of light from traditional areas: Brazil is undoubtedly regaining a lot
of traction and the Middle East is providing more and more work; new areas are also opening exciting prospects such as Mozambique where there will be a lot of activity in years to come. There are multiple vast offshore markets yet to be explored or developed such as floating windfarms, ocean management, arctic operations all the way to subsea mining. These markets would be a natural fit for contractors that have battled in the oil and gas world for the last half century. None stand out of reach given the available technologies. Optimism can be contagious.
PROSPECTS FOR 2020
DREDGING AND RENEWABLES
Picture: BOKA ATLANTIS , Diving support vessel, operated by Boskalis.Pictures: SANDERUS , Trailing suction hopper dredger, compliant with Europe Stage 5 emission standards, delivered by Keppel to Jan de Nul;
Jumbo Javelin , Heavy lift crane vessel (HLCV), operated by Jumbo.BRS GROUP - Annual review 2020 BRS GROUP - Annual review 2020

85
Cruise
A continued strong developmentYear after year, the cruise industry continues its solid development with an ever increasing number of passengers and an outstanding newbuilding orderbook.
Developing the Chinese cruise market is still a long term strategy although with some necessary adjustements along the road both in terms of ships capacity and sales distribution model. Some uncertainties are looming over the sector due to the coronavirus appearance by year end.
85
CARNIVA PANORAMA133,858 gt, 1977 cabins delivered by Fincantieri to Carnival Cruise Line in 2019.
Photo: Fincantieri
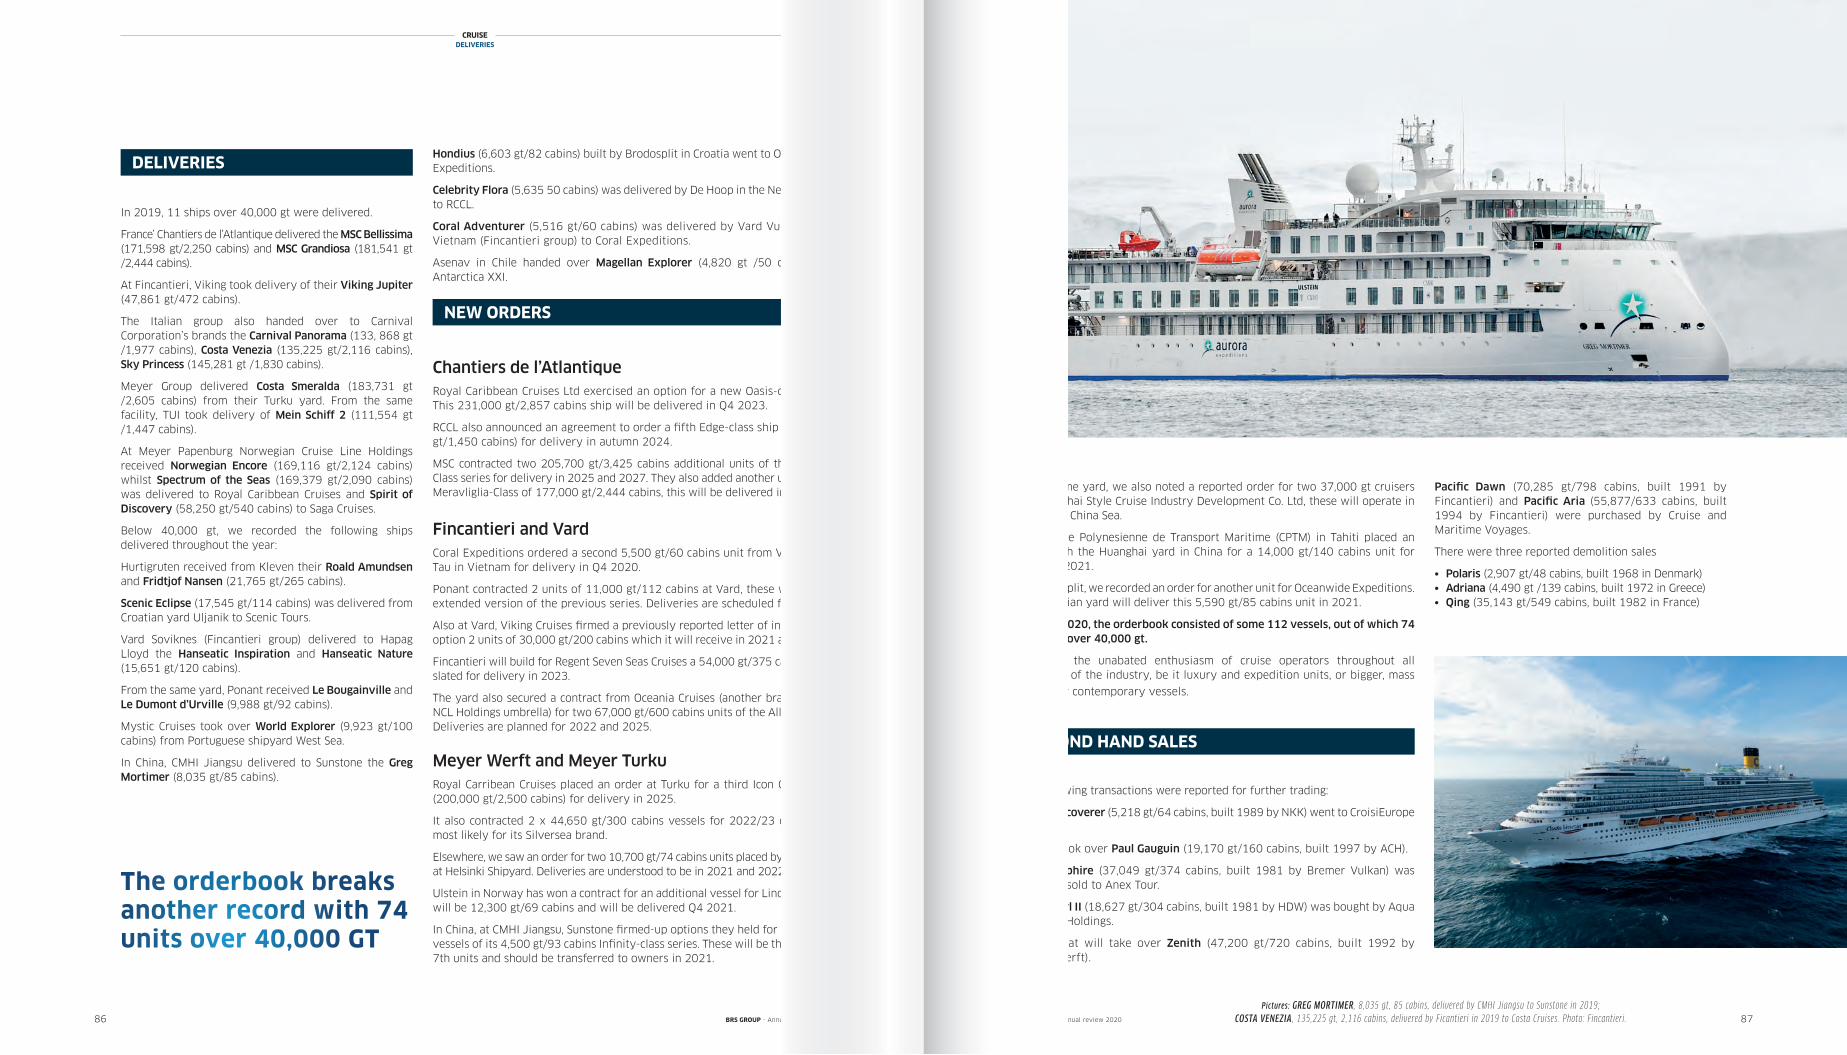
CRUISEDELIVERIES
86 87
Chantiers de l’AtlantiqueRoyal Caribbean Cruises Ltd exercised an option for a new Oasis-class unit. This 231,000 gt/2,857 cabins ship will be delivered in Q4 2023.
RCCL also announced an agreement to order a fifth Edge-class ship (130,000 gt/1,450 cabins) for delivery in autumn 2024.
MSC contracted two 205,700 gt/3,425 cabins additional units of the World-Class series for delivery in 2025 and 2027. They also added another unit of the Meravliglia-Class of 177,000 gt/2,444 cabins, this will be delivered in 2023.
Fincantieri and VardCoral Expeditions ordered a second 5,500 gt/60 cabins unit from Vard Vung Tau in Vietnam for delivery in Q4 2020.
Ponant contracted 2 units of 11,000 gt/112 cabins at Vard, these will be an extended version of the previous series. Deliveries are scheduled for 2022.
Also at Vard, Viking Cruises firmed a previously reported letter of intent for 2 option 2 units of 30,000 gt/200 cabins which it will receive in 2021 and 2022.
Fincantieri will build for Regent Seven Seas Cruises a 54,000 gt/375 cabins unit slated for delivery in 2023.
The yard also secured a contract from Oceania Cruises (another brand under NCL Holdings umbrella) for two 67,000 gt/600 cabins units of the Allura-class. Deliveries are planned for 2022 and 2025.
Meyer Werft and Meyer TurkuRoyal Carribean Cruises placed an order at Turku for a third Icon Class ship (200,000 gt/2,500 cabins) for delivery in 2025.
It also contracted 2 x 44,650 gt/300 cabins vessels for 2022/23 deliveries most likely for its Silversea brand.
Elsewhere, we saw an order for two 10,700 gt/74 cabins units placed by Vodohod at Helsinki Shipyard. Deliveries are understood to be in 2021 and 2022.
Ulstein in Norway has won a contract for an additional vessel for Lindblad. She will be 12,300 gt/69 cabins and will be delivered Q4 2021.
In China, at CMHI Jiangsu, Sunstone firmed-up options they held for two more vessels of its 4,500 gt/93 cabins Infinity-class series. These will be the 6th and 7th units and should be transferred to owners in 2021.
In the same yard, we also noted a reported order for two 37,000 gt cruisers for Shanghai Style Cruise Industry Development Co. Ltd, these will operate in the South China Sea.
Compagnie Polynesienne de Transport Maritime (CPTM) in Tahiti placed an order with the Huanghai yard in China for a 14,000 gt/140 cabins unit for delivery 2021.
At Brodosplit, we recorded an order for another unit for Oceanwide Expeditions. The Croatian yard will deliver this 5,590 gt/85 cabins unit in 2021.
In early 2020, the orderbook consisted of some 112 vessels, out of which 74 units are over 40,000 gt.
It shows the unabated enthusiasm of cruise operators throughout all segments of the industry, be it luxury and expedition units, or bigger, mass
market or contemporary vessels.
The following transactions were reported for further trading:
Silver Discoverer (5,218 gt/64 cabins, built 1989 by NKK) went to CroisiEurope France.
Ponant took over Paul Gauguin (19,170 gt/160 cabins, built 1997 by ACH).
Saga Sapphire (37,049 gt/374 cabins, built 1981 by Bremer Vulkan) was reported sold to Anex Tour.
Saga Pearl II (18,627 gt/304 cabins, built 1981 by HDW) was bought by Aqua Explorer Holdings.
Peace Boat will take over Zenith (47,200 gt/720 cabins, built 1992 by Meyer Werft).
In 2019, 11 ships over 40,000 gt were delivered.
France’ Chantiers de l’Atlantique delivered the MSC Bellissima (171,598 gt/2,250 cabins) and MSC Grandiosa (181,541 gt /2,444 cabins).
At Fincantieri, Viking took delivery of their Viking Jupiter (47,861 gt/472 cabins).
The Italian group also handed over to Carnival Corporation’s brands the Carnival Panorama (133, 868 gt /1,977 cabins), Costa Venezia (135,225 gt/2,116 cabins), Sky Princess (145,281 gt /1,830 cabins).
Meyer Group delivered Costa Smeralda (183,731 gt /2,605 cabins) from their Turku yard. From the same facility, TUI took delivery of Mein Schiff 2 (111,554 gt /1,447 cabins).
At Meyer Papenburg Norwegian Cruise Line Holdings received Norwegian Encore (169,116 gt/2,124 cabins) whilst Spectrum of the Seas (169,379 gt/2,090 cabins) was delivered to Royal Caribbean Cruises and Spirit of Discovery (58,250 gt/540 cabins) to Saga Cruises.
Below 40,000 gt, we recorded the following ships delivered throughout the year:
Hurtigruten received from Kleven their Roald Amundsen and Fridtjof Nansen (21,765 gt/265 cabins).
Scenic Eclipse (17,545 gt/114 cabins) was delivered from Croatian yard Uljanik to Scenic Tours.
Vard Soviknes (Fincantieri group) delivered to Hapag Lloyd the Hanseatic Inspiration and Hanseatic Nature (15,651 gt/120 cabins).
From the same yard, Ponant received Le Bougainville and Le Dumont d’Urville (9,988 gt/92 cabins).
Mystic Cruises took over World Explorer (9,923 gt/100 cabins) from Portuguese shipyard West Sea.
In China, CMHI Jiangsu delivered to Sunstone the Greg Mortimer (8,035 gt/85 cabins).
DELIVERIES
SECOND HAND SALES
CRUISESECOND HAND SALES
NEW ORDERS
The orderbook breaks another record with 74 units over 40,000 GT
BRS GROUP - Annual review 2020 BRS GROUP - Annual review 2020
Pacific Dawn (70,285 gt/798 cabins, built 1991 by Fincantieri) and Pacific Aria (55,877/633 cabins, built 1994 by Fincantieri) were purchased by Cruise and Maritime Voyages.
There were three reported demolition sales
• Polaris (2,907 gt/48 cabins, built 1968 in Denmark) • Adriana (4,490 gt /139 cabins, built 1972 in Greece)• Qing (35,143 gt/549 cabins, built 1982 in France)
Hondius (6,603 gt/82 cabins) built by Brodosplit in Croatia went to Oceanwide Expeditions.
Celebrity Flora (5,635 50 cabins) was delivered by De Hoop in the Netherlands to RCCL.
Coral Adventurer (5,516 gt/60 cabins) was delivered by Vard Vung Tau in Vietnam (Fincantieri group) to Coral Expeditions.
Asenav in Chile handed over Magellan Explorer (4,820 gt /50 cabins) to Antarctica XXI.
Pictures: GREG MORTIMER , 8,035 gt, 85 cabins, delivered by CMHI Jiangsu to Sunstone in 2019;COSTA VENEZIA , 135,225 gt, 2,116 cabins, delivered by Ficantieri in 2019 to Costa Cruises. Photo: Fincantieri.
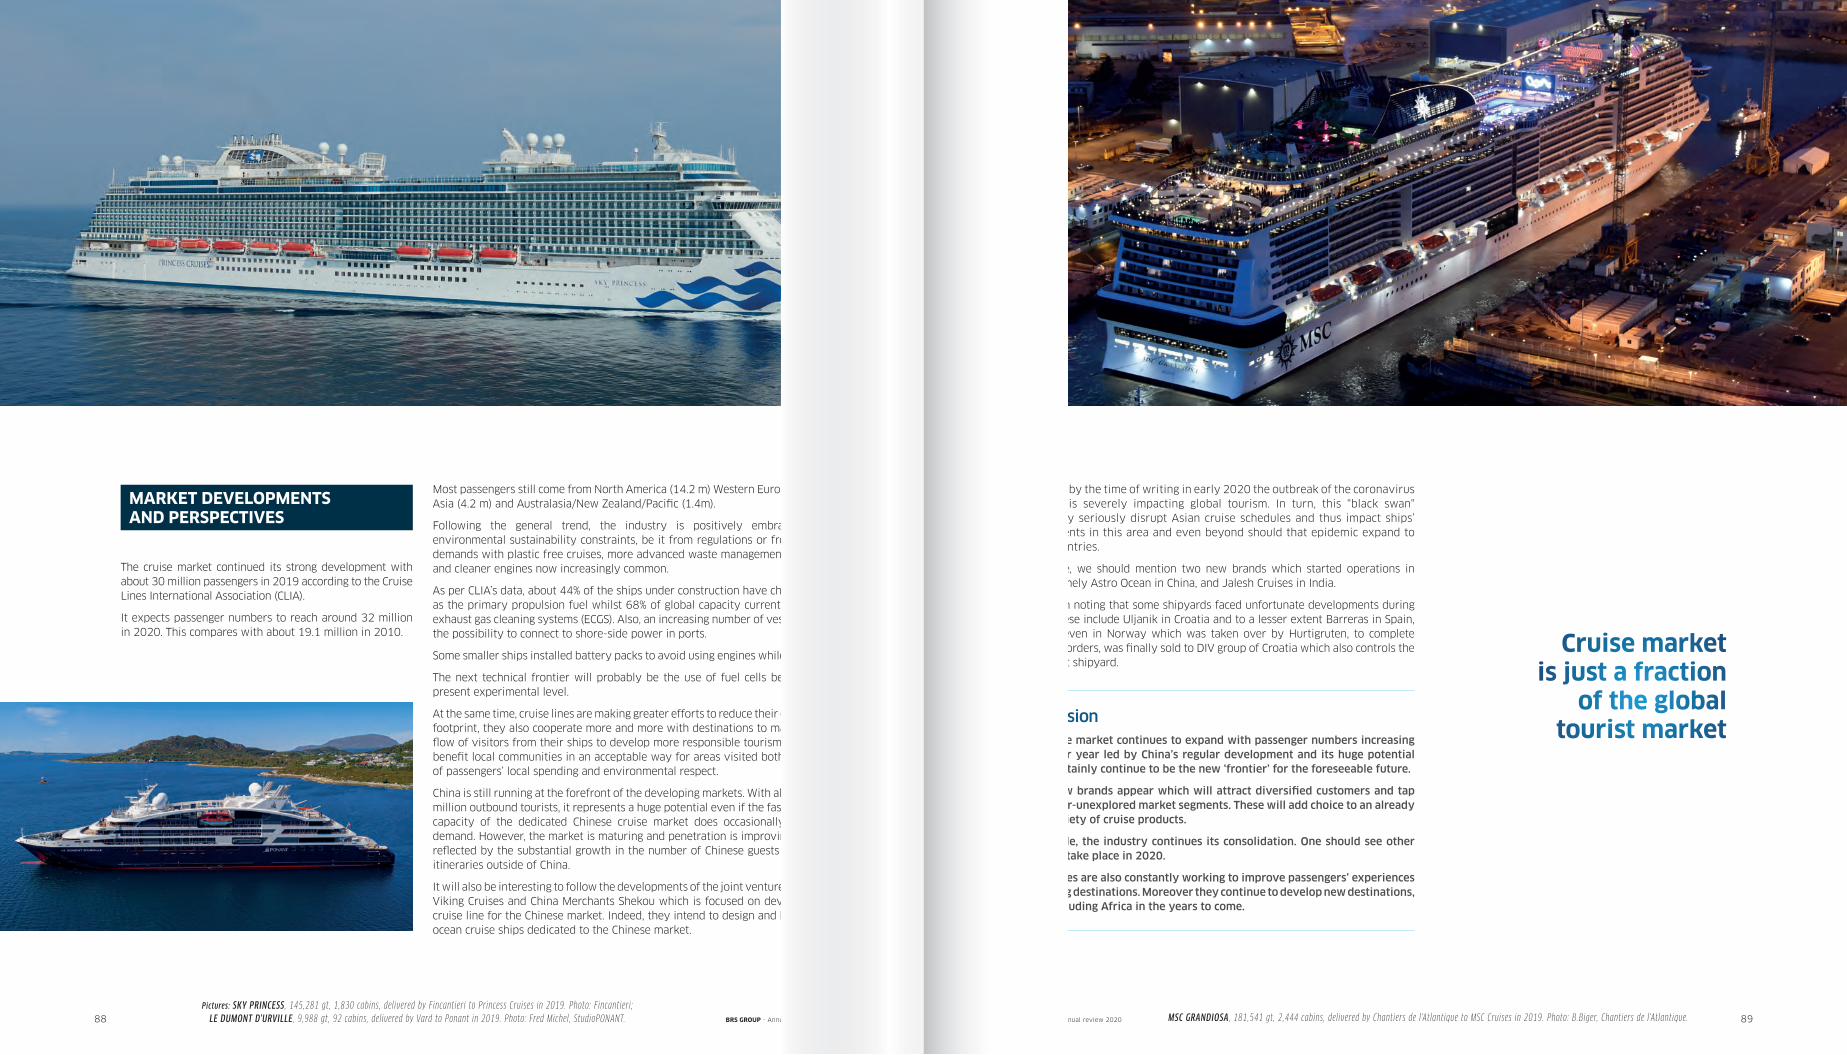
The cruise market continued its strong development with about 30 million passengers in 2019 according to the Cruise Lines International Association (CLIA).
It expects passenger numbers to reach around 32 million in 2020. This compares with about 19.1 million in 2010.
88 89
Most passengers still come from North America (14.2 m) Western Europe (6.7m), Asia (4.2 m) and Australasia/New Zealand/Pacific (1.4m).
Following the general trend, the industry is positively embracing the environmental sustainability constraints, be it from regulations or from public demands with plastic free cruises, more advanced waste management systems and cleaner engines now increasingly common.
As per CLIA’s data, about 44% of the ships under construction have chosen LNG as the primary propulsion fuel whilst 68% of global capacity currently utilizes exhaust gas cleaning systems (ECGS). Also, an increasing number of vessels have the possibility to connect to shore-side power in ports.
Some smaller ships installed battery packs to avoid using engines while in berth.
The next technical frontier will probably be the use of fuel cells beyond the present experimental level.
At the same time, cruise lines are making greater efforts to reduce their ecological footprint, they also cooperate more and more with destinations to manage the flow of visitors from their ships to develop more responsible tourism. This will benefit local communities in an acceptable way for areas visited both in terms of passengers’ local spending and environmental respect.
China is still running at the forefront of the developing markets. With almost 180 million outbound tourists, it represents a huge potential even if the fast-growing capacity of the dedicated Chinese cruise market does occasionally outstrip demand. However, the market is maturing and penetration is improving. This is reflected by the substantial growth in the number of Chinese guests on cruise itineraries outside of China.
It will also be interesting to follow the developments of the joint venture between Viking Cruises and China Merchants Shekou which is focused on developing a cruise line for the Chinese market. Indeed, they intend to design and build new ocean cruise ships dedicated to the Chinese market.
However, by the time of writing in early 2020 the outbreak of the coronavirus in China is severely impacting global tourism. In turn, this "black swan" event may seriously disrupt Asian cruise schedules and thus impact ships’ deployments in this area and even beyond should that epidemic expand to other countries.
Elsewhere, we should mention two new brands which started operations in 2019, namely Astro Ocean in China, and Jalesh Cruises in India.
It is worth noting that some shipyards faced unfortunate developments during 2019. These include Uljanik in Croatia and to a lesser extent Barreras in Spain, whilst Kleven in Norway which was taken over by Hurtigruten, to complete their two orders, was finally sold to DIV group of Croatia which also controls the Brodosplit shipyard.
ConclusionThe cruise market continues to expand with passenger numbers increasing year after year led by China’s regular development and its huge potential It will certainly continue to be the new ‘frontier’ for the foreseeable future.
Some new brands appear which will attract diversified customers and tap into so-far-unexplored market segments. These will add choice to an already great variety of cruise products.
Meanwhile, the industry continues its consolidation. One should see other alliances take place in 2020.
Cruise lines are also constantly working to improve passengers’ experiences at existing destinations. Moreover they continue to develop new destinations, likely including Africa in the years to come.
MARKET DEVELOPMENTSAND PERSPECTIVES
MSC GRANDIOSA , 181,541 gt, 2,444 cabins, delivered by Chantiers de l'Atlantique to MSC Cruises in 2019. Photo: B.Biger, Chantiers de l'Atlantique.Pictures: SKY PRINCESS , 145,281 gt, 1,830 cabins, delivered by Fincantieri to Princess Cruises in 2019. Photo: Fincantieri;
LE DUMONT D'URVILLE , 9,988 gt, 92 cabins, delivered by Vard to Ponant in 2019. Photo: Fred Michel, StudioPONANT. BRS GROUP - Annual review 2020 BRS GROUP - Annual review 2020
Cruise market is just a fraction
of the global tourist market
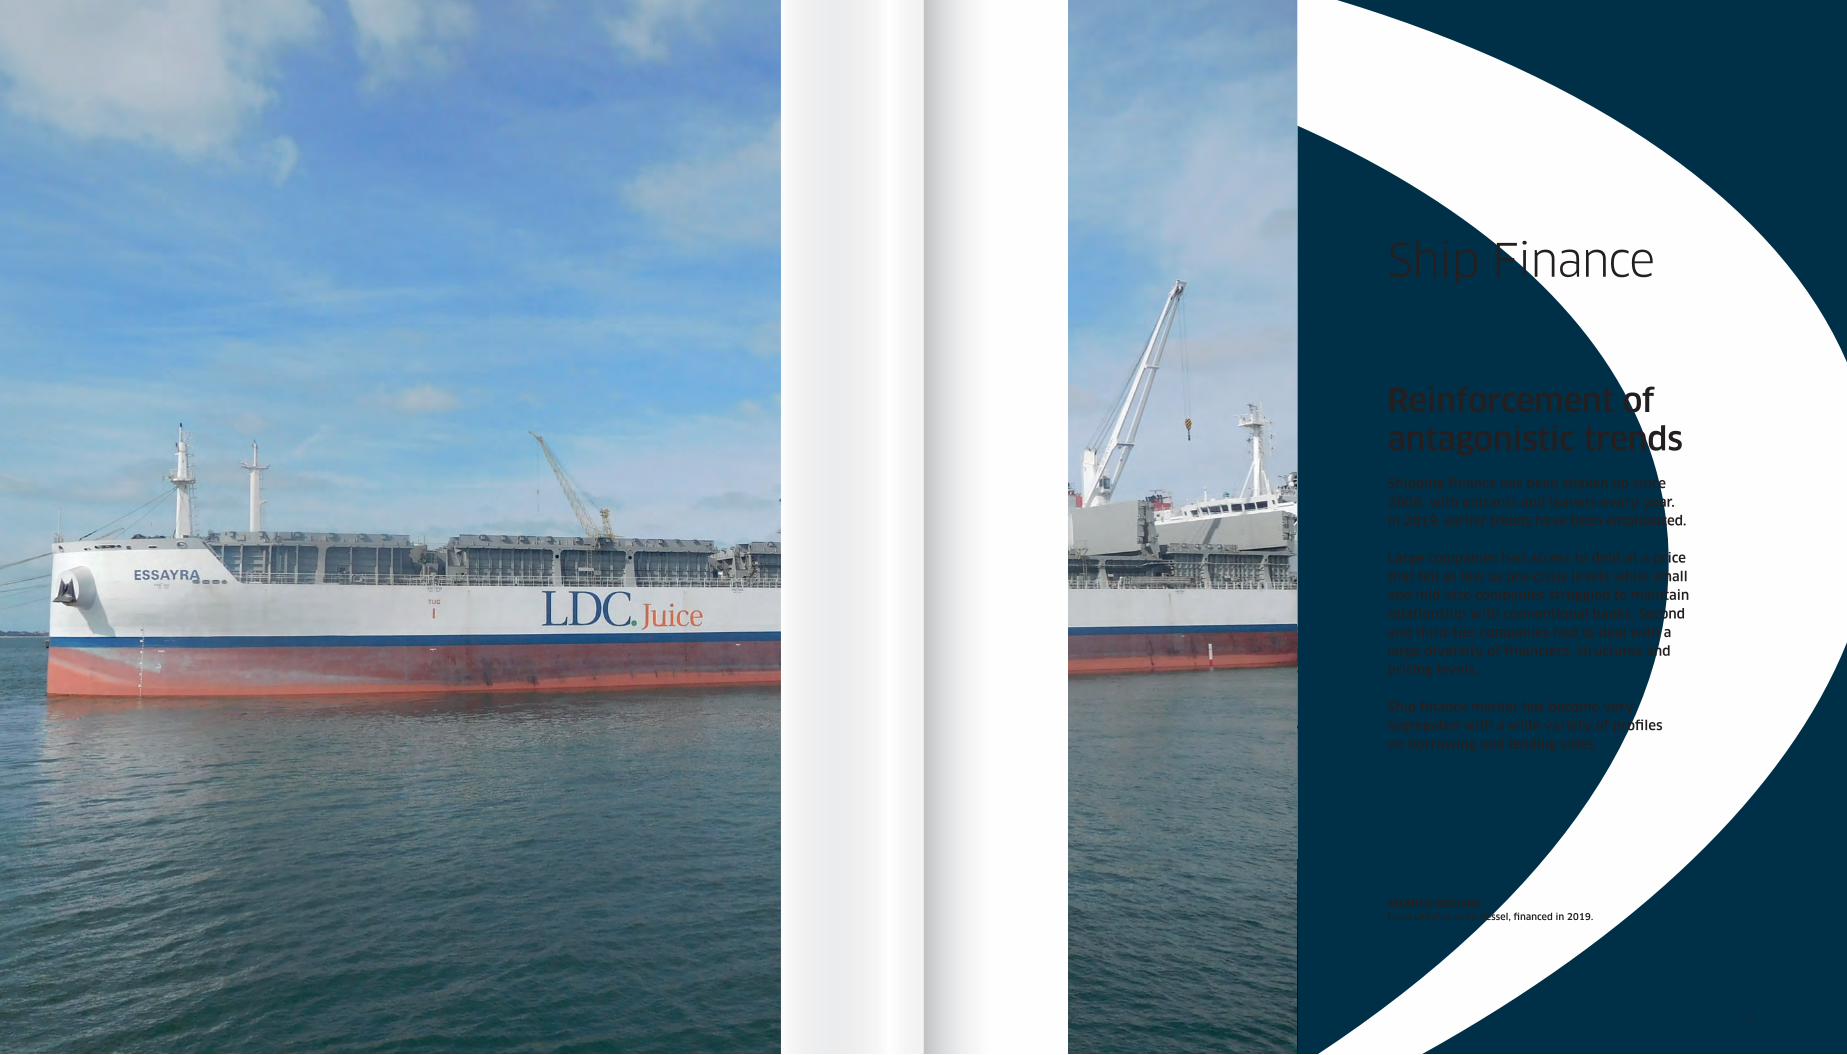
Ship Finance
Reinforcement of antagonistic trendsShipping finance has been shaken up since 2008, with entrants and leavers every year. In 2019, earlier trends have been emphasized.
Large companies had access to debt at a price that fell as low as pre-crisis levels while small and mid-size companies struggled to maintain relationship with conventional banks. Second and third-tier companies had to deal with a large diversity of financiers, structures and pricing levels.
Ship finance market has become very segregated with a wide variety of profiles on borrowing and lending sides.
ATLANTIC ORCHARDLouis Dreyfus Juice Vessel, financed in 2019.
91
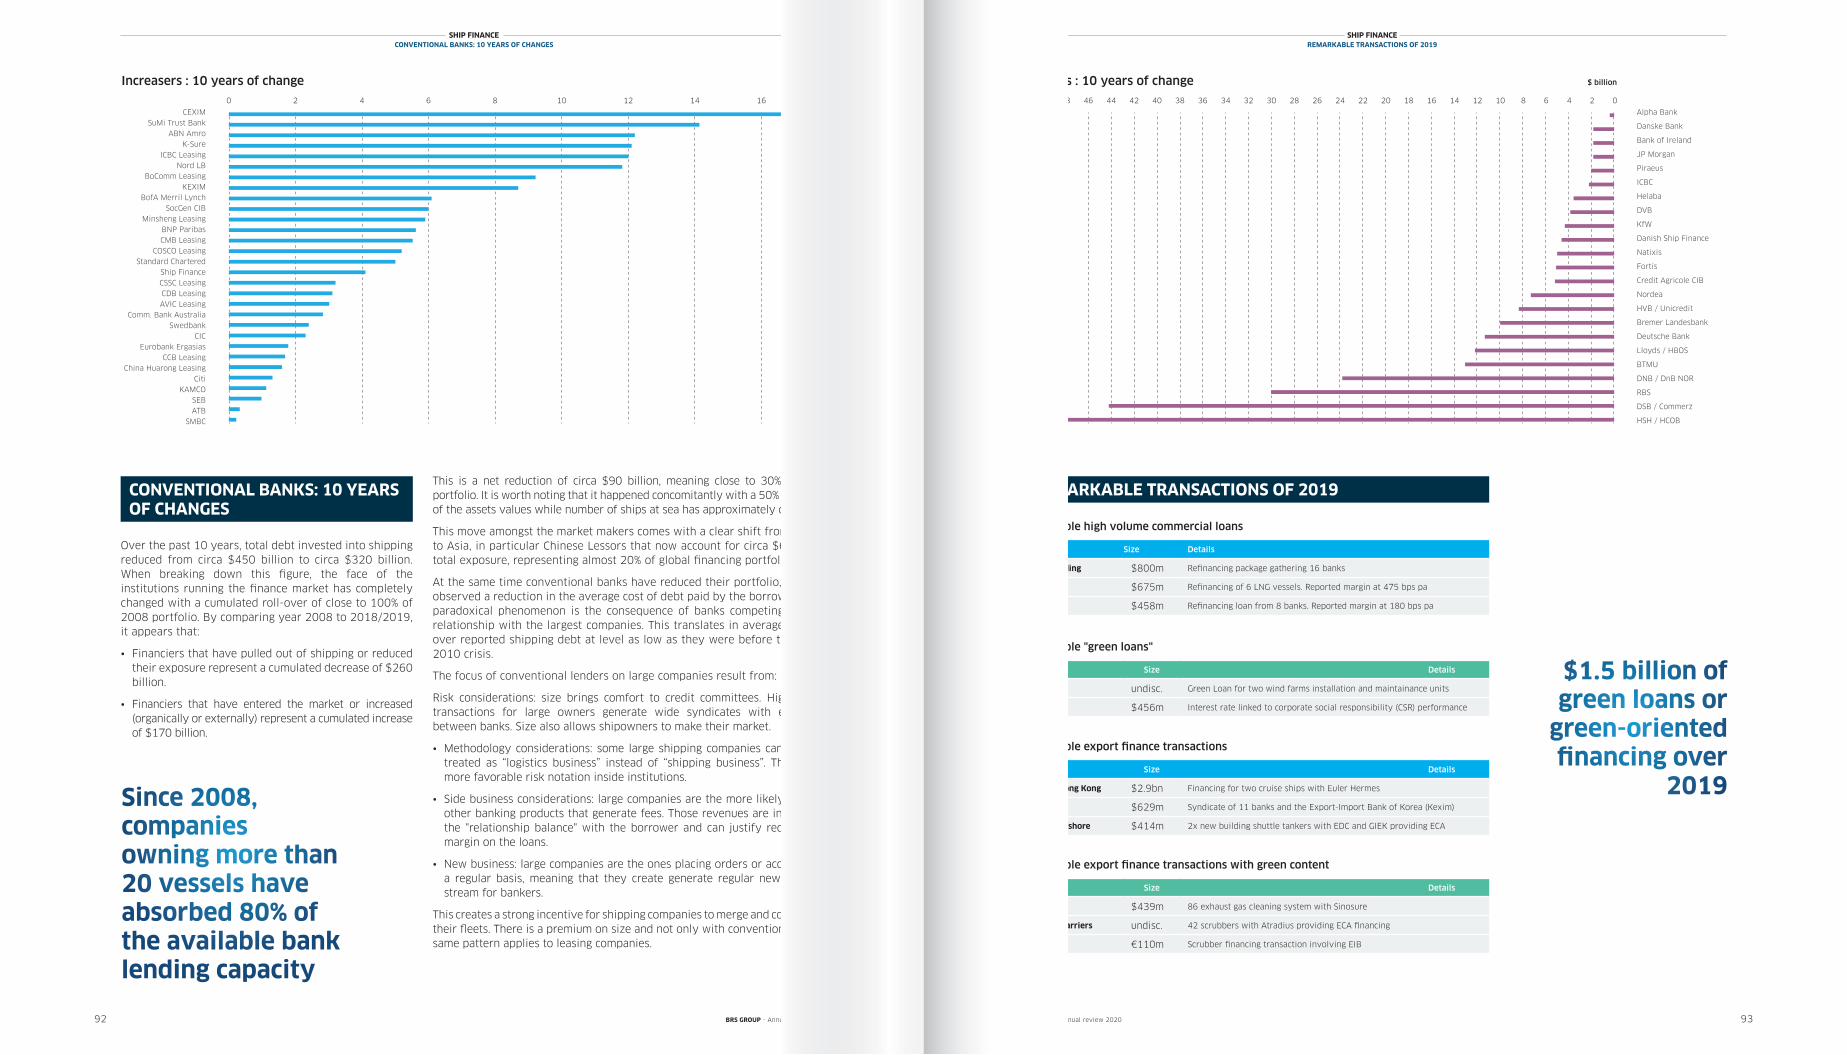
Over the past 10 years, total debt invested into shipping reduced from circa $450 billion to circa $320 billion. When breaking down this figure, the face of the institutions running the finance market has completely changed with a cumulated roll-over of close to 100% of 2008 portfolio. By comparing year 2008 to 2018/2019, it appears that:
• Financiers that have pulled out of shipping or reduced their exposure represent a cumulated decrease of $260 billion.
• Financiers that have entered the market or increased (organically or externally) represent a cumulated increase of $170 billion.
92 93
This is a net reduction of circa $90 billion, meaning close to 30% of 2008 portfolio. It is worth noting that it happened concomitantly with a 50% reduction of the assets values while number of ships at sea has approximately doubled.
This move amongst the market makers comes with a clear shift from Europe to Asia, in particular Chinese Lessors that now account for circa $65 billion total exposure, representing almost 20% of global financing portfolio.
At the same time conventional banks have reduced their portfolio, we have observed a reduction in the average cost of debt paid by the borrowers. This paradoxical phenomenon is the consequence of banks competing to keep relationship with the largest companies. This translates in average margins over reported shipping debt at level as low as they were before the 2008-2010 crisis.
The focus of conventional lenders on large companies result from:
Risk considerations: size brings comfort to credit committees. High profile transactions for large owners generate wide syndicates with emulation between banks. Size also allows shipowners to make their market.
• Methodology considerations: some large shipping companies can even be treated as “logistics business” instead of “shipping business”. This allows more favorable risk notation inside institutions.
• Side business considerations: large companies are the more likely users of other banking products that generate fees. Those revenues are included in the "relationship balance" with the borrower and can justify reduction in margin on the loans.
• New business: large companies are the ones placing orders or acquiring on a regular basis, meaning that they create generate regular new business stream for bankers.
This creates a strong incentive for shipping companies to merge and consolidate their fleets. There is a premium on size and not only with conventional banks, same pattern applies to leasing companies.
REMARKABLE TRANSACTIONS OF 2019
$1.5 billion of green loans or
green-oriented financing over
2019
BRS GROUP - Annual review 2020 BRS GROUP - Annual review 2020
CONVENTIONAL BANKS: 10 YEARS OF CHANGES
CEXIMSuMi Trust Bank
ABN AmroK-Sure
ICBC LeasingNord LB
BoComm LeasingKEXIM
BofA Merril LynchSocGen CIB
Minsheng LeasingBNP ParibasCMB Leasing
COSCO LeasingStandard Chartered
Ship FinanceCSSC LeasingCDB LeasingAVIC Leasing
Comm. Bank AustraliaSwedbank
CICEurobank Ergasias
CCB LeasingChina Huarong Leasing
CitiKAMCO
SEBATB
SMBC
86420 1612 1410 18
Borrower Size Details
Genting Hong Kong $2.9bn Financing for two cruise ships with Euler Hermes
Flex LNG $629m Syndicate of 11 banks and the Export-Import Bank of Korea (Kexim)
Teekay Offshore $414m 2x new building shuttle tankers with EDC and GIEK providing ECA
Remarkable export finance transactions
Borrower Size Details
Arkas Holding $800m Refinancing package gathering 16 banks
Dynagas $675m Refinancing of 6 LNG vessels. Reported margin at 475 bps pa
BW LPG $458m Refinancing loan from 8 banks. Reported margin at 180 bps pa
Remarkable high volume commercial loans
Borrower Size Details
Jan de Nul undisc. Green Loan for two wind farms installation and maintainance units
NYK $456m Interest rate linked to corporate social responsibility (CSR) performance
Remarkable "green loans"
Borrower Size Details
MSC $439m 86 exhaust gas cleaning system with Sinosure
Starbulk Carriers undisc. 42 scrubbers with Atradius providing ECA financing
Spliethoff €110m Scrubber financing transaction involving EIB
Remarkable export finance transactions with green content
CEXIMSuMi Trust Bank
ABN AmroK-Sure
ICBC LeasingNord LB
BoComm LeasingKEXIM
BofA Merril LynchSocGen CIB
Minsheng LeasingBNP ParibasCMB Leasing
COSCO LeasingStandard Chartered
Ship FinanceCSSC LeasingCDB LeasingAVIC Leasing
Comm. Bank AustraliaSwedbank
CICEurobank Ergasias
CCB LeasingChina Huarong Leasing
CitiKAMCO
SEBATB
SMBC
SHIP FINANCECONVENTIONAL BANKS: 10 YEARS OF CHANGES
SHIP FINANCEREMARKABLE TRANSACTIONS OF 2019
SHIP FINANCEALTERNATIVE LENDING
3840424446485052 1618202224263034 02468101214283236
Alpha Bank
Danske Bank
Bank of Ireland
JP Morgan
Piraeus
ICBC
Helaba
DVB
KfW
Danish Ship Finance
Natixis
Fortis
Credit Agricole CIB
Nordea
HVB / Unicredit
Bremer Landesbank
Deutsche Bank
Lloyds / HBOS
BTMU
DNB / DnB NOR
RBS
DSB / Commerz
HSH / HCOB
Alpha Bank
Danske Bank
Bank of Ireland
JP Morgan
Piraeus
ICBC
Helaba
DVB
KfW
Danish Ship Finance
Natixis
Fortis
Credit Agricole CIB
Nordea
HVB / Unicredit
Bremer Landesbank
Deutsche Bank
Lloyds / HBOS
BTMU
DNB / DnB NOR
RBS
DSB / Commerz
HSH / HCOB
Since 2008, companiesowning more than 20 vessels have absorbed 80% of the available bank lending capacity
Increasers : 10 years of change Reducers : 10 years of change$ billion $ billion
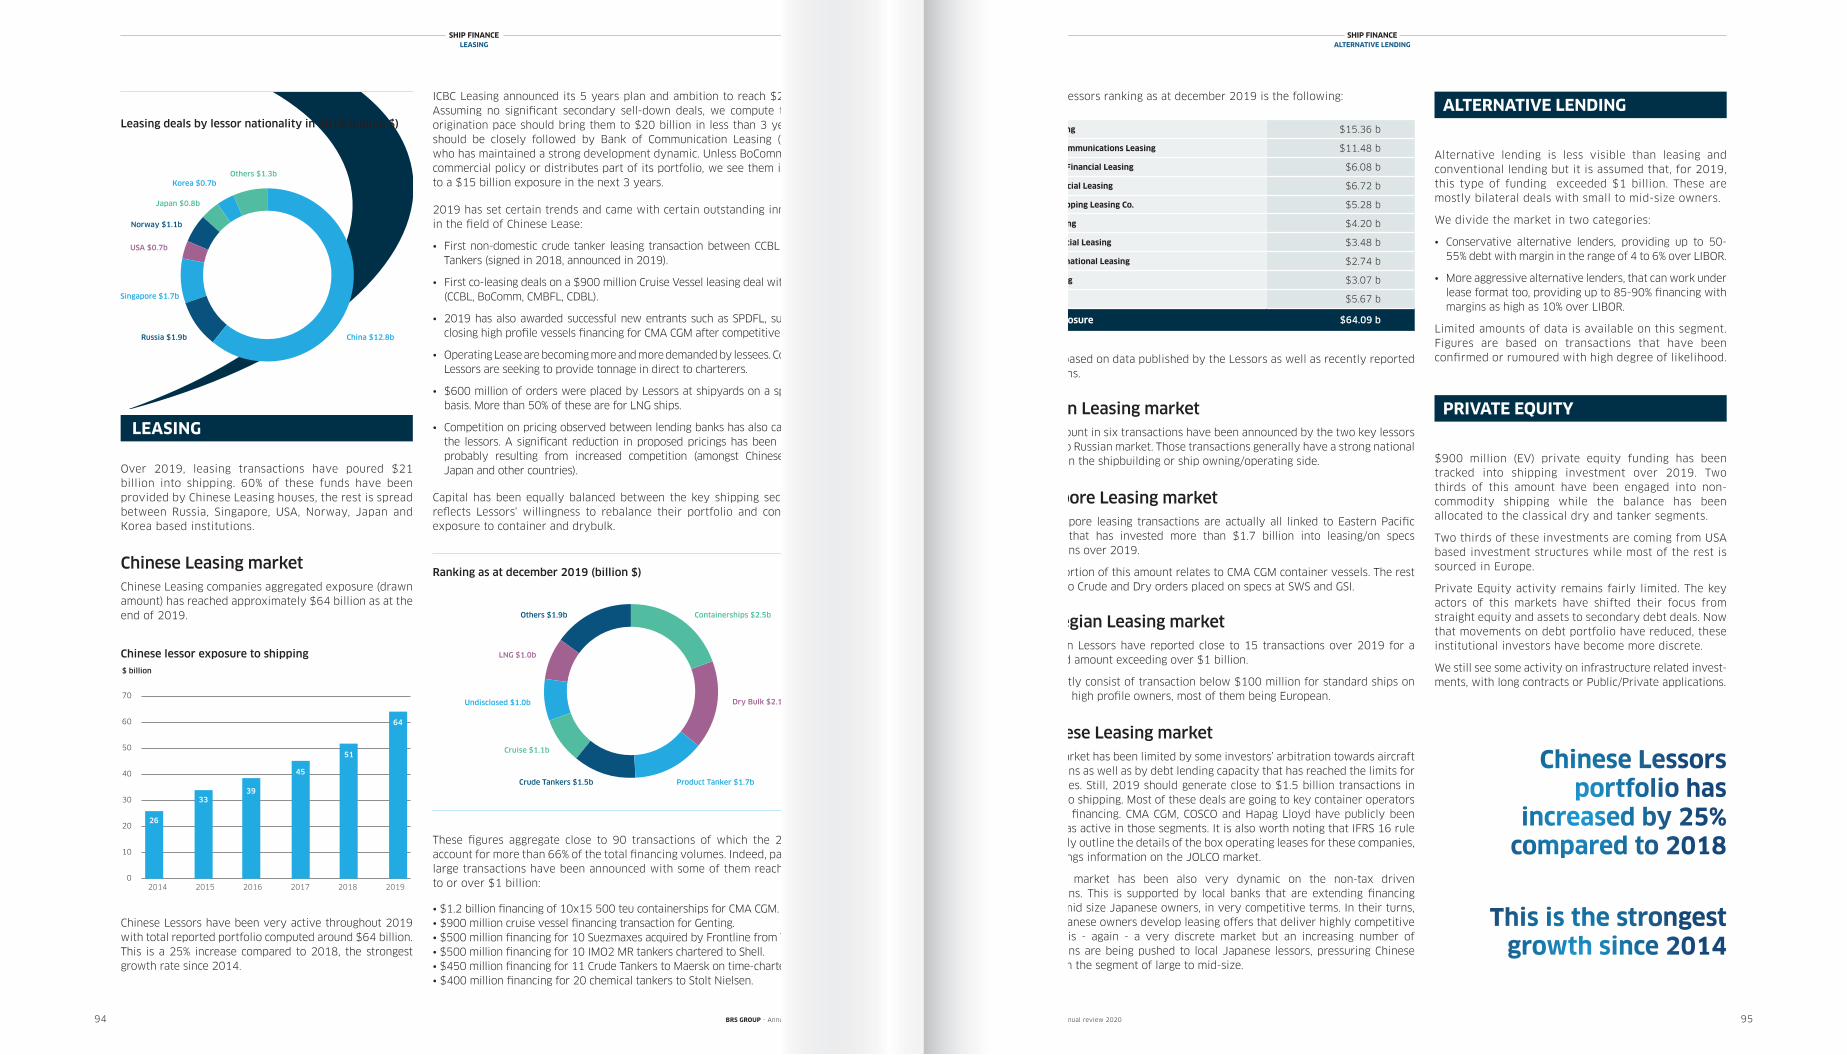
Over 2019, leasing transactions have poured $21 billion into shipping. 60% of these funds have been provided by Chinese Leasing houses, the rest is spread between Russia, Singapore, USA, Norway, Japan and Korea based institutions.
Chinese Leasing marketChinese Leasing companies aggregated exposure (drawn amount) has reached approximately $64 billion as at the end of 2019.
SHIP FINANCELEASING
SHIP FINANCEALTERNATIVE LENDING
LEASING
94 95
Chinese Lessorsportfolio has
increased by 25% compared to 2018
This is the strongest growth since 2014
BRS GROUP - Annual review 2020 BRS GROUP - Annual review 2020
ICBC Leasing announced its 5 years plan and ambition to reach $20 billion. Assuming no significant secondary sell-down deals, we compute that their origination pace should bring them to $20 billion in less than 3 years. ICBC should be closely followed by Bank of Communication Leasing (BoComm) who has maintained a strong development dynamic. Unless BoComm changes commercial policy or distributes part of its portfolio, we see them increasing to a $15 billion exposure in the next 3 years.
2019 has set certain trends and came with certain outstanding innovations in the field of Chinese Lease:
• First non-domestic crude tanker leasing transaction between CCBL and Almi Tankers (signed in 2018, announced in 2019).
• First co-leasing deals on a $900 million Cruise Vessel leasing deal with Genting (CCBL, BoComm, CMBFL, CDBL).
• 2019 has also awarded successful new entrants such as SPDFL, successfully closing high profile vessels financing for CMA CGM after competitive process.
• Operating Lease are becoming more and more demanded by lessees. Conversely, Lessors are seeking to provide tonnage in direct to charterers.
• $600 million of orders were placed by Lessors at shipyards on a speculative basis. More than 50% of these are for LNG ships.
• Competition on pricing observed between lending banks has also cascaded to the lessors. A significant reduction in proposed pricings has been observed, probably resulting from increased competition (amongst Chinese Lessors, Japan and other countries).
Capital has been equally balanced between the key shipping sectors. This reflects Lessors' willingness to rebalance their portfolio and control their exposure to container and drybulk.
These figures aggregate close to 90 transactions of which the 20 largest account for more than 66% of the total financing volumes. Indeed, particularly large transactions have been announced with some of them reaching close to or over $1 billion:
• $1.2 billion financing of 10x15 500 teu containerships for CMA CGM.• $900 million cruise vessel financing transaction for Genting. • $500 million financing for 10 Suezmaxes acquired by Frontline from Trafigura.• $500 million financing for 10 IMO2 MR tankers chartered to Shell.• $450 million financing for 11 Crude Tankers to Maersk on time-charter to BP.• $400 million financing for 20 chemical tankers to Stolt Nielsen.
$900 million (EV) private equity funding has been tracked into shipping investment over 2019. Two thirds of this amount have been engaged into non-commodity shipping while the balance has been allocated to the classical dry and tanker segments.
Two thirds of these investments are coming from USA based investment structures while most of the rest is sourced in Europe.
Private Equity activity remains fairly limited. The key actors of this markets have shifted their focus from straight equity and assets to secondary debt deals. Now that movements on debt portfolio have reduced, these institutional investors have become more discrete.
We still see some activity on infrastructure related invest-ments, with long contracts or Public/Private applications.
PRIVATE EQUITY
Chinese Lessors ranking as at december 2019 is the following:
Ranking based on data published by the Lessors as well as recently reported drawdowns.
Russian Leasing marketLarge amount in six transactions have been announced by the two key lessors active into Russian market. Those transactions generally have a strong national content, on the shipbuilding or ship owning/operating side.
Singapore Leasing marketThe Singapore leasing transactions are actually all linked to Eastern Pacific Shipping that has invested more than $1.7 billion into leasing/on specs transactions over 2019.
A large portion of this amount relates to CMA CGM container vessels. The rest is linked to Crude and Dry orders placed on specs at SWS and GSI.
Norwegian Leasing marketNorwegian Lessors have reported close to 15 transactions over 2019 for a cumulated amount exceeding over $1 billion.
They mostly consist of transaction below $100 million for standard ships on charter to high profile owners, most of them being European.
Japanese Leasing marketJOLCO Market has been limited by some investors’ arbitration towards aircraft transactions as well as by debt lending capacity that has reached the limits for key Lessees. Still, 2019 should generate close to $1.5 billion transactions in JOLCO into shipping. Most of these deals are going to key container operators for boxes financing. CMA CGM, COSCO and Hapag Lloyd have publicly been reported as active in those segments. It is also worth noting that IFRS 16 rule now clearly outline the details of the box operating leases for these companies, which brings information on the JOLCO market.
Japanese market has been also very dynamic on the non-tax driven transactions. This is supported by local banks that are extending financing to small-mid size Japanese owners, in very competitive terms. In their turns, these Japanese owners develop leasing offers that deliver highly competitive terms. It is - again - a very discrete market but an increasing number of transactions are being pushed to local Japanese lessors, pressuring Chinese Lessors on the segment of large to mid-size.
Alternative lending is less visible than leasing and conventional lending but it is assumed that, for 2019, this type of funding exceeded $1 billion. These are mostly bilateral deals with small to mid-size owners.
We divide the market in two categories:
• Conservative alternative lenders, providing up to 50-55% debt with margin in the range of 4 to 6% over LIBOR.
• More aggressive alternative lenders, that can work under lease format too, providing up to 85-90% financing with margins as high as 10% over LIBOR.
Limited amounts of data is available on this segment. Figures are based on transactions that have been confirmed or rumoured with high degree of likelihood.
ALTERNATIVE LENDINGICBC Leasing $15.36 b
Bank of Communications Leasing $11.48 b
Minsheng Financial Leasing $6.08 b
CMB Financial Leasing $6.72 b
COSCO Shipping Leasing Co. $5.28 b
CSSC Leasing $4.20 b
CDB Financial Leasing $3.48 b
AVIC International Leasing $2.74 b
CCB Leasing $3.07 b
Others $5.67 b
Total exposure $64.09 b
Chinese Lessors have been very active throughout 2019 with total reported portfolio computed around $64 billion. This is a 25% increase compared to 2018, the strongest growth rate since 2014.
Leasing deals by lessor nationality in 2019 (billion $)
Others $1.3b
Norway $1.1b
USA $0.7b
China $12.8b
Korea $0.7b
Singapore $1.7b
Russia $1.9b
Japan $0.8b
Chinese lessor exposure to shipping
0
10
20
30
40
50
60
70
N° of vessels
Historical LNG newbuilding activity
20191972 1975 1980 1985 1990 1995 2005 2010 20152000
0
10
20
30
40
50
60
70
$ billion
Chinese lessor exposure to shipping
2014 20192015 20182016 2017
64
51
45
3933
26
CEXIMSuMi Trust Bank
ABN AmroK-Sure
ICBC LeasingNord LB
BoComm LeasingKEXIM
BofA Merril LynchSocGen CIB
Minsheng LeasingBNP ParibasCMB Leasing
COSCO LeasingStandard Chartered
Ship FinanceCSSC LeasingCDB LeasingAVIC Leasing
Comm. Bank AustraliaSwedbank
CICEurobank Ergasias
CCB LeasingChina Huarong Leasing
CitiKAMCO
SEBATB
SMBC
86420 181612 1410
$ billion
2015 2016 2017 2018 20192014
Ranking as at december 2019 (billion $)
Containerships $2.5b
LNG $1.0b
Product Tanker $1.7b
Others $1.9b
Undisclosed $1.0b
Crude Tankers $1.5b
Cruise $1.1b
Dry Bulk $2.1b
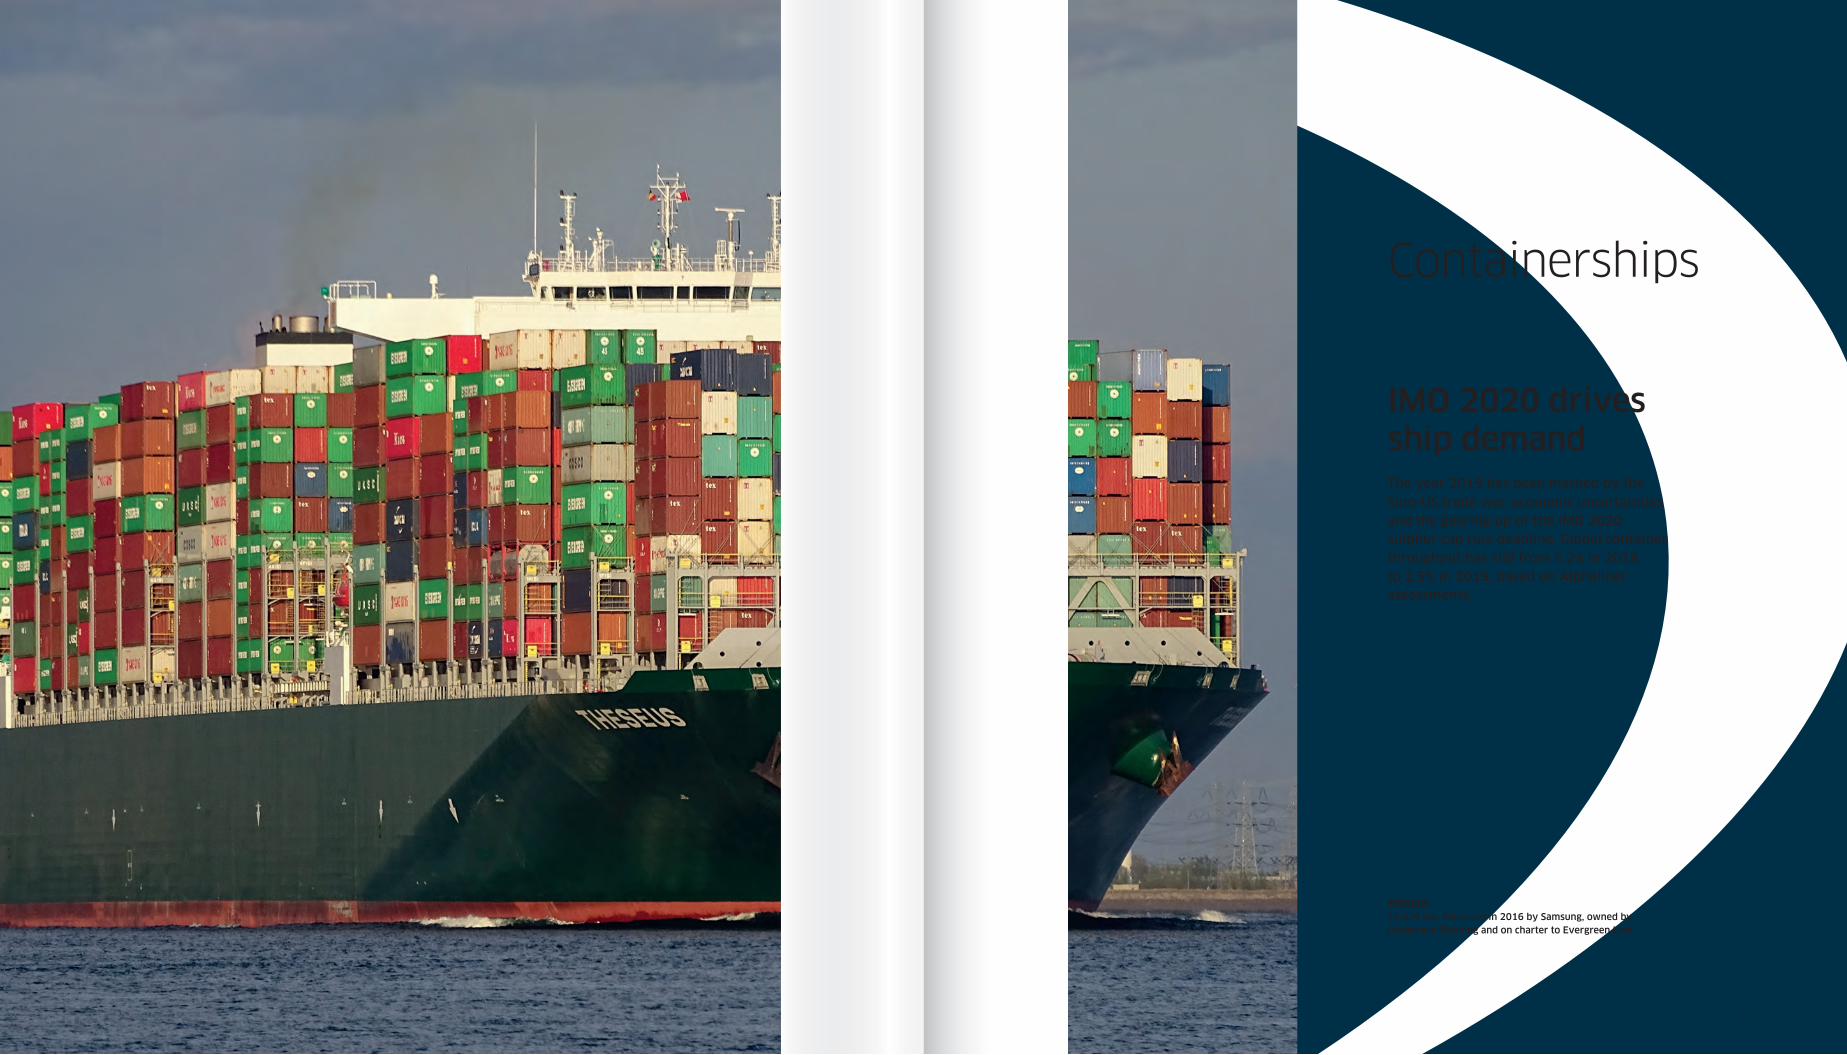
97
Containerships
IMO 2020 drives ship demand The year 2019 has been marked by the Sino-US trade war, economic uncertainties and the gearing-up of the IMO 2020 sulphur cap rule deadline. Global container throughput has slid from 5.2% in 2018 to 2.5% in 2019, based on Alphaliner assessments.
THESEUS14,424 teu, delivered in 2016 by Samsung, owned by Costamare Shipping and on charter to Evergreen Line.
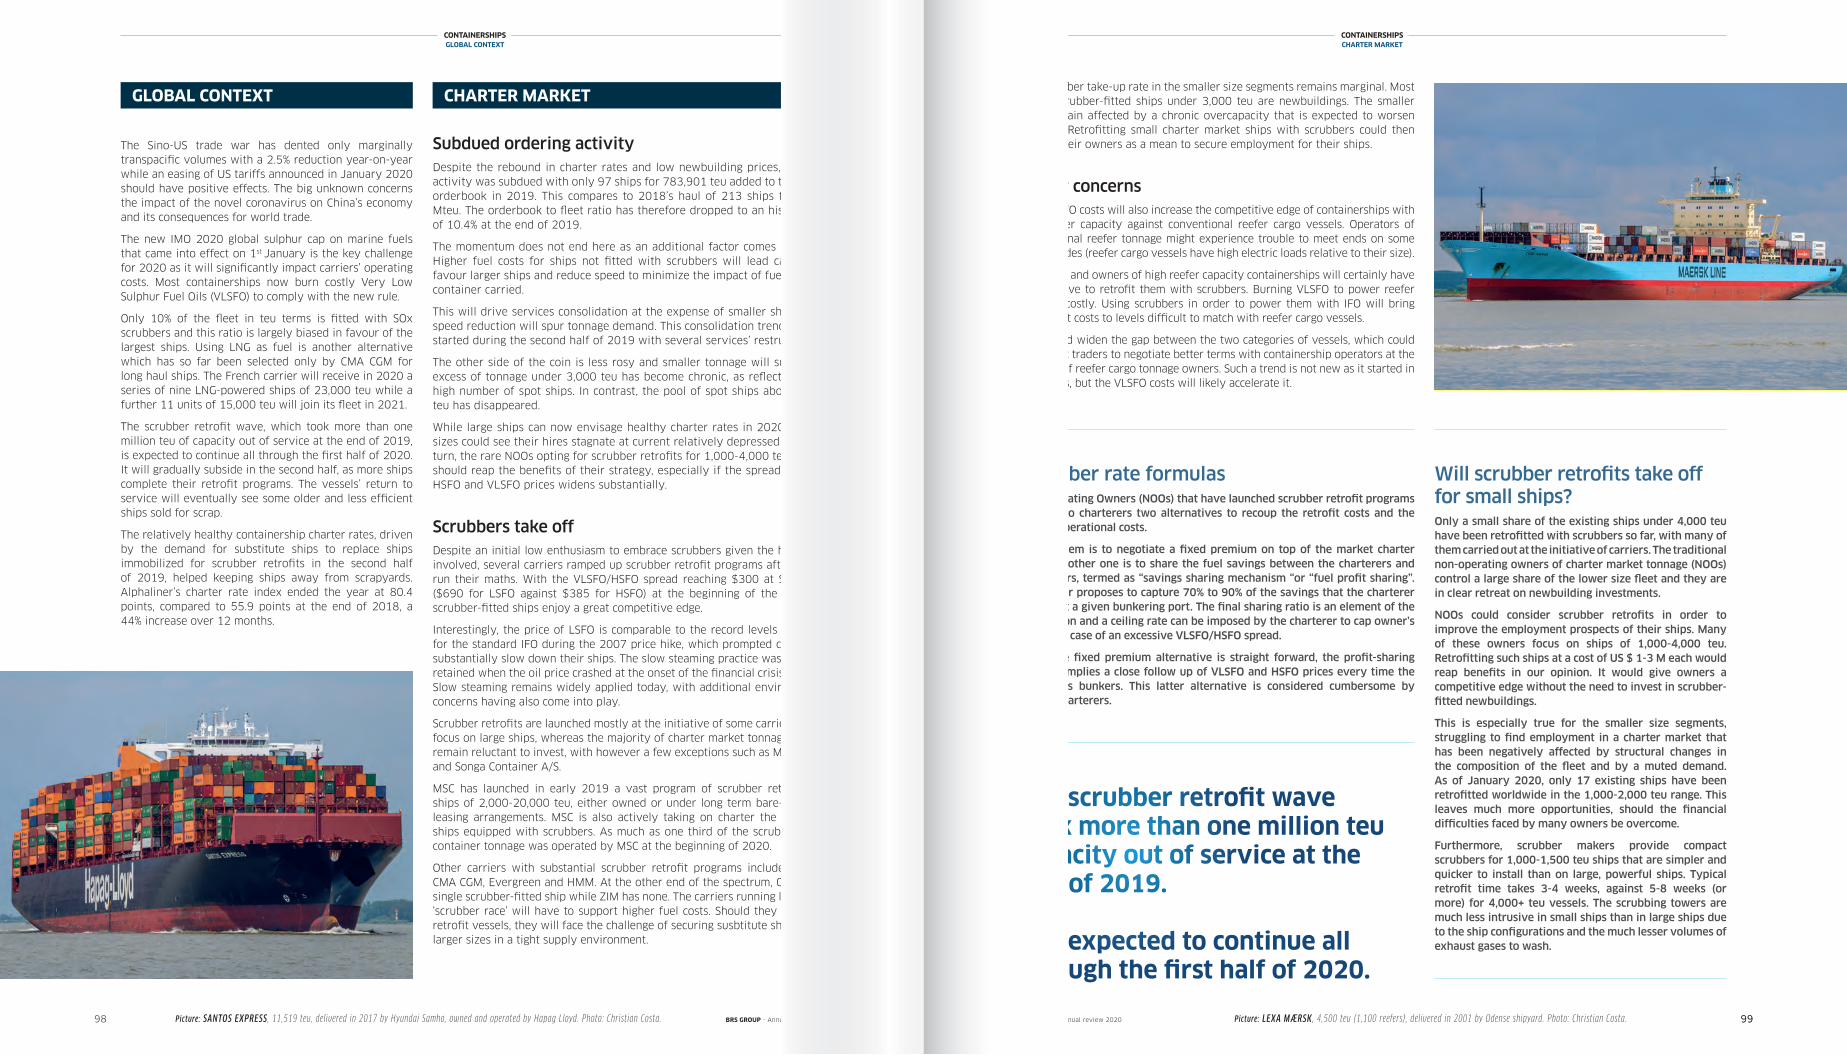
Subdued ordering activityDespite the rebound in charter rates and low newbuilding prices, ordering activity was subdued with only 97 ships for 783,901 teu added to the global orderbook in 2019. This compares to 2018’s haul of 213 ships for 1.297 Mteu. The orderbook to fleet ratio has therefore dropped to an historic low of 10.4% at the end of 2019.
The momentum does not end here as an additional factor comes into play. Higher fuel costs for ships not fitted with scrubbers will lead carriers to favour larger ships and reduce speed to minimize the impact of fuel cost per container carried.
This will drive services consolidation at the expense of smaller ships while speed reduction will spur tonnage demand. This consolidation trend actually started during the second half of 2019 with several services’ restructurings.
The other side of the coin is less rosy and smaller tonnage will suffer. The excess of tonnage under 3,000 teu has become chronic, as reflected in the high number of spot ships. In contrast, the pool of spot ships above 5,000 teu has disappeared.
While large ships can now envisage healthy charter rates in 2020, smaller sizes could see their hires stagnate at current relatively depressed levels. In turn, the rare NOOs opting for scrubber retrofits for 1,000-4,000 teu vessels should reap the benefits of their strategy, especially if the spread between HSFO and VLSFO prices widens substantially.
Scrubbers take offDespite an initial low enthusiasm to embrace scrubbers given the high costs involved, several carriers ramped up scrubber retrofit programs after having run their maths. With the VLSFO/HSFO spread reaching $300 at Singapore ($690 for LSFO against $385 for HSFO) at the beginning of the year, the scrubber-fitted ships enjoy a great competitive edge.
Interestingly, the price of LSFO is comparable to the record levels observed for the standard IFO during the 2007 price hike, which prompted carriers to substantially slow down their ships. The slow steaming practice was however retained when the oil price crashed at the onset of the financial crisis in 2008. Slow steaming remains widely applied today, with additional environmental concerns having also come into play.
Scrubber retrofits are launched mostly at the initiative of some carriers with a focus on large ships, whereas the majority of charter market tonnage owners remain reluctant to invest, with however a few exceptions such as MPC Group and Songa Container A/S.
MSC has launched in early 2019 a vast program of scrubber retrofits for ships of 2,000-20,000 teu, either owned or under long term bare-boat and leasing arrangements. MSC is also actively taking on charter the few NOO ships equipped with scrubbers. As much as one third of the scrubber-fitted container tonnage was operated by MSC at the beginning of 2020.
Other carriers with substantial scrubber retrofit programs include Maersk, CMA CGM, Evergreen and HMM. At the other end of the spectrum, ONE has a single scrubber-fitted ship while ZIM has none. The carriers running late in the ‘scrubber race’ will have to support higher fuel costs. Should they decide to retrofit vessels, they will face the challenge of securing susbtitute ships in the larger sizes in a tight supply environment.
The scrubber take-up rate in the smaller size segments remains marginal. Most of the scrubber-fitted ships under 3,000 teu are newbuildings. The smaller sizes remain affected by a chronic overcapacity that is expected to worsen in 2020. Retrofitting small charter market ships with scrubbers could then benefit their owners as a mean to secure employment for their ships.
Reefer concernsHigh VLSFO costs will also increase the competitive edge of containerships with high reefer capacity against conventional reefer cargo vessels. Operators of conventional reefer tonnage might experience trouble to meet ends on some reefer trades (reefer cargo vessels have high electric loads relative to their size).
Operators and owners of high reefer capacity containerships will certainly have an incentive to retrofit them with scrubbers. Burning VLSFO to power reefer boxes is costly. Using scrubbers in order to power them with IFO will bring reefer unit costs to levels difficult to match with reefer cargo vessels.
This would widen the gap between the two categories of vessels, which could drive fruit traders to negotiate better terms with containership operators at the expense of reefer cargo tonnage owners. Such a trend is not new as it started in the 1970s, but the VLSFO costs will likely accelerate it.
CONTAINERSHIPSGLOBAL CONTEXT
CONTAINERSHIPSCHARTER MARKET
The Sino-US trade war has dented only marginally transpacific volumes with a 2.5% reduction year-on-year while an easing of US tariffs announced in January 2020 should have positive effects. The big unknown concerns the impact of the novel coronavirus on China’s economy and its consequences for world trade.
The new IMO 2020 global sulphur cap on marine fuels that came into effect on 1st January is the key challenge for 2020 as it will significantly impact carriers’ operating costs. Most containerships now burn costly Very Low Sulphur Fuel Oils (VLSFO) to comply with the new rule.
Only 10% of the fleet in teu terms is fitted with SOx scrubbers and this ratio is largely biased in favour of the largest ships. Using LNG as fuel is another alternative which has so far been selected only by CMA CGM for long haul ships. The French carrier will receive in 2020 a series of nine LNG-powered ships of 23,000 teu while a further 11 units of 15,000 teu will join its fleet in 2021.
The scrubber retrofit wave, which took more than one million teu of capacity out of service at the end of 2019, is expected to continue all through the first half of 2020. It will gradually subside in the second half, as more ships complete their retrofit programs. The vessels’ return to service will eventually see some older and less efficient ships sold for scrap.
The relatively healthy containership charter rates, driven by the demand for substitute ships to replace ships immobilized for scrubber retrofits in the second half of 2019, helped keeping ships away from scrapyards. Alphaliner’s charter rate index ended the year at 80.4 points, compared to 55.9 points at the end of 2018, a 44% increase over 12 months.
GLOBAL CONTEXT
9998 99
CHARTER MARKET
Picture: SANTOS EXPRESS , 11,519 teu, delivered in 2017 by Hyundai Samho, owned and operated by Hapag Lloyd. Photo: Christian Costa. BRS GROUP - Annual review 2020 BRS GROUP - Annual review 2020 Picture: LEXA MÆRSK , 4,500 teu (1,100 reefers), delivered in 2001 by Odense shipyard. Photo: Christian Costa.
The scrubber retrofit wave took more than one million teu capacity out of service at the end of 2019.
It is expected to continue all through the first half of 2020.
Scrubber rate formulasNon-Operating Owners (NOOs) that have launched scrubber retrofit programs propose to charterers two alternatives to recoup the retrofit costs and the related operational costs.
One of them is to negotiate a fixed premium on top of the market charter rate. The other one is to share the fuel savings between the charterers and the owners, termed as “savings sharing mechanism “or “fuel profit sharing”. The owner proposes to capture 70% to 90% of the savings that the charterer obtains at a given bunkering port. The final sharing ratio is an element of the negotiation and a ceiling rate can be imposed by the charterer to cap owner’s benefit in case of an excessive VLSFO/HSFO spread.
While the fixed premium alternative is straight forward, the profit-sharing solution implies a close follow up of VLSFO and HSFO prices every time the ship takes bunkers. This latter alternative is considered cumbersome by certain charterers.
Will scrubber retrofits take off for small ships?Only a small share of the existing ships under 4,000 teu have been retrofitted with scrubbers so far, with many of them carried out at the initiative of carriers. The traditional non-operating owners of charter market tonnage (NOOs) control a large share of the lower size fleet and they are in clear retreat on newbuilding investments.
NOOs could consider scrubber retrofits in order to improve the employment prospects of their ships. Many of these owners focus on ships of 1,000-4,000 teu. Retrofitting such ships at a cost of US $ 1-3 M each would reap benefits in our opinion. It would give owners a competitive edge without the need to invest in scrubber-fitted newbuildings.
This is especially true for the smaller size segments, struggling to find employment in a charter market that has been negatively affected by structural changes in the composition of the fleet and by a muted demand. As of January 2020, only 17 existing ships have been retrofitted worldwide in the 1,000-2,000 teu range. This leaves much more opportunities, should the financial difficulties faced by many owners be overcome.
Furthermore, scrubber makers provide compact scrubbers for 1,000-1,500 teu ships that are simpler and quicker to install than on large, powerful ships. Typical retrofit time takes 3-4 weeks, against 5-8 weeks (or more) for 4,000+ teu vessels. The scrubbing towers are much less intrusive in small ships than in large ships due to the ship configurations and the much lesser volumes of exhaust gases to wash.
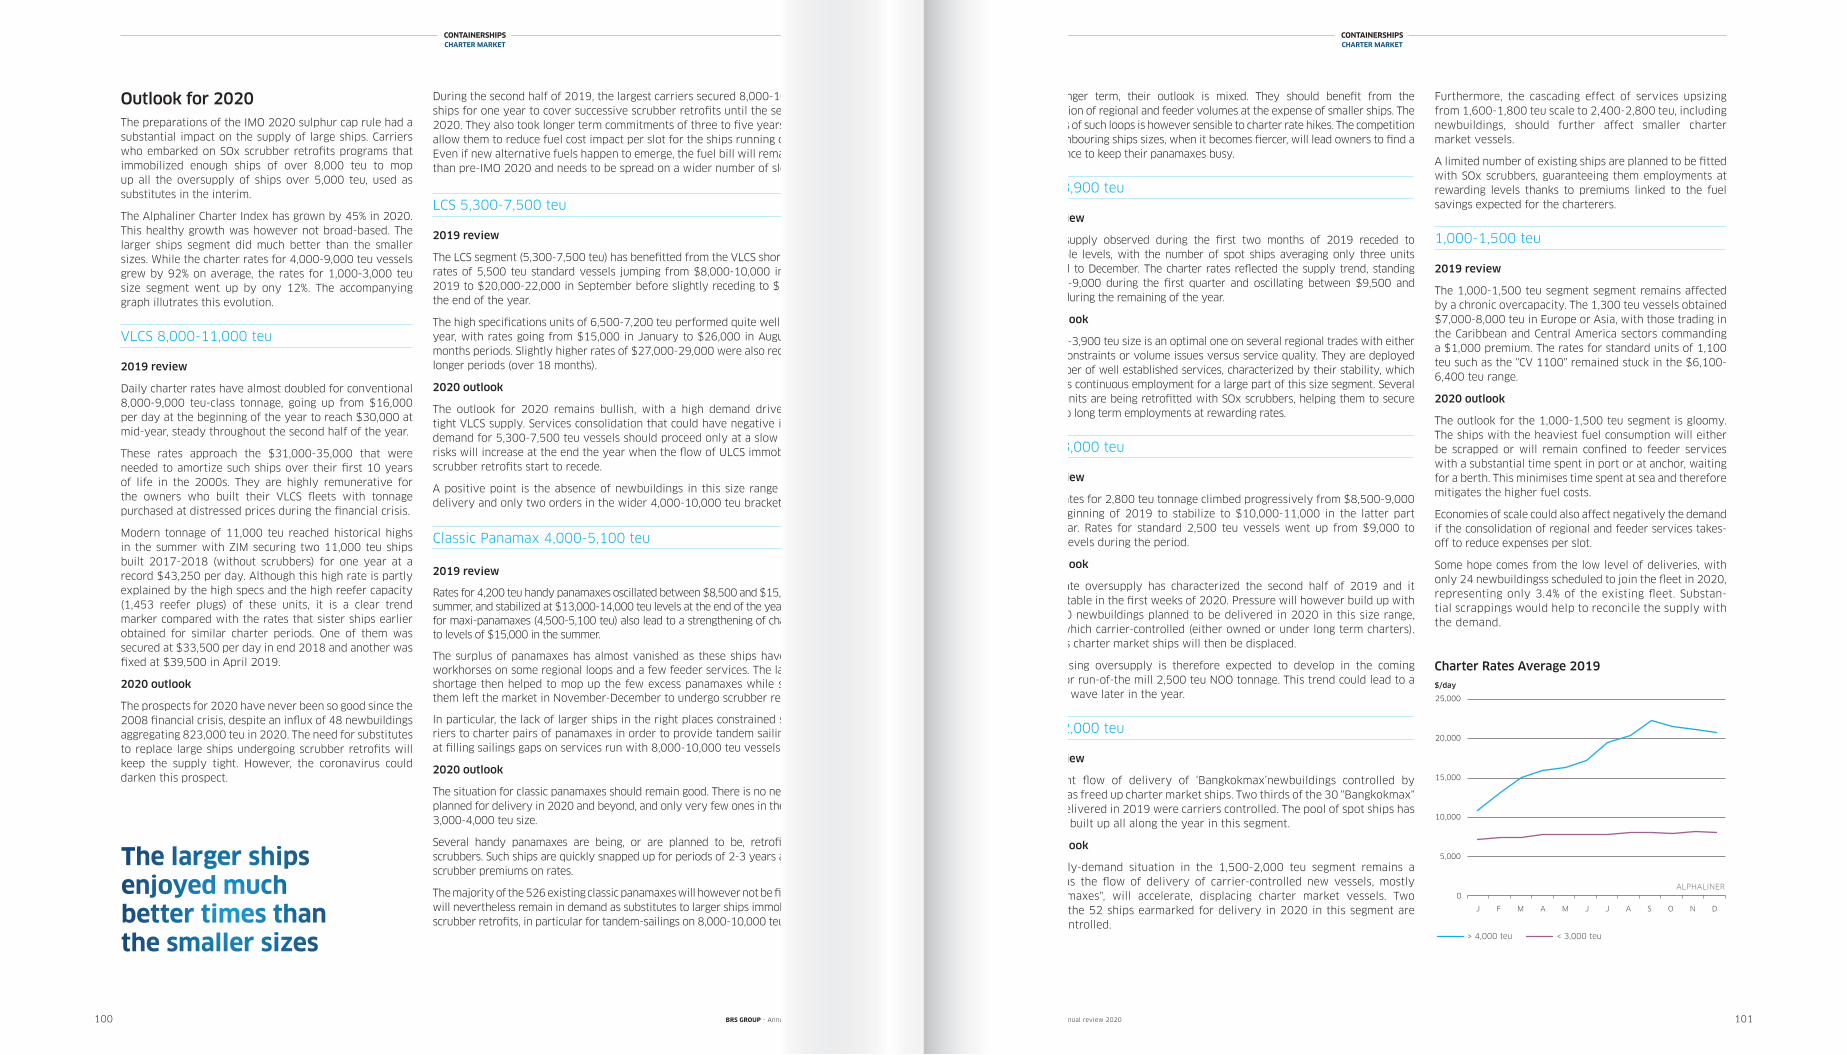
During the second half of 2019, the largest carriers secured 8,000-10,000 teu ships for one year to cover successive scrubber retrofits until the second half 2020. They also took longer term commitments of three to five years that will allow them to reduce fuel cost impact per slot for the ships running on VLSFO. Even if new alternative fuels happen to emerge, the fuel bill will remain higher than pre-IMO 2020 and needs to be spread on a wider number of slots.
LCS 5,300-7,500 teu
2019 review
The LCS segment (5,300-7,500 teu) has benefitted from the VLCS shortage, with rates of 5,500 teu standard vessels jumping from $8,000-10,000 in January 2019 to $20,000-22,000 in September before slightly receding to $19,000 at the end of the year.
The high specifications units of 6,500-7,200 teu performed quite well along the year, with rates going from $15,000 in January to $26,000 in August for 12 months periods. Slightly higher rates of $27,000-29,000 were also recorded for longer periods (over 18 months).
2020 outlook
The outlook for 2020 remains bullish, with a high demand driven by the tight VLCS supply. Services consolidation that could have negative impact on demand for 5,300-7,500 teu vessels should proceed only at a slow pace. The risks will increase at the end the year when the flow of ULCS immobilized for scrubber retrofits start to recede.
A positive point is the absence of newbuildings in this size range for 2020 delivery and only two orders in the wider 4,000-10,000 teu bracket.
Classic Panamax 4,000-5,100 teu
2019 review
Rates for 4,200 teu handy panamaxes oscillated between $8,500 and $15,000 in the summer, and stabilized at $13,000-14,000 teu levels at the end of the year. Demand for maxi-panamaxes (4,500-5,100 teu) also lead to a strengthening of charter rates to levels of $15,000 in the summer.
The surplus of panamaxes has almost vanished as these ships have become workhorses on some regional loops and a few feeder services. The large ships shortage then helped to mop up the few excess panamaxes while several of them left the market in November-December to undergo scrubber retrofits.
In particular, the lack of larger ships in the right places constrained some car-riers to charter pairs of panamaxes in order to provide tandem sailings aimed at filling sailings gaps on services run with 8,000-10,000 teu vessels.
2020 outlook
The situation for classic panamaxes should remain good. There is no newbuilding planned for delivery in 2020 and beyond, and only very few ones in the adjacent 3,000-4,000 teu size.
Several handy panamaxes are being, or are planned to be, retrofitted with scrubbers. Such ships are quickly snapped up for periods of 2-3 years at 15-20% scrubber premiums on rates.
The majority of the 526 existing classic panamaxes will however not be fitted. They will nevertheless remain in demand as substitutes to larger ships immobilized for scrubber retrofits, in particular for tandem-sailings on 8,000-10,000 teu services.
100 101
Outlook for 2020The preparations of the IMO 2020 sulphur cap rule had a substantial impact on the supply of large ships. Carriers who embarked on SOx scrubber retrofits programs that immobilized enough ships of over 8,000 teu to mop up all the oversupply of ships over 5,000 teu, used as substitutes in the interim.
The Alphaliner Charter Index has grown by 45% in 2020. This healthy growth was however not broad-based. The larger ships segment did much better than the smaller sizes. While the charter rates for 4,000-9,000 teu vessels grew by 92% on average, the rates for 1,000-3,000 teu size segment went up by ony 12%. The accompanying graph illutrates this evolution.
VLCS 8,000-11,000 teu
2019 review
Daily charter rates have almost doubled for conventional 8,000-9,000 teu-class tonnage, going up from $16,000 per day at the beginning of the year to reach $30,000 at mid-year, steady throughout the second half of the year.
These rates approach the $31,000-35,000 that were needed to amortize such ships over their first 10 years of life in the 2000s. They are highly remunerative for the owners who built their VLCS fleets with tonnage purchased at distressed prices during the financial crisis.
Modern tonnage of 11,000 teu reached historical highs in the summer with ZIM securing two 11,000 teu ships built 2017-2018 (without scrubbers) for one year at a record $43,250 per day. Although this high rate is partly explained by the high specs and the high reefer capacity (1,453 reefer plugs) of these units, it is a clear trend marker compared with the rates that sister ships earlier obtained for similar charter periods. One of them was secured at $33,500 per day in end 2018 and another was fixed at $39,500 in April 2019.
2020 outlook
The prospects for 2020 have never been so good since the 2008 financial crisis, despite an influx of 48 newbuildings aggregating 823,000 teu in 2020. The need for substitutes to replace large ships undergoing scrubber retrofits will keep the supply tight. However, the coronavirus could darken this prospect.
CONTAINERSHIPSCHARTER MARKET
BRS GROUP - Annual review 2020 BRS GROUP - Annual review 2020
In the longer term, their outlook is mixed. They should benefit from the consolidation of regional and feeder volumes at the expense of smaller ships. The economics of such loops is however sensible to charter rate hikes. The competition from neighbouring ships sizes, when it becomes fiercer, will lead owners to find a right balance to keep their panamaxes busy.
3,000-3,900 teu
2019 review
The oversupply observed during the first two months of 2019 receded to manageable levels, with the number of spot ships averaging only three units from April to December. The charter rates reflected the supply trend, standing at $8,000-9,000 during the first quarter and oscillating between $9,500 and $12,500 during the remaining of the year.
2020 outlook
The 3,000-3,900 teu size is an optimal one on several regional trades with either physical constraints or volume issues versus service quality. They are deployed on a number of well established services, characterized by their stability, which guarantees continuous employment for a large part of this size segment. Several of these units are being retrofitted with SOx scrubbers, helping them to secure medium to long term employments at rewarding rates.
2,000-3,000 teu
2019 review
Charter rates for 2,800 teu tonnage climbed progressively from $8,500-9,000 at the beginning of 2019 to stabilize to $10,000-11,000 in the latter part of the year. Rates for standard 2,500 teu vessels went up from $9,000 to $10,000 levels during the period.
2020 outlook
A moderate oversupply has characterized the second half of 2019 and it remains stable in the first weeks of 2020. Pressure will however build up with around 60 newbuildings planned to be delivered in 2020 in this size range, most of which carrier-controlled (either owned or under long term charters). Numerous charter market ships will then be displaced.
An increasing oversupply is therefore expected to develop in the coming months for run-of-the mill 2,500 teu NOO tonnage. This trend could lead to a scrapping wave later in the year.
1,500-2,000 teu
2019 review
A constant flow of delivery of ‘Bangkokmax’newbuildings controlled by carriers has freed up charter market ships. Two thirds of the 30 "Bangkokmax" vessels delivered in 2019 were carriers controlled. The pool of spot ships has therefore built up all along the year in this segment.
2020 outlook
The supply-demand situation in the 1,500-2,000 teu segment remains a concern as the flow of delivery of carrier-controlled new vessels, mostly "Bangkokmaxes", will accelerate, displacing charter market vessels. Two thirds of the 52 ships earmarked for delivery in 2020 in this segment are carrier-controlled.
Furthermore, the cascading effect of services upsizing from 1,600-1,800 teu scale to 2,400-2,800 teu, including newbuildings, should further affect smaller charter market vessels.
A limited number of existing ships are planned to be fitted with SOx scrubbers, guaranteeing them employments at rewarding levels thanks to premiums linked to the fuel savings expected for the charterers.
1,000-1,500 teu
2019 review
The 1,000-1,500 teu segment segment remains affected by a chronic overcapacity. The 1,300 teu vessels obtained $7,000-8,000 teu in Europe or Asia, with those trading in the Caribbean and Central America sectors commanding a $1,000 premium. The rates for standard units of 1,100 teu such as the "CV 1100" remained stuck in the $6,100-6,400 teu range.
2020 outlook
The outlook for the 1,000-1,500 teu segment is gloomy. The ships with the heaviest fuel consumption will either be scrapped or will remain confined to feeder services with a substantial time spent in port or at anchor, waiting for a berth. This minimises time spent at sea and therefore mitigates the higher fuel costs.
Economies of scale could also affect negatively the demand if the consolidation of regional and feeder services takes-off to reduce expenses per slot.
Some hope comes from the low level of deliveries, with only 24 newbuildingss scheduled to join the fleet in 2020, representing only 3.4% of the existing fleet. Substan-tial scrappings would help to reconcile the supply with the demand.
Charter Rates Average 2019$/day
0
5,000
10,000
15,000
20,000
25,000
$/day
Charter Rates 2019
0
10
20
30
40
50
60
70
80
million $
Containership Second Hand Prices
1,700 teu 10 years2,750 teu 5 years
4,500 teu 5 years9,000 teu 5 years
2012 2013 2014 2015 2016 2017 2018
jan2019
dec
>4,000 teu <3,000 teu
ALPHALINER
> 4,000 teu < 3,000 teu
The larger ships enjoyed much better times than the smaller sizes
CONTAINERSHIPSCHARTER MARKET
J F M A M J J A S O N D
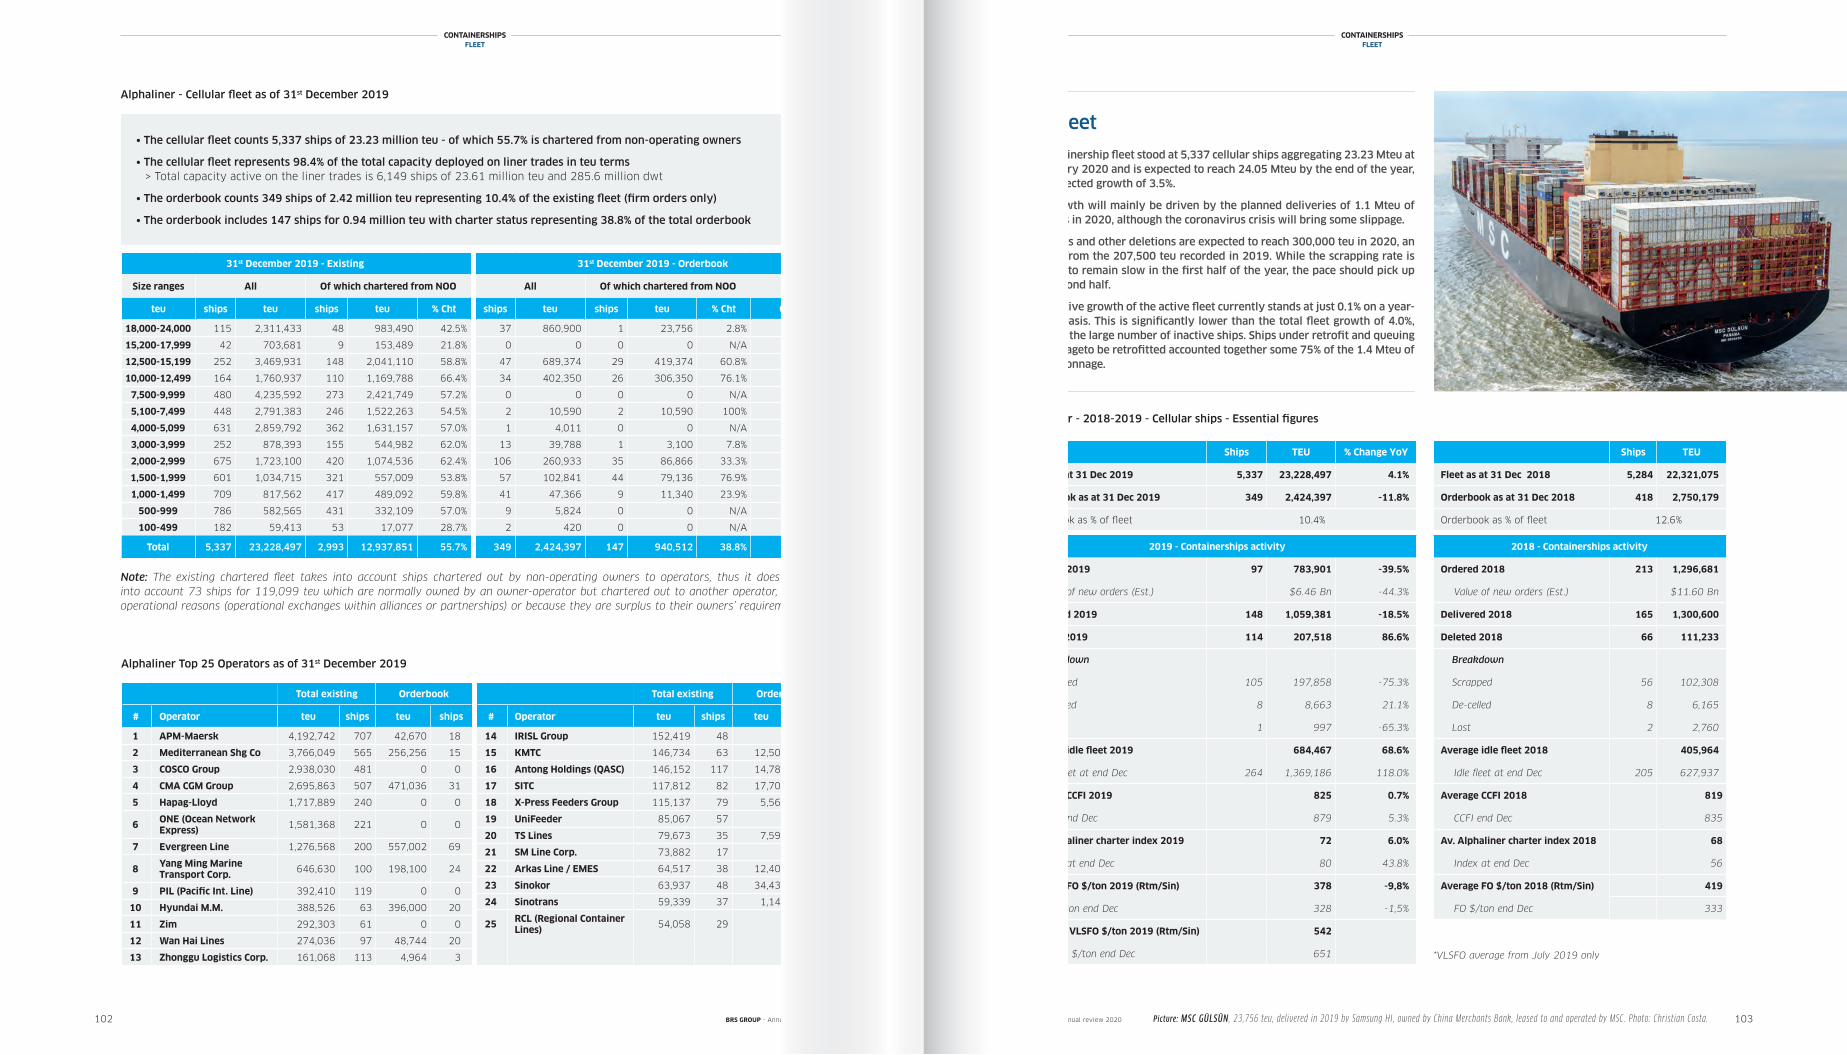
102 103
CONTAINERSHIPSFLEET
Alphaliner - Cellular fleet as of 31st December 2019
Total existing Orderbook
# Operator teu ships teu ships
1 APM-Maersk 4,192,742 707 42,670 18
2 Mediterranean Shg Co 3,766,049 565 256,256 15
3 COSCO Group 2,938,030 481 0 0
4 CMA CGM Group 2,695,863 507 471,036 31
5 Hapag-Lloyd 1,717,889 240 0 0
6ONE (Ocean Network Express)
1,581,368 221 0 0
7 Evergreen Line 1,276,568 200 557,002 69
8Yang Ming Marine Transport Corp.
646,630 100 198,100 24
9 PIL (Pacific Int. Line) 392,410 119 0 0
10 Hyundai M.M. 388,526 63 396,000 20
11 Zim 292,303 61 0 0
12 Wan Hai Lines 274,036 97 48,744 20
13 Zhonggu Logistics Corp. 161,068 113 4,964 3
Total existing Orderbook
# Operator teu ships teu ships
14 IRISL Group 152,419 48 0 0
15 KMTC 146,734 63 12,500 5
16 Antong Holdings (QASC) 146,152 117 14,780 9
17 SITC 117,812 82 17,700 7
18 X-Press Feeders Group 115,137 79 5,564 2
19 UniFeeder 85,067 57 0 0
20 TS Lines 79,673 35 7,592 4
21 SM Line Corp. 73,882 17 0 0
22 Arkas Line / EMES 64,517 38 12,400 4
23 Sinokor 63,937 48 34,436 24
24 Sinotrans 59,339 37 1,140 1
25RCL (Regional Container Lines)
54,058 29 0 0
Alphaliner Top 25 Operators as of 31st December 2019
31st December 2019 - Existing
Size ranges All Of which chartered from NOO
teu ships teu ships teu % Cht
18,000-24,000 115 2,311,433 48 983,490 42.5%
15,200-17,999 42 703,681 9 153,489 21.8%
12,500-15,199 252 3,469,931 148 2,041,110 58.8%
10,000-12,499 164 1,760,937 110 1,169,788 66.4%
7,500-9,999 480 4,235,592 273 2,421,749 57.2%
5,100-7,499 448 2,791,383 246 1,522,263 54.5%
4,000-5,099 631 2,859,792 362 1,631,157 57.0%
3,000-3,999 252 878,393 155 544,982 62.0%
2,000-2,999 675 1,723,100 420 1,074,536 62.4%
1,500-1,999 601 1,034,715 321 557,009 53.8%
1,000-1,499 709 817,562 417 489,092 59.8%
500-999 786 582,565 431 332,109 57.0%
100-499 182 59,413 53 17,077 28.7%
Total 5,337 23,228,497 2,993 12,937,851 55.7%
31st December 2019 - Orderbook
All Of which chartered from NOO
ships teu ships teu % Cht O / E
37 860,900 1 23,756 2.8% 37.2%
0 0 0 0 N/A 0%
47 689,374 29 419,374 60.8% 19.9%
34 402,350 26 306,350 76.1% 22.8%
0 0 0 0 N/A 0%
2 10,590 2 10,590 100% 0.4%
1 4,011 0 0 N/A 0.1%
13 39,788 1 3,100 7.8% 4.5%
106 260,933 35 86,866 33.3% 15.1%
57 102,841 44 79,136 76.9% 9.9%
41 47,366 9 11,340 23.9% 5.8%
9 5,824 0 0 N/A 1.0%
2 420 0 0 N/A 0.7%
349 2,424,397 147 940,512 38.8% 10.4%
• The cellular fleet counts 5,337 ships of 23.23 million teu - of which 55.7% is chartered from non-operating owners
• The cellular fleet represents 98.4% of the total capacity deployed on liner trades in teu terms > Total capacity active on the liner trades is 6,149 ships of 23.61 million teu and 285.6 million dwt
• The orderbook counts 349 ships of 2.42 million teu representing 10.4% of the existing fleet (firm orders only)
• The orderbook includes 147 ships for 0.94 million teu with charter status representing 38.8% of the total orderbook
Note: The existing chartered fleet takes into account ships chartered out by non-operating owners to operators, thus it does not take into account 73 ships for 119,099 teu which are normally owned by an owner-operator but chartered out to another operator, either for operational reasons (operational exchanges within alliances or partnerships) or because they are surplus to their owners’ requirements.
BRS GROUP - Annual review 2020 BRS GROUP - Annual review 2020
CONTAINERSHIPSFLEET
Ships TEU % Change YoY
Fleet as at 31 Dec 2019 5,337 23,228,497 4.1%
Orderbook as at 31 Dec 2019 349 2,424,397 -11.8%
Orderbook as % of fleet 10.4%
2019 - Containerships activity
Ordered 2019 97 783,901 -39.5%
Value of new orders (Est.) $6.46 Bn -44.3%
Delivered 2019 148 1,059,381 -18.5%
Deleted 2019 114 207,518 86.6%
Breakdown
Scrapped 105 197,858 -75.3%
De-celled 8 8,663 21.1%
Lost 1 997 -65.3%
Average idle fleet 2019 684,467 68.6%
Idle fleet at end Dec 264 1,369,186 118.0%
Average CCFI 2019 825 0.7%
CCFI end Dec 879 5.3%
Av. Alphaliner charter index 2019 72 6.0%
Index at end Dec 80 43.8%
Average FO $/ton 2019 (Rtm/Sin) 378 -9,8%
FO $/ton end Dec 328 -1,5%
*Average VLSFO $/ton 2019 (Rtm/Sin) 542
VLSFO $/ton end Dec 651
Ships TEU
Fleet as at 31 Dec 2018 5,284 22,321,075
Orderbook as at 31 Dec 2018 418 2,750,179
Orderbook as % of fleet 12.6%
2018 - Containerships activity
Ordered 2018 213 1,296,681
Value of new orders (Est.) $11.60 Bn
Delivered 2018 165 1,300,600
Deleted 2018 66 111,233
Breakdown
Scrapped 56 102,308
De-celled 8 6,165
Lost 2 2,760
Average idle fleet 2018 405,964
Idle fleet at end Dec 205 627,937
Average CCFI 2018 819
CCFI end Dec 835
Av. Alphaliner charter index 2018 68
Index at end Dec 56
Average FO $/ton 2018 (Rtm/Sin) 419
FO $/ton end Dec 333
The fleet
The containership fleet stood at 5,337 cellular ships aggregating 23.23 Mteu at 1st January 2020 and is expected to reach 24.05 Mteu by the end of the year, for a projected growth of 3.5%.
Fleet growth will mainly be driven by the planned deliveries of 1.1 Mteu of new ships in 2020, although the coronavirus crisis will bring some slippage.
Scrappings and other deletions are expected to reach 300,000 teu in 2020, an increase from the 207,500 teu recorded in 2019. While the scrapping rate is expected to remain slow in the first half of the year, the pace should pick up in the second half.
The effective growth of the active fleet currently stands at just 0.1% on a year-on-year basis. This is significantly lower than the total fleet growth of 4.0%, reflecting the large number of inactive ships. Ships under retrofit and queuing at anchorageto be retrofitted accounted together some 75% of the 1.4 Mteu of inactive tonnage.
Alphaliner - 2018-2019 - Cellular ships - Essential figures
*VLSFO average from July 2019 only
Picture: MSC GÜLSÜN , 23,756 teu, delivered in 2019 by Samsung HI, owned by China Merchants Bank, leased to and operated by MSC. Photo: Christian Costa.
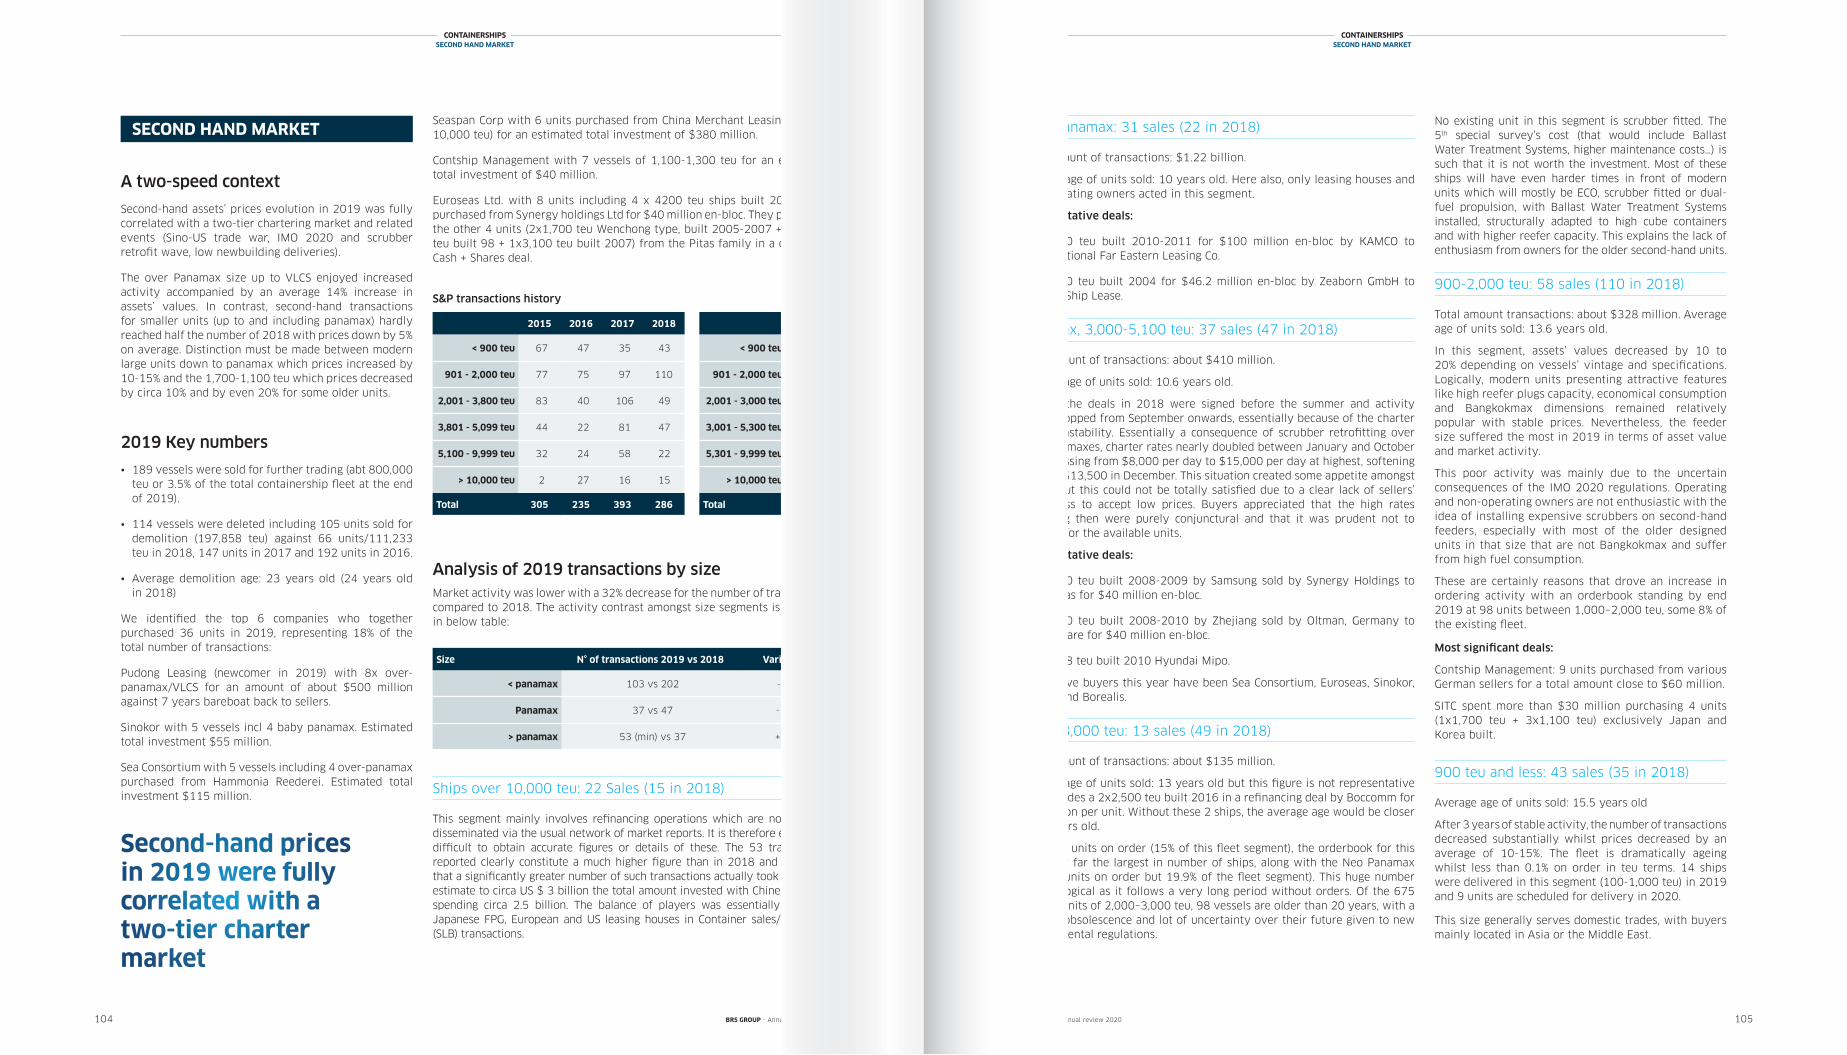
Over-Panamax: 31 sales (22 in 2018)
Total amount of transactions: $1.22 billion.
Average age of units sold: 10 years old. Here also, only leasing houses and non-operating owners acted in this segment.
Representative deals:
• 3x8,500 teu built 2010-2011 for $100 million en-bloc by KAMCO to International Far Eastern Leasing Co.
• 3x7,800 teu built 2004 for $46.2 million en-bloc by Zeaborn GmbH to Global Ship Lease.
Panamax, 3,000-5,100 teu: 37 sales (47 in 2018)
Total amount of transactions: about $410 million.
Average age of units sold: 10.6 years old.
Most of the deals in 2018 were signed before the summer and activity nearly stopped from September onwards, essentially because of the charter market instability. Essentially a consequence of scrubber retrofitting over neo-panamaxes, charter rates nearly doubled between January and October 2019, passing from $8,000 per day to $15,000 per day at highest, softening down to $13,500 in December. This situation created some appetite amongst buyers but this could not be totally satisfied due to a clear lack of sellers’ willingness to accept low prices. Buyers appreciated that the high rates prevailing then were purely conjunctural and that it was prudent not to overpay for the available units.
Representative deals:
• 4x4,250 teu built 2008-2009 by Samsung sold by Synergy Holdings to Euroseas for $40 million en-bloc.
• 4x4,250 teu built 2008-2010 by Zhejiang sold by Oltman, Germany to Costamare for $40 million en-bloc.
• 2x4,228 teu built 2010 Hyundai Mipo.
Most active buyers this year have been Sea Consortium, Euroseas, Sinokor, Celsius, and Borealis.
2,000-3,000 teu: 13 sales (49 in 2018)
Total amount of transactions: about $135 million.
Average age of units sold: 13 years old but this figure is not representative as it includes a 2x2,500 teu built 2016 in a refinancing deal by Boccomm for $27 million per unit. Without these 2 ships, the average age would be closer to 16 years old.
With 106 units on order (15% of this fleet segment), the orderbook for this size is by far the largest in number of ships, along with the Neo Panamax size (47 units on order but 19.9% of the fleet segment). This huge number is quite logical as it follows a very long period without orders. Of the 675 existing units of 2,000–3,000 teu, 98 vessels are older than 20 years, with a growing obsolescence and lot of uncertainty over their future given to new environmental regulations.
Analysis of 2019 transactions by sizeMarket activity was lower with a 32% decrease for the number of transactions compared to 2018. The activity contrast amongst size segments is reflected in below table:
Ships over 10,000 teu: 22 Sales (15 in 2018)
This segment mainly involves refinancing operations which are not entirely disseminated via the usual network of market reports. It is therefore extremely difficult to obtain accurate figures or details of these. The 53 transactions reported clearly constitute a much higher figure than in 2018 and we know that a significantly greater number of such transactions actually took place. We estimate to circa US $ 3 billion the total amount invested with Chinese lessors spending circa 2.5 billion. The balance of players was essentially Seaspan, Japanese FPG, European and US leasing houses in Container sales/leaseback (SLB) transactions.
No existing unit in this segment is scrubber fitted. The 5th special survey’s cost (that would include Ballast Water Treatment Systems, higher maintenance costs…) is such that it is not worth the investment. Most of these ships will have even harder times in front of modern units which will mostly be ECO, scrubber fitted or dual-fuel propulsion, with Ballast Water Treatment Systems installed, structurally adapted to high cube containers and with higher reefer capacity. This explains the lack of enthusiasm from owners for the older second-hand units.
900-2,000 teu: 58 sales (110 in 2018)
Total amount transactions: about $328 million. Average age of units sold: 13.6 years old.
In this segment, assets’ values decreased by 10 to 20% depending on vessels’ vintage and specifications. Logically, modern units presenting attractive features like high reefer plugs capacity, economical consumption and Bangkokmax dimensions remained relatively popular with stable prices. Nevertheless, the feeder size suffered the most in 2019 in terms of asset value and market activity.
This poor activity was mainly due to the uncertain consequences of the IMO 2020 regulations. Operating and non-operating owners are not enthusiastic with the idea of installing expensive scrubbers on second-hand feeders, especially with most of the older designed units in that size that are not Bangkokmax and suffer from high fuel consumption.
These are certainly reasons that drove an increase in ordering activity with an orderbook standing by end 2019 at 98 units between 1,000–2,000 teu, some 8% of the existing fleet.
Most significant deals:
Contship Management: 9 units purchased from various German sellers for a total amount close to $60 million.
SITC spent more than $30 million purchasing 4 units (1x1,700 teu + 3x1,100 teu) exclusively Japan and Korea built.
900 teu and less: 43 sales (35 in 2018)
Average age of units sold: 15.5 years old
After 3 years of stable activity, the number of transactions decreased substantially whilst prices decreased by an average of 10-15%. The fleet is dramatically ageing whilst less than 0.1% on order in teu terms. 14 ships were delivered in this segment (100-1,000 teu) in 2019 and 9 units are scheduled for delivery in 2020.
This size generally serves domestic trades, with buyers mainly located in Asia or the Middle East.
Seaspan Corp with 6 units purchased from China Merchant Leasing (9,000-10,000 teu) for an estimated total investment of $380 million.
Contship Management with 7 vessels of 1,100-1,300 teu for an estimated total investment of $40 million.
Euroseas Ltd. with 8 units including 4 x 4200 teu ships built 2008-2009 purchased from Synergy holdings Ltd for $40 million en-bloc. They purchased the other 4 units (2x1,700 teu Wenchong type, built 2005-2007 + 1x2,000 teu built 98 + 1x3,100 teu built 2007) from the Pitas family in a combined Cash + Shares deal.
104 105
CONTAINERSHIPSSECOND HAND MARKET
Second-hand prices in 2019 were fully correlated with a two-tier charter market
S&P transactions history
2015 2016 2017 2018
< 900 teu 67 47 35 43
901 - 2,000 teu 77 75 97 110
2,001 - 3,800 teu 83 40 106 49
3,801 - 5,099 teu 44 22 81 47
5,100 - 9,999 teu 32 24 58 22
> 10,000 teu 2 27 16 15
Total 305 235 393 286
CONTAINERSHIPSSECOND HAND MARKET
BRS GROUP - Annual review 2020 BRS GROUP - Annual review 2020
SECOND HAND MARKET
A two-speed context
Second-hand assets’ prices evolution in 2019 was fully correlated with a two-tier chartering market and related events (Sino-US trade war, IMO 2020 and scrubber retrofit wave, low newbuilding deliveries).
The over Panamax size up to VLCS enjoyed increased activity accompanied by an average 14% increase in assets’ values. In contrast, second-hand transactions for smaller units (up to and including panamax) hardly reached half the number of 2018 with prices down by 5% on average. Distinction must be made between modern large units down to panamax which prices increased by 10-15% and the 1,700-1,100 teu which prices decreased by circa 10% and by even 20% for some older units.
2019 Key numbers
• 189 vessels were sold for further trading (abt 800,000 teu or 3.5% of the total containership fleet at the end of 2019).
• 114 vessels were deleted including 105 units sold for demolition (197,858 teu) against 66 units/111,233 teu in 2018, 147 units in 2017 and 192 units in 2016.
• Average demolition age: 23 years old (24 years old in 2018)
We identified the top 6 companies who together purchased 36 units in 2019, representing 18% of the total number of transactions:
Pudong Leasing (newcomer in 2019) with 8x over-panamax/VLCS for an amount of about $500 million against 7 years bareboat back to sellers.
Sinokor with 5 vessels incl 4 baby panamax. Estimated total investment $55 million.
Sea Consortium with 5 vessels including 4 over-panamax purchased from Hammonia Reederei. Estimated total investment $115 million.
2019
< 900 teu 27
901 - 2,000 teu 58
2,001 - 3,000 teu 13
3,001 - 5,300 teu 37
5,301 - 9,999 teu 31
> 10,000 teu 22
Total 189
Size N° of transactions 2019 vs 2018 Variation
< panamax 103 vs 202 -50%
Panamax 37 vs 47 -22%
> panamax 53 (min) vs 37 +40%
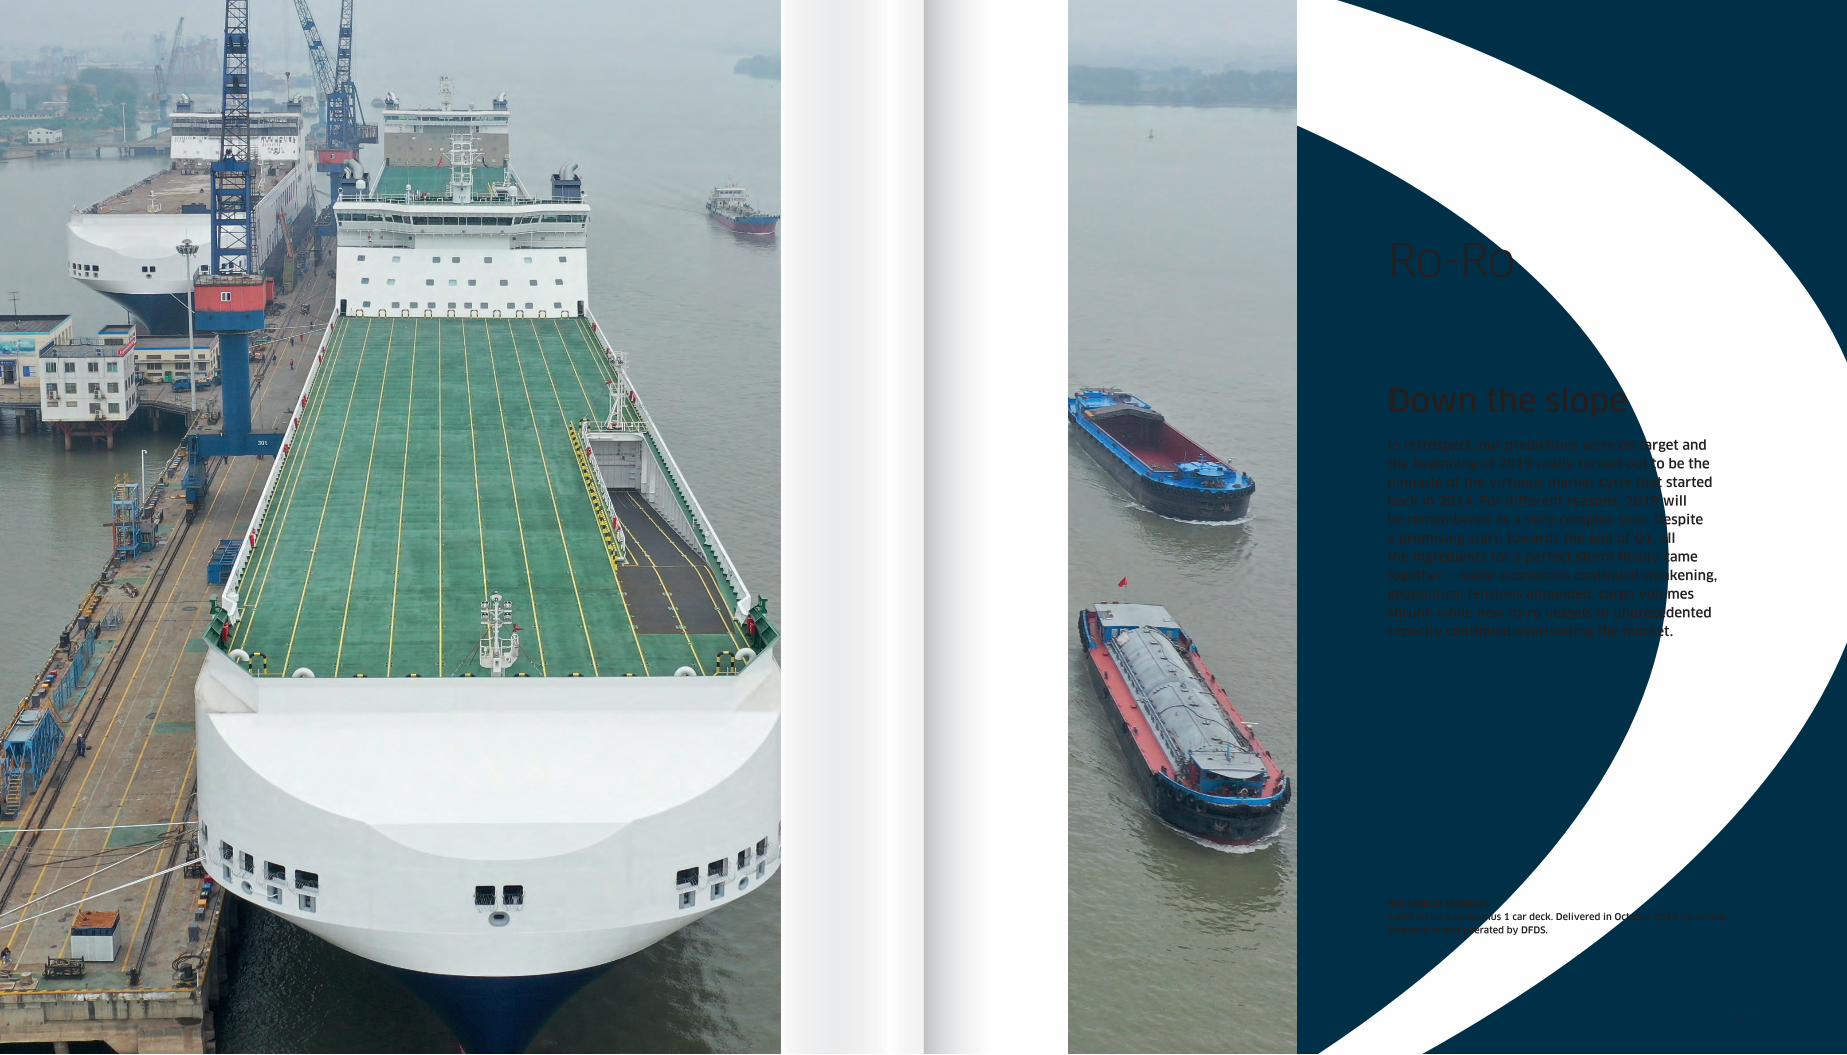
Ro-Ro
Down the slopeIn retrospect, our predictions were on target and the beginning of 2019 really turned out to be the pinnacle of the virtuous market cycle that started back in 2014. For different reasons, 2019 will be remembered as a very complex year. Despite a promising start, towards the end of Q1, all the ingredients for a perfect storm finally came together – major economies continued weakening, geopolitical tensions abounded, cargo volumes shrunk while new ro-ro vessels of unprecedented capacity continued overloading the market.
107
HOLLANDIA SEAWAYS6,690 lm on 5 decks plus 1 car deck. Delivered in October 2019 by Jinling Shipyard to and operated by DFDS.
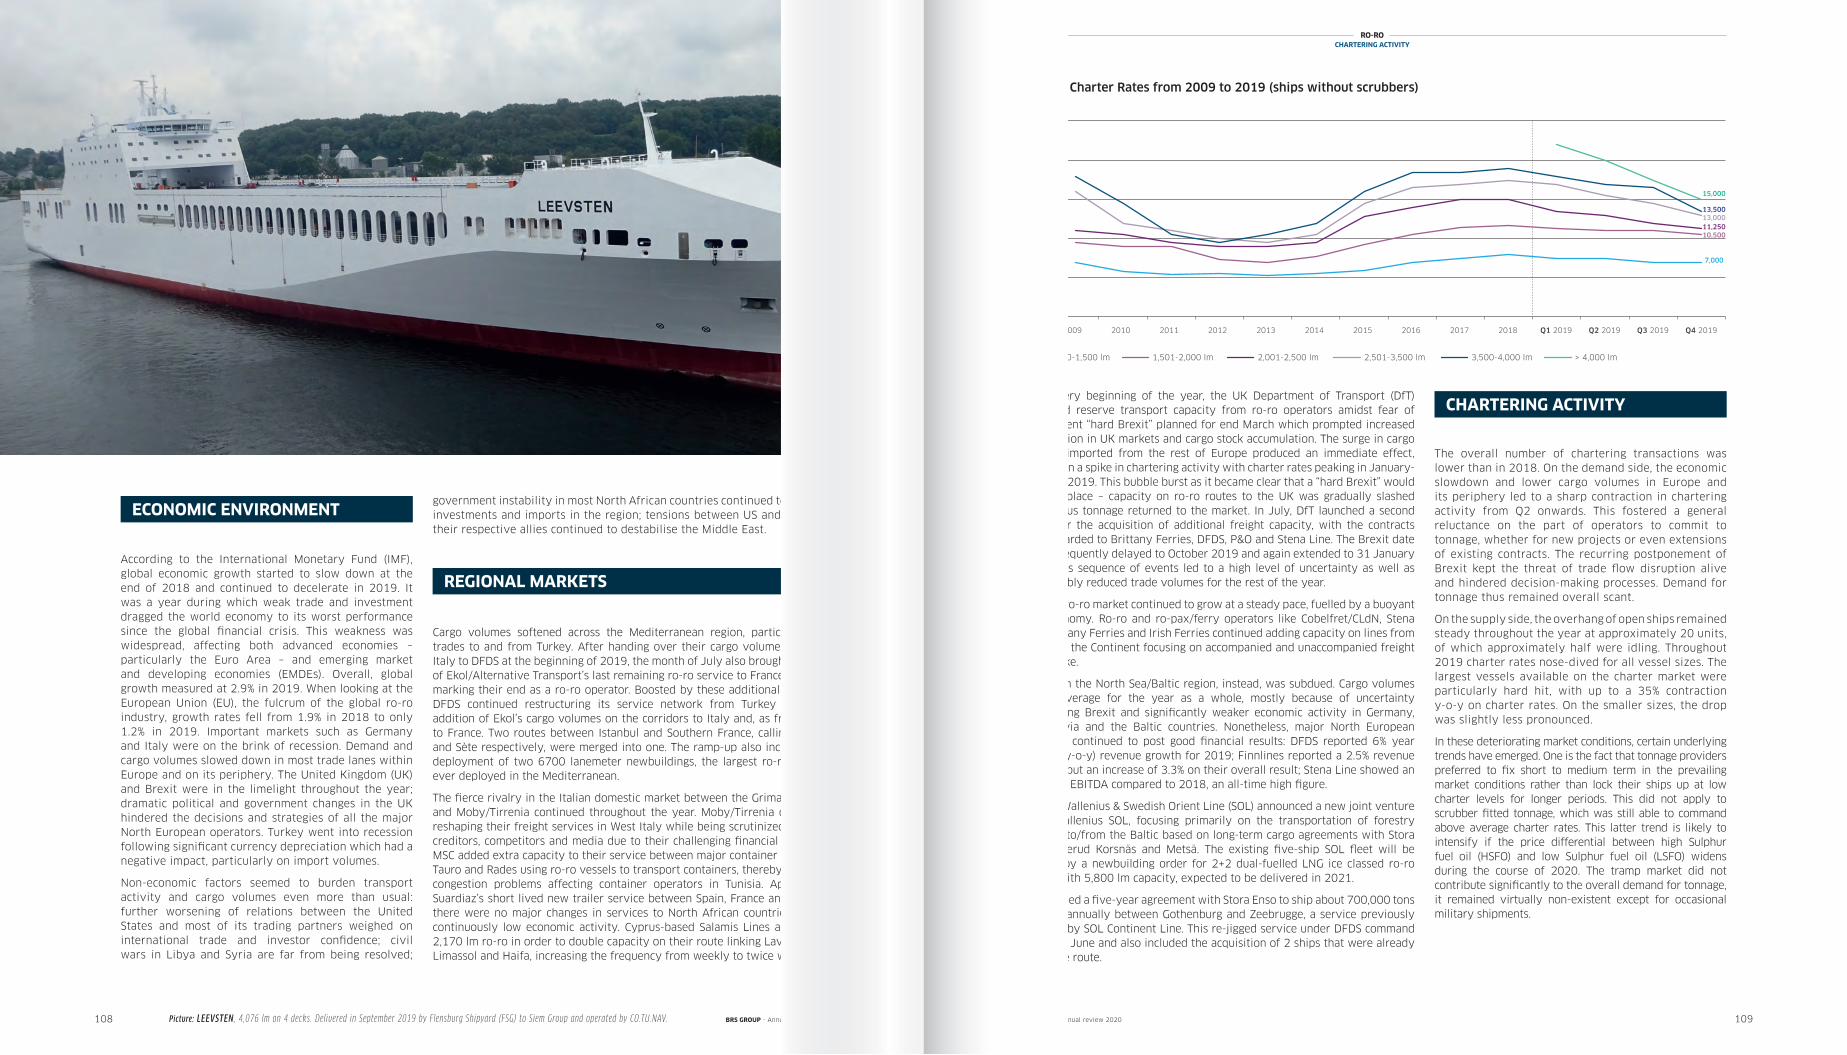
108 109
RO-ROCHARTERING ACTIVITY
government instability in most North African countries continued to hamper investments and imports in the region; tensions between US and Iran and their respective allies continued to destabilise the Middle East.
Cargo volumes softened across the Mediterranean region, particularly on trades to and from Turkey. After handing over their cargo volumes to/from Italy to DFDS at the beginning of 2019, the month of July also brought the end of Ekol/Alternative Transport’s last remaining ro-ro service to France, thereby marking their end as a ro-ro operator. Boosted by these additional volumes, DFDS continued restructuring its service network from Turkey with the addition of Ekol’s cargo volumes on the corridors to Italy and, as from June, to France. Two routes between Istanbul and Southern France, calling Toulon and Sète respectively, were merged into one. The ramp-up also included the deployment of two 6700 lanemeter newbuildings, the largest ro-ro vessels ever deployed in the Mediterranean.
The fierce rivalry in the Italian domestic market between the Grimaldi Group and Moby/Tirrenia continued throughout the year. Moby/Tirrenia continued reshaping their freight services in West Italy while being scrutinized by their creditors, competitors and media due to their challenging financial situation. MSC added extra capacity to their service between major container hub Gioia Tauro and Rades using ro-ro vessels to transport containers, thereby avoiding congestion problems affecting container operators in Tunisia. Apart from Suardiaz’s short lived new trailer service between Spain, France and Algeria, there were no major changes in services to North African countries due to continuously low economic activity. Cyprus-based Salamis Lines acquired a 2,170 lm ro-ro in order to double capacity on their route linking Lavrion with Limassol and Haifa, increasing the frequency from weekly to twice weekly.
REGIONAL MARKETS
At the very beginning of the year, the UK Department of Transport (DfT) purchased reserve transport capacity from ro-ro operators amidst fear of an imminent “hard Brexit” planned for end March which prompted increased consumption in UK markets and cargo stock accumulation. The surge in cargo volumes imported from the rest of Europe produced an immediate effect, resulting in a spike in chartering activity with charter rates peaking in January-February 2019. This bubble burst as it became clear that a “hard Brexit” would not take place – capacity on ro-ro routes to the UK was gradually slashed and surplus tonnage returned to the market. In July, DfT launched a second tender for the acquisition of additional freight capacity, with the contracts being awarded to Brittany Ferries, DFDS, P&O and Stena Line. The Brexit date was consequently delayed to October 2019 and again extended to 31 January 2020. This sequence of events led to a high level of uncertainty as well as considerably reduced trade volumes for the rest of the year.
The Irish ro-ro market continued to grow at a steady pace, fuelled by a buoyant Irish economy. Ro-ro and ro-pax/ferry operators like Cobelfret/CLdN, Stena Line, Brittany Ferries and Irish Ferries continued adding capacity on lines from Ireland to the Continent focusing on accompanied and unaccompanied freight traffic alike.
Activity in the North Sea/Baltic region, instead, was subdued. Cargo volumes fell on average for the year as a whole, mostly because of uncertainty surrounding Brexit and significantly weaker economic activity in Germany, Scandinavia and the Baltic countries. Nonetheless, major North European operators continued to post good financial results: DFDS reported 6% year on year (y-o-y) revenue growth for 2019; Finnlines reported a 2.5% revenue decrease but an increase of 3.3% on their overall result; Stena Line showed an improved EBITDA compared to 2018, an all-time high figure.
In April, Wallenius & Swedish Orient Line (SOL) announced a new joint venture called Wallenius SOL, focusing primarily on the transportation of forestry products to/from the Baltic based on long-term cargo agreements with Stora Enso, Billerud Korsnäs and Metsä. The existing five-ship SOL fleet will be boosted by a newbuilding order for 2+2 dual-fuelled LNG ice classed ro-ro vessels with 5,800 lm capacity, expected to be delivered in 2021.
DFDS signed a five-year agreement with Stora Enso to ship about 700,000 tons of paper annually between Gothenburg and Zeebrugge, a service previously operated by SOL Continent Line. This re-jigged service under DFDS command started in June and also included the acquisition of 2 ships that were already plying the route.
The overall number of chartering transactions was lower than in 2018. On the demand side, the economic slowdown and lower cargo volumes in Europe and its periphery led to a sharp contraction in chartering activity from Q2 onwards. This fostered a general reluctance on the part of operators to commit to tonnage, whether for new projects or even extensions of existing contracts. The recurring postponement of Brexit kept the threat of trade flow disruption alive and hindered decision-making processes. Demand for tonnage thus remained overall scant.
On the supply side, the overhang of open ships remained steady throughout the year at approximately 20 units, of which approximately half were idling. Throughout 2019 charter rates nose-dived for all vessel sizes. The largest vessels available on the charter market were particularly hard hit, with up to a 35% contraction y-o-y on charter rates. On the smaller sizes, the drop was slightly less pronounced.
In these deteriorating market conditions, certain underlying trends have emerged. One is the fact that tonnage providers preferred to fix short to medium term in the prevailing market conditions rather than lock their ships up at low charter levels for longer periods. This did not apply to scrubber fitted tonnage, which was still able to command above average charter rates. This latter trend is likely to intensify if the price differential between high Sulphur fuel oil (HSFO) and low Sulphur fuel oil (LSFO) widens during the course of 2020. The tramp market did not contribute significantly to the overall demand for tonnage, it remained virtually non-existent except for occasional military shipments.
Picture: LEEVSTEN , 4,076 lm on 4 decks. Delivered in September 2019 by Flensburg Shipyard (FSG) to Siem Group and operated by CO.TU.NAV.
According to the International Monetary Fund (IMF), global economic growth started to slow down at the end of 2018 and continued to decelerate in 2019. It was a year during which weak trade and investment dragged the world economy to its worst performance since the global financial crisis. This weakness was widespread, affecting both advanced economies – particularly the Euro Area – and emerging market and developing economies (EMDEs). Overall, global growth measured at 2.9% in 2019. When looking at the European Union (EU), the fulcrum of the global ro-ro industry, growth rates fell from 1.9% in 2018 to only 1.2% in 2019. Important markets such as Germany and Italy were on the brink of recession. Demand and cargo volumes slowed down in most trade lanes within Europe and on its periphery. The United Kingdom (UK) and Brexit were in the limelight throughout the year; dramatic political and government changes in the UK hindered the decisions and strategies of all the major North European operators. Turkey went into recession following significant currency depreciation which had a negative impact, particularly on import volumes.
Non-economic factors seemed to burden transport activity and cargo volumes even more than usual: further worsening of relations between the United States and most of its trading partners weighed on international trade and investor confidence; civil wars in Libya and Syria are far from being resolved;
ECONOMIC ENVIRONMENT
BRS GROUP - Annual review 2020 BRS GROUP - Annual review 2020
CHARTERING ACTIVITY
Average Charter Rates from 2009 to 2019 (ships without scrubbers)$/day
1000-1500 lm 1501-2000 lm 2001-2500 lm 2501-3500 lm 3500-4000 lm > 4000 lm
0
5,000
10,000
15,000
20,000
25,000
$/day
Average Charter Rates from 2009 to 2019
2009 2010 2011 2012 2013 2014 2015 2016 2017 2018 Q1 2019 Q2 2019 Q3 2019 Q4 20192009 2010 2011 2012 2013 2014 2015 2016 2017 2018
1,501-2,000 lm 2,001-2,500 lm > 4,000 lm2,501-3,500 lm 3,500-4,000 lm
Q1 2019 Q2 2019 Q3 2019 Q4 2019
1,000-1,500 lm
15,000
13,50013,00011,25010,500
7,000
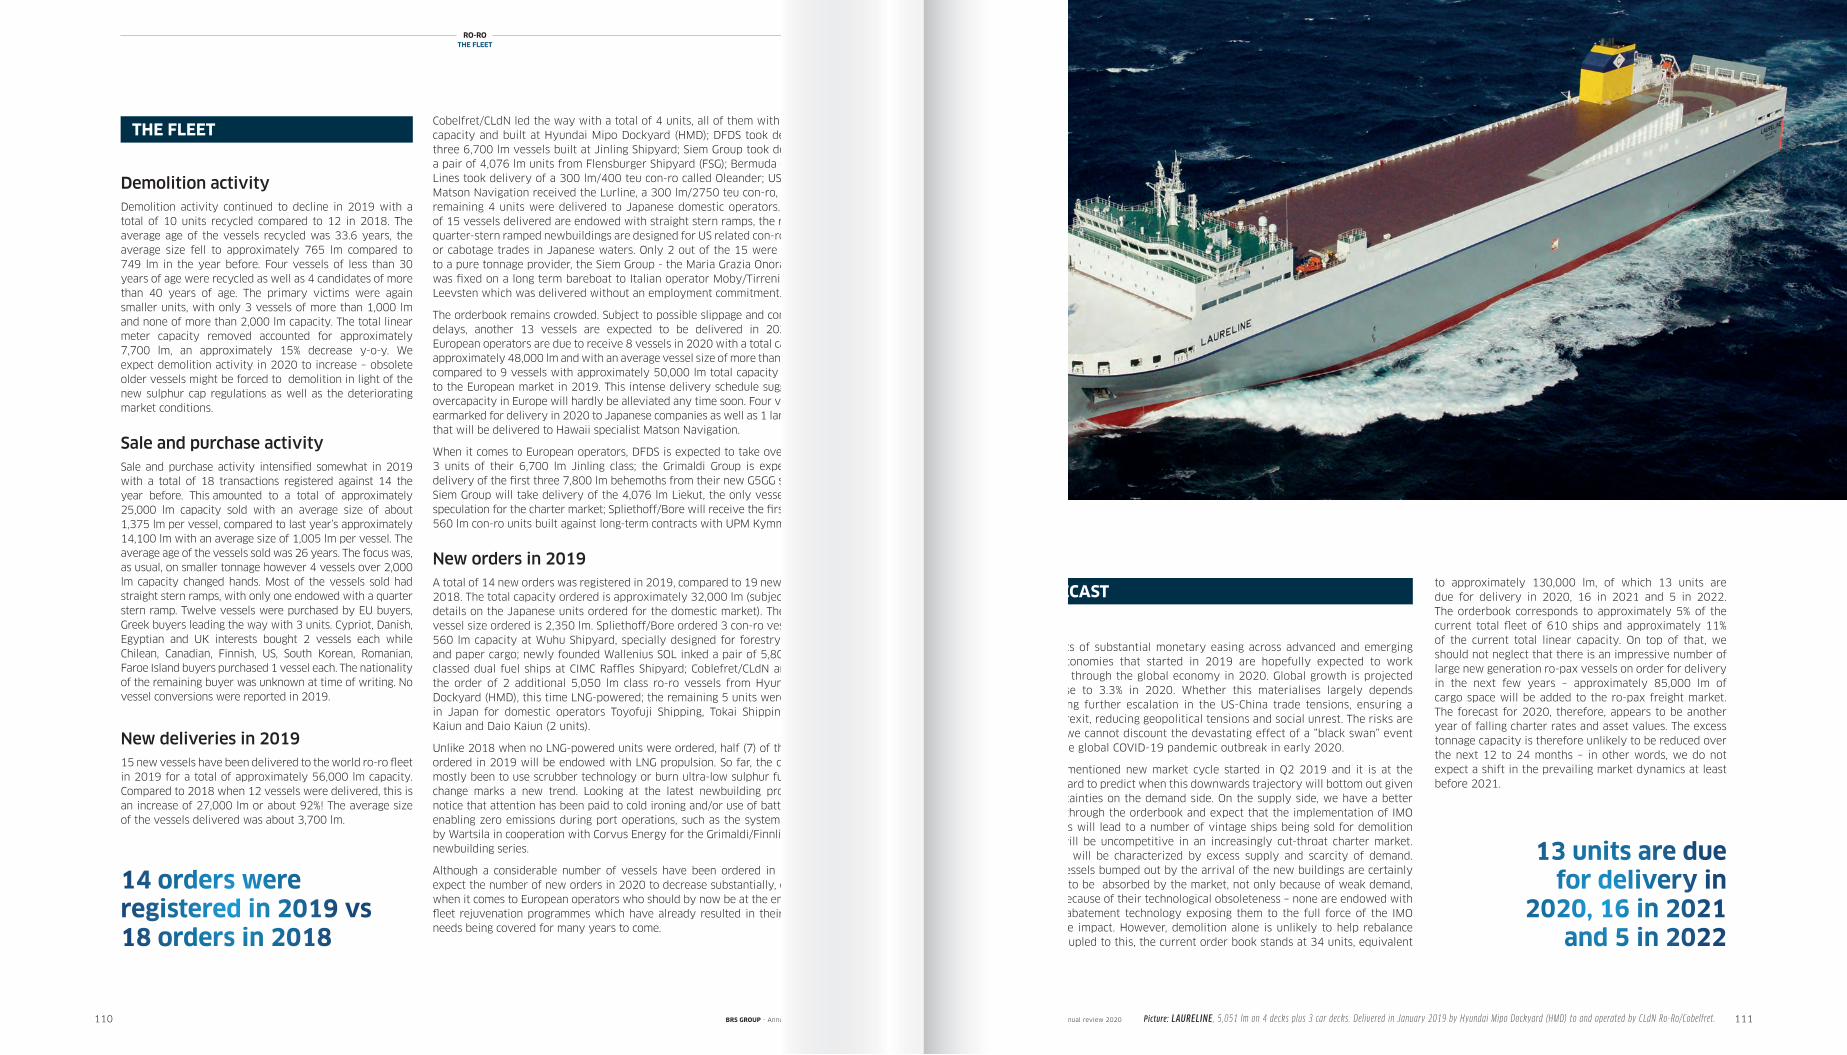
Demolition activity Demolition activity continued to decline in 2019 with a total of 10 units recycled compared to 12 in 2018. The average age of the vessels recycled was 33.6 years, the average size fell to approximately 765 lm compared to 749 lm in the year before. Four vessels of less than 30 years of age were recycled as well as 4 candidates of more than 40 years of age. The primary victims were again smaller units, with only 3 vessels of more than 1,000 lm and none of more than 2,000 lm capacity. The total linear meter capacity removed accounted for approximately 7,700 lm, an approximately 15% decrease y-o-y. We expect demolition activity in 2020 to increase – obsolete older vessels might be forced to demolition in light of the new sulphur cap regulations as well as the deteriorating market conditions.
Sale and purchase activity Sale and purchase activity intensified somewhat in 2019 with a total of 18 transactions registered against 14 the year before. This amounted to a total of approximately 25,000 lm capacity sold with an average size of about 1,375 lm per vessel, compared to last year’s approximately 14,100 lm with an average size of 1,005 lm per vessel. The average age of the vessels sold was 26 years. The focus was, as usual, on smaller tonnage however 4 vessels over 2,000 lm capacity changed hands. Most of the vessels sold had straight stern ramps, with only one endowed with a quarter stern ramp. Twelve vessels were purchased by EU buyers, Greek buyers leading the way with 3 units. Cypriot, Danish, Egyptian and UK interests bought 2 vessels each while Chilean, Canadian, Finnish, US, South Korean, Romanian, Faroe Island buyers purchased 1 vessel each. The nationality of the remaining buyer was unknown at time of writing. No vessel conversions were reported in 2019.
New deliveries in 201915 new vessels have been delivered to the world ro-ro fleet in 2019 for a total of approximately 56,000 lm capacity. Compared to 2018 when 12 vessels were delivered, this is an increase of 27,000 lm or about 92%! The average size of the vessels delivered was about 3,700 lm.
110 111
RO-ROTHE FLEET
Picture: LAURELINE , 5,051 lm on 4 decks plus 3 car decks. Delivered in January 2019 by Hyundai Mipo Dockyard (HMD) to and operated by CLdN Ro-Ro/Cobelfret.
Cobelfret/CLdN led the way with a total of 4 units, all of them with 5,050 lm capacity and built at Hyundai Mipo Dockyard (HMD); DFDS took delivery of three 6,700 lm vessels built at Jinling Shipyard; Siem Group took delivery of a pair of 4,076 lm units from Flensburger Shipyard (FSG); Bermuda Container Lines took delivery of a 300 lm/400 teu con-ro called Oleander; US operator Matson Navigation received the Lurline, a 300 lm/2750 teu con-ro, while the remaining 4 units were delivered to Japanese domestic operators. Nine out of 15 vessels delivered are endowed with straight stern ramps, the remaining quarter-stern ramped newbuildings are designed for US related con-ro services or cabotage trades in Japanese waters. Only 2 out of the 15 were delivered to a pure tonnage provider, the Siem Group - the Maria Grazia Onorato which was fixed on a long term bareboat to Italian operator Moby/Tirrenia and the Leevsten which was delivered without an employment commitment.
The orderbook remains crowded. Subject to possible slippage and construction delays, another 13 vessels are expected to be delivered in 2020 alone. European operators are due to receive 8 vessels in 2020 with a total capacity of approximately 48,000 lm and with an average vessel size of more than 6,000 lm, compared to 9 vessels with approximately 50,000 lm total capacity delivered to the European market in 2019. This intense delivery schedule suggests that overcapacity in Europe will hardly be alleviated any time soon. Four vessels are earmarked for delivery in 2020 to Japanese companies as well as 1 large con-ro that will be delivered to Hawaii specialist Matson Navigation.
When it comes to European operators, DFDS is expected to take over another 3 units of their 6,700 lm Jinling class; the Grimaldi Group is expecting the delivery of the first three 7,800 lm behemoths from their new G5GG series; the Siem Group will take delivery of the 4,076 lm Liekut, the only vessel built on speculation for the charter market; Spliethoff/Bore will receive the first of three 560 lm con-ro units built against long-term contracts with UPM Kymmene.
New orders in 2019A total of 14 new orders was registered in 2019, compared to 19 new orders in 2018. The total capacity ordered is approximately 32,000 lm (subject to exact details on the Japanese units ordered for the domestic market). The average vessel size ordered is 2,350 lm. Spliethoff/Bore ordered 3 con-ro vessels with 560 lm capacity at Wuhu Shipyard, specially designed for forestry products and paper cargo; newly founded Wallenius SOL inked a pair of 5,800 lm ice-classed dual fuel ships at CIMC Raffles Shipyard; Coblefret/CLdN announced the order of 2 additional 5,050 lm class ro-ro vessels from Hyundai Mipo Dockyard (HMD), this time LNG-powered; the remaining 5 units were ordered in Japan for domestic operators Toyofuji Shipping, Tokai Shipping, Nansei Kaiun and Daio Kaiun (2 units).
Unlike 2018 when no LNG-powered units were ordered, half (7) of the vessels ordered in 2019 will be endowed with LNG propulsion. So far, the choice has mostly been to use scrubber technology or burn ultra-low sulphur fuel so this change marks a new trend. Looking at the latest newbuilding projects, we notice that attention has been paid to cold ironing and/or use of battery packs enabling zero emissions during port operations, such as the system designed by Wartsila in cooperation with Corvus Energy for the Grimaldi/Finnlines G5GG newbuilding series.
Although a considerable number of vessels have been ordered in 2019, we expect the number of new orders in 2020 to decrease substantially, especially when it comes to European operators who should by now be at the end of their fleet rejuvenation programmes which have already resulted in their capacity needs being covered for many years to come.
The effects of substantial monetary easing across advanced and emerging market economies that started in 2019 are hopefully expected to work their way through the global economy in 2020. Global growth is projected to increase to 3.3% in 2020. Whether this materialises largely depends on avoiding further escalation in the US-China trade tensions, ensuring a smooth Brexit, reducing geopolitical tensions and social unrest. The risks are high and we cannot discount the devastating effect of a ”black swan” event such as the global COVID-19 pandemic outbreak in early 2020.
The aforementioned new market cycle started in Q2 2019 and it is at the moment hard to predict when this downwards trajectory will bottom out given the uncertainties on the demand side. On the supply side, we have a better visibility through the orderbook and expect that the implementation of IMO 2020 rules will lead to a number of vintage ships being sold for demolition as they will be uncompetitive in an increasingly cut-throat charter market. The latter will be characterized by excess supply and scarcity of demand. Vintage vessels bumped out by the arrival of the new buildings are certainly not going to be absorbed by the market, not only because of weak demand, but also because of their technological obsoleteness – none are endowed with emission abatement technology exposing them to the full force of the IMO 2020 price impact. However, demolition alone is unlikely to help rebalance supply. Coupled to this, the current order book stands at 34 units, equivalent
14 orders were registered in 2019 vs 18 orders in 2018
to approximately 130,000 lm, of which 13 units are due for delivery in 2020, 16 in 2021 and 5 in 2022. The orderbook corresponds to approximately 5% of the current total fleet of 610 ships and approximately 11% of the current total linear capacity. On top of that, we should not neglect that there is an impressive number of large new generation ro-pax vessels on order for delivery in the next few years – approximately 85,000 lm of cargo space will be added to the ro-pax freight market. The forecast for 2020, therefore, appears to be another year of falling charter rates and asset values. The excess tonnage capacity is therefore unlikely to be reduced over the next 12 to 24 months – in other words, we do not expect a shift in the prevailing market dynamics at least before 2021.
FORECAST
13 units are duefor delivery in
2020, 16 in 2021 and 5 in 2022
BRS GROUP - Annual review 2020 BRS GROUP - Annual review 2020
THE FLEET
Car Carrier
StandstillSustained chartering activity throughout most of the year kept the size of the idle fleet in check but was not sufficient to raise charter rates in a sustainable manner.
113
TRAVIATA Car carrier with approximately 65,996 square meters (8,000 CEU) on 13 decks, including 5 hoistable. Delivered in April 2019 by Tianjin Xingang shipyard (CSIC) in China to WallRORO and operated by Wallenius Wilhelmsen Ocean. She is the sixth sister ship in the company’s series of High Efficiency RoRo (HERO) vessels.

114 115
The Ongoing Anti-Trust Investigation
As anticipated, the sweeping investigation into the global car carrier price fixing scandal that is ongoing since 2012 produced further developments during 2019. In April, the Chilean Tribunal for the Defence of Free Competition (TDLC) released its final ruling whereby NYK and MOL were ordered to pay $6.6 million and $2.5 million respectively, whereas EUKOR, K Line and CMC were acquitted. CSAV was exempted for having revealed the existence of the collusion agreement and compensation procedure. Chile’s National Economic Prosecutor's Office (FNE) is appealing the ruling in the country’s Supreme Court asking to increase NYK’s fine and to impose economic sanctions against EUKOR, K Line and CMC.
In June, two former executives of Höegh Autoliners were indicted by the United States (US) District Court in Baltimore for their roles in an alleged antitrust conspiracy. In August, K Line was convicted of criminal cartel conduct and ordered to pay a fine of $34.5 million by Australia’s Federal Court. It is the largest ever criminal fine imposed under the Australian Competition and Consumer Commission (ACCC). During the same month, following the
Despite rationalizing and optimizing their fleet deployments and being generally more selective in terms of cargo, operators were unable to break free of the deadlock of low freight rates
Picture: NIAGARA HIGHWAY , car carrier with post-Panamax beam and with approximately 67,000 square meters (7,450 CEU) on 13 decks including 3 hoistable. Delivered in March 2019 by Imabari Shipbuilding Co. Ltd. in Tadotsu, Japan to Shoei Kisen Kaisha and operated by K Line.
Despite rationalizing and optimizing their fleet deployments and being generally more selective in terms of cargo, operators were unable to break free of the deadlock of low freight rates. With no remarkable gains on the freight side and with overall lower cargo volumes due to declining global car sales, 2019 turned out to be a status quo year.
Looking ahead, downside triggers remain high with continued geopolitical and trade tensions, intensifying social unrest, and recurring climate-related natural disasters, plus the possibility of a “black swan” event. We therefore expect to see more demand-side volatility for the car carrier sector in 2020.
On the supply-side, the implementation of IMO 2020 and continued poor earnings should lead to above average tonnage recycling levels and should deter further investment in newbuildings. With a bit of luck, this could offset demand-side volatility and lead to a demand / supply imbalance, which could then usher in a fresh virtuous cycle.
CHARTERING ACTIVITY
BRS GROUP - Annual review 2020 BRS GROUP - Annual review 2020
continued investigation of the ACCC, the Commonwealth Director of Public Prosecution (CDPP) charged Wallenius Wilhelmsen Ocean (WWO) with criminal cartel conduct concerning the international shipping of certain vehicles to Australia between June 2011 and July 2012. In December, it emerged that German car maker Daimler is seeking compensation from several car carrier operators in a case of price-fixing in the United Kingdom (UK).
Just as we indicated last year, we expect that in 2020 more convictions and penalties will follow, with the possible emergence of further new investigations in this global cartel case which has already cost car carrier operators fines worth in excess of $1 billion.
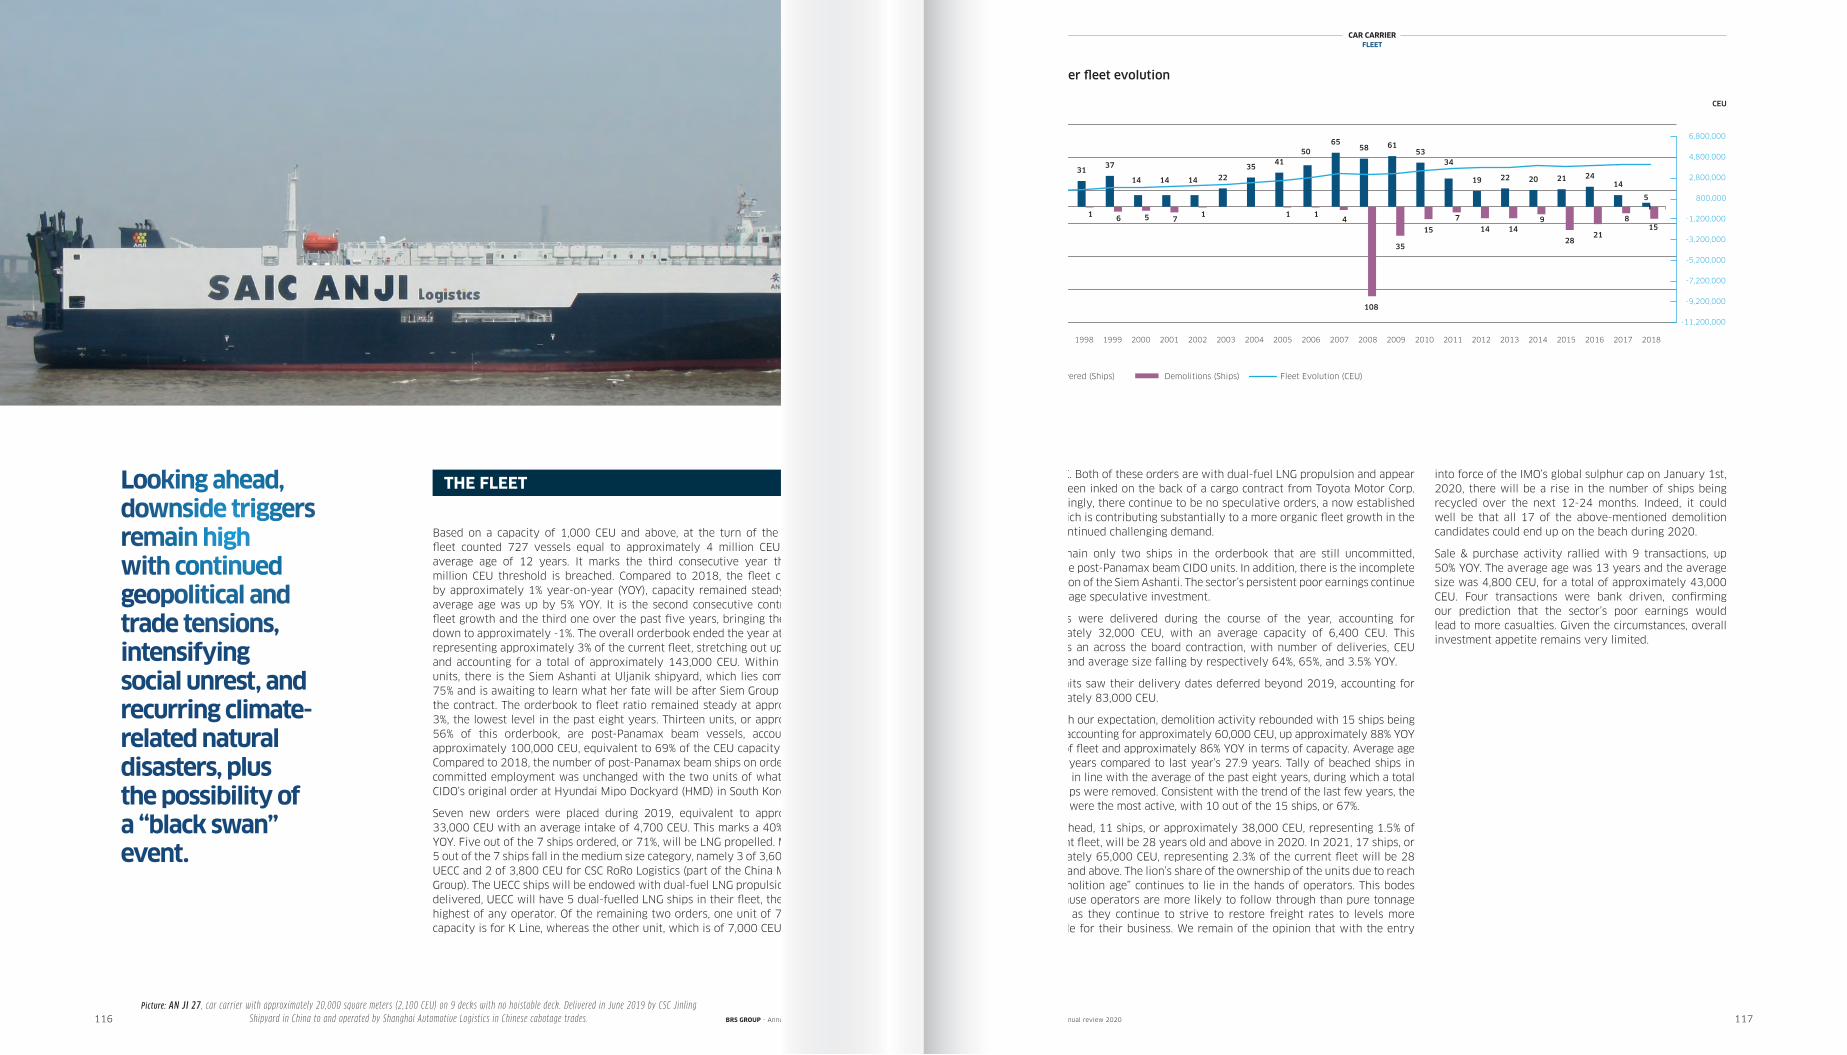
116 117
Based on a capacity of 1,000 CEU and above, at the turn of the year, the fleet counted 727 vessels equal to approximately 4 million CEU, with an average age of 12 years. It marks the third consecutive year that the 4 million CEU threshold is breached. Compared to 2018, the fleet contracted by approximately 1% year-on-year (YOY), capacity remained steady and the average age was up by 5% YOY. It is the second consecutive contraction in fleet growth and the third one over the past five years, bringing the average down to approximately -1%. The overall orderbook ended the year at 23 units, representing approximately 3% of the current fleet, stretching out up to 2021, and accounting for a total of approximately 143,000 CEU. Within these 23 units, there is the Siem Ashanti at Uljanik shipyard, which lies completed at 75% and is awaiting to learn what her fate will be after Siem Group cancelled the contract. The orderbook to fleet ratio remained steady at approximately 3%, the lowest level in the past eight years. Thirteen units, or approximately 56% of this orderbook, are post-Panamax beam vessels, accounting for approximately 100,000 CEU, equivalent to 69% of the CEU capacity on order. Compared to 2018, the number of post-Panamax beam ships on order without committed employment was unchanged with the two units of what is left of CIDO’s original order at Hyundai Mipo Dockyard (HMD) in South Korea.
Seven new orders were placed during 2019, equivalent to approximately 33,000 CEU with an average intake of 4,700 CEU. This marks a 40% increase YOY. Five out of the 7 ships ordered, or 71%, will be LNG propelled. Moreover, 5 out of the 7 ships fall in the medium size category, namely 3 of 3,600 CEU for UECC and 2 of 3,800 CEU for CSC RoRo Logistics (part of the China Merchants Group). The UECC ships will be endowed with dual-fuel LNG propulsion – when delivered, UECC will have 5 dual-fuelled LNG ships in their fleet, the absolute highest of any operator. Of the remaining two orders, one unit of 7,200 CEU capacity is for K Line, whereas the other unit, which is of 7,000 CEU capacity,
Looking ahead, downside triggers remain high with continued geopolitical and trade tensions, intensifying social unrest, and recurring climate-related natural disasters, plus the possibility of a “black swan” event.
is for NYK. Both of these orders are with dual-fuel LNG propulsion and appear to have been inked on the back of a cargo contract from Toyota Motor Corp. Unsurprisingly, there continue to be no speculative orders, a now established trend, which is contributing substantially to a more organic fleet growth in the face of continued challenging demand.
There remain only two ships in the orderbook that are still uncommitted, namely the post-Panamax beam CIDO units. In addition, there is the incomplete construction of the Siem Ashanti. The sector’s persistent poor earnings continue to discourage speculative investment.
Five units were delivered during the course of the year, accounting for approximately 32,000 CEU, with an average capacity of 6,400 CEU. This represents an across the board contraction, with number of deliveries, CEU capacity, and average size falling by respectively 64%, 65%, and 3.5% YOY.
Eleven units saw their delivery dates deferred beyond 2019, accounting for approximately 83,000 CEU.
In line with our expectation, demolition activity rebounded with 15 ships being beached, accounting for approximately 60,000 CEU, up approximately 88% YOY in terms of fleet and approximately 86% YOY in terms of capacity. Average age was 31.4 years compared to last year’s 27.9 years. Tally of beached ships in 2019 was in line with the average of the past eight years, during which a total of 116 ships were removed. Consistent with the trend of the last few years, the operators were the most active, with 10 out of the 15 ships, or 67%.
Looking ahead, 11 ships, or approximately 38,000 CEU, representing 1.5% of the current fleet, will be 28 years old and above in 2020. In 2021, 17 ships, or approximately 65,000 CEU, representing 2.3% of the current fleet will be 28 years old and above. The lion’s share of the ownership of the units due to reach their “demolition age” continues to lie in the hands of operators. This bodes well, because operators are more likely to follow through than pure tonnage providers as they continue to strive to restore freight rates to levels more sustainable for their business. We remain of the opinion that with the entry
Picture: AN JI 27 , car carrier with approximately 20,000 square meters (2,100 CEU) on 9 decks with no hoistable deck. Delivered in June 2019 by CSC Jinling Shipyard in China to and operated by Shanghai Automotive Logistics in Chinese cabotage trades.
THE FLEETinto force of the IMO’s global sulphur cap on January 1st, 2020, there will be a rise in the number of ships being recycled over the next 12-24 months. Indeed, it could well be that all 17 of the above-mentioned demolition candidates could end up on the beach during 2020.
Sale & purchase activity rallied with 9 transactions, up 50% YOY. The average age was 13 years and the average size was 4,800 CEU, for a total of approximately 43,000 CEU. Four transactions were bank driven, confirming our prediction that the sector’s poor earnings would lead to more casualties. Given the circumstances, overall investment appetite remains very limited.
Car carrier fleet evolution
Ships
Delivered (Ships) Demolitions (Ships) Fleet Evolution (CEU)
-11,200,000
-9,200,000
-7,200,000
-5,200,000
-3,200,000
-1,200,000
800,000
2,800,000
4,800,000
6,800,000
-140
-100
-60
-20
20
60
100
19
98
19
99
20
00
20
01
20
02
20
03
20
04
20
05
20
06
20
07
20
08
20
09
20
10
20
11
20
12
20
13
20
14
20
15
20
16
20
19
CCEEUUShips
Car Carrier Fleet Evolution
Delivered (Ships) Demolitions (Ships) Fleet Evolution (CEU)
20
17
20
18
2331
37
14 14 14 2235
4150
6558 61
5334
19 22 20 21 2414
1 6 5 71 1 1
4
108
35
15
7
14 149
2821
8
5
15
2000 2001 2002 2003 2004 2005 2006 2007 2008 2009 2010 2011 2012 2013 2014 2015 2016 20181998 1999
CEU
1997 2017
CAR CARRIERFLEET
BRS GROUP - Annual review 2020 BRS GROUP - Annual review 2020
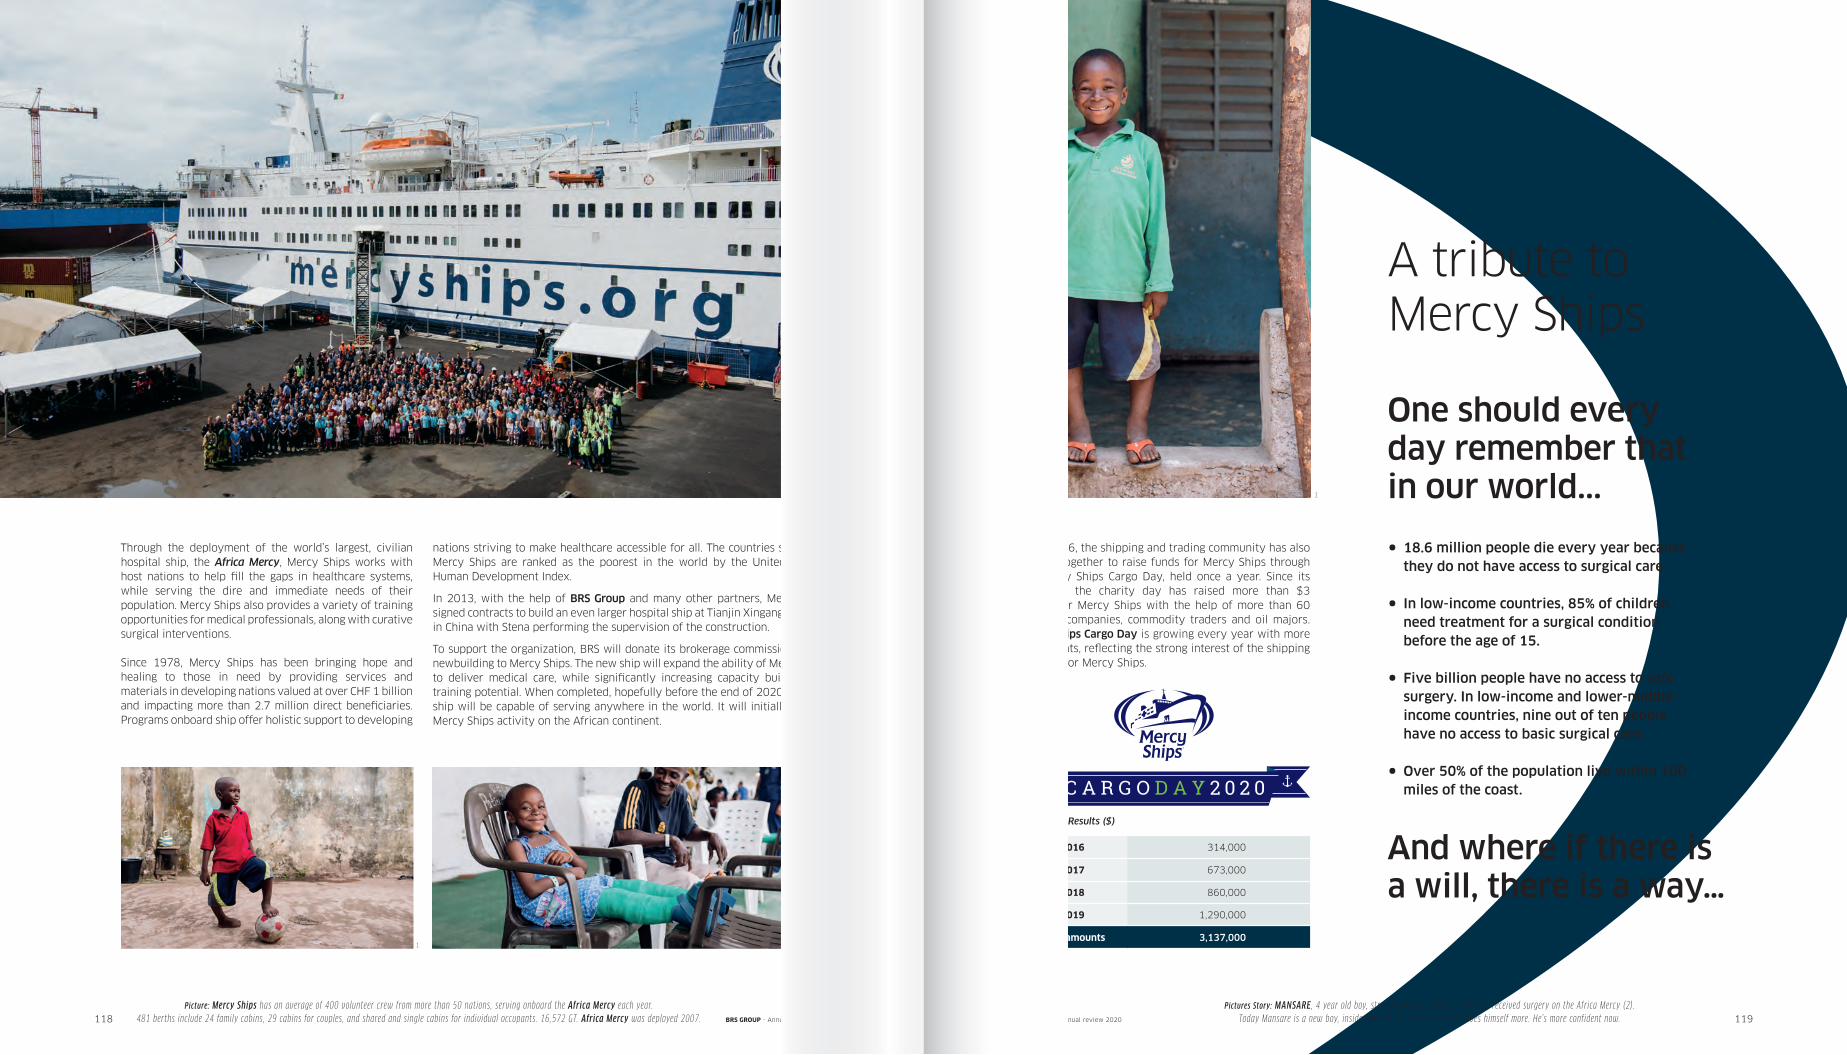
118 119BRS GROUP - Annual review 2020 BRS GROUP - Annual review 2020
A tribute to Mercy Ships
One should every day remember that in our world...
•
•
•
•
18.6 million people die every year because they do not have access to surgical care.
In low-income countries, 85% of children need treatment for a surgical condition before the age of 15.
Five billion people have no access to safe surgery. In low-income and lower-middle-income countries, nine out of ten people have no access to basic surgical care.
Over 50% of the population live within 100 miles of the coast.
nations striving to make healthcare accessible for all. The countries served by Mercy Ships are ranked as the poorest in the world by the United Nations Human Development Index.
In 2013, with the help of BRS Group and many other partners, Mercy Ships signed contracts to build an even larger hospital ship at Tianjin Xingang shipyard in China with Stena performing the supervision of the construction.
To support the organization, BRS will donate its brokerage commission on the newbuilding to Mercy Ships. The new ship will expand the ability of Mercy Ships to deliver medical care, while significantly increasing capacity building and training potential. When completed, hopefully before the end of 2020, the new ship will be capable of serving anywhere in the world. It will initially expand Mercy Ships activity on the African continent.
And where if there is a will, there is a way…
Since 2016, the shipping and trading community has also worked together to raise funds for Mercy Ships through the Mercy Ships Cargo Day, held once a year. Since its inception, the charity day has raised more than $3 million for Mercy Ships with the help of more than 60 shipping companies, commodity traders and oil majors. Mercy Ships Cargo Day is growing every year with more participants, reflecting the strong interest of the shipping industry for Mercy Ships.
Pictures Story: MANSARE , 4 year old boy, struggle with limited mobility (1), received surgery on the Africa Mercy (2). Today Mansare is a new boy, inside and out (3). He can run. He loves himself more. He’s more confident now.
Through the deployment of the world’s largest, civilian hospital ship, the Africa Mercy, Mercy Ships works with host nations to help fill the gaps in healthcare systems, while serving the dire and immediate needs of their population. Mercy Ships also provides a variety of training opportunities for medical professionals, along with curative surgical interventions.
Since 1978, Mercy Ships has been bringing hope and healing to those in need by providing services and materials in developing nations valued at over CHF 1 billion and impacting more than 2.7 million direct beneficiaries. Programs onboard ship offer holistic support to developing
2016 314,000
2017 673,000
2018 860,000
2019 1,290,000
Total amounts 3,137,000
Picture: Mercy Ships has an average of 400 volunteer crew from more than 50 nations, serving onboard the Africa Mercy each year. 481 berths include 24 family cabins, 29 cabins for couples, and shared and single cabins for individual occupants. 16,572 GT. Africa Mercy was deployed 2007.
1. 2.
3.
Cargo Day Results ($)
Affiliates
Athens
+30 211 1037 300
Beijing
+86 10 8221 1718
Bogota+57 1 795 46 64
Dubai +971 4 440 8400
Geneva
+41 22 591 2828
Hamburg
+49 40 333 966 999
Ho Chi Minh
+84 97 213 47 60
Hong Kong [email protected]
Houston
+1 346 237 3380
Jakarta
+62 812 8772 9396
London
+44 207 374 65 83
Luxembourg
+352 27 44 93 88
Madrid
+34 91 564 63 35
Mumbai +91 22 6650 4242
Paris
+33 1 41 92 12 34
Rio de Janeiro
+55 21 39 23 51 52 [email protected]
Shanghai +86 21 6321 5666
Singapore
+65 6603 3230
Stamford (Connecticut)
+1 203 487 7014
Offices
Newbuilding
Sale & Purchase
Dry Bulk
Tanker
Liner
Chemical [email protected]
Gas
Offshore
Research
Project Finance
Departments
120 121
Global Shipbroking Services
Market Intelligence
www.brsbrokers.com
BRS GROUP - Annual review 2020 BRS GROUP - Annual review 2020
www.alphaliner.comwww.axsmarine.com www.demogate.com

122
11, boulevard Jean-Mermoz - 92200 Neuilly-sur-Seine - FRANCE
BRS GROUP - Annual review 2020

www.brsbrokers.com
20
20
A
nn
ual
Rev
iew
Related Documents