885 Shifting Patterns of Nitrogen Excretion and Amino Acid Catabolism Capacity during the Life Cycle of the Sea Lamprey (Petromyzon marinus) Michael P. Wilkie 1,2, * Jaime F. Claude 2 Amanda Cockshutt 2 John A. Holmes 3,4 Yuxiang S. Wang 5,6 John H. Youson 3 Patrick J. Walsh 6 1 Department of Biology, Wilfrid Laurier University, Waterloo, Ontario N2L 3C5, Canada; 2 Department of Biology, Mount Allison University, Sackville, New Brunswick E4L 1G7, Canada; 3 Department of Life Sciences, University of Toronto at Scarborough, Toronto, Ontario M1C 1A4, Canada; 4 Fisheries and Oceans Canada, Nanaimo, British Columbia V9T 6N7, Canada; 5 Department of Biology, Queen’s University, Kingston, Ontario K7L 3N6, Canada; 6 Rosentiel School of Marine and Atmospheric Science, University of Miami, Miami, Florida 33149 Accepted 3/17/2006; Electronically Published 8/7/2006 ABSTRACT The jawless fish, the sea lamprey (Petromyzon marinus), spends part of its life as a burrow-dwelling, suspension-feeding larva (ammocoete) before undergoing a metamorphosis into a free swimming, parasitic juvenile that feeds on the blood of fishes. We predicted that animals in this juvenile, parasitic stage have a great capacity for catabolizing amino acids when large quan- tities of protein-rich blood are ingested. The sixfold to 20-fold greater ammonia excretion rates (J Amm ) in postmetamorphic (nonfeeding) and parasitic lampreys compared with ammo- coetes suggested that basal rates of amino acid catabolism in- creased following metamorphosis. This was likely due to a greater basal amino acid catabolizing capacity in which there was a sixfold higher hepatic glutamate dehydrogenase (GDH) activity in parasitic lampreys compared with ammocoetes. Im- munoblotting also revealed that GDH quantity was 10-fold and threefold greater in parasitic lampreys than in ammocoetes and * Corresponding author; e-mail: [email protected]. Physiological and Biochemical Zoology 79(5):885–898. 2006. 2006 by The University of Chicago. All rights reserved. 1522-2152/2006/7905-5126$15.00 upstream migrant lampreys, respectively. Higher hepatic ala- nine and aspartate aminotransferase activities in the parasitic lampreys also suggested an enhanced amino acid catabolizing capacity in this life stage. In contrast to parasitic lampreys, the twofold larger free amino acid pool in the muscle of upstream migrant lampreys confirmed that this period of natural star- vation is accompanied by a prominent proteolysis. Carbamoyl phosphate synthetase III was detected at low levels in the liver of parasitic and upstream migrant lampreys, but there was no evidence of extrahepatic (muscle, intestine) urea production via the ornithine urea cycle. However, detection of arginase activity and high concentrations of arginine in the liver at all life stages examined infers that arginine hydrolysis is an im- portant source of urea. We conclude that metamorphosis is accompanied by a metabolic reorganization that increases the capacity of parasitic sea lampreys to catabolize intermittently large amino acid loads arising from the ingestion of protein rich blood from their prey/hosts. The subsequent generation of energy-rich carbon skeletons can then be oxidized or retained for glycogen and fatty acid synthesis, which are essential fuels for the upstream migratory and spawning phases of the sea lamprey’s life cycle. Introduction The complex life cycle of the sea lamprey (Petromyzon marinus) is characterized by a prolonged burrow-dwelling phase lasting 3–7 yr, in which they subsist as suspension-feeding ammocoetes (larvae) before undergoing a complex metamorphosis into freely swimming, juvenile parasitic lampreys that feed on the blood of fishes (for review, see Youson 1980). Following the parasitic phase, sea lampreys cease feeding, migrate upstream (upstream migrants), spawn, and then die (Beamish and Potter 1975). Metamorphosis leads to profound changes in internal and external body structure, as characterized by the develop- ment of an oral disc and rasping tongue and eyes, along with a major reorganization of the liver, gastrointestinal tract, kid- neys, and gills (Youson 1980; Rovainen 1996). The objective of this investigation was to test the hypothesis that such life stage–dependent changes in body structure, ac- tivity level, mode of feeding, and dietary status alter patterns of amino acid catabolism and nitrogenous waste (N-waste)

Welcome message from author
This document is posted to help you gain knowledge. Please leave a comment to let me know what you think about it! Share it to your friends and learn new things together.
Transcript
885
Shifting Patterns of Nitrogen Excretion and Amino Acid Catabolism
Capacity during the Life Cycle of the Sea Lamprey
(Petromyzon marinus)
Michael P. Wilkie1,2,*Jaime F. Claude2
Amanda Cockshutt2
John A. Holmes3,4
Yuxiang S. Wang5,6
John H. Youson3
Patrick J. Walsh6
1Department of Biology, Wilfrid Laurier University, Waterloo,Ontario N2L 3C5, Canada; 2Department of Biology, MountAllison University, Sackville, New Brunswick E4L 1G7,Canada; 3Department of Life Sciences, University of Torontoat Scarborough, Toronto, Ontario M1C 1A4, Canada;4Fisheries and Oceans Canada, Nanaimo, British ColumbiaV9T 6N7, Canada; 5Department of Biology, Queen’sUniversity, Kingston, Ontario K7L 3N6, Canada; 6RosentielSchool of Marine and Atmospheric Science, University ofMiami, Miami, Florida 33149
Accepted 3/17/2006; Electronically Published 8/7/2006
ABSTRACT
The jawless fish, the sea lamprey (Petromyzon marinus), spendspart of its life as a burrow-dwelling, suspension-feeding larva(ammocoete) before undergoing a metamorphosis into a freeswimming, parasitic juvenile that feeds on the blood of fishes.We predicted that animals in this juvenile, parasitic stage havea great capacity for catabolizing amino acids when large quan-tities of protein-rich blood are ingested. The sixfold to 20-foldgreater ammonia excretion rates (JAmm) in postmetamorphic(nonfeeding) and parasitic lampreys compared with ammo-coetes suggested that basal rates of amino acid catabolism in-creased following metamorphosis. This was likely due to agreater basal amino acid catabolizing capacity in which therewas a sixfold higher hepatic glutamate dehydrogenase (GDH)activity in parasitic lampreys compared with ammocoetes. Im-munoblotting also revealed that GDH quantity was 10-fold andthreefold greater in parasitic lampreys than in ammocoetes and
* Corresponding author; e-mail: [email protected].
Physiological and Biochemical Zoology 79(5):885–898. 2006. � 2006 by TheUniversity of Chicago. All rights reserved. 1522-2152/2006/7905-5126$15.00
upstream migrant lampreys, respectively. Higher hepatic ala-nine and aspartate aminotransferase activities in the parasiticlampreys also suggested an enhanced amino acid catabolizingcapacity in this life stage. In contrast to parasitic lampreys, thetwofold larger free amino acid pool in the muscle of upstreammigrant lampreys confirmed that this period of natural star-vation is accompanied by a prominent proteolysis. Carbamoylphosphate synthetase III was detected at low levels in the liverof parasitic and upstream migrant lampreys, but there was noevidence of extrahepatic (muscle, intestine) urea productionvia the ornithine urea cycle. However, detection of arginaseactivity and high concentrations of arginine in the liver at alllife stages examined infers that arginine hydrolysis is an im-portant source of urea. We conclude that metamorphosis isaccompanied by a metabolic reorganization that increases thecapacity of parasitic sea lampreys to catabolize intermittentlylarge amino acid loads arising from the ingestion of proteinrich blood from their prey/hosts. The subsequent generationof energy-rich carbon skeletons can then be oxidized or retainedfor glycogen and fatty acid synthesis, which are essential fuelsfor the upstream migratory and spawning phases of the sealamprey’s life cycle.
Introduction
The complex life cycle of the sea lamprey (Petromyzon marinus)is characterized by a prolonged burrow-dwelling phase lasting3–7 yr, in which they subsist as suspension-feeding ammocoetes(larvae) before undergoing a complex metamorphosis intofreely swimming, juvenile parasitic lampreys that feed on theblood of fishes (for review, see Youson 1980). Following theparasitic phase, sea lampreys cease feeding, migrate upstream(upstream migrants), spawn, and then die (Beamish and Potter1975). Metamorphosis leads to profound changes in internaland external body structure, as characterized by the develop-ment of an oral disc and rasping tongue and eyes, along witha major reorganization of the liver, gastrointestinal tract, kid-neys, and gills (Youson 1980; Rovainen 1996).
The objective of this investigation was to test the hypothesisthat such life stage–dependent changes in body structure, ac-tivity level, mode of feeding, and dietary status alter patternsof amino acid catabolism and nitrogenous waste (N-waste)

886 M. P. Wilkie, J. F. Claude, A. Cockshutt, J. A. Holmes, Y. S. Wang, J. H. Youson, and P. J. Walsh
production in sea lampreys. Indeed, postmetamorphic eleva-tions of metabolic rate, along with a switch to a protein-richdiet of blood, may be reflected by greater rates of N-wasteproduction and excretion during the parasitic stage of the sealamprey’s life cycle. Because the upstream migration is a non-trophic period, upstream migrant sea lampreys also have toendure several months without food (Beamish and Potter 1975;Larsen 1980; Emelyanova et al. 2004).
Although mechanisms of N-waste production were previ-ously examined in migrating Pacific lamprey (Lampetra triden-tata; Read 1968), sea lamprey ammocoetes (Wilkie et al. 1999),and feeding parasitic sea lampreys (Wilkie et al. 2004), it is notknown how patterns of amino acid catabolism and N-wasteproduction change at different stages of the lamprey life cycle.Thus, the first objective of this investigation was to compareN-waste excretion patterns during each of the sea lamprey’smajor life stages by measuring rates of ammonia (JAmm) andurea excretion (JUrea) in ammocoete, postmetamorphic (not yetfeeding), parasitic, and upstream migrant sea lampreys, plusplasma ammonia and urea concentrations. The lamprey’s ca-pacity to produce N-wastes at different life-history stages wasevaluated by comparing the activities of key enzymes of aminoacid metabolism in the liver, muscle, and intestine. Key aminoacids were also measured to determine how changes in the sizeof the amino acid pool or the quantity of specific amino acidsinfluenced amino acid catabolism, JAmm and JUrea at different lifestages.
Although ammocoetes and parasitic lampreys excrete ap-proximately 10%–30% of their N-waste as urea (Wilkie et al.1999, 2004), there is little to suggest that the ornithine ureacycle (OUC) is quantitatively important in lampreys. On thebasis of enzymatic determinations of OUC activity, Read (1968)suggested that upstream migrant lampreys lacked the ability toproduce urea de novo via the OUC, speculating that the ma-jority was produced through the breakdown of arginine. Wilkieet al. (1999) demonstrated that urea is quantitatively importantin ammocoetes, but the key OUC enzyme, carbamoyl phos-phate synthetase III (CPS III), was not detected. More recently,low levels of CPS III activity were detected in the livers ofparasitic sea lampreys but were insufficient to account for sig-nificant JUrea (Wilkie et al. 2004). However, recent studies haveshown that extrahepatic sites such as the muscle and/or intes-tine possess significant OUC enzyme activity (CPS III and or-nithine carbamoyl transferase [OCT]) in many fishes, includingthe little skate (Raja erinacea; Steele et al. 2005), spiny dogfish(Squalus acanthias; Kajimura et al. 2005), ureogenic Lake Ma-gadi tilapia (Alcolapia grahami; Lindley et al. 1999), gulf toad-fish (Opsanus beta; Julsrud et al. 1998), larval trout (Onco-rhynchus mykiss; Korte et al. 1997; Steele et al. 2001), andlargemouth bass (Micropterus dolomieu; Kong et al. 1998).Thus, another objective was to test the hypothesis that extra-hepatic sites potentially contributed to urea production in sealampreys by comparing the intramuscular and intestinal activ-
ities of key OUC and other enzymes associated with urea pro-duction to measurements made in the liver of ammocoete,parasitic, and upstream migrant sea lampreys.
Material and Methods
Experimental Animals and Setup
Sea lamprey (Petromyzon marinus) ammocoetes were collectedfrom Duffin’s Creek, Ontario, using pulsed DC electrofishing(Smith Root model 12A) and transported to the University ofToronto at Scarborough in insulated containers containing aer-ated water. The animals were held in well-aerated 50-L aquaria,in which the bottom was lined with 10 cm of sand to serve asburrowing substrate, receiving dechlorinated tap water (T p
–15�C; mmol L�1 as CaCO3; ) at12� hardness p 0.7 pH p 7.9a rate of 300–500 mL min�1. The ammocoetes were fed a weeklymaintenance diet of baker’s yeast (approximately 2 g per am-mocoete; Holmes and Youson 1994).
A subset of ammocoetes entered metamorphosis and, fol-lowing metamorphosis, were transferred to a 500-L LivingStream (Frigid Units). No attempts were made to feed lampreyundergoing metamorphosis because they do not feed at thistime (Youson 2003). Following metamorphosis, however, theanimals were allowed to feed on domestic rainbow trout (On-corhynchus mykiss; –200 g) purchased from Lin-mass p 100wood Acres Trout Farm, Campbellcroft, Ontario. The healthof the trout was frequently monitored, and when they lostequilibrium, they were quickly netted and euthanized with anoverdose of buffered tricaine methanesulfonate (MS-222) an-esthetic (Syndel Laboratories), as approved by the Universityof Toronto at Scarborough and Mount Allison University An-imal Care Committees. Most of the parasitic lampreys contin-ued feeding until experiments commenced 2 mo later.
Upstream migrant (prespawning) sea lampreys were cap-tured in Duffin’s Creek or the Humber River (near Toronto)and held in groups of 20–30 in 80-L aquaria receiving waterat a rate of 1.0 L min�1 and a temperature of 12�–15�C. At thetime of experimentation, care was taken to verify that all an-imals remained in prespawning condition by monitoring thedevelopment of secondary sex characters for each gender. Itwas not possible to feed the upstream migrant sea lampreysbecause they do not feed during this life stage (Larsen 1980).
Experimental Protocol
Nitrogenous waste excretion rates (JN-waste) were determined inammocoete ( ; g), postmeta-N p 24 mass p 3.53 � 0.03morphic ( ; g), parasitic ( ;N p 5 1.46 � 0.25 N p 8 5.04 �
g), and upstream migrant ( ; g) lam-0.74 N p 20 248.6 � 11.1preys held individually in darkened flux chambers ( –T p 12�
14�C). Ammocoetes and parasitic lampreys were fasted 7–10 dbefore experiments to better compare basal levels of N-wasteproduction and excretion. This approach was also better suited
Effects of Life-History Stage on Nitrogen Metabolism in Lampreys 887
for making similar comparisons to the naturally starving up-stream migrant lampreys. The volume of each flux chamberreflected the size of each animal; smaller ammocoetes and par-asitic lampreys were held in 200–500-mL flux chambers, andthe larger upstream migrants were held in 3.0-L chambers. Eachchamber was fitted with an externally mounted sampling port,which permitted the experimenter to collect water samples (10mL at 0, 4, 8, and 12 h) with minimal disturbance to the animalinside. Excretion rates were determined over three consecutive4-h flux determination periods to eliminate artifacts introducedby possible diurnal rhythms. Since excretion rates were stableover this period, only mean excretion rates are reported. Ad-ditional details are found in Wilkie et al. (1999, 2004).
Following flux determinations, the lampreys were anesthe-tized with 1.5 g L�1 MS222 buffered with 3.0 g L�1 NaHCO3
for 3–5 min (Wilkie et al. 1999). Weights were then determinedand blood collected from an incision through the heart usingnonheparinized capillary tubes (Wilkie et al. 1999). Blood sam-ples were centrifuged at 10,000 g for 5 min, and the plasmawas collected and frozen at �80�C until analyzed for ammonia,urea, and amino acids. An incision was then made along themidventral line of the animal, exposing the liver and intestine,which were removed and snap frozen in liquid N2 using pre-cooled aluminum tongs. After removing the skin, muscle wasexcised from the anteriolateral trunk and preserved in an iden-tical manner. All tissues were stored at �80�C until analyzedfor amino acid levels or enzyme activities.
Analytical Techniques
Measurements of ammonia (JAmm) and urea excretion (JUrea)were based on the accumulation of each waste product in thewater during each flux determination period, after correctingfor the animal’s weight and water volume. Total ammonia (thesum of NH3 and ) in the water was determined using the�NH4
salicylate-hypochlorite assay (Verdouw et al. 1978), whileplasma ammonia was determined enzymatically (glutamate de-hydrogenase [GDH]) using a commercial kit (Sigma). Waterand plasma urea concentrations were determined using thediacetyl monoxime reaction (Crocker 1967).
Amino acids were quantified in the plasma, liver, and muscleof ammocoete, parasitic, and upstream migrant lampreys byhigh-performance liquid chromatography using a Varian Star9012 solvent delivery system and 9100 Autosampler, a WatersM420 fluorescence detector, and a reverse-phase C18 Whatmanpartisphere cartridge column. Plasma was deproteinized usingan equal volume of 8% perchloric acid, neutralized with K2CO3,placed on ice for approximately 5 min, and centrifuged at10,000 g at 4�C for 10 min. For amino acid quantification, 25mL of supernatant was injected onto the column, followingprecolumn derivatization with an equal volume of o-ophthal-dialdehyde (OPA). Pieces of liver (approximately 20 mg) andmuscle (approximately 100 mg) were prepared in a similar
manner. Individual amino acid identities and quantities werebased on relative retention times and the fluorescence peakareas of the OPA–amino acid derivatives when compared withcommercially prepared amino acid standards (Sigma; catalogAA-S-18). Sixteen amino acids were quantified, including theessential amino acids arginine, histidine, isoleucine, leucine,lysine, methionine, phenylalanine, threonine, and valine andthe nonessential amino acids alanine, aspartate, glutamate, glu-tamine, glycine, serine, and tyrosine.
Enzyme activities were determined on tissue homogenatesprepared from frozen tissues (liver, muscle, intestine) usingassay conditions and protocols that were optimized for lampreytissues (Wilkie et al. 1999, 2004) using previously describedmethodology (Mommsen and Walsh 1989; Barber and Walsh1993; Walsh 1996). Briefly, pieces of tissue (20–100 mg) weretransferred to a chilled 1.5-mL centrifuge tube and ground for30 s in 4 vols of homogenization buffer (pH 7.5; 20 mmol L�1
KH2PO4, 10 mmol L�1 HEPES, 0.5 mmol L�1 EDTA, 1 mmolL�1 dithiothreitol; 50% glycerol) using a PowerGen model 125tissue homogenizer. Following homogenization, the sampleswere centrifuged 3 min at 10,000 g and 4�C, and activities weredetermined on the supernatant using a 96-well plate spectro-photometer at the appropriate wavelengths (Molecular Devices,Spectramax 340). Maximal enzyme activities were determinedfor GDH (in the amination direction), glutamine synthetase(GS), glutaminase (Glnase), alanine aminotransferase (AlaAt),aspartate aminotransferase (AspAt), and the OUC enzymes CPSIII, OCT, and arginase (Arg). It should also be noted thaturidine triphosphate was included in the reaction buffer forCPS III determinations to inhibit CPS II, which can lead tooverestimates of CPS III activity (Anderson 1995). All enzymeactivities are expressed as micromoles of product formed perminute per gram of wet tissue at 20�C (mmol min�1 g�1).
Western blotting was used to test the hypothesis that hepaticGDH protein quantity increased following metamorphosis.Frozen livers (�80�C) from ammocoete, parasitic, and up-stream migrant sea lampreys were homogenized 1 min on icein 4 vols of homogenization buffer (composition: 50% glycerol;10 mmol L�1 HEPES; 20 mmol L�1 K2HPO4; 0.5 mmol L�1
EDTA; 1 mmol L�1 dithiothreitol; pH 7.5) containing the pro-tease inhibitor PMSF (2 mmol L�1), which was then dilutedfivefold to 10-fold in deionized water, boiled 5 min, cooled,and pulsed 30 s in a microcentrifuge. Total protein content ofthe supernatant was quantified using a commercial kit (Bicin-choninic Acid Protein Kit; Sigma Diagnostics BCA-1). Proteinswere then separated by SDS-polyacrylamide gel electrophoresis(SDS-PAGE; 140 V for 1 h) using 4%–20% TrisHCl Ready Gels(BioRad) after equal amounts of protein (10 mg) were addedto each respective well. Prestained broad-range molecularweight markers (Sigma; catalog C3437; 205,000–6,500 Da) wereused, while pure bovine liver GDH (10 mg mL�1; BoerhingerMannheim, catalog 127 710) was used to confirm antibodydetection and to provide a reference standard for subsequent
888 M. P. Wilkie, J. F. Claude, A. Cockshutt, J. A. Holmes, Y. S. Wang, J. H. Youson, and P. J. Walsh
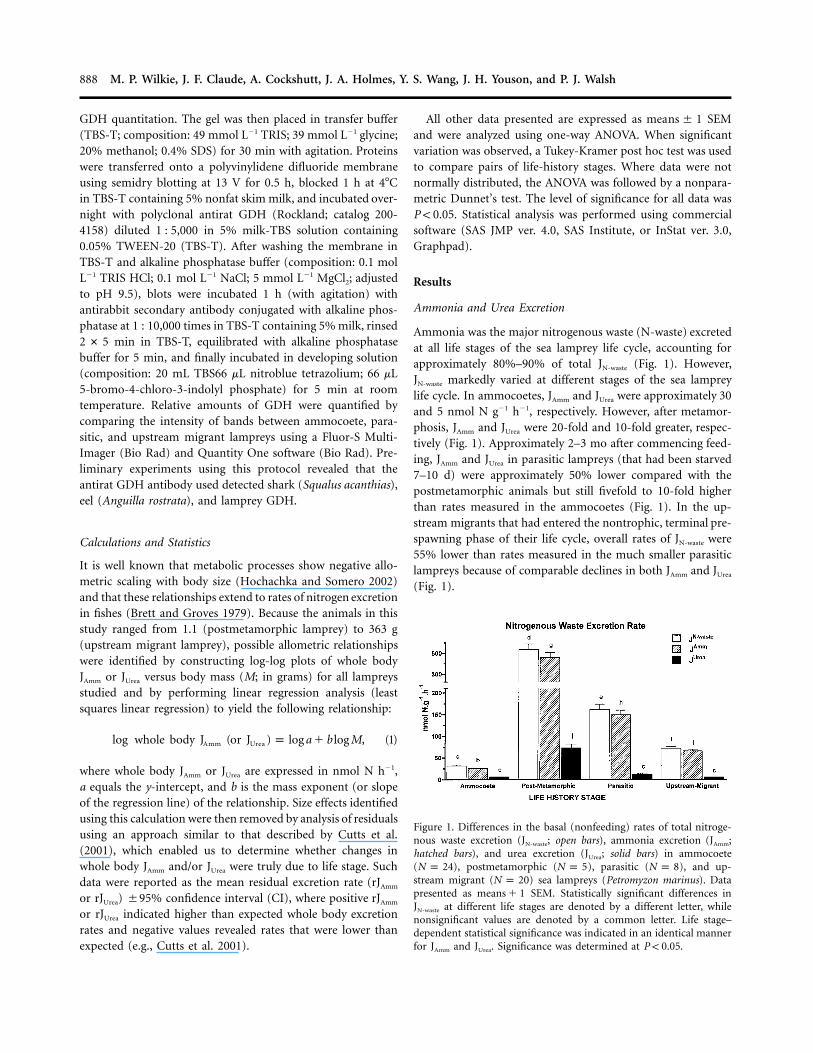
Figure 1. Differences in the basal (nonfeeding) rates of total nitroge-nous waste excretion (JN-waste; open bars), ammonia excretion (JAmm;hatched bars), and urea excretion (JUrea; solid bars) in ammocoete( ), postmetamorphic ( ), parasitic ( ), and up-N p 24 N p 5 N p 8stream migrant ( ) sea lampreys (Petromyzon marinus). DataN p 20presented as SEM. Statistically significant differences inmeans � 1JN-waste at different life stages are denoted by a different letter, whilenonsignificant values are denoted by a common letter. Life stage–dependent statistical significance was indicated in an identical mannerfor JAmm and JUrea. Significance was determined at .P ! 0.05
GDH quantitation. The gel was then placed in transfer buffer(TBS-T; composition: 49 mmol L�1 TRIS; 39 mmol L�1 glycine;20% methanol; 0.4% SDS) for 30 min with agitation. Proteinswere transferred onto a polyvinylidene difluoride membraneusing semidry blotting at 13 V for 0.5 h, blocked 1 h at 4�Cin TBS-T containing 5% nonfat skim milk, and incubated over-night with polyclonal antirat GDH (Rockland; catalog 200-4158) diluted 1 : 5,000 in 5% milk-TBS solution containing0.05% TWEEN-20 (TBS-T). After washing the membrane inTBS-T and alkaline phosphatase buffer (composition: 0.1 molL�1 TRIS HCl; 0.1 mol L�1 NaCl; 5 mmol L�1 MgCl2; adjustedto pH 9.5), blots were incubated 1 h (with agitation) withantirabbit secondary antibody conjugated with alkaline phos-phatase at 1 : 10,000 times in TBS-T containing 5% milk, rinsed
min in TBS-T, equilibrated with alkaline phosphatase2 # 5buffer for 5 min, and finally incubated in developing solution(composition: 20 mL TBS66 mL nitroblue tetrazolium; 66 mL5-bromo-4-chloro-3-indolyl phosphate) for 5 min at roomtemperature. Relative amounts of GDH were quantified bycomparing the intensity of bands between ammocoete, para-sitic, and upstream migrant lampreys using a Fluor-S Multi-Imager (Bio Rad) and Quantity One software (Bio Rad). Pre-liminary experiments using this protocol revealed that theantirat GDH antibody used detected shark (Squalus acanthias),eel (Anguilla rostrata), and lamprey GDH.
Calculations and Statistics
It is well known that metabolic processes show negative allo-metric scaling with body size (Hochachka and Somero 2002)and that these relationships extend to rates of nitrogen excretionin fishes (Brett and Groves 1979). Because the animals in thisstudy ranged from 1.1 (postmetamorphic lamprey) to 363 g(upstream migrant lamprey), possible allometric relationshipswere identified by constructing log-log plots of whole bodyJAmm or JUrea versus body mass (M; in grams) for all lampreysstudied and by performing linear regression analysis (leastsquares linear regression) to yield the following relationship:
log whole body J (or J ) p log a � b log M, (1)Amm Urea
where whole body JAmm or JUrea are expressed in nmol N h�1,a equals the y-intercept, and b is the mass exponent (or slopeof the regression line) of the relationship. Size effects identifiedusing this calculation were then removed by analysis of residualsusing an approach similar to that described by Cutts et al.(2001), which enabled us to determine whether changes inwhole body JAmm and/or JUrea were truly due to life stage. Suchdata were reported as the mean residual excretion rate (rJAmm
or rJUrea) �95% confidence interval (CI), where positive rJAmm
or rJUrea indicated higher than expected whole body excretionrates and negative values revealed rates that were lower thanexpected (e.g., Cutts et al. 2001).
All other data presented are expressed as SEMmeans � 1and were analyzed using one-way ANOVA. When significantvariation was observed, a Tukey-Kramer post hoc test was usedto compare pairs of life-history stages. Where data were notnormally distributed, the ANOVA was followed by a nonpara-metric Dunnet’s test. The level of significance for all data was
. Statistical analysis was performed using commercialP ! 0.05software (SAS JMP ver. 4.0, SAS Institute, or InStat ver. 3.0,Graphpad).
Results
Ammonia and Urea Excretion
Ammonia was the major nitrogenous waste (N-waste) excretedat all life stages of the sea lamprey life cycle, accounting forapproximately 80%–90% of total JN-waste (Fig. 1). However,JN-waste markedly varied at different stages of the sea lampreylife cycle. In ammocoetes, JAmm and JUrea were approximately 30and 5 nmol N g�1 h�1, respectively. However, after metamor-phosis, JAmm and JUrea were 20-fold and 10-fold greater, respec-tively (Fig. 1). Approximately 2–3 mo after commencing feed-ing, JAmm and JUrea in parasitic lampreys (that had been starved7–10 d) were approximately 50% lower compared with thepostmetamorphic animals but still fivefold to 10-fold higherthan rates measured in the ammocoetes (Fig. 1). In the up-stream migrants that had entered the nontrophic, terminal pre-spawning phase of their life cycle, overall rates of JN-waste were55% lower than rates measured in the much smaller parasiticlampreys because of comparable declines in both JAmm and JUrea
(Fig. 1).
Effects of Life-History Stage on Nitrogen Metabolism in Lampreys 889
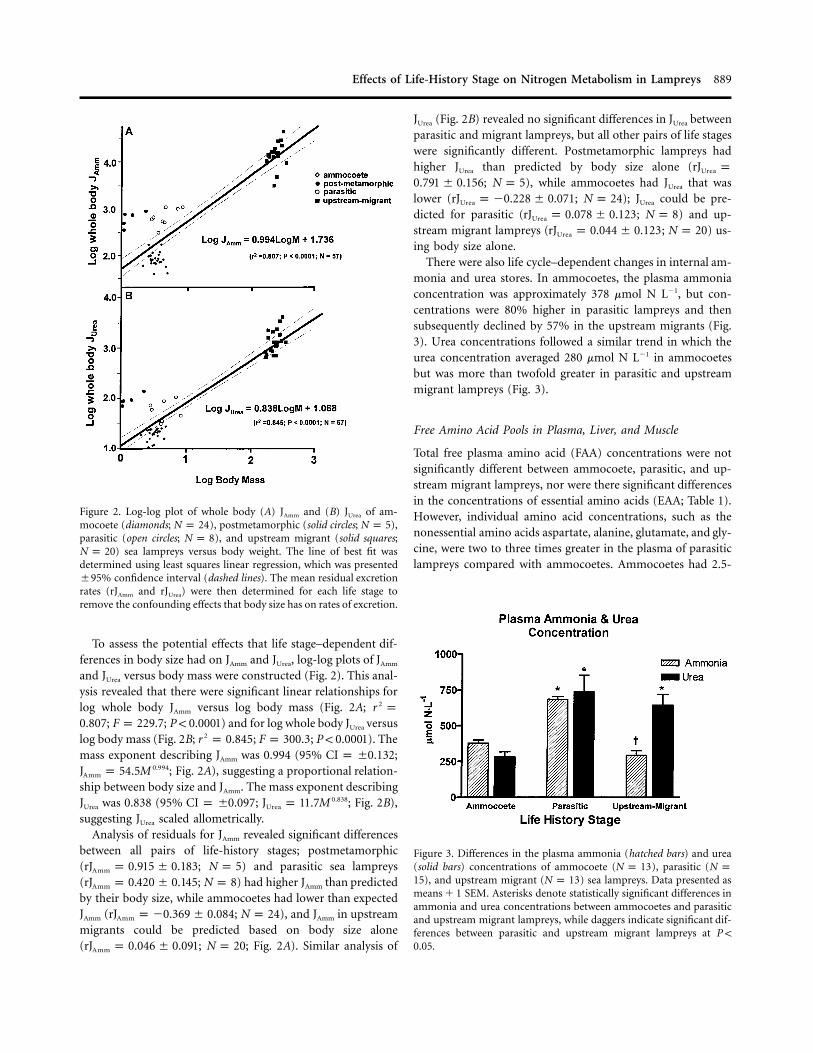
Figure 2. Log-log plot of whole body (A) JAmm and (B) JUrea of am-mocoete (diamonds; ), postmetamorphic (solid circles; ),N p 24 N p 5parasitic (open circles; ), and upstream migrant (solid squares;N p 8
) sea lampreys versus body weight. The line of best fit wasN p 20determined using least squares linear regression, which was presented�95% confidence interval (dashed lines). The mean residual excretionrates (rJAmm and rJUrea) were then determined for each life stage toremove the confounding effects that body size has on rates of excretion.
Figure 3. Differences in the plasma ammonia (hatched bars) and urea(solid bars) concentrations of ammocoete ( ), parasitic (N p 13 N p
), and upstream migrant ( ) sea lampreys. Data presented as15 N p 13SEM. Asterisks denote statistically significant differences inmeans � 1
ammonia and urea concentrations between ammocoetes and parasiticand upstream migrant lampreys, while daggers indicate significant dif-ferences between parasitic and upstream migrant lampreys at P !
.0.05
To assess the potential effects that life stage–dependent dif-ferences in body size had on JAmm and JUrea, log-log plots of JAmm
and JUrea versus body mass were constructed (Fig. 2). This anal-ysis revealed that there were significant linear relationships forlog whole body JAmm versus log body mass (Fig. 2A; 2r p
; ; ) and for log whole body JUrea versus0.807 F p 229.7 P ! 0.0001log body mass (Fig. 2B; ; ; ). The2r p 0.845 F p 300.3 P ! 0.0001mass exponent describing JAmm was 0.994 (95% ;CI p �0.132
; Fig. 2A), suggesting a proportional relation-0.994J p 54.5MAmm
ship between body size and JAmm. The mass exponent describingJUrea was 0.838 (95% ; ; Fig. 2B),0.838CI p �0.097 J p 11.7MUrea
suggesting JUrea scaled allometrically.Analysis of residuals for JAmm revealed significant differences
between all pairs of life-history stages; postmetamorphic( ; ) and parasitic sea lampreysrJ p 0.915 � 0.183 N p 5Amm
( ; ) had higher JAmm than predictedrJ p 0.420 � 0.145 N p 8Amm
by their body size, while ammocoetes had lower than expectedJAmm ( ; ), and JAmm in upstreamrJ p �0.369 � 0.084 N p 24Amm
migrants could be predicted based on body size alone( ; ; Fig. 2A). Similar analysis ofrJ p 0.046 � 0.091 N p 20Amm
JUrea (Fig. 2B) revealed no significant differences in JUrea betweenparasitic and migrant lampreys, but all other pairs of life stageswere significantly different. Postmetamorphic lampreys hadhigher JUrea than predicted by body size alone (rJ pUrea
; ), while ammocoetes had JUrea that was0.791 � 0.156 N p 5lower ( ; ); JUrea could be pre-rJ p �0.228 � 0.071 N p 24Urea
dicted for parasitic ( ; ) and up-rJ p 0.078 � 0.123 N p 8Urea
stream migrant lampreys ( ; ) us-rJ p 0.044 � 0.123 N p 20Urea
ing body size alone.There were also life cycle–dependent changes in internal am-
monia and urea stores. In ammocoetes, the plasma ammoniaconcentration was approximately 378 mmol N L�1, but con-centrations were 80% higher in parasitic lampreys and thensubsequently declined by 57% in the upstream migrants (Fig.3). Urea concentrations followed a similar trend in which theurea concentration averaged 280 mmol N L�1 in ammocoetesbut was more than twofold greater in parasitic and upstreammigrant lampreys (Fig. 3).
Free Amino Acid Pools in Plasma, Liver, and Muscle
Total free plasma amino acid (FAA) concentrations were notsignificantly different between ammocoete, parasitic, and up-stream migrant lampreys, nor were there significant differencesin the concentrations of essential amino acids (EAA; Table 1).However, individual amino acid concentrations, such as thenonessential amino acids aspartate, alanine, glutamate, and gly-cine, were two to three times greater in the plasma of parasiticlampreys compared with ammocoetes. Ammocoetes had 2.5-

890 M. P. Wilkie, J. F. Claude, A. Cockshutt, J. A. Holmes, Y. S. Wang, J. H. Youson, and P. J. Walsh
Table 1: Amino acid concentrations (mmol g�1 wet weight) in the plasma ofammocoete, parasitic, and upstream migrant sea lampreys
Amino AcidAmmocoete( )N p 8
Parasitic( )N p 6
Upstream Migrant( )N p 6
Alanine .079 � .008 .228 � .080* .066 � .012Arginine .072 � .005 .054 � .008 .052 � .006Aspartate .007 � .005 .016 � .002* .004 � .002Glutamine .029 � .007 .069 � .020 .122 � .020*Glutamate .007 � .005 .029 � .002* .001 � .000**Glycine .085 � .016 .167 � .027* .093 � .010Histidine .119 � .013 .045 � .003* .016 � .004*Isoleucine .050 � .006 .078 � .008* .072 � .007Leucine .087 � .011 .180 � .011* .110 � .013**Lysine .097 � .008 .134 � .015 .166 � .023*Methionine .032 � .005 .047 � .002 .028 � .005Phenylalanine .024 � .003 .040 � .002 .058 � .007*Serine .057 � .014 .068 � .006 .059 � .011Threonine .149 � .123 .067 � .007* .071 � .007*Tyrosine .034 � .003 .029 � .003 .037 � .007Valine .099 � .012 .180 � .010 .095 � .014Total free amino acids 1.027 � .105 1.355 � .092 1.049 � .056Total essential amino acids .729 � .063 .751 � .047 .667 � .036
Note. Essential amino acids in italic.
* Statistically significant difference from ammocoetes ( ).P ! 0.05
** Statistically significant difference from parasitic sea lampreys ( ).P ! 0.05
fold greater concentrations of the EAAs histidine and threonine(Table 1). Although upstream migrant lampreys had not likelyfed for at least 3–4 mo (see “Discussion”), plasma amino acids,including EAAs, were similar to concentrations measured inthe parasitic lampreys. One exception was glutamate, whichwas approximately 30-fold greater in the plasma of the parasiticlamprey (Table 1).
The more or less constant plasma amino acid concentrationsin the plasma were in marked contrast to the liver, where totalFAAs in parasitic lampreys were more than threefold higherthan those in ammocoetes (Table 2). However, the total FAAswere about 25% lower in the upstream migrant compared withthe parasitic lampreys. The largest changes observed were thenonessential amino acids alanine, aspartate, and glutamate,which were fivefold to 10-fold greater in the livers of parasiticlampreys than in ammocoetes (Table 2). Some of these aminoacids also differed significantly between the parasitic and up-stream migrant lampreys, in which the respective concentra-tions of alanine and glutamate were fourfold and twofoldgreater in parasitic lampreys. However, aspartate was approx-imately twofold greater in the upstream migrant lampreys (Ta-ble 2). Glutamine concentrations were approximately 30%lower in the liver of upstream migrant lampreys than in par-asitic lampreys (Table 2). In contrast to the total FAAs, totalEAA concentrations were comparable in parasitic and upstreammigrant lampreys but were approximately 30% lower in am-
mocoetes (Table 2). Notably, arginine was threefold greater inthe liver of parasitic and upstream migrant sea lampreys thanin ammocoetes (Table 2).
The total FAA pool was 1.5–2.0 times greater in the muscleof upstream migrant lampreys than in the muscle of ammo-coetes and parasitic lampreys, respectively (Table 3). This resultwas mainly due to significant increases in the nonessentialamino acids alanine, aspartate, glutamate, and glycine. Argininewas the only EAA to increase in upstream migrant lampreys,where it was approximately threefold greater than concentra-tions measured in ammocoetes and parasitic lampreys (Table3). However, respective total free EAAs in the muscle were 70%lower in parasitic lampreys and 40% lower in upstream migrantlampreys than they were in ammocoetes. This result was mainlydue to significantly lower concentrations of histidine, methi-onine, phenylalanine, threonine, and valine (Table 3).
Activities of Amino Acid Catabolizing Enzymes andGlutamate Dehydrogenase Quantification
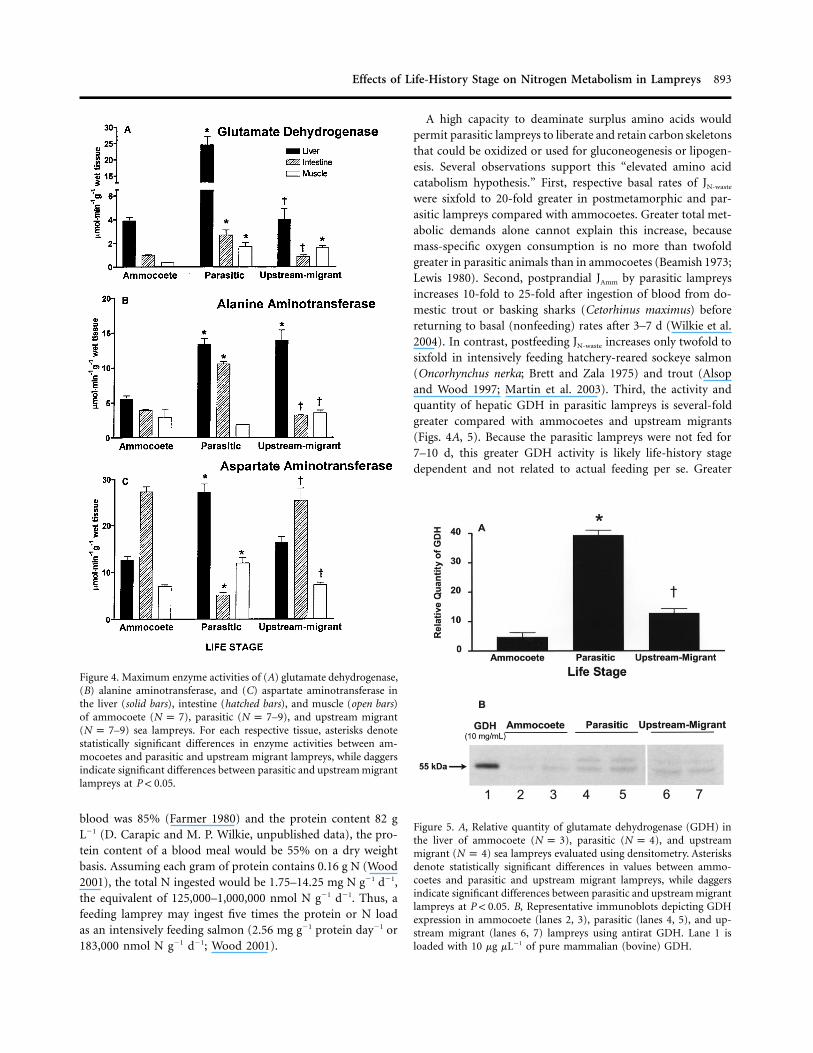
The maximum activity of enzymes associated with amino aciddeamination was influenced by life-history stage. The activityof GDH, which promotes the oxidative deamination of glu-tamate to ammonia and a-ketoglutarate, was sixfold greater inthe liver of parasitic lampreys compared with ammocoetes (Fig.4A). A similar, less pronounced pattern was observed in the

Effects of Life-History Stage on Nitrogen Metabolism in Lampreys 891
Table 2: Amino acid concentrations (mmol g�1 wet weight) in the liver of ammocoete,parasitic, and upstream migrant sea lampreys
Amino AcidAmmocoete( )N p 9
Parasitic( )N p 6
Upstream Migrant( )N p 7
Alanine .268 � .037 2.622 � .127* .636 � .054*,**Arginine .228 � .053 .679 � .049* .623 � .114*Aspartate .046 � .029 .174 � .052* .420 � .068*,**Glutamine .473 � .074 .923 � .260 .288 � .052**Glutamate .321 � .145 2.592 � .395* 1.393 � .238*,**Glycine .354 � .052 1.924 � .106* 1.832 � .393*Histidine .072 � .028 .045 � .026 .037 � .005Isoleucine .054 � .006 .102 � .019* .090 � .011Leucine .085 � .008 .154 � .025 .272 � .068*Lysine .248 � .036 .189 � .026 .137 � .0190Methionine .101 � .024 .085 � .022 .064 � .013Phenylalanine .044 � .004 .061 � .006 .097 � .014*Serine .696 � .191 .641 � .097 .595 � .092Threonine … … …Tyrosine .198 � .018 .084 � .004* .200 � .048**Valine .129 � .013 .135 � .010 .168 � .018Total free amino acids 3.317 � .529 10.409 � .750* 6.847 � .507*,**Total essential amino acids .961 � .078 1.449 � .054* 1.482 � .183*
Note. Essential amino acids in italic.
* Statistically significant difference from ammocoetes ( ).P ! 0.05
** Statistically significant difference from parasitic sea lampreys ( ).P ! 0.05
intestine and muscle of parasitic lampreys, where GDH activ-ities were two to four times greater than in ammocoetes. Inupstream migrants, GDH activities in the liver and intestinewere significantly reduced compared with the parasitic animalsbut were comparable to activities measured in the ammocoeteliver (Fig. 4A). GDH activity in the muscle of the upstreammigrants was comparable to activities measured in parasiticlampreys but fourfold greater than rates in ammocoete muscle(Fig. 4A).
Similar trends were also observed for ammocoete and par-asitic lamprey hepatic AlaAT and AspAt, in which the activitiesof each enzyme were twofold to threefold greater in the parasiticlampreys (Fig. 4B, 4C). Differences in these two parameterswere less obvious between parasitic and upstream migrants,where hepatic AlaAT and AspAt activity were similar betweenthe two life stages (Fig. 4B, 4C). In the intestine, AlaAt activitywas twofold higher in parasitic lampreys than in ammocoetesand upstream migrant lampreys (Fig. 4B). However, intestinalAspAt activity was 80% lower in parasitic animals than it wasin ammocoetes and upstream migrants (Fig. 4C). AlaAt in mus-cle was slightly higher in upstream migrant compared withparasitic animals (Fig. 4B), while AspAt was about 50% higherin the parasitic phase compared with the ammocoetes and up-stream migrant stages (Fig. 4C).
Because of the pivotal role of hepatic GDH in amino acidcatabolism and ammonia generation in vertebrates, Western
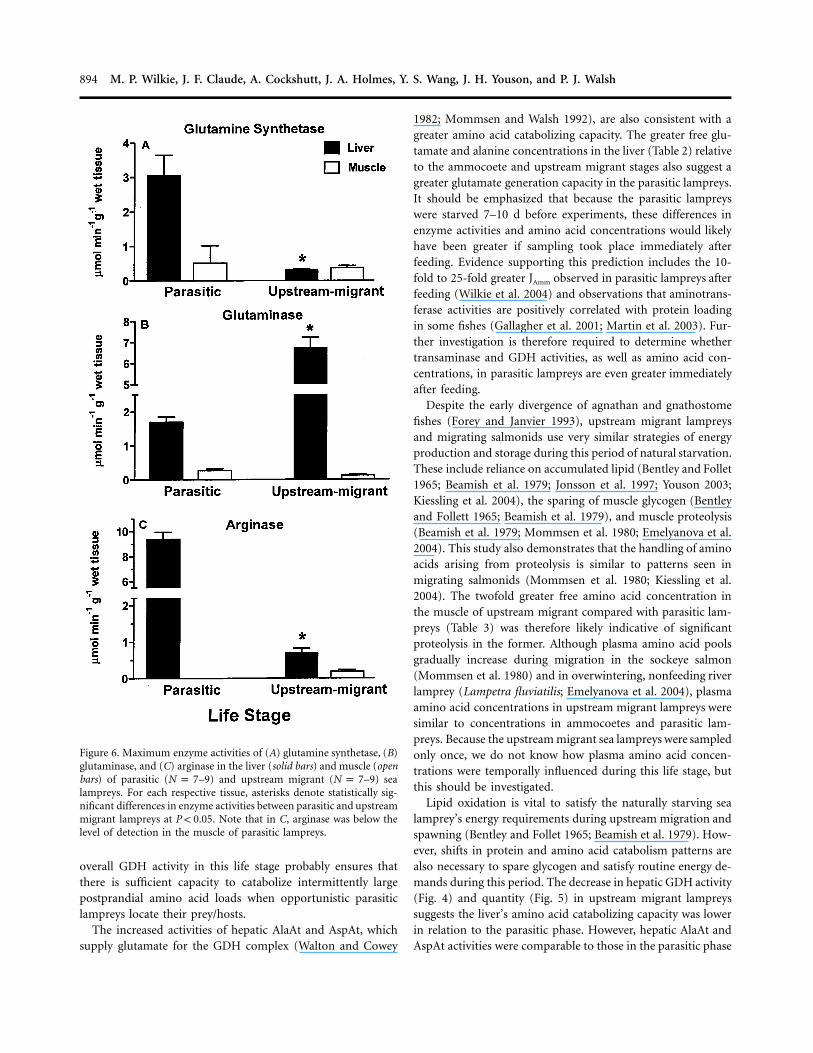
blots were performed to determine whether the observed in-creases in GDH activity in parasitic lampreys could be explainedby greater quantities of hepatic GDH or, alternatively, by post-translational modifications (Fig. 5). Indeed, GDH proteinquantity was greatest in the parasitic phase, where the relativeamounts of GDH were 10-fold and threefold greater than inammocoetes and upstream migrant lampreys, respectively (Fig.5). It should also be noted that the polyclonal antibody usedfor this analysis, which was raised against rat GDH, producedtwo bands in liver homogenates taken from all major stages ofthe lamprey life cycle (Fig. 5B) but single bands in the eel,dogfish, and rat liver (data not shown).
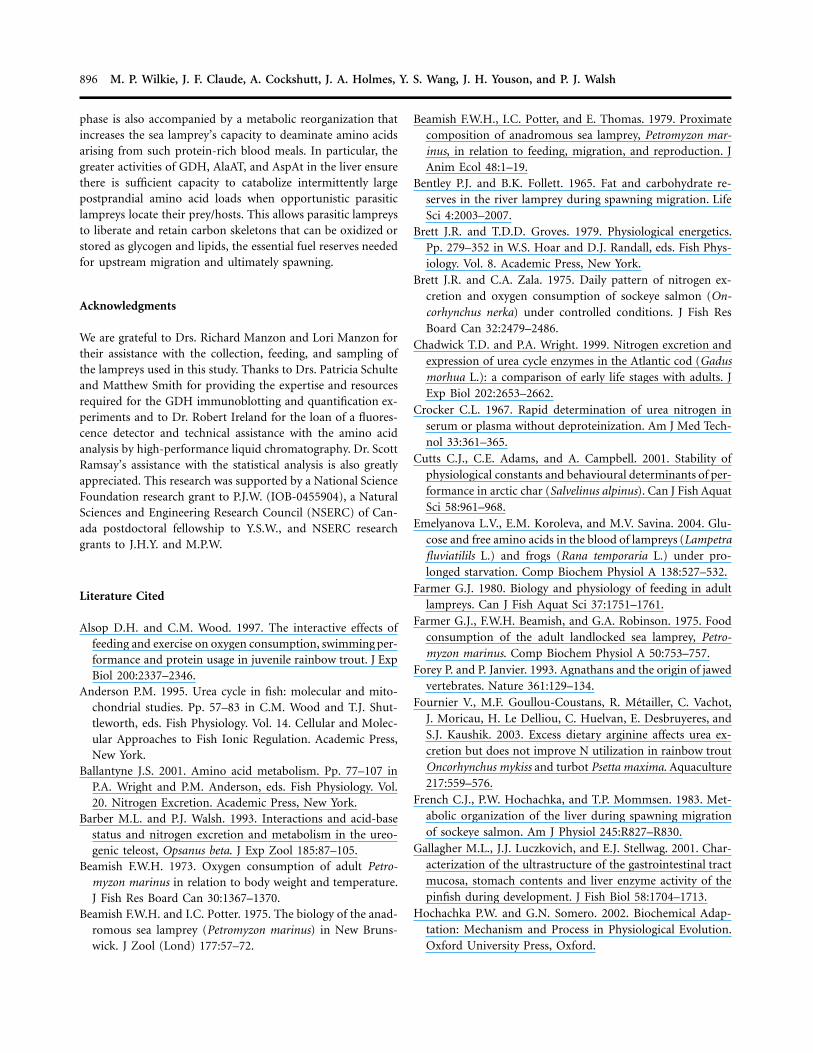
GS activity was relatively low in the muscle of parasitic andupstream migrant lampreys (Fig. 6A). However, GS activity was10-fold higher in the liver of parasitic lampreys than in theliver of upstream migrants (Fig. 6A). While Glnase activity wasrelatively low in the muscle, its activity was highest in the liverof upstream migrant lampreys, where Glnase activity was three-fold greater than in the liver of parasitic lampreys (Fig. 6B).
Arg was also detected in the liver and muscle in ammocoetes(data not shown) and upstream migrants (Fig. 6C), but atrelatively low levels. In contrast, Arg activities were approxi-mately 20-fold greater in the liver of parasitic animals (Fig. 6C).Notably, Arg activity was below detection in the muscle of theparasitic lamprey (Fig. 6C).

892 M. P. Wilkie, J. F. Claude, A. Cockshutt, J. A. Holmes, Y. S. Wang, J. H. Youson, and P. J. Walsh
Table 3: Amino acid concentrations (mmol g�1 wet weight) in the muscle ofammocoete, parasitic, and upstream migrant sea lampreys
Amino AcidAmmocoete( )N p 8
Parasitic( )N p 8
Upstream Migrant( )N p 6
Alanine .313 � .038 1.397 � .110* 2.008 � .088*,**Arginine .392 � .127 .471 � .149 1.209 � .161*,**Aspartate .095 � .032 .036 � .012 .389 � .095 **Glutamine .315 � .027 .320 � .074 .602 � .141Glutamate .309 � .052 .641 � .153 1.613 � .312*Glycine .370 � .045 .494 � .085 2.062 � .113*,**Histidine .228 � .038 .032 � .010* .007 � .006*Isoleucine .129 � .017 .069 � .011 .100 � .023Leucine .194 � .026 .115 � .021 .162 � .028Lysine .401 � .101 .191 � .034 .266 � .120Methionine 1.010 � .108 .093 � .029* .092 � .019*Phenylalanine .175 � .027 .042 � .009* .108 � .018*Serine .487 � .028 .079 � .025* .255 � .081Threonine .976 � .193 .107 � .025* .275 � .069*Tyrosine .197 � .038 .043 � .006* .100 � .012Valine .339 � .048 .110 � .019* .144 � .023*Total free amino acids 5.930 � .478 4.240 � .467 9.390 � .957*,**Total essential amino acids 3.845 � .334 1.230 � .189* 2.362 � .357*
Note. Essential amino acids in italic.
* Statistically significant difference from ammocoetes ( ).P ! 0.05
** Statistically significant difference from parasitic sea lampreys ( ).P ! 0.05
Hepatic versus Extrahepatic Urea Production
Although the key enzyme of the OUC, CPS III, was detectedin the liver of upstream migrant lampreys (mean activity p
mmol min�1 g�1; ), OCT was below de-0.004 � 0.001 N p 8tection (data not shown). CPS III and OCT were also belowdetection in the muscle and intestine of ammocoete, parasitic,and upstream migrant lampreys (data not shown).
Discussion
The greater mass-specific rates (expressed in nmol N g�1 h�1)of JAmm and JUrea in postmetamorphic and parasitic sea lampreyscompared with ammocoetes likely reflect a true elevation ofN-waste production rates and amino acid catabolism capacity(Fig. 1). This premise is supported by two lines of evidence.First, whole body JAmm and JUrea (expressed as nmol N h�1)increased with body mass when all life stages of the sea lampreywere considered (Fig. 2), as expected. However, when the effectsof body mass were removed using residual analysis, whole bodyJAmm and JUrea were lower than expected in ammocoetes butgreater than expected in postmetamorphic and parasitic lam-preys (Fig. 2), suggesting the increases were truly life stagedependent. Second, unlike JAmm and JUrea in this study, mostmass-specific rates (e.g., excretion rates, oxygen consumption)and enzyme activities in animals, with the exception of anaer-obic glycolysis in fish locomotory muscle, decrease with body
size (Brett and Groves 1979; Hochachka and Somero 2002). Inother words, had excretion rates followed the allometric rela-tionships of other animals, mass-specific rates would have de-creased, not increased. Thus, the increases in mass-specific ex-cretion rates, as well as tissue enzyme activities, observedfollowing metamorphosis reflect real life stage differences.
The much lower JN-waste of burrow-dwelling ammocoetescompared with parasitic and upstream migrant lampreys islikely associated with their low metabolic rate (Potter and Rog-ers 1972; Holmes and Lin 1994; Wilkie et al. 2001), which isabout 50% lower than in comparably sized lampreys imme-diately following metamorphosis (Lewis 1980). Because the am-mocoete diet is mainly detritus of low nutritive value, digestiontakes much longer in this life stage (Sutton and Bowen 1994).This factor, plus lower energy demands (Lewis 1980), is likelyaccompanied by lower basal rates of amino acid catabolism.The low activities of amino acid catabolizing enzymes such asGDH and AlaAt in liver, intestine, and muscle further supportthis hypothesis.
Following metamorphosis, amino acid catabolizing capacityis markedly elevated when sea lampreys ingest large amountsof protein-rich blood as they parasitize fishes. Indeed, parasiticsea lampreys in the size range examined (5–10 g) consumeblood at rates ranging from 2.0% to 16.3% of their body weightper day on a dry weight basis while feeding on salmonids (Far-mer et al. 1975). Thus, if the water content of trout whole
Effects of Life-History Stage on Nitrogen Metabolism in Lampreys 893
Figure 4. Maximum enzyme activities of (A) glutamate dehydrogenase,(B) alanine aminotransferase, and (C) aspartate aminotransferase inthe liver (solid bars), intestine (hatched bars), and muscle (open bars)of ammocoete ( ), parasitic ( –9), and upstream migrantN p 7 N p 7( –9) sea lampreys. For each respective tissue, asterisks denoteN p 7statistically significant differences in enzyme activities between am-mocoetes and parasitic and upstream migrant lampreys, while daggersindicate significant differences between parasitic and upstream migrantlampreys at .P ! 0.05
Figure 5. A, Relative quantity of glutamate dehydrogenase (GDH) inthe liver of ammocoete ( ), parasitic ( ), and upstreamN p 3 N p 4migrant ( ) sea lampreys evaluated using densitometry. AsterisksN p 4denote statistically significant differences in values between ammo-coetes and parasitic and upstream migrant lampreys, while daggersindicate significant differences between parasitic and upstream migrantlampreys at . B, Representative immunoblots depicting GDHP ! 0.05expression in ammocoete (lanes 2, 3), parasitic (lanes 4, 5), and up-stream migrant (lanes 6, 7) lampreys using antirat GDH. Lane 1 isloaded with 10 mg mL�1 of pure mammalian (bovine) GDH.
blood was 85% (Farmer 1980) and the protein content 82 gL�1 (D. Carapic and M. P. Wilkie, unpublished data), the pro-tein content of a blood meal would be 55% on a dry weightbasis. Assuming each gram of protein contains 0.16 g N (Wood2001), the total N ingested would be 1.75–14.25 mg N g�1 d�1,the equivalent of 125,000–1,000,000 nmol N g�1 d�1. Thus, afeeding lamprey may ingest five times the protein or N loadas an intensively feeding salmon (2.56 mg g�1 protein day�1 or183,000 nmol N g�1 d�1; Wood 2001).
A high capacity to deaminate surplus amino acids wouldpermit parasitic lampreys to liberate and retain carbon skeletonsthat could be oxidized or used for gluconeogenesis or lipogen-esis. Several observations support this “elevated amino acidcatabolism hypothesis.” First, respective basal rates of JN-waste
were sixfold to 20-fold greater in postmetamorphic and par-asitic lampreys compared with ammocoetes. Greater total met-abolic demands alone cannot explain this increase, becausemass-specific oxygen consumption is no more than twofoldgreater in parasitic animals than in ammocoetes (Beamish 1973;Lewis 1980). Second, postprandial JAmm by parasitic lampreysincreases 10-fold to 25-fold after ingestion of blood from do-mestic trout or basking sharks (Cetorhinus maximus) beforereturning to basal (nonfeeding) rates after 3–7 d (Wilkie et al.2004). In contrast, postfeeding JN-waste increases only twofold tosixfold in intensively feeding hatchery-reared sockeye salmon(Oncorhynchus nerka; Brett and Zala 1975) and trout (Alsopand Wood 1997; Martin et al. 2003). Third, the activity andquantity of hepatic GDH in parasitic lampreys is several-foldgreater compared with ammocoetes and upstream migrants(Figs. 4A, 5). Because the parasitic lampreys were not fed for7–10 d, this greater GDH activity is likely life-history stagedependent and not related to actual feeding per se. Greater
894 M. P. Wilkie, J. F. Claude, A. Cockshutt, J. A. Holmes, Y. S. Wang, J. H. Youson, and P. J. Walsh
Figure 6. Maximum enzyme activities of (A) glutamine synthetase, (B)glutaminase, and (C) arginase in the liver (solid bars) and muscle (openbars) of parasitic ( –9) and upstream migrant ( –9) seaN p 7 N p 7lampreys. For each respective tissue, asterisks denote statistically sig-nificant differences in enzyme activities between parasitic and upstreammigrant lampreys at . Note that in C, arginase was below theP ! 0.05level of detection in the muscle of parasitic lampreys.
overall GDH activity in this life stage probably ensures thatthere is sufficient capacity to catabolize intermittently largepostprandial amino acid loads when opportunistic parasiticlampreys locate their prey/hosts.
The increased activities of hepatic AlaAt and AspAt, whichsupply glutamate for the GDH complex (Walton and Cowey
1982; Mommsen and Walsh 1992), are also consistent with agreater amino acid catabolizing capacity. The greater free glu-tamate and alanine concentrations in the liver (Table 2) relativeto the ammocoete and upstream migrant stages also suggest agreater glutamate generation capacity in the parasitic lampreys.It should be emphasized that because the parasitic lampreyswere starved 7–10 d before experiments, these differences inenzyme activities and amino acid concentrations would likelyhave been greater if sampling took place immediately afterfeeding. Evidence supporting this prediction includes the 10-fold to 25-fold greater JAmm observed in parasitic lampreys afterfeeding (Wilkie et al. 2004) and observations that aminotrans-ferase activities are positively correlated with protein loadingin some fishes (Gallagher et al. 2001; Martin et al. 2003). Fur-ther investigation is therefore required to determine whethertransaminase and GDH activities, as well as amino acid con-centrations, in parasitic lampreys are even greater immediatelyafter feeding.
Despite the early divergence of agnathan and gnathostomefishes (Forey and Janvier 1993), upstream migrant lampreysand migrating salmonids use very similar strategies of energyproduction and storage during this period of natural starvation.These include reliance on accumulated lipid (Bentley and Follet1965; Beamish et al. 1979; Jonsson et al. 1997; Youson 2003;Kiessling et al. 2004), the sparing of muscle glycogen (Bentleyand Follett 1965; Beamish et al. 1979), and muscle proteolysis(Beamish et al. 1979; Mommsen et al. 1980; Emelyanova et al.2004). This study also demonstrates that the handling of aminoacids arising from proteolysis is similar to patterns seen inmigrating salmonids (Mommsen et al. 1980; Kiessling et al.2004). The twofold greater free amino acid concentration inthe muscle of upstream migrant compared with parasitic lam-preys (Table 3) was therefore likely indicative of significantproteolysis in the former. Although plasma amino acid poolsgradually increase during migration in the sockeye salmon(Mommsen et al. 1980) and in overwintering, nonfeeding riverlamprey (Lampetra fluviatilis; Emelyanova et al. 2004), plasmaamino acid concentrations in upstream migrant lampreys weresimilar to concentrations in ammocoetes and parasitic lam-preys. Because the upstream migrant sea lampreys were sampledonly once, we do not know how plasma amino acid concen-trations were temporally influenced during this life stage, butthis should be investigated.
Lipid oxidation is vital to satisfy the naturally starving sealamprey’s energy requirements during upstream migration andspawning (Bentley and Follet 1965; Beamish et al. 1979). How-ever, shifts in protein and amino acid catabolism patterns arealso necessary to spare glycogen and satisfy routine energy de-mands during this period. The decrease in hepatic GDH activity(Fig. 4) and quantity (Fig. 5) in upstream migrant lampreyssuggests the liver’s amino acid catabolizing capacity was lowerin relation to the parasitic phase. However, hepatic AlaAt andAspAt activities were comparable to those in the parasitic phase

Effects of Life-History Stage on Nitrogen Metabolism in Lampreys 895
(Fig. 4), suggesting that the liver’s transamination capacity wasunaltered. Because alanine is the major gluconeogenic substratein fishes (Ballantyne 2001), maintaining AlaAt activity couldbe essential for maintaining hepatic gluconeogenic capacity(LeBlanc et al. 1995) during natural starvation in upstreammigrants.
As first proposed in the migrating sockeye salmon (Momm-sen et al. 1980; French et al. 1983; Mommsen 2003), alanineis likely the major carrier of amino acid carbon and nitrogento gluconeogenic and ammoniogenic tissues such as the liverin the upstream migrant lamprey. In this model, the majorityof free amino acids liberated by muscle proteolysis are trans-aminated to various citric acid cycle intermediates, convertedto pyruvate, and then transformed to alanine via AlaAt. Thealanine is then transported to the liver, where it is transaminatedto glutamate, yielding pyruvate that is either oxidized or usedfor gluconeogenesis. Three observations in this study supportthis “alanine shuttle” model in upstream migrant sea lampreys.First, free alanine concentrations in the muscle of upstreammigrant lampreys were greater than in the parasitic phase andcomparable to increases measured in white and red muscle ofmigrating sockeye salmon (Mommsen et al. 1980). Second, theAlaAt activity in the muscle of upstream migrant lampreys wastwofold greater than in parasites, lying between values reportedfor the red muscle and white muscle of the sockeye (Mommsenet al. 1980). Finally, glutamate concentrations were threefoldgreater in the muscle of upstream migrant than in parasiticlampreys. For the “alanine shuttle” model to be viable, suchglutamate would be essential for driving alanine formation viaAlaAt.
One possible source of glutamate is through the hydrolysisof glutamine via Glnase. LeBlanc et al. (1995) reported thatGlnase activities were one to three orders of magnitude greaterthan GS in the muscle and liver of upstream migrant sea lam-prey, suggesting that net glutamine catabolism in these tissuesled to net glutamate formation. While the Glnase activities inthe muscle and liver of upstream migrant sea lampreys in thisstudy (Fig. 6) were comparable to those reported by LeBlancet al. (1995), the tissue GS activities we report were fivefold to20-fold greater. However, it should be noted that the GS assayused in this study measured glutamyl transferase activity, notsynthetase activity, and was therefore an indirect index of actualGS activity (Shankar and Anderson 1985; Walsh 1996). Previousstudies have demonstrated that the ratio of transferase : syn-thetase activity is about 15 : 1 (Shankar and Anderson 1985;Walsh 1996). When GS activities are corrected using this ratio,the GS activities of both liver and muscle are approximately0.03 mmol min�1 g�1 in upstream migrant lampreys. As a result,the actual Glnase : GS ratio in both the liver (∼320 : 1) andmuscle (∼5 : 1) of upstream migrants favors net glutamine ca-tabolism, or glutamate production, in agreement with LeBlancet al. (1995).
This study demonstrates that urea accounts for about 10%–
20% of total N-waste excretion at all major stages of the sealamprey’s life cycle (Fig. 1). Read (1968) detected traces of ureain the urine of upstream migrant Pacific lampreys and attrib-uted it to arginine hydrolysis. Indeed, the threefold greater freearginine concentrations in the muscle of upstream migrant sealampreys compared with other life stages (Table 3) suggest sig-nificant arginine was generated from muscle proteolysis. Al-though detected at low levels, the Arg activity in the muscle ofupstream migrants (Fig. 6) would likely be sufficient to generatesmall amounts of urea from this larger, excess arginine pool.In addition, relatively high hepatic arginine concentrations, plussignificant Arg activity, likely contributed to urea formation inthe liver of the upstream migrants (Table 2; Fig. 6). In contrast,Arg activity was below detection in the muscle of parasiticlampreys (Fig. 6C). However, the much higher Arg activitiesin the liver of parasitic lampreys (Fig. 6C) compared with otherlife stages, plus high concentrations of arginine, suggest theremay be significant hepatic urea production via this route. Un-like the situation in upstream migrants, arginine is likely ac-quired from the diet as parasitic sea lampreys feed on the bloodof fishes (Wilkie et al. 2004). Indeed, greater dietary arginineloads have been reported to increase plasma urea and JUrea inrainbow trout and turbot (Psetta maxima; Fournier et al. 2003).An additional explanation is that JUrea by parasitic lampreysarises from the coingestion of urea as they ingest blood fromteleosts or perhaps elasmobranchs (Wilkie et al. 2004). Forinstance, plasma urea concentrations may approach 5 mmol NL�1 in trout (Wilkie and Wood 1991) and range from 600 to700 mmol N L�1 in elasmobranchs (Schmidt-Nielsen et al. 1972;Wood et al. 1995).
Urea production in the sea lamprey does not appear to bedue to the OUC. Key OUC enzymes such as CPS III and OCTwere either not present or not detectable in the liver, as inammocoetes (Wilkie et al. 1999), or, in the case of parasitic(Wilkie et al. 2004) and upstream migrant lampreys, active onlyat low levels. Nor does it appear that extrahepatic tissues con-tribute to OUC-derived urea production in the lamprey dueto the absence of CPS III and OCT activity in muscle andintestine. Nevertheless, the possibility that OUC enzymes areactivated during earlier stages of embryonic or larval devel-opment—or even during metamorphosis, when there is a majorreorganization of the kidneys, liver, and gills (Youson 1980;Rovainen 1996)—remains to be elucidated. Indeed, CPS IIIand OCT activities are greatest in the tissues of larval embryoniccod and trout before declining in later life stages (Wright et al.1995; Chadwick and Wright 1999).
The life history and body structure of the lamprey has beenhighly conserved for at least 350 million years (Forey and Jan-vier 1993). Part of this success is due to adaptations such as ahighly specialized oral disc and rasping tongue and the secretionof the anticoagulant lamphredin (Farmer 1980), which allowsparasitic lampreys to attach to and feed on the blood of fishes(Rovainen 1996). We demonstrate that the onset of the parasitic
896 M. P. Wilkie, J. F. Claude, A. Cockshutt, J. A. Holmes, Y. S. Wang, J. H. Youson, and P. J. Walsh
phase is also accompanied by a metabolic reorganization thatincreases the sea lamprey’s capacity to deaminate amino acidsarising from such protein-rich blood meals. In particular, thegreater activities of GDH, AlaAT, and AspAt in the liver ensurethere is sufficient capacity to catabolize intermittently largepostprandial amino acid loads when opportunistic parasiticlampreys locate their prey/hosts. This allows parasitic lampreysto liberate and retain carbon skeletons that can be oxidized orstored as glycogen and lipids, the essential fuel reserves neededfor upstream migration and ultimately spawning.
Acknowledgments
We are grateful to Drs. Richard Manzon and Lori Manzon fortheir assistance with the collection, feeding, and sampling ofthe lampreys used in this study. Thanks to Drs. Patricia Schulteand Matthew Smith for providing the expertise and resourcesrequired for the GDH immunoblotting and quantification ex-periments and to Dr. Robert Ireland for the loan of a fluores-cence detector and technical assistance with the amino acidanalysis by high-performance liquid chromatography. Dr. ScottRamsay’s assistance with the statistical analysis is also greatlyappreciated. This research was supported by a National ScienceFoundation research grant to P.J.W. (IOB-0455904), a NaturalSciences and Engineering Research Council (NSERC) of Can-ada postdoctoral fellowship to Y.S.W., and NSERC researchgrants to J.H.Y. and M.P.W.
Literature Cited
Alsop D.H. and C.M. Wood. 1997. The interactive effects offeeding and exercise on oxygen consumption, swimming per-formance and protein usage in juvenile rainbow trout. J ExpBiol 200:2337–2346.
Anderson P.M. 1995. Urea cycle in fish: molecular and mito-chondrial studies. Pp. 57–83 in C.M. Wood and T.J. Shut-tleworth, eds. Fish Physiology. Vol. 14. Cellular and Molec-ular Approaches to Fish Ionic Regulation. Academic Press,New York.
Ballantyne J.S. 2001. Amino acid metabolism. Pp. 77–107 inP.A. Wright and P.M. Anderson, eds. Fish Physiology. Vol.20. Nitrogen Excretion. Academic Press, New York.
Barber M.L. and P.J. Walsh. 1993. Interactions and acid-basestatus and nitrogen excretion and metabolism in the ureo-genic teleost, Opsanus beta. J Exp Zool 185:87–105.
Beamish F.W.H. 1973. Oxygen consumption of adult Petro-myzon marinus in relation to body weight and temperature.J Fish Res Board Can 30:1367–1370.
Beamish F.W.H. and I.C. Potter. 1975. The biology of the anad-romous sea lamprey (Petromyzon marinus) in New Bruns-wick. J Zool (Lond) 177:57–72.
Beamish F.W.H., I.C. Potter, and E. Thomas. 1979. Proximatecomposition of anadromous sea lamprey, Petromyzon mar-inus, in relation to feeding, migration, and reproduction. JAnim Ecol 48:1–19.
Bentley P.J. and B.K. Follett. 1965. Fat and carbohydrate re-serves in the river lamprey during spawning migration. LifeSci 4:2003–2007.
Brett J.R. and T.D.D. Groves. 1979. Physiological energetics.Pp. 279–352 in W.S. Hoar and D.J. Randall, eds. Fish Phys-iology. Vol. 8. Academic Press, New York.
Brett J.R. and C.A. Zala. 1975. Daily pattern of nitrogen ex-cretion and oxygen consumption of sockeye salmon (On-corhynchus nerka) under controlled conditions. J Fish ResBoard Can 32:2479–2486.
Chadwick T.D. and P.A. Wright. 1999. Nitrogen excretion andexpression of urea cycle enzymes in the Atlantic cod (Gadusmorhua L.): a comparison of early life stages with adults. JExp Biol 202:2653–2662.
Crocker C.L. 1967. Rapid determination of urea nitrogen inserum or plasma without deproteinization. Am J Med Tech-nol 33:361–365.
Cutts C.J., C.E. Adams, and A. Campbell. 2001. Stability ofphysiological constants and behavioural determinants of per-formance in arctic char (Salvelinus alpinus). Can J Fish AquatSci 58:961–968.
Emelyanova L.V., E.M. Koroleva, and M.V. Savina. 2004. Glu-cose and free amino acids in the blood of lampreys (Lampetrafluviatilils L.) and frogs (Rana temporaria L.) under pro-longed starvation. Comp Biochem Physiol A 138:527–532.
Farmer G.J. 1980. Biology and physiology of feeding in adultlampreys. Can J Fish Aquat Sci 37:1751–1761.
Farmer G.J., F.W.H. Beamish, and G.A. Robinson. 1975. Foodconsumption of the adult landlocked sea lamprey, Petro-myzon marinus. Comp Biochem Physiol A 50:753–757.
Forey P. and P. Janvier. 1993. Agnathans and the origin of jawedvertebrates. Nature 361:129–134.
Fournier V., M.F. Goullou-Coustans, R. Metailler, C. Vachot,J. Moricau, H. Le Delliou, C. Huelvan, E. Desbruyeres, andS.J. Kaushik. 2003. Excess dietary arginine affects urea ex-cretion but does not improve N utilization in rainbow troutOncorhynchus mykiss and turbot Psetta maxima. Aquaculture217:559–576.
French C.J., P.W. Hochachka, and T.P. Mommsen. 1983. Met-abolic organization of the liver during spawning migrationof sockeye salmon. Am J Physiol 245:R827–R830.
Gallagher M.L., J.J. Luczkovich, and E.J. Stellwag. 2001. Char-acterization of the ultrastructure of the gastrointestinal tractmucosa, stomach contents and liver enzyme activity of thepinfish during development. J Fish Biol 58:1704–1713.
Hochachka P.W. and G.N. Somero. 2002. Biochemical Adap-tation: Mechanism and Process in Physiological Evolution.Oxford University Press, Oxford.
Effects of Life-History Stage on Nitrogen Metabolism in Lampreys 897
Holmes J.A. and P. Lin. 1994. Thermal niche of larval sea lam-prey, Petromyzon marinus. Can J Fish Aquat Sci 51:253–262.
Holmes J.A. and J.H. Youson. 1994. Fall condition factor andtemperature influence the incidence of metamorphosis in sealampreys, Petromyzon marinus. Can J Zool 72:1134–1140.
Jonsson N., B. Jonsson, and L.P. Hansen. 1997. Changes inproximate composition and estimates of energetic costs dur-ing upstream migration and spawning in Atlantic salmonSalmo salar. J Anim Ecol 66:425–436.
Julsrud E.A., P.J. Walsh, and P.M. Anderson. 1998. N-acetyl-l-glutamate and the urea cycle in gulf toadfish (Opsanus beta)and other fish. Arch Biochem Biophys 350:55–60.
Kajimura M., P.J. Walsh, T.P. Mommsen, and C.M. Wood. 2005.The dogfish shark (Squalus acanthias) increases both hepaticand extrahepatic ornithine urea cycle enzyme activities fornitrogen conservation after feeding. Physiol Biochem Zool79:602–613.
Kiessling A., K. Lindahl-Kiessling, and K.-H. Kiessling. 2004.Energy utilization and metabolism in migrating early Stuartsockeye salmon (Oncorhynchus nerka): the migratory para-dox. Can J Fish Aquat Sci 61:452–465.
Kong H., D.D. Edberg, J.J. Korte, W.L. Salo, P.A. Wright, andP.M. Anderson. 1998. Nitrogen excretion and expression ofcarbamoyl phosphate synthetase III activity and mRNA inextrahepatic tissues of largemouth bass (Micropterus salmo-ides). Arch Biochem Biophys 350:157–168.
Korte J.J., W.L. Salo, V.M. Cabrerra, P.A. Wright, A.K. Felskie,and P.M. Anderson. 1997. Expression of carbamoyl-phos-phate synthetase III mRNA during the early stages of de-velopment and in muscle of adult rainbow trout (Onco-rhynchus mykiss). J Biol Chem 272:6270–6277.
Larsen L.O. 1980. Physiology of adult lampreys with specialregard to natural starvation, reproduction and death afterspawning. Can J Fish Aquat Sci 37:1762–1779.
LeBlanc P.J., T.E. Gillis, M.F. Gerrits, and J.S. Ballantyne. 1995.Metabolic organization of somatic muscle of landlocked sealamprey, Petromyzon marinus, during the spawning migra-tion. Can J Zool 73:916–923.
Lewis S.V. 1980. Respiration of lampreys. Can J Fish Aquat Sci37:1711–1722.
Lindley T.E., C.L. Scheiderer, P.J. Walsh, C.M. Wood, H.L. Berg-man, A.L. Bergman, P. Laurent, P. Wilson, and P.M. Ander-son. 1999. Muscle as the primary site of urea cycle enzymeactivity in an alkaline lake-adapted tilapia, Oreochromis al-calicus grahami. J Biol Chem 274:29858–29861.
Martin S.A.M., O. Vilhelmsson, F. Medale, P. Watt, S. Kaushik,and D.F. Houlihan. 2003. Proteomic sensitivity to dietarymanipulations in rainbow trout. Biochim Biophys Acta 1651:17–29.
Mommsen T.P. 2003. Salmon spawning and migration andmuscle protein metabolism: the August Krogh principle atwork. Comp Biochem Physiol B 139:383–400.
Mommsen T.P., C.J. French, and P.W. Hochachka. 1980. Sites
and patterns of protein and amino acid utilization duringthe spawning migration of salmon. Can J Zool 58:1785–1799.
Mommsen T.P. and P.J. Walsh. 1989. Evolution of urea synthesisin vertebrates: the piscine connection. Science 243:72–75.
———. 1992. Biochemical and environmental perspectives onnitrogen metabolism in fishes. Experientia 48:583–592.
Potter I.C. and M.J. Rogers. 1972. Oxygen consumption inburrowed and unburrowed ammocoetes of Lampetra planeri(Bloch). Comp Biochem Physiol A 41:427–432.
Read L.J. 1968. A study of ammonia and urea production andexcretion in the fresh-water-adapted form of the Pacific lam-prey (Entosphenus tridentatus). Comp Biochem Physiol A 26:455–466.
Rovainen C.M. 1996. Feeding and breathing in lampreys. BrainBehav Evol 48:297–305.
Schmidt-Nielsen B., B. Truniger, and L. Rabinowitz. 1972.Sodium-linked urea transport by the renal tubule of the spinydogfish Squalus acanthias. Comp Biochem Physiol A 42:13–25.
Shankar R.A. and P.M. Anderson. 1985. Purification and prop-erties of glutamine synthetase from liver of Squalus acanthias.Arch Biochem Biophys 239:248–259.
Steele S.L., T.D. Chadwick, and P.A. Wright. 2001. Ammoniadetoxification and localization of urea cycle enzyme activityin embryos of the rainbow trout (Oncorhynchus mykiss) inrelation to high tolerance to high environmental ammonialevels. J Exp Biol 204:2145–2154.
Steele S.L., P.H. Yancey, and P.A. Wright. 2005. The little skateRaja erinacea exhibits an extrahepatic ornithine urea cyclein the muscle and modulates nitrogen metabolism duringlow-salinity challenge. Physiol Biochem Zool 78:216–226.
Sutton T.M. and S.H. Bowen. 1994. Significance of organicdetritus in the diet of larval lampreys in the Great Lakesbasin. Can J Fish Aquat Sci 51:2380–2387.
Verdouw H., C.J.A. van Echted, and E.M.J. Dekkers. 1978. Am-monia determination based on indophenol formation withsodium salicylate. Water Res 12:399–402.
Walsh P.J. 1996. Purification and properties of hepatic gluta-mine synthetases from the ureotelic Gulf toadfish, Opsanusbeta. Comp Biochem Physiol B 115:523–532.
Walton M.J. and C.B. Cowey. 1982. Aspects of intermediarymetabolism in salmonid fish. Comp Biochem Physiol B 73:59–79.
Wilkie M.P., P.G. Bradshaw, V. Joanis, J.F. Claude, and S.L.Swindell. 2001. Rapid metabolic recovery following vigorousexercise in burrow-dwelling larval sea lampreys (Petromyzonmarinus). Physiol Biochem Zool 74:261–272.
Wilkie M.P., S. Turnbull, J. Bird, Y.S. Wang, J.F. Claude, andJ.H. Youson. 2004. Lamprey parasitism of sharks and teleosts:high capacity urea excretion in an extant vertebrate relic.Comp Biochem Physiol A 138:485–492.
Wilkie M.P., Y. Wang, P.J. Walsh, and J.H. Youson. 1999. Ni-trogenous waste excretion by the larvae of a phylogenetically
898 M. P. Wilkie, J. F. Claude, A. Cockshutt, J. A. Holmes, Y. S. Wang, J. H. Youson, and P. J. Walsh
ancient vertebrate: the sea lamprey (Petromyzon marinus).Can J Zool 77:707–715.
Wilkie M.P. and C.M. Wood. 1991. Nitrogenous waste excre-tion, acid-base regulation and ionoregulation in rainbowtrout (Oncorhynchus mykiss) exposed to extremely alkalinewater. Physiol Zool 64:1069–1086.
Wood C.M. 2001. Influence of feeding, exercise, and temper-ature on nitrogen metabolism and excretion. Pp. 201–238in P.A. Wright and P.M. Anderson, eds. Fish Physiology. Vol.20. Nitrogen Excretion. Academic Press, New York.
Wood C.M., P. Part, and P.A. Wright. 1995. Ammonia and ureametabolism in relation to gill function and acid-base balance
in a marine elasmobranch, the spiny dogfish (Squalus acan-thias). J Exp Biol 198:1545–1558.
Wright P.A., A. Felskie, and P.M. Anderson. 1995. Inductionof ornithine-urea cycle enzymes and nitrogen metabolismand excretion in rainbow trout (Oncorhynchus mykiss) duringearly life stages. J Exp Biol 198:127–135.
Youson J.H. 1980. Morphology and physiology of lampreymetamorphosis. Can J Fish Aquat Sci 37:1687–1710.
———. 2003. The biology of metamorphosis in sea lampreys:endocrine, environmental and physiological cues and events,and their potential application to lamprey control. J Gt LakesRes 29(suppl.):26–49.
Related Documents


