. . A commentary of key observations on the data for the ward is on page 2. The profiles are complementary to a range of other Sheffield health and wellbeing indicator tools - Ward Trend Indicator Tool (for exploring the variation of any of the indicators across all wards) - Ward Health and Wellbeing Atlases (provide the facility to instantly manipulate, analyse, chart and produce maps) Access this health profile together with supporting tools and documentation online at the wesbsite for the Director of Public Health Report for Sheffield 2013 Health and Wellbeing Profiles are also available for a variety of other geographical and administrative areas within Sheffield e.g. Neigbourhoods, Children's Centres and Practices - Adult Social Care - Lifestyle - Children & Young People - Disease Groups - Mental Health This profile gives a snapshot overview of key Health and Wellbeing indicators in the chosen Ward, with comparisons to Sheffield. Sheffield Wards Health & Wellbeing Profiles 2013 for Dore and Totley Ward Dore and Totley Ward Street Map This profile may be used for non-commercial purposes provided the source is acknowledged: Source: Sheffield Wards Health and Wellbeing Profiles 2013, Public Health Intelligence Team, Sheffield City Council. Version 1.0, 25 September 2013 Topics covered in the profile:- - Population and Ethnicity - Deprivation - Wider Determinants of Health - Life Expectancy & Mortality - General Hospital Activity Contains Ordnance Survey data © Crown copyright and database right 2010 Map Shows ward & community assembly Boundaries Page 1 of 13 Sheffield Wards Health and Wellbeing Profiles 2013 © Public Health Intelligence Team, SCC. v1.0, 25th September 2013

Welcome message from author
This document is posted to help you gain knowledge. Please leave a comment to let me know what you think about it! Share it to your friends and learn new things together.
Transcript
.
.
.
A commentary of key observations on the data for the ward is on page 2.
The profiles are complementary to a range of other Sheffield health and wellbeing indicator tools- Ward Trend Indicator Tool (for exploring the variation of any of the indicators across all wards)- Ward Health and Wellbeing Atlases (provide the facility to instantly manipulate, analyse, chart and produce maps)
Access this health profile together with supporting tools and documentation online at the wesbsite for the Director of Public Health Report for Sheffield 2013
Health and Wellbeing Profiles are also available for a variety of other geographical and administrative areas within Sheffield e.g. Neigbourhoods, Children's Centres and Practices
- Adult Social Care
- Lifestyle
- Children & Young People
- Disease Groups
- Mental Health
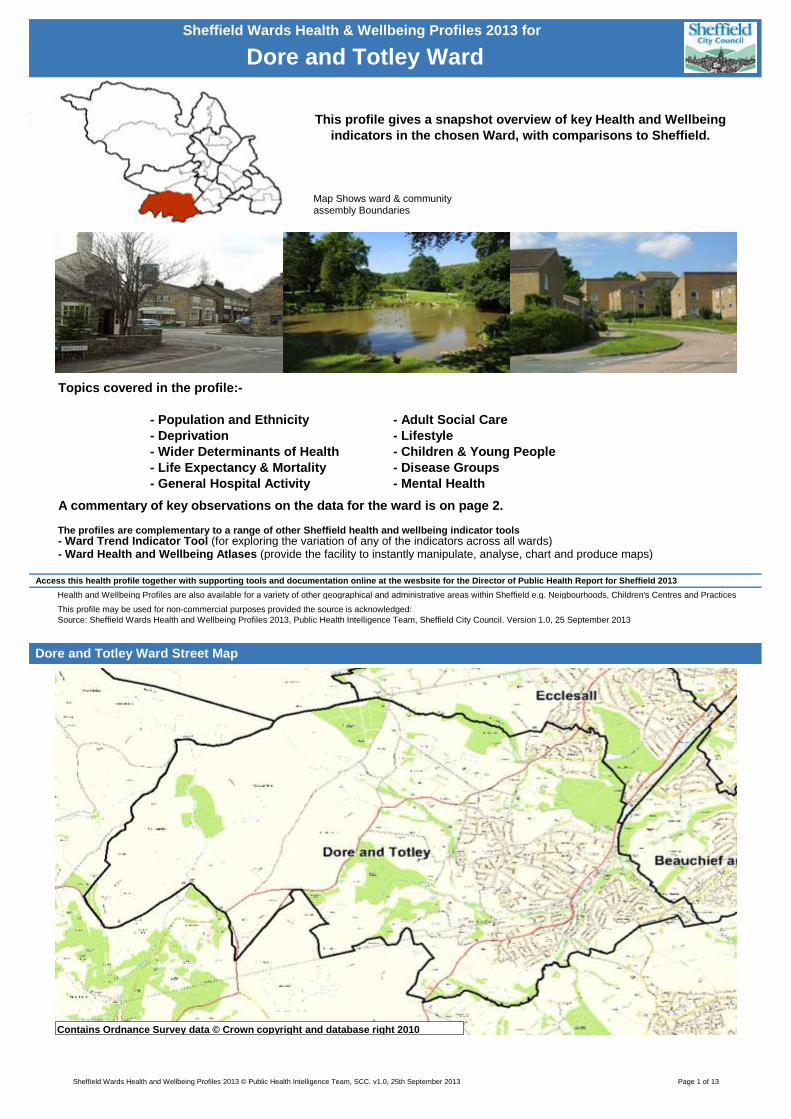
This profile gives a snapshot overview of key Health and Wellbeing
indicators in the chosen Ward, with comparisons to Sheffield.
Sheffield Wards Health & Wellbeing Profiles 2013 for
Dore and Totley Ward
Dore and Totley Ward Street Map
This profile may be used for non-commercial purposes provided the source is acknowledged:
Source: Sheffield Wards Health and Wellbeing Profiles 2013, Public Health Intelligence Team, Sheffield City Council. Version 1.0, 25 September 2013
Topics covered in the profile:-
- Population and Ethnicity
- Deprivation
- Wider Determinants of Health
- Life Expectancy & Mortality
- General Hospital Activity
Contains Ordnance Survey data © Crown copyright and database right 2010
Map Shows ward & community assembly Boundaries
Page 1 of 13Sheffield Wards Health and Wellbeing Profiles 2013 © Public Health Intelligence Team, SCC. v1.0, 25th September 2013

Observations with particular reference to indicators statistically significantly different to Sheffield.
Geography4
Population4
Deprivation4
Life Expectancy, Death and Ill Health4
The Dore and Totley Ward lies in the far south west of the city. Communities living in Totley, Bradway, Dore, Whirlow and Abbeydale fall into
this area. A large proportion of the area is rural including Burbage Moor, Fox House and Ringinglow and there is good access to open
countryside and the Peak District National Park. Totley is made up of three distinct areas, Totley Rise, Totley and New Totley. Dore is one of
Sheffield’s more affluent neighbourhoods and remains almost a separate village. Residents in the Ward have excellent access to green space
as it lies adjacent to the Peak District National Park and Ecclesall Woods. Some of the more rural communities to the west of the ward have
more limited access to local services such as schools, health care and shops and post offices.
Not covered by a Healthy Community Programme Area.
One of the least deprived wards. There are no people in the ward who are living in areas classed amongst the 10% most deprived in England,
according to the latest Indices of Deprivation (2010).
Low(3rd) levels of deprivation(IMD) and 'Child Well Being' Index. Low child poverty as per HMRC(3rd). Low(4th) proportion of Sheffield's
children in poverty.
Significantly low levels of crime. Educational attainment rates are high for educational attainment for age 4/5, Key Stage 2(age 15/16) & Key
Stage 4(age 15/16)highest rates of Y11 (age 15/16) children staying in learning.
Dore and Totley Ward: Some Key Observations in relation to the Sheffield average
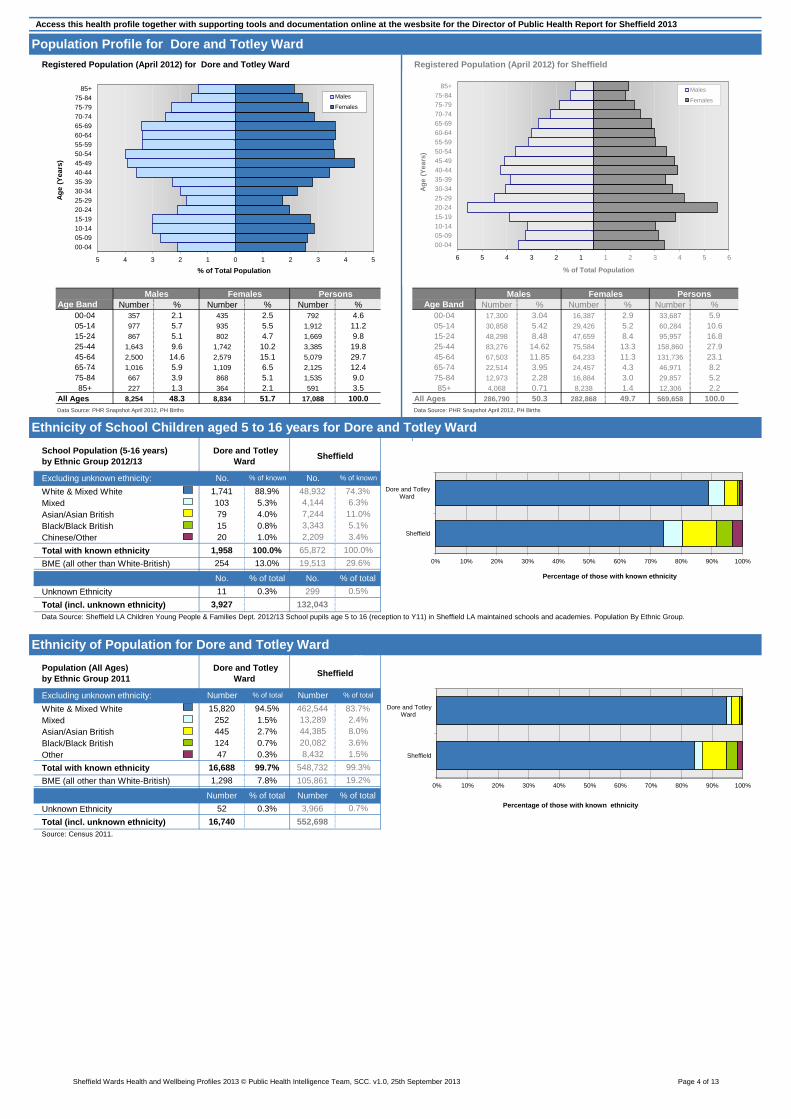
Ward with the highest proportion of over 75 year olds (12%). Low proportion of the population aged between 20 and 39 years.
"Low(4th) proportion of children(under 5) and Highest proportion of older persons(over 75
11% of school children are of non White-British ethnic origin. The 2011 Census indicates that 8% of Dore and Totley Ward are BME, lower than
the city average. The largest single BME population is the Other White group. This group represents 21.3% of BME people and 1.6% of the
total population of the ward.
Overall all age BME (all other than White-British) for ward is 7.8% (Sheffield is 19.2%) with the largest group being Other white groups at 1.6%.
BME at ages 5-16 is 13.5% (Sheffield is 30.1%).
Across all wards ethnicity rates are: High(3rd) black groups with Lowest Black-Caribbean; "
Lowest rate of admissions related to alcohol. Highest rates of alcohol abstainers. Lowest rates of high risk and binge drinkers.
Significantly low(27th) new STI diagnoses, Lowest positive chlamydia tests (age 15-24). Significantly low smoking prevalence and low smoking
attributable mortality. Significantly low prevalence of mental health disorders, and significantly low rates of referrals to Mental Health specialties.
Significantly high (82.6 years) life expectancy for males and highest (87.3 years) life expectancy for females. Significantly low all cause
mortality, both for all ages and under 75 years. Significantly low A&E attendances & emergency admissions for all ages. Significantly low
elective admissions across all age groups, apart from those aged 65+ (significantly high elective admission rates).
The rate of Adult Social Care referrals and assesments are significantly low for those aged between 18 and 84.
Significantly high proportion of breastfeeding at 6-8 weeks; significantly low rate of mothers delivering with BMI of 25+ or 30+; Significantly low
rates of children (year R & Year 6) who are overweight or obese; significantly low rate of dmft in 5 year olds.
Lowest ward rates for chronic diseases elective admissions and diabetes admissions. Significantly high admissions for cancer (5th highest).
Significantly low admissions for circulatory diseases(2nd), CHD(elective)(4th), CHD(emergency)(2nd), stroke(2nd), asthma(3rd) COPD(excl.
asthma)(3rd). Significantly low mortality rates for cancer, CHD, chronic diseases and circulatory diseases. Significantly low rates of lung cancer
registration for lung.
Page 2 of 13Sheffield Wards Health and Wellbeing Profiles 2013 © Public Health Intelligence Team, SCC. v1.0, 25th September 2013

Access this health profile together with supporting tools and documentation online at the wesbsite for the Director of Public Health Report for Sheffield 2013
Proportion of Ward Population Registered with each Practice and Locality (as at April 2011)
Data Source: Population Health Register (PHR)
Notes: This table aims to cover the entire Ward population but is limited to the top 16 practices
If the Ward population is distributed across more than 16 practices an 'Other Areas' grouping is used
Practice & Locality Configuration as at April 2011
Proportion of Ward Population Resident in each Healthy Community Programme Area as at (April 2011)
Data Source: Population Health Register (PHR)
Notes: This table aims to cover the entire Ward population but is limited to the top 4 HCPAs
If the Ward population is distributed across more than 4 HCPAs or the remining wards amount to less than 1% an 'Other HCPAs' grouping is used
Proportion of Ward Population Resident in each ward as at (April 2011)
Data Source: Population Health Register (PHR)
Notes: This table aims to cover the entire Ward population but is limited to the top 4 neighbourhoods
If the Ward population is distributed across more than 4 neighbourhoods or the remining wards amount to less than 1% an 'Other Neighbourhoods' grouping is used
Proportion of Ward Population Resident in each Children's Centre as at (April 2011)
Data Source: Population Health Register (PHR)
Notes: This table aims to cover the entire Ward population but is limited to the top 4 Children's Centres
If the Ward population is distributed across more than 4 Children's Centres or the remining wards amount to less than 1% an 'Other Children's Centres' grouping is used
-
-
-
-
C88061
C88653
% of Ward Population Accounted for
-
42.7%
100%
Porter Brook Medical Centre
Broomhill Surgery
C88053
Children's Centre Name
21.5%
100%
-
Totley Rise Medical Centre
Abbey Lane Surgery
PBC02
Greenhill Health Centre
The Meadowhead Group Practice
The Hollies Medical Centre
PBC09
PBC08
PBC09
PBC02
C88024 Avenue Medical Practice
Bents Green Surgery
C88068
C88031
25.4%
West
% of Ward Population Accounted for
PBC02
C88052
Upperthorpe Medical Centre
Central
-
100.0%
OtherOther
0.4%
West
By Healthy Community Programme Area
Neighbourhood Name
Totley
Other Neighbourhoods
% of Ward
Population
Resident in
Children's Centre
-
99
Other
24.0%
By Children's Centre
98
Dore
% of
Neighbourhood
Population
Resident in Ward
100.0%
% of Ward
Population
Resident in
Neighbourhood
% of HCPA
Population
Resident in Ward
100.0%
Neighbourhood
Code
% of Ward
Population
Resident in HCPA
-
2.3%
Whirlow / Abbeydale
Bradway
-
-
0.0%
-
By Neighbourhood
-
-
-
-
% of Children's
Centre Population
Resident in Ward
99.7%
% of Ward Population Accounted for
0.3%Other AreasOther
-
-
-
- -
100%
94.6%
-
- -
93
Totley/ Beauchief/ Bradway/ Ecclesall/
Crosspool/ Fulwood
-
97
Children's Centre
Code
2.0%Other
By Practice & Locality
Practice Code Practice Name
PBC09
Locality Name
Other
0.5%
30.5%
C88041
C88026
Central
C88028
0.5%
PBC08
C88007
C88015
Woodseats Medical Centre
Locality Code
100%Percentage of Ward Population Accounted for above
Falkland House
Central
C88016
The Sloan Practice
4.8%
PBC09
-
CC14
C88038
Other Areas
C88046
HCPA Code
(blank)
-
Other
Not within a HCPA
The Mathews Practice
Healthy Community
Programme Area Name
Hallam & South (HASC)
Hallam & South (HASC)PBC09
9.5% 54.3%
PBC09
Population Distributions for Dore and Totley Ward (April 2011)
Baslow Road Surgery
Central
PBC09
0.4%
0.6%
PBC02
0.5%
2.2%
Hallam & South (HASC)
Hallam & South (HASC)
Hallam & South (HASC) 5.9%
9.9%
Hallam & South (HASC)
0.5%
0.7%
PBC02
Central
% of Ward
Population
Registered with
Practice
C88037 27.1%
1.3%
14.7%Hallam & South (HASC)PBC09
Carterknowle and Dore Medical
Practice
PBC09
Hallam & South (HASC) 2.4%
Hallam & South (HASC)
0%
20%
40%
60%
80%
100%
Pe
rce
nta
ge
of
po
pu
lati
on
Distribution of Dore and Totley Ward Population by
Locality
Unknown Locality
Registered Outside of Sheffield
North
HASC
West
Central
0% 10% 20% 30% 40% 50% 60% 70% 80% 90% 100%
Percentage of population
Distribution of Dore and Totley Ward Population by Children's Centre
0% 10% 20% 30% 40% 50% 60% 70% 80% 90% 100%
Percentage of population
Distribution of Dore and Totley Ward Population by Neighbourhood
0% 10% 20% 30% 40% 50% 60% 70% 80% 90% 100%
Percentage of population
Distribution of Dore and Totley Ward Population by HCPA
Page 3 of 13Sheffield Wards Health and Wellbeing Profiles 2013 © Public Health Intelligence Team, SCC. v1.0, 25th September 2013
Access this health profile together with supporting tools and documentation online at the wesbsite for the Director of Public Health Report for Sheffield 2013
Registered Population (April 2012) for Dore and Totley Ward Registered Population (April 2012) for Sheffield
All Ages All Ages
Data Source: PHR Snapshot April 2012, PH Births Data Source: PHR Snapshot April 2012, PH Births
Sh 0.0
White & Mixed White
Mixed
Asian/Asian British
Black/Black British
Chinese/Other
Total with known ethnicity
BME (all other than White-British)
Unknown Ethnicity
Total (incl. unknown ethnicity)
Sh
White & Mixed White
Mixed
Asian/Asian British
Black/Black British
Other
Total with known ethnicity
BME (all other than White-British)
Unknown Ethnicity
Total (incl. unknown ethnicity)
5,079
Age Band
00-04
13.3
1,298 7.8%
83.7%
105,861 19.2%
124
16,688
2.4%
445
15,820
Number % of total
252
48,298
12.4
47,659
Persons
11.85 64,233
3,385 25-44
Males
0.3%
19.8
67,503
65-74
17,088
1.5%
Ethnicity of School Children aged 5 to 16 years for Dore and Totley Ward Dore and Totley Ward
75,58414.6283,276 158,860
16.895,9578.48.48
5.2
50.3 100.0
9.0
0.713.5 4,068 8,238
569,658
2.2
% of total
5.1%
49.7100.0
% of total
8,834
Dore and Totley
Ward
75-84 3.0
282,868
16,884
22,514
12,973
1.4
2.28
3.95
11.3
27.9
15-24
8.224,457 46,9714.3
23.1131,736
Persons
1,669 9.8
5.42 5.2
16,387
29,426
5.9
Population Profile for Dore and Totley Ward
Age Band
3.9
3,966
591
0.0
% of known
99.7%
85+
51.7
Excluding unknown ethnicity:
Source: Census 2011.
Number
45-64
802
%
1.5%
8.0%
Dore and Totley Ward
60,284
%
15.1
%
2.1
Females
29.7
4.6
Number
Population (All Ages)
by Ethnic Group 2011
2.7%
0.3%
552,698
10.6
Number
Sheffield
286,790
12,306
5.7
10.2
47
13,289
0.7%52
3.6%20,082
99.3%
16,740
8,432
Number
94.5%
44,385
462,544
548,732
0.7%
% of total
Number Number%
17,300
935 5.5 05-14
435
30,858
792 2.93.04 33,687
Number %
2.5
1,74225-44
5.1
05-14 11.2
867
1,912
Number
Females
Number
Males
%
15-24
00-04
977
357
4.7
85+
0.0
8,254
227
Sheffield
Excluding unknown ethnicity:
48.3
School Population (5-16 years)
by Ethnic Group 2012/13
Dore and Totley
Ward
667
2.1
75-84
9.6
2,579
65-74
45-64
1,109
1,643
1,016 2,125
2,500 14.6
1.3 364
5.9 6.5
868 1,5355.1 29,857
74.3%
103 5.3% 4,144 6.3%
4.0%
15 0.8% 3,343
No. % of known No.
1,741 88.9% 48,932
11.0%
1,958 100.0% 65,872 100.0%
79 7,244
20 1.0% 2,209 3.4%
3,927 132,043
No. % of total No. % of total
11 0.3% 299 0.5%
Ethnicity of Population for Dore and Totley Ward
Data Source: Sheffield LA Children Young People & Families Dept. 2012/13 School pupils age 5 to 16 (reception to Y11) in Sheffield LA maintained schools and academies. Population By Ethnic Group.
254 13.0% 19,513
0.0
29.6%
6 5 4 3 2 1 1 2 3 4 5 6
00-04
05-09
10-14
15-19
20-24
25-29
30-34
35-39
40-44
45-49
50-54
55-59
60-64
65-69
70-74
75-79
75-84
85+
% of Total Population
Ag
e (
Ye
ars
)
Males
Females
5 4 3 2 1 0 1 2 3 4 5
00-04
05-09
10-14
15-19
20-24
25-29
30-34
35-39
40-44
45-49
50-54
55-59
60-64
65-69
70-74
75-79
75-84
85+
% of Total Population
Ag
e (
Ye
ars
)
Males
Females
0% 10% 20% 30% 40% 50% 60% 70% 80% 90% 100%
Dore and TotleyWard
Sheffield
Percentage of those with known ethnicity
0% 10% 20% 30% 40% 50% 60% 70% 80% 90% 100%
Dore and TotleyWard
Sheffield
Percentage of those with known ethnicity
Page 4 of 13Sheffield Wards Health and Wellbeing Profiles 2013 © Public Health Intelligence Team, SCC. v1.0, 25th September 2013

Access this health profile together with supporting tools and documentation online at the wesbsite for the Director of Public Health Report for Sheffield 2013
KEY:
1.
2.
3.
KEY:
4.
5.
6.
7.
8.
9.
10.
11.
12.
13.
14.
15.
16.
17.
18.
19.
20.
21.
22.
23.
24.
25.
26.
27.
28.
21.5
42,163
2.35
31.7
Ward
Range
Highest
Population Indicators for Dore and Totley Ward
Ward
Range
Lowest
12.441.852,126
23.2
9.40
rate
(95% CI)
4.63792
14.6
numbernumber
% Population (Age 75+) 7.40
Dore and Totley Ward
% Population (Age <5)
Sheffield
rate
(95% CI)
33,687 5.92
Population
132,368% Population (Age <20)
A simple guide to chart interpretation can be found at the top of page 6; there is also a more detailed technical guide to interpretation available on page 10.
Left side of the pages: indicator names with Ward and Sheffield figures (number, rate and 95% confidence intervals where available)
Right side of the pages: Ward and Sheffield figures displayed as a chart
Simple metadata detailing indicator time periods and units can be found at the bottom of each section.
A comprehensive list of metadata (including definitions, time periods, units, sources and additional notes) can be found at the end of the profile on pages 11-13.
Guide to Interpretation
92.2
Detailed Ethnic Breakdown for Dore and Totley Ward
Population Ethnicity
School Children from BME groups (Age 5-16) 254
15,820 94.5
0.31
White; British
Sheffield
number
0.10
462,544ALL WHITE GROUPS
446,837
PERIODS: (4) 2012/13, (5-28) 2011. UNITS: (4) % of school children age 5 to 16 with known ethnicty, (5-28) % of Population. See metadata for full indicator definitions and data sources.
2.6252
White; Gypsy or Irish Traveller 0.04
ALL MIXED GROUPS
358
3,966
15,442
Other; Other groups
38.1
White; Irish 96 0.57 2,891 0.52
276 1.65
6
Other white groups 12,458
0.24
98.183.7 42.5
96.880.8
1.16
0.06 0.01
0.14
0.49 4.982.25
252 1.51 13,289 2.40
0.59
0.62
0.10 1,296 0.23 0.05
4.68
0.28 2.21
1.07
Mixed; White and black African groups 16
0.63 0.09
Mixed; White and black Caribbean groups 65 0.39 5,450 0.99
Other mixed groups 65 0.39 3,053 0.55
3,490Mixed; White and asian groups 106 0.63
4.28
0.12
0.79 5,868 1.06 0.13
1.28
0.52 33.05
22.76
Asian; Indian 133
3.98 0.03
ALL ASIAN GROUPS 445 2.66 44,385 8.03
Asian; Bangladeshi 21 0.13 3,326 0.60
21,990Asian; Pakistani 199 1.19
3.03
0.01
0.19 5,803 1.05 0.15
7.31
0.13 8.25
14.05
Other Asian groups 31
3.63 0.48
Asian; Chinese 61 0.36 7,398 1.34
Black; African 38 0.23 11,543 2.09
20,082ALL BLACK GROUPS 124 0.74
0.23
0.16 3,033 0.55 0.05
7.94
0.14 3.60Black; Caribbean 59 0.35 5,506 1.00
ALL OTHER GROUPS 10.4199 0.59
1.53 0.11
Other black groups 27
2.24 0.23
2.50
47 0.28 8,432
12,398
7.80
0.72
Other; Arab
19.15 3.16 61.91
PERIODS: (1-3) Apr 2012. UNITS: (1-3) % of Population. See metadata for full indicator definitions and data sources.
1,298 7.75
19,513
number
105,861
3,679
12.44
12.97
rate
(95% CI)
Dore and Totley Ward
3.94 84.82
Ward
Range
Lowest
29.62
Ward
Range
Highest
rate
(95% CI)
BME groups (non-White British)
Significantly better than Sheffield Statistically similar to Sheffield Significantly worse than Sheffield Statistical Significance not available
Ward range Sheffield value
Significantly better than Sheffield Statistically similar to Sheffield Significantly worse than Sheffield Statistical Significance not available
Ward range Sheffield value
Page 5 of 13Sheffield Wards Health and Wellbeing Profiles 2013 © Public Health Intelligence Team, SCC. v1.0, 25th September 2013

Access this health profile together with supporting tools and documentation online at the wesbsite for the Director of Public Health Report for Sheffield 2013
KEY:
29.
30.
31.
32.
33.
34.
35.
36.
37.
38.
39.
40.
41.
42.
43.
44.
45.
46.
47.
KEY:
48.
49.
50.
51.
52.
Child Well-being Index 2009; Material Well-being Domain
0
rate
(95% CI)
29.2
(26.8 , 31.9)
160
14.6
Child Well-being Index 2009; Education Domain
Child Well-being Index 2009; Environment Domain 21.4
3.53
40.33 5.81
98.3
Wider Determinants Indicators for Dore and Totley Ward
PERIODS: (29-36) 2010, (37-44) 2009, (45-46) 2010, (47) 2012. UNITS: (29) IMD Overall Score, (30-36) IMD Domain Score, (37) CWBI Overall Score, (38-44) CWBI Domain Score, (45) % Children
in Ward, (46) % All Sheffield Children in poverty, (47) % Children in Ward. See metadata for full indicator definitions and data sources.
number
Dore and Totley Ward
497
Child Well-being Index 2009; Housing Domain 5.97
1.59
36.2
0.08
223.0 388.9
7.0348.08
80.12 1.30
64.8
0.01
-1.171.45
0.23
16.6
-0.75
0.03
1.31
69.12
28.6
0.26
number
IMD 2010; Income Domain
rate
(95% CI)number
7.35
40.49
0.04
20.85
0.99
0.81
-0.46
IMD 2010; Employment Domain
4.7853.91
Child Well-being Index 2009; Children in Need Domain 0.01
0.05
-0.75
Deprivation
IMD 2010; Health & Disability Domain
IMD 2010; Education, Skills & Training Domain
Index of Multiple Deprivation 2010; Overall Score
Child Well-being Index 2009; Overall Score 70.9
Deprivation Indicators for Dore and Totley Ward
-0.75
Child Well-being Index 2009; Health & Disability Domain
IMD 2010; Living Environment Domain
2.85
IMD 2010; Barriers to Housing & Services Domain
IMD 2010; Crime Domain
Child Well-being Index 2009; Crime Domain
22.10
Ward
Range
Best
Children in Poverty (End Child Poverty) Rate for ward
rate
(95% CI)number
Suppressed 24,383 4.60
Sheffield
42.90
24.540,94274.9
(74.2 , 75.6)
3,78462.7
(61.5 , 63.9)
4,104 59.4
35.2
5,248
Education; Pupils in Year R Attaining 78+ Points including
6+ in CLL & PSE (FS, Age 4/5)
Education; Year 11 Pupils Staying in Learning (Age
15/16)
PERIODS: (48) 2009/10, (49-52) 2012. UNITS: (48) rate per 1,000 population, (49) % YR pupils , (50) % Y6 pupils, (51) % Y11 pupils , (52) % Y11 pupils. See metadata for full indicator definitions
and data sources.
86.5
85.0
94.6
47.677.2
(70.1 , 83.1)
Education; Pupils in Year 6 Attaining Level 4+ in English
and Maths (KS2, Age 10/11)
2,95355.5
(54.2 , 56.9)
77.1
(75.9 , 78.2)
123
92.3
(86.9 , 95.5)142
96.0
(91.5 , 98.2)
92.4
(91.7 , 93.1)
27.10
Sheffield Dore and Totley Ward
0.41
Ward
Range
Best
144
Ward
Range
Worst
0.030.35
1.44
0.04
7.03
21.2
-0.20
Children in Poverty (HMRC) Percentage of all Sheffield
children in poverty
0.06
0.21
0.52
45.00
0.40
0.06
Guide to Chart Interpretation
rate
(95% CI)
Ward
Range
Worst
Wider Determinants
84.9
(78.1 , 89.8)
88.0
197.8Crime; Total Incidence
122
Education; Pupils Attaining 5+ GCSEs at Grade A*-C
including English & Maths (KS4, Age 15/16)
3.40
12.140.60
4.80
0.36
Children in Poverty (HMRC) Rate for ward 24.1726,690
160
16.9
Significantly better than Sheffield Statistically similar to Sheffield Significantly worse than Sheffield Statistical Significance not available
Significantly better than Sheffield Statistically similar to Sheffield Significantly worse than Sheffield Statistical Significance not available
Ward range Sheffield value
Ward range Sheffield value
Statistical Significance: Calculated using 95% Confidence Intervals For some indicators (for example Smoking Prevalence) a high value is not the same as a better value; the charts already take this into account in the way they are plotted. For some indicators (for example Live Birth Rate) statistical significance cannot be calculated; in this case, a point to the right end of the grey bar simply denotes a higher value, and to the left denotes a lower value.
Range of ward values
LEFT SIDE
BAD RIGHT SIDE
GOOD
Sheffield Average
STATISTICALLY SIGNIFICANT BETTER WORSE
Not Statistically Different Significance not Calculated
Page 6 of 13Sheffield Wards Health and Wellbeing Profiles 2013 © Public Health Intelligence Team, SCC. v1.0, 25th September 2013

Access this health profile together with supporting tools and documentation online at the wesbsite for the Director of Public Health Report for Sheffield 2013
KEY:
53.
54.
55.
56.
57.
58.
59.
60.
KEY:
61.
62.
63.
64.
65.
66.
67.
68.
69.
70.
71.
72.
KEY:
73.
74.
75.
76.
77.
78.
79.
80.
370All Cause Mortality (Age <75) - Females
221
(173 , 279)
1,879
180,318
559,570332
(331 , 333)
466
(464 , 469)
rate
(95% CI)number
373
(361 , 386)
All Cause Mortality (Age <75) - Persons
All Cause Mortality (Age <75) - Males
132179
(149 , 213)4,611
314
(270 , 361)
2,73276
255
All Cause Mortality (All Ages) - Females 241
number
87.3
14,401548
(539 , 558)
82.5
(82.2 , 82.8)
365
75.6
rate
(95% CI)
481
(420 , 549)6,892
500
270
(262 , 278)
87.3
(85.8 , 88.7)
Sheffield Dore and Totley Ward
323
(311 , 335)
79.0
(78.7 , 79.3)
814470
(458 , 482)
858641
(626 , 657)
7,509
Ward
Range
Best
Ward
Range
Worst
Dore and Totley Ward
rate
(95% CI)
432
78,610785
(780 , 791)
286
149.0
7.30
Emergency Admissions (Age 65+)
Emergency Admissions (Age <5)
2,451
374 19,222
6,627
(6,391 , 6,868)
16,366
(14,745 , 18,117)
11,945 6,242
16,761
5,087
84.2
26.5
14,186
28,837
11,158
28,747
481
1,02024.69
(23.20 , 26.26)
47.4
(43.4 , 51.7)
9,169
38,27536,422
(35,323 , 37,545)
35.18
5.99
(5.84 , 6.13)
8,159
(8,070 , 8,250)
number
10.87
5,964
(5,513 , 6,441)10,510
rate
(95% CI)
3.72
(3.05 , 4.49)
Ward
Range
Worst
31,911
13,581
(13,270 , 13,897)
8,4338,454
(8,274 , 8,636)
68,848
823
rate
(95% CI)
Life Expectancy & Mortality Indicators for Dore and Totley Ward
14,232
(14,175 , 14,289)
136
157
9,173
(9,127 , 9,218)
369
(367 , 372)
568
348
1,005
16,414
33,381
(33,153 , 33,611)86,338
number
129.6
(125.9 , 133.4)
14.17
(13.97 , 14.37)
412
218
(208 , 228)
398
number
255
(250 , 260)
84.4
237
PERIODS: (53-60) 2010 - 2012. UNITS: (53-54) Life Expectancy (years), (55-60) DASR per 100,000. See metadata for full indicator definitions and data sources.
117
496
19,194
(18,923 , 19,467)
22,994
(22,816 , 23,173)
Life Expectancy & Mortality
56
314
Sheffield
A&E Attendances (Age 65+)
561A&E Attendances (Age <20)
Dore and Totley Ward
numberrate
(95% CI)
Referrals (Age 18+)
Adult Social Care
Assessments (Age 85+)
30.8
(27.5 , 34.3)332
Referrals (Age 18-64)
67.6
(66.6 , 68.7)
630
Adult Social Care Indicators for Dore and Totley Ward
Elective Admissions (All Ages)
8,506
(8,414 , 8,600)
16,859
(16,165 , 17,574)
11,405
5,305
(4,418 , 6,318)
10,142
5,054Elective Admissions (Age <20)
Elective Admissions (Age 65+)
663
7.12
1.10
Assessments (Age 65-84)
PERIODS: (73-80) 2010/11 - 2012/13. UNITS: (73-80) Crude Rate per 1,000. See metadata for full indicator definitions and data sources.
Emergency Admissions (Age <20)
3,844
Emergency Admissions (All Ages)
70.8
638
(606 , 672)
2.61
(2.05 , 3.27)
107
76.9
Ward
Range
Worst
12,828
Assessments (Age 18-64)
6,569
30,035
19,266
Elective Admissions (Age <5)
4,455
PERIODS: (61-72) 2010/11 - 2012/13. UNITS: (61-64) DASR per 1,000, (65-72) DASR per 100,000. See metadata for full indicator definitions and data sources.
Referrals (Age 65-84)
126
230 4,709
6,229
Ward
Range
Best
General Hospital Activity Indicators for Dore and Totley Ward
A&E Attendances (All Ages) 12,908
172,912
32,504
106,308
389
(352 , 429)
286
(277 , 295)
6,646
(6,128 , 7,196)
137
(103 , 180)
23,664
82.6
(81.2 , 84.0)
255,218
1,475A&E Attendances (Age <5)
Male Life Expectancy at Birth (All Ages)
All Cause Mortality (All Ages) - Persons
General Hospital Activity
Female Life Expectancy at Birth (All Ages)
All Cause Mortality (All Ages) - Males
4,4154.02
(3.91 , 4.14)
4,380
3,904
1.68
22.09
(21.84 , 22.34)
Ward
Range
Best
Sheffield
267 150
21.54 4.26
132.0
(115.5 , 150.2)
75
44.8
(43.9 , 45.7)
512 43.3
Referrals (Age 85+) 401230
(208 , 254)8,156
15,310
224
(220 , 229)
105.0
Assessments (Age 18+) 63715.42
(14.25 , 16.67)
Significantly better than Sheffield Statistically similar to Sheffield Significantly worse than Sheffield Statistical Significance not available
Significantly better than Sheffield Statistically similar to Sheffield Significantly worse than Sheffield Statistical Significance not available
Ward range Sheffield value
Ward range Sheffield value
Significantly better than Sheffield Statistically similar to Sheffield Significantly worse than Sheffield Statistical Significance not available
Ward range Sheffield value
Page 7 of 13Sheffield Wards Health and Wellbeing Profiles 2013 © Public Health Intelligence Team, SCC. v1.0, 25th September 2013
Access this health profile together with supporting tools and documentation online at the wesbsite for the Director of Public Health Report for Sheffield 2013
KEY:
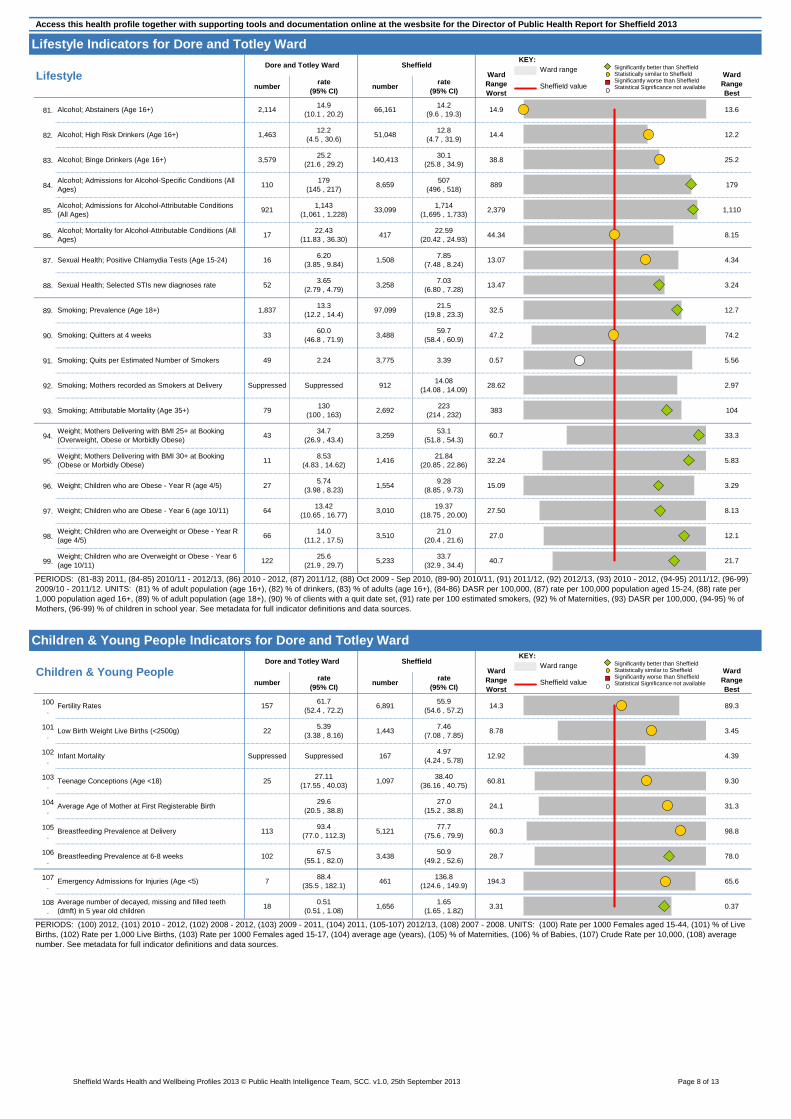
81.
82.
83.
84.
85.
86.
87.
88.
89.
90.
91.
92.
93.
94.
95.
96.
97.
98.
99.
KEY:
100
.
101
.
102
.
103
.
104
.
105
.
106
.
107
.
108
.
3,48859.7
(58.4 , 60.9)
12.8
(4.7 , 31.9)
number
507
(496 , 518)
Sheffield
74.2
13.07
47.2
14.9
38.8
8,659
32.5
12.2
13.47
33,099
12.7
8.15
3.24
44.34
4.34
140,413
2,379
25.2
1,110
7.85
(7.48 , 8.24)
Smoking; Quitters at 4 weeks
1,837
rate
(95% CI)
17
1,714
(1,695 , 1,733)
21.5
(19.8 , 23.3)
14.2
(9.6 , 19.3)
Alcohol; Admissions for Alcohol-Attributable Conditions
(All Ages)
12.2
(4.5 , 30.6)
Sexual Health; Selected STIs new diagnoses rate
Alcohol; Mortality for Alcohol-Attributable Conditions (All
Ages)
Alcohol; High Risk Drinkers (Age 16+)
22.43
(11.83 , 36.30)
14.9
(10.1 , 20.2)
179
Alcohol; Binge Drinkers (Age 16+)
889
Ward
Range
Best
Ward
Range
Worst
Alcohol; Abstainers (Age 16+)
Dore and Totley Ward
3,579
13.6
Lifestyle
921
Alcohol; Admissions for Alcohol-Specific Conditions (All
Ages)
25.2
(21.6 , 29.2)
Sexual Health; Positive Chlamydia Tests (Age 15-24)
1,143
(1,061 , 1,228)
1,463
110
14.4
Smoking; Prevalence (Age 18+)
2,114
rate
(95% CI)number
16
7.03
(6.80 , 7.28)
1,508
Lifestyle Indicators for Dore and Totley Ward
79
60.0
(46.8 , 71.9)
34.7
(26.9 , 43.4)
33
Suppressed
Weight; Children who are Obese - Year R (age 4/5)
130
(100 , 163)Smoking; Attributable Mortality (Age 35+)
Weight; Mothers Delivering with BMI 25+ at Booking
(Overweight, Obese or Morbidly Obese)43
Suppressed
49
11
5.74
(3.98 , 8.23)
8.53
(4.83 , 14.62)
Weight; Mothers Delivering with BMI 30+ at Booking
(Obese or Morbidly Obese)
64
27
157Fertility Rates
Children & Young People Dore and Totley Ward
number
Weight; Children who are Overweight or Obese - Year 6
(age 10/11)122
25.6
(21.9 , 29.7)
PERIODS: (81-83) 2011, (84-85) 2010/11 - 2012/13, (86) 2010 - 2012, (87) 2011/12, (88) Oct 2009 - Sep 2010, (89-90) 2010/11, (91) 2011/12, (92) 2012/13, (93) 2010 - 2012, (94-95) 2011/12, (96-99)
2009/10 - 2011/12. UNITS: (81) % of adult population (age 16+), (82) % of drinkers, (83) % of adults (age 16+), (84-86) DASR per 100,000, (87) rate per 100,000 population aged 15-24, (88) rate per
1,000 population aged 16+, (89) % of adult population (age 18+), (90) % of clients with a quit date set, (91) rate per 100 estimated smokers, (92) % of Maternities, (93) DASR per 100,000, (94-95) % of
Mothers, (96-99) % of children in school year. See metadata for full indicator definitions and data sources.
40.7
Suppressed
Weight; Children who are Obese - Year 6 (age 10/11)
6,891
77.7
(75.6 , 79.9)
28.7
Low Birth Weight Live Births (<2500g)5.39
(3.38 , 8.16)
55.9
(54.6 , 57.2)
Average Age of Mother at First Registerable Birth
88.4
(35.5 , 182.1)461
22
2527.11
(17.55 , 40.03)Teenage Conceptions (Age <18)
Infant Mortality Suppressed
18
93.4
(77.0 , 112.3)
102
Breastfeeding Prevalence at Delivery 113
Average number of decayed, missing and filled teeth
(dmft) in 5 year old children
7
Breastfeeding Prevalence at 6-8 weeks67.5
(55.1 , 82.0)
Emergency Admissions for Injuries (Age <5)
29.6
(20.5 , 38.8)
3,438
1,6560.51
(0.51 , 1.08)
60.35,121
27.0
(15.2 , 38.8)
1.65
(1.65 , 1.82)
8.78
14.3
12.92
0.37
31.3
9.3060.81
194.3
4.39
78.0
65.6
98.8
50.9
(49.2 , 52.6)
1,4437.46
(7.08 , 7.85)
136.8
(124.6 , 149.9)
38.40
(36.16 , 40.75)
167
8.13
rate
(95% CI)
61.7
(52.4 , 72.2)
Ward
Range
Worst
Sheffield
27.0
21.75,233
13.42
(10.65 , 16.77)
104
3.29
5.56
21.84
(20.85 , 22.86)
9.28
(8.85 , 9.73)
33.3
2.97
0.57
383
28.62
15.09
5.83
27.50
numberrate
(95% CI)
33.7
(32.9 , 34.4)
1,554
1,416
12.1
19.37
(18.75 , 20.00)
53.1
(51.8 , 54.3)
2.24
3,010
3,259
3.65
(2.79 , 4.79)
2,692223
(214 , 232)
3,775
97,099
14.08
(14.08 , 14.09)
60.7
6.20
(3.85 , 9.84)
30.1
(25.8 , 34.9)
32.24
912
3.39
3,25852
51,048
66,161
417
Smoking; Mothers recorded as Smokers at Delivery
13.3
(12.2 , 14.4)
179
(145 , 217)
Smoking; Quits per Estimated Number of Smokers
Children & Young People Indicators for Dore and Totley Ward
21.0
(20.4 , 21.6)
3.31
Ward
Range
Best
Weight; Children who are Overweight or Obese - Year R
(age 4/5)66
14.0
(11.2 , 17.5)
1,097
89.3
4.97
(4.24 , 5.78)
3.45
24.1
PERIODS: (100) 2012, (101) 2010 - 2012, (102) 2008 - 2012, (103) 2009 - 2011, (104) 2011, (105-107) 2012/13, (108) 2007 - 2008. UNITS: (100) Rate per 1000 Females aged 15-44, (101) % of Live
Births, (102) Rate per 1,000 Live Births, (103) Rate per 1000 Females aged 15-17, (104) average age (years), (105) % of Maternities, (106) % of Babies, (107) Crude Rate per 10,000, (108) average
number. See metadata for full indicator definitions and data sources.
22.59
(20.42 , 24.93)
3,510
Significantly better than Sheffield Statistically similar to Sheffield Significantly worse than Sheffield Statistical Significance not available
Significantly better than Sheffield Statistically similar to Sheffield Significantly worse than Sheffield Statistical Significance not available
Ward range Sheffield value
Ward range Sheffield value
Page 8 of 13Sheffield Wards Health and Wellbeing Profiles 2013 © Public Health Intelligence Team, SCC. v1.0, 25th September 2013
Access this health profile together with supporting tools and documentation online at the wesbsite for the Director of Public Health Report for Sheffield 2013
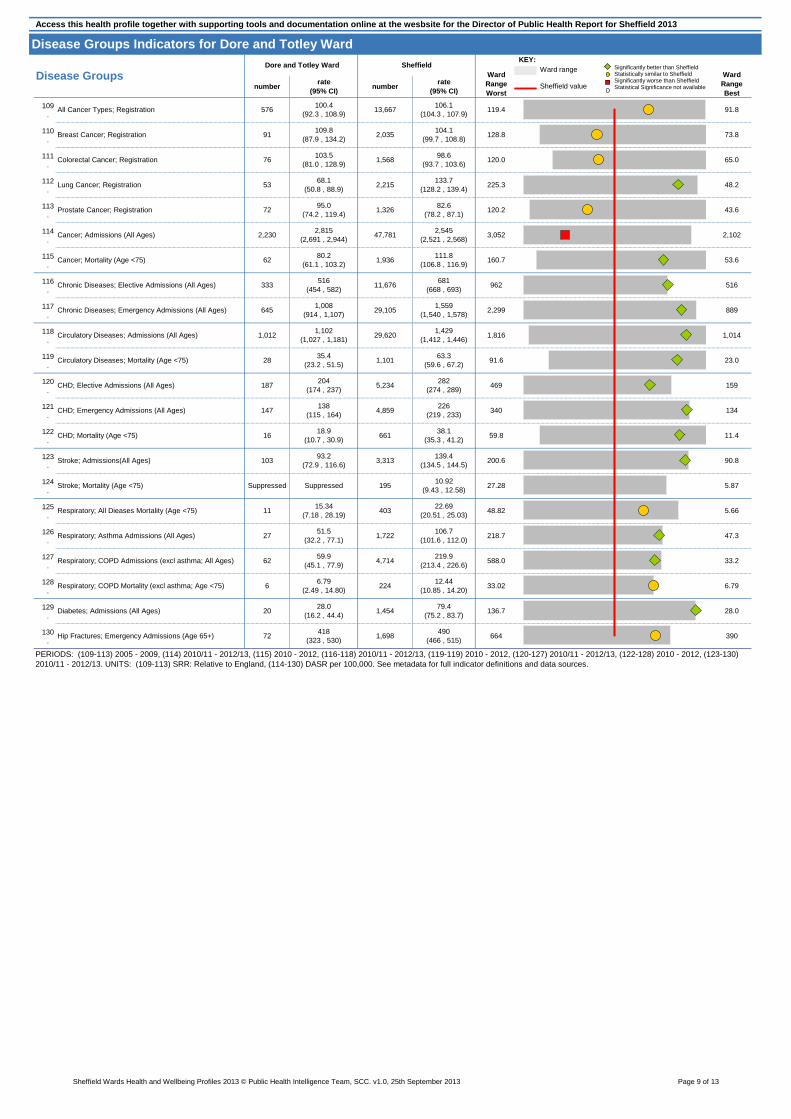
KEY:
109
.
110
.
111
.
112
.
113
.
114
.
115
.
116
.
117
.
118
.
119
.
120
.
121
.
122
.
123
.
124
.
125
.
126
.
127
.
128
.
129
.
130
.
1,101
490
(466 , 515)
PERIODS: (109-113) 2005 - 2009, (114) 2010/11 - 2012/13, (115) 2010 - 2012, (116-118) 2010/11 - 2012/13, (119-119) 2010 - 2012, (120-127) 2010/11 - 2012/13, (122-128) 2010 - 2012, (123-130)
2010/11 - 2012/13. UNITS: (109-113) SRR: Relative to England, (114-130) DASR per 100,000. See metadata for full indicator definitions and data sources.
390664
224
4,859
3,313
Diabetes; Admissions (All Ages) 2028.0
(16.2 , 44.4)
147
Stroke; Admissions(All Ages)
403
Hip Fractures; Emergency Admissions (Age 65+) 72
1,102
(1,027 , 1,181)
6.79
(2.49 , 14.80)
62
Circulatory Diseases; Mortality (Age <75)35.4
(23.2 , 51.5)
138
(115 , 164)
103
Circulatory Diseases; Admissions (All Ages) 1,012
Respiratory; All Dieases Mortality (Age <75)
27
CHD; Elective Admissions (All Ages)
CHD; Emergency Admissions (All Ages)
Stroke; Mortality (Age <75)
8891,559
(1,540 , 1,578)2,299
1,816
38.1
(35.3 , 41.2)59.8 11.4
282
(274 , 289)
226
(219 , 233)
6.79
91.6
1,722
469 159
23.0
22.69
(20.51 , 25.03)
90.8
5.87
5,234
33.2
53.6111.8
(106.8 , 116.9)
33.02
1,014
219.9
(213.4 , 226.6)
47.3218.7
1,429
(1,412 , 1,446)
962
12.44
(10.85 , 14.20)
120.282.6
(78.2 , 87.1)
3,052
681
(668 , 693)
63.3
(59.6 , 67.2)
340
106.7
(101.6 , 112.0)
139.4
(134.5 , 144.5)
516
Cancer; Admissions (All Ages) 2,230
588.0
2,545
(2,521 , 2,568)
4,714
2,102
5.66
160.7
47,781
119.4
Sheffield
106.1
(104.3 , 107.9)
rate
(95% CI)number
225.3
128.8
133.7
(128.2 , 139.4)
120.0
Ward
Range
Best
Ward
Range
Worst
Dore and Totley Ward
43.6
91.8
48.2
65.0
73.8
rate
(95% CI)
79.4
(75.2 , 83.7)1,454
645
204
(174 , 237)
1,936
2,815
(2,691 , 2,944)
11,676
187
29,620
1,008
(914 , 1,107)
418
(323 , 530)1,698
51.5
(32.2 , 77.1)
11 48.82
28.0
Disease Groups Indicators for Dore and Totley Ward
Disease Groups
104.1
(99.7 , 108.8)
576
number
13,667
109.8
(87.9 , 134.2)
98.6
(93.7 , 103.6)
Breast Cancer; Registration
100.4
(92.3 , 108.9)
91 2,035
76
1,326
All Cancer Types; Registration
80.2
(61.1 , 103.2)
1,568103.5
(81.0 , 128.9)
2,2155368.1
(50.8 , 88.9)Lung Cancer; Registration
Colorectal Cancer; Registration
59.9
(45.1 , 77.9)
15.34
(7.18 , 28.19)
28
Cancer; Mortality (Age <75)
195
Chronic Diseases; Elective Admissions (All Ages) 333516
(454 , 582)
Chronic Diseases; Emergency Admissions (All Ages)
Respiratory; Asthma Admissions (All Ages)
62
Prostate Cancer; Registration 72
10.92
(9.43 , 12.58)27.28
Respiratory; COPD Mortality (excl asthma; Age <75) 6
29,105
Respiratory; COPD Admissions (excl asthma; All Ages)
136.7
Suppressed Suppressed
93.2
(72.9 , 116.6)200.6
95.0
(74.2 , 119.4)
134
CHD; Mortality (Age <75) 1618.9
(10.7 , 30.9)661
Significantly better than Sheffield Statistically similar to Sheffield Significantly worse than Sheffield Statistical Significance not available
Ward range Sheffield value
Page 9 of 13Sheffield Wards Health and Wellbeing Profiles 2013 © Public Health Intelligence Team, SCC. v1.0, 25th September 2013
Access this health profile together with supporting tools and documentation online at the wesbsite for the Director of Public Health Report for Sheffield 2013
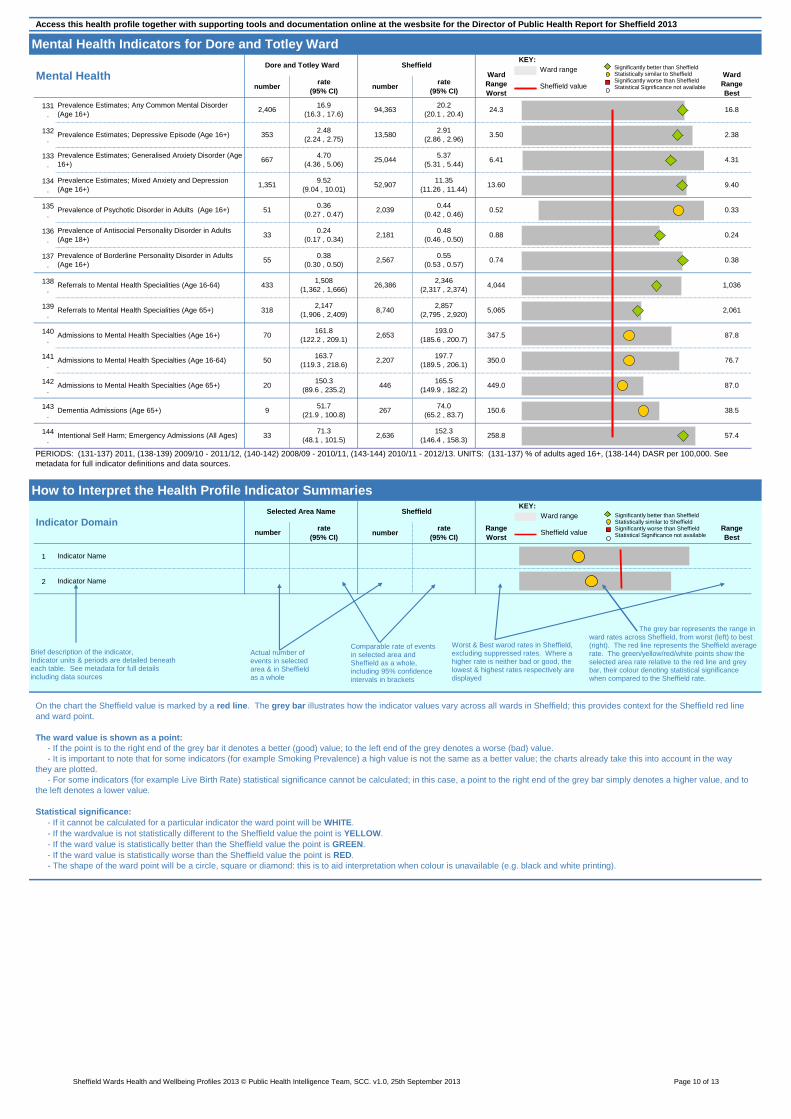
KEY:
131
.
132
.
133
.
134
.
135
.
136
.
137
.
138
.
139
.
140
.
141
.
142
.
143
.
144
.
KEY:
1
2
161.8
(122.2 , 209.1)
51
Selected Area Name
33 258.8
Indicator Name
152.3
(146.4 , 158.3)2,636
71.3
(48.1 , 101.5)
How to Interpret the Health Profile Indicator Summaries
165.5
(149.9 , 182.2)
197.7
(189.5 , 206.1)
Prevalence of Psychotic Disorder in Adults (Age 16+)
55
Prevalence of Antisocial Personality Disorder in Adults
(Age 18+)
0.24
(0.17 , 0.34)
0.38
(0.30 , 0.50)
On the chart the Sheffield value is marked by a red line. The grey bar illustrates how the indicator values vary across all wards in Sheffield; this provides context for the Sheffield red line
and ward point.
The ward value is shown as a point:
- If the point is to the right end of the grey bar it denotes a better (good) value; to the left end of the grey denotes a worse (bad) value.
- It is important to note that for some indicators (for example Smoking Prevalence) a high value is not the same as a better value; the charts already take this into account in the way
they are plotted.
- For some indicators (for example Live Birth Rate) statistical significance cannot be calculated; in this case, a point to the right end of the grey bar simply denotes a higher value, and to
the left denotes a lower value.
Statistical significance:
- If it cannot be calculated for a particular indicator the ward point will be WHITE.
- If the wardvalue is not statistically different to the Sheffield value the point is YELLOW.
- If the ward value is statistically better than the Sheffield value the point is GREEN.
- If the ward value is statistically worse than the Sheffield value the point is RED.
- The shape of the ward point will be a circle, square or diamond: this is to aid interpretation when colour is unavailable (e.g. black and white printing).
Intentional Self Harm; Emergency Admissions (All Ages)
Indicator Domain
PERIODS: (131-137) 2011, (138-139) 2009/10 - 2011/12, (140-142) 2008/09 - 2010/11, (143-144) 2010/11 - 2012/13. UNITS: (131-137) % of adults aged 16+, (138-144) DASR per 100,000. See
metadata for full indicator definitions and data sources.
Range
Best
Sheffield
57.4
Range
Worst
rate
(95% CI)number
Indicator Name
rate
(95% CI)number
163.7
(119.3 , 218.6)
20150.3
(89.6 , 235.2)
76.7
267
446 87.0
Dementia Admissions (Age 65+)
50
9
70
Referrals to Mental Health Specialities (Age 65+) 318
Admissions to Mental Health Specialties (Age 65+)
Admissions to Mental Health Specialties (Age 16-64)
Admissions to Mental Health Specialties (Age 16+) 87.8
350.0
449.0
347.5
2,061
1,036
Prevalence Estimates; Mixed Anxiety and Depression
(Age 16+)
33
Prevalence of Borderline Personality Disorder in Adults
(Age 16+)
Referrals to Mental Health Specialities (Age 16-64) 433
rate
(95% CI)
4.70
(4.36 , 5.06)
Prevalence Estimates; Depressive Episode (Age 16+)
2,406
667
0.33
9.4052,9079.52
(9.04 , 10.01)
11.35
(11.26 , 11.44)
13,580
6.4125,044
0.36
(0.27 , 0.47)
2.48
(2.24 , 2.75)
1,351
Dore and Totley Ward
Ward
Range
Worst
Prevalence Estimates; Generalised Anxiety Disorder (Age
16+)
Ward
Range
Best
Prevalence Estimates; Any Common Mental Disorder
(Age 16+)16.8
353
24.3
number
1,508
(1,362 , 1,666)
8,740
2,207
2,147
(1,906 , 2,409)
51.7
(21.9 , 100.8)
16.9
(16.3 , 17.6)
20.2
(20.1 , 20.4)94,363
2.91
(2.86 , 2.96)2.38
2,039
2,346
(2,317 , 2,374)
2,857
(2,795 , 2,920)
Mental Healthrate
(95% CI)number
Sheffield
2,653193.0
(185.6 , 200.7)
3.50
5,065
Mental Health Indicators for Dore and Totley Ward
26,386
0.240.88
0.38
2,1810.48
(0.46 , 0.50)
0.742,567
4,044
38.574.0
(65.2 , 83.7)150.6
4.31
0.52
5.37
(5.31 , 5.44)
13.60
0.44
(0.42 , 0.46)
0.55
(0.53 , 0.57)
Brief description of the indicator, Indicator units & periods are detailed beneath each table. See metadata for full details including data sources
Actual number of events in selected area & in Sheffield as a whole
Comparable rate of events in selected area and Sheffield as a whole, including 95% confidence intervals in brackets
Worst & Best warod rates in Sheffield, excluding suppressed rates. Where a higher rate is neither bad or good, the lowest & highest rates respectively are displayed
The grey bar represents the range in ward rates across Sheffield, from worst (left) to best (right). The red line represents the Sheffield average rate. The green/yellow/red/white points show the selected area rate relative to the red line and grey bar, their colour denoting statistical significance when compared to the Sheffield rate.
Significantly better than Sheffield Statistically similar to Sheffield Significantly worse than Sheffield Statistical Significance not available
Ward range Sheffield value
Significantly better than Sheffield Statistically similar to Sheffield Significantly worse than Sheffield Statistical Significance not available
Ward range Sheffield value
Page 10 of 13Sheffield Wards Health and Wellbeing Profiles 2013 © Public Health Intelligence Team, SCC. v1.0, 25th September 2013

P
P
D
e
W
i
L
i
f
NOTE: The rules for assigning ICD10 codes to the underlying cause of death has recently changed from Jan 2011. This may have had an effect on the number of deaths for some causes
for that year. However, most of these indicators are shown for time periods over several years, so will this will have had little impact on the data.
Domain
14
28
20
Source: Public Health Births, Population Health Register. Sheffield Residents.
Metadata
13
25
41
Source: PH Mortality, Public Health Births, Population Health Register. Based on year of death registration.
Metadata and Supporting Information
Profile
Indicator
Reference
Population
21
1
39
Source: Public Health Births, Population Health Register. Sheffield Residents.
49
44
16
18
31
11
47
2
12
Source: Census 2011.
Source: Census 2011.
Source: Department for Communities and Local Government, Child Well-being Index, 2009, Population Health Register April 2011 Snapshot. A higher score indicates a
worse level of child well-being. Attributed from published LSOA level figures. August 2012 calculation.
Source: Department for Communities and Local Government, Child Well-being Index, 2009, Population Health Register April 2011 Snapshot. A higher score indicates a
worse level of child well-being. Attributed from published LSOA level figures. August 2012 calculation.
Source: Department for Communities and Local Government, Child Well-being Index, 2009, Population Health Register April 2011 Snapshot. A higher score indicates a
worse level of child well-being. Attributed from published LSOA level figures. August 2012 calculation.
Source: Performance & Analysis Service, Children Young People & Families Directorate, Sheffield City Council. Percentage of pupils in further education, employment with
training or non-employed training in the September following the completion of year 11. Attributed to neighbourhoods based on pupils' postcodes of residence.
46
Source: Performance & Analysis Service, Children Young People & Families Directorate, Sheffield City Council. Percentage of pupils in year R (age 4-5) scoring 78 points
or more including six points of more in each of CLL and PSED. Attributed to Areas based on pupils' postcodes of residence.
PHOF ID: 1.2(S1).
Source: Department for Communities and Local Government, Child Well-being Index, 2009, Population Health Register April 2011 Snapshot. A higher score indicates a
worse level of child well-being. Attributed from published LSOA level figures. August 2012 calculation.
Source: Department for Communities and Local Government, Child Well-being Index, 2009, Population Health Register April 2011 Snapshot. A higher score indicates a
worse level of child well-being. Attributed from published LSOA level figures. August 2012 calculation.
Source: HMRC: 2010 Child Poverty data at ward level. % of children living in families in receipt of Child Tax Credit whose reported income is less than 60 per cent of the
median income or in receipt of IS or (Income-Based) JSA, divided by the total number of children in the area (determined by Child Benefit data). PHOF Indicator 1.1.
PHOF ID: 1.1(S2).
Source: Performance & Analysis Service, Children Young People & Families Directorate, Sheffield City Council. Percentage of pupils attaining 5 or more GCSEs, including
English and maths, at Grade C or above. Attributed to Areas based on pupils' postcodes of residence. Data is from end of Acedemic year.
PHOF ID: 1.3(S4).
55
52
Source: HMRC: 2010 Child Poverty data. Number of all sheffield children living in families in receipt of Child Tax Credit whose reported income is less than 60 per cent of
the median income or in receipt of IS or (Income-Based) JSA, divided by the total number of children in the area (determined by Child Benefit data).
PHOF ID: 1.1(S1).
Source: Census 2011.
7
Source: Census 2011.
3 Source: Public Health Births, Population Health Register. Sheffield Residents.
Source: Department for Communities and Local Government, Indices of Deprivation, Population Health Register April 2011 Snapshot. A higher score indicates higher
deprivation. Attributed from published LSOA level figures. May 2012 calculation.
29
Source: Census 2011.
Source: Department for Communities and Local Government, Indices of Deprivation, Population Health Register April 2011 Snapshot. A higher score indicates higher
deprivation. Attributed from published LSOA level figures. May 2012 calculation.
Source: Department for Communities and Local Government, Indices of Deprivation, Population Health Register April 2011 Snapshot. A higher score indicates higher
deprivation. Attributed from published LSOA level figures. May 2012 calculation.
10
Source: British Crime Survey. Safer and Sustainable Communities Support Team, Community Services, Sheffield City Council. Total Crime: includes all types of crime.
Source: Public Health Mortality files, Public Health Births Files, Population Health Register. Life expectancy is the average number of years a new-born baby would survive,
were he or she to experience the particular area's age-specific mortality rates for that time period throughout his or her life.
PHOF ID: 0.1(ii)M.
Source: Census 2011.
9
32
19
Source: Census 2011.
Source: Census 2011.
4 Source: Sheffield LA Children Young People & Families Dept. Sheffield LA maintained schools and academies.
5 Source: Census 2011.
6
Source: Department for Communities and Local Government, Indices of Deprivation, Population Health Register April 2011 Snapshot. A higher score indicates higher
deprivation. Attributed from published LSOA level figures. May 2012 calculation.
Source: Census 2011.
Source: Census 2011.
Source: Census 2011.
8 Source: Census 2011.
Source: Census 2011.
15
Source: Census 2011.
17
Source: Census 2011.
22 Source: Census 2011.
30
Source: Census 2011.
Source: Department for Communities and Local Government, Indices of Deprivation, Population Health Register April 2011 Snapshot. A higher score indicates higher
deprivation. Attributed from published LSOA level figures. May 2012 calculation.
34
Source: Department for Communities and Local Government, Child Well-being Index, 2009, Population Health Register April 2011 Snapshot. A higher score indicates a
worse level of child well-being. Attributed from published LSOA level figures. August 2012 calculation.
54
Source: Department for Communities and Local Government, Indices of Deprivation, Population Health Register April 2011 Snapshot. A higher score indicates higher
deprivation. Attributed from published LSOA level figures. May 2012 calculation.
33
Source: Performance & Analysis Service, Children Young People & Families Directorate, Sheffield City Council. Percentage of pupils in year 6 (age 10-11) achieving level 4
and above in English & Maths. Attributed to Areas based on pupils' postcodes of residence.
37
45
42
Source: Census 2011.
26 Source: Census 2011.
27 Source: Census 2011.
38
40
Source: Campaign to End Child Poverty, 2012. This is not a direct measure of exactly how many children are in poverty on the official definition, but is the closest to an
equivalent measure End Child Poverty has of local levels of child poverty (these data should therefore not be used for direct comparisons with official national and regional
figures). The figures are estimates for mid-2012.
Source: Public Health Mortality files, Public Health Births Files, Population Health Register. Life expectancy is the average number of years a new-born baby would survive,
were he or she to experience the particular area's age-specific mortality rates for that time period throughout his or her life.
PHOF ID: 0.1(ii)F.
Source: Census 2011.
23 Source: Census 2011.
24 Source: Census 2011.
Source: Department for Communities and Local Government, Child Well-being Index, 2009, Population Health Register April 2011 Snapshot. A higher score indicates a
worse level of child well-being. Attributed from published LSOA level figures. August 2012 calculation.
Wider Determinants
Life Expectancy &
Mortality
51
48
43
50
53
Deprivation
35
Source: Department for Communities and Local Government, Child Well-being Index, 2009, Population Health Register April 2011 Snapshot. A higher score indicates a
worse level of child well-being. Attributed from published LSOA level figures. August 2012 calculation.
36Source: Department for Communities and Local Government, Indices of Deprivation, Population Health Register April 2011 Snapshot. A higher score indicates higher
deprivation. Attributed from published LSOA level figures. May 2012 calculation.
Source: Department for Communities and Local Government, Indices of Deprivation, Population Health Register April 2011 Snapshot. A higher score indicates higher
deprivation. Attributed from published LSOA level figures. May 2012 calculation.
Population Ethnicity
Page 11 of 13Sheffield Wards Health and Wellbeing Profiles 2013 © Public Health Intelligence Team, SCC. v1.0, 25th September 2013

0
L
i
G
e
A
L
i
C
h
i
General Hospital
Activity
Profile
Indicator
Reference
58
75
Metadata
Source: PH Mortality, Public Health Births, Population Health Register. Based on year of death registration.
PHOF ID: 0.1(S5)F.57
56
87
85
Source: A&E minimum dataset, Public Health Births, Population Health Register. Includes Minor Injuries at RHH, NGH A&E and Childrens Hospital A&E. Excludes walk in
centre.
Source: A&E minimum dataset, Public Health Births, Population Health Register. Includes Minor Injuries at RHH, NGH A&E and Childrens Hospital A&E. Excludes walk in
centre.
Source: A&E minimum dataset, Public Health Births, Population Health Register. Includes Minor Injuries at RHH, NGH A&E and Childrens Hospital A&E. Excludes walk in
centre.
65
Source: Inpatient CMDS, Public Health Births, Population Health Register. Elective admissions. Includes admissions to external hospitals.
102
63
Source: Chlamydia Screening Programme. Note that a low rate may indicate low take up of screening or low incidence of chlamydia.
PHOF ID: 3.2.
Source: Inpatient CMDS, Public Health Births, Population Health Register. Elective admissions. Includes admissions to external hospitals.
Source: NWPHO AAFs Nov 2008, PH Mortality, Public Health Births, Population Health Register. Deaths with an alcohol-attributable condition recorded as the underlying
cause. Each death is counted as a whole or a fraction of a death based on the likelihood of a death for that age, sex and condition being alcohol related. Based on year of
death registration.
Source: North West Public Health Observatory Local Alcohol Profiles for England 2011 adjusted for age and sex using General Household Survey 2008 data. Estimated %
of adult population aged 16+ consuming more than double the recommended daily allowance of alcohol on one or more days per week (ie men > 8 units, women > 6 units).
PHOF ID: 2.18(S2).
62
Source: PH Mortality, Public Health Births, Population Health Register. Based on year of death registration.
PHOF ID: 0.1(S5)M.
Source: Protos. Includes mothers registered with a Sheffield GP and delivering a baby at 23 weeks or more gestation at a STHT hospital or at home.
PHOF ID: 2.3.
Source: From Adult Social Care.
61
89
Source: PH Mortality, Public Health Births, Population Health Register. Based on year of death registration.
PHOF ID: 0.1(S6)M.
Source: Inpatient CMDS, Public Health Births, Population Health Register. Emergency Admissions (excluding transfers). Includes admissions to external hospitals.
Source: North West Public Health Observatory Local Alcohol Profiles for England 2011 adjusted for age and sex using General Household Survey 2008 data. Estimated %
of drinking population aged 16+ consuming more than 50 units per week (males) or 35 units per week (females) - denominator excludes abstainers.
72
Source: Inpatient CMDS, Public Health Births, Population Health Register. Emergency Admissions (excluding transfers). Includes admissions to external hospitals.
69
Source: From Adult Social Care.
Source: Inpatient CMDS, Public Health Births, Population Health Register. Emergency Admissions (excluding transfers). Includes admissions to external hospitals.
Source: GUM clinic, STHT, Public Health Register population 16+ April 2010. Sexually Transmitted Infections (STIs) (Chlamydia, Gonorrohea, Herpes, Syphilis, Anogenital
warts).
80
Source: Inpatient CMDS, Public Health Births, Population Health Register. Emergency Admissions (excluding transfers). Includes admissions to external hospitals.
88
70
81
84
73
Source: NWPHO AAFs Nov 2008, Inpatient CMDS, Public Health Births, Population Health Register(April Snapshots). Admissions with an alcohol-specific condition
recorded in the primary or any secondary position. Includes admissions to external hospitals.
Source: From Adult Social Care.
92
91
Source: PH Mortality, Population Health Register, Public Health Births, NHS Information Centre Statistics on Smoking 2010, Health Survey for England 2009. This indicator
attributes a fraction of deaths to smoking based on the relative risk (by cause, age and gender) of a death being smoking related and the likelihood that the deceased was
a smoker or ex-smoker. Based on year of death registration.
PHOF ID: 2.14(S).
Source: National Child Measurement Programme. % of children who are obese (excluding overweight). Excludes children attending special schools. Data may be
suppressed for some areas due to small numbers. 3 year pooled data.
PHOF ID: 2.6(i)(S).
Source: PH Mortality, Public Health Births. Deaths in infants aged under 1 year per 1,000 live births. Based on year of death registration.
PHOF ID: 4.1.
82
90
100
Source: Inpatient CMDS, Public Health Births, Population Health Register. Elective admissions. Includes admissions to external hospitals.
Source: North West Public Health Observatory Local Alcohol Profiles for England 2011 adjusted for age and sex using General Household Survey 2008 data. Estimated %
of adult population aged 16+ reporting abstinence from drinking alcohol.
71
Source: Protos. Mothers delivering in the period who had a BMI of 25+ at booking expressed as a percentage of all mothers delivering in the period. Includes Sheffield
resident mothers registered with a Sheffield GP and delivering in an NHS hospital or at home. Excludes mothers with unknown BMI.
93
101
Source: A&E minimum dataset, Public Health Births, Population Health Register. Includes Minor Injuries at RHH, NGH A&E and Childrens Hospital A&E. Excludes walk in
centre.
Source: PH Mortality, Public Health Births, Population Health Register. Based on year of death registration.
83
95
94
Source: PH Mortality, Public Health Births, Population Health Register. Based on year of death registration.
PHOF ID: 0.1(S6)F.
96
Source: Protos. Mothers delivering in the period who had a BMI of 30+ at booking expressed as a percentage of all mothers delivering in the period. Includes Sheffield
resident mothers registered with a Sheffield GP and delivering in an NHS hospital or at home. Excludes mothers with unknown BMI.
Source: Integrated Household Survey 2010/11 adjusted for age and sex using Yorkshire and the Humber Integrated Household Survey 2010 data and Population Health
register April 2010 snapshot, and adjusted for deprivation using Council benefits data and SHAIPS 2001 local survey data. Estimated % of adult population aged 18+ who
currently smoke cigarettes.
PHOF ID: 2.14.
Source: Sheffield Stop Smoking Service Database, HSfE 2009, Population Health Register Populations 09/10, SHAIPS II, Sheffield City Council Benefits dataset 2008. The
neighbourhood in which the stop smoking service client lived, not necessarily where the service was delivered. Sheffield total excludes non Sheff residents.
Source: Public Health Births. Expressed as a percentage. Includes births to Sheffield resident mothers wherever they occur. Births of unknown weight are excluded.
PHOF ID: 2.1.
Source: Public Health Births, Population Health Register. Expressed as the number of live births per 1,000 population. Includes births to Sheffield resident mothers
wherever they occur.
86
59
Source: NWPHO AAFs Nov 2008, Inpatient CMDS, Public Health Births, Population Health Register(April Snapshots). Admissions with an alcohol-attributable condition
recorded in the primary or any secondary position. Each admissions is counted as a whole or a fraction of an based on the likelihood of an admission for that condition, age
and sex being alcohol-related. Includes admissions to external hospitals.
PHOF ID: 2.18(S1).
Source: Sheffield Stop Smoking Service Database. The neighbourhood in which the stop smoking service client lived, not necessarily where the service was delivered.
Sheffield total excludes non Sheff residents.
60
Domain
67
64
66
76
79 Source: From Adult Social Care.
Source: From Adult Social Care.
78
Source: From Adult Social Care.
68
Metadata and Supporting Information (continued)
Source: From Adult Social Care.
Source: From Adult Social Care.
Source: Inpatient CMDS, Public Health Births, Population Health Register. Elective admissions. Includes admissions to external hospitals.
74
77
Life Expectancy &
Mortality
Adult Social Care
Lifestyle
Children & Young
People
99
Source: National Child Measurement Programme. % of children who are overweight or obese. Excludes children attending special schools. Data may be suppressed for
some areas due to small numbers.
PHOF ID: 2.6(ii).
Source: National Child Measurement Programme. % of children who are obese (excluding overweight). Excludes children attending special schools. Data may be
suppressed for some areas due to small numbers.
PHOF ID: 2.6(ii)(S).Source: National Child Measurement Programme. % of children who are overweight or obese. Excludes children attending special schools. Data may be suppressed for
some areas due to small numbers. 3 year pooled data.
PHOF ID: 2.6(i).
97
98
Page 12 of 13Sheffield Wards Health and Wellbeing Profiles 2013 © Public Health Intelligence Team, SCC. v1.0, 25th September 2013

0
C
h
i
D
i
s
M
e
n
105
Source: Adult Psychiatric Morbidity Survey (APMS) in England 2007, Population Health Register April 2011, Council Benefits dataset August 2010, NPMS Index. Episode in
previous week.
Based on APMS 2007, p40, table 2.3 using NPMSDep Index deprivation weighting in line with IAPT Workforce Capacity Tool, March 2008 methodology. Includes
diagnosed and undiagnosed. Confidence intervals do not take into account levels of uncertainty associated with assumptions made in the modelled estimate methodology.
Source: Inpatient CMDS, Public Health Births, Population Health Register. Emergency admissions (excluding transfers) with a primary diagnosis of hip fracture (ICD10:
S72.0, S72.1 and S72.2). Includes admissions to external hospitals.
PHOF ID: 4.14(i).
120Source: Inpatient CMDS, Public Health Births, Population Health Register. Elective Admissions with coronary heart disease recorded as the primary diagnosis (ICD10:I20-
I25). Includes admissions to external hospitals.
130
126Source: Inpatient CMDS, Public Health Births, Population Health Register. Admissions with asthma recorded as the primary diagnosis (ICD10:J45-J46). Includes
admissions to external hospitals.
125
Source: PH Mortality, Public Health Births, Population Health Register. Deaths with coronary heart disease recorded as the underlying cause (ICD10:I20-I25). Based on
year of death registration.
PHOF ID: 4.7(i).
Source: PH Mortality, Public Health Births, Population Health Register. Deaths with cerebrovascular disease (excluding transient ischaemic attack) recorded as the
underlying cause (ICD10:I60-I69). Based on year of death registration.
Source: Inpatient CMDS, Public Health Births, Population Health Register. Admissions with cerebrovascular disease (excluding transient ischaemic attack) recorded as the
primary diagnosis (ICD10:I60-I69). Includes admissions to external hospitals.
116
Source: Inpatient CMDS, Public Health Births, Population Health Register. Emergency Admissions (excluding transfers) with coronary heart disease recorded as the
primary diagnosis (ICD10:I20-I25). Includes admissions to external hospitals.
Source: Inpatient CMDS, Public Health Births, Population Health Register. Emergency Admissions (excluding transfers) with respiratory disease, coronary heart disease or
diabetes recorded as the primary diagnosis (ICD10:J00-J99, I20-I25 or E10-E14). Includes admissions to external hospitals.
119
Source: PH Mortality, Public Health Births, Population Health Register. Deaths with circulatory disease recorded as the underlying cause (ICD10:I00-I99). Based on year of
death registration.
PHOF ID: 4.4(i).
121
118
Source: Inpatient CMDS, Public Health Births, Population Health Register. Elective Admissions with respiratory disease, coronary heart disease or diabetes recorded as the
primary diagnosis (ICD10:J00-J99, I20-I25 or E10-E14). Includes admissions to external hospitals.
122Source: PH Mortality, Public Health Births, Population Health Register. Deaths with coronary heart disease recorded as the underlying cause (ICD10:I20-I25). Based on
year of death registration.
110
Source: Inpatient CMDS, Public Health Births, Population Health Register. Admissions with Circulatory disease recorded as the underlying cause (ICD10:I00-I99). Includes
admissions to external hospitals.
117
Source: National Cancer Data Repository, Public Health England, Local Health Profiles 2011. Incidence of colorectal cancer (ICD10 C18-C20).
Ward data has been estimated by PHE from MSOA data by using population weightings using the mid-2010 all age population of the OAs that make up each ward and
MSOA (using data and lookups provided by ONS).
Source: Inpatient CMDS, Public Health Births, Population Health Register. Admissions with cancer recorded as the primary diagnosis (ICD10:C00-C99). Includes
admissions to external hospitals.
115
Source: National Cancer Data Repository, Public Health England, Local Health Profiles 2011. Incidence of all cancer (ICD10 C00-C97 excluding C44).
Ward data has been estimated by PHE from MSOA data by using population weightings using the mid-2010 all age population of the OAs that make up each ward and
MSOA (using data and lookups provided by ONS).
109
Source: National Cancer Data Repository, Public Health England, Local Health Profiles 2011. Incidence of lung cancer (ICD10 C33-C34).
Ward data has been estimated by PHE from MSOA data by using population weightings using the mid-2010 all age population of the OAs that make up each ward and
MSOA (using data and lookups provided by ONS).
111
103
141Source: Inpatient CMDS, Public Health Births, Population Health Register. Admissions to mental health specialties (specialty codes 710-724). Includes admissions to
external hospitals.
Source: Adult Psychiatric Morbidity Survey (APMS) in England 2007, Population Health Register April 2011, Council Benefits dataset August 2010, NPMS Index. Episode in
previous week.
Based on APMS 2007, p40, table 2.3 using NPMSDep Index deprivation weighting in line with IAPT Workforce Capacity Tool, March 2008 methodology. Includes
diagnosed and undiagnosed. Confidence intervals do not take into account levels of uncertainty associated with assumptions made in the modelled estimate methodology.
Source: Protos. Includes mothers registered with a Sheffield GP and delivering a baby at 23 weeks or more gestation at a STHT hospital or at home.
Source: Protos. Percentage of resident babies becoming 8 weeks old in the period who are known to have been receiving breastmilk at 6-8 weeks of age. Excludes babies
who were not registered with Child Health by 12 weeks of age and those who have died. Babies with unknown feeding status at 6-8 weeks are included in the denominator.
PHOF ID: 2.2 (ii).
Metadata and Supporting Information (continued)
Source: Inpatient CMDS, Protos, Population Health Register. Conceptions occuring during the time period based on delivery, abortion and miscarriage data. Abortions are
assumed to take place 12 weeks after conception. Deliveries are assumed to take place at 38 weeks gestation.
PHOF ID: 2.4.
Source: Inpatient CMDS, Public Health Births, Population Health Register. Admissions with primary diagnosis of dementia (ICD10: F00-F03). Includes admissions to
external hospitals.
106
134
113
107
143
140
131
Source: Inpatient CMDS, Public Health Births, Population Health Register. Admissions to mental health specialties (specialty codes 710-724). Includes admissions to
external hospitals.
114
132
129
142
112
137
Profile
Indicator
Reference
133
Source: Inpatient CMDS, Public Health Births, Population Health Register. Admissions to mental health specialties (specialty codes 710-724). Includes admissions to
external hospitals.
Source: National Cancer Data Repository, Public Health England, Local Health Profiles 2011. Incidence of breast cancer (ICD10 C50).
Ward data has been estimated by PHE from MSOA data by using population weightings using the mid-2010 all age population of the OAs that make up each ward and
MSOA (using data and lookups provided by ONS).
Source: National Cancer Data Repository, Public Health England, Local Health Profiles 2011. Incidence of prostate cancer (ICD10 C61).
Ward data has been estimated by PHE from MSOA data by using population weightings using the mid-2010 all age population of the OAs that make up each ward and
MSOA (using data and lookups provided by ONS).
Source: Sheffield Dental Public Health Unit, 2007/08 School Year. This was a sample survey of Sheffield school children and based on an opt-in approach to participation,
and so should not be compared to previous 5 yr survey data.
PHOF ID: 4.2.
Source: Protos. Includes mothers solely breastfeeding and those breastfeeding in conjunction with complements or artificial methods. Includes mothers registered with a
Sheffield GP and delivering a baby at 23 weeks or more gestation at a STHT hospital or at home.
PHOF ID: 2.2 (i).
108
104
Source: Inpatient CMDS, Public Health Births, Population Health Register. Emergency admissions (excluding transfers) caused by unintentional and deliberate injuries
(Where the first external cause code recorded (ICD10: V01-Y98) is not between X33-X39 or X52 (forces of nature)). Episodes ending in the period.
PHOF ID: 2.7(i).
144
Source: Inpatient CMDS, Public Health Births, Population Health Register. Emergency admissions (excluding transfers) where the first External Cause of Morbidity and
Mortality diagnosis (V01 - Y98) is between X60 -X84 (Intentional Self Harm). Includes admissions at external hospitals.
PHOF ID: 2.10(S).
Domain
123
124
Children & Young
People
Disease Groups
Mental HealthSource: Adult Psychiatric Morbidity Survey (APMS) in England 2007, Population Health Register April 2011, Council Benefits dataset August 2010, MINI2000 Index.
Prevalence of Antisocial Personality Disorder (ASPD). Based on APMS 2007, p116, table 6.1 using MINI2000 deprivation adjustment. Includes diagnosed and
undiagnosed. Confidence intervals do not take into account levels of uncertainty associated with assumptions made in the modelled estimate methodology.
138
Source: Referral & Outpatient datasets, Public Health Births, Population Health Register. Referrals to Sheffield providers sourced from referrals dataset (includes referrals
which do not result in any contact with the service). Referrals to external providers sourced from outpatient datasets (using first patient attendances as proxy measure and
therefore excludes referrals which do not result in any contact with the service).
135
Source: Adult Psychiatric Morbidity Survey (APMS) in England 2007, Population Health Register April 2011, Council Benefits dataset August 2010, MINI2000 Index.
Prevalence of Psychotic Disorder (in the last year). Based on APMS 2007, p99, table 5.1 using MINI2000 deprivation adjustment. Includes diagnosed and undiagnosed.
Confidence intervals do not take into account levels of uncertainty associated with assumptions made in the modelled estimate methodology.
139
Source: Referral & Outpatient datasets, Public Health Births, Population Health Register. Referrals to Sheffield providers sourced from referrals dataset (includes referrals
which do not result in any contact with the service). Referrals to external providers sourced from outpatient datasets (using first patient attendances as proxy measure and
therefore excludes referrals which do not result in any contact with the service).
128Source: PH Mortality, Public Health Births, Population Health Register. Deaths with COPD Respiritory disease recorded as the underlying cause (ICD10:J40-J44). Based on
year of death registration.
136
Source: Adult Psychiatric Morbidity Survey (APMS) in England 2007, Population Health Register April 2011, Council Benefits dataset August 2010, MINI2000 Index.
Prevalence of Antisocial Personality Disorder (ASPD). Based on APMS 2007, p116, table 6.1 using MINI2000 deprivation adjustment. Includes diagnosed and
undiagnosed. Confidence intervals do not take into account levels of uncertainty associated with assumptions made in the modelled estimate methodology.
Source: Adult Psychiatric Morbidity Survey (APMS) in England 2007, Population Health Register April 2011, Council Benefits dataset August 2010, NPMS Index. Episode in
previous week.
Based on APMS 2007, p40, table 2.3 using NPMSDep Index deprivation weighting in line with IAPT Workforce Capacity Tool, March 2008 methodology. Includes
diagnosed and undiagnosed. Confidence intervals do not take into account levels of uncertainty associated with assumptions made in the modelled estimate methodology.
Source: Inpatient CMDS, Public Health Births, Population Health Register. Admissions with COPD (excluding asthma) recorded as the primary diagnosis (ICD10:J40-
J44,J47). Includes admissions to external hospitals.
Source: Inpatient CMDS, Public Health Births, Population Health Register. Admissions with diabetes recorded as the primary diagnosis (ICD10:E10-E14). Includes
admissions to external hospitals.
127
Source: PH Mortality, Public Health Births, Population Health Register. Deaths with cancer recorded as the underlying cause (ICD10:C00-C99). Based on year of death
registration.
PHOF ID: 4.5(i).
Metadata
Page 13 of 13Sheffield Wards Health and Wellbeing Profiles 2013 © Public Health Intelligence Team, SCC. v1.0, 25th September 2013
Related Documents