CHAPTER-I INTRODUCTION AND RESEARCH DESIGN OF THE STUDY The London Stock exchange was the world first stock exchange. It was formed in 1773. In the course of time, France followed the example of London and soon after Germany and America came into the field. Indian stock markets are one of the o ldest in Asia. Its history dates back to nearly 200 years ago. Trade in securities took place even in the eighteenth century. At the time dealings in securities were not regulated by any code or rules and no hours to transact business were prescribed. By 1830’s business on corporate stocks and shares in Bank and Cotton presses took place in Bombay. Though the trading list was broader in 1839, there were only half a dozen brokers recognized by banks and merchants during 1840 and 1850. The 1850’s witnessed a rapid development of commercial enterprise and brokerage business attracted many men into the field and by 1860 the number of brokers increased into 60. In 1860-61 the American Civil War broke out and cotton supply from United state of Europe was stopped. The ‘Share Mania’ in India begun. The number of brokers increased to about 200 to 250.However, at the end of the American Civil War, in 1865, a disastrous slump began (for example, Bank of Bombay Share which had touched Rs,2850 could only be sold at Rs,87) At the end of the America Civil War, the brokers Who thrived out of Civil War in 1874, found a place in a street (now appropriately called as Dalal Street) where they wo uld conveniently assemble and transact business. In 1887, they formally established in Bombay, the “Native share and Stock Broker’s Association” which is alternatively known as “The Stock Exchange”. During the Second World War boom, a number of stock exchanges came into being in different part of the country. Their number increased from 7 to 21 within the period ranging from 1939 to 1945. But most of them were closed soon. Twenty one Stock Exchange have been so far by the Government under the Act. Of them permanent recognition has been given only to Bombay Stock Exchange. 1

Welcome message from author
This document is posted to help you gain knowledge. Please leave a comment to let me know what you think about it! Share it to your friends and learn new things together.
Transcript
8/6/2019 Share Main Project
http://slidepdf.com/reader/full/share-main-project 1/53
CHAPTER-I
INTRODUCTION AND RESEARCH DESIGN OF THE STUDY
The London Stock exchange was the world first stock exchange. It was formed in 1773. In
the course of time, France followed the example of London and soon after Germany and America
came into the field. Indian stock markets are one of the oldest in Asia. Its history dates back to
nearly 200 years ago. Trade in securities took place even in the eighteenth century. At the time
dealings in securities were not regulated by any code or rules and no hours to transact business
were prescribed. By 1830’s business on corporate stocks and shares in Bank and Cotton presses
took place in Bombay. Though the trading list was broader in 1839, there were only half a dozen
brokers recognized by banks and merchants during 1840 and 1850.
The 1850’s witnessed a rapid development of commercial enterprise and brokerage
business attracted many men into the field and by 1860 the number of brokers increased into 60.
In 1860-61 the American Civil War broke out and cotton supply from United state of Europe was
stopped. The ‘Share Mania’ in India begun. The number of brokers increased to about 200 to
250.However, at the end of the American Civil War, in 1865, a disastrous slump began (for example, Bank of Bombay Share which had touched Rs,2850 could only be sold at Rs,87)
At the end of the America Civil War, the brokers Who thrived out of Civil War in 1874,
found a place in a street (now appropriately called as Dalal Street) where they would
conveniently assemble and transact business. In 1887, they formally established in Bombay, the
“Native share and Stock Broker’s Association” which is alternatively known as “The Stock
Exchange”. During the Second World War boom, a number of stock exchanges came into being
in different part of the country. Their number increased from 7 to 21 within the period ranging
from 1939 to 1945. But most of them were closed soon. Twenty one Stock Exchange have been
so far by the Government under the Act. Of them permanent recognition has been given only to
Bombay Stock Exchange.
1
8/6/2019 Share Main Project
http://slidepdf.com/reader/full/share-main-project 2/53
Indian Capital Market – An Overview:
Capital market is the market for the mobilization of long-term funds. It refers to “allfacilities and institutional arrangements for borrowing and lending term funds”.Capital market
is concerned with rising of money capital for the purpose of investments.
The Indian capital market can be broadly classified into gilt-edged market and industrial
securities market. Gilt-edged market deals with government and non-governmental securities
backed by RBI whereas; the industrial capital market deals with shares and debentures of old
and new companies. The industrial securities market can be further classified into primary and
secondary market. Primary market is concerned with the issues of shares, preferred stock,
debentures of non-governmental public Ltd. Companies and also raising fresh capital by public
sector units through bonds. Secondary market is concerned with the trading of old or already
issued securities.
These securities are traded in an organized market called as stock exchange. Stock
exchange means “no body of individuals, whether incorporated of not, constituted for the
purpose of regulations or controlling the business of buying, selling or dealing in securities.
Before independence, the capital market was not developed due to poor industrial
growth. Only very few companies existed, and hence the number of securities traded was
smaller. There were only few individual investors who belonged to affluent class. Moreover,
there were no specialized issue houses and no intermediaries to mobilize and channelize the
savings.
But after the independence, the capital market has broadened significantly and has been
steadily improving. The government has also taken a number of steps to promote savings and to
protect the interest of the investors. In the last three decades, the capital market has seen
tremendous development, which includes the following:
2
8/6/2019 Share Main Project
http://slidepdf.com/reader/full/share-main-project 3/53
• Development of Stock Exchange
• Development of specialized financial institutions
• Regulations of the capital market (SEBI)
• New financial intermediaries• Adoption of screen based trading
• Arrival of Foreign Institutional investors.
• Enlivening of debt market.
Stock Exchange:
The stock exchange or secondary market is a highly organized market for the purchase
and sale of second hand quoted of listed securities.
The securities contract (Regulation) Act 1956 defines a stock exchange as “an
association, organization or not, established for the purpose of assisting, regulating and
controlling business in buying, selling and dealing in securities.
Of all the modern service institutions, stock exchange plays a crucial agents and
facilitators of entrepreneurial progress. After the industrial resolution, as the size of the business
enterprises grew, it was no longer possible for individual person or even partnerships to raise
such huge amount for undertaking these ventures. Such huge requirements of capital can be met
only large number of individuals.
These investors could be expected to participate actively only if investment is liquid or
they could sell a part of their stake whenever they wish to generate cash. This liquidity can be
achieved through shares and debentures representing smallest units of ownership and lendingrepresented by the public. The institution where these securities are traded is known as stock
exchange. This stock exchange is one of the most important institutions in the capital market.
3
8/6/2019 Share Main Project
http://slidepdf.com/reader/full/share-main-project 4/53
Bombay Stock Exchange (BSE):
The oldest exchange in Asia and the first exchange in the country to be granted
permanent recognition under the Securities Contract Regulation Act, 1956, Bombay Stock
Exchange Limited (BSE) have had an interesting rise to prominence over the past 130 years.
The BSE is now synonymous with Dalal Street, it wasn’t always so. In fact the first
venues of the earliest stock broker meetings in the 1850s were amidst rather natural
environs- under banyan trees – in front of the Town Hall, where Horniman circle is now
situated. A decade later, the brokers moved their venue to another set of foliage, this time
under banyan trees at the junction of Meadows Street and Mahatma Gandhi Road. As the
number of brokers increased, they had to shift from place to place, and wherever they went,
through sheer habit, they overflowed into the streets. At last, in 1874, found a permanent
place, and one that they could, quite literally, call their own. The new place was, aptly,
called Dalal street.
The journey of BSE is as eventful and interesting as the history of India’s securities
market. India’s biggest bourse, in terms of listed companies and market capitalization, BSE
has played a pioneering role in the Indian Securities Market- one of the oldest in the world.
Much before actual legislations were enacted, BSE had formulated comprehensive set of
Rules and Regulations for the Indian Capital Markets. It also laid down best practices
adopted by the Indian Capital Markets after India gained its independence. Perhaps, there
would not be any leading corporate in Indian, which has not sourced BSE’s services in
resource mobilization. BSE as a brand is synonymous with capital markets in India. The
BSE SENSEX is the benchmark equity index that reflects the robustness of the economy
and finance. At par with international standards, BSE has been a pioneer in several areas. It
has several firsts to its credit even in an intensely competitive environment.
First in India to introduce Equity Derivatives First in India to launch a Free Float Index
First in India to launch US$ version of BSE Sensex first in India to launch surveillance,
clearing & settlement ‘BSE On- Line Trading System’ (BOLT) has been awarded the
4

8/6/2019 Share Main Project
http://slidepdf.com/reader/full/share-main-project 5/53
globally recognized the Information Security Management System standard BS7799-
2:2002. First to have an exclusive for financial training moved from open outcry to
Electronic Trading within just 50 days.
An equally important accomplishment of BSE is the launch of a nationwide investor
awareness campaign-safe investing in the stock market- under which nationwide awareness
campaigns and dissemination of information through print and electronic medium was
undertaken. BSE also actively promoted the securities market awareness campaign of the
securities and exchange board of India.
In 2002, the name the stock exchange, Mumbai, was changed to BSE. BSE had
introduced securities trading in India, replaced its open ourcry system of trading in 1995,
when the totally automated trading through the BSE online trading (BOLT) system was put
into practice. The BOLT network was expanded, nationwide, in 1997. It was at the BSE’s
international convention hall that india’s 1st Bell ringing ceremony in the history of capital
markets was held on February 18th, 2002. It was the listing ceremony of Bharti Tele ventures
Ltd. BSE with its long history of capital market development is fully geared to continue its
contributions to further growth of the securities markets of the country, thus helping India
increase its sphere of influence in international financial markets.
National Stock Exchange (NSE):
The National Stock Exchange of India Limited has genesis in the report of the high
powered study group on establishment of New Stock Exchanges, which recommended
promotion of a National Stock Exchange by financial institutions (FIs) to provide access to
investors from all across the country on an equal footing. Based on the recommendations.
NSE was promoted by leading Financial Institutions at the behest of the government of
India and was incorporated in November 1992 as a tax-paying company unlike other
exchange in the country.
5
8/6/2019 Share Main Project
http://slidepdf.com/reader/full/share-main-project 6/53
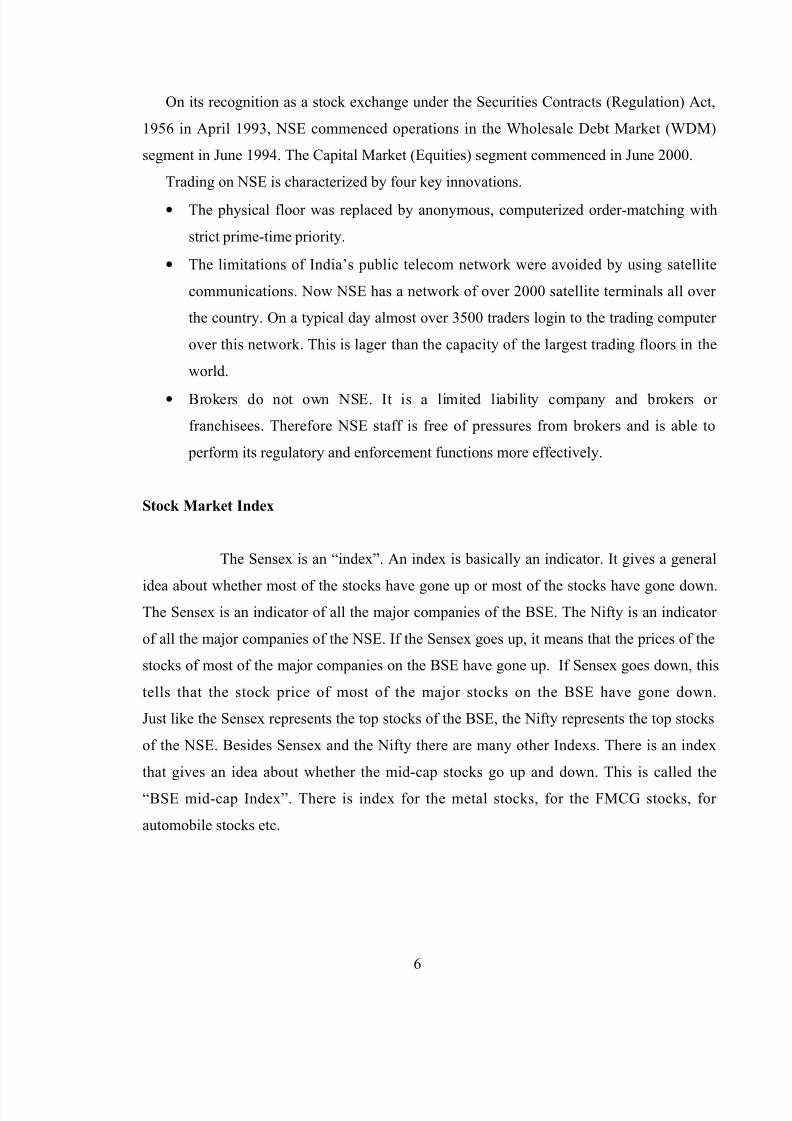
On its recognition as a stock exchange under the Securities Contracts (Regulation) Act,
1956 in April 1993, NSE commenced operations in the Wholesale Debt Market (WDM)
segment in June 1994. The Capital Market (Equities) segment commenced in June 2000.
Trading on NSE is characterized by four key innovations.
• The physical floor was replaced by anonymous, computerized order-matching with
strict prime-time priority.
• The limitations of India’s public telecom network were avoided by using satellite
communications. Now NSE has a network of over 2000 satellite terminals all over
the country. On a typical day almost over 3500 traders login to the trading computer
over this network. This is lager than the capacity of the largest trading floors in the
world.
• Brokers do not own NSE. It is a limited liability company and brokers or
franchisees. Therefore NSE staff is free of pressures from brokers and is able to
perform its regulatory and enforcement functions more effectively.
Stock Market Index
The Sensex is an “index”. An index is basically an indicator. It gives a general
idea about whether most of the stocks have gone up or most of the stocks have gone down.The Sensex is an indicator of all the major companies of the BSE. The Nifty is an indicator
of all the major companies of the NSE. If the Sensex goes up, it means that the prices of the
stocks of most of the major companies on the BSE have gone up. If Sensex goes down, this
tells that the stock price of most of the major stocks on the BSE have gone down.
Just like the Sensex represents the top stocks of the BSE, the Nifty represents the top stocks
of the NSE. Besides Sensex and the Nifty there are many other Indexs. There is an index
that gives an idea about whether the mid-cap stocks go up and down. This is called the
“BSE mid-cap Index”. There is index for the metal stocks, for the FMCG stocks, for
automobile stocks etc.
6
8/6/2019 Share Main Project
http://slidepdf.com/reader/full/share-main-project 7/53
Dematerialization:
The final point of transaction is where the title on a security is changed from the seller to
the buyer. Since share certificates in India were printed on paper, trading in them was
fraught with operational cost and risk. Theft or counterfeiting the share certificate gave rise
to a number of criminal activities. To tackle this problem national securities depository
limited (NSDL) was setup in November 1996. Setting up the central depository services
(India) Limited (CDSL) followed this.
The depository maintains a computer record of ownership of securities and dispenses
with physical share certificates. This cut down the hazards related with physical trading in
share certificates and also reduces the transaction costs substantially.
This form of trading is being extended in phases and more and more companies are
being brought under it. Demat trading in more than 200 scripts is compulsory nowadays.
The progress in dematerialization is also indicated by a dramatic rise in the proposition
of Demat shares in the total delivery value of NSE.
7
8/6/2019 Share Main Project
http://slidepdf.com/reader/full/share-main-project 8/53
RESEARCH DESIGN OF THE STUDY
Statement Of The Problem
The growth and operations of stock exchanges largely influences the economic growth of thenation. The stock market trading determines the share prices which influences equity investment
decision. Further more it is influenced by various economic, political and other factors. In this
content, the researcher is interested to study about share price movements and fluctuations at
JRG securities ltd, Namakkal.
Objectives Of The Study
To analyze the volatility of stock price fluctuation in Bombay Stock Exchange.
.
To analyze the reasons for fluctuations in share price.
To study the impact of volatility of share prices on Indian economy.
To offer suggestions based on the study.
Sources Of Data
The study uses only the secondary data. The secondary data have been collected from the
website of Bombay Stock Exchange chart.
Period Of Study
The relevant secondary data have been collected for a period of 4 months, from September
2007 to December 2007.
Tools Employed For Analysis
The data was analyzed using various tools
Paired sample t test
Mean
Standard deviation
8

8/6/2019 Share Main Project
http://slidepdf.com/reader/full/share-main-project 9/53
Limitation Of Study
Every study has its own limitation and this study is not an exception to it. The
following are some of the limitations.
The period of study is limited to 4 months.
Only 29 companies are considered for the study.
Chapter Scheme
The study is presented in following chapters
1. Chapter I – Introduction and Research Design of the study.
2. Chapter II- Profile of the Company.
3. Chapter III- Analysis and Interpretation.
4. Chapter IV- Findings, Suggestions and Conclusion.
9

8/6/2019 Share Main Project
http://slidepdf.com/reader/full/share-main-project 10/53
CHAPTER II
COMPANY PROFILE
JRG is a premier brokerage house in India on the fast growth track. JRG started
functioning in the stock market in 1992. Over the years, the company has grown from strength
to strength to become a major player in India's financial services sector.
Today JRG is a listed company in the Bombay Stock Exchange. JRG is one of the
foremost brokerage houses, being a member of various exchanges in the capital and commodity
markets and the insurance sector. JRG is a member of the National Stock Exchange of India
(NSE), the Bombay Stock Exchange, the National Multi Commodity Exchange of India Ltd
(NMCEIL), the National Commodities Derivatives Exchange Ltd (NCDEX), the Multi
Commodity Exchange of India Ltd (MCX) and the Indian Pepper and Spices Trades
Association (IPSTA). JRG is a full-fledged depository participant of the National Securities
Depository Ltd and Central Depository Services (India) Limited.
In April 2006, JRG Securities Limited, the flagship company of JRG Group, came out
with a Rs 14.50 crore public issue of 36,25,000 equity shares with a face value of Rs 10 at a
premium of Rs 30 per share.
In July 2007, Baring India Private Equity Fund II Ltd (Baring India) announced an
investment of upto $35 million in JRG Securities Ltd. through a preferential issue and warrants
for a minimum 44.8 per cent stake in the company, subject to the approvals from Securities and
Exchange Board of India and shareholders among others.
Post the allotment, Baring India Partners will become the single largest share holder in
the company.
10

8/6/2019 Share Main Project
http://slidepdf.com/reader/full/share-main-project 11/53
Vision
JRG Securities Limited was born out of a vision to explore the immense investment
opportunities in the Indian financial market, to benefit the investors. The company is built on
the pillars of financial expertise, professionalism, exemplary ethics and a commitment to
provide ultimate customer satisfaction.
JRG constantly strives to meet the changing market needs and trends.
JRG began as a sub-brokerage house in the year 1992. Our financial expertise and
professionalism coupled with ethics and a commitment has made JRG one of the major players
in Indian financial market.
The company caters efficiently to the diverse and complex needs of over 200,000
customers, most of whom are individual traders, institutions and money managers.
The vision of the JRG Group is to be a Financial Super Market. It aims to provide all
types of financial services to its clients at one place to save them from going from place to place
to meet their investment needs.
With the opening up of the Indian economy and the advent of IT enabled trading, the
Indian capital market has become a whole new ball game. From floor trading, the custom is fast
shifting to Internet trading. Equally fast is the role of the financial service provider, which is
being redefined. Earlier, a financial service provider's responsibility was limited to executing
customer's instructions to buy and sell. Now, the whole operational paradigm has progressively
shifted with the opening of more and more avenues to offer strategic customer supports.
11

8/6/2019 Share Main Project
http://slidepdf.com/reader/full/share-main-project 12/53
The guiding principles that lead us:
1. Serve the clients with the highest level of responsiveness and integrity.2. Place the client's interests and protection of their investments as the top priorities.
3. Operate on predefined and constantly updated service standards. Be customer driven,
rather than deal driven.
4. Adopt futuristic technology to gather vital information on real time basis to optimize
investor protection and investor returns.
Set up most modern trading facilities for its clients at par with global standards.
Group Of Companies
From a modest beginning a decade back, JRG is today a power to reckon with in the financial
services industry through the following JRG Group of Companies:
• JRG Securities Ltd
• JRG Wealth Management Ltd
• JRG Insurance Broking Pvt Ltd
• JRG Metal & Commodities DMCC, Dubai
12

8/6/2019 Share Main Project
http://slidepdf.com/reader/full/share-main-project 13/53
JRG Board of Directors
The JRG Board is constituted by independent professionals. Its Board of Directors comprises
veterans from the fields of banking, stock broking and other financial services. Their experience
and expertise have helped the company become a premier broking house in the country.
• T M Venkataraman – Chairman
• Regi Jaocb - Managing Director
• Giby Mathew - Executive Director
• Rahul Bhasin – Director
• Munish Dayal – Director
• S K K Nair – Director
13

8/6/2019 Share Main Project
http://slidepdf.com/reader/full/share-main-project 14/53
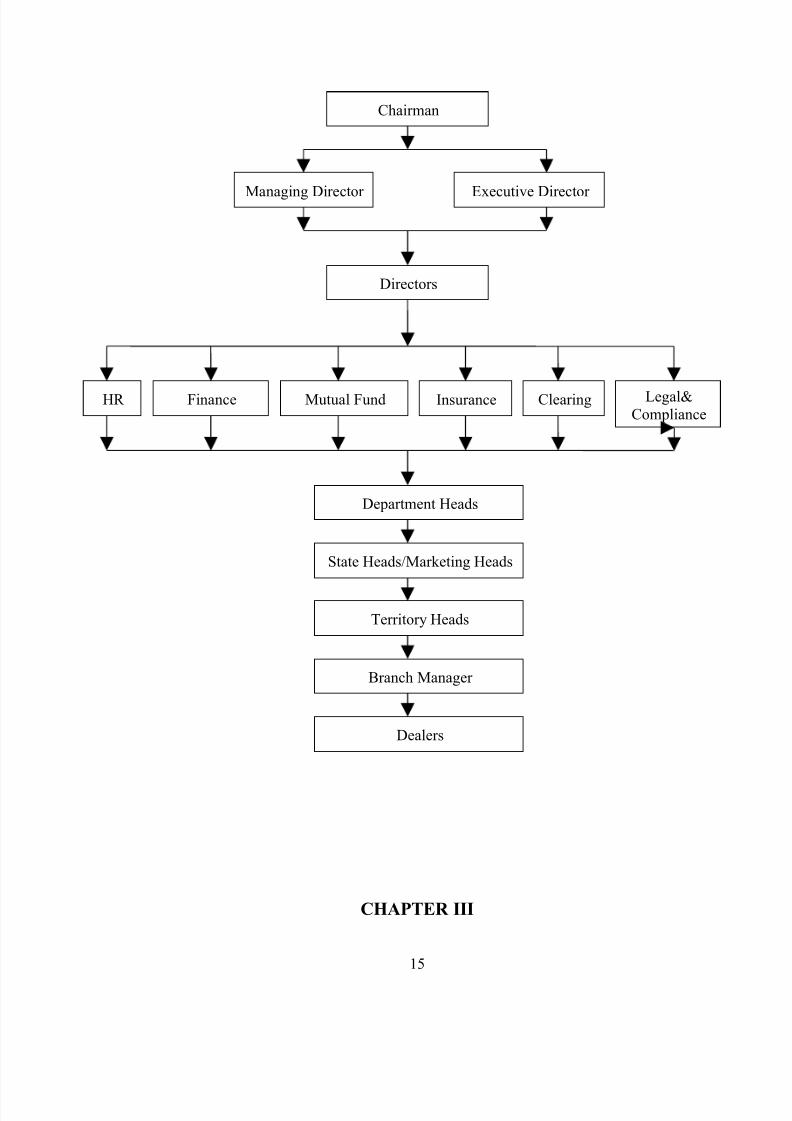
ORGANISATON CHART
14
8/6/2019 Share Main Project
http://slidepdf.com/reader/full/share-main-project 15/53
CHAPTER III
Chairman
Managing Director Executive Director
Directors
HR Finance Mutual Fund Insurance Clearing
Department Heads
State Heads/Marketing Heads
Territory Heads
Branch Manager
Dealers
Legal&Compliance
15
8/6/2019 Share Main Project
http://slidepdf.com/reader/full/share-main-project 16/53
ANALYSIS AND INTERPRETATION
The data collected was analyzed using appropriate statistical techniques. Significantly,
the trading days opening and closing values are compared with each other using Paired Sample
T–Test. The following table’s present company wise comparison between the opening and
closing price of the stock for the month of September, October and November.
For the purpose study, the opening and closing price of 30 companies (that company that
are consider for calculating SENSEX) for the period of 4 months (September 2007-December
2007) are obtained.
The data collected was analyses using “Paired Sample T-Test”. This is tested at 5%significant level. The trading days opening and closing values are compared with each other
using Paired Sample T–Test
Tool Employed for Price Movement and Fluctuation
The following is the tool used for analyzing the Price Movement and Fluctuation
Paired Sample T-Test
T-Test is based on t -distribution and is considered an appropriate test for judging the
significance of a sample mean or for judging the significance of difference between the means
of two samples in case of small sample(s) when population variance is not known (in which
case we use variance of the sample as an estimate of the population variance). In case two
samples are related, we use paired t -test for judging the significance of the mean of difference
between the two related samples. It can also be used for judging the significance of the
coefficients of simple and partial correlations. The relevant test statistic, t, is calculated from the
sample data and then compared with its probable value based on t-distribution (to be read from
the table that gives probable values of t for different levels of significance for different degrees
of freedom) at a specified level of significance for concerning degrees of freedom for accepting
16

8/6/2019 Share Main Project
http://slidepdf.com/reader/full/share-main-project 17/53
or rejecting the null hypothesis. It may be noted that t -test applies only in case of small
sample(s) when population variance is unknown
The equation for the Paired Sample T-Test:
t = d √ n
S
where d = the mean of the differences.
S = the standard deviation of the differences.
The value of S is calculated as follows:
S= √ ∑d2 – (d)2- n
n-1
n-1 = degree of freedom.
List of companies whose share price are taken for the study
• ACC
• Bajaj Auto
• BHARTI TELEVENTURES
• Bharat Heavy Electronical Ltd
• CIPLA LTD
• DLF
• GRASIM
• Gujarat Ambuja Cement
• Housing Development Of Financial Corporation
• HDFC BANK
• Hindalco
17

8/6/2019 Share Main Project
http://slidepdf.com/reader/full/share-main-project 18/53
• Hindustan Lever
• ICICI BANK
• Infosys Technologies
• ITC LTD• Larsen & Toubro
• Mahindra & Mahindra
• Maruthi Udyog
• National Thermal Power (NTPC)
• ONGC
• Ranbaxy Lab
• Reliance
• Reliance Communications
• Reliance Energy
• State Bank Of India
• Tata Consultancy Services
• WIPRO LTD
• TATA Steel
• TATA Motors
18
8/6/2019 Share Main Project
http://slidepdf.com/reader/full/share-main-project 19/53
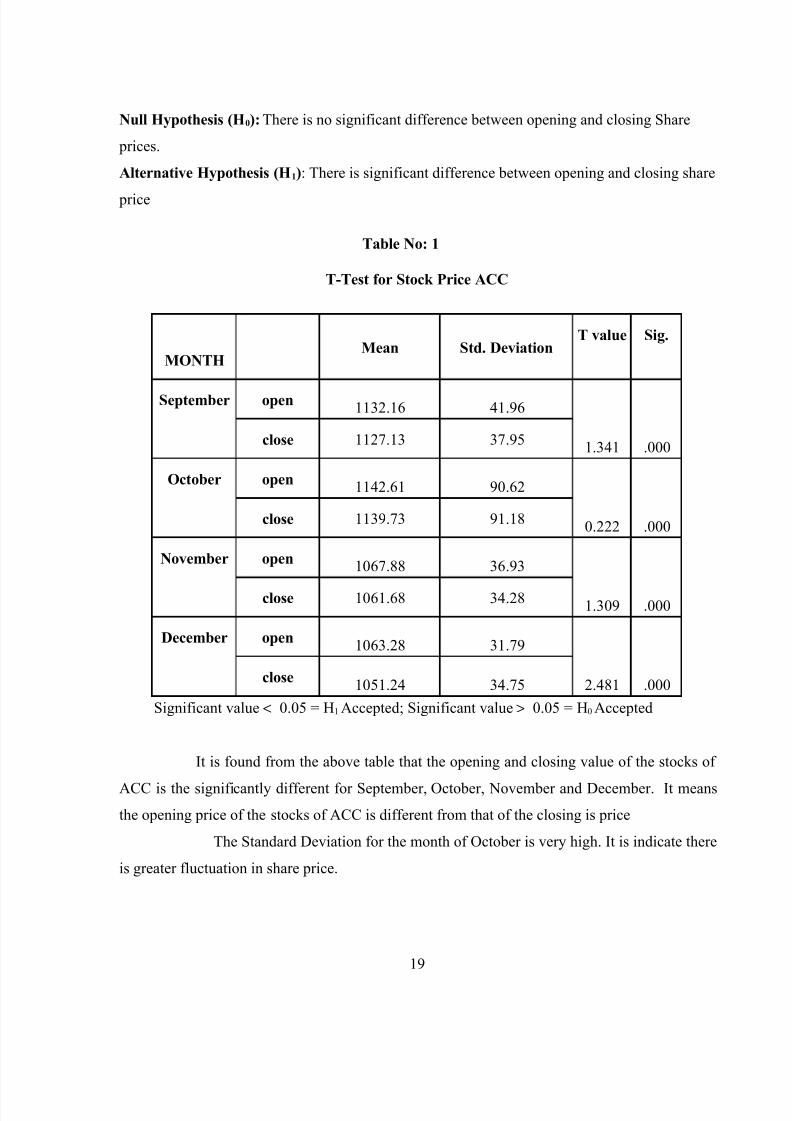
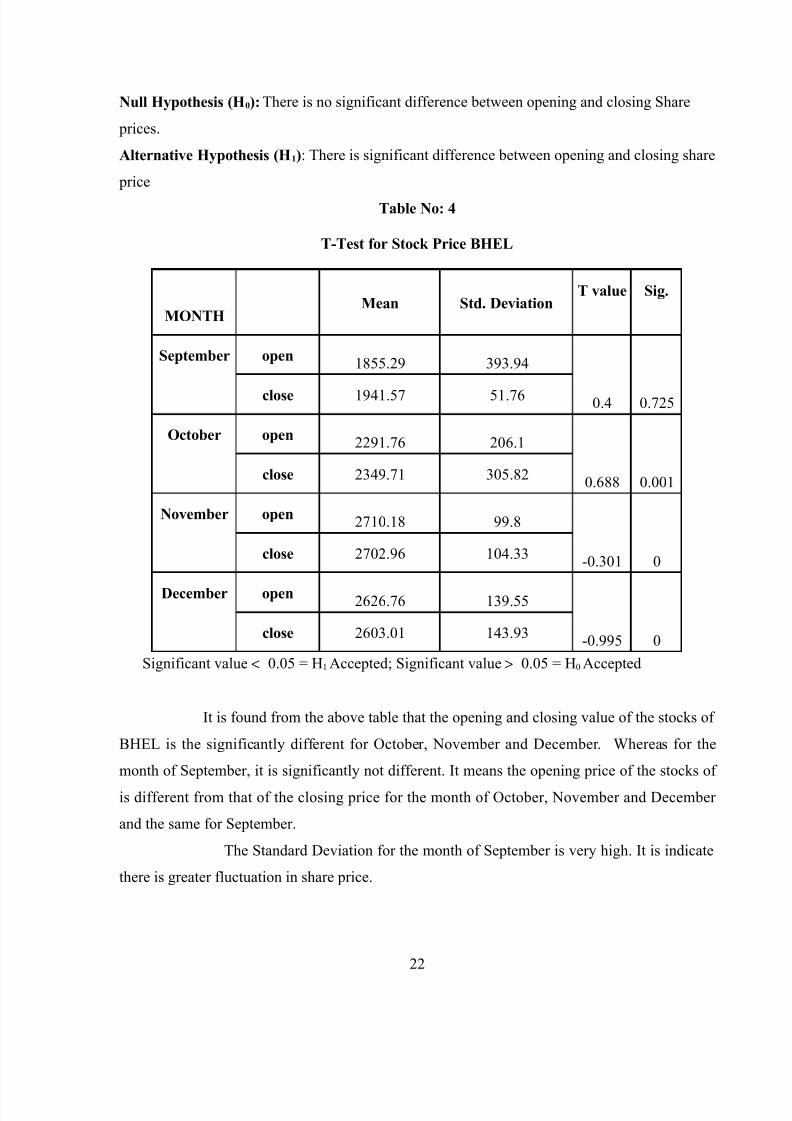
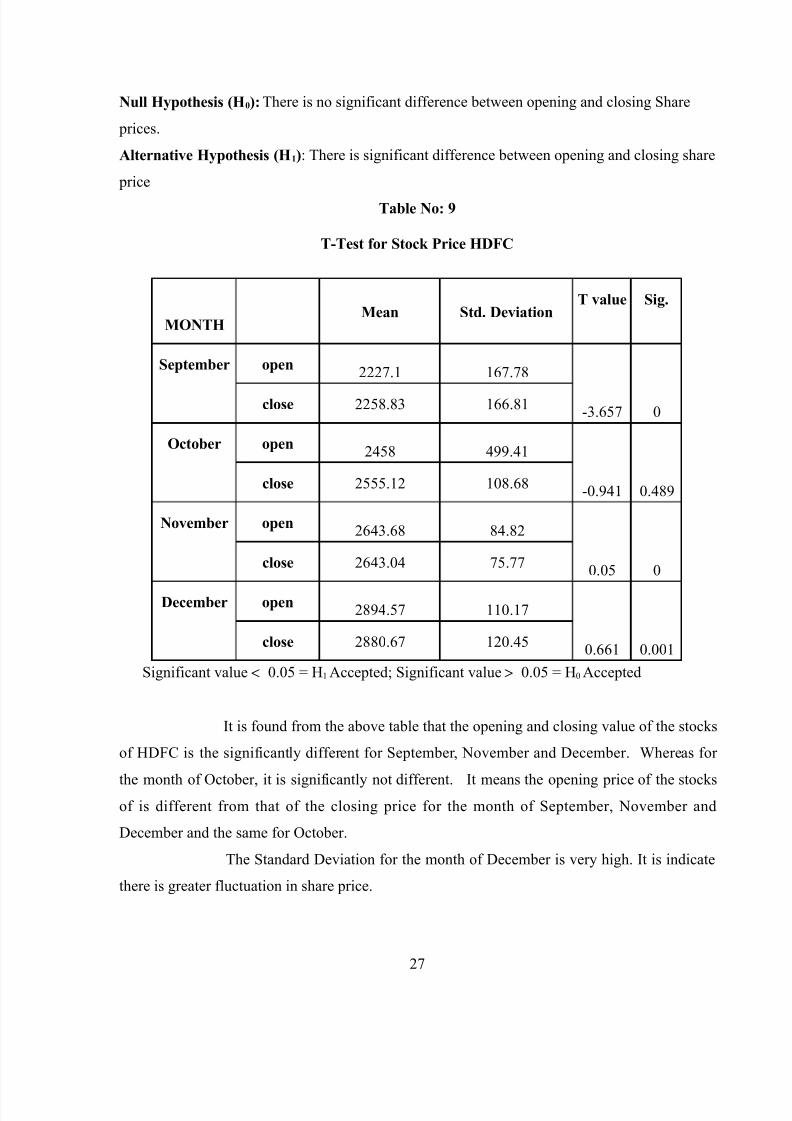
Null Hypothesis (H0): There is no significant difference between opening and closing Share
prices.
Alternative Hypothesis (H1): There is significant difference between opening and closing share
price
Table No: 1
T-Test for Stock Price ACC
MONTHMean Std. Deviation
T value Sig.
September open1132.16 41.96
1.341 .000close 1127.13 37.95
October open1142.61 90.62
0.222 .000close 1139.73 91.18
November open1067.88 36.93
1.309 .000close 1061.68 34.28
December open1063.28 31.79
2.481 .000close
1051.24 34.75
Significant value < 0.05 = H1 Accepted; Significant value > 0.05 = H0 Accepted
It is found from the above table that the opening and closing value of the stocks of
ACC is the significantly different for September, October, November and December. It means
the opening price of the stocks of ACC is different from that of the closing is price
The Standard Deviation for the month of October is very high. It is indicate there
is greater fluctuation in share price.
19
8/6/2019 Share Main Project
http://slidepdf.com/reader/full/share-main-project 20/53
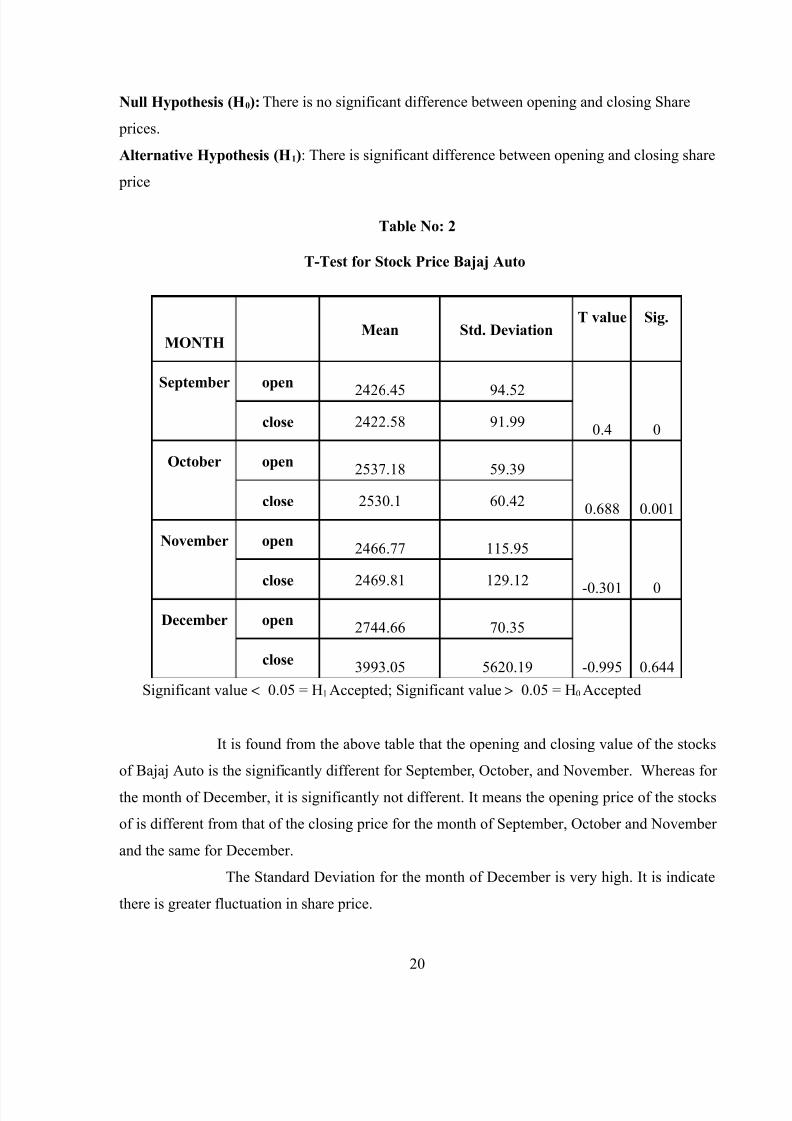
Null Hypothesis (H0): There is no significant difference between opening and closing Share
prices.
Alternative Hypothesis (H1): There is significant difference between opening and closing share
price
Table No: 2
T-Test for Stock Price Bajaj Auto
MONTHMean Std. Deviation
T value Sig.
September open2426.45 94.52
0.4 0close 2422.58 91.99
October open2537.18 59.39
0.688 0.001close 2530.1 60.42
November open2466.77 115.95
-0.301 0close 2469.81 129.12
December open2744.66 70.35
-0.995 0.644close
3993.05 5620.19
Significant value < 0.05 = H1 Accepted; Significant value > 0.05 = H0 Accepted
It is found from the above table that the opening and closing value of the stocks
of Bajaj Auto is the significantly different for September, October, and November. Whereas for
the month of December, it is significantly not different. It means the opening price of the stocks
of is different from that of the closing price for the month of September, October and November
and the same for December.
The Standard Deviation for the month of December is very high. It is indicate
there is greater fluctuation in share price.
20
8/6/2019 Share Main Project
http://slidepdf.com/reader/full/share-main-project 21/53
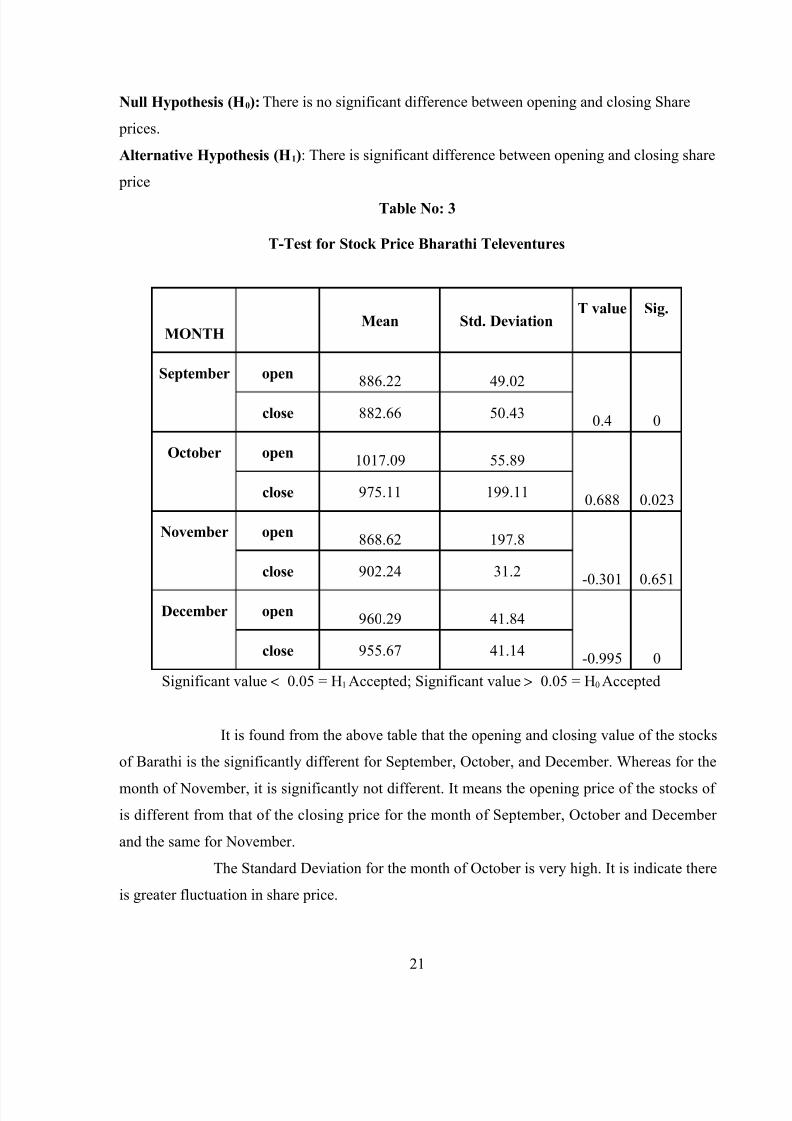
Null Hypothesis (H0): There is no significant difference between opening and closing Share
prices.
Alternative Hypothesis (H1): There is significant difference between opening and closing share
price
Table No: 3
T-Test for Stock Price Bharathi Televentures
MONTHMean Std. Deviation
T value Sig.
September open886.22 49.02
0.4 0close 882.66 50.43
October open1017.09 55.89
0.688 0.023close 975.11 199.11
November open868.62 197.8
-0.301 0.651close 902.24 31.2
December open960.29 41.84
-0.995 0close 955.67 41.14
Significant value < 0.05 = H1 Accepted; Significant value > 0.05 = H0 Accepted
It is found from the above table that the opening and closing value of the stocks
of Barathi is the significantly different for September, October, and December. Whereas for the
month of November, it is significantly not different. It means the opening price of the stocks of
is different from that of the closing price for the month of September, October and December
and the same for November.
The Standard Deviation for the month of October is very high. It is indicate there
is greater fluctuation in share price.
21
8/6/2019 Share Main Project
http://slidepdf.com/reader/full/share-main-project 22/53
Null Hypothesis (H0): There is no significant difference between opening and closing Share
prices.
Alternative Hypothesis (H1): There is significant difference between opening and closing share
price
Table No: 4
T-Test for Stock Price BHEL
MONTHMean Std. Deviation
T value Sig.
September open1855.29 393.94
0.4 0.725close 1941.57 51.76
October open2291.76 206.1
0.688 0.001close 2349.71 305.82
November open2710.18 99.8
-0.301 0close 2702.96 104.33
December open 2626.76 139.55
-0.995 0close 2603.01 143.93
Significant value < 0.05 = H1 Accepted; Significant value > 0.05 = H0 Accepted
It is found from the above table that the opening and closing value of the stocks of
BHEL is the significantly different for October, November and December. Whereas for the
month of September, it is significantly not different. It means the opening price of the stocks of
is different from that of the closing price for the month of October, November and December
and the same for September.
The Standard Deviation for the month of September is very high. It is indicate
there is greater fluctuation in share price.
22
8/6/2019 Share Main Project
http://slidepdf.com/reader/full/share-main-project 23/53
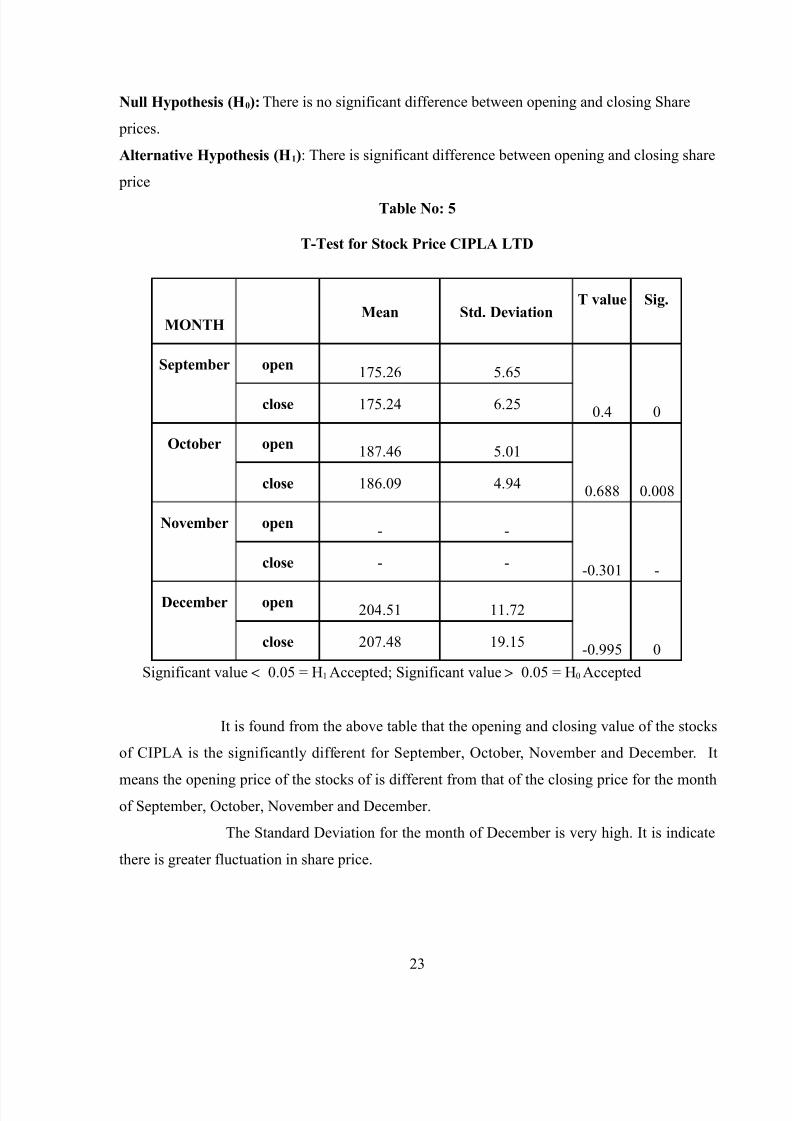
Null Hypothesis (H0): There is no significant difference between opening and closing Share
prices.
Alternative Hypothesis (H1): There is significant difference between opening and closing share
price
Table No: 5
T-Test for Stock Price CIPLA LTD
MONTHMean Std. Deviation
T value Sig.
September open175.26 5.65
0.4 0close 175.24 6.25
October open187.46 5.01
0.688 0.008close 186.09 4.94
November open- -
-0.301 -close - -
December open204.51 11.72
-0.995 0close 207.48 19.15
Significant value < 0.05 = H1 Accepted; Significant value > 0.05 = H0 Accepted
It is found from the above table that the opening and closing value of the stocks
of CIPLA is the significantly different for September, October, November and December. It
means the opening price of the stocks of is different from that of the closing price for the monthof September, October, November and December.
The Standard Deviation for the month of December is very high. It is indicate
there is greater fluctuation in share price.
23
8/6/2019 Share Main Project
http://slidepdf.com/reader/full/share-main-project 24/53
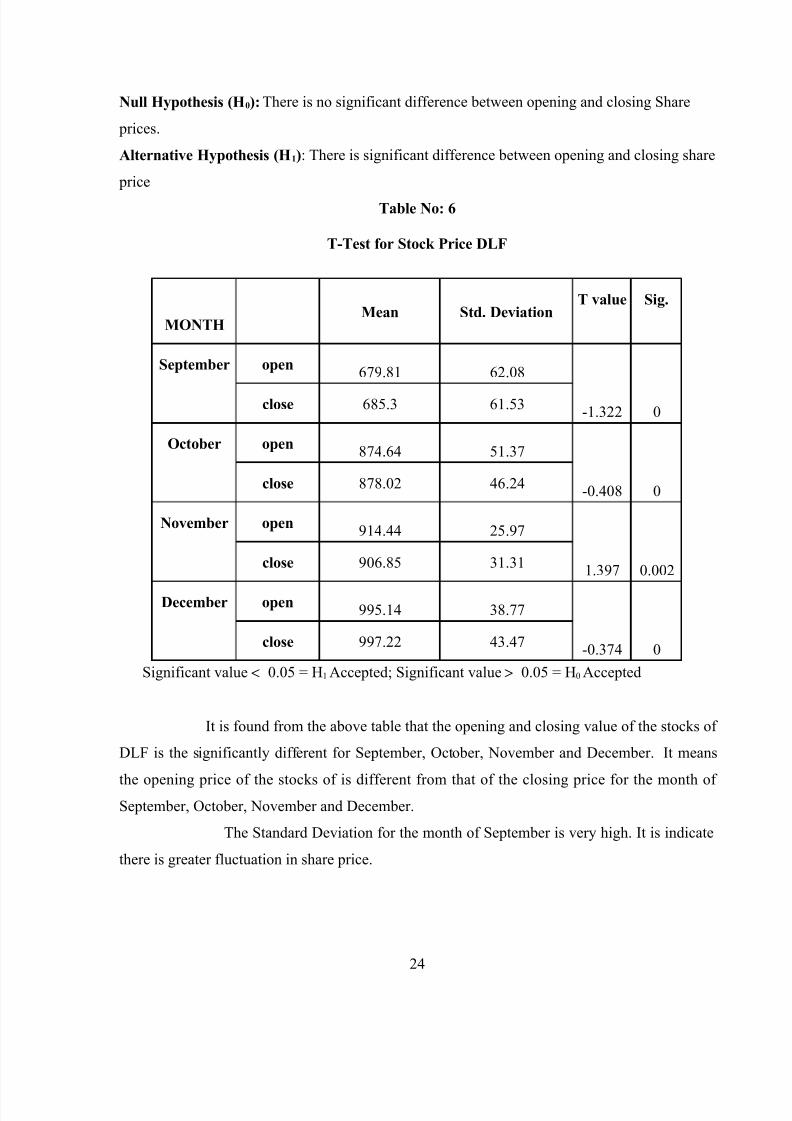
Null Hypothesis (H0): There is no significant difference between opening and closing Share
prices.
Alternative Hypothesis (H1): There is significant difference between opening and closing share
price
Table No: 6
T-Test for Stock Price DLF
MONTHMean Std. Deviation
T value Sig.
September open679.81 62.08
-1.322 0close 685.3 61.53
October open874.64 51.37
-0.408 0close 878.02 46.24
November open914.44 25.97
1.397 0.002close 906.85 31.31
December open995.14 38.77
-0.374 0close 997.22 43.47
Significant value < 0.05 = H1 Accepted; Significant value > 0.05 = H0 Accepted
It is found from the above table that the opening and closing value of the stocks of
DLF is the significantly different for September, October, November and December. It means
the opening price of the stocks of is different from that of the closing price for the month of September, October, November and December.
The Standard Deviation for the month of September is very high. It is indicate
there is greater fluctuation in share price.
24
8/6/2019 Share Main Project
http://slidepdf.com/reader/full/share-main-project 25/53
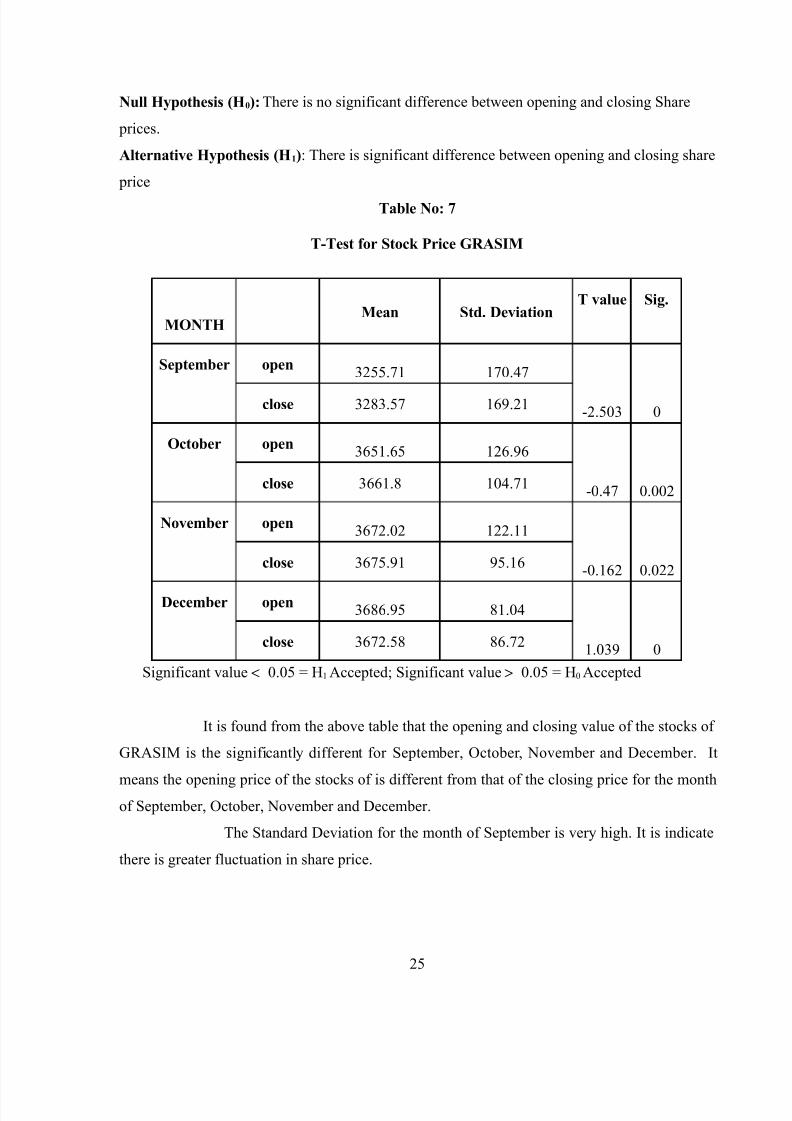
Null Hypothesis (H0): There is no significant difference between opening and closing Share
prices.
Alternative Hypothesis (H1): There is significant difference between opening and closing share
price
Table No: 7
T-Test for Stock Price GRASIM
MONTHMean Std. Deviation
T value Sig.
September open3255.71 170.47
-2.503 0close 3283.57 169.21
October open3651.65 126.96
-0.47 0.002close 3661.8 104.71
November open3672.02 122.11
-0.162 0.022close 3675.91 95.16
December open3686.95 81.04
1.039 0close 3672.58 86.72
Significant value < 0.05 = H1 Accepted; Significant value > 0.05 = H0 Accepted
It is found from the above table that the opening and closing value of the stocks of
GRASIM is the significantly different for September, October, November and December. It
means the opening price of the stocks of is different from that of the closing price for the monthof September, October, November and December.
The Standard Deviation for the month of September is very high. It is indicate
there is greater fluctuation in share price.
25

8/6/2019 Share Main Project
http://slidepdf.com/reader/full/share-main-project 26/53
8/6/2019 Share Main Project
http://slidepdf.com/reader/full/share-main-project 27/53
Null Hypothesis (H0): There is no significant difference between opening and closing Share
prices.
Alternative Hypothesis (H1): There is significant difference between opening and closing share
price
Table No: 9
T-Test for Stock Price HDFC
MONTHMean Std. Deviation
T value Sig.
September open2227.1 167.78
-3.657 0close 2258.83 166.81
October open2458 499.41
-0.941 0.489close 2555.12 108.68
November open2643.68 84.82
0.05 0close 2643.04 75.77
December open2894.57 110.17
0.661 0.001close 2880.67 120.45
Significant value < 0.05 = H1 Accepted; Significant value > 0.05 = H0 Accepted
It is found from the above table that the opening and closing value of the stocks
of HDFC is the significantly different for September, November and December. Whereas for
the month of October, it is significantly not different. It means the opening price of the stocksof is different from that of the closing price for the month of September, November and
December and the same for October.
The Standard Deviation for the month of December is very high. It is indicate
there is greater fluctuation in share price.
27

8/6/2019 Share Main Project
http://slidepdf.com/reader/full/share-main-project 28/53
Null Hypothesis (H0): There is no significant difference between opening and closing Share
prices.
Alternative Hypothesis (H1): There is significant difference between opening and closing share
price
Table No: 10
T-Test for Stock Price HDFC BANK
MONTHMean Std. Deviation
T value Sig.
September open1266.04 95.62
-1.315 0close 1273.04 96.02
October open1465.94 86.84
-0.557 0close 1470.55 86.03
November open1638.61 69.71
-0.039 0.006close 1639.16 72.61
December open 1716.63 40.62
0.532 0.007close 1712.34 37.67
Significant value < 0.05 = H1 Accepted; Significant value > 0.05 = H0 Accepted
It is found from the above table that the opening and closing value of the
stocks of HDFC BANK is the significantly different for September, October, November and
December. It means the opening price of the stocks of is different from that of the closing price
for the month of September, October, November and December.
The Standard Deviation for the month of September is very high. It is indicate
there is greater fluctuation in share price.
28
8/6/2019 Share Main Project
http://slidepdf.com/reader/full/share-main-project 29/53
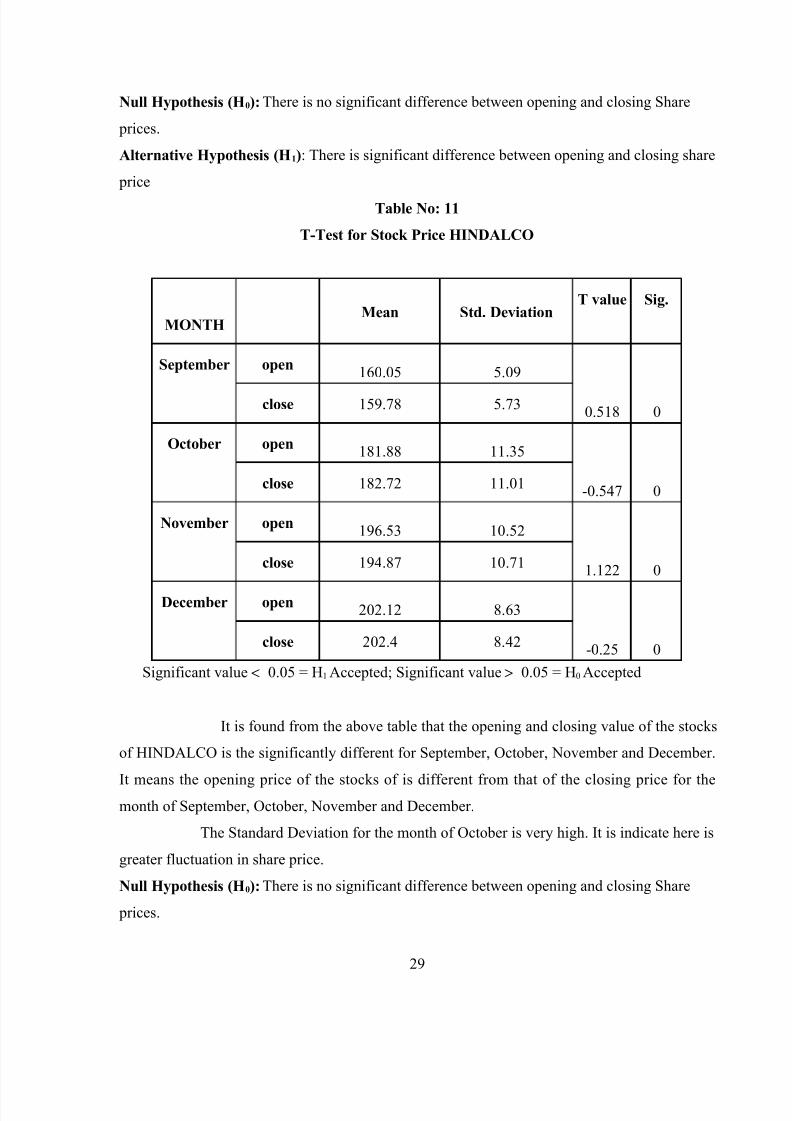
Null Hypothesis (H0): There is no significant difference between opening and closing Share
prices.
Alternative Hypothesis (H1): There is significant difference between opening and closing share
price
Table No: 11
T-Test for Stock Price HINDALCO
MONTHMean Std. Deviation
T value Sig.
September open160.05 5.09
0.518 0close 159.78 5.73
October open181.88 11.35
-0.547 0close 182.72 11.01
November open196.53 10.52
1.122 0close 194.87 10.71
December open202.12 8.63
-0.25 0close 202.4 8.42
Significant value < 0.05 = H1 Accepted; Significant value > 0.05 = H0 Accepted
It is found from the above table that the opening and closing value of the stocks
of HINDALCO is the significantly different for September, October, November and December.
It means the opening price of the stocks of is different from that of the closing price for themonth of September, October, November and December.
The Standard Deviation for the month of October is very high. It is indicate here is
greater fluctuation in share price.
Null Hypothesis (H0): There is no significant difference between opening and closing Share
prices.
29
8/6/2019 Share Main Project
http://slidepdf.com/reader/full/share-main-project 30/53
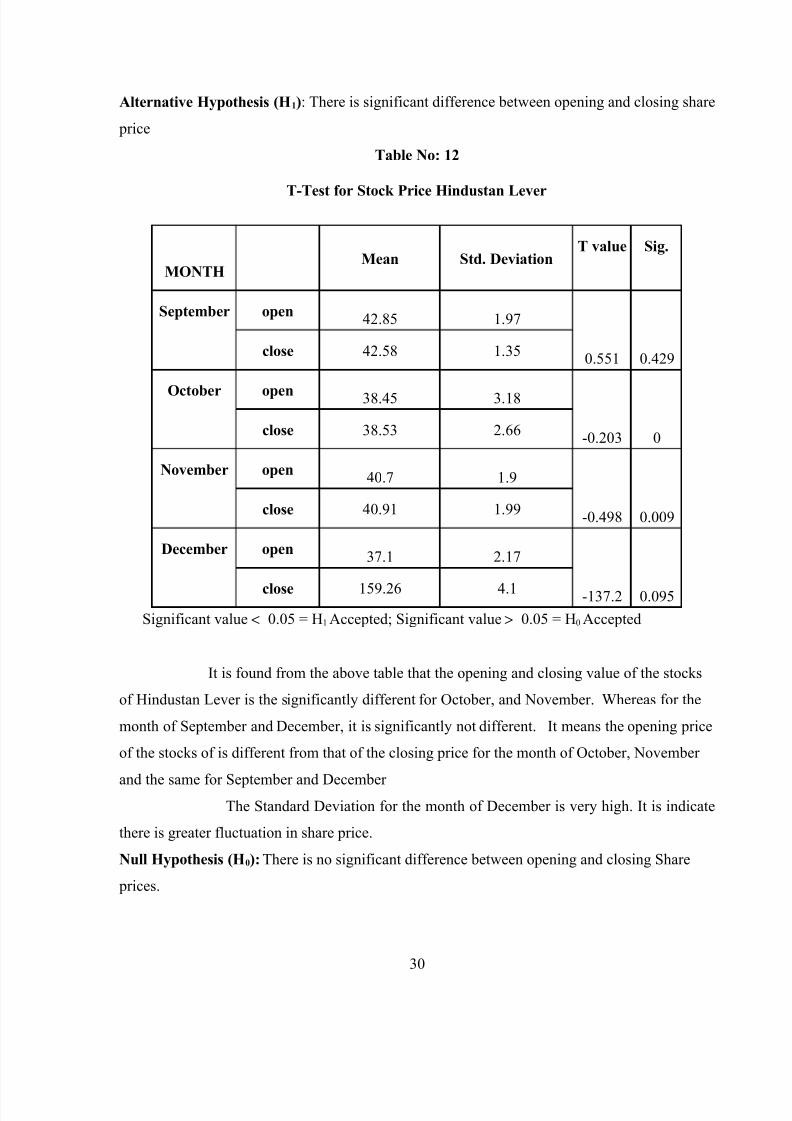
Alternative Hypothesis (H1): There is significant difference between opening and closing share
price
Table No: 12
T-Test for Stock Price Hindustan Lever
MONTHMean Std. Deviation
T value Sig.
September open42.85 1.97
0.551 0.429close 42.58 1.35
October open 38.45 3.18
-0.203 0close 38.53 2.66
November open40.7 1.9
-0.498 0.009close 40.91 1.99
December open37.1 2.17
-137.2 0.095close 159.26 4.1
Significant value < 0.05 = H1 Accepted; Significant value > 0.05 = H0 Accepted
It is found from the above table that the opening and closing value of the stocks
of Hindustan Lever is the significantly different for October, and November. Whereas for the
month of September and December, it is significantly not different. It means the opening price
of the stocks of is different from that of the closing price for the month of October, November
and the same for September and December The Standard Deviation for the month of December is very high. It is indicate
there is greater fluctuation in share price.
Null Hypothesis (H0): There is no significant difference between opening and closing Share
prices.
30

8/6/2019 Share Main Project
http://slidepdf.com/reader/full/share-main-project 31/53
Alternative Hypothesis (H1): There is significant difference between opening and closing share
price
Table No: 13
T-Test for Stock Price ICICI BANK
MONTHMean Std. Deviation
T value Sig.
September open944.53 51.06
-1.518 0close 950.57 57.94
October open 1104.3 74.78
-1.066 0close 1112.52 81.74
November open1199.08 65.02
0.854 0close 1191.52 62.24
December open1217.07 45.93
0.942 0close 1211.46 50.1
Significant value < 0.05 = H1 Accepted; Significant value > 0.05 = H0 Accepted
It is found from the above table that the opening and closing value of the stocks
is the significantly different for September, October, November and December. It means the
opening price of the stocks of is different from that of the closing price for the month of
September, October, November and December.
The Standard Deviation for the month of December is very high. It is indicatethere is greater fluctuation in share price.
Null Hypothesis (H0): There is no significant difference between opening and closing Share
prices.
31
8/6/2019 Share Main Project
http://slidepdf.com/reader/full/share-main-project 32/53
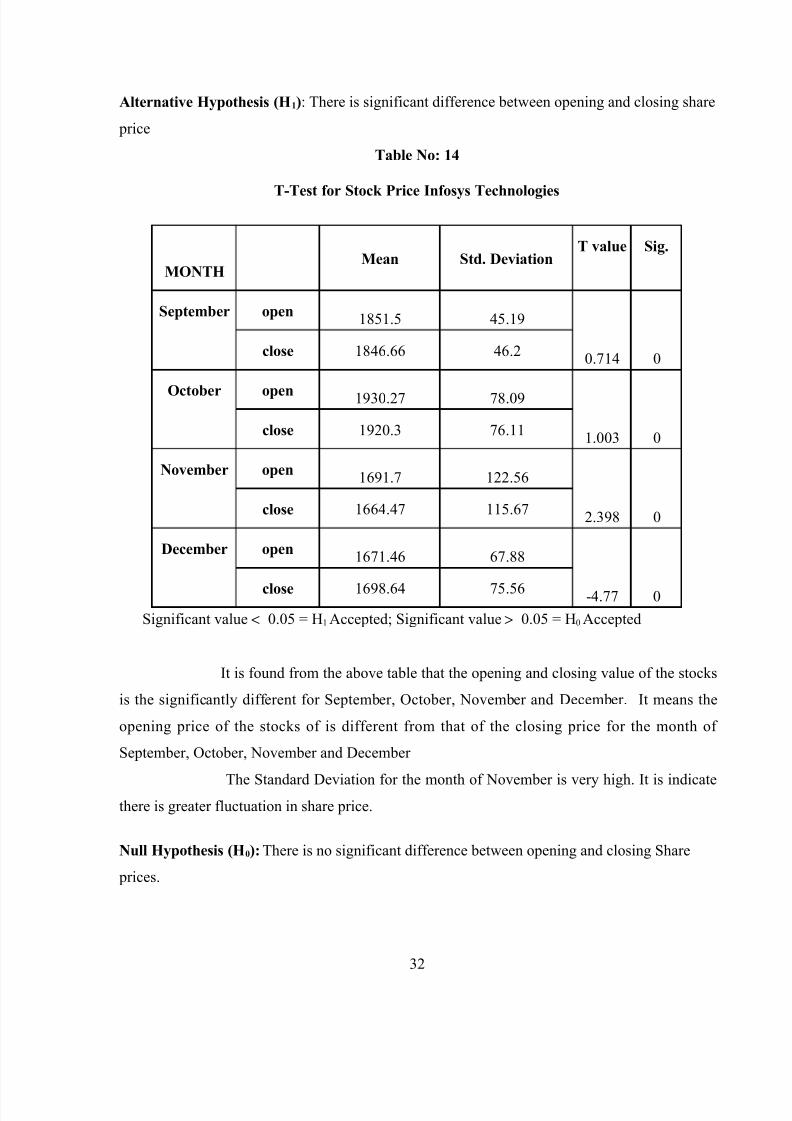
Alternative Hypothesis (H1): There is significant difference between opening and closing share
price
Table No: 14
T-Test for Stock Price Infosys Technologies
MONTHMean Std. Deviation
T value Sig.
September open1851.5 45.19
0.714 0close 1846.66 46.2
October open 1930.27 78.09
1.003 0close 1920.3 76.11
November open1691.7 122.56
2.398 0close 1664.47 115.67
December open1671.46 67.88
-4.77 0close 1698.64 75.56
Significant value < 0.05 = H1 Accepted; Significant value > 0.05 = H0 Accepted
It is found from the above table that the opening and closing value of the stocks
is the significantly different for September, October, November and December. It means the
opening price of the stocks of is different from that of the closing price for the month of
September, October, November and December
The Standard Deviation for the month of November is very high. It is indicatethere is greater fluctuation in share price.
Null Hypothesis (H0): There is no significant difference between opening and closing Share
prices.
32
8/6/2019 Share Main Project
http://slidepdf.com/reader/full/share-main-project 33/53
Alternative Hypothesis (H1): There is significant difference between opening and closing share
price
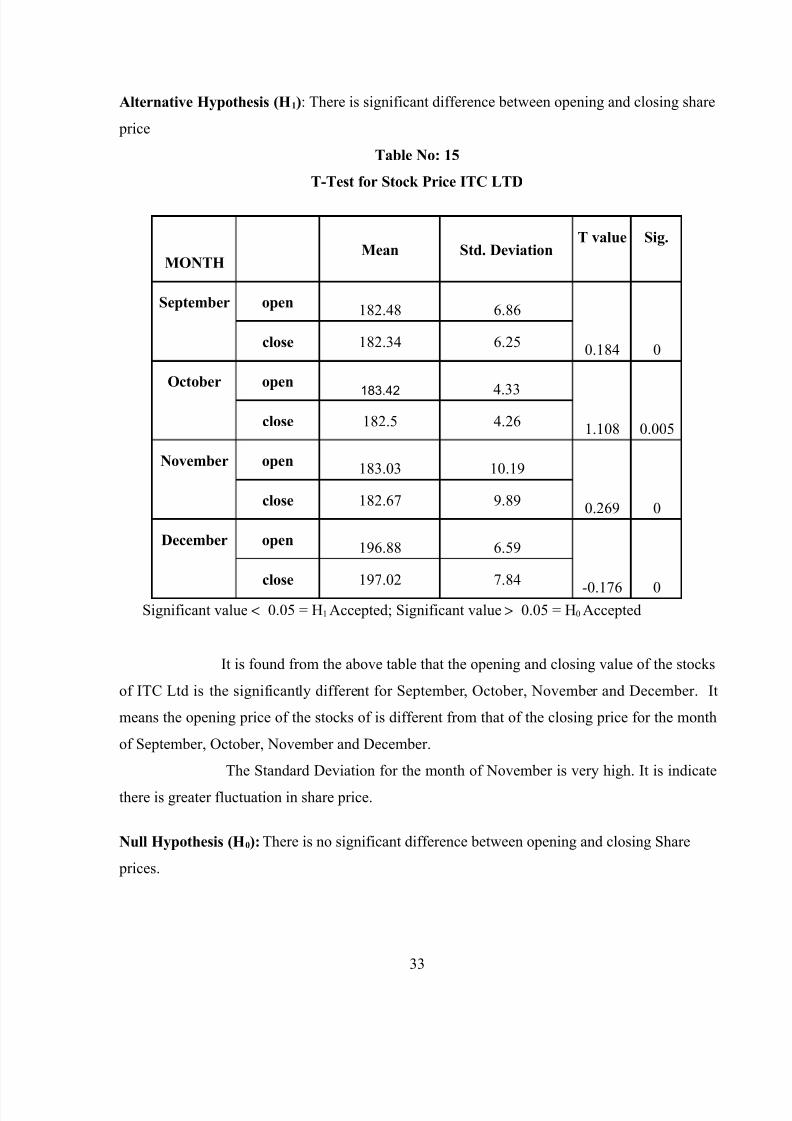
Table No: 15
T-Test for Stock Price ITC LTD
MONTHMean Std. Deviation
T value Sig.
September open182.48 6.86
0.184 0close 182.34 6.25
October open183.42 4.33
1.108 0.005close 182.5 4.26
November open183.03 10.19
0.269 0close 182.67 9.89
December open196.88 6.59
-0.176 0close 197.02 7.84
Significant value < 0.05 = H1 Accepted; Significant value > 0.05 = H0 Accepted
It is found from the above table that the opening and closing value of the stocks
of ITC Ltd is the significantly different for September, October, November and December. It
means the opening price of the stocks of is different from that of the closing price for the month
of September, October, November and December.
The Standard Deviation for the month of November is very high. It is indicate
there is greater fluctuation in share price.
Null Hypothesis (H0): There is no significant difference between opening and closing Share
prices.
33
8/6/2019 Share Main Project
http://slidepdf.com/reader/full/share-main-project 34/53
Alternative Hypothesis (H1): There is significant difference between opening and closing share
price
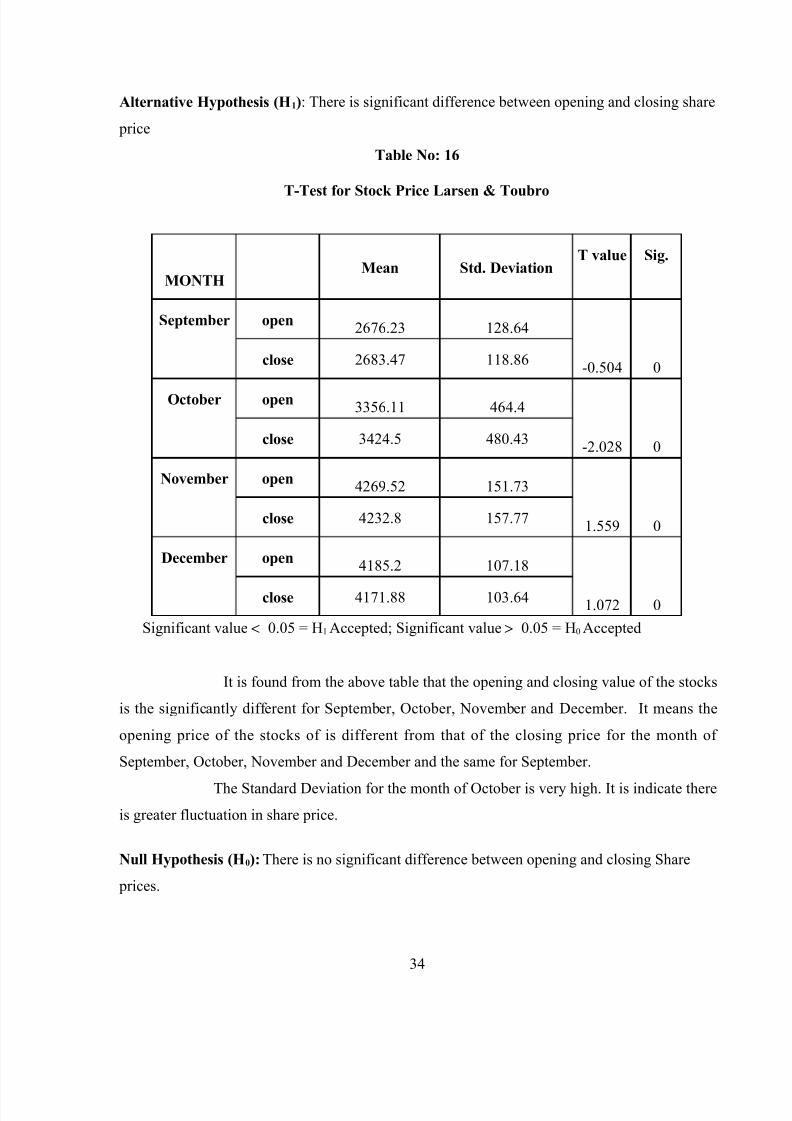
Table No: 16
T-Test for Stock Price Larsen & Toubro
MONTHMean Std. Deviation
T value Sig.
September open2676.23 128.64
-0.504 0close 2683.47 118.86
October open3356.11 464.4
-2.028 0close 3424.5 480.43
November open4269.52 151.73
1.559 0close 4232.8 157.77
December open4185.2 107.18
1.072 0close 4171.88 103.64
Significant value < 0.05 = H1 Accepted; Significant value > 0.05 = H0 Accepted
It is found from the above table that the opening and closing value of the stocks
is the significantly different for September, October, November and December. It means the
opening price of the stocks of is different from that of the closing price for the month of
September, October, November and December and the same for September.
The Standard Deviation for the month of October is very high. It is indicate there
is greater fluctuation in share price.
Null Hypothesis (H0): There is no significant difference between opening and closing Share
prices.
34

8/6/2019 Share Main Project
http://slidepdf.com/reader/full/share-main-project 35/53
Alternative Hypothesis (H1): There is significant difference between opening and closing share
price
Table No: 17
T-Test for Stock Price Mahindra & Mahindra
MONTHMean Std. Deviation
T value Sig.
September open731.93 30.1
0.63 0close 729.94 29.04
October open 772.32 32.39
0.185 0close 771.38 30.39
November open736.04 19.66
1.615 0.003close 730.16 18.4
December open800.68 25.58
0.273 0close 799.67 30.81
Significant value < 0.05 = H1 Accepted; Significant value > 0.05 = H0 Accepted
It is found from the above table that the opening and closing value of the stocks
of Mahaindra & Mahindra is the significantly different for September, October, November and
December. It means the opening price of the stocks of is different from that of the closing price
for the month of September, October, November and December
The Standard Deviation for the month of October is very high. It is indicate thereis greater fluctuation in share price.
Null Hypothesis (H0): There is no significant difference between opening and closing Share
prices.
35
8/6/2019 Share Main Project
http://slidepdf.com/reader/full/share-main-project 36/53
Alternative Hypothesis (H1): There is significant difference between opening and closing share
price
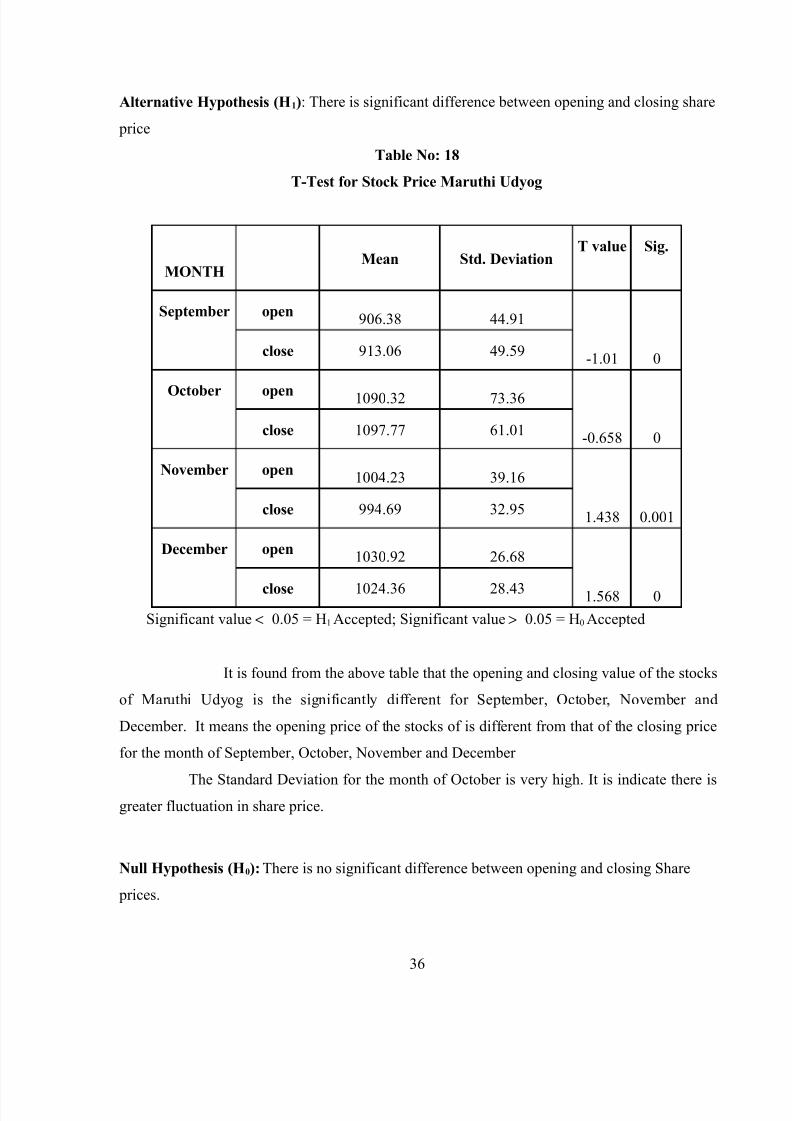
Table No: 18
T-Test for Stock Price Maruthi Udyog
MONTHMean Std. Deviation
T value Sig.
September open906.38 44.91
-1.01 0close 913.06 49.59
October open 1090.32 73.36
-0.658 0close 1097.77 61.01
November open1004.23 39.16
1.438 0.001close 994.69 32.95
December open1030.92 26.68
1.568 0close 1024.36 28.43
Significant value < 0.05 = H1 Accepted; Significant value > 0.05 = H0 Accepted
It is found from the above table that the opening and closing value of the stocks
of Maruthi Udyog is the significantly different for September, October, November and
December. It means the opening price of the stocks of is different from that of the closing price
for the month of September, October, November and December
The Standard Deviation for the month of October is very high. It is indicate there isgreater fluctuation in share price.
Null Hypothesis (H0): There is no significant difference between opening and closing Share
prices.
36

8/6/2019 Share Main Project
http://slidepdf.com/reader/full/share-main-project 37/53
Alternative Hypothesis (H1): There is significant difference between opening and closing share
price
Table No: 19
T-Test for Stock Price National Thermal Power (NTPC)
MONTHMean Std. Deviation
T value Sig.
September open189.07 5.99
-0.725 0.009close 189.96 5.79
October open 219.18 12.65
-0.523 0close 220.09 10.84
November open246.58 18.03
0.364 0close 245.69 15.26
December open242.43 6.71
0.831 0.002close 241.3 7.49
Significant value < 0.05 = H1 Accepted; Significant value > 0.05 = H0 Accepted
It is found from the above table that the opening and closing value of the
stocks of NTPC is the significantly different for September, October, November and December.
It means the opening price of the stocks of is different from that of the closing price for the
month of September, October, November and December
The Standard Deviation for the month of October is very high. It is indicate thereis greater fluctuation in share price.
Null Hypothesis (H0): There is no significant difference between opening and closing Share
prices.
37
8/6/2019 Share Main Project
http://slidepdf.com/reader/full/share-main-project 38/53
Alternative Hypothesis (H1): There is significant difference between opening and closing share
price
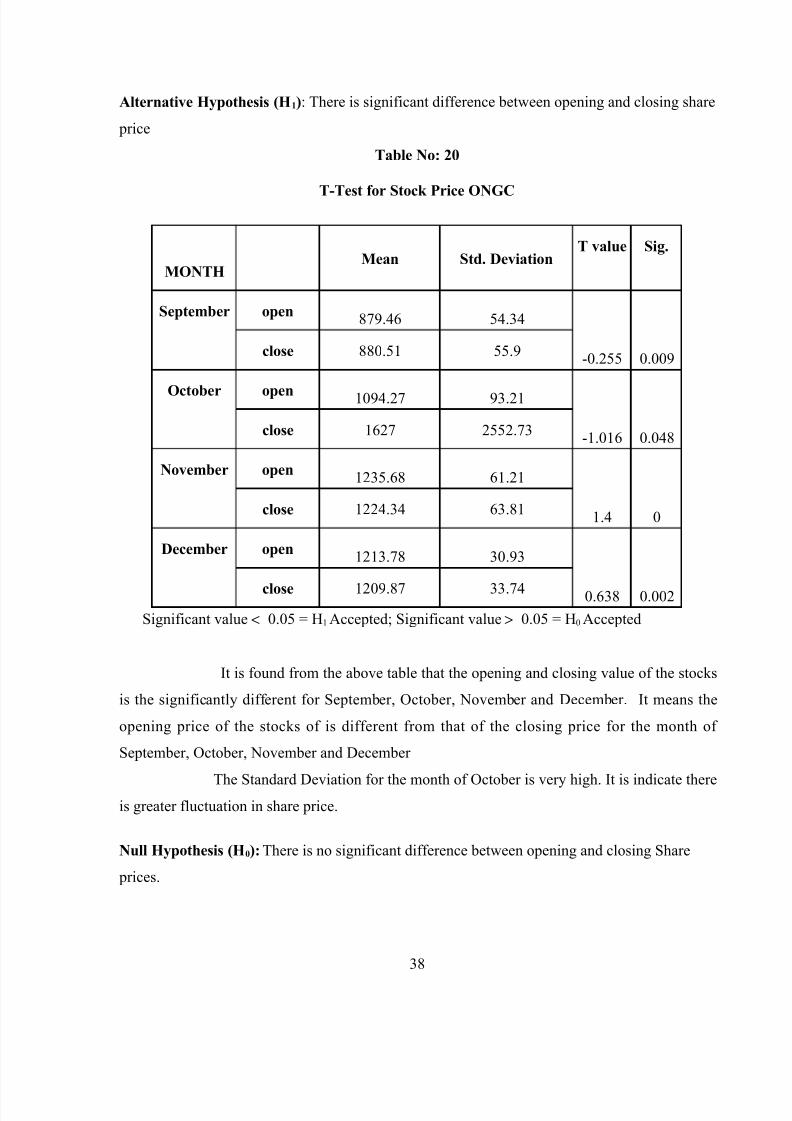
Table No: 20
T-Test for Stock Price ONGC
MONTHMean Std. Deviation
T value Sig.
September open879.46 54.34
-0.255 0.009close 880.51 55.9
October open 1094.27 93.21
-1.016 0.048close 1627 2552.73
November open1235.68 61.21
1.4 0close 1224.34 63.81
December open1213.78 30.93
0.638 0.002close 1209.87 33.74
Significant value < 0.05 = H1 Accepted; Significant value > 0.05 = H0 Accepted
It is found from the above table that the opening and closing value of the stocks
is the significantly different for September, October, November and December. It means the
opening price of the stocks of is different from that of the closing price for the month of
September, October, November and December
The Standard Deviation for the month of October is very high. It is indicate thereis greater fluctuation in share price.
Null Hypothesis (H0): There is no significant difference between opening and closing Share
prices.
38

8/6/2019 Share Main Project
http://slidepdf.com/reader/full/share-main-project 39/53
Alternative Hypothesis (H1): There is significant difference between opening and closing share
price
Table No: 21
T-Test for Stock Price RANBAXY LAB
MONTHMean Std. Deviation
T value Sig.
September open414.38 11.42
-0.575 0close 415.33 10.47
October open 429.23 10.98
0.917 0.068close 427.16 8.09
November open417.95 18.37
2.252 0close 413.9 18.87
December open409.07 10.46
0.452 0close 408.33 10.09
Significant value < 0.05 = H1 Accepted; Significant value > 0.05 = H0 Accepted
It is found from the above table that the opening and closing value of the stocks
of RANBAXY is the significantly different for September, November and December. Whereas
for the month of October, it is significantly not different. It means the opening price of the
stocks of is different from that of the closing price for the month of September, November and
December and the same for October.The Standard Deviation for the month of November is very high. It is indicate
there is greater fluctuation in share price.
Null Hypothesis (H0): There is no significant difference between opening and closing Share
prices.
39
8/6/2019 Share Main Project
http://slidepdf.com/reader/full/share-main-project 40/53
Alternative Hypothesis (H1): There is significant difference between opening and closing share
price
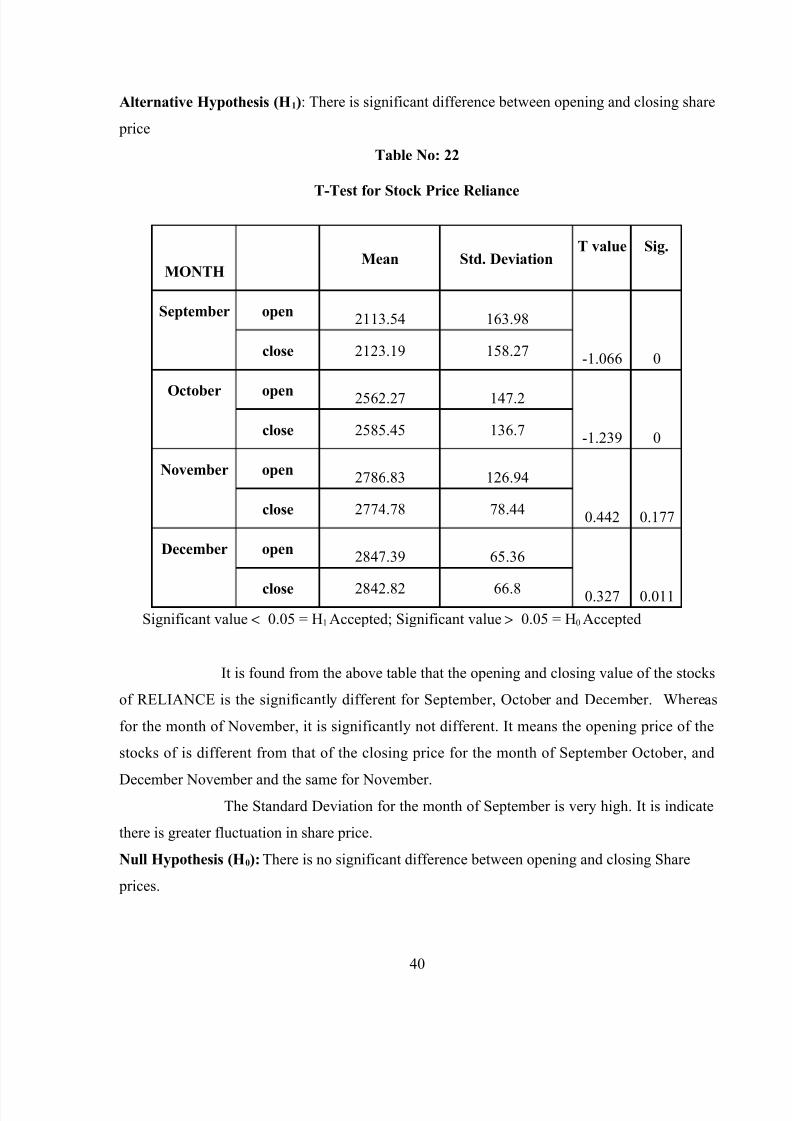
Table No: 22
T-Test for Stock Price Reliance
MONTHMean Std. Deviation
T value Sig.
September open2113.54 163.98
-1.066 0close 2123.19 158.27
October open 2562.27 147.2
-1.239 0close 2585.45 136.7
November open2786.83 126.94
0.442 0.177close 2774.78 78.44
December open2847.39 65.36
0.327 0.011close 2842.82 66.8
Significant value < 0.05 = H1 Accepted; Significant value > 0.05 = H0 Accepted
It is found from the above table that the opening and closing value of the stocks
of RELIANCE is the significantly different for September, October and December. Whereas
for the month of November, it is significantly not different. It means the opening price of the
stocks of is different from that of the closing price for the month of September October, and
December November and the same for November.The Standard Deviation for the month of September is very high. It is indicate
there is greater fluctuation in share price.
Null Hypothesis (H0): There is no significant difference between opening and closing Share
prices.
40

8/6/2019 Share Main Project
http://slidepdf.com/reader/full/share-main-project 41/53
Alternative Hypothesis (H1): There is significant difference between opening and closing share
price
Table No: 23
T-Test for Stock Price Reliance Communications
MONTHMean Std. Deviation
T value Sig.
September open559.65 23.5
-0.44 0close 560.61 24.61
October open 714.98 58.34
-1.611 0close 721.6 51.6
November open720.99 37.8
3.236 0close 711.34 36.19
December open733.75 23.1
0.57 0.002close 731.51 18.44
Significant value < 0.05 = H1 Accepted; Significant value > 0.05 = H0 Accepted
It is found from the above table that the opening and closing value of the stocks
of RCOM is the significantly different for September, October, November and December. It
means the opening price of the stocks of is different from that of the closing price for the month
of September, October, November and December.
The Standard Deviation for the month of October is very high. It is indicate thereis greater fluctuation in share price.
Null Hypothesis (H0): There is no significant difference between opening and closing Share
prices.
41

8/6/2019 Share Main Project
http://slidepdf.com/reader/full/share-main-project 42/53
Alternative Hypothesis (H1): There is significant difference between opening and closing share
price
Table No: 24
T-Test for Stock Price Reliance Energy
MONTHMean Std. Deviation
T value Sig.
September open941.76 123.19
-2.288 0close 961.23 142.9
October open 1595.27 191.63
-0.444 0close 1605.61 173.06
November open1811.66 90.32
1.334 0.013close 1787.79 76.83
December open1964.76 118.68
-0.863 0close 1976.88 124.62
Significant value < 0.05 = H1 Accepted; Significant value > 0.05 = H0 Accepted
It is found from the above table that the opening and closing value of the stocks
of RELIACE ENERGY is the significantly different for September, October, November and
December. It means the opening price of the stocks of is different from that of the closing price
for the month of September October, November and December
The Standard Deviation for the month of December is very high. It is indicatethere is greater fluctuation in share price.
Null Hypothesis (H0): There is no significant difference between opening and closing Share
prices.
42
8/6/2019 Share Main Project
http://slidepdf.com/reader/full/share-main-project 43/53
Alternative Hypothesis (H1): There is significant difference between opening and closing share
price
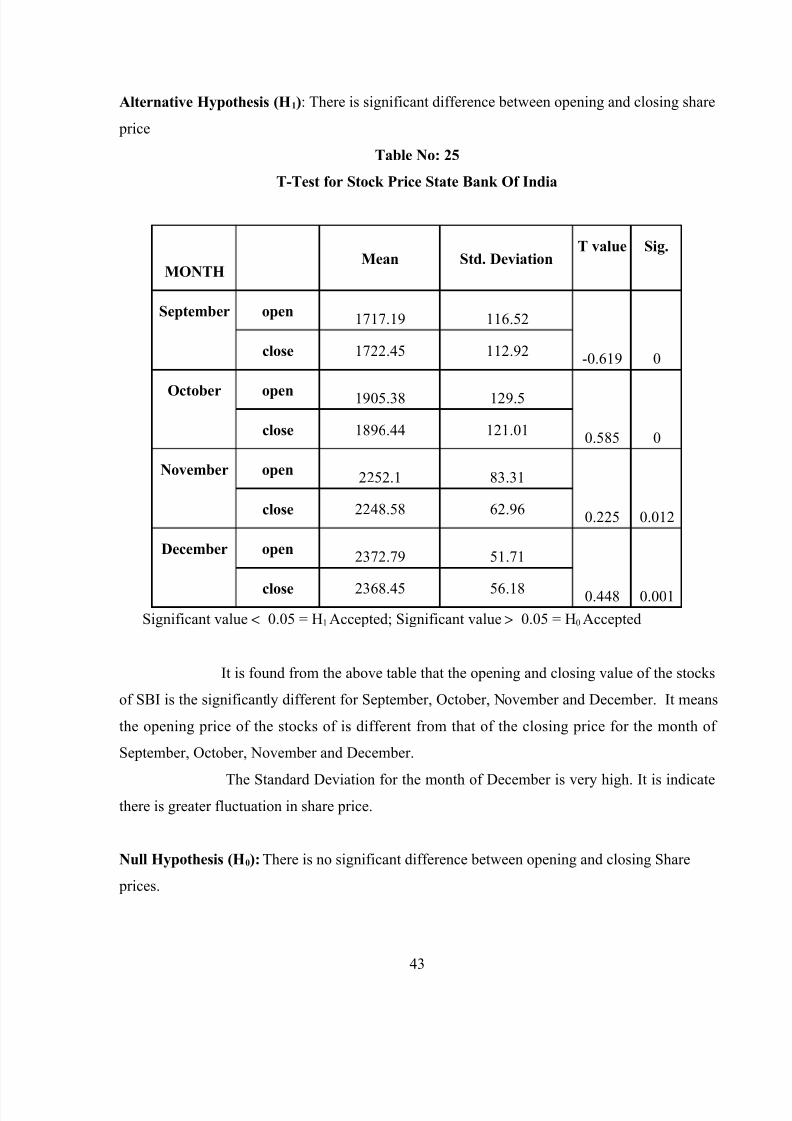
Table No: 25
T-Test for Stock Price State Bank Of India
MONTHMean Std. Deviation
T value Sig.
September open1717.19 116.52
-0.619 0close 1722.45 112.92
October open 1905.38 129.5
0.585 0close 1896.44 121.01
November open2252.1 83.31
0.225 0.012close 2248.58 62.96
December open2372.79 51.71
0.448 0.001close 2368.45 56.18
Significant value < 0.05 = H1 Accepted; Significant value > 0.05 = H0 Accepted
It is found from the above table that the opening and closing value of the stocks
of SBI is the significantly different for September, October, November and December. It means
the opening price of the stocks of is different from that of the closing price for the month of
September, October, November and December.
The Standard Deviation for the month of December is very high. It is indicatethere is greater fluctuation in share price.
Null Hypothesis (H0): There is no significant difference between opening and closing Share
prices.
43
8/6/2019 Share Main Project
http://slidepdf.com/reader/full/share-main-project 44/53
Alternative Hypothesis (H1): There is significant difference between opening and closing share
price
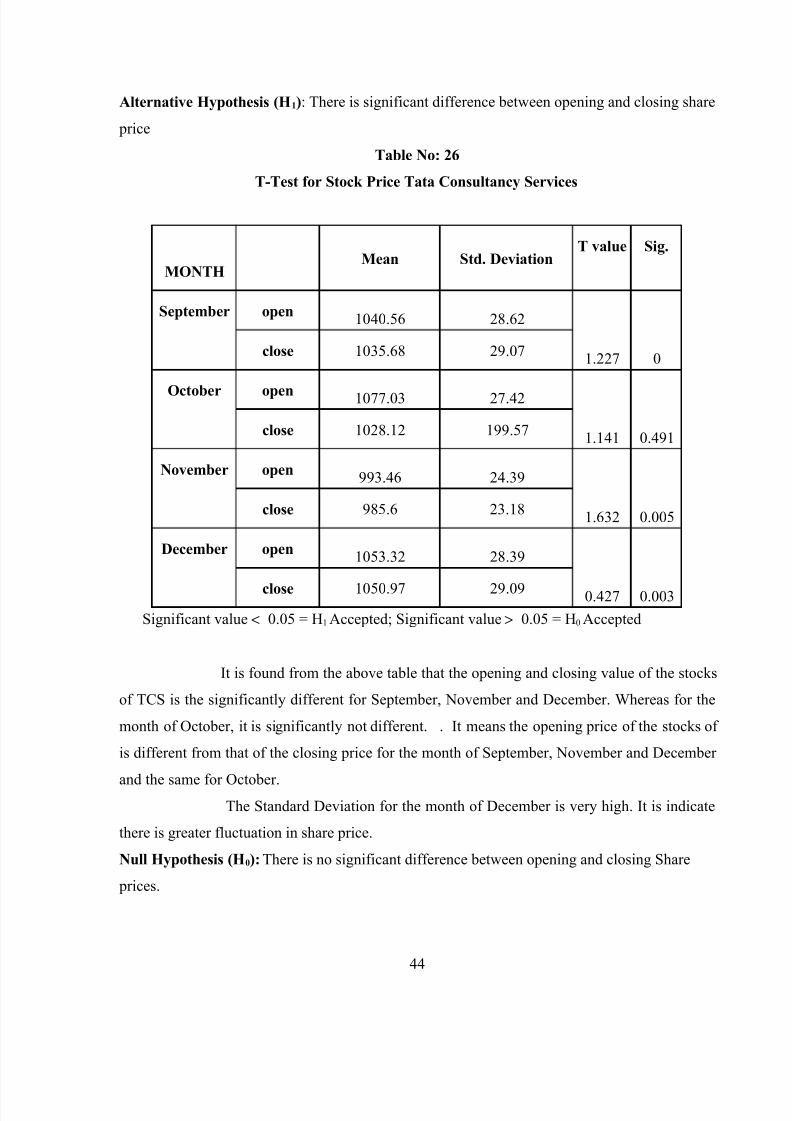
Table No: 26
T-Test for Stock Price Tata Consultancy Services
MONTHMean Std. Deviation
T value Sig.
September open1040.56 28.62
1.227 0close 1035.68 29.07
October open 1077.03 27.42
1.141 0.491close 1028.12 199.57
November open993.46 24.39
1.632 0.005close 985.6 23.18
December open1053.32 28.39
0.427 0.003close 1050.97 29.09
Significant value < 0.05 = H1 Accepted; Significant value > 0.05 = H0 Accepted
It is found from the above table that the opening and closing value of the stocks
of TCS is the significantly different for September, November and December. Whereas for the
month of October, it is significantly not different. . It means the opening price of the stocks of
is different from that of the closing price for the month of September, November and December
and the same for October.The Standard Deviation for the month of December is very high. It is indicate
there is greater fluctuation in share price.
Null Hypothesis (H0): There is no significant difference between opening and closing Share
prices.
44

8/6/2019 Share Main Project
http://slidepdf.com/reader/full/share-main-project 45/53
Alternative Hypothesis (H1): There is significant difference between opening and closing share
price
Table No: 27
T-Test for Stock Price Wipro Ltd
MONTHMean Std. Deviation
T value Sig.
September open 459.50 13.91
2.025 .056
close 455.98 13.32
October open 485.84 16.706.52 .00
close 475.18 15.92
November open 444.97 91.45
-.87 .39
close 461.30 17.69
December open 504.11 20.84
-.765 .454
close 506.26 19.19
Significant value < 0.05 = H1 Accepted; Significant value > 0.05 = H0 Accepted
It is found from the above table that the opening and closing value of the stocks of
WIPRO is the same during September, November and December whereas different for the
month of October. It means the opening price of the stocks of Wipro is different from that of
the closing is price
The Standard Deviation for the month of December is very high. It is indicatethere is greater fluctuation in share price.
Null Hypothesis (H0): There is no significant difference between opening and closing Share
prices.
45
8/6/2019 Share Main Project
http://slidepdf.com/reader/full/share-main-project 46/53
Alternative Hypothesis (H1): There is significant difference between opening and closing share
price
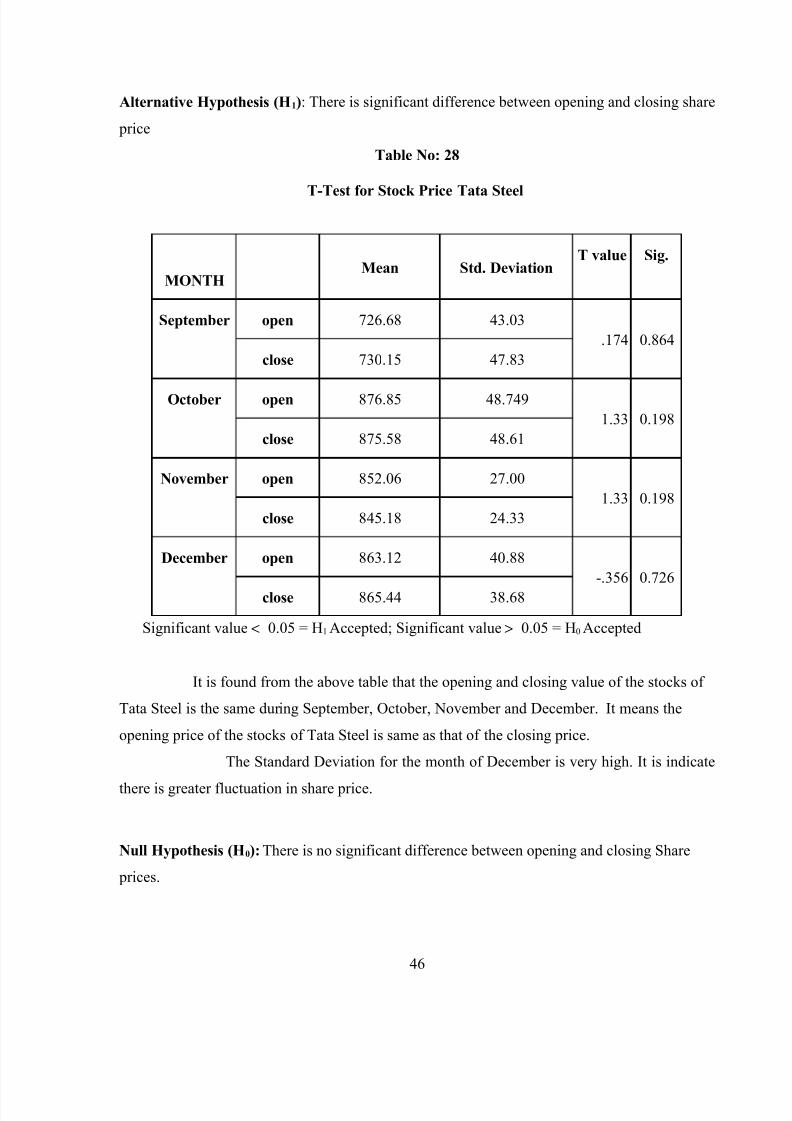
Table No: 28
T-Test for Stock Price Tata Steel
MONTHMean Std. Deviation
T value Sig.
September open 726.68 43.03
.174 0.864
close 730.15 47.83
October open 876.85 48.749
1.33 0.198
close 875.58 48.61
November open 852.06 27.00
1.33 0.198
close 845.18 24.33
December open 863.12 40.88
-.356 0.726
close 865.44 38.68
Significant value < 0.05 = H1 Accepted; Significant value > 0.05 = H0 Accepted
It is found from the above table that the opening and closing value of the stocks of
Tata Steel is the same during September, October, November and December. It means the
opening price of the stocks of Tata Steel is same as that of the closing price.
The Standard Deviation for the month of December is very high. It is indicate
there is greater fluctuation in share price.
Null Hypothesis (H0): There is no significant difference between opening and closing Share
prices.
46
8/6/2019 Share Main Project
http://slidepdf.com/reader/full/share-main-project 47/53
Alternative Hypothesis (H1): There is significant difference between opening and closing share
price
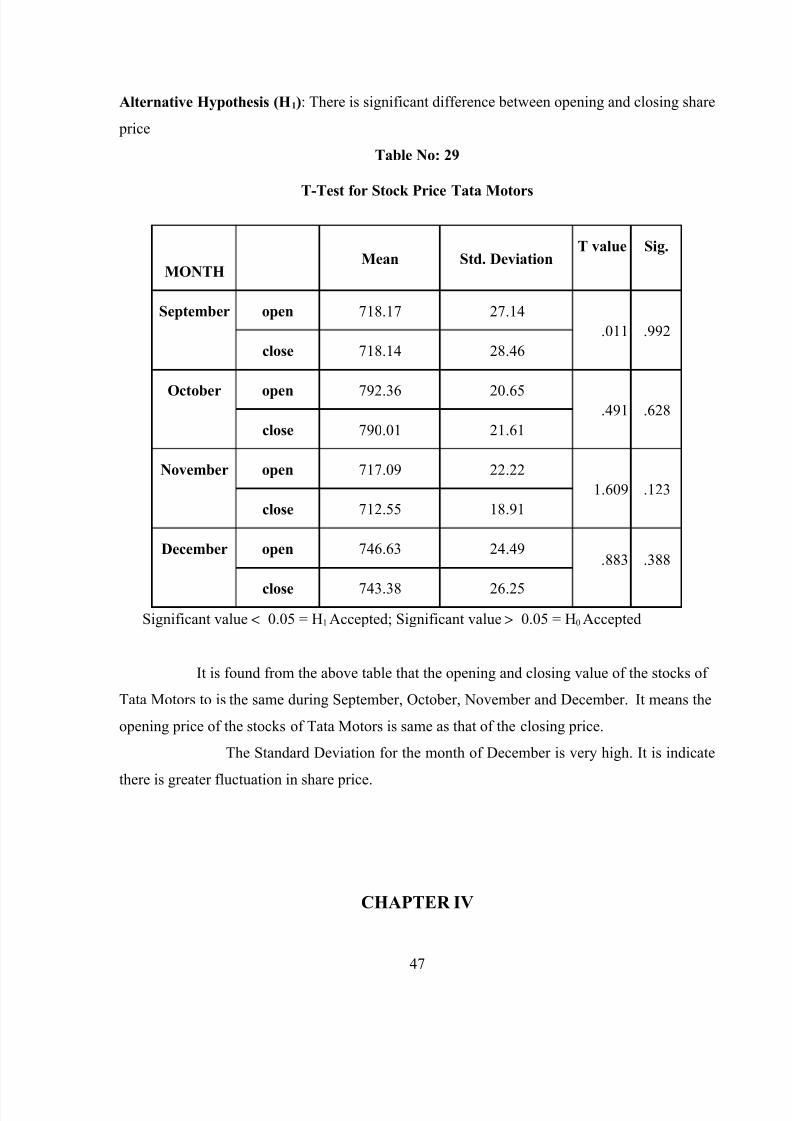
Table No: 29
T-Test for Stock Price Tata Motors
MONTHMean Std. Deviation
T value Sig.
September open 718.17 27.14
.011 .992
close 718.14 28.46
October open 792.36 20.65.491 .628
close 790.01 21.61
November open 717.09 22.22
1.609 .123
close 712.55 18.91
December open 746.63 24.49.883 .388
close 743.38 26.25
Significant value < 0.05 = H1 Accepted; Significant value > 0.05 = H0 Accepted
It is found from the above table that the opening and closing value of the stocks of
Tata Motors to is the same during September, October, November and December. It means the
opening price of the stocks of Tata Motors is same as that of the closing price.
The Standard Deviation for the month of December is very high. It is indicate
there is greater fluctuation in share price.
CHAPTER IV
47

8/6/2019 Share Main Project
http://slidepdf.com/reader/full/share-main-project 48/53
FINDINGS, SUGGESTIONS & CONCLUSION
Findings
• ACC : The opening and closing price are found significantly different due to opening
price is high and the closing price is low for the month of September, October,
November, December.
• BAJAJ AUTO: The opening and closing value of the stocks are found significantly
different for September, October, and November. Whereas for the month of December,
it is significantly not different.
• BARATHI : The opening and closing value of the stocks of Barathi is the significantly
different for September, October, and December. Whereas for the month of November,
it is significantly not different.
• BHEL: The opening and closing value of the stocks of BHEL is the significantly
different for October, November and December. Whereas for the month of September,
it is significantly not different.
• CIPLA: The opening and closing value of the stocks of CIPLA is the significantly
different for September, October, November and December.
• DLF: The opening and closing value of the stocks of DLF is the significantly different
for September, October, November and December.
• GRASIM : The opening and closing value of the stocks of GRASIM is the significantly
different for September, October, November and December.
48

8/6/2019 Share Main Project
http://slidepdf.com/reader/full/share-main-project 49/53

8/6/2019 Share Main Project
http://slidepdf.com/reader/full/share-main-project 50/53
• MARUTH UDI : The opening and closing value of the stocks of MARUTHI is the
significantly different for September, October, November and December.
• NATIONAL THERMAL POWER (NTPC): The opening and closing value of the
stocks of NTPC is the significantly different for September, October, November and
December.
• ONGC : The opening and closing value of the stocks is the significantly different for
September, October, November and December.
• RANBAXY : The opening and closing value of the stocks of RANBAXY is the
significantly different for September, November and December. Whereas for the month
of October, it is significantly not different.
• RELIANCE : The opening and closing value of the stocks of RELIANCE is the
significantly different for September, October and December. Whereas for the month of
November, it is significantly not different.
• RELIANCE COMMUNICATION : The opening and closing value of the stocks of
RCOM is the significantly different for September, October, November and December.
• RELIANCE ENERY: The opening and closing value of the stocks of RELIACE
ENERGY is the significantly different for September, October, November and
December.
• STATE BANK OF INDIA: The opening and closing value of the stocks of SBI is thesignificantly different for September, October, November and December.
50
8/6/2019 Share Main Project
http://slidepdf.com/reader/full/share-main-project 51/53
8/6/2019 Share Main Project
http://slidepdf.com/reader/full/share-main-project 52/53
Suggestions
• The company can provide separate system for doing technical and fundamental analysis,
which helps to take stock investments decisions.
• SEBI will have to protect the interests of the investor in securities. Because people
depend upon share brokers, jobbers etc. Many of them are weak speculators and
frequently put their clients into difficulties. They create violent price fluctuation.
• Since stock market is highly sensitive to various uncontrollable national and
international factors, SEBI and regulatory bodies must frame guidelines and regulations
from time to time bring stabilization in stock market activities.
52

8/6/2019 Share Main Project
http://slidepdf.com/reader/full/share-main-project 53/53
CONCLUSION
At the most fundamental level, supply and demand in the market determines stock
price. There are many types of techniques and methods that investors use to figure out whether
a stock price will go up or down. Stock prices changes every day because of market forces.
Share prices experience volatility. The extent of volatility varies across companies, business
events and market cycles. The extent of the volatility can range from a little to a lot. Time
intervals for substantial price changes may be daily, between days and over longer periods.
Volatility is an insight to the risk of share price fluctuation. It is a factor in the balancing of risk
and reward. The analysis shows the share price fluctuations of the companies that are
considered for calculating SENSEX. This forms a basis for the investors to take investment
decision in shares. Further researches can be conducted in the areas like investor’s likes &
dislike of share investment, factors influencing share price movement and so on.
Related Documents