Am. J. Hum. Genet. 65:208–219, 1999 208 Sex-Specific Migration Patterns in Central Asian Populations, Revealed by Analysis of Y-Chromosome Short Tandem Repeats and mtDNA Anna Pe ´rez-Lezaun, 1 Francesc Calafell, 1 David Comas, 1 Eva Mateu, 1 Elena Bosch, 1 Rosa Martı ´nez-Arias, 1 Jordi Clarimo ´n, 1 Giovanni Fiori, 2 Donata Luiselli, 2 Fiorenzo Facchini, 2 Davide Pettener, 2 and Jaume Bertranpetit 1 1 Unitat de Biologia Evolutiva, Facultat de Cie `ncies de la Salut i de la Vida, Universitat Pompeu Fabra, Barcelona; and 2 Dipartimento di Biologia evoluzionistica sperimentale, Unita ` di Antropologia, Universita ` di Bologna, Bologna Summary Eight Y-linked short-tandem-repeat polymorphisms (DYS19, DYS388, DYS389I, DYS389II, DYS390, DYS391, DYS392, and DYS393) were analyzed in four populations of Central Asia, comprising two lowland samples—Uighurs and lowland Kirghiz—and two high- land samples—namely, the Kazakhs (altitude 2,500 m above sea level) and highland Kirghiz (altitude 3,200 m above sea level). The results were compared with mtDNA sequence data on the same individuals, to study possible differences in male versus female genetic-vari- ation patterns in these Central Asian populations. Anal- ysis of molecular variance (AMOVA) showed a very high degree of genetic differentiation among the populations tested, in discordance with the results obtained with mtDNA sequences, which showed high homogeneity. Moreover, a dramatic reduction of the haplotype genetic diversity was observed in the villages at high altitude, especially in the highland Kirghiz, when compared with the villages at low altitude, which suggests a male foun- der effect in the settlement of high-altitude lands. None- theless, mtDNA genetic diversity in these highland pop- ulations is equivalent to that in the lowland populations. The present results suggest a very different migration pattern in males versus females, in an extended historical frame, with a higher migration rate for females. Received December 7, 1998; accepted for publication April 23, 1999; electronically published May 24, 1999. Address for correspondence and reprints: Dr. Jaume Bertranpetit, Unitat de Biologia Evolutiva, Facultat de Cie `ncies de la Salut i de la Vida, Universitat Pompeu Fabra Doctor Aiguader 80, 08003 Barce- lona, Catalonia, Spain. E-mail: [email protected] q 1999 by The American Society of Human Genetics. All rights reserved. 0002-9297/99/6501-0027$02.00 Introduction Central Asia is a vast extension of land often regarded as a borderland between East and West. It comprises the republics of Uzbekistan, Tajikistan, Turkmenistan, Kirghizstan, and part of Kazakhstan, along the regions of the Pamir, the Hindu Kush, and farther to the northeast. Genetically, Central Asia is one of the least-studied major regions of the world. The scarce studies on the region, based on classical genetic markers (Cavalli- Sforza et al. 1994) and mtDNA (Comas et al. 1998), seem to indicate that Central Asia has a genetic com- position intermediate between those of Asian and Eu- ropean populations, probably because of admixture of already differentiated Eastern and Western populations rather than because of an intermediate position in a gen- eral Eurasian cline. The value of Y-chromosome polymorphisms for hu- man evolutionary studies has largely been recognized. Recently, a large amount of population variation in the Y chromosome has been described (Underhill et al. 1997; Kayser et al. 1997), which seems to be highly relevant in molecular studies of human evolution (Pena et al. 1995; Hammer and Zegura 1996; Underhill et al. 1996; Hammer et al. 1997). Other studies (Cooper et al. 1996; Deka et al. 1996) have shown, in particular, the appli- cability of Y-chromosome short tandem repeat (STR) haplotypes to human population genetics. Because of the smaller effective population size of Y chromosomes com- pared with the autosomes, Y-chromosome polymor- phisms are more affected by genetic-drift processes and thus could be very useful to point out genetic differences between closely related populations whose time of di- vergence has been relatively short. In a previous study (Pe ´rez-Lezaun et al. 1997), the degree of polymorphism in Y-chromosome STRs and their autosomal counterparts was analyzed and assessed to be equivalent, when corrections for the smaller ef- fective population size of the Y chromosome with respect to the autosomes were applied. The fact that the majority

Welcome message from author
This document is posted to help you gain knowledge. Please leave a comment to let me know what you think about it! Share it to your friends and learn new things together.
Transcript

Am. J. Hum. Genet. 65:208–219, 1999
208
Sex-Specific Migration Patterns in Central Asian Populations, Revealed byAnalysis of Y-Chromosome Short Tandem Repeats and mtDNAAnna Perez-Lezaun,1 Francesc Calafell,1 David Comas,1 Eva Mateu,1 Elena Bosch,1Rosa Martınez-Arias,1 Jordi Clarimon,1 Giovanni Fiori,2 Donata Luiselli,2 Fiorenzo Facchini,2Davide Pettener,2 and Jaume Bertranpetit1
1Unitat de Biologia Evolutiva, Facultat de Ciencies de la Salut i de la Vida, Universitat Pompeu Fabra, Barcelona; and 2Dipartimento diBiologia evoluzionistica sperimentale, Unita di Antropologia, Universita di Bologna, Bologna
Summary
Eight Y-linked short-tandem-repeat polymorphisms(DYS19, DYS388, DYS389I, DYS389II, DYS390,DYS391, DYS392, and DYS393) were analyzed in fourpopulations of Central Asia, comprising two lowlandsamples—Uighurs and lowland Kirghiz—and two high-land samples—namely, the Kazakhs (altitude 2,500 mabove sea level) and highland Kirghiz (altitude 3,200 mabove sea level). The results were compared withmtDNA sequence data on the same individuals, to studypossible differences in male versus female genetic-vari-ation patterns in these Central Asian populations. Anal-ysis of molecular variance (AMOVA) showed a very highdegree of genetic differentiation among the populationstested, in discordance with the results obtained withmtDNA sequences, which showed high homogeneity.Moreover, a dramatic reduction of the haplotype geneticdiversity was observed in the villages at high altitude,especially in the highland Kirghiz, when compared withthe villages at low altitude, which suggests a male foun-der effect in the settlement of high-altitude lands. None-theless, mtDNA genetic diversity in these highland pop-ulations is equivalent to that in the lowland populations.The present results suggest a very different migrationpattern in males versus females, in an extended historicalframe, with a higher migration rate for females.
Received December 7, 1998; accepted for publication April 23,1999; electronically published May 24, 1999.
Address for correspondence and reprints: Dr. Jaume Bertranpetit,Unitat de Biologia Evolutiva, Facultat de Ciencies de la Salut i de laVida, Universitat Pompeu Fabra Doctor Aiguader 80, 08003 Barce-lona, Catalonia, Spain. E-mail: [email protected]
q 1999 by The American Society of Human Genetics. All rights reserved.0002-9297/99/6501-0027$02.00
Introduction
Central Asia is a vast extension of land often regardedas a borderland between East and West. It comprises therepublics of Uzbekistan, Tajikistan, Turkmenistan,Kirghizstan, and part of Kazakhstan, along the regionsof the Pamir, the Hindu Kush, and farther to thenortheast.
Genetically, Central Asia is one of the least-studiedmajor regions of the world. The scarce studies on theregion, based on classical genetic markers (Cavalli-Sforza et al. 1994) and mtDNA (Comas et al. 1998),seem to indicate that Central Asia has a genetic com-position intermediate between those of Asian and Eu-ropean populations, probably because of admixture ofalready differentiated Eastern and Western populationsrather than because of an intermediate position in a gen-eral Eurasian cline.
The value of Y-chromosome polymorphisms for hu-man evolutionary studies has largely been recognized.Recently, a large amount of population variation in theY chromosome has been described (Underhill et al. 1997;Kayser et al. 1997), which seems to be highly relevantin molecular studies of human evolution (Pena et al.1995; Hammer and Zegura 1996; Underhill et al. 1996;Hammer et al. 1997). Other studies (Cooper et al. 1996;Deka et al. 1996) have shown, in particular, the appli-cability of Y-chromosome short tandem repeat (STR)haplotypes to human population genetics. Because of thesmaller effective population size of Y chromosomes com-pared with the autosomes, Y-chromosome polymor-phisms are more affected by genetic-drift processes andthus could be very useful to point out genetic differencesbetween closely related populations whose time of di-vergence has been relatively short.
In a previous study (Perez-Lezaun et al. 1997), thedegree of polymorphism in Y-chromosome STRs andtheir autosomal counterparts was analyzed and assessedto be equivalent, when corrections for the smaller ef-fective population size of the Y chromosome with respectto the autosomes were applied. The fact that the majority
Perez-Lezaun et al.: Y-Chromosome STRs in Central Asia 209
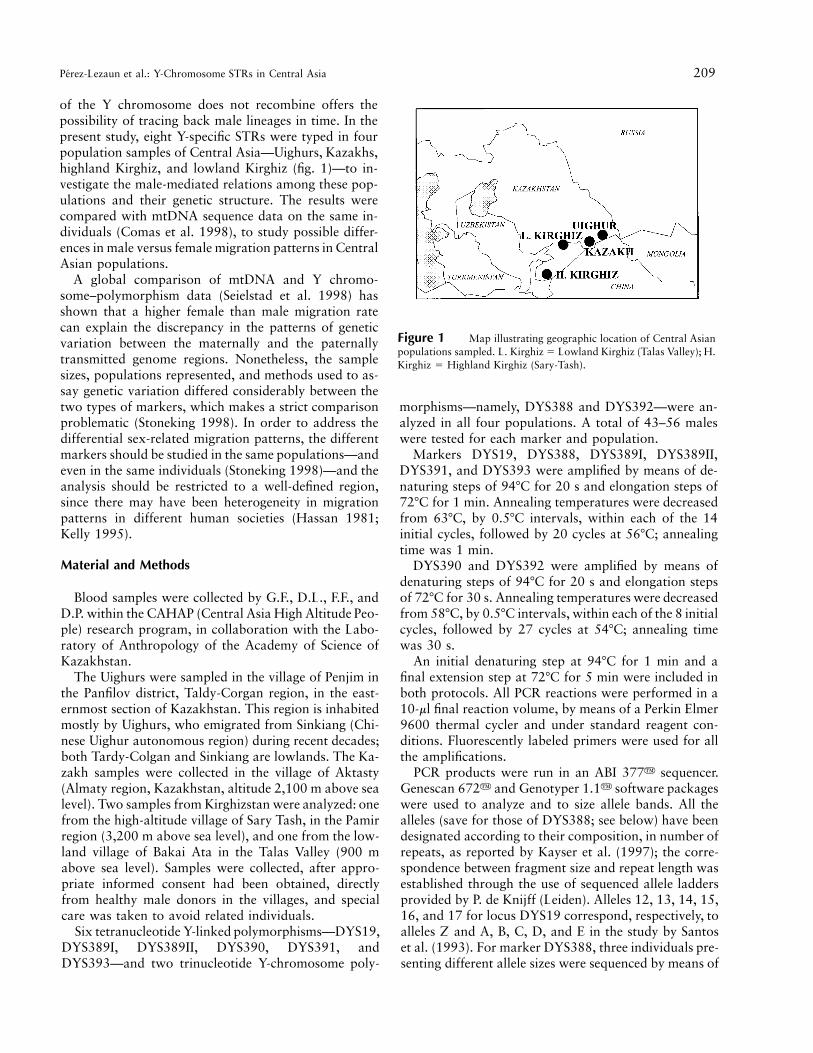
Figure 1 Map illustrating geographic location of Central Asianpopulations sampled. L. Kirghiz 5 Lowland Kirghiz (Talas Valley); H.Kirghiz 5 Highland Kirghiz (Sary-Tash).
of the Y chromosome does not recombine offers thepossibility of tracing back male lineages in time. In thepresent study, eight Y-specific STRs were typed in fourpopulation samples of Central Asia—Uighurs, Kazakhs,highland Kirghiz, and lowland Kirghiz (fig. 1)—to in-vestigate the male-mediated relations among these pop-ulations and their genetic structure. The results werecompared with mtDNA sequence data on the same in-dividuals (Comas et al. 1998), to study possible differ-ences in male versus female migration patterns in CentralAsian populations.
A global comparison of mtDNA and Y chromo-some–polymorphism data (Seielstad et al. 1998) hasshown that a higher female than male migration ratecan explain the discrepancy in the patterns of geneticvariation between the maternally and the paternallytransmitted genome regions. Nonetheless, the samplesizes, populations represented, and methods used to as-say genetic variation differed considerably between thetwo types of markers, which makes a strict comparisonproblematic (Stoneking 1998). In order to address thedifferential sex-related migration patterns, the differentmarkers should be studied in the same populations—andeven in the same individuals (Stoneking 1998)—and theanalysis should be restricted to a well-defined region,since there may have been heterogeneity in migrationpatterns in different human societies (Hassan 1981;Kelly 1995).
Material and Methods
Blood samples were collected by G.F., D.L., F.F., andD.P. within the CAHAP (Central Asia High Altitude Peo-ple) research program, in collaboration with the Labo-ratory of Anthropology of the Academy of Science ofKazakhstan.
The Uighurs were sampled in the village of Penjim inthe Panfilov district, Taldy-Corgan region, in the east-ernmost section of Kazakhstan. This region is inhabitedmostly by Uighurs, who emigrated from Sinkiang (Chi-nese Uighur autonomous region) during recent decades;both Tardy-Colgan and Sinkiang are lowlands. The Ka-zakh samples were collected in the village of Aktasty(Almaty region, Kazakhstan, altitude 2,100 m above sealevel). Two samples from Kirghizstan were analyzed: onefrom the high-altitude village of Sary Tash, in the Pamirregion (3,200 m above sea level), and one from the low-land village of Bakai Ata in the Talas Valley (900 mabove sea level). Samples were collected, after appro-priate informed consent had been obtained, directlyfrom healthy male donors in the villages, and specialcare was taken to avoid related individuals.
Six tetranucleotide Y-linked polymorphisms—DYS19,DYS389I, DYS389II, DYS390, DYS391, andDYS393—and two trinucleotide Y-chromosome poly-
morphisms—namely, DYS388 and DYS392—were an-alyzed in all four populations. A total of 43–56 maleswere tested for each marker and population.
Markers DYS19, DYS388, DYS389I, DYS389II,DYS391, and DYS393 were amplified by means of de-naturing steps of 947C for 20 s and elongation steps of727C for 1 min. Annealing temperatures were decreasedfrom 637C, by 0.57C intervals, within each of the 14initial cycles, followed by 20 cycles at 567C; annealingtime was 1 min.
DYS390 and DYS392 were amplified by means ofdenaturing steps of 947C for 20 s and elongation stepsof 727C for 30 s. Annealing temperatures were decreasedfrom 587C, by 0.57C intervals, within each of the 8 initialcycles, followed by 27 cycles at 547C; annealing timewas 30 s.
An initial denaturing step at 947C for 1 min and afinal extension step at 727C for 5 min were included inboth protocols. All PCR reactions were performed in a10-ml final reaction volume, by means of a Perkin Elmer9600 thermal cycler and under standard reagent con-ditions. Fluorescently labeled primers were used for allthe amplifications.
PCR products were run in an ABI 377y sequencer.Genescan 672y and Genotyper 1.1y software packageswere used to analyze and to size allele bands. All thealleles (save for those of DYS388; see below) have beendesignated according to their composition, in number ofrepeats, as reported by Kayser et al. (1997); the corre-spondence between fragment size and repeat length wasestablished through the use of sequenced allele laddersprovided by P. de Knijff (Leiden). Alleles 12, 13, 14, 15,16, and 17 for locus DYS19 correspond, respectively, toalleles Z and A, B, C, D, and E in the study by Santoset al. (1993). For marker DYS388, three individuals pre-senting different allele sizes were sequenced by means of

210 Am. J. Hum. Genet. 65:208–219, 1999
Table 1
Allele Frequencies of Eight Y-Chromosome STRs in Four Central Asian Populations
ALLELE Uighurs Kazakhs Highland Kirghiz Lowland Kirghiz
Frequency
DYS19:10 0 0 0 .02311 0 0 0 012 0 0 0 013 .070 0 0 014 .186 .080 .070 .13615 .209 .080 .140 .18216 .465 .840 .790 .65917 .070 0 0 0
Summary Statistics for DYS19
;n 5 43 D 5 .712 ;n 5 50 D 5 .287 ;n 5 43 D 5 .360 ;n 5 44 D 5 .526
Frequency
DYS388:10 .082 0 0 011 .041 .018 0 012 .551 .164 .958 .61713 .041 .055 0 .17014 .286 .745 .042 .06415 0 0 0 016 0 0 0 017 0 0 0 .04318 0 .018 0 .106
Summary Statistics for DYS388
;n 5 49 D 5 .619 ;n 5 55 D 5 .414 ;n 5 48 D 5 .082 ;n 5 47 D 5 .586
Frequency
DYS389I:9 .245 .018 .021 .10610 .428 .839 .125 .21311 .327 .143 .854 .681
Summary Statistics for DYS389I
;n 5 49 D 5 .663 ;n 5 56 D 5 .280 ;n 5 48 D 5 .260 ;n 5 47 D 5 .490
Frequency
DYS389II:24 .043 0 0 025 .065 .058 0 .12826 .348 .731 .125 .10627 .348 .115 .021 .12828 .174 .096 .041 .17029 .022 0 .792 .44730 0 0 .021 .021
Summary Statistics for DYS389II
;n 5 46 D 5 .737 ;n 5 52 D 5 .440 ;n 5 48 D 5 .362 ;n 5 47 D 5 .743
(continued)
the DNA Sequencing Kity (Perkin-Elmer), to determinethe number of repeats and the repeat structure.
Primers for the DYS389 locus amplify a partially du-plicated region and generate two PCR products,DYS389I and DYS389II. It has been shown that theDYS389II fragment contains the length variation in
DYS389I, as well as three additional stretches of tet-ranucleotide repeats (Pestoni et al. 1999; Rolf et al.1998). Therefore, we have used only DYS389I in thejoint analysis with the other six Y-linked STRs.
Gene diversity at each locus was estimated as D 5, where N is sample size and fi is21 2 [(N/N 2 1)(Sf )]i

Perez-Lezaun et al.: Y-Chromosome STRs in Central Asia 211
Table 1 (continued)
ALLELE Uighurs Kazakhs Highland Kirghiz Lowland Kirghiz
Frequency
DYS390:19 .022 0 0 020 0 .018 0 021 .043 .018 0 .02222 .130 .018 .021 023 .261 .071 .063 .15624 .174 .179 .042 .11125 .326 .607 .854 .64426 .022 .089 .021 .06727 .022 0 0 0
Summary Statistics for DYS390
;n 5 46 D 5 .792 ;n 5 56 D 5 .596 ;n 5 48 D 5 .270 ;n 5 45 D 5 .556
Frequency
DYS391:8 0 0 0 .0219 .080 .071 0 .14610 .660 .893 .188 .35411 .200 .018 .812 .47912 .060 .018 0 0
Summary Statistics for DYS391
;n 5 50 D 5 .525 ;n 5 56 D 5 .200 ;n 5 48 D 5 .312 ;n 5 48 D 5 .637
Frequency
DYS392:9 0 0 0 .02110 .123 .018 0 .04311 .571 .928 .874 .74512 .082 .036 .021 .02113 .041 0 0 .08514 .163 .018 .063 .08515 .020 0 .042 0
Summary Statistics for DYS392
;n 5 49 D 5 .636 ;n 5 56 D 5 .139 ;n 5 48 D 5 .235 ;n 5 47 D 5 .437
Frequency
DYS393:11 .073 0 0 .12512 .145 .018 .021 .02113 .564 .946 .958 .75014 .145 .036 .021 .10415 .055 0 0 016 .018 0 0 0
Summary Statistics for DYS393
;n 5 55 D 5 .643 ;n 5 56 D 5 .105 ;n 5 48 D 5 .083 ;n 5 48 D 5 .419
allele frequency. This is formally equivalent to unbiasedexpected heterozygosity in an autosomal locus. Inter-population variability was estimated for each locusthrough x2 contingency tests and FST (Wright 1951).
Haplotypes consisting of seven Y-chromosome STRswere constructed for each individual. Haplotype diver-sity was calculated as gene diversity, with allele fre-
quency being substituted for haplotype frequency. Themean pairwise difference, in number of repeats, acrossall seven loci was computed within each population. Thisprovides a relative measure of how closely related areSTR haplotypes within each population, although it isnot necessarily an accurate measure of the phylogeneticdistance between Y chromosomes when specific popu-

212 Am. J. Hum. Genet. 65:208–219, 1999
Table 2
Frequency of Alleles, D, and FST in Eight Y-Chromosome STR Lociin Four Central Asian Samples
Locus
No. ofAllelesFound D FST
DYS19 6 .460 .075DYS388 7 .418 .381DYS389I 5 .415 .377DYS389II 7 .561 .338DYS390 9 .542 .110DYS391 5 .410 .387DYS392 7 .354 .092DYS393 6 .298 .146
Mean ) .432 .238
lations are being compared. The detailed phylogeny ofthe Y chromosome (which is not the object of this report)would be better understood if account were taken of thehaplotypes defined by the unique-event polymorphismssuch as single-nucleotide polymorphisms or Alu inser-tions (Hammer et al. 1997; Jobling et al. 1997; Underhillet al. 1997).
Genetic homogeneity among populations was testedthrough analysis of molecular variance (AMOVA [Ex-coffier et al. 1992]), by means of the Arlequin package(Schneider et al. 1996). Genetic variance was estimatedwith the “sum of size differences” option, which takesinto account the difference in allele size when the dif-ference between two STR alleles is being estimated.
Results
Allele Definition and Sequence Variability of DYS388Polymorphism
Sequence analysis of several alleles of the trinucleotideDYS388 showed that this marker comprises a simplerepetitive structure of the core unit (ATA). Alleles des-ignated as “129,” “132,” and “135” by Kayser et al.(1997) and Perez-Lezaun et al. (1997) correspond, re-spectively, to 12, 13, and 14 repetitions of the core unit(table 1). In a previous study (Perez-Lezaun et al. 1997),six alleles of this marker had been described. Two newalleles, one containing 10 repeats and the other con-taining 18 repeats, are reported in the present study’ssurvey of samples from Central Asia. The allele fre-quency distribution is irregular in the populations stud-ied to date, and an allele containing 16 repeats has notyet been found.
Allele Frequencies and Locus Informativeness
Table 1 shows the distribution of allele frequenciesfound. Allele frequency differences among Central Asianpopulations, as shown by x2 tests for each STR, arestatistically significant in all eight loci (all values are
).P ! .005Table 2 shows the number of alleles, gene diversity,
and FST values for each of the STRs used in the con-struction of haplotypes. The mean gene-diversity valuefound in four Central Asian populations (D 5 .432 5
) is very similar to that found in two Western Eu-.088ropean population samples (Catalans and Basques,
[Perez-Lezaun et al. 1997]). For the four pop-D 5 .435ulations under study, the mean FST value for markersDYS19, DYS389I, DYS390, DYS391, DYS392, andDYS393 was , which is an extremely high.224 5 .079value compared with the mean FST value, ,.039 5 .015found, for the same markers, between two Europeanpopulations (Perez-Lezaun et al. 1997). The differenceis statistically significant ( , by signed-rank test).P 5 .017
Thus, Central Asian populations seem to be particularlyheterogeneous. Although FST values vary among mark-ers, all of them are high. Even the lowest FST value found,that for DYS19, is clearly higher than the values foundon a worldwide scale for classic genetic markers (Cavalli-Sforza et al. 1994), although this was expected, giventhe smaller effective population size of Y chromosomescompared with autosomes. If a correction for the smallereffective population size of the Y chromosome were tobe applied (Perez-Lezaun et al. 1997), then a Y-chro-mosome FST of .224, such as that found, would corre-spond to an autosomal FST of .067, which is much closerto the values actually found for autosomal markers. Nosignificant relationship between FST and the number ofdifferent alleles of each locus was found ( ,r 5 2.437
).P 5 .279
Genetic Structure of Central Asian Populations
AMOVA showed that, when all four Central Asianpopulations were treated as a single group, 79.40%( ) of the genetic variance was found withinP ! .0001populations, whereas 20.60% ( ) was attrib-P ! .0001utable to differences among populations. When we sep-arated highland populations (highland Kirghiz and Ka-zakhs) from lowland populations (Uighurs and lowlandKirghiz), 81.00% ( ) of the variance was dueP ! .0001to differences within populations, 25.04% ( )P ! .0001was due to differences between populations within al-titude groups, and 26.04% ( ) was due to differ-P ≈ 1ences between altitude groups. When we grouped pop-ulations according to their language, three differentgroups resulted: Kirghiz, Kazakhs, and Uighurs. Then,77.35% ( ) of the variance could be ascribedP ! .0001to differences within populations, 6.49% ( )P 5 .172was found to be due to differences between populationswithin groups, and 16.16% ( ) was attributableP ! .0001to differences between groups. When we distinguishedbetween Kirghiz and non-Kirghiz groups, we observedthat 77.26% ( ) of the variance was due to dif-P ! .0001

Perez-Lezaun et al.: Y-Chromosome STRs in Central Asia 213
Figure 2 Y-chromosome STR haplotype frequencies in four Cen-tral Asian samples. Only haplotypes shared by more than one popu-lation have been labeled. Haplotypes for the DYS19-DYS388-DYS389I-DYS390-DYS391-DYS392-DYS393 loci are as follows: A,16-12-11-25-11-11-13; B, 16-14-10-25-10-11-13; C, 16-12-11-25-10-11-13; D, 15-12-11-25-11-11-13; E, 14-12-11-23-10-14-14; F, 15-14-10-25-10-11-13; G, 16-12-11-26-11-11-13; H,16-14-10-24-10-11-13;I, 16-14-10-25-11-11-13.
ferences within populations, 14.63% ( ) of theP ! .0001variance was due to differences between populationswithin groups, and 8.11% ( ) was due to dif-P 5 .666ferences between groups. When we took one populationand compared it with the other three, the results weresimilar for all four possibilities: the fraction of variationfound between populations within groups was relativelylarge and highly significant ( ), whereas the var-P ! .0001iance between groups remained smaller and not statis-tically significant ( ). Thus, although the fractionP 1 .05of variation found among populations was high, it didnot appear to be distributed according to a clear-cutpattern. The significance of this apportionment of thegenetic variance, especially when compared with the re-sults of a similar analysis conducted with mtDNA se-quences in the same samples, will be discussed below.
Haplotype Analysis
In a total of 172 complete seven-locus haplotypes inthe four Central Asian populations, we observed 90 dif-ferent haplotypes (listed in the Appendix), only one ofwhich—namely, 16-14-10-25-10-11-13 for DYS19-DYS388-DYS389I-DYS390-DYS391-DYS392-DYS393(haplotype B in fig. 2)—was found in all Central Asiansamples. The four populations tested had dramatic dif-ferences in their haplotype diversities (fig. 2): the Uighurspresented 36 different haplotypes in 39 individuals (hap-lotype diversity [D] ), and the lowland Kir-.995 5 .008ghiz had 25 haplotypes in 41 individuals (D 5 .955 5
). In contrast, the two highland populations pre-.022sented a much lower haplotype diversity: the Kazakhshad 18 different haplotypes in 49 individuals (D 5
), and the highland Kirghiz had 11 haplo-.738 5 .069types in 43 individuals ( ). Moreover,D 5 .545 5 .091both the Kazakhs and the highland Kirghiz each pre-sented one haplotype at high frequency (haplotype 16-14-10-25-10-11-13 in the Kazakhs and haplotype 16-12-11-25-11-11-13 in the highland Kirghiz; haplotypesB and A, respectively, in fig. 2), and, with only one ora few putative mutation steps, most of the remaininghaplotypes in those two populations could be derivedfrom the most frequent haplotype. No such reductionof variability was observed in 360-bp mtDNA sequencesof control region I in the same individuals andpopulations.
The average difference between different haplotypeswithin each population was measured as the mean pair-wise difference in the number of repeats, across all sevenloci. On average, two seven-locus haplotypes in theUighurs have a difference of 7.81 repeats; these pairwiseaverages are 8.32 in the lowland Kirghiz, 5.52 in theKazakhs, and 6.22 in the highland Kirghiz. Thus, hap-lotypes in the highland populations are, on average,
more related to each other than are haplotypes in thelowland populations.
Discussion
The present study contains detailed information onthe allele frequencies of eight trinucleotide and tetra-nucleotide STRs on the Y chromosome in four popu-lations from Central Asia, a region previously poorlystudied at the genetic level. This report gives informationon the sequence structure of marker DYS388, whichhas been shown to be a quite polymorphic, trinucleotide-repeat polymorphisms on the Y chromosome. Popula-tion information on that marker contributes to its val-idation for forensic analysis and demonstrates itsinformativeness for human population genetics.
In this study we have been able to compare (a) theinformation provided by eight STRs for as many as 207individuals from four populations in Central Asia with(b) the information on mtDNA control-region sequencedata on the same individuals (Comas et al. 1998). Thiswill allow us to discuss differences and similarities be-tween results obtained from those nonrecombiningregions of the human genome, and it underscores theimportance of analyzing jointly both data on mtDNAand data on the Y chromosome, to help us unravel thegenetic history of human populations (Salem et al. 1996;

214 Am. J. Hum. Genet. 65:208–219, 1999
Huoponen et al. 1997; Poloni et al. 1997; Bamshad etal. 1998; Passarino et al. 1998; Seielstad et al. 1998). Itshould be stressed that it is important to analyze thesame populations and individuals, in order to obtain aclear picture of male-lineage versus female-lineage dif-ferentiation (Stoneking 1998).
Before we proceed to compare sequence mtDNA datawith Y-chromosome STRs, we will argue that such acomparison is legitimate. It may be argued that sequencepolymorphism and STRs evolve at very different ratesand with different patterns, thus preventing any mean-ingful comparison. STRs have higher mutation ratesthan do nucleotide changes, and they mutate in a step-wise fashion (Weber and Wong 1993), with repeatedmutations resulting in homoplasy. However, the latestempirical estimate of mutation rates in Y-chromosomeSTRs, derived from the overall observation of 1,088 fa-ther-son transmissions (Bianchi et al. 1998), is 1.2 #
, or a combined for the seven loci. Phy-23 2310 8.4 # 10logenetic mutation rate estimates for the hypervariableregion I (HVR-I) of mtDNA are on the order of 1023
(Forster et al. 1996), with genealogical estimates as highas (Parsons et al. 1997, although this221.1–1.8 # 10frequency has been questioned by Jazin et al. 1998).Thus, mutation rates in the hypervariable regions ofmtDNA do not seem to be significantly slower than thoseof Y-chromosome STRs, and, in populations that havesplit during relatively recent times, a differential accu-mulation of genetic variation due to the different mu-tation rates does not seem likely. In the differentiationof human populations, drift has had a deeper effect thanmutation, as has been clearly demonstrated for a widerange of autosomal STRs (Perez-Lezaun et al. 1997).Owing to the lower effective population sizes of bothmtDNA and the Y chromosome relative to autosomes,mutation is likely to have been even less important thandrift in the differentiation of human groups, especiallyin those groups that have a recent common origin, suchas the Central Asian populations that we have analyzed.Recurrent mutation leading to homoplasy is also a com-mon occurrence in the mtDNA control region: in HVR-I, Wakeley (1993) identified 29 nucleotide positions thathad undergone repeated mutations in very different se-quence backgrounds.
Both mtDNA and the Y chromosome contain markersthat mutate more slowly than those that weused—namely, nucleotide variation outside the controlregion in mtDNA (Torroni et al. 1992; Macaulay et al.1999) and biallelic polymorphisms in the Y chromosome(Jobling et al. 1997). Both sets of markers have beenused to define haplogroups in their respective molecules.When the variation in the faster loci has been analyzedin a haplogroup framework, a good correlation has beenfound: RFLP haplogroups in mtDNA tend to bear spe-cific control-region motifs (Macaulay et al. 1999), and
Malaspina et al. (1998) have found that 80% of hap-lotypes defined by just four Y-chromosome STRs werenot shared between the haplogroups defined by two bial-lelic polymorphisms (i.e., the YAP Alu insertion and thealphoid HindIII site). Thus, the faster markers retainmost of the phylogenetic information on the genealogyof the slower sites, and, on average, two related Y-chro-mosome STR haplotypes will be borne by chromosomesclose to each other in the Y-chromosome phylogeny. Insummary, a relatively high mutation rate and homoplasyhappen both in the Y-chromosome STRs and in themtDNA control-region sequences, and it is not to beexpected that they would differentially affect the twogenetic systems. Y-chromosome STRs and mtDNA con-trol-region sequences have been compared successfullyin the recent work, by Bamshad et al. (1998), on geneflow among Indian castes.
The apportionment of genetic diversity in Y-chro-mosome STR haplotypes showed two main features: (1)extremely high levels of interpopulation diversity whencompared with mtDNA sequences and (2) a dramaticreduction of internal genetic diversity in the two high-land populations. Interpopulation diversity was extremewhether measured by FST or by AMOVA. Average FST
by locus was .224, which reduces to .067 when a cor-rection for the smaller effective population size of Ychromosomes compared with autosomes is applied, ashas been suggested by Perez-Lezaun et al. (1997). Thisis a relatively high value for neighboring populationsspeaking closely related languages: it is roughly half ofthe worldwide variation for autosomal classic markers(i.e., blood groups and protein electromorphs) and is sixtimes larger than FST, for the same Y-chromosome STRs,between Basques and Catalans, who speak languagesbelonging to two separate families. AMOVA shows that∼20% of the haplotype genetic variation is found amongpopulations (equivalent to ), whereas 15% is theF ù .2ST
worldwide average for autosomal STRs (Barbujani et al.1997). Moreover, a 360-bp stretch of the hypervariablesegment I of the mtDNA control region sequenced inthe same individuals showed that only 0.5% of the ge-netic variation could be attributed to interpopulationdifferences. Three types of reasons could account for thisdifferential behavior of Y-chromosome STRs: (i) intrinsicproperties of Y-chromosome STRs; (ii) a different effec-tive population size for males versus females (in whichcase, high levels of polygyny could account for a lowereffective population size for males); and (iii) a differentialpattern of male versus female migration.
A high mutation rate of Y-chromosome STRs couldaccount for a rapid differentiation of Y-chromosomehaplotypes in populations that have split recently. How-ever, pedigree analysis has shown that the mutation rateof Y-chromosome STRs (Heyer et al. 1997; Bianchi etal. 1998) is consistent with the average mutation rate in

Perez-Lezaun et al.: Y-Chromosome STRs in Central Asia 215
autosomal STRs. Moreover, Perez-Lezaun et al. (1997)have shown that, for two European populations, thelevels of differentiation of Y-chromosome and autosomalSTRs are almost identical. Thus, it does not seem likelythat the high degree of interpopulation diversity shownby the Y-chromosome STRs should be attributed to anyintrinsic properties.
As we will show below, the relative reduction of ef-fective population size for males that is generated bypolygyny or other causes made a very small contributionto the observed pattern in Y-chromosome intra- and in-terpopulation differentiation. The levels of polygynyvary greatly across cultures, although there are impor-tant similarities within regional areas (i.e., distances!1,500 km; White 1988). That allows us to consider theexisting ethnographic data for Kazakhs to be represen-tative for the other populations in our study. The Ka-zakhs, Kirghiz, and Uighurs are Moslems, although re-ligious practice was suppressed during the Soviet period,and polygyny was forbidden. As reported in White’s(1988) compilation of data on polygyny, the Kazakhswere ethnographically surveyed in 1885, and, at thattime, they practiced polygyny, although the practice waslimited to the top ∼10% of men of the highest socialrank. The number and distribution of wives per husbandis not known, but harems were absent. Sororal polygynywas not practiced. When the worldwide average of wivesper polygynous husband (i.e., 2.6) is taken into account,the ratio R—that is, male:female effective populationsize—is .862. When the equation suggested by Perez-Lezaun et al. (1997) is generalized, the relation betweenmale-lineage FST (FSTm) and female-lineage FST (FSTf) isgiven by the formula . ForF 5 F /[F 1 R(1 2 F )]STm STf STf STf
, as observed for mtDNA sequences in CentralF 5 .005STf
Asia, the corresponding male-mediated FST is .0058, farfrom the observed .2. A similar correction can be appliedto haplotype diversity, with the same result: after cor-rection for polygyny, the mtDNA haplotype diversity inthe highland Kirghiz changes from .984 to .981, still farfrom the observed Y-chromosome diversity ( ).D 5 .545In summary, polygyny had an almost negligible contri-bution to both the reduction of intrapopulation Y-chro-mosome diversity and the increase of Y-chromosome in-terpopulation differentiation.
An additional factor that could reduce the relativeeffective population size for males is a higher male prer-eproductive mortality, caused by hunting or warfare. Adistribution of ages at death, by sex, could be obtainedfrom burial remains, but such data are not available forour populations. However, ethnographic observationduring recent decades does not show evidence of a highermale prereproductive mortality (O. Ismagulov, personalcommunication), and this seems to be a general patternfor most of ancient human populations (Kelly 1995, andreferences therein).
A traditional structure of patrilocal marriages—thatis, those in which the custom is for the bride to moveto the groom’s village—would result in a very high fe-male:male ratio of short-distance migration. Patrilocalmarriages are indeed practiced by the Kazakhs and theKirghiz (O. Ismagulov, personal communication), as isa strong paternal-clan exogamy, and our observationsconfirm that the prescribed matrimonial pattern has astrong impact on the genetic structure of the populations(Bamshad et al. 1998). This mechanism could explainthe observed disparity, in interpopulation differentia-tion, between Y-chromosome and mitochondrial mark-ers, and it also has been invoked by Salem et al. (1996),to explain similar patterns of Y-chromosome andmtDNA diversity in Sinai Bedouins, and by Seielstad etal. (1998), in a global survey. The rates of male andfemale migration may be very different because of thecultural practices in different world populations, and itis to be expected that the relative levels of Y-chromosomeand mtDNA interpopulation differentiation would varyaccordingly. Moreover, genetic analysis may be able todetect ancient, extinct cultural practices not observed bysocial scholars.
When we grouped the four Central Asian populationsin higher-level hierarchies, we found that altitude con-tributed a negative fraction of genetic variability; thatis, there was more variability between populations at thesame altitude than between the two altitude groups. Itseems unlikely, then, that altitude has exerted a commonselective pressure on the Y-chromosome genes of thehighland Kazakhs and the Kirghiz; a similar pattern wasobserved in the mtDNA of the same populations (Comaset al. 1998). When populations were grouped accordingto language, 16% of Y-chromosome genetic diversitycould be attributed to linguistic groups, whereas thisfraction was negligible (20.5%) for mtDNA sequences.Then, it seems that female migration may overcome lin-guistic barriers with greater ease than does male migra-tion. Zones of sharp autosomal genetic change in Europeappear to overlay linguistic boundaries (Barbujani andSokal 1990), and Poloni et al. (1997) have shown that,in populations worldwide, linguistic distances present ahigher correlation with Y-chromosome than withmtDNA markers. Both this finding and our results seemto indicate that genetic isolation at linguistic boundarieswould be largely contributed by male, rather than fe-male, isolation.
The level of haplotype diversity detected in the Y chro-mosomes of Central Asia appears to be linked to thealtitudinal habitat of the populations: the highlanddwellers have reduced haplotype diversities when com-pared with the lowland Kirghiz and Uighurs. The high-land Kirghiz and the Kazakhs each present both a dif-ferent haplotype at very high frequency and a reducednumber of other haplotypes that may derive from the

216 Am. J. Hum. Genet. 65:208–219, 1999
main haplotypes by one mutation event. Haplotype 16-12-11-25-11-11-13 (haplotype A in fig. 2) was found athigh frequencies in the highland Kirghiz and was alsofound at lower frequencies in the lowland Kirghiz. Themost common haplotype in the Kazakhs, 16-14-10-25-10-11-13 (haplotype B in fig. 2), is also the only hap-lotype present in all four samples. The most frequentalleles in both Kirghiz samples for three loci (DYS389I,DYS389II, and DYS390) are the same, and they aredifferent from the most frequent allele elsewhere in Eu-rope and Asia. It seems likely, then, that the Y-chro-mosome pool of the high-altitude populations reflects arelatively recent foundation event. The Keghen Valley,where the highland Kazakhs live, was colonized200–400 years ago by the lowland Kazakhs (O. Isma-gulov, personal communication), and the present inhab-itants consider themselves to be direct descendants ofthe original colonizers. The Kirghiz seem to have cometo the high valleys of the Tien Shan, Pamir, Alay, andQara Qorum no earlier than the 16th or 17th centuries(Menges 1994), whereas for the Talas valley an archae-ological record dating back to the Bronze Age isavailable.
The reduction in Y-chromosome STR haplotype di-versity in the highland dwellers could have been causedby selection operating on some gene in the Y chromo-some and thereby reducing the diversity on the wholechromosome. This has not been observed in other pop-ulations or in general surveys. However, AMOVAshowed that altitude contributed a nonsignificant, neg-ative fraction of the genetic variation, and this makes itunlikely that altitude exerted a common selective pres-sure on highland Kirghiz and Kazakh Y chromosomes.Therefore, a founder effect could explain better the lowlevels of Y-chromosome genetic diversity in highlanders.
In contrast with what is seen for the Y chromosome,the same highland populations do not show a reductionin the diversity of mtDNA sequences (Comas et al.1998). A historically higher effective population size forfemales could be achieved in a number of not necessarilyexclusive ways. It is possible that the highland popula-tions were founded by groups containing a few, possiblyrelated males and a higher number of females. Alter-natively or concomitantly, exogamic patrilocal mar-
riages could have resulted in an inflow of females thatcould have restored the mitochondrial genetic diversity.
The lowland populations present a very high internalgenetic diversity for both the mtDNA and the Y chro-mosome. The mtDNA diversity is among the highest inEurasia, and the same is true for the Y-chromosomediversity. Comas et al. (1998) have concluded that thehigh mtDNA diversity, along with other features of theCentral Asian mtDNA sequence pool, could be a resultof admixture between the already differentiated popu-lations of Europe and eastern Asia. It is likely that theCentral Asian gene pool has been shaped by high levelsof female-mediated migration, possibly related to pat-rilocal marriages within and between linguistic and al-titudinal populations, a situation that would have main-tained high levels of mtDNA diversity in all populations,whereas the male-mediated migration has been less in-tense and has occurred mainly in high-altitude popula-tions, where a male founding effect seems clear. In con-clusion, the joint analysis of Y-chromosome and mtDNAgenetic material has allowed us to observe the geneticoutcome of sex-specific migration patterns and has re-vealed itself as a powerful tool in the analysis of humanpopulation history.
Acknowledgments
This research was supported mainly by Direccion Generalde Investigacion Cientıfico Tecnica (Spain) grant PB95-0267-C02-01. Additional support was provided by Human Capitaland Mobility contracts (network ERCHRXCT92-0032 andERB-CHRX-CT920090) to J.B., by Direccio General de Re-cerca, Generalitat de Catalunya, grants 1995SGR00205 and1996SGR00041, and by the Institut d’Estudis Catalans. TheCAHAP research project was partially supported by MURSTgrants to F.F. and D.P. and by private grants from “Fondazionedella Cassa di Risparmio di Bologna.” This work was alsomade possible thanks to Spanish Ministry of Education andScience fellowships to A.P.-L. (FP93), F.C. (postdoctoral returncontract), and R.M.-A. (AP96); Universitat de Barcelona fel-lowships to E.M. and J.C.; and Comissionat per a Universitatsi Recerca, Generalitat de Catalunya fellowships to E.B. (FI/96-1153) and F.C. Allele ladders and invaluable advice were pro-vided by Peter de Knijff. We also acknowledge the help andtechnical assistance offered by the Unitat de Sequenciacio,Servei Cientıfico-Tecnic, Universitat de Barcelona. Mark Seiel-stad reviewed an earlier version of the manuscript.
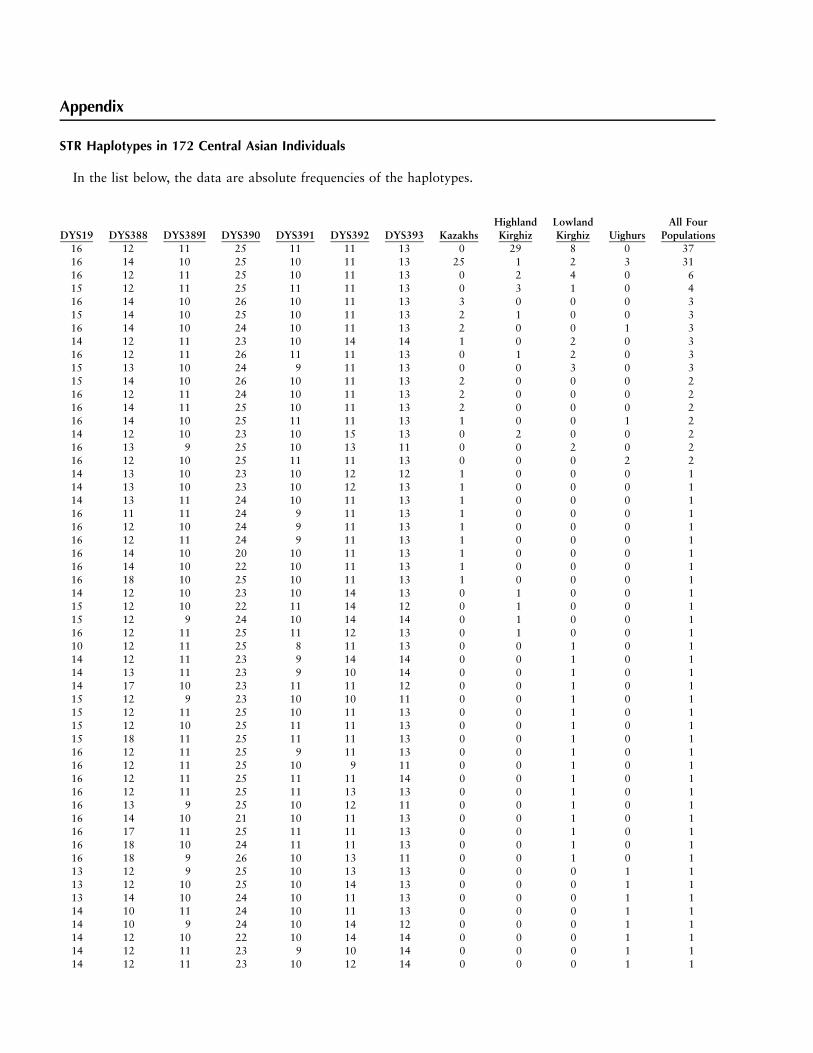
Appendix
STR Haplotypes in 172 Central Asian Individuals
In the list below, the data are absolute frequencies of the haplotypes.
DYS19 DYS388 DYS389I DYS390 DYS391 DYS392 DYS393 KazakhsHighlandKirghiz
LowlandKirghiz Uighurs
All FourPopulations
16 12 11 25 11 11 13 0 29 8 0 3716 14 10 25 10 11 13 25 1 2 3 3116 12 11 25 10 11 13 0 2 4 0 615 12 11 25 11 11 13 0 3 1 0 416 14 10 26 10 11 13 3 0 0 0 315 14 10 25 10 11 13 2 1 0 0 316 14 10 24 10 11 13 2 0 0 1 314 12 11 23 10 14 14 1 0 2 0 316 12 11 26 11 11 13 0 1 2 0 315 13 10 24 9 11 13 0 0 3 0 315 14 10 26 10 11 13 2 0 0 0 216 12 11 24 10 11 13 2 0 0 0 216 14 11 25 10 11 13 2 0 0 0 216 14 10 25 11 11 13 1 0 0 1 214 12 10 23 10 15 13 0 2 0 0 216 13 9 25 10 13 11 0 0 2 0 216 12 10 25 11 11 13 0 0 0 2 214 13 10 23 10 12 12 1 0 0 0 114 13 10 23 10 12 13 1 0 0 0 114 13 11 24 10 11 13 1 0 0 0 116 11 11 24 9 11 13 1 0 0 0 116 12 10 24 9 11 13 1 0 0 0 116 12 11 24 9 11 13 1 0 0 0 116 14 10 20 10 11 13 1 0 0 0 116 14 10 22 10 11 13 1 0 0 0 116 18 10 25 10 11 13 1 0 0 0 114 12 10 23 10 14 13 0 1 0 0 115 12 10 22 11 14 12 0 1 0 0 115 12 9 24 10 14 14 0 1 0 0 116 12 11 25 11 12 13 0 1 0 0 110 12 11 25 8 11 13 0 0 1 0 114 12 11 23 9 14 14 0 0 1 0 114 13 11 23 9 10 14 0 0 1 0 114 17 10 23 11 11 12 0 0 1 0 115 12 9 23 10 10 11 0 0 1 0 115 12 11 25 10 11 13 0 0 1 0 115 12 10 25 11 11 13 0 0 1 0 115 18 11 25 11 11 13 0 0 1 0 116 12 11 25 9 11 13 0 0 1 0 116 12 11 25 10 9 11 0 0 1 0 116 12 11 25 11 11 14 0 0 1 0 116 12 11 25 11 13 13 0 0 1 0 116 13 9 25 10 12 11 0 0 1 0 116 14 10 21 10 11 13 0 0 1 0 116 17 11 25 11 11 13 0 0 1 0 116 18 10 24 11 11 13 0 0 1 0 116 18 9 26 10 13 11 0 0 1 0 113 12 9 25 10 13 13 0 0 0 1 113 12 10 25 10 14 13 0 0 0 1 113 14 10 24 10 11 13 0 0 0 1 114 10 11 24 10 11 13 0 0 0 1 114 10 9 24 10 14 12 0 0 0 1 114 12 10 22 10 14 14 0 0 0 1 114 12 11 23 9 10 14 0 0 0 1 114 12 11 23 10 12 14 0 0 0 1 1

218 Am. J. Hum. Genet. 65:208–219, 1999
14 12 10 25 11 13 12 0 0 0 1 114 13 10 23 11 14 11 0 0 0 1 115 12 11 19 10 11 12 0 0 0 1 115 12 11 21 10 10 13 0 0 0 1 115 12 11 22 10 14 11 0 0 0 1 115 12 9 23 10 12 13 0 0 0 1 115 12 11 23 10 14 11 0 0 0 1 115 12 10 26 11 11 13 0 0 0 1 115 12 9 27 10 11 13 0 0 0 1 116 12 10 22 10 11 12 0 0 0 1 116 12 11 23 9 10 14 0 0 0 1 116 12 11 23 9 11 13 0 0 0 1 116 12 10 23 10 11 13 0 0 0 1 116 12 9 23 10 12 12 0 0 0 1 116 12 10 23 10 14 12 0 0 0 1 116 12 10 23 11 11 13 0 0 0 1 116 12 9 25 10 10 15 0 0 0 1 116 12 10 25 11 15 14 0 0 0 1 116 14 9 24 10 14 14 0 0 0 1 116 14 9 25 10 11 13 0 0 0 1 116 14 10 25 11 11 15 0 0 0 1 117 11 10 24 10 11 13 0 0 0 1 117 12 10 24 11 11 13 0 0 0 1 117 13 11 22 10 10 12 0 0 0 1 1
References
Bamshad MJ, Watkins WS, Dixon ME, Jorde LB, Rao BB,Naidu JM, Prasad BVR, et al (1998) Female gene flow strat-ifies Hindu castes. Nature 395:651-652
Barbujani G, Magagni A, Minch E, Cavalli-Sforza LL (1997)An apportionment of human DNA diversity. Proc Natl AcadSci USA 94:4516-4519
Barbujani G, Sokal RR (1990) Zones of sharp genetic changein Europe are also linguistic boundaries. Proc Natl Acad SciUSA 87:1816-1819
Bianchi NO, Catanesi CI, Bailliet G, Martinez-Marignac VL,Bravi CM, Vidal-Rioja LB, Herrera RJ, et al (1998) Char-acterization of ancestral and derived Y-chromosome hap-lotypes of New World native populations. Am J Hum Genet63:1862-1871
Cavalli-Sforza LL, Menozzi P, Piazza A (1994) The history andgeography of human genes. Princeton University Press,Princeton
Comas D, Calafell F, Mateu E, Perez-Lezaun A, Bosch E, Mar-tınez-Arias R, Clarimon J, et al (1998) Trading genes alongthe Silk Road: mtDNA sequences and the origin of CentralAsian populations. Am J Hum Genet 63:1824-1838
Cooper G, Amos W, Hoffman D, Rubinsztein D (1996) Net-work analysis of human Y microsatellite haplotypes. HumMol Genet 5:1759-1766
Deka R, Jin L, Shriver MD, Mei Yu L, Saha N, Barrantes R,Chakraborty R, et al (1996) Dispersion of human Y chro-mosome haplotypes based on five microsatellites in globalpopulations. Genome Res 6:1177-1184
Excoffier L, Smouse PE, Quattro JM (1992) Analysis of mo-lecular variance inferred from metric distances among DNAhaplotypes: application to human mitochondrial DNA re-striction data. Genetics 131:479-491
Forster P, Harding R, Torroni A, Bandelt H-J (1996) Origin
and evolution of Native American mtDNA variation: a re-appraisal. Am J Hum Genet 59:935-945
Hammer MF, Spurdle AB, Karafet T, Bonner MR, Wood ET,Novelletto A, Malaspina P, et al (1997) The geographic dis-tribution of human Y chromosome variation. Genetics 145:787-805
Hammer M, Zegura SL (1996) The role of the Y chromosomein human evolutionary studies. Evol Anthropol 5:116-134
Hassan FA (1981) Demographic archaeology. Academic Press,New York
Heyer E, Puymirat J, Dieltjes P, Bakker E, de Knijff P (1997)Estimating Y chromosome specific microsatellite mutationfrequencies using deep rooting pedigrees. Hum Mol Genet6:799-803
Huoponen K, Torroni A, Wickman P, Sellito D, Gurley DS,Scozzari R, Wallace D (1997) Mitochondrial DNA and Ychromosome-specific polymorphisms in the Seminole tribeof Florida. Eur J Hum Genet 5:25-34
Jazin E, Soodyall H, Jalonen P, Lindholm E, Stoneking M,Gyllensten U (1998) Mitochondrial mutation rate revisited:hot spots and polymorphism. Nat Genet 18:109-110
Jobling MA, Pandya A, Tyler-Smith C (1997) The Y chro-mosome in forensic analysis and paternity testing. Int J LegalMed 110:118-124
Kayser M, Caglia A, Corach D, Fretwell N, Gehrig C, GraziosiG, Heidorn F, et al (1997) Evaluation of Y-chromosomalSTRs: a multicenter study. Int J Legal Med 110:125-133,141-149
Kelly RL (1995) The foraging spectrum: diversity in hunter-gatherer lifeways. Prentice Hall, New York
Macaulay V, Richards M, Hickey E, Vega E, Cruciani F, GuidaV, Scozzari R, et al (1999) The emerging tree of west Eu-rasian mtDNAs: a synthesis of control-region sequences andRFLPs. Am J Hum Genet 64:232-249
Malaspina P, Cruciani F, Ciminelli BM, Terrenato L, Santo-lamazza P, Alonso A, Banyko J, et al (1998) Network anal-

Perez-Lezaun et al.: Y-Chromosome STRs in Central Asia 219
yses of Y-chromosomal types in Europe, northern Africa,and western Asia reveal specific patterns of geographic dis-tribution. Am J Hum Genet 63:847-860
Menges KH (1994) People, languages and migrations. In: All-worth E (ed) Central Asia: 130 years of Russian dominance,a historical overview, 3d edition. Duke University Press,Durham, NC, pp 60-91
Parsons TJ, Muniec DS, Sullivan K, Woodyatt N, Alliston-Greiner R, Wilson MR, Berry DL, et al (1997) A high ob-served substitution rate in the human mitochondrial DNAcontrol region. Nat Genet 15:363-368
Passarino G, Semino O, Quintana-Murci L, Excoffier L, Ham-mer M, Santachiara Benericetti AS (1998) Different geneticcomponents in the Ethiopian population, identified bymtDNA and Y-chromosome polymorphisms. Am J Hum Ge-net 62:420-434
Pena SD, Santos FR, Bianchi NO, Bravi CM, Carnese FR,Rothhammer F, Gerelsaikhan T, et al (1995) A major foun-der Y-chromosome haplotype in Amerindians. Nat Genet11:15-16
Perez-Lezaun A, Calafell F, Seielstad M, Mateu E, Comas D,Bosch E, Bertranpetit J (1997) Population genetics of Y-chromosome short tandem repeats in humans. J Mol Evol45:265-270
Pestoni C, Cal ML, Lareu MV, Rodrıguez-Calvo MS, Carra-cedo A (1999) Y chromosome STR haplotypes: genetic andsequencing data of the Galician population (NW Spain). IntJ Legal Med 112:15-21
Poloni ES, Semino O, Passarino G, Santachiara-Benerecetti AS,Dupanloup I, Langaney A, Excoffier L (1997) Human ge-netic affinities for Y-chromosome p49a,f/TaqI haplotypesshow strong correspondence with linguistics. Am J HumGenet 61:1015-1035
Rolf B, Meyer E, Brinkmann B, de Knijff P (1998) Polymor-phism at the tetranucleotide repeat locus DYS389 in 10 pop-ulations reveals strong geographic clustering. Eur J HumGenet 6:583-588
Salem A-H, Badr FM, Gaballah MF, Paabo S (1996) The ge-netics of traditional living: Y-chromosomal and mitochon-
drial lineages in the Sinai Peninsula. Am J Hum Genet 59:741-743
Santos FR, Pena SDJ, Epplen JT (1993) Genetic and popula-tion study of a Y-linked tetranucleotide repeat DNA poly-morphism with a simple non-isotopic technique. Hum Genet90:655-656
Schneider S, Kueffer JM, Roessli D, Excoffier L (1996) Arlekin(version 1.0): a software environment for the analysis ofpopulation genetics data. Genetics and Biometry Lab, Uni-versity of Geneva, Geneva
Seielstad M, Minch E, Cavalli-Sforza LL (1998) Genetic evi-dence for a higher female migration rate in humans. NatGenet 20:278-280
Stoneking M (1998) Women on the move. Nat Genet 20:219-220
Torroni A, Schurr TG, Yang C-C, Szathmary EJE, WilliamsRC, Schanfield MS, Tromp GA, et al (1992) Native mito-chondrial DNA analysis indicates that the Amerind and theNadene populations were founded by two independent mi-grations. Genetics 130:153-162
Underhill PA, Jin L, Lin A, Medhdi SQ, Jenkins T, VollrathD, Davis RW, et al (1997) Detection of numerous Y chro-mosome biallelic polymorphisms by denaturing high per-formance liquid chromatography (DHPLC). Genome Res 7:996-1005
Underhill PA, Jin L, Zemmans R, Oefner PJ, Cavalli-SforzaLL (1996) A pre-Columbian Y chromosome-specific tran-sition and its implications for human evolutionary history.Proc Natl Acad Sci USA 93:196-200
Wakeley J (1993) Substitution rate variation among sites inhypervariable region I of human mitochondrial DNA. J MolEvol 37:613-623
Weber JL, Wong C (1993) Mutation of human short tandemrepeats. Hum Mol Genet 2:1123–1128
White DR (1988) Rethinking polygyny: co-wives, codes, andcultural systems. Curr Anthropol 29:529-558
Wright S (1951) The genetical structure of populations. AnnEugenics 15:323-354
Related Documents