Service Engineering Class 4 (12/02/2008) The Second Prerequisite: Operational Models; Service (Processing, Flow, Queueing) Networks, DSPERTs • Review: The First Prerequisite - Data, Measurement; • Service Networks = Queueing Networks; • The Service (Processing, Flow, Queueing) Network Paradigm; • Dynamic-Stochastic PERT/CPM models, or “Why Queues?”; • Operational Queues: Synchronization, Scarce Resources; • Analyzing DS-PERT/CPM’s: 1. Can we do it? Answer via “Capacity Analysis” 2. How long will it take? via “Response-Time Analysis” 3. Can we do better? “Parametric / Sensitivity (What- If) Analysis” 4. What is the best we (one) can do? “Optimization” • Multi-Project Management. 1

Welcome message from author
This document is posted to help you gain knowledge. Please leave a comment to let me know what you think about it! Share it to your friends and learn new things together.
Transcript
Service Engineering
Class 4 (12/02/2008)
The Second Prerequisite: Operational Models;
Service (Processing, Flow, Queueing) Networks, DSPERTs
• Review: The First Prerequisite - Data, Measurement;
• Service Networks = Queueing Networks;
• The Service (Processing, Flow, Queueing) Network Paradigm;
• Dynamic-Stochastic PERT/CPM models, or “Why Queues?”;
• Operational Queues: Synchronization, Scarce Resources;
• Analyzing DS-PERT/CPM’s:
1. Can we do it? Answer via “Capacity Analysis”
2. How long will it take? via “Response-Time Analysis”
3. Can we do better? “Parametric / Sensitivity (What-
If) Analysis”
4. What is the best we (one) can do? “Optimization”
• Multi-Project Management.
1
Msndelbaum
Rectangle

Recall The First Prerequisite:Data & Measurements
Empirical “Axiom”:
The Data One Needs is Never There For One To Use !
Averages tell only a small part of the whole story (yet prevalent)
Individual-Transaction Level Data: Time-Stamps of Events
• Face-to-Face: T, C, S, I, O, F (QIE, RFID)
• Telephone: ACD Log-Files, CTI/CRM, Surveys
• Internet: Click-Stream Data (Log-Files)
• Transportation: Sensors at highways/intersections
Our Databases: Operations (vs. Marketing, Surveys, . . .)
• Face-to-Face data (branch banking) – Recitations;
• Telephone data (small banking call center) – Homeworks;
• DataMOCCA (large cc’s: repository, interface) – class/research.
Future Research:
DataMOCCA on the web; Operation+Marketing;
Healthcare, Multimedia (Contact Centers), Field-Support.
2

The Second Prerequisite:(Operational) Models
Empirical Models
• Conceptual
– Service-Process Data = Flow Network
– Service Networks = Queueing Networks
• Descriptive
– QC-Tools: Pareto, Gantt, Fishbone Diagrams,...
– Histograms, Hazard-Rates, ...
– Data-MOCCA: Repository + Interface
• Explanatory
– Nonparametric: Comparative Statistics, Regression,...
– Parametric: Log-Normal Services, (Doubly) Poisson Ar-
rivals, Exponential (Im)Patience
Analytical Models
• Fluid (Deterministic) Models
• Stochastic Models (Birth & Death, G/G/n, Jackson,...)
6

Conceptual Models:Service Networks = Queueing Networks
• People, waiting for service (resource) : teller, repairman, ATM;
• Telephone-calls, to be answered: busy, music, information;
• Forms, to be sent, processed, printed; for a partner (synchronization) ;
• Projects, to be planned, approved, implemented;
• Justice, to be made: pre-trial, hearing, retrial;
• Ships, for a pilot, berth, unloading crew;
• Patients, for an ambulance, emergency room, operation;
• Cars, in rush-hour, for parking;
• Passengers at Airports, security-check, check-in, taking-off;
• Checks, waiting to be processed, cashed.
Operational Queues (as opposed to, say, “weather queues”),
due to:
• Scarce Resources (Resource Queues)
• Synchronization Gaps (Synchronization Queues)
Queues are costly, but (many) are here to stay.
7

Conceptual Fluid Model
Customers/units are modeled by fluid (continuous) flow.
Labor-day Queueing at Niagara Falls
Labor-Day Queueing in Niagara FallsThree-station Tandem Network:Elevators, Coats, Boats
Total wait of 15 minutesfrom upper-right corner to boat
How? “Deterministic” constant motion
• Appropriate when predictable variability prevalent;
• Useful first-order models/approximations, often suffice;
• Rigorously justifiable via Functional Strong Laws of Large
Numbers.
8
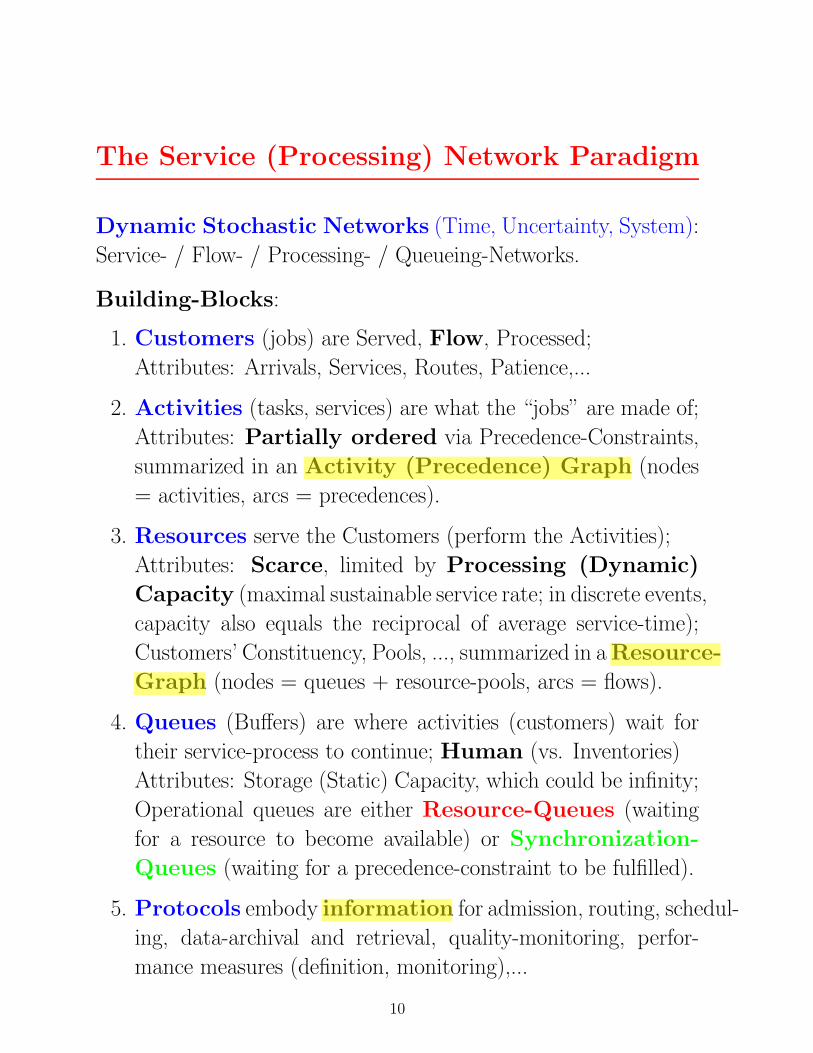
The Service (Processing) Network Paradigm
Dynamic Stochastic Networks (Time, Uncertainty, System):
Service- / Flow- / Processing- / Queueing-Networks.
Building-Blocks:
1. Customers (jobs) are Served, Flow, Processed;
Attributes: Arrivals, Services, Routes, Patience,...
2. Activities (tasks, services) are what the “jobs” are made of;
Attributes: Partially ordered via Precedence-Constraints,
summarized in an Activity (Precedence) Graph (nodes
= activities, arcs = precedences).
3. Resources serve the Customers (perform the Activities);
Attributes: Scarce, limited by Processing (Dynamic)
Capacity (maximal sustainable service rate; in discrete events,
capacity also equals the reciprocal of average service-time);
Customers’ Constituency, Pools, ..., summarized in a Resource-
Graph (nodes = queues + resource-pools, arcs = flows).
4. Queues (Buffers) are where activities (customers) wait for
their service-process to continue; Human (vs. Inventories)
Attributes: Storage (Static) Capacity, which could be infinity;
Operational queues are either Resource-Queues (waiting
for a resource to become available) or Synchronization-
Queues (waiting for a precedence-constraint to be fulfilled).
5. Protocols embody information for admission, routing, schedul-
ing, data-archival and retrieval, quality-monitoring, perfor-
mance measures (definition, monitoring),...
10
aviman
Highlight
aviman
Highlight
aviman
Highlight
aviman
Highlight
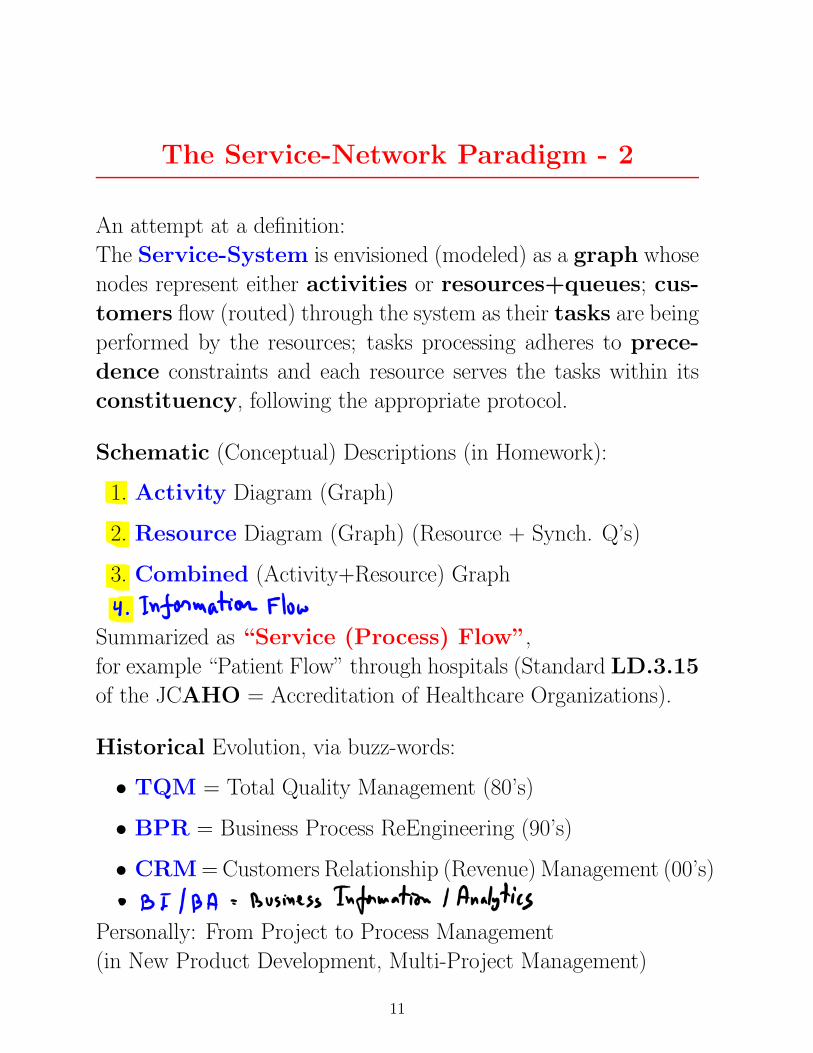
The Service-Network Paradigm - 2
An attempt at a definition:
The Service-System is envisioned (modeled) as a graph whose
nodes represent either activities or resources+queues; cus-
tomers flow (routed) through the system as their tasks are being
performed by the resources; tasks processing adheres to prece-
dence constraints and each resource serves the tasks within its
constituency, following the appropriate protocol.
Schematic (Conceptual) Descriptions (in Homework):
1. Activity Diagram (Graph)
2. Resource Diagram (Graph) (Resource + Synch. Q’s)
3. Combined (Activity+Resource) Graph
Summarized as “Service (Process) Flow”,
for example “Patient Flow” through hospitals (Standard LD.3.15
of the JCAHO = Accreditation of Healthcare Organizations).
Historical Evolution, via buzz-words:
• TQM = Total Quality Management (80’s)
• BPR = Business Process ReEngineering (90’s)
• CRM = Customers Relationship (Revenue) Management (00’s)
Personally: From Project to Process Management
(in New Product Development, Multi-Project Management)
11

The Service-Network Paradigm - 3
Three (sometimes Four) Steps in Analyzing a Service Networks
(demonstrated in the sequel via DS-PERTs).
Gives rise to the following Guiding Questions:
1. Can we do it? Deterministic capacity analysis, via ser-
vice (process) flow diagrams (spreadsheets, linear program-
ming), which identifies resource-bottlenecks (or at least candi-
dates) and yields utilization profiles.
2. How long will it take? Typically stochastic response-
time analysis, via analytical queueing-network models (ex-
act, approximations) or simulations, which yields congestion
curves.
Note: When predictable variability prevails and dominates
then the Fluid View is appropriate; the analysis is then de-
terministic, for example via queueing-buildup diagrams. (e.g.
Recitation today, Trucks in National Cranberries next class.)
3. Can we do better? Sensitivity and Parametric (what-
if) analysis, of MOPs or scenarios, which yields directions
and magnitudes for improvements.
4. How much better can we (one) do? or simply: What
is optimal to do? Optimal control (exact, asymptotic), typi-
cally difficult but more and more feasible, which yields optimal
protocols (strategies, policies).
12

Conceptual Model:Bank Branch = Queueing Network
23
Teller
Entrance
Tourism
Xerox
Manager
Teller
Entrance
Tourism
Xerox
Manager
Bottleneck!
14

Bank Branch: A Queuing Network
Bank: A Queuing Network
Transition Frequencies Between Units in The Private and Business Sections:
Private Banking Business
To Unit Bankers Authorized Compens - Tellers Tellers Overdrafts Authorized Full Exit
From Unit Personal - ations Personal Service
Bankers 1% 1% 4% 4% 0% 0% 0% 90%
Private Authorized Personal 12% 5% 4% 6% 0% 0% 0% 73%
Banking Compensations 7% 4% 18% 6% 0% 0% 1% 64%
Tellers 6% 0% 1% 1% 0% 0% 0% 90%
Tellers 1% 0% 0% 0% 1% 0% 2% 94%
Services Overdrafts 2% 0% 1% 1% 19% 5% 8% 64%
Authorized Personal 2% 1% 0% 1% 11% 5% 11% 69%
Full Service 1% 0% 0% 0% 8% 1% 2% 88%
Entrance 13% 0% 3% 10% 58% 2% 0% 14% 0%
Legend: 0%-5% 5%-10% 10%-15% >15%
Dominant Paths - Business:
Unit Station 1 Station 2 Total Parameter Tourism Teller Dominant Path
Service Time 12.7 4.8 17.5 Waiting Time 8.2 6.9 15.1
Total Time 20.9 11.7 32.6
Service Index 0.61 0.41 0.53
Dominant Paths - Private:
Unit Station 1 Station 2 Total Parameter Banker Teller Dominant Path
Service Time 12.1 3.9 16.0 Waiting Time 6.5 5.7 12.2
Total Time 18.6 9.6 28.2
Service Index 0.65 0.40 0.56
Service Index = % time being served
15

Mapping the Offered Load (Bank Branch)
Mapping Offered Load (Branch of a Bank)
Business
Services
Private
Banking
Banking
Services
Department
Time Tourism Teller Teller Teller Comprehensive
8:30 – 9:00
9:00 – 9:30
9:30 – 10:00
10:00 – 10:30
10:30 – 11:00
11:00 – 11:30
11:30 – 12:00
12:00 – 12:30
Break
16:00 – 16:30
16:30 – 17:00
17:00 – 17:30
17:30 – 18:00
Legend:
Not Busy
Busy
Very Busy
Note: What can / should be done at 11:00 ? Conclusion: Models are not always necessary but measurements are !
16

Conceptual Model: Call-Center Network
Schematic Chart – Pelephone Call-Center 1994
AccountsGeneralTechnical
Clearing
Typist
Manager
ACD
€
€€
€€
€
☺ 1
1 2
135
2
4
= Tele Net = Queueing Network
43
17
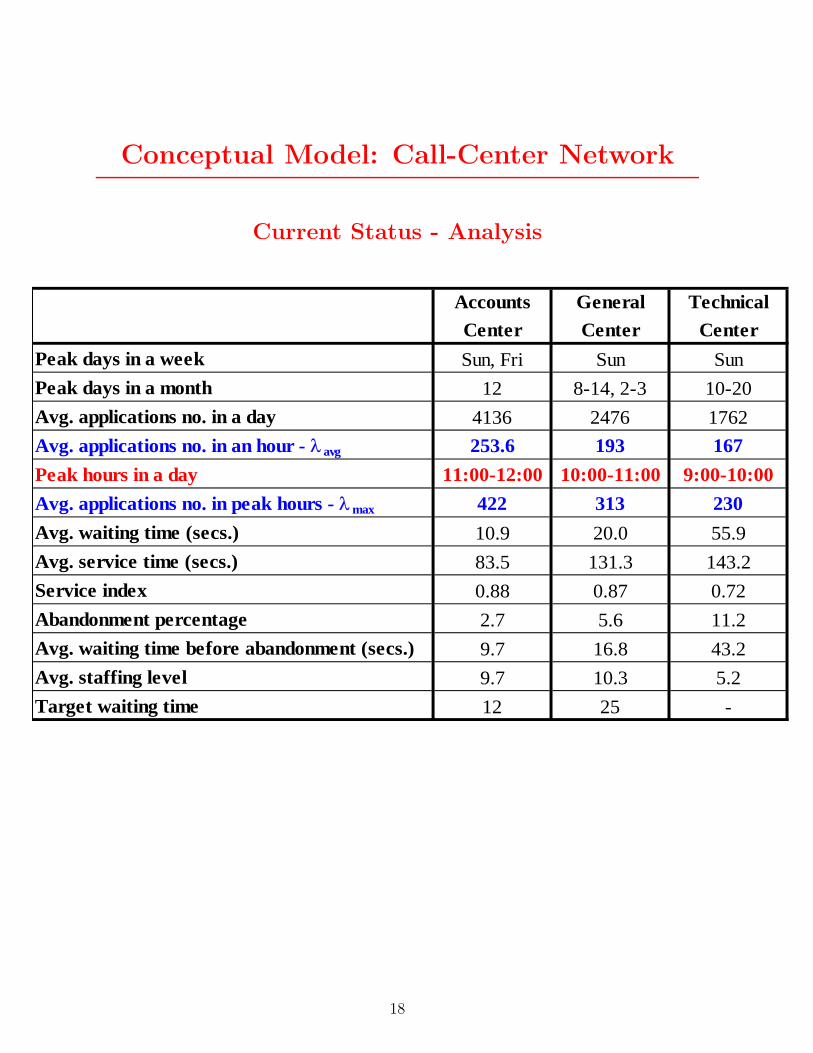
Conceptual Model: Call-Center Network
Current Status - Analysis
Current Status - Analysis
Accounts General TechnicalCenter Center Center
Peak days in a week Sun, Fri Sun SunPeak days in a month 12 8-14, 2-3 10-20Avg. applications no. in a day 4136 2476 1762Avg. applications no. in an hour - λ avg 253.6 193 167Peak hours in a day 11:00-12:00 10:00-11:00 9:00-10:00Avg. applications no. in peak hours - λmax 422 313 230Avg. waiting time (secs.) 10.9 20.0 55.9Avg. service time (secs.) 83.5 131.3 143.2Service index 0.88 0.87 0.72Abandonment percentage 2.7 5.6 11.2Avg. waiting time before abandonment (secs.) 9.7 16.8 43.2Avg. staffing level 9.7 10.3 5.2Target waiting time 12 25 -
Operations Research
44
18

JOINT COMMISSION ON ACCREDITATION OF HEALTHCARE ORGANIZATIONS
2006 HOSPITAL ACCREDITATION STANDARDS FOR
Emergency Management Planning
Emergency Management Drills
Infection Control
Disaster Privileges
(Please note that standards addressing emergency management drills and disaster
privileges are undergoing additional research; revised standards for these areas are
forthcoming)
Standard EC.4.10
The hospital addresses emergency management.
Rationale for EC.4.10
An emergency1 in the hospital or its community could suddenly and significantly affect
the need for the hospital’s services or its ability to provide those services. Therefore, a
hospital needs to have an emergency management plan that comprehensively describes
its approach to emergencies in the hospital or in its community.
Elements of Performance for EC.4.10
1. The hospital conducts a hazard vulnerability analysis2 to identify potential emergencies
that could affect the need for its services or its ability to provide those services.
2. The hospital establishes the following with the community:
• Priorities among the potential emergencies identified in the hazard vulnerability
analysis
• The hospital’s role in relation to a communitywide emergency management
program
• An “all-hazards” command structure within the hospital that links with the
community’s command structure
3. The hospital develops and maintains a written emergency management plan describing
the process for disaster readiness and emergency management, and implements it when
1Emergency A natural or manmade event that significantly disrupts the environment of care (for example,
damage to the hospital’s building(s) and grounds due to severe winds, storms, or earthquakes) that
significantly disrupts care, treatment and services (for example, loss of utilities such as power, water, or
telephones due to floods, civil disturbances, accidents, or emergencies within the hospital or in its
community); or that results in sudden, significantly changed, or increased demands for the hospital’s
services (for example, bioterrorist attack, building collapse, plane crash in the organization’s community).
Some emergencies are called “disasters” or “potential injury creating events” (PICEs).
2 Hazard vulnerability analysis: The identification of potential emergencies and the direct and indirect
effects these emergencies may have on the hospital’s operations and the demand for its services.

4. The business continuity/disaster recovery plan is implemented when information
systems are interrupted.
Standard LD.3.15
The leaders develop and implement plans to identify and mitigate impediments to
efficient patient flow throughout the hospital.
Rationale for LD.3.15
Managing the flow of patients through the organization is essential to the prevention and
mitigation of patient crowding, a problem that can lead to lapses in patient safety and
quality of care. The Emergency Department is particularly vulnerable to experiencing
negative effects of inefficiency in the management of this process. While Emergency
Departments have little control over the volume and type of patient arrivals and most
hospitals have lost the “surge capacity” that existed at one time to manage the elastic
nature of emergency admissions, other opportunities for improvement do exist.
Overcrowding has been shown to be primarily an organization-wide “system problem”
and not just a problem for which a solution resides within the emergency department.
Opportunities for improvement often exist outside the emergency department.
This standard emphasizes the role of assessment and planning for effective and efficient
patient flow throughout the organization. To understand the system implications of the
issues, leadership should identify all of the processes critical to patient flow through the
hospital system from the time the patient arrives, through admitting, patient assessment
and treatment, and discharge. Supporting processes such as diagnostic, communication,
and patient transportation are included if identified by leadership as impacting patient
flow. Relevant indicators are selected and data is collected and analyzed to enable
monitoring and improvement of processes.
A key component of the standard addresses the needs of admitted patients who are in
temporary bed locations awaiting an inpatient bed. Twelve key elements of care have
been identified to ensure adequate and appropriate care for admitted patients in temporary
locations. These elements have implications across the organization and should be
considered when planning care and services for these patients. Additional standard
chapters relevant to these key elements are shown in parenthesis.
• Life Safety Code issues (for example, patients in open areas) (EC)
• Patient privacy and confidentiality (RI)
• Cross training and coordination among programs and services to ensure adequate
staffing, particularly nursing staff (HR)
• Designation of a physician to manage the care of the admitted patient in a
temporary location, without compromising the quality of care given to other ED
patients (HR)
• Proper technology and equipment to meet patient needs (PC, LD)
• Appropriately privileged practitioners to provide patient care beyond immediate
emergency services (HR)
user
Highlight
user
Highlight
user
Highlight
user
Highlight
user
Highlight
user
Highlight
user
Highlight
user
Highlight
user
Highlight
user
Highlight
user
Highlight
user
Highlight
user
Highlight
user
Highlight
user
Highlight

Patient Flow in Hospitals:Reducing Delay in Healthcare Delivery
Chapter 1
MODELING PATIENT FLOWS THROUGH THE HEALTHCARE SYSTEM
Randolph Hall, David Belson, Pavan Murali and Maged Dessouky Epstein Department of Industrial and Systems Engineering, 200 GER,University of Southern California, Los Angeles, California 90089-0193
Abstract: The system of health care can be evaluated from four perspectives: macro, regional, center, and department. In each case, reduction of patient delay depends on improving interfaces as patients are transferred from activity to activity or department to department. This chapter presents basic tools for resolving delays at interfaces, through mapping the processes by which patients are served, and by developing and implementing measures of system performance. These tools are demonstrated through a case study of the Los Angeles County/University of Southern California Hospital.
Key words: Process charts, performance measurement, healthcare systems
1. INTRODUCTION
Health care systems have been challenged in recent years to deliver high quality care with limited resources. In the United States, large segments of the population have inadequate health insurance coverage, forcing them to rely on an under funded public health system. At the national level, the National Institutes of Health has projected a steady increase in expenditures over the next 10 years, both in absolute terms and as a percentage of the gross-domestic-product (GDP). Total expenditures in year 2000 amounted to $1.3 trillion, or 13.2% of the GDP. While expenditures as a percentage of GDP held nearly constant between 1992 and 2000, they increased steadily from 5.2% to 13.1% in the 32-year period from 1960 to 1992. Due to aging of the population and increased costs of medical delivery, health-care costs are projected to increase to 15.9% of the GDP in 2010.
25
Patient Flow in Hospitals: Macro-View
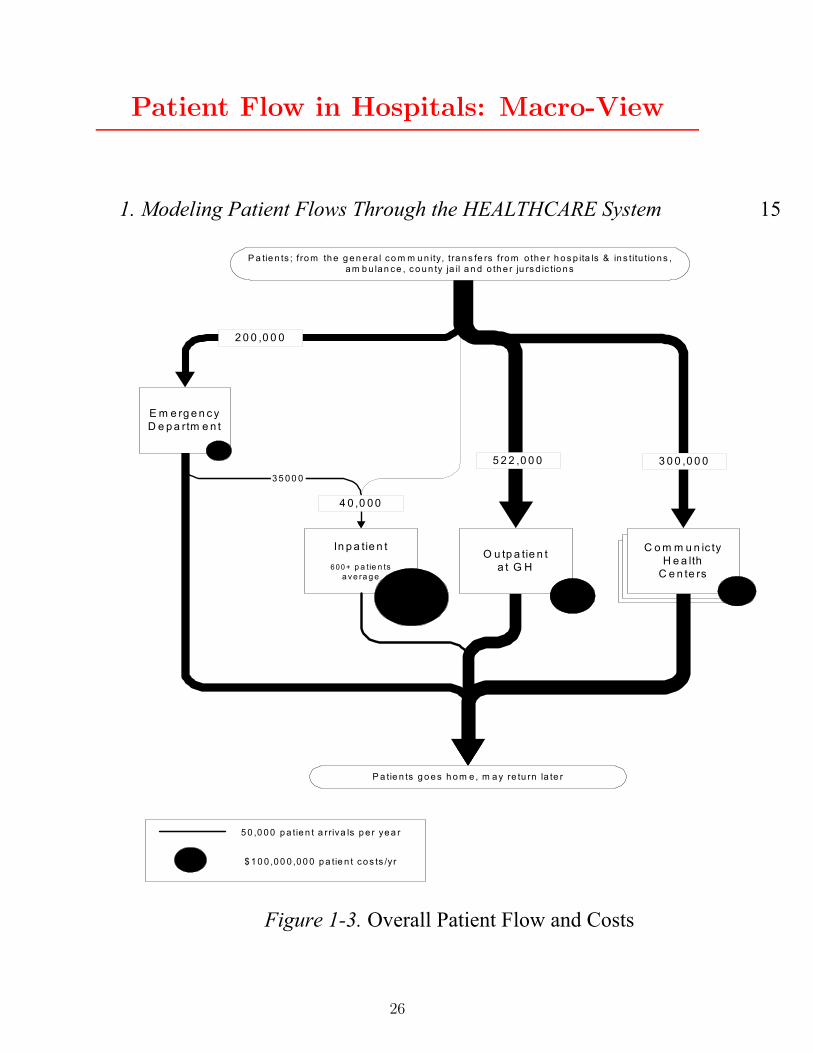
1. Modeling Patient Flows Through the HEALTHCARE System 15
C o m m u n ic tyH e a lth
C e n te rs
C o m m u n ic tyH e a lth
C e n te rs
E m e rg e n c yD e p a rtm e n t
In p a tie n t
6 00 + p a tie n tsa ve ra g e
O u tp a tie n ta t G H
C o m m u n ic tyH e a lth
C e n te rs
3 5 0 0 0
P a tie n ts g o e s h o m e , m a y re tu rn la te r
2 0 0 ,0 0 0
4 0 ,0 0 0
5 2 2 ,0 0 0 3 0 0 ,0 0 0
5 0 ,0 0 0 p a tie n t a r riva ls p e r ye a r
$ 1 0 0 ,0 0 0 ,0 0 0 p a tie n t co s ts /yr
P a tie n ts ; f ro m th e g e n era l co m m u n ity, tra n s fe rs fro m o the r h o s p ita ls & in s titu tio n s ,a m b u lan ce , c o u n ty ja il a n d o th e r ju rs d ic tio n s
Figure 1-3. Overall Patient Flow and Costs
26

Patient Flow: Inpatient Radiology 1
26 Chapter 1
The clerk or nurse at the ward adds order topatient cardex and enters it into Af f nity -Order
Management
Radiology Department in GH observ esrequest f or serv ices
The scheduler at the radiology dept. checksf or any coming up empty slots in the
appropriage schedule
Are there anyempty slots in theday 's schedule?
The clerk places a request with thetransportation pool to take the patient to
radiology
Transportation staf f takes gurney /wheelchair to the ward.
Istransportation
av ailable?
Patient waits inroom
Pt is transported to RAD andreports to the radiology ward
Are there anyempty slots?
Is there any ER/jailpatient/prev iousinpat waiting?
Pt waits f or thenext empty slot
Patient requires radiology serv ices
Yes
No
Yes
No
Yes
No
No
Yes
RadiologySchedules
Radiology - Inpatient
USC / ISE + LAC Patient FlowProject
Phy sician writes order f or scan/X-ray onPhy sician Order f orm
Radiology rev iews OM request andapprov es or replies,
Phy sician OrderForm
Departmentalapprov al process
Pt waits in room
A
B
Figure 1-10a. Process Map for Inpatient Radiology, Part 1
28
Related Documents