This is an Accepted Manuscript, which has been through the Royal Society of Chemistry peer review process and has been accepted for publication. Accepted Manuscripts are published online shortly after acceptance, before technical editing, formatting and proof reading. Using this free service, authors can make their results available to the community, in citable form, before we publish the edited article. We will replace this Accepted Manuscript with the edited and formatted Advance Article as soon as it is available. You can find more information about Accepted Manuscripts in the Information for Authors. Please note that technical editing may introduce minor changes to the text and/or graphics, which may alter content. The journal’s standard Terms & Conditions and the Ethical guidelines still apply. In no event shall the Royal Society of Chemistry be held responsible for any errors or omissions in this Accepted Manuscript or any consequences arising from the use of any information it contains. Accepted Manuscript Molecular BioSystems www.rsc.org/molecularbiosystems View Article Online View Journal This article can be cited before page numbers have been issued, to do this please use: A. Bhunia, A. Ghosh, A. Datta, J. Jana, R. K. Kar, C. Chatterjee and S. Chatterjee, Mol. BioSyst., 2014, DOI: 10.1039/C4MB00111G.

Welcome message from author
This document is posted to help you gain knowledge. Please leave a comment to let me know what you think about it! Share it to your friends and learn new things together.
Transcript

This is an Accepted Manuscript, which has been through the Royal Society of Chemistry peer review process and has been accepted for publication.
Accepted Manuscripts are published online shortly after acceptance, before technical editing, formatting and proof reading. Using this free service, authors can make their results available to the community, in citable form, before we publish the edited article. We will replace this Accepted Manuscript with the edited and formatted Advance Article as soon as it is available.
You can find more information about Accepted Manuscripts in the Information for Authors.
Please note that technical editing may introduce minor changes to the text and/or graphics, which may alter content. The journal’s standard Terms & Conditions and the Ethical guidelines still apply. In no event shall the Royal Society of Chemistry be held responsible for any errors or omissions in this Accepted Manuscript or any consequences arising from the use of any information it contains.
Accepted Manuscript
Molecular BioSystems
www.rsc.org/molecularbiosystems
View Article OnlineView Journal
This article can be cited before page numbers have been issued, to do this please use: A. Bhunia, A.
Ghosh, A. Datta, J. Jana, R. K. Kar, C. Chatterjee and S. Chatterjee, Mol. BioSyst., 2014, DOI:
10.1039/C4MB00111G.
Journal Name RSC
ARTICLE
This journal is © The Royal Society of Chemistry 2013 J. Name., 2013, 00, 1-3 | 1
Sequence Context Induced Antimicrobial Activity:
Insight to Lipopolysaccharide Permeabilization
Anirban Ghosh,a,
Aritreyee Datta,a,
Jagannath Jana,a,
Rajiv K. Kar,a
Chiradip Chatterjee,b Subhrangsu Chatterjee
a,* and Anirban Bhunia
a,*
Lactoferrampin (WR17, Trp 268-Arg 284), an antimicrobial peptide is known to have
significant antibacterial and candidacial activity. However, there were no previous studies
explaining how WR17 permeabilizes the outer membrane of gram negative bacteria and
neutralizes endotoxins. In this study we used a series of assays like antimicrobial activity,
calcein leakage, NPN dye uptake and endotoxin neutralization assay to show that the sequence
context of WR17 modulates its multi-faceted activities. We determined the high resolution
NMR structure of WR17 in LPS and found that the N-ter region forms a helix (Trp1-Phe11)
and orients itself at an angle of 4 -
ter region (Lys13-Arg17) remains as a flexible extended random coil. We also verified this
result through in-silico molecular modeling simulation. Isothermal titration calorimetry
showed that the interaction of WR17 and its analogues with LPS was primarily endothermic in
nature. Using several fluorescence techniques such as anisotropy and red edge excitation shift
assay we revealed a motional restriction for Trp1 of WR17 in LPS. The distance between an
indole ring of Trp1 of WR17 and the polar head group of LPS is around 7 Å, as obtained from
the depth of insertion assay. Additionally, MD simulation demonstrated that the incorporation
of the peptide in LPS is achieved by the help of K13xK15xR17 motif at the C-terminus. This
v g “K13NKSR17” f u b g u z u g g
design novel anti-endotoxic molecules.
Introduction
Lipopolysaccharide (LPS), a glycolipid component present in the
outer leaflet of the outer membrane of gram negative bacteria plays
a pivotal role in bacterial infections affecting human health.1 LPS
presents itself as an impermeable barrier in bacterial membrane,
protecting them from a hoard of antibacterial agents and
subsequently contribute to septicemia or endotoxic shock in human
and animals.2 A study conducted in the United States alone showed a
steady rise in deaths associated with sepsis reaching a striking annual
average mortality rate of 120,000.3 Sepsis, due to gram negative
bacterial infections is caused by a hyper activated innate immune
response g x v u f TNFα
immune-modulatory cytokines which leads to severe damage to
tissue and organs. This phenomenon leads to a steep fall in blood
pressure and associated multiple organ failure and coagulopathy.4
LPS, the key bio-molecule in sepsis through its immune-modulatory
effects, mediates the hyperactive immune response through a
cascade of signalling pathways.5-7 Initially, LPS is released into
blood upon lysis of the bacterial cell wall and binds to LPS binding
protein (LBP). Next, is carried to CD14 receptors present on the
surface of immune cell membrane. CD14 takes LPS to myeloid
differentiation protein-2 (MD2) that is associated to toll like receptor
protein, TLR4. TLR4, upon binding to LPS activates the signalling
cascade responsible for the cytokine burst which inclu TNFα I -
6, IL-8 and IL-1.8-10 Thus LPS establishes itself as a prime target for
pharmacological intervention towards development of effective
antibacterial and anti-sepsis drug.
Page 1 of 17 Molecular BioSystems
Mol
ecul
arB
ioS
yste
ms
Acc
epte
dM
anus
crip
t
Publ
ishe
d on
25
Mar
ch 2
014.
Dow
nloa
ded
by B
ose
Inst
itute
on
26/0
3/20
14 0
6:01
:29.
View Article Online
DOI: 10.1039/C4MB00111G
Journal Name ARTICLE
This journal is © The Royal Society of Chemistry 2012 J. Name., 2012, 00, 1-3 | 2
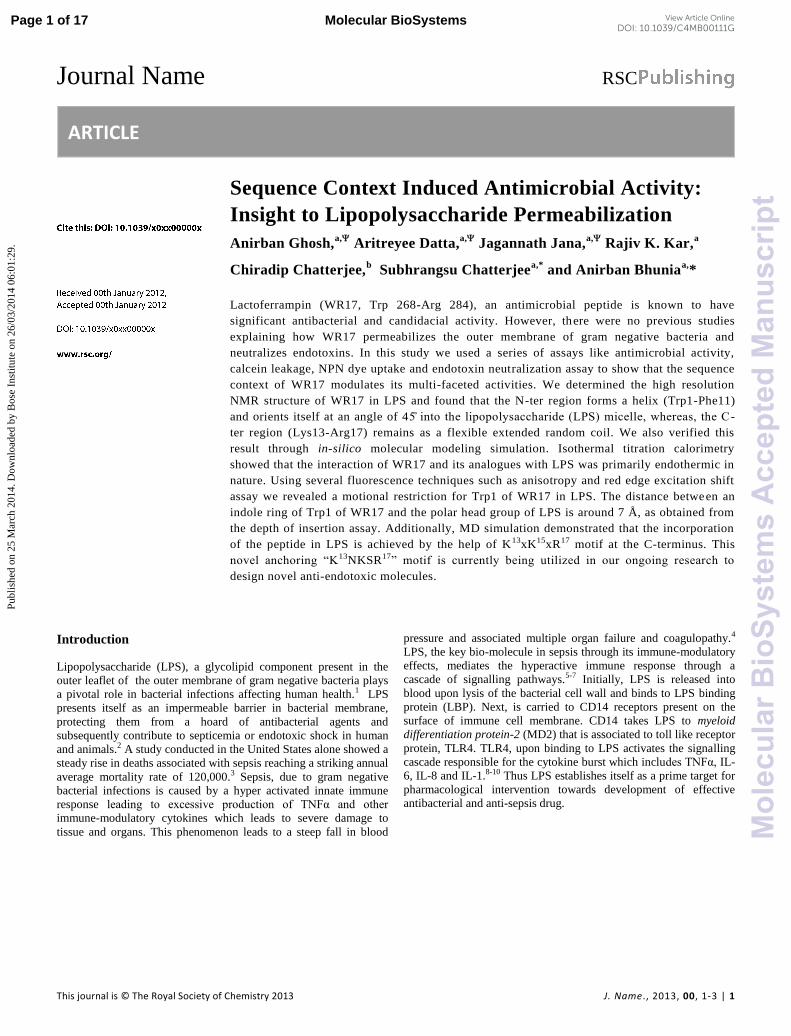
Fig. 1. Cartoon diagram of bovine lactoferrin and amino acid
sequences of WR17 and its shorter fragments. (A) Ribbon diagram of
bovine lactoferrin (Protein Data Bank accession code 1BLF) and a 17
residue antimicrobial peptide in an N1 - domain has been denoted as
lactoferrampin (WR17, amino acids Trp268–Arg284) which is marked
with a black circle. The figure was prepared using Pymol. (B) Amino
acid sequence of WR17 and its N- and C-ter truncated peptides WG12,
WK10, KG11, KK9, KR12 and KR8 analogue.
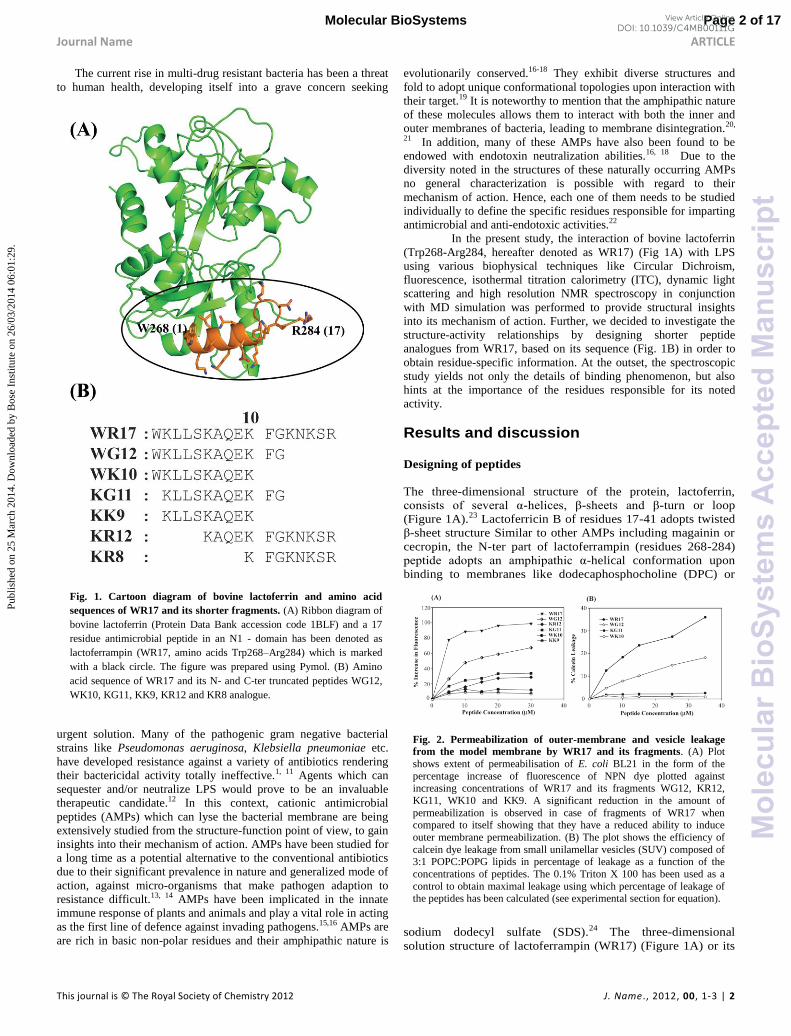
Fig. 2. Permeabilization of outer-membrane and vesicle leakage
from the model membrane by WR17 and its fragments. (A) Plot
shows extent of permeabilisation of E. coli BL21 in the form of the
percentage increase of fluorescence of NPN dye plotted against
increasing concentrations of WR17 and its fragments WG12, KR12,
KG11, WK10 and KK9. A significant reduction in the amount of
permeabilization is observed in case of fragments of WR17 when compared to itself showing that they have a reduced ability to induce
outer membrane permeabilization. (B) The plot shows the efficiency of
calcein dye leakage from small unilamellar vesicles (SUV) composed of 3:1 POPC:POPG lipids in percentage of leakage as a function of the
concentrations of peptides. The 0.1% Triton X 100 has been used as a
control to obtain maximal leakage using which percentage of leakage of the peptides has been calculated (see experimental section for equation).
The current rise in multi-drug resistant bacteria has been a threat
to human health, developing itself into a grave concern seeking
urgent solution. Many of the pathogenic gram negative bacterial
strains like Pseudomonas aeruginosa, Klebsiella pneumoniae etc.
have developed resistance against a variety of antibiotics rendering
their bactericidal activity totally ineffective.1, 11 Agents which can
sequester and/or neutralize LPS would prove to be an invaluable
therapeutic candidate.12 In this context, cationic antimicrobial
peptides (AMPs) which can lyse the bacterial membrane are being
extensively studied from the structure-function point of view, to gain
insights into their mechanism of action. AMPs have been studied for
a long time as a potential alternative to the conventional antibiotics
due to their significant prevalence in nature and generalized mode of
action, against micro-organisms that make pathogen adaption to
resistance difficult.13, 14 AMPs have been implicated in the innate
immune response of plants and animals and play a vital role in acting
as the first line of defence against invading pathogens.15,16 AMPs are
are rich in basic non-polar residues and their amphipathic nature is
evolutionarily conserved.16-18 They exhibit diverse structures and
fold to adopt unique conformational topologies upon interaction with
their target.19 It is noteworthy to mention that the amphipathic nature
of these molecules allows them to interact with both the inner and
outer membranes of bacteria, leading to membrane disintegration.20,
21 In addition, many of these AMPs have also been found to be
endowed with endotoxin neutralization abilities.16, 18 Due to the
diversity noted in the structures of these naturally occurring AMPs
no general characterization is possible with regard to their
mechanism of action. Hence, each one of them needs to be studied
individually to define the specific residues responsible for imparting
antimicrobial and anti-endotoxic activities.22
In the present study, the interaction of bovine lactoferrin
(Trp268-Arg284, hereafter denoted as WR17) (Fig 1A) with LPS
using various biophysical techniques like Circular Dichroism,
fluorescence, isothermal titration calorimetry (ITC), dynamic light
scattering and high resolution NMR spectroscopy in conjunction
with MD simulation was performed to provide structural insights
into its mechanism of action. Further, we decided to investigate the
structure-activity relationships by designing shorter peptide
analogues from WR17, based on its sequence (Fig. 1B) in order to
obtain residue-specific information. At the outset, the spectroscopic
study yields not only the details of binding phenomenon, but also
hints at the importance of the residues responsible for its noted
activity.
Results and discussion
Designing of peptides
The three-dimensional structure of the protein, lactoferrin,
f v α- β- β-turn or loop
(Figure 1A).23 Lactoferricin B of residues 17-41 adopts twisted
β-sheet structure Similar to other AMPs including magainin or
cecropin, the N-ter part of lactoferrampin (residues 268-284)
α-helical conformation upon
binding to membranes like dodecaphosphocholine (DPC) or
sodium dodecyl sulfate (SDS).24 The three-dimensional
solution structure of lactoferrampin (WR17) (Figure 1A) or its
Page 2 of 17Molecular BioSystems
Mol
ecul
arB
ioS
yste
ms
Acc
epte
dM
anus
crip
t
Publ
ishe
d on
25
Mar
ch 2
014.
Dow
nloa
ded
by B
ose
Inst
itute
on
26/0
3/20
14 0
6:01
:29.
View Article Online
DOI: 10.1039/C4MB00111G
Journal Name ARTICLE
This journal is © The Royal Society of Chemistry 2012 J. Name., 2012, 00, 1-3 | 3
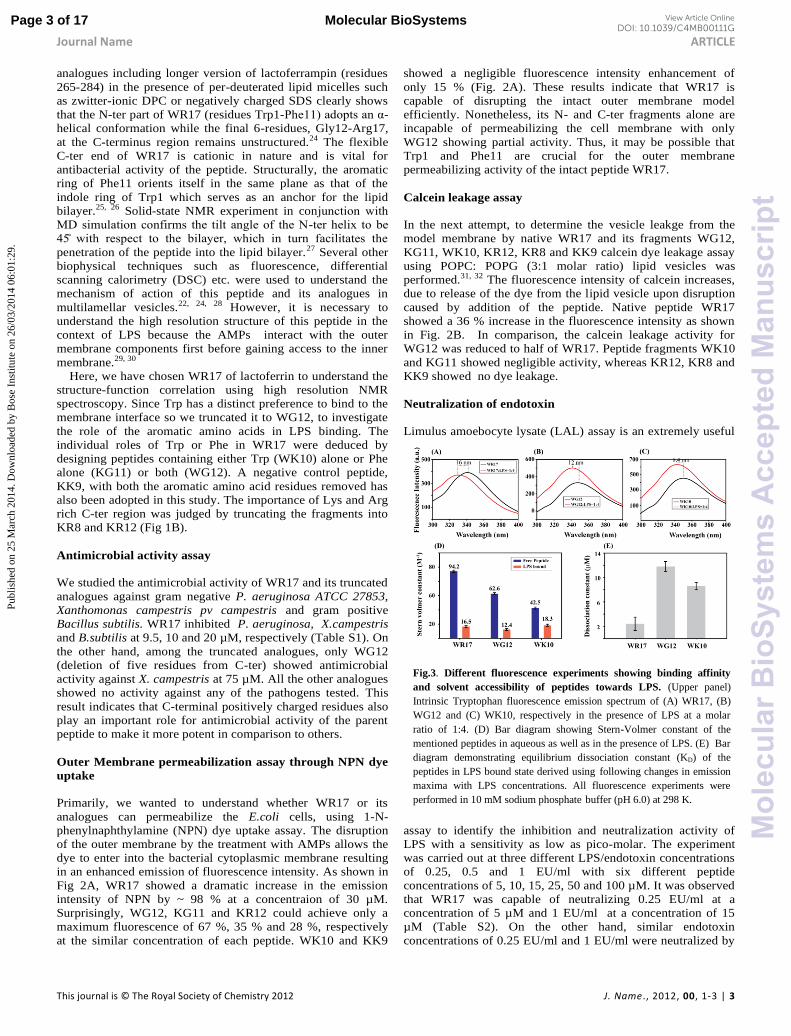
Fig.3. Different fluorescence experiments showing binding affinity
and solvent accessibility of peptides towards LPS. (Upper panel)
Intrinsic Tryptophan fluorescence emission spectrum of (A) WR17, (B)
WG12 and (C) WK10, respectively in the presence of LPS at a molar ratio of 1:4. (D) Bar diagram showing Stern-Volmer constant of the
mentioned peptides in aqueous as well as in the presence of LPS. (E) Bar
diagram demonstrating equilibrium dissociation constant (KD) of the
peptides in LPS bound state derived using following changes in emission
maxima with LPS concentrations. All fluorescence experiments were
performed in 10 mM sodium phosphate buffer (pH 6.0) at 298 K.
analogues including longer version of lactoferrampin (residues
265-284) in the presence of per-deuterated lipid micelles such
as zwitter-ionic DPC or negatively charged SDS clearly shows
that the N-ter part of WR17 (residues Trp1- 11 α-
helical conformation while the final 6-residues, Gly12-Arg17,
at the C-terminus region remains unstructured.24 The flexible
C-ter end of WR17 is cationic in nature and is vital for
antibacterial activity of the peptide. Structurally, the aromatic
ring of Phe11 orients itself in the same plane as that of the
indole ring of Trp1 which serves as an anchor for the lipid
bilayer.25, 26 Solid-state NMR experiment in con u
u f g f N- x b
b u f
penetration of the peptide into the lipid bilayer.27 Several other
biophysical techniques such as fluorescence, differential
scanning calorimetry (DSC) etc. were used to understand the
mechanism of action of this peptide and its analogues in
multilamellar vesicles.22, 24, 28 However, it is necessary to
understand the high resolution structure of this peptide in the
context of LPS because the AMPs interact with the outer
membrane components first before gaining access to the inner
membrane.29, 30
Here, we have chosen WR17 of lactoferrin to understand the
structure-function correlation using high resolution NMR
spectroscopy. Since Trp has a distinct preference to bind to the
membrane interface so we truncated it to WG12, to investigate
the role of the aromatic amino acids in LPS binding. The
individual roles of Trp or Phe in WR17 were deduced by
designing peptides containing either Trp (WK10) alone or Phe
alone (KG11) or both (WG12). A negative control peptide,
KK9, with both the aromatic amino acid residues removed has
also been adopted in this study. The importance of Lys and Arg
rich C-ter region was judged by truncating the fragments into
KR8 and KR12 (Fig 1B).
Antimicrobial activity assay
We studied the antimicrobial activity of WR17 and its truncated
analogues against gram negative P. aeruginosa ATCC 27853,
Xanthomonas campestris pv campestris and gram positive
Bacillus subtilis. WR17 inhibited P. aeruginosa, X.campestris
and B.subtilis at 9.5, 10 and 20 µM, respectively (Table S1). On
the other hand, among the truncated analogues, only WG12
(deletion of five residues from C-ter) showed antimicrobial
activity against X. campestris at 75 µM. All the other analogues
showed no activity against any of the pathogens tested. This
result indicates that C-terminal positively charged residues also
play an important role for antimicrobial activity of the parent
peptide to make it more potent in comparison to others.
Outer Membrane permeabilization assay through NPN dye
uptake
Primarily, we wanted to understand whether WR17 or its
analogues can permeabilize the E.coli cells, using 1-N-
phenylnaphthylamine (NPN) dye uptake assay. The disruption
of the outer membrane by the treatment with AMPs allows the
dye to enter into the bacterial cytoplasmic membrane resulting
in an enhanced emission of fluorescence intensity. As shown in
Fig 2A, WR17 showed a dramatic increase in the emission
intensity of NPN by ~ 98 % at a concentraion of 30 µM.
Surprisingly, WG12, KG11 and KR12 could achieve only a
maximum fluorescence of 67 %, 35 % and 28 %, respectively
at the similar concentration of each peptide. WK10 and KK9
showed a negligible fluorescence intensity enhancement of
only 15 % (Fig. 2A). These results indicate that WR17 is
capable of disrupting the intact outer membrane model
efficiently. Nonetheless, its N- and C-ter fragments alone are
incapable of permeabilizing the cell membrane with only
WG12 showing partial activity. Thus, it may be possible that
Trp1 and Phe11 are crucial for the outer membrane
permeabilizing activity of the intact peptide WR17.
Calcein leakage assay
In the next attempt, to determine the vesicle leakge from the
model membrane by native WR17 and its fragments WG12,
KG11, WK10, KR12, KR8 and KK9 calcein dye leakage assay
using POPC: POPG (3:1 molar ratio) lipid vesicles was
performed.31, 32 The fluorescence intensity of calcein increases,
due to release of the dye from the lipid vesicle upon disruption
caused by addition of the peptide. Native peptide WR17
showed a 36 % increase in the fluorescence intensity as shown
in Fig. 2B. In comparison, the calcein leakage activity for
WG12 was reduced to half of WR17. Peptide fragments WK10
and KG11 showed negligible activity, whereas KR12, KR8 and
KK9 showed no dye leakage.
Neutralization of endotoxin
Limulus amoebocyte lysate (LAL) assay is an extremely useful
assay to identify the inhibition and neutralization activity of
LPS with a sensitivity as low as pico-molar. The experiment
was carried out at three different LPS/endotoxin concentrations
of 0.25, 0.5 and 1 EU/ml with six different peptide
concentrations of 5, 10, 15, 25, 50 and 100 µM. It was observed
that WR17 was capable of neutralizing 0.25 EU/ml at a
concentration of 5 µM and 1 EU/ml at a concentration of 15
µM (Table S2). On the other hand, similar endotoxin
concentrations of 0.25 EU/ml and 1 EU/ml were neutralized by
Page 3 of 17 Molecular BioSystems
Mol
ecul
arB
ioS
yste
ms
Acc
epte
dM
anus
crip
t
Publ
ishe
d on
25
Mar
ch 2
014.
Dow
nloa
ded
by B
ose
Inst
itute
on
26/0
3/20
14 0
6:01
:29.
View Article Online
DOI: 10.1039/C4MB00111G

Journal Name ARTICLE
This journal is © The Royal Society of Chemistry 2012 J. Name., 2012, 00, 1-3 | 4
Fig. 4. Isothermal titration Calorimetric (ITC) profile for WR17,
WG12 and KK9. The upper panel shows the endothermic heat of
reaction vs. time (minute) upon interaction with LPS for peptides (A) WR17, (B) WG12 and (C) KK9, respectively. The lower panel of the
figures A, B and C shows enthalpy change per mole of peptide injection
vs. molar ratio (peptide:LPS) for peptides WR17, WG12 and KK9 respectively upon interaction with LPS. 10 µM of LPS were titrated
against 250 µM of peptides. All peptides and LPS were dissolved in 10
mM phosphate buffer at pH 6.0.
Table 1. Thermodynamic parameters derived from ITC
experiment.
Parameters WR17 WG12
KA (µM-1) 2.6 2.2
ΔH k . -
1)
3.2 ± 0.4 6.3 ±
0.7 TΔ k . -
1)
11.9 14.9
ΔG k . -
1)
-8.7 -8.6
KD (µM) 0.4 0.5
Fig. 5. Secondary structures of peptides in free and LPS bound forms by Circular Dichromism.
Far-UV CD spectra of native WR17 (A), WG12 (B), and WK10 (C) (solid panel), KG11 (D), KK9 (E)
and KR8 (F) (lower panel) in the absence (dashed line) and the presence of E. coli 0111:B4 LPS (red line). All CD spectra were performed in 10 mM sodium phosphate buffer (pH 6.0) at 298 K.
WG12 at 25 µM and 50 µM, respectively. All the other
fragments were unable to neutralize the endotoxin.
Interaction study using Fluorescence Spectroscopy and ITC
The presence of Trp residue in the peptides WR17, WG12 and
WK10 was used to determine the binding parameters.
Generally, the change in the fluorescence emission maxima
λmax) of Trp is used as a sensitive probe to monitor the
interaction of the ligand with a macromolecule. The Trp residue
of WR17, WG12 and WK10 in free solution showed an
emission maximum at ~ 350 nm, which argues that the Trp
residue is exposed to the aqueous environment (Fig. 3A-C).
However, the successive addition of LPS into the peptide
solution at an increasing molar
ratio yielded a progressive blue
shift of the emission maxima. The
blue shift observed for the Trp
residue of WR17/WG12/WK10 in
the presence of LPS indicates the
presence of Trp in the hydrophobic
or non-polar environment (Fig.
3A-C). The extent of blue shift was
highest for WR17 with a shift of
16 nm, whereas its analogues,
WG12 and WK10 recorded a blue
shift of about 12 and 8.4 nm,
respectively. The larger blue shift
of the emission wavelength
provides evidence for the deep
insertion of the Trp residue of
WR17 in the hydrophobic
environment of LPS compared to
that of the analogues WG12 and
WK10. Therefore, the extent of the
solvent exposure of Trp residues in
WR17/WG12/WK10 was further
investigated by means of static quenching with a neutral
quencher acrylamide in free solution as well as in complex with
LPS. All of the peptides exhibited much higher Stern-Volmer
Quenching Constants (KSV) in free-state compared to the LPS
bound state indicating that the Trp residue is well embedded
inside the LPS which protects its accessibility to the quencher
(Fig. 3D). This quenching data is in good agreement with the
fact that the Trp has an indiscriminate preference for the
interfacial region of the lipid bilayer.25 Additionally, the
changes of fluorescence emission maxima of Trp in
WR17/WG12/WK10 in the presence of LPS yielded an
equilibrium dissociation constant (KD) of 2.4 + 0.1, 11.8 + 0.3
and 8.6 + 0.6 µM, respectively (Fig. 3E). Altogether, the larger
blue shift and lower KD values observed in case of WR17 is
attributed to the strong electrostatic interaction between the
positively charged residues, Lys and Arg at the C-ter region of
WR17 and the negatively charged phosphate head group of
LPS. Due to the lack of Trp residues in the analogues KG11,
KK9, KR12 and KR8, the fluorescence based assays in the
presence of LPS could not be carried out. To determine the
depth of insertion of Trp into the LPS bilayer fluorescence-
quenching studies were carried out using two spin-labeled
lipids, 5-DSA and 16-DSA. The position of Trp residues from
the center of the LPS player for WR17 and WG12 was found to
be around 7.4 and 7.1 Å, respectively (Table S2). This distance
information indicates that the Trp residue of both the peptides is
well inserted in the LPS bilayer and forms strong van-der-
Waals interaction with the acyl chains of LPS (Table S3).
Additionally, isothermal titration calorimetry (ITC)
experiments were performed to obtain the equilibrium
dissociation constant (KD) and the binding energy of the active
peptides WR17 and WG12 with LPS (Fig. 4). As a control
experiment the binding interaction of the inactive KK9 (peptide
Page 4 of 17Molecular BioSystems
Mol
ecul
arB
ioS
yste
ms
Acc
epte
dM
anus
crip
t
Publ
ishe
d on
25
Mar
ch 2
014.
Dow
nloa
ded
by B
ose
Inst
itute
on
26/0
3/20
14 0
6:01
:29.
View Article Online
DOI: 10.1039/C4MB00111G
Journal Name ARTICLE
This journal is © The Royal Society of Chemistry 2012 J. Name., 2012, 00, 1-3 | 5
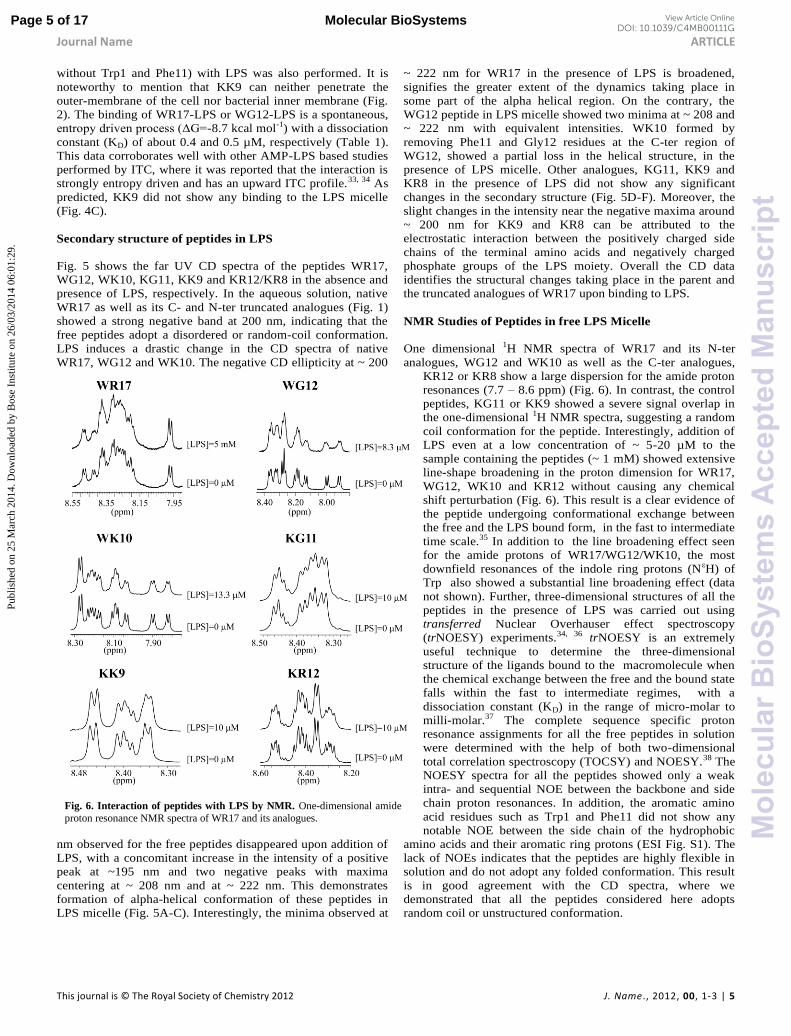
Fig. 6. Interaction of peptides with LPS by NMR. One-dimensional amide
proton resonance NMR spectra of WR17 and its analogues.
without Trp1 and Phe11) with LPS was also performed. It is
noteworthy to mention that KK9 can neither penetrate the
outer-membrane of the cell nor bacterial inner membrane (Fig.
2). The binding of WR17-LPS or WG12-LPS is a spontaneous,
v ΔG=-8.7 kcal mol-1) with a dissociation
constant (KD) of about 0.4 and 0.5 µM, respectively (Table 1).
This data corroborates well with other AMP-LPS based studies
performed by ITC, where it was reported that the interaction is
strongly entropy driven and has an upward ITC profile.33, 34 As
predicted, KK9 did not show any binding to the LPS micelle
(Fig. 4C).
Secondary structure of peptides in LPS
Fig. 5 shows the far UV CD spectra of the peptides WR17,
WG12, WK10, KG11, KK9 and KR12/KR8 in the absence and
presence of LPS, respectively. In the aqueous solution, native
WR17 as well as its C- and N-ter truncated analogues (Fig. 1)
showed a strong negative band at 200 nm, indicating that the
free peptides adopt a disordered or random-coil conformation.
LPS induces a drastic change in the CD spectra of native
WR17, WG12 and WK10. The negative CD ellipticity at ~ 200
nm observed for the free peptides disappeared upon addition of
LPS, with a concomitant increase in the intensity of a positive
peak at ~195 nm and two negative peaks with maxima
centering at ~ 208 nm and at ~ 222 nm. This demonstrates
formation of alpha-helical conformation of these peptides in
LPS micelle (Fig. 5A-C). Interestingly, the minima observed at
~ 222 nm for WR17 in the presence of LPS is broadened,
signifies the greater extent of the dynamics taking place in
some part of the alpha helical region. On the contrary, the
WG12 peptide in LPS micelle showed two minima at ~ 208 and
~ 222 nm with equivalent intensities. WK10 formed by
removing Phe11 and Gly12 residues at the C-ter region of
WG12, showed a partial loss in the helical structure, in the
presence of LPS micelle. Other analogues, KG11, KK9 and
KR8 in the presence of LPS did not show any significant
changes in the secondary structure (Fig. 5D-F). Moreover, the
slight changes in the intensity near the negative maxima around
~ 200 nm for KK9 and KR8 can be attributed to the
electrostatic interaction between the positively charged side
chains of the terminal amino acids and negatively charged
phosphate groups of the LPS moiety. Overall the CD data
identifies the structural changes taking place in the parent and
the truncated analogues of WR17 upon binding to LPS.
NMR Studies of Peptides in free LPS Micelle
One dimensional 1H NMR spectra of WR17 and its N-ter
analogues, WG12 and WK10 as well as the C-ter analogues,
KR12 or KR8 show a large dispersion for the amide proton
resonances (7.7 – 8.6 ppm) (Fig. 6). In contrast, the control
peptides, KG11 or KK9 showed a severe signal overlap in
the one-dimensional 1H NMR spectra, suggesting a random
coil conformation for the peptide. Interestingly, addition of
LPS even at a low concentration of ~ 5-20 µM to the
sample containing the peptides (~ 1 mM) showed extensive
line-shape broadening in the proton dimension for WR17,
WG12, WK10 and KR12 without causing any chemical
shift perturbation (Fig. 6). This result is a clear evidence of
the peptide undergoing conformational exchange between
the free and the LPS bound form, in the fast to intermediate
time scale.35 In addition to the line broadening effect seen
for the amide protons of WR17/WG12/WK10, the most
downfield resonances of the indole ring protons (NεH) of
Trp also showed a substantial line broadening effect (data
not shown). Further, three-dimensional structures of all the
peptides in the presence of LPS was carried out using
transferred Nuclear Overhauser effect spectroscopy
(trNOESY) experiments.34, 36 trNOESY is an extremely
useful technique to determine the three-dimensional
structure of the ligands bound to the macromolecule when
the chemical exchange between the free and the bound state
falls within the fast to intermediate regimes, with a
dissociation constant (KD) in the range of micro-molar to
milli-molar.37 The complete sequence specific proton
resonance assignments for all the free peptides in solution
were determined with the help of both two-dimensional
total correlation spectroscopy (TOCSY) and NOESY.38 The
NOESY spectra for all the peptides showed only a weak
intra- and sequential NOE between the backbone and side
chain proton resonances. In addition, the aromatic amino
acid residues such as Trp1 and Phe11 did not show any
notable NOE between the side chain of the hydrophobic
amino acids and their aromatic ring protons (ESI Fig. S1). The
lack of NOEs indicates that the peptides are highly flexible in
solution and do not adopt any folded conformation. This result
is in good agreement with the CD spectra, where we
demonstrated that all the peptides considered here adopts
random coil or unstructured conformation.
Page 5 of 17 Molecular BioSystems
Mol
ecul
arB
ioS
yste
ms
Acc
epte
dM
anus
crip
t
Publ
ishe
d on
25
Mar
ch 2
014.
Dow
nloa
ded
by B
ose
Inst
itute
on
26/0
3/20
14 0
6:01
:29.
View Article Online
DOI: 10.1039/C4MB00111G
Journal Name ARTICLE
This journal is © The Royal Society of Chemistry 2012 J. Name., 2012, 00, 1-3 | 6
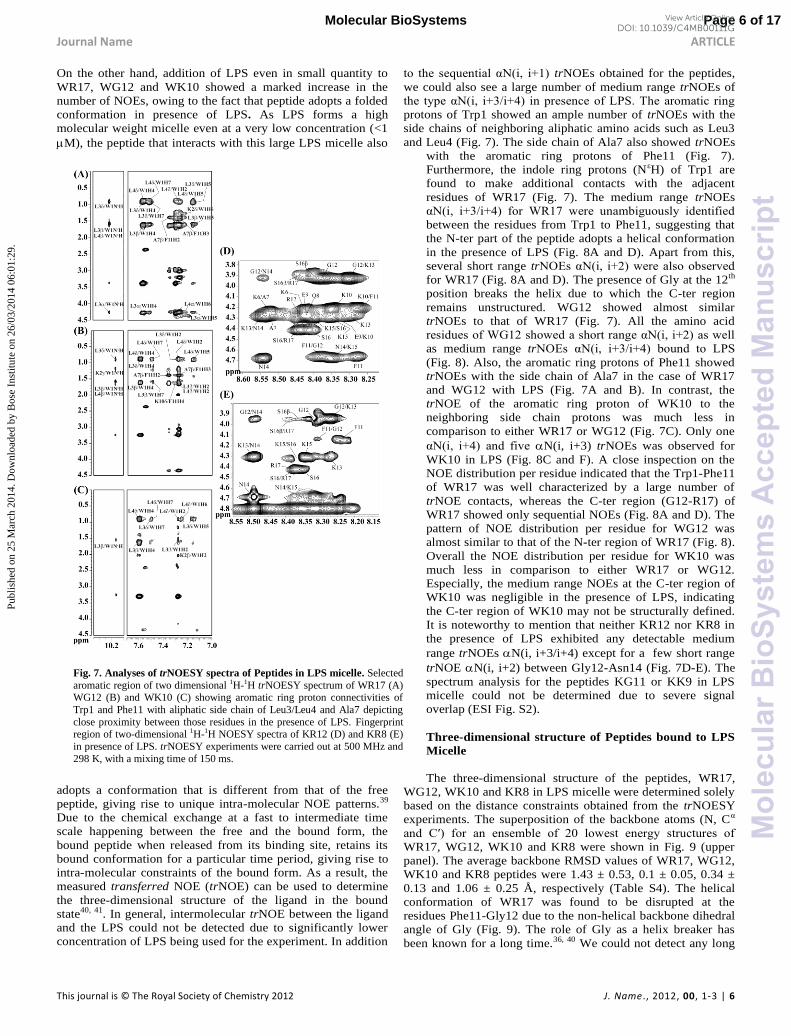
Fig. 7. Analyses of trNOESY spectra of Peptides in LPS micelle. Selected
aromatic region of two dimensional 1H-1H trNOESY spectrum of WR17 (A) WG12 (B) and WK10 (C) showing aromatic ring proton connectivities of
Trp1 and Phe11 with aliphatic side chain of Leu3/Leu4 and Ala7 depicting
close proximity between those residues in the presence of LPS. Fingerprint region of two-dimensional 1H-1H NOESY spectra of KR12 (D) and KR8 (E)
in presence of LPS. trNOESY experiments were carried out at 500 MHz and
298 K, with a mixing time of 150 ms.
On the other hand, addition of LPS even in small quantity to
WR17, WG12 and WK10 showed a marked increase in the
number of NOEs, owing to the fact that peptide adopts a folded
conformation in presence of LPS. As LPS forms a high
molecular weight micelle even at a very low concentration (<1
M), the peptide that interacts with this large LPS micelle also
adopts a conformation that is different from that of the free
peptide, giving rise to unique intra-molecular NOE patterns.39
Due to the chemical exchange at a fast to intermediate time
scale happening between the free and the bound form, the
bound peptide when released from its binding site, retains its
bound conformation for a particular time period, giving rise to
intra-molecular constraints of the bound form. As a result, the
measured transferred NOE (trNOE) can be used to determine
the three-dimensional structure of the ligand in the bound
state40, 41. In general, intermolecular trNOE between the ligand
and the LPS could not be detected due to significantly lower
concentration of LPS being used for the experiment. In addition
qu αN +1 trNOEs obtained for the peptides,
we could also see a large number of medium range trNOEs of
αN +3/ + f . T g
protons of Trp1 showed an ample number of trNOEs with the
side chains of neighboring aliphatic amino acids such as Leu3
and Leu4 (Fig. 7). The side chain of Ala7 also showed trNOEs
with the aromatic ring protons of Phe11 (Fig. 7).
Furthermore, the indole ring protons (NεH) of Trp1 are
found to make additional contacts with the adjacent
residues of WR17 (Fig. 7). The medium range trNOEs
αN +3/ + f WR17 u b gu u f
between the residues from Trp1 to Phe11, suggesting that
the N-ter part of the peptide adopts a helical conformation
in the presence of LPS (Fig. 8A and D). Apart from this,
several short range trNOE αN +2 b v
for WR17 (Fig. 8A and D). The presence of Gly at the 12th
position breaks the helix due to which the C-ter region
remains unstructured. WG12 showed almost similar
trNOEs to that of WR17 (Fig. 7). All the amino acid
u f WG12 g αN +2
as medium range trNOE αN +3/ + b u
(Fig. 8). Also, the aromatic ring protons of Phe11 showed
trNOEs with the side chain of Ala7 in the case of WR17
and WG12 with LPS (Fig. 7A and B). In contrast, the
trNOE of the aromatic ring proton of WK10 to the
neighboring side chain protons was much less in
comparison to either WR17 or WG12 (Fig. 7C). Only one
αN + f v N(i, i+3) trNOEs was observed for
WK10 in LPS (Fig. 8C and F). A close inspection on the
NOE distribution per residue indicated that the Trp1-Phe11
of WR17 was well characterized by a large number of
trNOE contacts, whereas the C-ter region (G12-R17) of
WR17 showed only sequential NOEs (Fig. 8A and D). The
pattern of NOE distribution per residue for WG12 was
almost similar to that of the N-ter region of WR17 (Fig. 8).
Overall the NOE distribution per residue for WK10 was
much less in comparison to either WR17 or WG12.
Especially, the medium range NOEs at the C-ter region of
WK10 was negligible in the presence of LPS, indicating
the C-ter region of WK10 may not be structurally defined.
It is noteworthy to mention that neither KR12 nor KR8 in
the presence of LPS exhibited any detectable medium
range trNOEs N(i, i+3/i+4) except for a few short range
trNOE N(i, i+2) between Gly12-Asn14 (Fig. 7D-E). The
spectrum analysis for the peptides KG11 or KK9 in LPS
micelle could not be determined due to severe signal
overlap (ESI Fig. S2).
Three-dimensional structure of Peptides bound to LPS
Micelle
The three-dimensional structure of the peptides, WR17,
WG12, WK10 and KR8 in LPS micelle were determined solely
based on the distance constraints obtained from the trNOESY
experiments. The superposition of the backbone atoms (N, Cα
′ f b f 20 g u u f
WR17, WG12, WK10 and KR8 were shown in Fig. 9 (upper
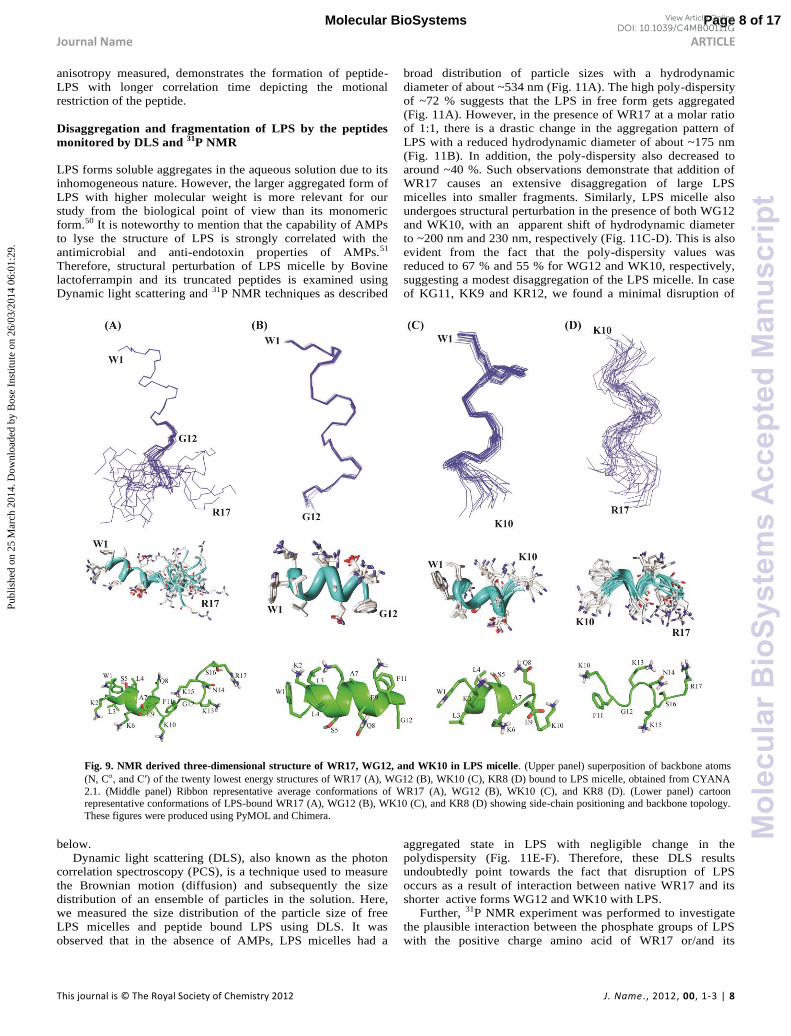
panel). The average backbone RMSD values of WR17, WG12,
WK10 and KR8 peptides were 1.43 ± 0.53, 0.1 ± 0.05, 0.34 ±
0.13 and 1.06 ± 0.25 Å, respectively (Table S4). The helical
conformation of WR17 was found to be disrupted at the
residues Phe11-Gly12 due to the non-helical backbone dihedral
angle of Gly (Fig. 9). The role of Gly as a helix breaker has
been known for a long time.36, 40 We could not detect any long
Page 6 of 17Molecular BioSystems
Mol
ecul
arB
ioS
yste
ms
Acc
epte
dM
anus
crip
t
Publ
ishe
d on
25
Mar
ch 2
014.
Dow
nloa
ded
by B
ose
Inst
itute
on
26/0
3/20
14 0
6:01
:29.
View Article Online
DOI: 10.1039/C4MB00111G
Journal Name ARTICLE
This journal is © The Royal Society of Chemistry 2012 J. Name., 2012, 00, 1-3 | 7
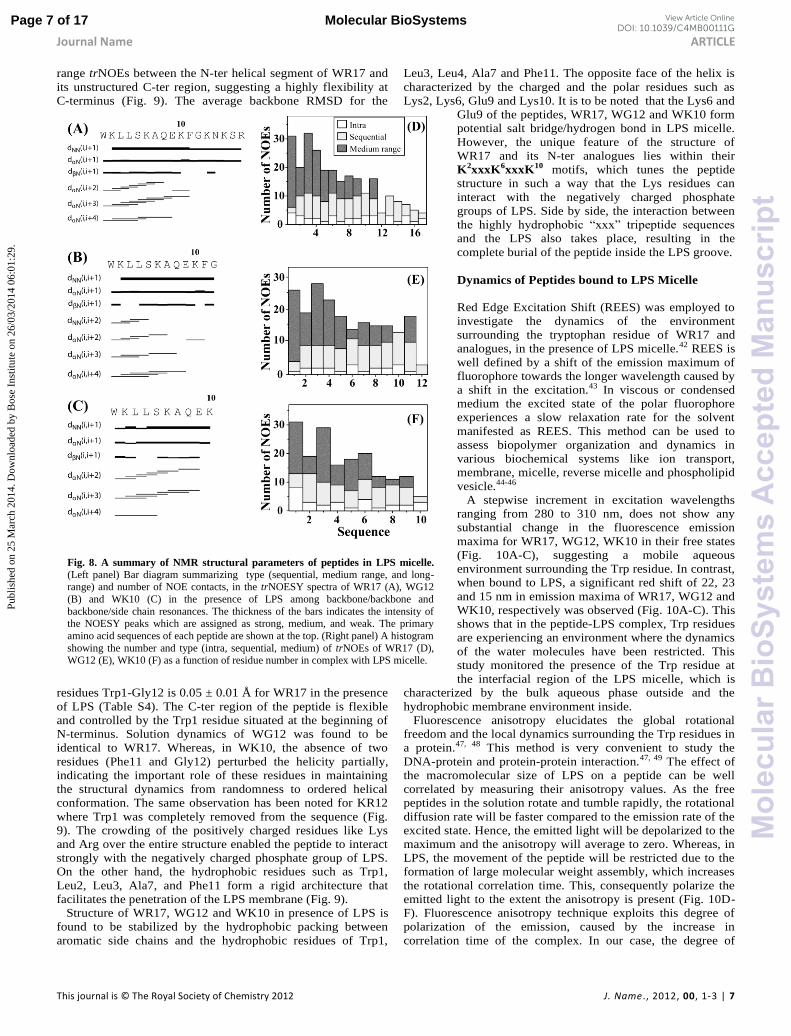
Fig. 8. A summary of NMR structural parameters of peptides in LPS micelle.
(Left panel) Bar diagram summarizing type (sequential, medium range, and long-range) and number of NOE contacts, in the trNOESY spectra of WR17 (A), WG12
(B) and WK10 (C) in the presence of LPS among backbone/backbone and
backbone/side chain resonances. The thickness of the bars indicates the intensity of the NOESY peaks which are assigned as strong, medium, and weak. The primary
amino acid sequences of each peptide are shown at the top. (Right panel) A histogram
showing the number and type (intra, sequential, medium) of trNOEs of WR17 (D), WG12 (E), WK10 (F) as a function of residue number in complex with LPS micelle.
range trNOEs between the N-ter helical segment of WR17 and
its unstructured C-ter region, suggesting a highly flexibility at
C-terminus (Fig. 9). The average backbone RMSD for the
residues Trp1-Gly12 is 0.05 ± 0.01 Å for WR17 in the presence
of LPS (Table S4). The C-ter region of the peptide is flexible
and controlled by the Trp1 residue situated at the beginning of
N-terminus. Solution dynamics of WG12 was found to be
identical to WR17. Whereas, in WK10, the absence of two
residues (Phe11 and Gly12) perturbed the helicity partially,
indicating the important role of these residues in maintaining
the structural dynamics from randomness to ordered helical
conformation. The same observation has been noted for KR12
where Trp1 was completely removed from the sequence (Fig.
9). The crowding of the positively charged residues like Lys
and Arg over the entire structure enabled the peptide to interact
strongly with the negatively charged phosphate group of LPS.
On the other hand, the hydrophobic residues such as Trp1,
Leu2, Leu3, Ala7, and Phe11 form a rigid architecture that
facilitates the penetration of the LPS membrane (Fig. 9).
Structure of WR17, WG12 and WK10 in presence of LPS is
found to be stabilized by the hydrophobic packing between
aromatic side chains and the hydrophobic residues of Trp1,
Leu3, Leu4, Ala7 and Phe11. The opposite face of the helix is
characterized by the charged and the polar residues such as
Lys2, Lys6, Glu9 and Lys10. It is to be noted that the Lys6 and
Glu9 of the peptides, WR17, WG12 and WK10 form
potential salt bridge/hydrogen bond in LPS micelle.
However, the unique feature of the structure of
WR17 and its N-ter analogues lies within their
K2xxxK6xxxK10 motifs, which tunes the peptide
structure in such a way that the Lys residues can
interact with the negatively charged phosphate
groups of LPS. Side by side, the interaction between
g b “xxx” qu
and the LPS also takes place, resulting in the
complete burial of the peptide inside the LPS groove.
Dynamics of Peptides bound to LPS Micelle
Red Edge Excitation Shift (REES) was employed to
investigate the dynamics of the environment
surrounding the tryptophan residue of WR17 and
analogues, in the presence of LPS micelle.42 REES is
well defined by a shift of the emission maximum of
fluorophore towards the longer wavelength caused by
a shift in the excitation.43 In viscous or condensed
medium the excited state of the polar fluorophore
experiences a slow relaxation rate for the solvent
manifested as REES. This method can be used to
assess biopolymer organization and dynamics in
various biochemical systems like ion transport,
membrane, micelle, reverse micelle and phospholipid
vesicle.44-46
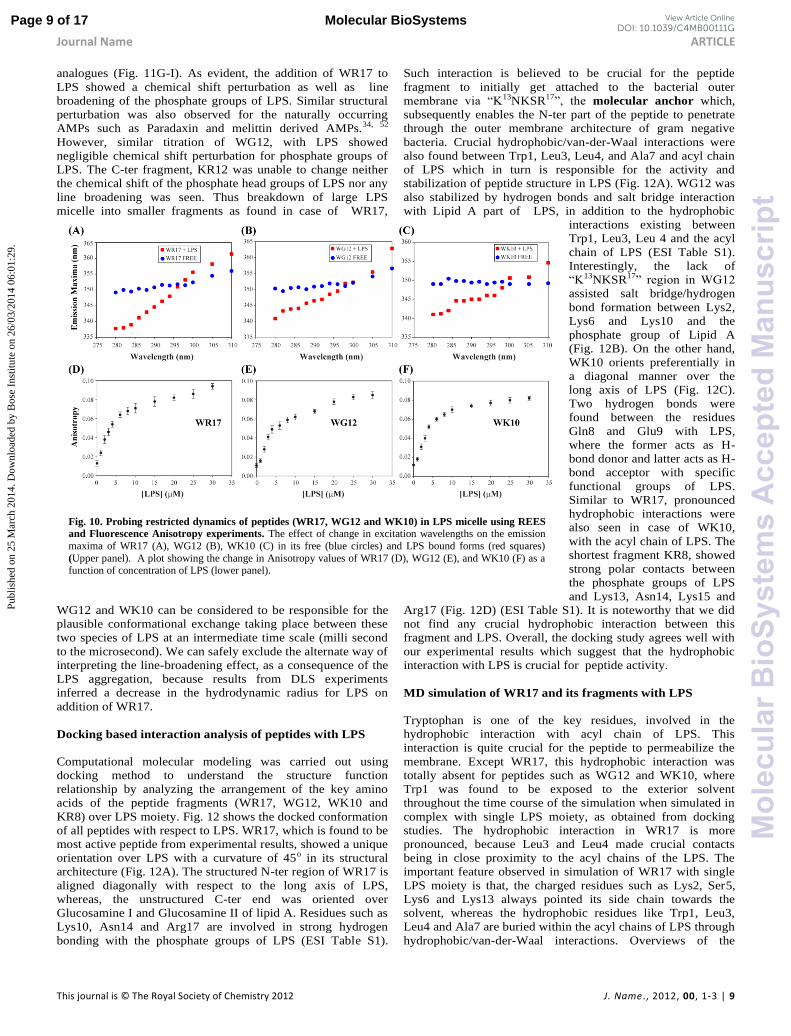
A stepwise increment in excitation wavelengths
ranging from 280 to 310 nm, does not show any
substantial change in the fluorescence emission
maxima for WR17, WG12, WK10 in their free states
(Fig. 10A-C), suggesting a mobile aqueous
environment surrounding the Trp residue. In contrast,
when bound to LPS, a significant red shift of 22, 23
and 15 nm in emission maxima of WR17, WG12 and
WK10, respectively was observed (Fig. 10A-C). This
shows that in the peptide-LPS complex, Trp residues
are experiencing an environment where the dynamics
of the water molecules have been restricted. This
study monitored the presence of the Trp residue at
the interfacial region of the LPS micelle, which is
characterized by the bulk aqueous phase outside and the
hydrophobic membrane environment inside.
Fluorescence anisotropy elucidates the global rotational
freedom and the local dynamics surrounding the Trp residues in
a protein.47, 48 This method is very convenient to study the
DNA-protein and protein-protein interaction.47, 49 The effect of
the macromolecular size of LPS on a peptide can be well
correlated by measuring their anisotropy values. As the free
peptides in the solution rotate and tumble rapidly, the rotational
diffusion rate will be faster compared to the emission rate of the
excited state. Hence, the emitted light will be depolarized to the
maximum and the anisotropy will average to zero. Whereas, in
LPS, the movement of the peptide will be restricted due to the
formation of large molecular weight assembly, which increases
the rotational correlation time. This, consequently polarize the
emitted light to the extent the anisotropy is present (Fig. 10D-
F). Fluorescence anisotropy technique exploits this degree of
polarization of the emission, caused by the increase in
correlation time of the complex. In our case, the degree of
Page 7 of 17 Molecular BioSystems
Mol
ecul
arB
ioS
yste
ms
Acc
epte
dM
anus
crip
t
Publ
ishe
d on
25
Mar
ch 2
014.
Dow
nloa
ded
by B
ose
Inst
itute
on
26/0
3/20
14 0
6:01
:29.
View Article Online
DOI: 10.1039/C4MB00111G
Journal Name ARTICLE
This journal is © The Royal Society of Chemistry 2012 J. Name., 2012, 00, 1-3 | 8
Fig. 9. NMR derived three-dimensional structure of WR17, WG12, and WK10 in LPS micelle. (Upper panel) superposition of backbone atoms
(N, C ′ f twenty lowest energy structures of WR17 (A), WG12 (B), WK10 (C), KR8 (D) bound to LPS micelle, obtained from CYANA
2.1. (Middle panel) Ribbon representative average conformations of WR17 (A), WG12 (B), WK10 (C), and KR8 (D). (Lower panel) cartoon representative conformations of LPS-bound WR17 (A), WG12 (B), WK10 (C), and KR8 (D) showing side-chain positioning and backbone topology.
These figures were produced using PyMOL and Chimera.
anisotropy measured, demonstrates the formation of peptide-
LPS with longer correlation time depicting the motional
restriction of the peptide.
Disaggregation and fragmentation of LPS by the peptides
monitored by DLS and 31P NMR
LPS forms soluble aggregates in the aqueous solution due to its
inhomogeneous nature. However, the larger aggregated form of
LPS with higher molecular weight is more relevant for our
study from the biological point of view than its monomeric
form.50 It is noteworthy to mention that the capability of AMPs
to lyse the structure of LPS is strongly correlated with the
antimicrobial and anti-endotoxin properties of AMPs.51
Therefore, structural perturbation of LPS micelle by Bovine
lactoferrampin and its truncated peptides is examined using
Dynamic light scattering and 31P NMR techniques as described
below.
Dynamic light scattering (DLS), also known as the photon
correlation spectroscopy (PCS), is a technique used to measure
the Brownian motion (diffusion) and subsequently the size
distribution of an ensemble of particles in the solution. Here,
we measured the size distribution of the particle size of free
LPS micelles and peptide bound LPS using DLS. It was
observed that in the absence of AMPs, LPS micelles had a
broad distribution of particle sizes with a hydrodynamic
diameter of about ~534 nm (Fig. 11A). The high poly-dispersity
of ~72 % suggests that the LPS in free form gets aggregated
(Fig. 11A). However, in the presence of WR17 at a molar ratio
of 1:1, there is a drastic change in the aggregation pattern of
LPS with a reduced hydrodynamic diameter of about ~175 nm
(Fig. 11B). In addition, the poly-dispersity also decreased to
around ~40 %. Such observations demonstrate that addition of
WR17 causes an extensive disaggregation of large LPS
micelles into smaller fragments. Similarly, LPS micelle also
undergoes structural perturbation in the presence of both WG12
and WK10, with an apparent shift of hydrodynamic diameter
to ~200 nm and 230 nm, respectively (Fig. 11C-D). This is also
evident from the fact that the poly-dispersity values was
reduced to 67 % and 55 % for WG12 and WK10, respectively,
suggesting a modest disaggregation of the LPS micelle. In case
of KG11, KK9 and KR12, we found a minimal disruption of
aggregated state in LPS with negligible change in the
polydispersity (Fig. 11E-F). Therefore, these DLS results
undoubtedly point towards the fact that disruption of LPS
occurs as a result of interaction between native WR17 and its
shorter active forms WG12 and WK10 with LPS.
Further, 31P NMR experiment was performed to investigate
the plausible interaction between the phosphate groups of LPS
with the positive charge amino acid of WR17 or/and its
Page 8 of 17Molecular BioSystems
Mol
ecul
arB
ioS
yste
ms
Acc
epte
dM
anus
crip
t
Publ
ishe
d on
25
Mar
ch 2
014.
Dow
nloa
ded
by B
ose
Inst
itute
on
26/0
3/20
14 0
6:01
:29.
View Article Online
DOI: 10.1039/C4MB00111G
Journal Name ARTICLE
This journal is © The Royal Society of Chemistry 2012 J. Name., 2012, 00, 1-3 | 9
Fig. 10. Probing restricted dynamics of peptides (WR17, WG12 and WK10) in LPS micelle using REES
and Fluorescence Anisotropy experiments. The effect of change in excitation wavelengths on the emission
maxima of WR17 (A), WG12 (B), WK10 (C) in its free (blue circles) and LPS bound forms (red squares)
(Upper panel). A plot showing the change in Anisotropy values of WR17 (D), WG12 (E), and WK10 (F) as a function of concentration of LPS (lower panel).
analogues (Fig. 11G-I). As evident, the addition of WR17 to
LPS showed a chemical shift perturbation as well as line
broadening of the phosphate groups of LPS. Similar structural
perturbation was also observed for the naturally occurring
AMPs such as Paradaxin and melittin derived AMPs.34, 52
However, similar titration of WG12, with LPS showed
negligible chemical shift perturbation for phosphate groups of
LPS. The C-ter fragment, KR12 was unable to change neither
the chemical shift of the phosphate head groups of LPS nor any
line broadening was seen. Thus breakdown of large LPS
micelle into smaller fragments as found in case of WR17,
WG12 and WK10 can be considered to be responsible for the
plausible conformational exchange taking place between these
two species of LPS at an intermediate time scale (milli second
to the microsecond). We can safely exclude the alternate way of
interpreting the line-broadening effect, as a consequence of the
LPS aggregation, because results from DLS experiments
inferred a decrease in the hydrodynamic radius for LPS on
addition of WR17.
Docking based interaction analysis of peptides with LPS
Computational molecular modeling was carried out using
docking method to understand the structure function
relationship by analyzing the arrangement of the key amino
acids of the peptide fragments (WR17, WG12, WK10 and
KR8) over LPS moiety. Fig. 12 shows the docked conformation
of all peptides with respect to LPS. WR17, which is found to be
most active peptide from experimental results, showed a unique
orientation over LPS with a curvature of 45o in its structural
architecture (Fig. 12A). The structured N-ter region of WR17 is
aligned diagonally with respect to the long axis of LPS,
whereas, the unstructured C-ter end was oriented over
Glucosamine I and Glucosamine II of lipid A. Residues such as
Lys10, Asn14 and Arg17 are involved in strong hydrogen
bonding with the phosphate groups of LPS (ESI Table S1).
Such interaction is believed to be crucial for the peptide
fragment to initially get attached to the bacterial outer
b v “K13NKSR17” molecular anchor which,
subsequently enables the N-ter part of the peptide to penetrate
through the outer membrane architecture of gram negative
bacteria. Crucial hydrophobic/van-der-Waal interactions were
also found between Trp1, Leu3, Leu4, and Ala7 and acyl chain
of LPS which in turn is responsible for the activity and
stabilization of peptide structure in LPS (Fig. 12A). WG12 was
also stabilized by hydrogen bonds and salt bridge interaction
with Lipid A part of LPS, in addition to the hydrophobic
interactions existing between
Trp1, Leu3, Leu 4 and the acyl
chain of LPS (ESI Table S1).
Interestingly, the lack of
“K13NKSR17” g WG12
assisted salt bridge/hydrogen
bond formation between Lys2,
Lys6 and Lys10 and the
phosphate group of Lipid A
(Fig. 12B). On the other hand,
WK10 orients preferentially in
a diagonal manner over the
long axis of LPS (Fig. 12C).
Two hydrogen bonds were
found between the residues
Gln8 and Glu9 with LPS,
where the former acts as H-
bond donor and latter acts as H-
bond acceptor with specific
functional groups of LPS.
Similar to WR17, pronounced
hydrophobic interactions were
also seen in case of WK10,
with the acyl chain of LPS. The
shortest fragment KR8, showed
strong polar contacts between
the phosphate groups of LPS
and Lys13, Asn14, Lys15 and
Arg17 (Fig. 12D) (ESI Table S1). It is noteworthy that we did
not find any crucial hydrophobic interaction between this
fragment and LPS. Overall, the docking study agrees well with
our experimental results which suggest that the hydrophobic
interaction with LPS is crucial for peptide activity.
MD simulation of WR17 and its fragments with LPS
Tryptophan is one of the key residues, involved in the
hydrophobic interaction with acyl chain of LPS. This
interaction is quite crucial for the peptide to permeabilize the
membrane. Except WR17, this hydrophobic interaction was
totally absent for peptides such as WG12 and WK10, where
Trp1 was found to be exposed to the exterior solvent
throughout the time course of the simulation when simulated in
complex with single LPS moiety, as obtained from docking
studies. The hydrophobic interaction in WR17 is more
pronounced, because Leu3 and Leu4 made crucial contacts
being in close proximity to the acyl chains of the LPS. The
important feature observed in simulation of WR17 with single
LPS moiety is that, the charged residues such as Lys2, Ser5,
Lys6 and Lys13 always pointed its side chain towards the
solvent, whereas the hydrophobic residues like Trp1, Leu3,
Leu4 and Ala7 are buried within the acyl chains of LPS through
hydrophobic/van-der-Waal interactions. Overviews of the
Page 9 of 17 Molecular BioSystems
Mol
ecul
arB
ioS
yste
ms
Acc
epte
dM
anus
crip
t
Publ
ishe
d on
25
Mar
ch 2
014.
Dow
nloa
ded
by B
ose
Inst
itute
on
26/0
3/20
14 0
6:01
:29.
View Article Online
DOI: 10.1039/C4MB00111G
Journal Name ARTICLE
This journal is © The Royal Society of Chemistry 2012 J. Name., 2012, 00, 1-3 | 10
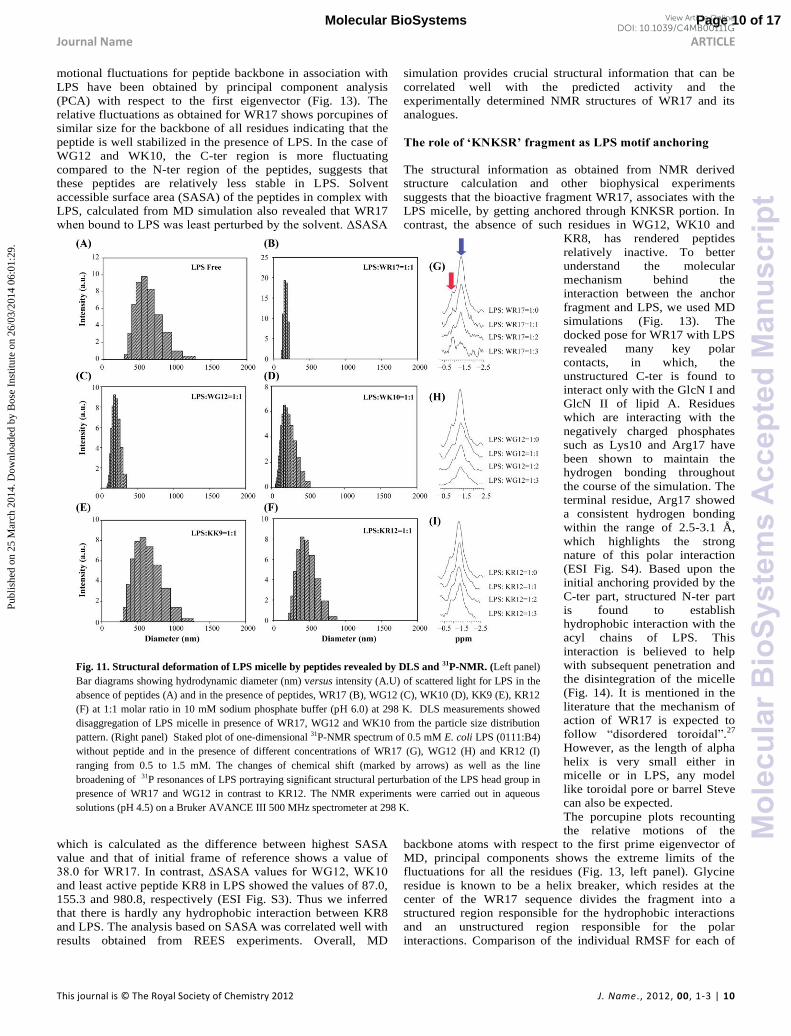
Fig. 11. Structural deformation of LPS micelle by peptides revealed by DLS and 31P-NMR. (Left panel)
Bar diagrams showing hydrodynamic diameter (nm) versus intensity (A.U) of scattered light for LPS in the
absence of peptides (A) and in the presence of peptides, WR17 (B), WG12 (C), WK10 (D), KK9 (E), KR12
(F) at 1:1 molar ratio in 10 mM sodium phosphate buffer (pH 6.0) at 298 K. DLS measurements showed
disaggregation of LPS micelle in presence of WR17, WG12 and WK10 from the particle size distribution
pattern. (Right panel) Staked plot of one-dimensional 31P-NMR spectrum of 0.5 mM E. coli LPS (0111:B4)
without peptide and in the presence of different concentrations of WR17 (G), WG12 (H) and KR12 (I)
ranging from 0.5 to 1.5 mM. The changes of chemical shift (marked by arrows) as well as the line
broadening of 31P resonances of LPS portraying significant structural perturbation of the LPS head group in
presence of WR17 and WG12 in contrast to KR12. The NMR experiments were carried out in aqueous
solutions (pH 4.5) on a Bruker AVANCE III 500 MHz spectrometer at 298 K.
motional fluctuations for peptide backbone in association with
LPS have been obtained by principal component analysis
(PCA) with respect to the first eigenvector (Fig. 13). The
relative fluctuations as obtained for WR17 shows porcupines of
similar size for the backbone of all residues indicating that the
peptide is well stabilized in the presence of LPS. In the case of
WG12 and WK10, the C-ter region is more fluctuating
compared to the N-ter region of the peptides, suggests that
these peptides are relatively less stable in LPS. Solvent
accessible surface area (SASA) of the peptides in complex with
LPS, calculated from MD simulation also revealed that WR17
b u u b b v . Δ A A
which is calculated as the difference between highest SASA
value and that of initial frame of reference shows a value of
38.0 f WR17. I Δ A A v u f WG12 WK10
and least active peptide KR8 in LPS showed the values of 87.0,
155.3 and 980.8, respectively (ESI Fig. S3). Thus we inferred
that there is hardly any hydrophobic interaction between KR8
and LPS. The analysis based on SASA was correlated well with
results obtained from REES experiments. Overall, MD
simulation provides crucial structural information that can be
correlated well with the predicted activity and the
experimentally determined NMR structures of WR17 and its
analogues.
The role of ‘KNKSR’ fragment as LPS motif anchoring
The structural information as obtained from NMR derived
structure calculation and other biophysical experiments
suggests that the bioactive fragment WR17, associates with the
LPS micelle, by getting anchored through KNKSR portion. In
contrast, the absence of such residues in WG12, WK10 and
KR8, has rendered peptides
relatively inactive. To better
understand the molecular
mechanism behind the
interaction between the anchor
fragment and LPS, we used MD
simulations (Fig. 13). The
docked pose for WR17 with LPS
revealed many key polar
contacts, in which, the
unstructured C-ter is found to
interact only with the GlcN I and
GlcN II of lipid A. Residues
which are interacting with the
negatively charged phosphates
such as Lys10 and Arg17 have
been shown to maintain the
hydrogen bonding throughout
the course of the simulation. The
terminal residue, Arg17 showed
a consistent hydrogen bonding
within the range of 2.5-3.1 Å,
which highlights the strong
nature of this polar interaction
(ESI Fig. S4). Based upon the
initial anchoring provided by the
C-ter part, structured N-ter part
is found to establish
hydrophobic interaction with the
acyl chains of LPS. This
interaction is believed to help
with subsequent penetration and
the disintegration of the micelle
(Fig. 14). It is mentioned in the
literature that the mechanism of
action of WR17 is expected to
f “ ”.27
However, as the length of alpha
helix is very small either in
micelle or in LPS, any model
like toroidal pore or barrel Steve
can also be expected.
The porcupine plots recounting
the relative motions of the
backbone atoms with respect to the first prime eigenvector of
MD, principal components shows the extreme limits of the
fluctuations for all the residues (Fig. 13, left panel). Glycine
residue is known to be a helix breaker, which resides at the
center of the WR17 sequence divides the fragment into a
structured region responsible for the hydrophobic interactions
and an unstructured region responsible for the polar
interactions. Comparison of the individual RMSF for each of
Page 10 of 17Molecular BioSystems
Mol
ecul
arB
ioS
yste
ms
Acc
epte
dM
anus
crip
t
Publ
ishe
d on
25
Mar
ch 2
014.
Dow
nloa
ded
by B
ose
Inst
itute
on
26/0
3/20
14 0
6:01
:29.
View Article Online
DOI: 10.1039/C4MB00111G
Journal Name ARTICLE
This journal is © The Royal Society of Chemistry 2012 J. Name., 2012, 00, 1-3 | 11
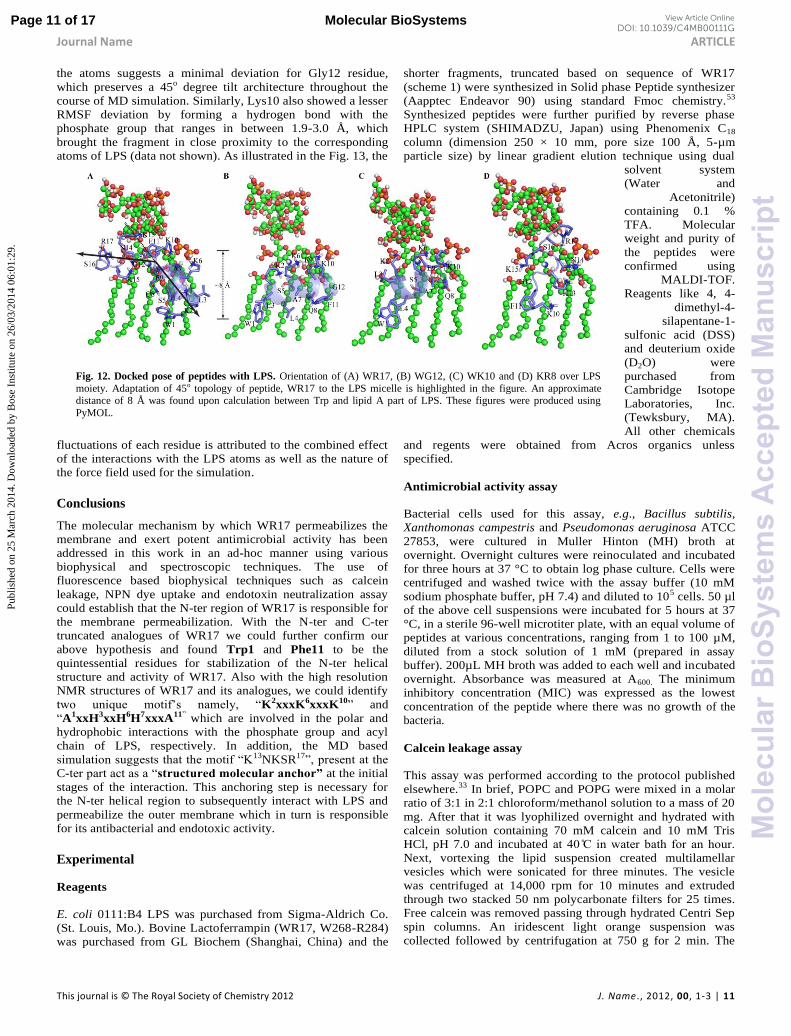
Fig. 12. Docked pose of peptides with LPS. Orientation of (A) WR17, (B) WG12, (C) WK10 and (D) KR8 over LPS
moiety. Adaptation of 45o topology of peptide, WR17 to the LPS micelle is highlighted in the figure. An approximate distance of 8 Å was found upon calculation between Trp and lipid A part of LPS. These figures were produced using
PyMOL.
the atoms suggests a minimal deviation for Gly12 residue,
which preserves a 45o degree tilt architecture throughout the
course of MD simulation. Similarly, Lys10 also showed a lesser
RMSF deviation by forming a hydrogen bond with the
phosphate group that ranges in between 1.9-3.0 Å, which
brought the fragment in close proximity to the corresponding
atoms of LPS (data not shown). As illustrated in the Fig. 13, the
fluctuations of each residue is attributed to the combined effect
of the interactions with the LPS atoms as well as the nature of
the force field used for the simulation.
Conclusions
The molecular mechanism by which WR17 permeabilizes the
membrane and exert potent antimicrobial activity has been
addressed in this work in an ad-hoc manner using various
biophysical and spectroscopic techniques. The use of
fluorescence based biophysical techniques such as calcein
leakage, NPN dye uptake and endotoxin neutralization assay
could establish that the N-ter region of WR17 is responsible for
the membrane permeabilization. With the N-ter and C-ter
truncated analogues of WR17 we could further confirm our
above hypothesis and found Trp1 and Phe11 to be the
quintessential residues for stabilization of the N-ter helical
structure and activity of WR17. Also with the high resolution
NMR structures of WR17 and its analogues, we could identify
u qu f’ “K2xxxK6xxxK10” and
“A1xxH3xxH6H7xxxA11” which are involved in the polar and
hydrophobic interactions with the phosphate group and acyl
chain of LPS, respectively. In addition, the MD based
u ugg f “K13NKSR17”
C- “structured molecular anchor” at the initial
stages of the interaction. This anchoring step is necessary for
the N-ter helical region to subsequently interact with LPS and
permeabilize the outer membrane which in turn is responsible
for its antibacterial and endotoxic activity.
Experimental
Reagents
E. coli 0111:B4 LPS was purchased from Sigma-Aldrich Co.
(St. Louis, Mo.). Bovine Lactoferrampin (WR17, W268-R284)
was purchased from GL Biochem (Shanghai, China) and the
shorter fragments, truncated based on sequence of WR17
(scheme 1) were synthesized in Solid phase Peptide synthesizer
(Aapptec Endeavor 90) using standard Fmoc chemistry.53
Synthesized peptides were further purified by reverse phase
HPLC system (SHIMADZU, Japan) using Phenomenix C18
column (dimension 250 × 10 mm, pore size 100 Å, 5-µm
particle size) by linear gradient elution technique using dual
solvent system
(Water and
Acetonitrile)
containing 0.1 %
TFA. Molecular
weight and purity of
the peptides were
confirmed using
MALDI-TOF.
Reagents like 4, 4-
dimethyl-4-
silapentane-1-
sulfonic acid (DSS)
and deuterium oxide
(D2O) were
purchased from
Cambridge Isotope
Laboratories, Inc.
(Tewksbury, MA).
All other chemicals
and regents were obtained from Acros organics unless
specified.
Antimicrobial activity assay
Bacterial cells used for this assay, e.g., Bacillus subtilis,
Xanthomonas campestris and Pseudomonas aeruginosa ATCC
27853, were cultured in Muller Hinton (MH) broth at
overnight. Overnight cultures were reinoculated and incubated
for three hours at 37 °C to obtain log phase culture. Cells were
centrifuged and washed twice with the assay buffer (10 mM
sodium phosphate buffer, pH 7.4) and diluted to 105 cells. 50 µl
of the above cell suspensions were incubated for 5 hours at 37
°C, in a sterile 96-well microtiter plate, with an equal volume of
peptides at various concentrations, ranging from 1 to 100 µM,
diluted from a stock solution of 1 mM (prepared in assay
buffer). 200µL MH broth was added to each well and incubated
overnight. Absorbance was measured at A600. The minimum
inhibitory concentration (MIC) was expressed as the lowest
concentration of the peptide where there was no growth of the
bacteria.
Calcein leakage assay
This assay was performed according to the protocol published
elsewhere.33 In brief, POPC and POPG were mixed in a molar
ratio of 3:1 in 2:1 chloroform/methanol solution to a mass of 20
mg. After that it was lyophilized overnight and hydrated with
calcein solution containing 70 mM calcein and 10 mM Tris
HCl, pH 7.0 and incubated 0 b f u .
Next, vortexing the lipid suspension created multilamellar
vesicles which were sonicated for three minutes. The vesicle
was centrifuged at 14,000 rpm for 10 minutes and extruded
through two stacked 50 nm polycarbonate filters for 25 times.
Free calcein was removed passing through hydrated Centri Sep
spin columns. An iridescent light orange suspension was
collected followed by centrifugation at 750 g for 2 min. The
Page 11 of 17 Molecular BioSystems
Mol
ecul
arB
ioS
yste
ms
Acc
epte
dM
anus
crip
t
Publ
ishe
d on
25
Mar
ch 2
014.
Dow
nloa
ded
by B
ose
Inst
itute
on
26/0
3/20
14 0
6:01
:29.
View Article Online
DOI: 10.1039/C4MB00111G
Journal Name ARTICLE
This journal is © The Royal Society of Chemistry 2012 J. Name., 2012, 00, 1-3 | 12
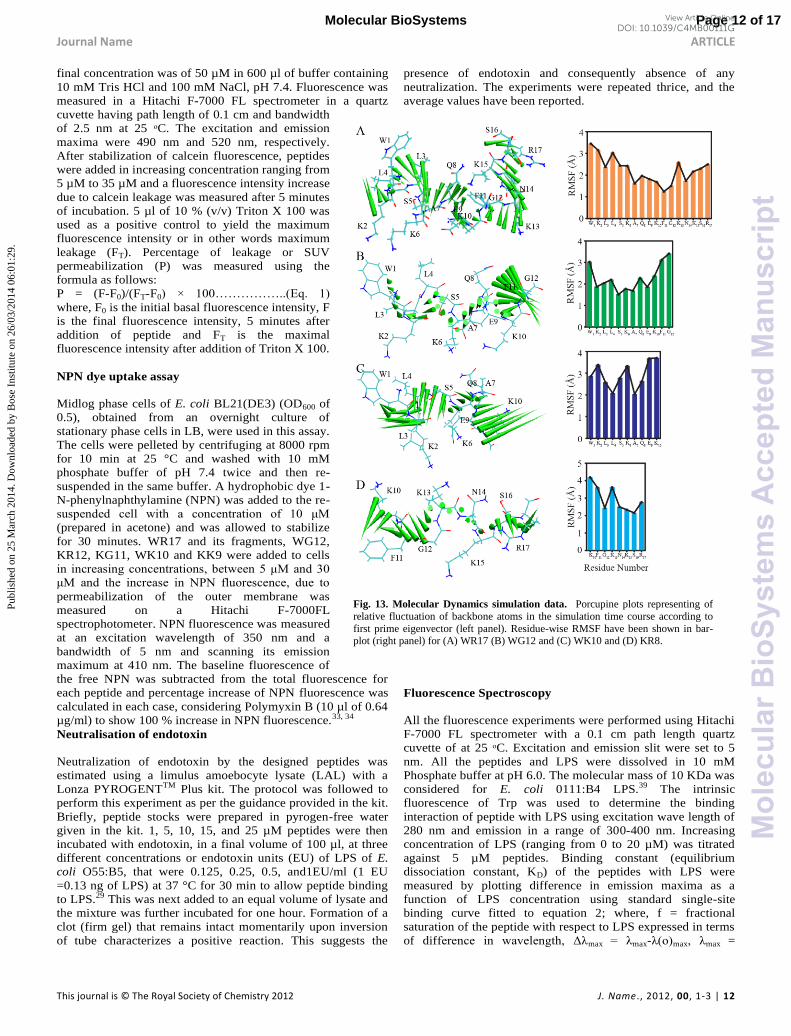
Fig. 13. Molecular Dynamics simulation data. Porcupine plots representing of
relative fluctuation of backbone atoms in the simulation time course according to
first prime eigenvector (left panel). Residue-wise RMSF have been shown in bar-plot (right panel) for (A) WR17 (B) WG12 and (C) WK10 and (D) KR8.
final concentration was of 50 µM in 600 µl of buffer containing
10 mM Tris HCl and 100 mM NaCl, pH 7.4. Fluorescence was
measured in a Hitachi F-7000 FL spectrometer in a quartz
cuvette having path length of 0.1 cm and bandwidth
of 2.5 nm at 25 ᵒC. The excitation and emission
maxima were 490 nm and 520 nm, respectively.
After stabilization of calcein fluorescence, peptides
were added in increasing concentration ranging from
5 µM to 35 µM and a fluorescence intensity increase
due to calcein leakage was measured after 5 minutes
of incubation. 5 µl of 10 % (v/v) Triton X 100 was
used as a positive control to yield the maximum
fluorescence intensity or in other words maximum
leakage (FT). Percentage of leakage or SUV
permeabilization (P) was measured using the
formula as follows:
P = (F-F0)/(FT-F0 × 100…………….. Eq. 1
where, F0 is the initial basal fluorescence intensity, F
is the final fluorescence intensity, 5 minutes after
addition of peptide and FT is the maximal
fluorescence intensity after addition of Triton X 100.
NPN dye uptake assay
Midlog phase cells of E. coli BL21(DE3) (OD600 of
0.5), obtained from an overnight culture of
stationary phase cells in LB, were used in this assay.
The cells were pelleted by centrifuging at 8000 rpm
for 10 min at 25 °C and washed with 10 mM
phosphate buffer of pH 7.4 twice and then re-
suspended in the same buffer. A hydrophobic dye 1-
N-phenylnaphthylamine (NPN) was added to the re-
u f 10 μ
(prepared in acetone) and was allowed to stabilize
for 30 minutes. WR17 and its fragments, WG12,
KR12, KG11, WK10 and KK9 were added to cells
g b μ 30
μ N N f u u
permeabilization of the outer membrane was
measured on a Hitachi F-7000FL
spectrophotometer. NPN fluorescence was measured
at an excitation wavelength of 350 nm and a
bandwidth of 5 nm and scanning its emission
maximum at 410 nm. The baseline fluorescence of
the free NPN was subtracted from the total fluorescence for
each peptide and percentage increase of NPN fluorescence was
calculated in each case, considering Polymyxin B (10 µl of 0.64
µg/ml) to show 100 % increase in NPN fluorescence.33, 34
Neutralisation of endotoxin
Neutralization of endotoxin by the designed peptides was
estimated using a limulus amoebocyte lysate (LAL) with a
Lonza PYROGENTTM Plus kit. The protocol was followed to
perform this experiment as per the guidance provided in the kit.
Briefly, peptide stocks were prepared in pyrogen-free water
given in the kit. 1, 5, 10, 15, and 25 µM peptides were then
incubated with endotoxin, in a final volume of 100 µl, at three
different concentrations or endotoxin units (EU) of LPS of E.
coli O55:B5, that were 0.125, 0.25, 0.5, and1EU/ml (1 EU
=0.13 ng of LPS) at 37 °C for 30 min to allow peptide binding
to LPS.29 This was next added to an equal volume of lysate and
the mixture was further incubated for one hour. Formation of a
clot (firm gel) that remains intact momentarily upon inversion
of tube characterizes a positive reaction. This suggests the
presence of endotoxin and consequently absence of any
neutralization. The experiments were repeated thrice, and the
average values have been reported.
Fluorescence Spectroscopy
All the fluorescence experiments were performed using Hitachi
F-7000 FL spectrometer with a 0.1 cm path length quartz
cuvette of at 25 ᵒC. Excitation and emission slit were set to 5
nm. All the peptides and LPS were dissolved in 10 mM
Phosphate buffer at pH 6.0. The molecular mass of 10 KDa was
considered for E. coli 0111:B4 LPS.39 The intrinsic
fluorescence of Trp was used to determine the binding
interaction of peptide with LPS using excitation wave length of
280 nm and emission in a range of 300-400 nm. Increasing
concentration of LPS (ranging from 0 to 20 µM) was titrated
against 5 µM peptides. Binding constant (equilibrium
dissociation constant, KD) of the peptides with LPS were
measured by plotting difference in emission maxima as a
function of LPS concentration using standard single-site
binding curve fitted to equation 2; where, f = fractional
saturation of the peptide with respect to LPS expressed in terms
of diff v g Δλmax = λmax-λ max λmax =
Page 12 of 17Molecular BioSystems
Mol
ecul
arB
ioS
yste
ms
Acc
epte
dM
anus
crip
t
Publ
ishe
d on
25
Mar
ch 2
014.
Dow
nloa
ded
by B
ose
Inst
itute
on
26/0
3/20
14 0
6:01
:29.
View Article Online
DOI: 10.1039/C4MB00111G
Journal Name ARTICLE
This journal is © The Royal Society of Chemistry 2012 J. Name., 2012, 00, 1-3 | 13
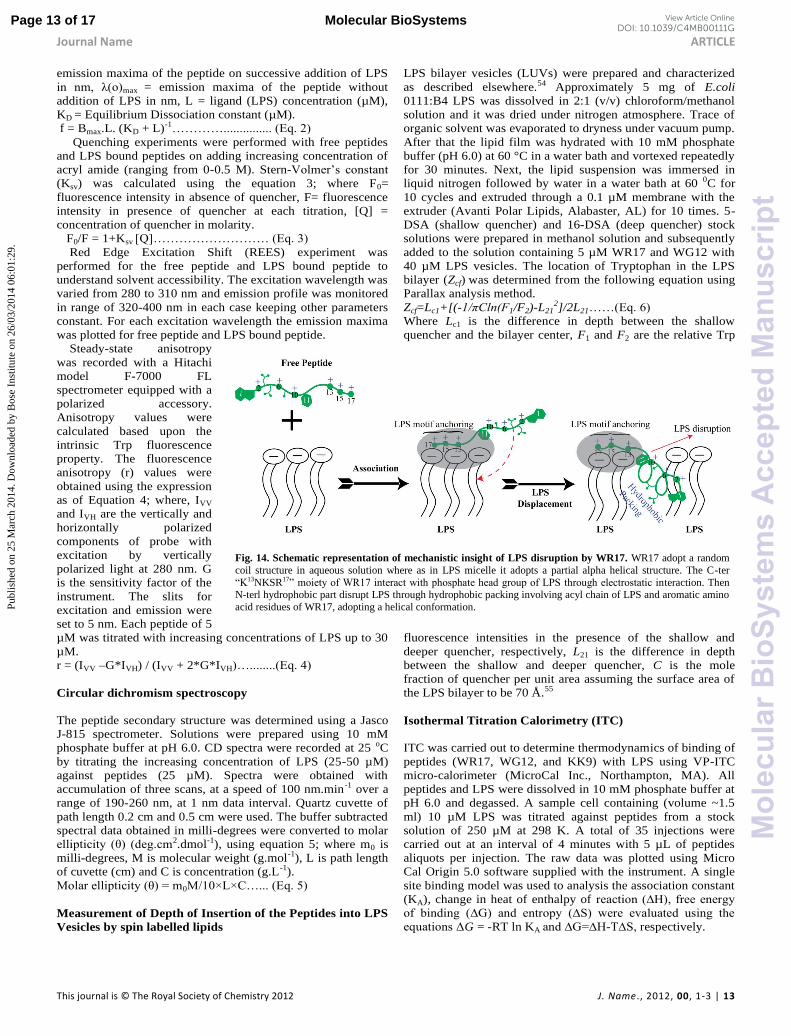
Fig. 14. Schematic representation of mechanistic insight of LPS disruption by WR17. WR17 adopt a random
coil structure in aqueous solution where as in LPS micelle it adopts a partial alpha helical structure. The C-ter
“K13NKSR17” f WR17 g u f ug teraction. Then N-terl hydrophobic part disrupt LPS through hydrophobic packing involving acyl chain of LPS and aromatic amino
acid residues of WR17, adopting a helical conformation.
emission maxima of the peptide on successive addition of LPS
λ max = emission maxima of the peptide without
addition of LPS in nm, L = ligand (LPS) concentration (µM),
KD = Equilibrium Dissociation constant (µM).
f = Bmax.L. (KD + L)-1…………............... Eq. 2
Quenching experiments were performed with free peptides
and LPS bound peptides on adding increasing concentration of
acryl amide (ranging from 0-0.5 M). Stern-V ’
(Ksv) was calculated using the equation 3; where F0=
fluorescence intensity in absence of quencher, F= fluorescence
intensity in presence of quencher at each titration, [Q] =
concentration of quencher in molarity.
F0/F = 1+Ksv [Q]……………………… Eq. 3
Red Edge Excitation Shift (REES) experiment was
performed for the free peptide and LPS bound peptide to
understand solvent accessibility. The excitation wavelength was
varied from 280 to 310 nm and emission profile was monitored
in range of 320-400 nm in each case keeping other parameters
constant. For each excitation wavelength the emission maxima
was plotted for free peptide and LPS bound peptide.
Steady-state anisotropy
was recorded with a Hitachi
model F-7000 FL
spectrometer equipped with a
polarized accessory.
Anisotropy values were
calculated based upon the
intrinsic Trp fluorescence
property. The fluorescence
anisotropy (r) values were
obtained using the expression
as of Equation 4; where, IVV
and IVH are the vertically and
horizontally polarized
components of probe with
excitation by vertically
polarized light at 280 nm. G
is the sensitivity factor of the
instrument. The slits for
excitation and emission were
set to 5 nm. Each peptide of 5
µM was titrated with increasing concentrations of LPS up to 30
µM.
r = (IVV –G*IVH) / (IVV + 2*G*IVH …........ Eq.
Circular dichromism spectroscopy
The peptide secondary structure was determined using a Jasco
J-815 spectrometer. Solutions were prepared using 10 mM
phosphate buffer at pH 6.0. CD spectra were recorded at 25 oC
by titrating the increasing concentration of LPS (25-50 µM)
against peptides (25 µM). Spectra were obtained with
accumulation of three scans, at a speed of 100 nm.min-1 over a
range of 190-260 nm, at 1 nm data interval. Quartz cuvette of
path length 0.2 cm and 0.5 cm were used. The buffer subtracted
spectral data obtained in milli-degrees were converted to molar
θ g. 2.dmol-1), using equation 5; where m0 is
milli-degrees, M is molecular weight (g.mol-1), L is path length
of cuvette (cm) and C is concentration (g.L-1).
θ = 0 /10× × …... Eq.
Measurement of Depth of Insertion of the Peptides into LPS
Vesicles by spin labelled lipids
LPS bilayer vesicles (LUVs) were prepared and characterized
as described elsewhere.54 Approximately 5 mg of E.coli
0111:B4 LPS was dissolved in 2:1 (v/v) chloroform/methanol
solution and it was dried under nitrogen atmosphere. Trace of
organic solvent was evaporated to dryness under vacuum pump.
After that the lipid film was hydrated with 10 mM phosphate
buffer (pH 6.0) at 60 °C in a water bath and vortexed repeatedly
for 30 minutes. Next, the lipid suspension was immersed in
liquid nitrogen followed by water in a water bath at 60 0C for
10 cycles and extruded through a 0.1 µM membrane with the
extruder (Avanti Polar Lipids, Alabaster, AL) for 10 times. 5-
DSA (shallow quencher) and 16-DSA (deep quencher) stock
solutions were prepared in methanol solution and subsequently
added to the solution containing 5 µM WR17 and WG12 with
40 µM LPS vesicles. The location of Tryptophan in the LPS
bilayer (Zcf) was determined from the following equation using
Parallax analysis method.
Zcf=Lc1+[(-1/πCln(F1/F2)-L212]/2L21…… Eq. 6
Where Lc1 is the difference in depth between the shallow
quencher and the bilayer center, F1 and F2 are the relative Trp
fluorescence intensities in the presence of the shallow and
deeper quencher, respectively, L21 is the difference in depth
between the shallow and deeper quencher, C is the mole
fraction of quencher per unit area assuming the surface area of
the LPS bilayer to be 70 Å.55
Isothermal Titration Calorimetry (ITC)
ITC was carried out to determine thermodynamics of binding of
peptides (WR17, WG12, and KK9) with LPS using VP-ITC
micro-calorimeter (MicroCal Inc., Northampton, MA). All
peptides and LPS were dissolved in 10 mM phosphate buffer at
pH 6.0 and degassed. A sample cell containing (volume ~1.5
ml) 10 µM LPS was titrated against peptides from a stock
solution of 250 µM at 298 K. A total of 35 injections were
carried out at an interval of 4 minutes with 5 µL of peptides
aliquots per injection. The raw data was plotted using Micro
Cal Origin 5.0 software supplied with the instrument. A single
site binding model was used to analysis the association constant
(KA), change in heat of enthalpy of ∆H f g
f b g ∆G ∆ v u u g
qu ΔG = -RT ln KA ∆G=∆H-T∆ respectively.
Page 13 of 17 Molecular BioSystems
Mol
ecul
arB
ioS
yste
ms
Acc
epte
dM
anus
crip
t
Publ
ishe
d on
25
Mar
ch 2
014.
Dow
nloa
ded
by B
ose
Inst
itute
on
26/0
3/20
14 0
6:01
:29.
View Article Online
DOI: 10.1039/C4MB00111G
Journal Name ARTICLE
This journal is © The Royal Society of Chemistry 2012 J. Name., 2012, 00, 1-3 | 14
Dynamic Light Scattering (DLS)
DLS experiments were performed using Malvern Zetasizer
Nano S (Malvern Instruments, UK) furnished with a 4-mW He-
Ne laser (λ= 633 nm) and 173° back scattering angle. 1 µM
LPS and LPS and peptide at a molar ratio of 1:1 were prepared
in 10 mM sodium phosphate (pH 6.0). All samples were filtered
using 0.45-µM filter papers (Whatman Inc) and degassed
before use and measured at 298 K using low volume disposable
sizing cuvette. The viscosity (0.8924) and refractive index
(1.330) of 10 mM sodium phosphate buffer were used for data
analysis.
NMR experiments
All NMR spectra were recorded at 288 K and/or 298 K with
Bruker AVANCE III 500 MHz NMR spectrometer, equipped
with a 5 mm SMART probe. Data acquisition and data
processing were carried out using TopspinTM v3.1 software
(Bruker Biospin, Switzerland). Two-dimensional total
correlation spectroscopy (TOCSY) and nuclear overhauser
effect spectroscopy (NOESY) spectra of free peptides and
peptide in LPS were acquired in aqueous solution containing
10% D2O at pH 4.5 with peptide concentration 1 mM. TOCSY
mixing time was 80 ms, whereas four different NOESY mixing
times, 80, 100, 150 and 200 ms were used for experiments.
DSS (2, 2-dimethyl-2-silapentane 5-sulfonate sodium salt) was
used as an internal standard (0.0 ppm). Two dimensional
trNOESY experiments were performed using 1 mM peptides by
titrating various concentrations of LPS ranging from 5 to 25
µM.
A series of one-dimensional proton-decoupled 31P NMR
u g B uk u g “zg g30”
recorded on a Bruker AVANCE III 500 MHz NMR
spectrometer to monitor LPS-peptide interactions at 298 K. The 31P NMR spectra of LPS of 0.5 mM concentration were
acquired with 3,072 scans. The sample was prepared by
dissolving 5 mg LPS in Milli Q water only and pH was adjusted
to 4.5. The LPS solution was then titrated with increasing
concentrations of WR17, WG12 and KR12.
Calculation of NMR derived structures
All the NMR structures of peptides were calculated by CYANA
program v2.1.56 NOE intensities were qualitatively
characterized as strong, medium, and weak based upon their
respective cross-peak intensities from trNOESY spectra
obtained at a mixing time of 150 ms in presence of LPS. This
was further translated to inter proton upper-bound distances of
3.0, 4.0 and 5.0 Å respectively. The lower bound distance was
kept constant at 2.0 Å. The backbone dihedral angle (phi) was
varied from -30o to -120o to restrict the conformational space
for all residues. No hydrogen bonding constrains were used for
structure calculation. Several round of structure refinements
were performed and based upon the NOE violations, the
distance restraints were adjusted accordingly. The twenty
lowest energy structures were selected to generate ensembles of
structures of peptides bund to LPS. The structures were
analyzed using pymol. The quality of the structures was
evaluated using PROCHECK and Protein Structure Validation
suite.57, 58 The calculated peptide structures in presence of LPS
were deposited in protein data bank (PDB) with pdb accession
codes: 2MD1, 2MD2, 2MD3 and 2MD4 for WR17, WK10,
KR8 and WG12, respectively.
Docking calculation of peptides with LPS
Docking calculation of all peptides with LPS was carried out
using AutoDock program.59 Coordinates of LPS were obtained
from pdb accession code 1QFG60 and for peptides (WR17,
WG12, WK10 and KR8) the trNOE derived structures were
used. Peptides were used as ligand in each docking
calculations, with rigid backbone and flexible side chains. A
grid spacing of 0.37 Å was used centering the H2 atom of
glucosamine II residue of LPS for grid preparation using
AutoGrid. All the energy-scoring grids have same size (grid
points 70 × 116 × 80) with external grid energy fixed to 1000.
Lamarckian genetic algorithm (LGA) was employed as search
engine (50 runs) and a LUDI type scoring function.61 Number
of individuals in each population was set to 150. Iteration steps
employed for energy evaluation was fixed to 2500,000 and
maximum number of generations was fixed to 27,000. The rate
of gene mutation and cross over was set to 0.02 and 0.8,
respectively. Rest of the parameters used for docking
calculations was set as default. Gasteiger-Marsilli charges were
used for docking calculations.62 A charge of +1 value was
added to each phosphorus atom to neutralize the system
according to Detering and Varani.63 The generated binding
conformations were grouped into clusters based on root-mean-
squared tolerance of 1 Å for analysis.
Molecular Dynamics Simulation
Molecular Dynamics (MD) simulation was employed to fetch
interaction and binding behavior of peptides in association with
LPS. AutoDock generated docked complex of peptide-LPS was
employed for MD simulation in explicit solvent (TIP3P water
models) conditions. Orthorhombic water box with minimum
distance of 10 Å from any heavy atom to box edge was
prepared with appropriate number of neutralizing counter ions.
MD simulation for 20 ns was performed using Desmond
package with OPLS-AA force field.64 The MD simulation
protocol used was similar to that of our previous study.65
Briefly before the production run, each system was processed
for energy minimization and equilibration steps. The energy
minimization step was performed in two steps; one with and
second without restraints over solute atoms. For equilibration
process, each system was first subjected to Berendsen
thermostat (NVT ensemble) at 10 K and restraints on solute
heavy atoms for 12 ps followed by 12 ps NPT simulation at 10
K with restraints on solute heavy atoms. The temperature was
then increased to 300 K and system was simulated for 24 ps
with Berendsen NPT ensemble with restraints on solute heavy
atoms. A final equilibration step was performed with Berendsen
NPT ensemble without any restraints for 24 ps before the
production run. A cutoff of 10 Å was used regarding the real-
space part of electrostatic and Lennard-Jones interactions.
RESPA integrator was used for long-range Coulomb
interactions and remaining interactions with time step of 6 fs
and 2 fs, respectively. M-SHAKE algorithm was used to
constraint the bond-lengths of hydrogen.66 Trajectories are
finally saved at an interval of 2 ps for analysis purpose.
PCA and SASA analysis
The MD simulation trajectory as obtained from Desmond was
converted into amber trajectory format using VMD.67 The
trajectory was then compressed for principal component
Page 14 of 17Molecular BioSystems
Mol
ecul
arB
ioS
yste
ms
Acc
epte
dM
anus
crip
t
Publ
ishe
d on
25
Mar
ch 2
014.
Dow
nloa
ded
by B
ose
Inst
itute
on
26/0
3/20
14 0
6:01
:29.
View Article Online
DOI: 10.1039/C4MB00111G
Journal Name ARTICLE
This journal is © The Royal Society of Chemistry 2012 J. Name., 2012, 00, 1-3 | 15
analysis (PCA) using PCAsuite
(http://mmb.pcb.ub.edu/software/pcasuite/). Two program file
viz. pcazip and pczdump was used for preparing average
structure for all peptides simulated with LPS. The average
structures of all peptides (backbone atoms only) are based on
first prime eigenvector. Porcupine plots were prepared to
represent the extremes and magnitude of fluctuations for
backbone atoms for all peptides interacting with LPS according
to the first principal component. Porcupine plots were prepared
using a script provided by Neidle group and visualized using
VMD program.68 Calculations of solvent accessible surface
area (SASA) have been executed using NACCESS program
(http://www.bioinf.manch ester.ac.uk/naccess/). MD snapshots
v v f 00 z . Δ A A v
been calculated as difference between highest SASA value and
that of 0 ns time snapshot.
Acknowledgements AB thanks DST FAST track (SR/FT/LS-100/2012) Govt. of
India and Institutional start up fund for financial support. SC
would like to thank DST, Government of India for Ramanujan
Fellowship. AG, AD and JJ thank CSIR, Government of India
for fellowship. The Central Instrument Facility (CIF) of Bose
Institute is greatly acknowledged for peptide synthesizer, CD,
Fluorescence, DLS and NMR instrument facilities. AB thanks
Prof. B. Bhattacharyya, Department of Biochemistry, Bose
Institute for allowing using the ITC machine and thanks to Mr.
Asim K. Poddar for helping in ITC experiment. We thank
Professor S. Neidle, University College London, UK for
providing the script to generate porcupine plots. Thanks to Dr.
K. Janarthan for critical reading of the manuscript. We thank
two anonymus referees for their suggestions to improve the
quality of the manuscript.
Notes and references aBiomolecular NMR and Drug Design Laboratory, Department of
Biophysics, Bose Institute, P-1/12 CIT Scheme VII (M), Kolkata 700054,
India. bSchool of Applied Sciences, Republic Polytechnic, 9 Woodlands Avenue
9, Singapore 738964. Authors contributed equally.
To whom correspondence should be addressed: Department of
Biophysics, Bose Institute, P-1/12 CIT Scheme VII (M), Kolkata 700054,
India, Telephone: +91-33-25693336; Fax: +91-33-23553886; Email:
[email protected] (SC), [email protected] (AB).
† The calculated peptide structures in presence of LPS were deposited in
protein data bank (PDB) with pdb accession codes: 2MD1, 2MD2, 2MD3
and 2MD4 for WR17, WK10, KR8 and WG12, respectively.
The abbreviations used are: Antimicrobial peptides, AMPs; NMR,
nuclear magnetic resonance; trNOE, transferred nuclear Overhauser
effect; NOESY, nuclear Overhauser effect spectroscopy; TOCSY, total
correlation spectroscopy; NOE, nuclear Overhauser enhancement; LPS,
lipopolysaccharide; DLS, Dynamic Light Scattering
*This work was supported by DST FAST track (SR/FT/LS-100/2012)
Govt. of India to AB.
Electronic Supplementary Information (ESI) available: [Figures S1-S4
and Table S1]. See DOI: 10.1039/b000000x/
References
1. G. Taubes, Science (New York, NY), 2008, 321, 356.
2. J. Cohen, Nature, 2002, 420, 885-891.
3. G. S. Martin, D. M. Mannino, S. Eaton and M. Moss, N. Engl. J.
Med., 2003, 348, 1546-1554.
4. E. T. Rietschel and O. Westphal, Endotoxin in health and disease,
1999, 1-30.
5. B. Beutler and E. T. Rietschel, Nat. Rev. Immunol., 2003, 3, 169-176.
6. P. A. Ward, Nat. Rev. Immunol., 2004, 4, 133-142.
7. S. I. Miller, R. K. Ernst and M. W. Bader, Nat. Rev. Microbiol., 2005,
3, 36-46.
8. S. Viriyakosol, P. S. Tobias, R. L. Kitchens and T. N. Kirkland, J.
Biol. Chem., 2001, 276, 38044-38051.
9. F. Re and J. L. Strominger, J. Biol. Chem., 2002, 277, 23427-23432.
10. P. Prohinar, F. Re, R. Widstrom, D. Zhang, A. Teghanemt, J. P.
Weiss and T. L. Gioannini, J. Biol. Chem., 2007, 282, 1010-
1017.
11. F. M. Walsh and S. G. Amyes, Curr. Opin. Microbiol., 2004, 7, 439-
444.
12. S. A. David, J. Mol. Recognit., 2001, 14, 370-387.
13. M. Zasloff, Nature, 2002, 415, 389-395.
14. H. Jenssen, P. Hamill and R. E. Hancock, Clin. Microbiol. Rev.,
2006, 19, 491-511.
15. M. I. van der Kraan, J. Groenink, K. Nazmi, E. C. Veerman, J. G.
Bolscher and A. V. Nieuw Amerongen, Peptides, 2004, 25,
177-183.
16. R. E. Hancock and M. G. Scott, PNAS, 2000, 97, 8856-8861.
17. K. A. Brogden, Nat. Rev. Microbiol., 2005, 3, 238-250.
18. R. E. Hancock, Lancet Infect. Dis., 2001, 1, 156-164.
19. H. VAN T, I. SIMOONS-SMIT and A. NIEUW, Biochem. J, 1997,
326, 39-45.
20. K. Matsuzaki, Biochim. Biophys. Acta., 1998, 1376, 391-400.
21. Y. Shai, Peptide Science, 2002, 66, 236-248.
22. E. F. Haney, K. Nazmi, F. Lau, J. G. Bolscher and H. J. Vogel,
Biochimie, 2009, 91, 141-154.
23. S. A. Moore, B. F. Anderson, C. R. Groom, M. Haridas and E. N.
Baker, J. Mol. Biol., 1997, 274, 222-236.
24. E. F. Haney, F. Lau and H. J. Vogel, Biochim. Biophys. Acta., 2007,
1768, 2355-2364.
25. W. C. Wimley and S. H. White, Nat. Struct. Biol., 1996, 3, 842-848.
26. S. H. White and W. C. Wimley, B Biochim. Biophys. Acta., 1998,
1376, 339-352.
27. A. Tsutsumi, N. Javkhlantugs, A. Kira, M. Umeyama, I. Kawamura,
K. Nishimura, K. Ueda and A. Naito, Biophys. J., 2012, 103,
1735-1743.
28. E. F. Haney, K. Nazmi, J. G. Bolscher and H. J. Vogel, Biochim.
Biophys. Acta., 2012, 1818, 762-775.
29. D. S. Snyder and T. J. McIntosh, Biochemistry (Mosc.), 2000, 39,
11777-11787.
Page 15 of 17 Molecular BioSystems
Mol
ecul
arB
ioS
yste
ms
Acc
epte
dM
anus
crip
t
Publ
ishe
d on
25
Mar
ch 2
014.
Dow
nloa
ded
by B
ose
Inst
itute
on
26/0
3/20
14 0
6:01
:29.
View Article Online
DOI: 10.1039/C4MB00111G
Journal Name ARTICLE
This journal is © The Royal Society of Chemistry 2012 J. Name., 2012, 00, 1-3 | 16
30. A. H. Delcour, Biochimica et Biochim. Biophys. Acta., 2009, 1794,
808-816.
31. P. N. Domadia, A. Bhunia, A. Ramamoorthy and S. Bhattacharjya,
JACS, 2010, 132, 18417-18428.
32. A. L. Russell, A. M. Kennedy, A. M. Spuches, D. Venugopal, J. B.
Bhonsle and R. P. Hicks, Chem. Phys. Lipids, 2010, 163, 488-
497.
33. P. N. Domadia, A. Bhunia, A. Ramamoorthy and S. Bhattacharjya,
JACS, 2010, 132, 18417-18428.
34. A. Bhunia, P. N. Domadia, J. Torres, K. J. Hallock, A. Ramamoorthy
and S. Bhattacharjya, J. Biol. Chem., 2010, 285, 3883-3895.
35. S. Bhattacharjya, S. A. David, V. Mathan and P. Balaram,
Biopolymers, 1997, 41, 251-265.
36. A. Bhunia, A. Ramamoorthy and S. Bhattacharjya, Chemistry., 2009,
15, 2036-2040.
37. C. B. Post, Curr. Opin. Struct. Biol., 2003, 13, 581-588.
38. K. Wuthrich, NMR of proteins and nucleic acids, Wiley, 1986.
39. L. Yu, M. Tan, B. Ho, J. L. Ding and T. Wohland, Anal Chim Acta,
2006, 556, 216-225.
40. A. Bhunia, H. Mohanram and S. Bhattacharjya, Peptide Science,
2009, 92, 9-22.
41. A. Bhunia, R. Saravanan, H. Mohanram, M. L. Mangoni and S.
Bhattacharjya, J. Biol. Chem., 2011, 286, 24394-24406.
42. J. R. Lakowicz, Principles of fluorescence spectroscopy, Springer,
2009.
43. A. P. Demchenko, Luminescence, 2002, 17, 19-42.
44. A. Chattopadhyay, Chem. Phys. Lipids, 2003, 122, 3-17.
45. A. Chattopadhyay and S. Mukherjee, Biochemistry (Mosc.), 1993, 32,
3804-3811.
46. A. Chattopadhyay and S. Mukherjee, J. Phys. Chem B., 1999, 103,
8180-8185.
47. D. M. Jameson and W. H. Sawyer, Methods Enzymol., 1995, 246,
283-300.
48. J. A. Ross, K. W. Rousslang and L. Brand, Biochemistry (Mosc.),
1981, 20, 4361-4369.
49. T. Heyduk, Y. Ma, H. Tang and R. H. Ebright, Methods Enzymol.,
1996, 274, 492-503.
50. M. Mueller, B. Lindner, S. Kusumoto, K. Fukase, A. B. Schromm
and U. Seydel, J. Biol. Chem., 2004, 279, 26307-26313.
51. Y. Rosenfeld, H.-G. Sahl and Y. Shai, Biochemistry (Mosc.), 2008,
47, 6468-6478.
52. A. Bhunia, P. N. Domadia and S. Bhattacharjya, Biochim. Biophys.
Acta., 2007, 1768, 3282-3291.
53. W. C. Chan and P. White, Fmoc solid phase peptide synthesis: a
practical approach, Oxford University Press on Demand,
2000.
54. A. Bhunia, H. Mohanram, P. N. Domadia, J. Torres and S.
Bhattacharjya, J. Biol. Chem., 2009, 284, 21991-22004.
55. A. Chattopadhyay and E. London, Biochemistry (Mosc.), 1987, 26,
39-45.
56. P. Güntert, C. Mumenthaler and K. Wüthrich, J. Mol. Biol., 1997,
273, 283-298.
57. Y. J. Huang, R. Powers and G. T. Montelione, JACS, 2005, 127,
1665-1674.
58. R. A. Laskowski, M. W. MacArthur, D. S. Moss and J. M. Thornton,
J. Appl. Crystallogr., 1993, 26, 283-291.
59. G. M. Morris, R. Huey, W. Lindstrom, M. F. Sanner, R. K. Belew, D.
S. Goodsell and A. J. Olson, J. Comput. Chem., 2009, 30,
2785-2791.
60. A. D Ferguson, W. Welte, E. Hofmann, B. Lindner, O. Holst, J. W.
Coulton and K. Diederichs, Structure, 2000, 8, 585-592.
61. H.-J. Böhm, J. Comput. Aided Mol. Des., 1992, 6, 61-78.
62. J. Gasteiger and M. Marsili, Tetrahedron Lett., 1978, 19, 3181-3184.
63. C. Detering and G. Varani, J. Med. Chem., 2004, 47, 4188-4201.
64. Desmond Molecular Dynamics System, version 2.2 (2009) D.E. Shaw
Research, New York, NY. Maestro-Desmond Interoperability
Tools, version 2.2, 2009 Schrodinger, New York, NY.
65. R. K. Kar, P. Suryadevara, J. Jana, A. Bhunia and S. Chatterjee, J
Biomol. Struct. Dyn, 2013, 31, 1497-1518.
66. V. Kräutler, W. F. van Gunsteren and P. H. Hünenberger, J. Comput.
Chem., 2001, 22, 501-508.
67. W. Humphrey, A. Dalke and K. Schulten, J. Mol. Graph., 1996, 14,
33-38.
68. S. Haider, G. N. Parkinson and S. Neidle, Biophys. J., 2008, 95, 296-
311.
Page 16 of 17Molecular BioSystems
Mol
ecul
arB
ioS
yste
ms
Acc
epte
dM
anus
crip
t
Publ
ishe
d on
25
Mar
ch 2
014.
Dow
nloa
ded
by B
ose
Inst
itute
on
26/0
3/20
14 0
6:01
:29.
View Article Online
DOI: 10.1039/C4MB00111G

Journal Name ARTICLE
This journal is © The Royal Society of Chemistry 2012 J. Name., 2012, 00, 1-3 | 17
Table of Contents
Mechanistic insights of the permeabilization of the outer membrane of gram negative bacteria of an antimicrobial
peptide, lactoferrampin, 17 residue peptide using high and low resolution spectroscopy in conjunction with MD
simulation.
Page 17 of 17 Molecular BioSystems
Mol
ecul
arB
ioS
yste
ms
Acc
epte
dM
anus
crip
t
Publ
ishe
d on
25
Mar
ch 2
014.
Dow
nloa
ded
by B
ose
Inst
itute
on
26/0
3/20
14 0
6:01
:29.
View Article Online
DOI: 10.1039/C4MB00111G
Related Documents