HAL Id: tel-01254036 https://tel.archives-ouvertes.fr/tel-01254036 Submitted on 12 Jan 2016 HAL is a multi-disciplinary open access archive for the deposit and dissemination of sci- entific research documents, whether they are pub- lished or not. The documents may come from teaching and research institutions in France or abroad, or from public or private research centers. L’archive ouverte pluridisciplinaire HAL, est destinée au dépôt et à la diffusion de documents scientifiques de niveau recherche, publiés ou non, émanant des établissements d’enseignement et de recherche français ou étrangers, des laboratoires publics ou privés. Study of cell membrane permeabilization induced by pulsed electric field – electrical modeling and characterization on biochip Claudia Trainito To cite this version: Claudia Trainito. Study of cell membrane permeabilization induced by pulsed electric field – electrical modeling and characterization on biochip. Other. Université Paris Saclay (COmUE), 2015. English. NNT : 2015SACLN008. tel-01254036

Welcome message from author
This document is posted to help you gain knowledge. Please leave a comment to let me know what you think about it! Share it to your friends and learn new things together.
Transcript
HAL Id: tel-01254036https://tel.archives-ouvertes.fr/tel-01254036
Submitted on 12 Jan 2016
HAL is a multi-disciplinary open accessarchive for the deposit and dissemination of sci-entific research documents, whether they are pub-lished or not. The documents may come fromteaching and research institutions in France orabroad, or from public or private research centers.
L’archive ouverte pluridisciplinaire HAL, estdestinée au dépôt et à la diffusion de documentsscientifiques de niveau recherche, publiés ou non,émanant des établissements d’enseignement et derecherche français ou étrangers, des laboratoirespublics ou privés.
Study of cell membrane permeabilization induced bypulsed electric field – electrical modeling and
characterization on biochipClaudia Trainito
To cite this version:Claudia Trainito. Study of cell membrane permeabilization induced by pulsed electric field – electricalmodeling and characterization on biochip. Other. Université Paris Saclay (COmUE), 2015. English.�NNT : 2015SACLN008�. �tel-01254036�
NNT : 2015SACLN008
THESE DE DOCTORAT DE L’UNIVERSITE PARIS-SACLAY,
préparée à l’Ecole Normale Supérieure Cachan
ÉCOLE DOCTORALE N°575 Physique et ingénierie : électrons, photons, sciences du vivant (EOBE)
Spécialité de doctorat : Physique
Par
M.lle Claudia Irene Trainito
Study of cell membrane permeabilization induced by pulsed electric field : electrical modelling and characterization on microfluidic biochip
Thèse présentée et soutenue à Cachan, le 04 décembre 2015 : Composition du Jury : M.me Marie-Pierre Rols, Directeur de Recherche, IPBS-CNRS, Rapporteur M. Christian Bergaud, Directeur de Recherche, LAAS-CNRS, Rapporteur M.me Anne-Marie Haghiri, Directeur de Recherche, LPN-CNRS Président M.me Gaëlle Lissorgues, Professeur, l'ESIEE-Paris, Examinatrice M. Thibault Honegger, Chargé de recherche, LTM–CNRS-CEA, Examinateur M. Bruno Le Pioufle, Professeur, ENS Cachan, Directeur de thèse M. Olivier Français, Maître de conférences, ENS Cachan, Co-directeur de thèse

Université Paris-Saclay Espace Technologique / Immeuble Discovery
Route de l’Orme aux Merisiers RD 128 / 91190 Saint-Aubin, France
TABLE OF CONTENTS
TABLEOFCONTENTS
Listofabbreviations............................................................................................................1
Introduction...........................................................................................................................3
1.Theinteractionbetweenelectricfieldandbiologicalspecies.........................9
1.1 Theelectricfieldtohandlebiologicalparticle......................................................13
1.1.1 Dielectrophoresis.......................................................................................................................15
1.1.2 Travelling-wavedielectrophoresis....................................................................................20
1.1.3 Electrorotation............................................................................................................................21
1.1.4 Electro-hydrodynamiceffects..............................................................................................23
1.2 Electropermeabilization:basicsandmechanisms................................................27
1.2.1 Theelectroporationand/ortheelectropermeabilizationtheor(y)ies...............34
1.2.2 The“poreformation”theory.................................................................................................35
1.2.3 Thelipidbilayer“destabilization”theory.......................................................................37
1.2.4 Thecombinedtheory...............................................................................................................39
1.3 Theinfluentialparameters...........................................................................................40
1.3.1 Thepulsesamplitudeandduration...................................................................................40
1.3.2 Thepulsecount...........................................................................................................................42
1.3.3 Thepulseshape..........................................................................................................................42
1.3.4 Thepulserepetitionfrequency............................................................................................43
1.4 Thecellmembraneelectropermeabilization:applications...............................44
1.4.1 Theapplicationsinindustry.................................................................................................45
1.4.2 Applicationsinmedicine........................................................................................................51
1.5 Conclusion...........................................................................................................................56
TABLE OF CONTENTS
2. Bioimpedancemeasurementasamethodtomonitorbiologicaltissue
permeabilization................................................................................................................59
2.1 Theimpedancespectroscopy.......................................................................................60
2.2 Electricalmodelfortissue.............................................................................................67
2.3 Materialandmethod:Impedancemeasurementtechnique.............................71
2.3.1 Theelectrode-tissueinterface..............................................................................................71
2.3.2 Theimpedancemeasurementsmethods.........................................................................73
2.3.3 The4-pointsprobesmethod.................................................................................................74
2.3.4 The2-pointsprobesmethod.................................................................................................75
2.3.5 Fittingalgorithmforthedeterminationoftheelectricalelements.....................77
2.4 Bioimpedancechangesduetoelectroporation......................................................79
2.4.1 Degreeoftissuepermeabilization......................................................................................80
2.4.2 Instrumentationandexperimentalsetup.......................................................................83
2.4.3 Influenceofpulsesparametersonthetissuepermeabilization............................84
2.4.4 EffectofelectropermeabilizationwithrespecttoCole-Coleequation...............88
2.5 Frombioimpedancetoelectrorotation-theimportanceofthe
miniaturization............................................................................................................................91
3. Monitoringthepermeabilizationofasinglecellinamicrofluidicdevice
withacombineddielectrophoresisandelectrorotationtechnique.................93
3.1 Thecellanditsdielectricproperties.........................................................................95
3.2 Thecellpolarizationduetoelectricfieldapplication.........................................99
3.2.1 DielectrophoresisandfCM....................................................................................................102
3.2.2 TravelingWaveDielectrophoresisandfCM..................................................................105
3.2.3 ElectrorotationandfCM.........................................................................................................106
3.2.4 Pulsedelectricfield................................................................................................................109
3.3 Materialandmethod:Combinationofelectricsolicitationsforcell
manipulation..............................................................................................................................110
3.3.1 Thedesignoftheelectrodesstructure..........................................................................110
3.3.2 Thebiochipfabrication........................................................................................................114
TABLE OF CONTENTS
3.3.3 Theexperimentalplatform.................................................................................................115
3.3.4 Fittingofdielectricproperties..........................................................................................117
3.4 TheThermaleffect........................................................................................................119
3.5 ThepermeabilizationanalysiswiththecombinedDEPandROTtechniques.
124
3.5.1 Thedielectricpropertiesestimation..............................................................................125
3.6 Electrorotationexperimenttodetectcancerprogression..............................128
3.7 Electrorotationasaversatiletooltoestimatedielectricpropertiesofmulti-
scalebiologicalsamples.........................................................................................................131
4. Thespheroid,apromising“invitro”modelfortumoranalysis:towards
thepermeabilizationstudy..........................................................................................133
4.1 Themulticellularspheroid.........................................................................................135
4.2 Spheroid:amodelforelectropermeabilization..................................................138
4.2.1 Comparisonbetweencellinsuspensionandspheroid..........................................141
4.3 Materialandmethod:Studyofspheroid’spermeabilizationthroughthe
combinedDEPandROTtechnique.....................................................................................142
4.3.1 Thespheroidmodeling.........................................................................................................143
4.4 Themulticellularspheroidpreparation................................................................148
4.5 Thespheroidforpermeabilizationstudy.............................................................150
4.6 Conclusion........................................................................................................................153
Conclusionandperspectives.......................................................................................155
ANNEXA-FittingalgorithmimplementedonMatlab®.....................................159
References.........................................................................................................................167
Listofpublications..........................................................................................................182

TABLE OF CONTENTS
LIST OF ABBREVIATIONS
Pag. 1
List of abbreviations
EF Electric Field
DC Direct Current
fCM Clauisus-Mossoti factor
DEP Dielectrophoresis
c-DEP conventional Dielectrophoresis
nDEP negative Dielectrophoresis
pDEP positive Dielectrophoresis
TW-DEP Travelling Dave Dielectrophoresis
ROT Electrorotation
PEF Pulsed Electric Field
BP Before Pulses application
AP After Pulses application
MD Molecular Dynamics
NTIRE Nonthermal Irreversible Electroporation
IRE Irreversible Electroporation
CPE Constant Phase Element

LIST OF ABBREVIATIONS
Pag. 2
INTRODUCTION
Pag. 3
Introduction
Microsystems dedicated to the characterization and manipulation of cells provides
innovative tools for the research in molecular biology and leads the development of new
treatments to better face illness such as leukemia or cancer.
In this PhD work we focus on the use of microfluidic devices for the sensing of
electrical properties of single cell or cell tissue in order to understand qualitatively and
quantitatively the effect of the pulsed electric field. In particular, one of our main
objectives is to measure the electrical parameters of the main cellular compartments
such as the cytoplasm and membrane to model the behavior of cells exposed to an
electric solicitation. Moreover the study of the interaction between the electric field and
single cells is a complementary approach to larger scale investigation that involves
cellular tissues.
The research of microfluidic devices for the biology is at the conjunction of several
disciplines since it involves electrical screening, optics, electronics, microfluidics and
biology.
Since 80’s the use of the electric field to treat or to monitor living cells leads to new
promising ways of investigation in research laboratories and industry: cancer diagnosis,
electrochemotherapy (insertion of a drug permeabilizing cell membranes), gene therapy
(insertion of a therapeutic gene), immunotherapy (anti-tumor vaccines obtained by
electrofusion of dendritic cells and cancer cells to reactivate the immune system).
INTRODUCTION
Pag. 4
The application of electrical pulses to cells or tissue induces a change on their
properties, especially on their membrane that becomes transiently permeable by
temporarily allowing the passage of ions and macromolecules.
Phenomena induced by cell membrane permeabilization due to the electric field
application were partially characterized by epi-fluorescence microscopy. However this
approach is static, thus a real-time monitoring of the dynamics of the electroporation
process is possible by electrical measurements.
This work has as main objective to implement a real-time monitoring of electrical
characteristics changes, within a wide frequency range, of a cellular tissue or a single
cell, before, during and after the solicitation induced by a pulsed electric field.
A model of the biological system is proposed to better describe phenomena observed
experimentally: the effect of electrical stress on cell viability, on the permeability of the
outer membrane, induced effects on the intracellular compounds, dynamics of
membrane fusion.
The degree of permeabilization of the biological sample (cell or cell tissue) is highly
dependent on many parameters in non linear way, which makes difficult the precise
interpretation of the phenomena.
The control in real time of the permeabilization represents a way to implement
customized treatments where the electric solicitation is inhibited once the desired degree
of permeabilization is achieved.
Eventually, this control system of the cell membrane permeabilization could be
massively parallelized on a dedicated biochip for the electroporation of many cells,
prior to cell fusion or integration of therapeutic vectors.
A multi-scale effects consideration provides a complete overview of the phenomenon,
thus
INTRODUCTION
Pag. 5
our study was carried on by approaching several models within the range of the tissue
(millimeter scale) till the single cell (micromiter scale) by passing by the intermediate
scales (cell spheroids characterization).
In the latter two cases (spheroid, single cell) the biological sample is isolated in a
microfluidic biochip where a specific electrodes structure had been designed
(micrometer scale).
The first chapter introduces the AC electrokinetic techniques to manipulate, capture and
separate bioparticles, indeed different electric field solicitations such as
dielecrophoresis, travelling-wave dielectrophoresis and electrorotation are presented. In
addition basics and mechanisms of electroporation are discussed. The chapter deals with
the debate about the permeabilization theories (electropermeabilization vs
electroporation) and finally accomplishes their combination.
It also shows the influence of each pulses electric parameters on the permeabilization
and how those parameters can be set in order to introduce small molecules or
macromolecules into the cell or in order to achieve cell membrane electrofusion. In all
these applications, cell viability has to be preserved.
Being a very general method, the electroporation is applicable to different cell types and
it can be used for various purposes. In medicine it is used for electrochemotherapy and
gene-therapy. In biotechnology it is used for water and liquid food sterilization and for
transfection of bacteria, yeast, plant protoplast, and intact plant tissue. A fully
understanding of the phenomenon of electroporation, its mechanisms and its parameters
optimization is a prerequisite for successful treatment.
The second chapter focuses on the permeabilization of the cell tissue, which is
investigated through the impedance spectroscopy. The degree of permeabilization of the
cell tissue is dependent on the characteristics of the PEF and governs the evolution of
the electrophysiological properties of the cells composing the exposed tissue, in
INTRODUCTION
Pag. 6
particular its bioimpedance. To characterize the electrochemical properties of biological
tissues we used the Cole-Cole model representing biological tissue as an equivalent
electric circuit with a low frequency resistor R0, a high frequency resistance R∞ and a
nonlinear fractional impedance CPE.
The influence of the pulse parameters (such as signal waveform, amplitude, pulse width,
pulse number) on the permeabilization of the cell membrane and thus on its electrical
properties is examined and discussed.
We finally proposed a combination of Cole-Cole model parameters to characterize the
level of tissue permeabilization.
The third chapter approaches the electrical characterization of the single cell
permeabilization. To do so, we designed a dedicated biochip where electrorotation
experiments are monitored in real time. The electrorotation allows the identification of
electro-physiological properties of cells by analyzing their rotational velocity when
submitted to a rotating electric field.
In the proposed system, the cell is captured between the electrodes by a stationary wave
(nDEP), a rotating electric field is then induced on the cell that consequently starts to
rotate. Analysis of the rotational speed of the cell gives as results the estimation of the
electrical properties of the bioparticles.
The application of this protocol before and after the application of electrical pulses
provides information about the real-time permeabilization at the microscopic level.
Qualitative and quantitative information about the cell permeabilization are thus
obtained.
Furthermore the chapter deals with the biochip conception, which was investigated to
obtain the best performance in terms of homogeneity of the electric solicitations
applied, and with the implementation of the estimation program, which has been chosen
for its robustness and its effectiveness.
INTRODUCTION
Pag. 7
The fourth chapter deals with the permeabilization at the intermediate scale biological
system: 3D cellular spheroids (human glioblastoma cell lines U87MG). Such cellular
organization provides a good model of cancer development and presents several
advantages for research laboratories compare to 2D cell culture and animal testing.
The chapter gives an overview of the electrical models through which the spheroids
dielectric properties were investigated, a first approach is finally proposed.
In our work the spheroid’s dielectric properties are determined by using the combined
electrorotation and dielctrophoresis techniques. Changes of the dielectric properties due
to the permeabilization process are discussed.

INTRODUCTION
Pag. 8
1. THE ELECTRIC FIELD TO HANDLE BIOLOGICAL SAMPLE
Pag. 9
Chapter 1
The interaction between electric field and biological
species
Since ancient times, before Newton enunciated the law of universal gravitation,
scientists thought that interactions between bodies could take place only in the presence
of their physical contact, or at least they put forward the hypothesis that there was a
slight matter, ether, also present in the vacuum as propagation medium capable of
transmitting the interaction from one point to another. From this erroneous, but
interesting theory the concept of force field came, indeed a vector field: a field that
associates to each point in space where it acts, a vector characterized by its own
magnitude and direction.
After Newton’s law draft, physicists attempted to solve the problem by assuming that
between massive bodies (or between electric charges) existed some forces that could
propagate instantaneously from one point in space to another, whatever the distance
between the interacting bodies and without a contact or a connection material. Later the
concept of instantaneous remote interaction was replaced with the concept of a field
which showed to be one of the most fruitful ideas in physics.
To take an example, Faraday hypothesized that a charge (or mass) in a given region of
space is able to perturb the surrounding space, thus if another charge (or another mass)
is introduced in the same region as the first ones, it can warn the disturbance generated
by it as a force acting on itself. This modification of space is known as a “field”. Space
1. THE ELECTRIC FIELD TO HANDLE BIOLOGICAL SAMPLE
Pag. 10
is not only the place where events take physical place but also it becomes a crucial
element of the interaction as the location of the field.
The main aspect of this new theory is that the field generated by the first body in a point
of the space exists independently from the fact that another body can be placed in that
space; actually the force acting on the possible second body is due to the pre-existing
field and it is not generated by the interaction force.
Suppose we have a piece of wood initially motionless in the water; by touching the
water with a second piece of wood even at a point far from the first, we can remark an
effect on the first one. The one, after a certain time, moves in response to the motion of
the other, we could thus conclude that between the two pieces of wood there is an
interaction and the water also perturbed the piece of wood. We could assert that the
water corresponds to the field.
The electric force provides an example of this contactless force between two bodies. An
electric charge acts on another electrical charge through an electrical field. This
interaction was formalized and deduced experimentally by Coulomb is known as
Coulomb's law. According to this law the force F exerted between two punctual charges
q1 and q2 (called test charge), placed in a vacuum at a distance d from each other, is
directly proportional to the product of the two charges and inversely proportional to the
square of their distance:
F =q1q2
4πεmediumε0.d
d3
(1.1)
where ε is the permittivity of the suspending medium and ε0 the permittivity of free
space.
Another example of contactless force is given by the gravitational field The Earth
modifies the physical properties of the surrounding space so that each body placed in its
1. THE ELECTRIC FIELD TO HANDLE BIOLOGICAL SAMPLE
Pag. 11
proximity feels its presence in the form of a force: the well-known gravitational force or
weight force. This force has a radial direction toward the center of the Earth and it is
given by:
F = gM * m
r2
"
# $
%
& ' (1.2)
where g is the gravitational constant (approximately 6.673×10⁻¹¹ N·(m/kg)2), M is the
mass of the Earth, m is the mass of the body interacting with the Earth and r is the
distance between the centers of masses.
Furthermore the gravitational field does not vary over time and it can thus be defined as
a stationary field.
If we consider a single charge, it induces a modification of the space that can be
expressed as:
E =
1
4πε
q
r2= −grad(V )
(1.3)
the latter, in the case of a uniform electric field due to a difference of potential ΔV
between two electrodes placed at a distance d, becomes:
E =ΔV
d (1.4)
Indeed, the electric field is a modification of the space produced by the charge
regardless of the presence of the second.
1. THE ELECTRIC FIELD TO HANDLE BIOLOGICAL SAMPLE
Pag. 12
In 1820, during some experiments with electrical circuits, it was realized that a
magnetic needle placed near a wire carrying current started to turn around itself, and
returned to its original position only if the charge flow was interrupted. There was a
close relationship between the electric and magnetic phenomena. Based on these
experiences, the French physicists Jean-Baptiste Biot, Félix Savart and André-Marie
Ampère found the exact relationships that bind the intensity of the current flowing
through a circuit and the magnetic force produced by the passage of charges. Ampere
studied the force acting between two circuits of length l carrying current, he discovered
that this force depends on the product of the current intensity i1 and i2 (increases with
increasing current) and is inversely proportional to the distance between the circuits d
(decreases when they are driven apart); also, is repulsive if the two currents flowing in
the same direction and attractive if the flow is in the opposite direction.
F =µ
0
2π
i1i2l
d (1.5)
where µ0 is the magnetic constant.
In electrical fields as well as in gravitational fields, the field lines are closed. Actually in
the first case, the positive and negative charges exist separately and in the gravitational
case there is only one 'charge', the mass. On the other side, a magnet always has two
poles and the lines of force are closed, the come out from one pole and enter to another.
When the electric field is due to particles in motion, a second component needs to be
taken into account, the induced electric field. This induced electric field E is directly
related to the magnetic field B created by these charges moving through the vector
potential A:
1. THE ELECTRIC FIELD TO HANDLE BIOLOGICAL SAMPLE
Pag. 13
! E = −
∂! A
∂t (1.6)
! B = ro
" t (! A ) (1.7)
An electromagnetic field is thus a combination of an electric field and a magnetic field.
The resultant force of this field called Lorentz force which is subjected a particle of
charge q moving at the speed v:
! F = q(
! E +! v ∧" B ) (1.8)
where E is the electric field and B is the magnetic field, they are furthermore expressed
in Maxwell equations [1].
1.1 The electric field to handle biological particle
A particle suspended in a medium influenced by an electric field can give place to
different effects according to its properties and to the field frequency.
Submitted to an electric field, a charged particle moves due to the Coulomb force; in
particular it moves towards the cathode if it’s positive charged, and it moves towards
the anode in the opposite case; this movement is known as “electrophoresis”. A neutral
particle, in the same case, just shows a polarization (free charges move through the
electrode with opposite charge), but it doesn’t move along any direction.
Alignment is possible if a particle is suspended in a non-uniform electric field, the
applied field induces a dipole inside the particle. The interaction between the non-
uniform field and the induced dipole generates a force, which induces movement of the
particle. If the particle is more polarizable than the dielectric medium, the dipole aligns
1. THE ELECTRIC FIELD TO HANDLE BIOLOGICAL SAMPLE
Pag. 14
with the field and moves in the direction of the field gradient. If the particle is less
polarizable than the medium, then the induced dipole moves against the field gradient.
Indeed it is possible to induce a polarization and a movement of the particle by using a
non- uniform electric field in two different ways: by using an electric field which is
non-uniform in amplitude (case of “conventional” dielectrophoresis), by using an
electric field which is non uniform in phase; the latter produces on particles a rotational
or linear movement (respectively cases of electrorotation and travelling-wave
dielectrophoresis) [2]
In the field of biology, a widely used separation method based on the application of a
DC electric field (DC Direct Current) on charged particles (DNA, proteins, etc.) in
order to migrate them to the opposite electrode is known as electrophoresis [3, 4]. Thus,
it is possible to separate different substances of a charged mixture, depending on several
parameters (such as size, shape, etc).
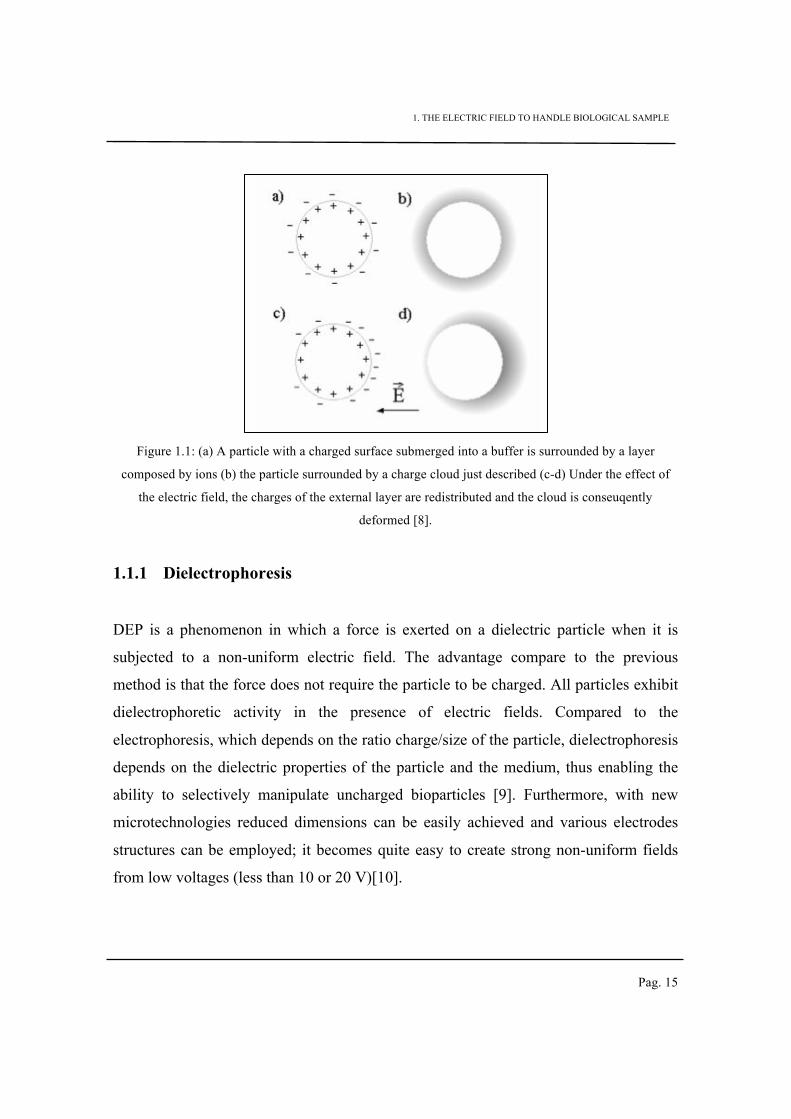
Biological species such as cells have surface chemical groups incline to loose or gain
ions when submerged into a buffer at a given pH. This is the case for example of the
carboxyl group (COOH), which has the tendency to loose the H+, leaving exposed the
COO- which is negatively charged, another example is given by the amines that can
combine with H+ to become positively charge [5]. Thus, the bilayer membrane confers
to the cell a surface charge [6] that finally results in an electric double layer around the
cell. Undergo the electric field application, this double layer is deformed [7], as shown
in Figure1.1.
1. THE ELECTRIC FIELD TO HANDLE BIOLOGICAL SAMPLE
Pag. 15
Figure 1.1: (a) A particle with a charged surface submerged into a buffer is surrounded by a layer
composed by ions (b) the particle surrounded by a charge cloud just described (c-d) Under the effect of
the electric field, the charges of the external layer are redistributed and the cloud is conseuqently
deformed [8].
1.1.1 Dielectrophoresis
DEP is a phenomenon in which a force is exerted on a dielectric particle when it is
subjected to a non-uniform electric field. The advantage compare to the previous
method is that the force does not require the particle to be charged. All particles exhibit
dielectrophoretic activity in the presence of electric fields. Compared to the
electrophoresis, which depends on the ratio charge/size of the particle, dielectrophoresis
depends on the dielectric properties of the particle and the medium, thus enabling the
ability to selectively manipulate uncharged bioparticles [9]. Furthermore, with new
microtechnologies reduced dimensions can be easily achieved and various electrodes
structures can be employed; it becomes quite easy to create strong non-uniform fields
from low voltages (less than 10 or 20 V)[10].
1. THE ELECTRIC FIELD TO HANDLE BIOLOGICAL SAMPLE
Pag. 16
In 1951 Pohl used for the first time the term "dielectrophoresis" referring to the induced
movement of a polarizable particle due to the action of a non-uniform electric field [2].
The word etymology suggests a Greek source, indeed “phoresis” in ancient Greek
meant movement while “dielectro” was chosen to evoke the origin of the phenomenon
that is the polarization of dielectric media under the effect of the field.
A cell can be electrically described as composed of an insulating membrane separating
the cytoplasm (modeled as a polarizable ionic solution) to the extracellular medium.
Each domain of this two- shell model (intra-cellular domain, membrane, extra-cellular
domain) is characterized by its dielectric properties: the conductivity σ and the
permittivity ε. This model is often simplified to the single shell model [11], where the
two inner concentric domains (the cytoplasm and the membrane) are simplified in one
homogenous equivalent domain, defined by its averaged complex permittivity
The exposure of such a system to an electric field E leads to its polarization, the cell in
such case behaves as an electrostatic dipole m and it is subjected to a force given by:
F
!"= (m!"∇!")E!"
(1.9)
The cells used within this thesis can be treated as of spherical objects, thus the
calculation of the dipole moment of such objects of radius r undergoing the action of an
electric field E and immersed in a medium of permittivity εm, is given by[12]:
m
!"= 4πεm fCM (ω)r
3E
!"
(1.10)
where fCM(ω) is the Clausius-Mossotti factor, strictly linked to the complex
permittivity of both the cell and the suspending medium:
1. THE ELECTRIC FIELD TO HANDLE BIOLOGICAL SAMPLE
Pag. 17
fCM =ε p
*−εm
*
ε p*+2εm
*
(1.11)
εi
*= ε0εr,i − j
σ i
ω (1.12)
where εi is the permittivity, σi is the conductivity and ω is the angular frequency of the
DEP signal [2].
Once defined the Force by the equation 1.9 and the dipolar moment as on the equation
1.10, a general expression for the time averaged dielectrophoresis force can be obtained
[13, 14] and it is valid for those cases when the nonuniformity of the electric field is due
to a spatial variation in its amplitude or its phase.
F(t) = 2πεmr3(Re[ fCM (ω)]∇Erms
2+ Im[ fCM (ω)] Erms
2
x,y,z
∑ ∇ϕ )
(1.13)
where E2RMS is the root mean square of the applied electric field and ϕ is its phase.
The first term of equation 1.13 determines the case of the stationary field where a
spatial variation of the amplitude confers the nonuniformity to the electric field, is
known as conventional DEP (c-DEP) and it is proportional to the real part of the
Clausius-Mossotti factor (Re [fCM])[2]. The second term of the equation 1.13 is given by
the spatial nonuniformity of the applied electric field phase, it is known as Travelling
wave dielectrophoresis (TW-DEP) and it depends on the imaginary part of the Clausius-
Mossotti factor (Im [fCM]) [15].
This c-DEP force drives the cell to the highest or lowest electric field regions,
depending on the difference in polarizability of the particle and the suspending medium.
The direction of the DEP force depends on the frequency of the applied signal, the
1. THE ELECTRIC FIELD TO HANDLE BIOLOGICAL SAMPLE
Pag. 18
volume of the cell, and the dielectric characteristics of both the cell and the external
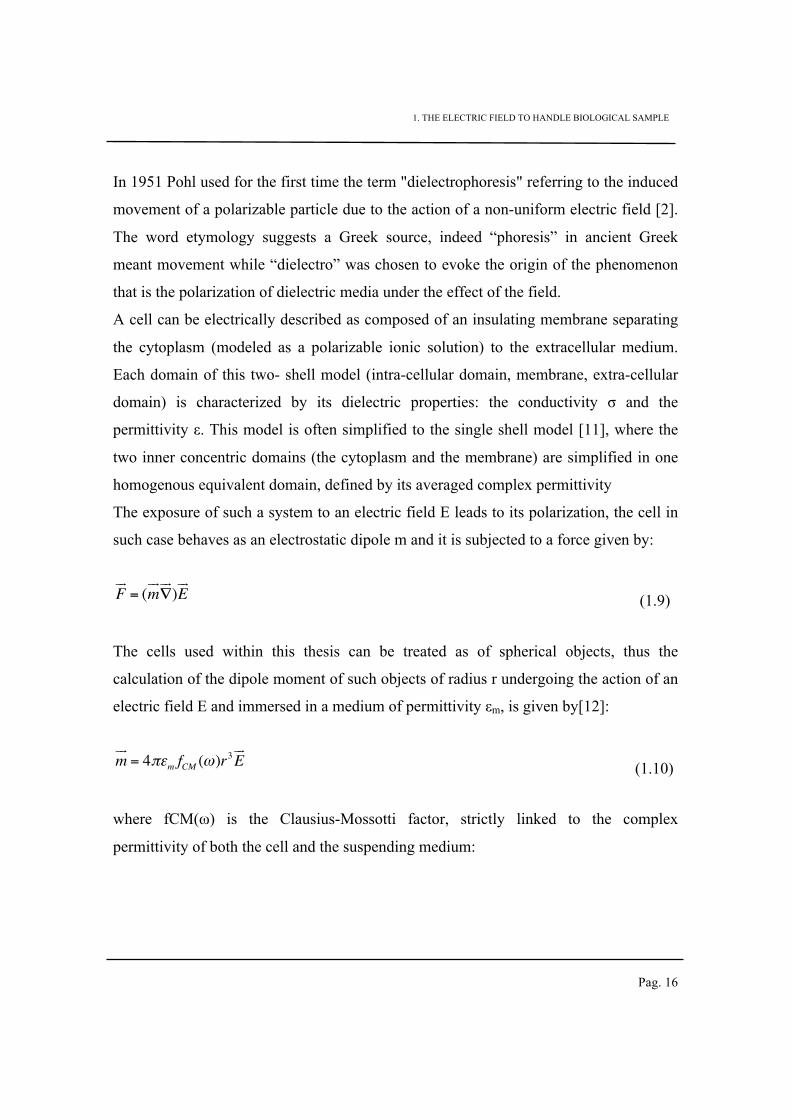
medium [2, 14, 16] (Figure 1.2).
Figure 1.2. (a) A spatial variation of the amplitude confers the nonuniformity to the eleectric field, case of
c-DEP [17]. (b) Plot of the Re[fCM(ω)] with respect to frequency of the applied electric field and
crossover frequencies.
It has been demonstrated [17, 18] that at low frequencies (f <100 kHz), the membrane
of the cell behaves as a dielectric having low losses and therefore a weak complex
conductivity. The membrane represents a barrier limiting the polarization of the
intracellular medium. On the other hand, the external medium shows a relatively low
resistance. The electric field consequently remains confined into the extracellular
medium and since the cell is less polarizable than the medium a negative
dielectrophoretic (nDEP) behavior is induced (the cell will move towards the lowest
electric field area) (Figure 1.2b).
When the frequency increases, the membrane gradually becomes more permeable to the
electric field. Therefore, if the intracellular medium is more conductive than the
extracellular medium, the cell is more polarizable than the medium and it will move
towards the highest electric field value (a positive dielectrophoretic behavior is shown
1. THE ELECTRIC FIELD TO HANDLE BIOLOGICAL SAMPLE
Pag. 19
by the cell, pDEP). In particular, this situation occurs when low conductivity media are
used for DEP experiments. On the contrary, if the cell is less polarizable than the
medium, the electric field will essentially remain confined and the cell will move
towards the lowest electric field area due to negative dielectrophoretic behavior. At high
frequency (f > 10 MHz), the permittivity becomes predominant. The external medium
has a permittivity (similar to water) much higher than that of the cell consisting of
water, but also of proteins and other large molecules less polarizable. The medium
becomes more polarizable than the cell, and once again negative dielectrophoresis
behavior dominate.
For any arbitrary shaped particle, the frequency which characterizes the passage to
nDEP to pDEP is given by [19]:
fcrossover =1
2π
(σ m −σ p )[σ m + A(σ p −σ m )]
(εp −εm )[εm + A(εp −εm )] (1.14)
where A represents the depolarization factor equal to 1/3 in the case of spherical shaped
particle.
Nowadays, the dielectrophoresis method is widely used for several purposes:
1) Handling, capture and separation of biological entities (eukaryotic cells [20, 21],
bacteria [22], yeasts [23], algae [24], DNA strand [3]) in microfluidic devices.
2) Efficient selection of different kind of cells [9]
3) Basic technique for cell electrofusion and cell electroporation [25, 26]
4) Assembly of carbon nanotubes or silicon nanowires [27, 28].
1. THE ELECTRIC FIELD TO HANDLE BIOLOGICAL SAMPLE
Pag. 20
1.1.2 Travelling-wave dielectrophoresis
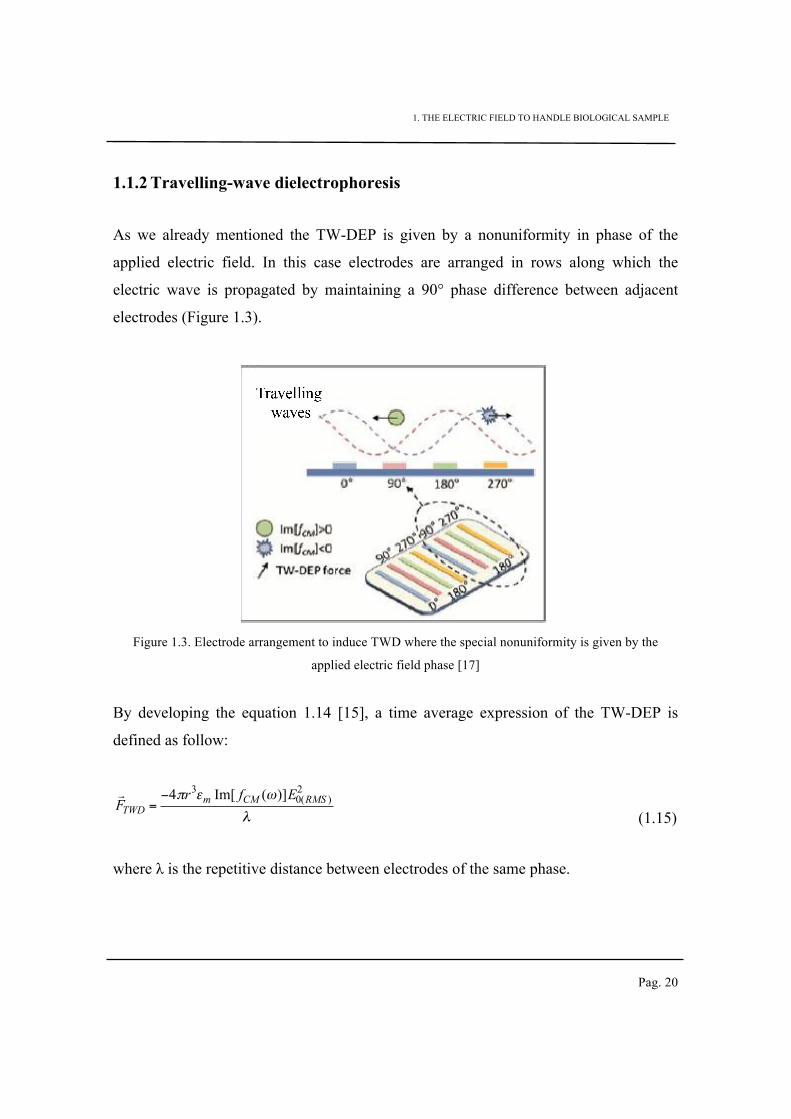
As we already mentioned the TW-DEP is given by a nonuniformity in phase of the
applied electric field. In this case electrodes are arranged in rows along which the
electric wave is propagated by maintaining a 90° phase difference between adjacent
electrodes (Figure 1.3).
Figure 1.3. Electrode arrangement to induce TWD where the special nonuniformity is given by the
applied electric field phase [17]
By developing the equation 1.14 [15], a time average expression of the TW-DEP is
defined as follow:
! F TWD =
−4πr3εm Im[ fCM (ω)]E0(RMS )
2
λ (1.15)
where λ is the repetitive distance between electrodes of the same phase.
1. THE ELECTRIC FIELD TO HANDLE BIOLOGICAL SAMPLE
Pag. 21
The direction of movement of the cell depends on the Clausius-Mossotti factor, and
therefore on the frequency of the applied field. If Im[fCM(ω)]>0, the cell will move
along the opposite direction respect to the applied electric field (the cell is directed on
the direction of increasing φ). Conversely, for Im[fCM (ω)]<0, the cell follows the path
of the electric wave (it moves in the direction corresponding to a decrease of φ).
1.1.3 Electrorotation
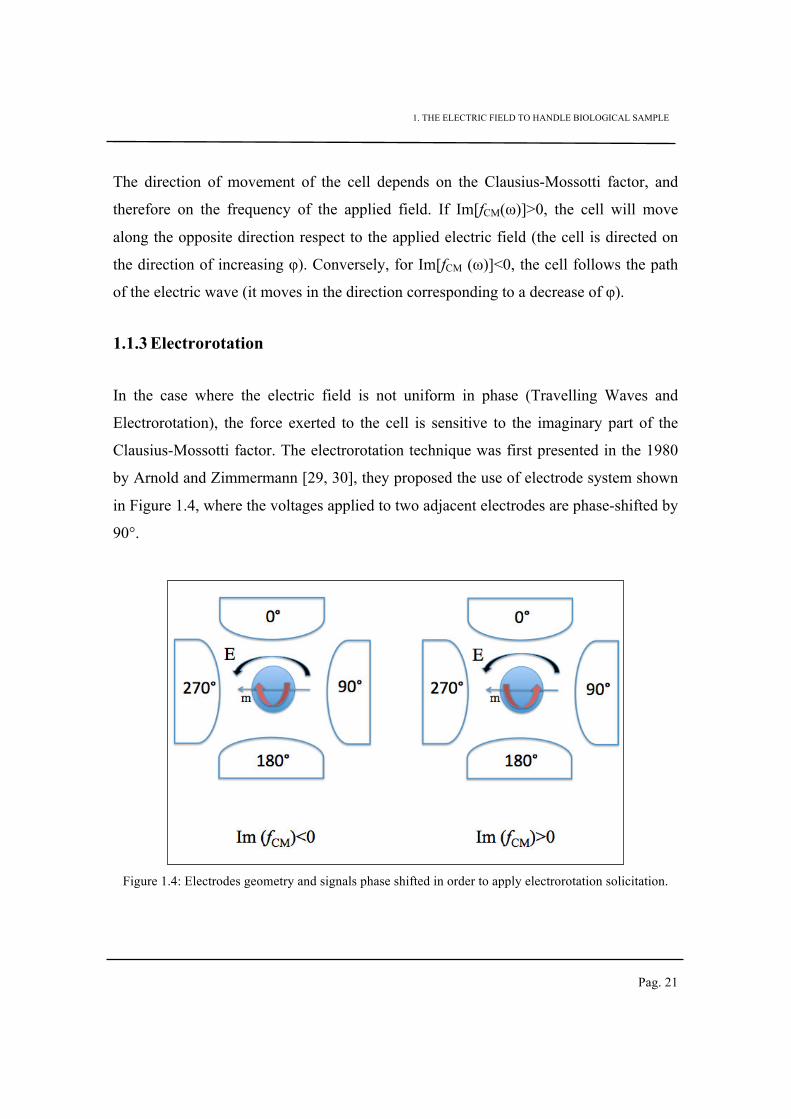
In the case where the electric field is not uniform in phase (Travelling Waves and
Electrorotation), the force exerted to the cell is sensitive to the imaginary part of the
Clausius-Mossotti factor. The electrorotation technique was first presented in the 1980
by Arnold and Zimmermann [29, 30], they proposed the use of electrode system shown
in Figure 1.4, where the voltages applied to two adjacent electrodes are phase-shifted by
90°.
Figure 1.4: Electrodes geometry and signals phase shifted in order to apply electrorotation solicitation.
1. THE ELECTRIC FIELD TO HANDLE BIOLOGICAL SAMPLE
Pag. 22
The rotating field E applies a torque to the cell, inducing its rotation (electro-rotation
phenomenon) [29]:
Γ!"=m×E
!"
(1.16)
From equation 1.10 and equation 1.16 a time average expression of the torque can be
defined [8]:
ΓROT (ω) = −4πεmr3Im[ fCM (ω)]E
2
(1.17)
Taking into account the rotational frictional force, the angular velocity of the cell
becomes [16]:
ΩROT (ω) = −ε0εm E2
2ηIm[ fCM (ω)]
(1.18)
where η is the dynamic viscosity of the medium.
When Im [fCM(ω)]> 0, the phase shift between the dipole moment and the electric field
is between 0 and 180 °, which induces an opposite direction of rotation of the cell
respect to the electric field. Conversely, when Im [fCM (ω)<0, the phase shift is between
-180 ° and 0 °, the direction of rotation of the cell is the same as the electric field.
To generate a rotating field a specific disposition, geometry, and powering of electrodes
is used (Figure 1.5 a). In our study, four planar polynomial electrodes were employed,
powered with four sinusoidal signals respectively 90° phase- shifted with the adjacent
ones.
The cell rotates with a velocity that depends on its dielectric properties and on the
frequency of the applied Electric Field (EF) across the imaginary part of the Clausius-
Mossotti factor [29, 31-33]. The electrorotation spectrum is defined as the rotational
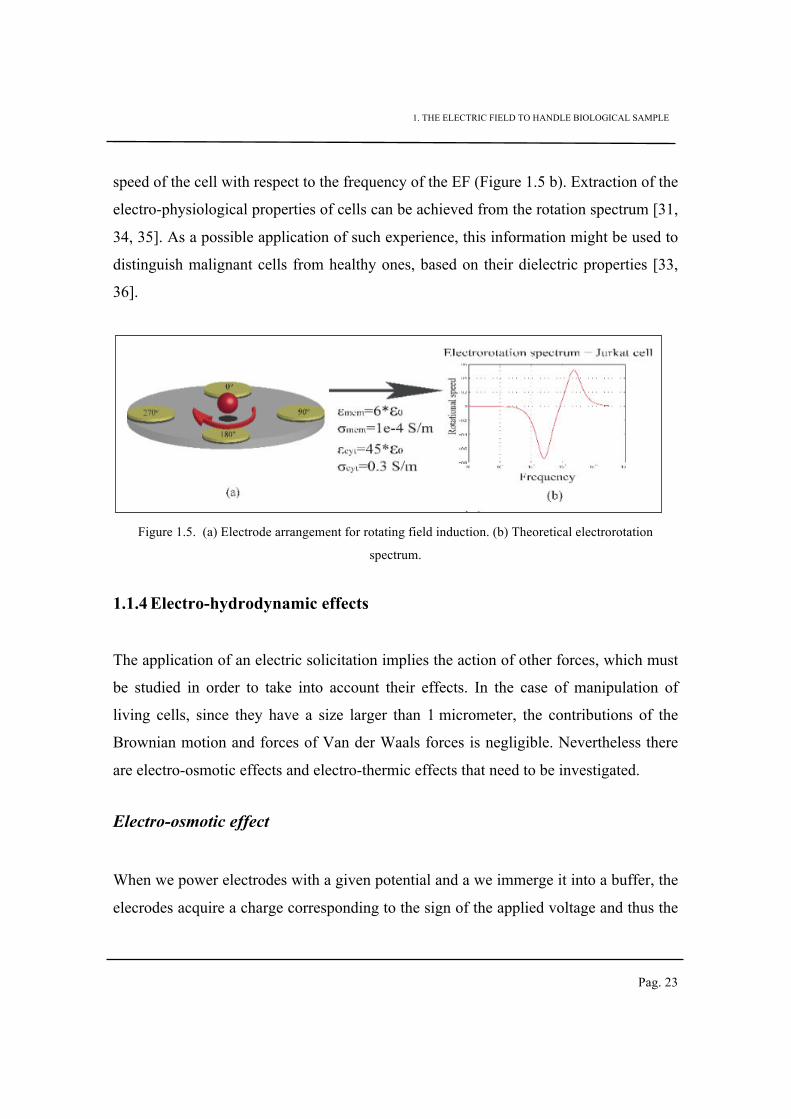
1. THE ELECTRIC FIELD TO HANDLE BIOLOGICAL SAMPLE
Pag. 23
speed of the cell with respect to the frequency of the EF (Figure 1.5 b). Extraction of the
electro-physiological properties of cells can be achieved from the rotation spectrum [31,
34, 35]. As a possible application of such experience, this information might be used to
distinguish malignant cells from healthy ones, based on their dielectric properties [33,
36].
Figure 1.5. (a) Electrode arrangement for rotating field induction. (b) Theoretical electrorotation
spectrum.
1.1.4 Electro-hydrodynamic effects
The application of an electric solicitation implies the action of other forces, which must
be studied in order to take into account their effects. In the case of manipulation of
living cells, since they have a size larger than 1 micrometer, the contributions of the
Brownian motion and forces of Van der Waals forces is negligible. Nevertheless there
are electro-osmotic effects and electro-thermic effects that need to be investigated.
Electro-osmotic effect
When we power electrodes with a given potential and a we immerge it into a buffer, the
elecrodes acquire a charge corresponding to the sign of the applied voltage and thus the
1. THE ELECTRIC FIELD TO HANDLE BIOLOGICAL SAMPLE
Pag. 24
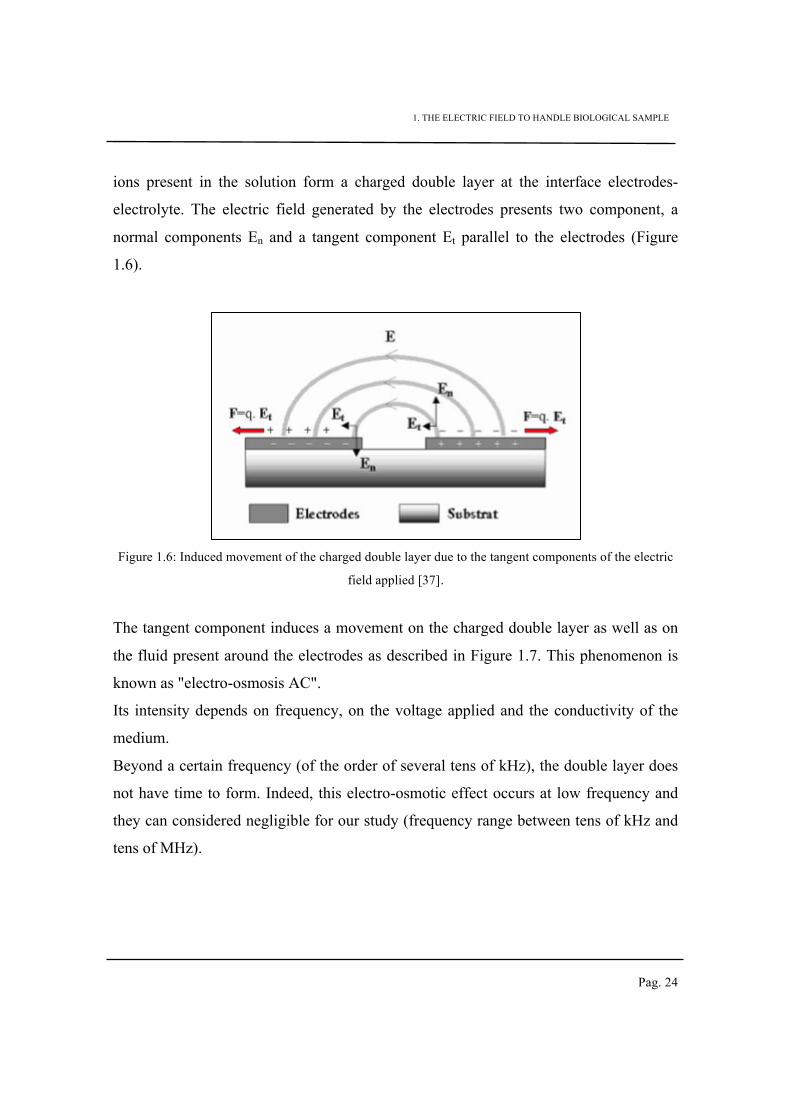
ions present in the solution form a charged double layer at the interface electrodes-
electrolyte. The electric field generated by the electrodes presents two component, a
normal components En and a tangent component Et parallel to the electrodes (Figure
1.6).
Figure 1.6: Induced movement of the charged double layer due to the tangent components of the electric
field applied [37].
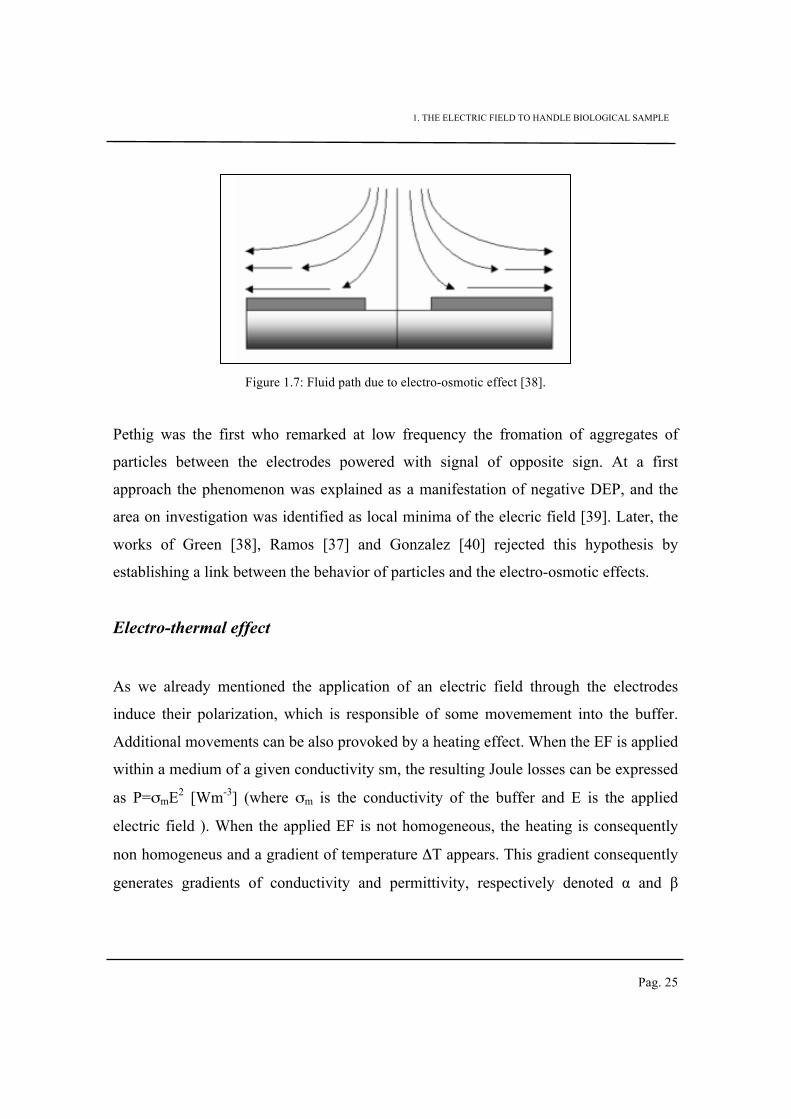
The tangent component induces a movement on the charged double layer as well as on
the fluid present around the electrodes as described in Figure 1.7. This phenomenon is
known as "electro-osmosis AC".
Its intensity depends on frequency, on the voltage applied and the conductivity of the
medium.
Beyond a certain frequency (of the order of several tens of kHz), the double layer does
not have time to form. Indeed, this electro-osmotic effect occurs at low frequency and
they can considered negligible for our study (frequency range between tens of kHz and
tens of MHz).
1. THE ELECTRIC FIELD TO HANDLE BIOLOGICAL SAMPLE
Pag. 25
Figure 1.7: Fluid path due to electro-osmotic effect [38].
Pethig was the first who remarked at low frequency the fromation of aggregates of
particles between the electrodes powered with signal of opposite sign. At a first
approach the phenomenon was explained as a manifestation of negative DEP, and the
area on investigation was identified as local minima of the elecric field [39]. Later, the
works of Green [38], Ramos [37] and Gonzalez [40] rejected this hypothesis by
establishing a link between the behavior of particles and the electro-osmotic effects.
Electro-thermal effect
As we already mentioned the application of an electric field through the electrodes
induce their polarization, which is responsible of some movemement into the buffer.
Additional movements can be also provoked by a heating effect. When the EF is applied
within a medium of a given conductivity sm, the resulting Joule losses can be expressed
as P=σmE2 [Wm-3] (where σm is the conductivity of the buffer and E is the applied
electric field ). When the applied EF is not homogeneous, the heating is consequently
non homogeneus and a gradient of temperature ΔT appears. This gradient consequently
generates gradients of conductivity and permittivity, respectively denoted α and β
1. THE ELECTRIC FIELD TO HANDLE BIOLOGICAL SAMPLE
Pag. 26
(equation 1.19), inducing movement of mobile charges (ρ) in the liquid (equation 1.20)
[16].
α =1
εm
∇εm
∇T
β =1
σm
∇σm
∇T
(1.19)
ρ =∇(εmE) =∇ε
mE +ε
m∇E (1.20)
The gradient of conductivity induces Coulomb forces while the gradient of permittivity
induces dielectic forces. The whole time average electrothermic force acting on the
liquid is thus given by:
FETE
! "!!!= 0.5ε
m∇TE
2! "!
Π(ω) (1.21)
where P(ω) determines the intensity of this force and it depends on the parameters
α and β as follow:
Π(ω) =α −β
1+ωε
m
σm
#
$%
&
'(
2−α
2
#
$
%%%%%
&
'
(((((
(1.22)
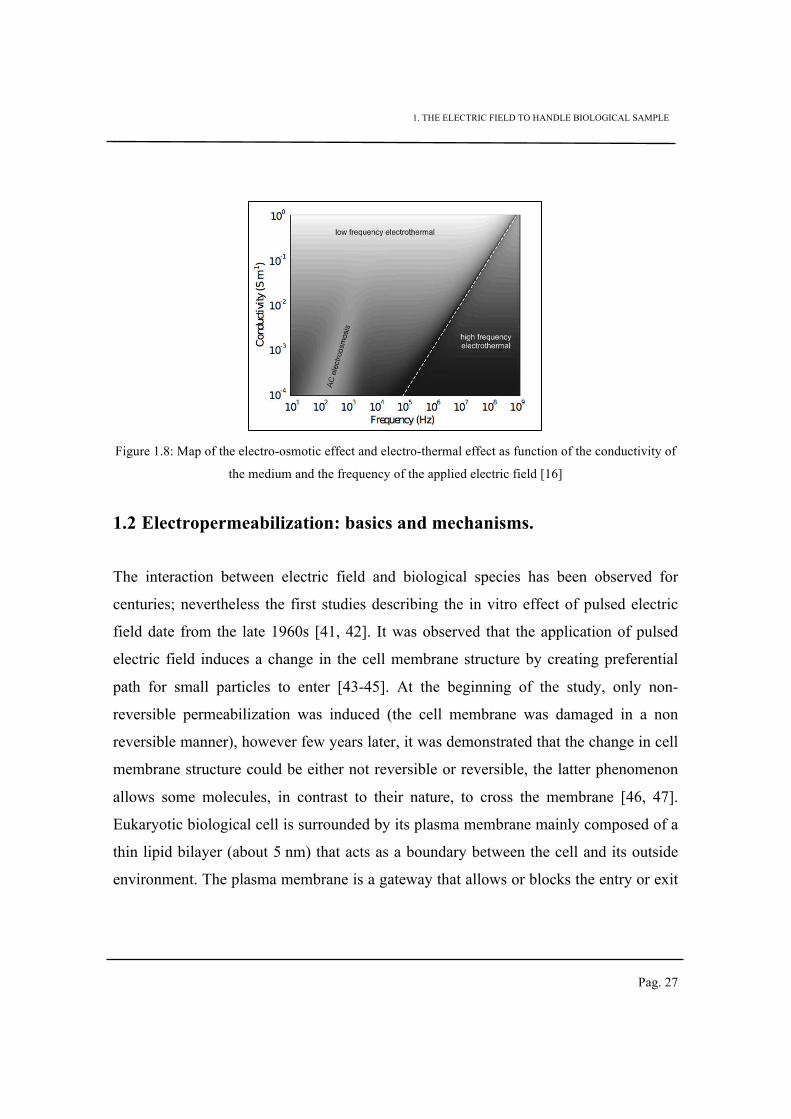
The electrothermal effect is strongly dependent on the conductivity of the medium and
can induce strong flow (v ~ 1 mm/s) in the whole freqeuncy range as shown in Figure
1.8.
1. THE ELECTRIC FIELD TO HANDLE BIOLOGICAL SAMPLE
Pag. 27
Figure 1.8: Map of the electro-osmotic effect and electro-thermal effect as function of the conductivity of
the medium and the frequency of the applied electric field [16]
1.2 Electropermeabilization: basics and mechanisms.
The interaction between electric field and biological species has been observed for
centuries; nevertheless the first studies describing the in vitro effect of pulsed electric
field date from the late 1960s [41, 42]. It was observed that the application of pulsed
electric field induces a change in the cell membrane structure by creating preferential
path for small particles to enter [43-45]. At the beginning of the study, only non-
reversible permeabilization was induced (the cell membrane was damaged in a non
reversible manner), however few years later, it was demonstrated that the change in cell
membrane structure could be either not reversible or reversible, the latter phenomenon
allows some molecules, in contrast to their nature, to cross the membrane [46, 47].
Eukaryotic biological cell is surrounded by its plasma membrane mainly composed of a
thin lipid bilayer (about 5 nm) that acts as a boundary between the cell and its outside
environment. The plasma membrane is a gateway that allows or blocks the entry or exit
1. THE ELECTRIC FIELD TO HANDLE BIOLOGICAL SAMPLE
Pag. 28
of molecules and chemical species; it regulates what can enter into the cell and what
should exit from it.
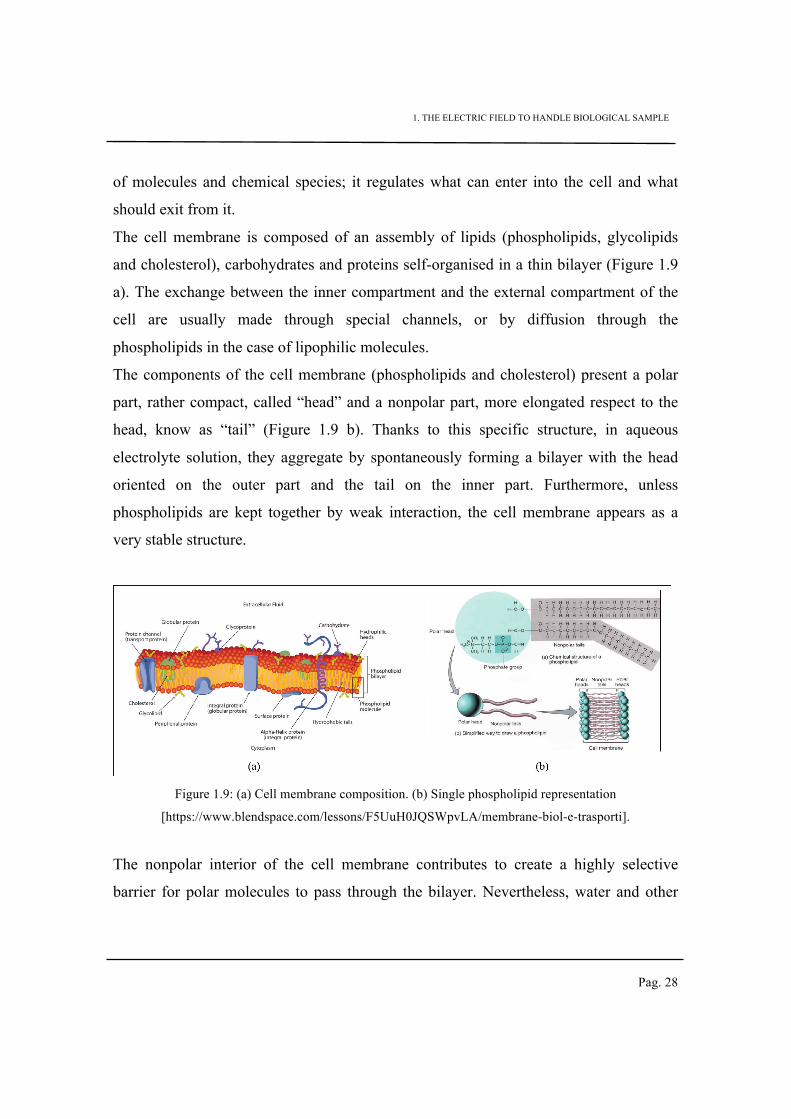
The cell membrane is composed of an assembly of lipids (phospholipids, glycolipids
and cholesterol), carbohydrates and proteins self-organised in a thin bilayer (Figure 1.9
a). The exchange between the inner compartment and the external compartment of the
cell are usually made through special channels, or by diffusion through the
phospholipids in the case of lipophilic molecules.
The components of the cell membrane (phospholipids and cholesterol) present a polar
part, rather compact, called “head” and a nonpolar part, more elongated respect to the
head, know as “tail” (Figure 1.9 b). Thanks to this specific structure, in aqueous
electrolyte solution, they aggregate by spontaneously forming a bilayer with the head
oriented on the outer part and the tail on the inner part. Furthermore, unless
phospholipids are kept together by weak interaction, the cell membrane appears as a
very stable structure.
Figure 1.9: (a) Cell membrane composition. (b) Single phospholipid representation
[https://www.blendspace.com/lessons/F5UuH0JQSWpvLA/membrane-biol-e-trasporti].
The nonpolar interior of the cell membrane contributes to create a highly selective
barrier for polar molecules to pass through the bilayer. Nevertheless, water and other
1. THE ELECTRIC FIELD TO HANDLE BIOLOGICAL SAMPLE
Pag. 29
ions can permeate and get inside the inner compartment in such high rate not be
explained by simply talking about diffusion [48].
From an electrical point of view, the plasma membrane can be considered as a thin
insulating layer surrounded on both sides by aqueous electrolyte solutions.
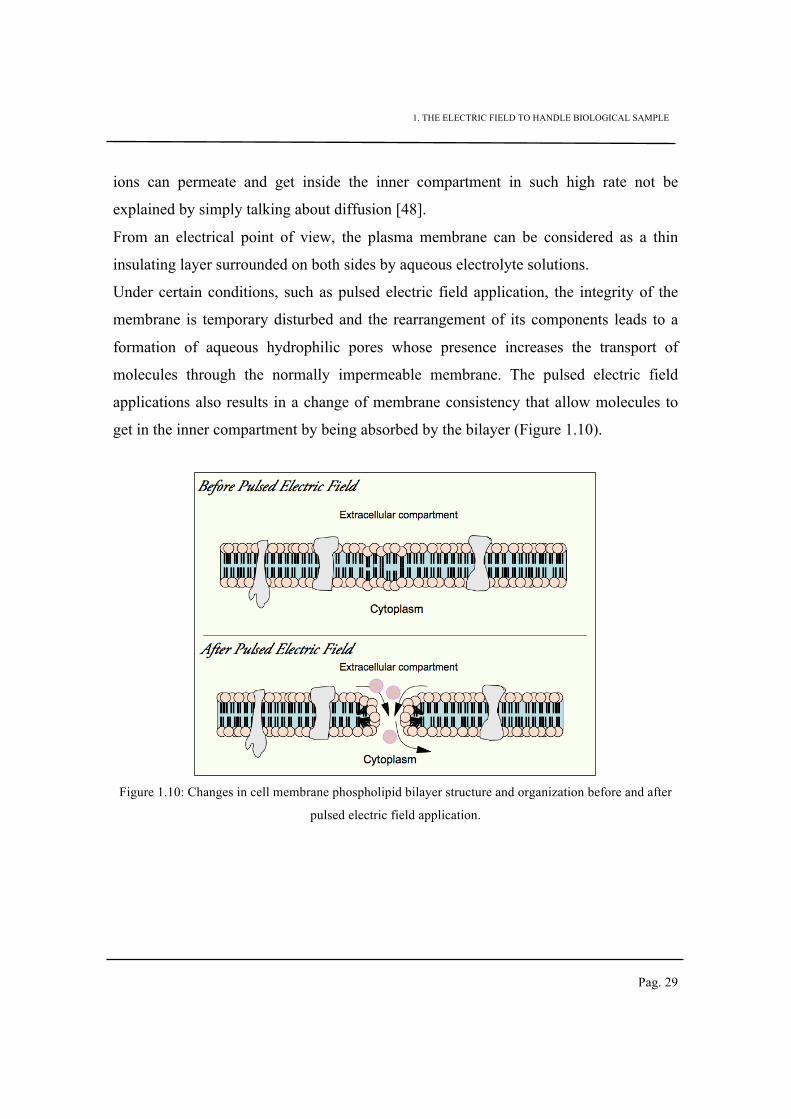
Under certain conditions, such as pulsed electric field application, the integrity of the
membrane is temporary disturbed and the rearrangement of its components leads to a
formation of aqueous hydrophilic pores whose presence increases the transport of
molecules through the normally impermeable membrane. The pulsed electric field
applications also results in a change of membrane consistency that allow molecules to
get in the inner compartment by being absorbed by the bilayer (Figure 1.10).
Figure 1.10: Changes in cell membrane phospholipid bilayer structure and organization before and after
pulsed electric field application.
1. THE ELECTRIC FIELD TO HANDLE BIOLOGICAL SAMPLE
Pag. 30
Membrane potential effects
The ion concentration gradient between the inside and outside of the cell (Table 1.1) is
known as resting potential (ΔΨ):
Ion concentration [mM] K+ Na+ Mg++ Ca++ Cl- HCO3-
intracellular 160 7-12 5 10-4-10-5 4-7 8
extracellular 4 144 1-2 2 120 26-28
Table 1.1:Typical intracellular and extracellular ions concentraton for a mammalian cell.
The Nernst equation (equation 1.23) establishes the potential across the cell membrane
based on the concentration gradient of each ion; it determines the membrane potential
Eeq at which the specific ion species x is in equilibrium:
Eeq,x
=RT
zFln
X[ ]o
X[ ]i (1.23)
where R is the universal gas constant and it is equal to 8.314 JK-1mol-1, T is the
temperature in Kelvin, z is the valence of the ion specie, F is the Faraday constant equal
to 96,485 C mol-1, [X]o is the concentration of the ion specie in the extracellular
medium and [X]i is the intracellular concentration of the ion specie.
The resting potential varies from cell to cell and is thus an intrinsic characteristic of the
sample, for instance for neurons its typical value is -70mV, for skeleton muscle cell it is
-90mV and for epithelial cell cells its value is around -50mV. When applying pulsed
electric field (width tens of microseconds up to several milliseconds) to a biological
solution containing living cells, a difference of potential between the inner and the outer
part of the membrane induces an accumulation of charges of opposite sign on the two
1. THE ELECTRIC FIELD TO HANDLE BIOLOGICAL SAMPLE
Pag. 31
sides of the plasma membrane. This potential is called induced transmembrane potential
(ΔΨi) [49]:
ΔΨi = f ⋅ E ⋅ R ⋅cos(θ ) ⋅[1− e−
t
τ m ] (1.24)
where f depends on dielectric and geometrical properties of the cell as shown in
equation 1.25, R is the radius of the cell, θ is the angle between the point where the ΔΨ
is calculated and the applied electric field (See figure 1.11) and τm is the membrane
charging time constant and it depends on the permittivity of the membrane (σmem), the
cytoplasm (σcyt) and the external environment (σm) and on the permittivity (εmem) and
the thickness (e) of the membrane (equation 1.26).
f =3⋅σ m[3⋅d ⋅R
2⋅σ cyt + (3⋅d
2⋅R− d
3)(σ mem −σ cyt )]
2 ⋅R2(σ mem + 2σ m )(σ mem +
1
2σ cyt )− 2(R− d)
3(σ m −σ mem )(σ cyt −σ mem )
(1.25)
τm =R ⋅εmem
d2σ mσ cyt
2σ m +σ cyt
+R
dσ mem
(1.26)
1. THE ELECTRIC FIELD TO HANDLE BIOLOGICAL SAMPLE
Pag. 32
Figure 1.11: Eelectric field applied on a particle of a radius r. red arrows represent the resting potential
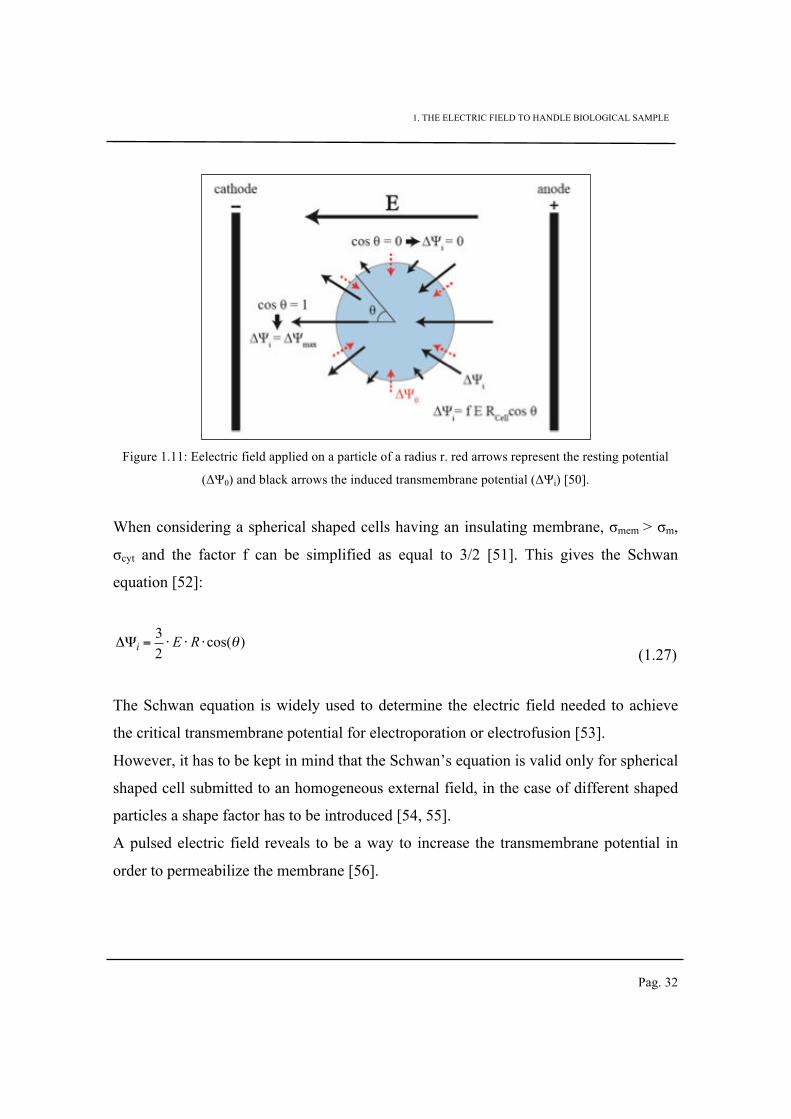
(ΔΨ0) and black arrows the induced transmembrane potential (ΔΨi) [50].
When considering a spherical shaped cells having an insulating membrane, σmem > σm,
σcyt and the factor f can be simplified as equal to 3/2 [51]. This gives the Schwan
equation [52]:
ΔΨ
i=
3
2⋅ E ⋅ R ⋅cos(θ )
(1.27)
The Schwan equation is widely used to determine the electric field needed to achieve
the critical transmembrane potential for electroporation or electrofusion [53].
However, it has to be kept in mind that the Schwan’s equation is valid only for spherical
shaped cell submitted to an homogeneous external field, in the case of different shaped
particles a shape factor has to be introduced [54, 55].
A pulsed electric field reveals to be a way to increase the transmembrane potential in
order to permeabilize the membrane [56].
1. THE ELECTRIC FIELD TO HANDLE BIOLOGICAL SAMPLE
Pag. 33
Being a really complex system composed by electrically charged species, a cell
submitted to a pulsed electric field changes its membrane topology. The first effect of
the pulses is the change of the spherical shape of the cell to an ellipsoidal one. The
pulses application results in an alteration of the membrane proteins, this phenomenon
affects mostly proteins that are not anchored to the cytoskeleton [57]. In the time
immediately after the application of pulses (around 1 minute after) a significant increase
of microvescicles is recorded, this eruption disappears if the cell recovers its original
topology (in the case of reversible electroporation) after about 30 minute at room
temperature.
Electropermeabilization is a threshold phenomenon and depending on the characteristics
of pulses parameters can lead to reversible or irreversible electropermeabilization. In
order to trigger the formation of transient aqueous pores in the cell membrane, the
external solicitation should reach a critical value in the range [200mV-1V] [58, 59]. If
the external electric field is kept below the critical threshold, the cell is able to recover
its original membrane condition and thus we can talk about reversible electorporation
[60]. If this is not the case and the electric field exceed the critical value, the cell
membrane is irreversible damaged and the cell viability is compromised, the result is
the irreversible electroporation [61, 62].
Depending on the desired outcome, reversible or irreversible electroporation are
induced.
Joule heating
Since pulsed electric field is applied, an electrical current originated from electrodes is
flowing through the medium. This current induces Joule heating resulting in an increase
of the temperature in the sample , indeed it has to be taken into account. In the case of in
vitro experiments, the heating can be controlled or limited by using a low conductive
1. THE ELECTRIC FIELD TO HANDLE BIOLOGICAL SAMPLE
Pag. 34
buffer and by delivering short pulses with low amplitude value. Furthermore, by
considering that the heating is linearly related to the pulse width as shown by the
equation 1.20, application of shorter pulses is a way to minimize deleterious heating
effects [57]:
ΔT =σ mE
2
ρCp
t
(1.28)
where σm represents the conductivity of the medium, ρ represents its volume density,
Cp is its specific heat and t is the pulse width.
1.2.1 The electroporation and/or the electropermeabilization theor(y)ies.
It was previously mentioned that electric field pulses characteristics lead to a reversible
or non-reversible permeabilization. Over the last decades reversible electroporation has
been used as a promising technique for cancer treatments while irreversible
electroporation was almost ignored at that time. However the latter was employed
afterwards as a promising ablation technique. Irreversible electroporation requires
pulsed electric field high in amplitude (~ 1kV/cm) and with long duration (~ 800 ms),
such specific conditions can affect the transmembrane potential in an irreversible
manner. The advantage of the irreversible electroporation is the high control of the
affected area that can be also monitored with electrical impedance tomography [63].
In the case of more moderate pulses the potential difference across the membrane is also
affected, but in a way that allow the bilayer to recover after a given time without putting
in danger its viability. Reversible electroporation is mostly used in medicine and
biotechnology to introduce no permeable species inside the cell, ranging from small
1. THE ELECTRIC FIELD TO HANDLE BIOLOGICAL SAMPLE
Pag. 35
molecules (fluorescent dye, drugs, …) to big molecules (DNA, antibodies, etc..) [57,
64].
Nevertheless on this point the scientific community is divided. It is well known that the
creation of membrane defects induce the access of large molecules inside the cell, but it
is not clear, or it is not demonstrated, if phospholipids are just "destabilized" by
allowing passage of molecules or if real channels (known as electropores) are created.
Indeed two theories exist (even a third one as the combination of the two). Thus the two
terms electroporation and electropermeabilization are used depending on the theory
used to explain the phenomenon.
1.2.2 The “pore formation” theory.
The structural integrity of the cell membrane can be perturbed by an applied pulsed
electric field, indeed physicochemical mechanisms lead to a reorganization of the lipid
bilayer [65]. With conventional techniques it is not possible to observe nano-pores and
to characterize in details the dynamics of the permeabilization phenomenon. Thus the
needs to use computational methods; in particular Molecular Dynamics (MD)
simulations have been employed recently in order to investigate the pulsed electric field
effects on the lipid bilayer [66, 67].
In MD usually simulations are performed on a small number of molecules because of
limits due to computer power or to the system speed execution, the simulations actually
need a huge computer performance to be carried on. When performing MD simulations,
information such as forces, positions and velocity or momentum are given at a specific
time t, they are then used to predict momentum at a time t+Δt, where Δt is a
femtosecond time step.
Once the pulsed electric field is applied a migration of water molecules and
phospholipid head groups is remarked in the inner part of the bilayer, the first step of
1. THE ELECTRIC FIELD TO HANDLE BIOLOGICAL SAMPLE
Pag. 36
the pore formation takes place as long as the external solicitation is applied. Once the
pulsed electric field is removed, a decrease of the pore dimension is observed till the
moment when water molecule and phospholipids head group migrate, this time in the
opposite direction, out of the membrane interior. The life cycle of an electropore is
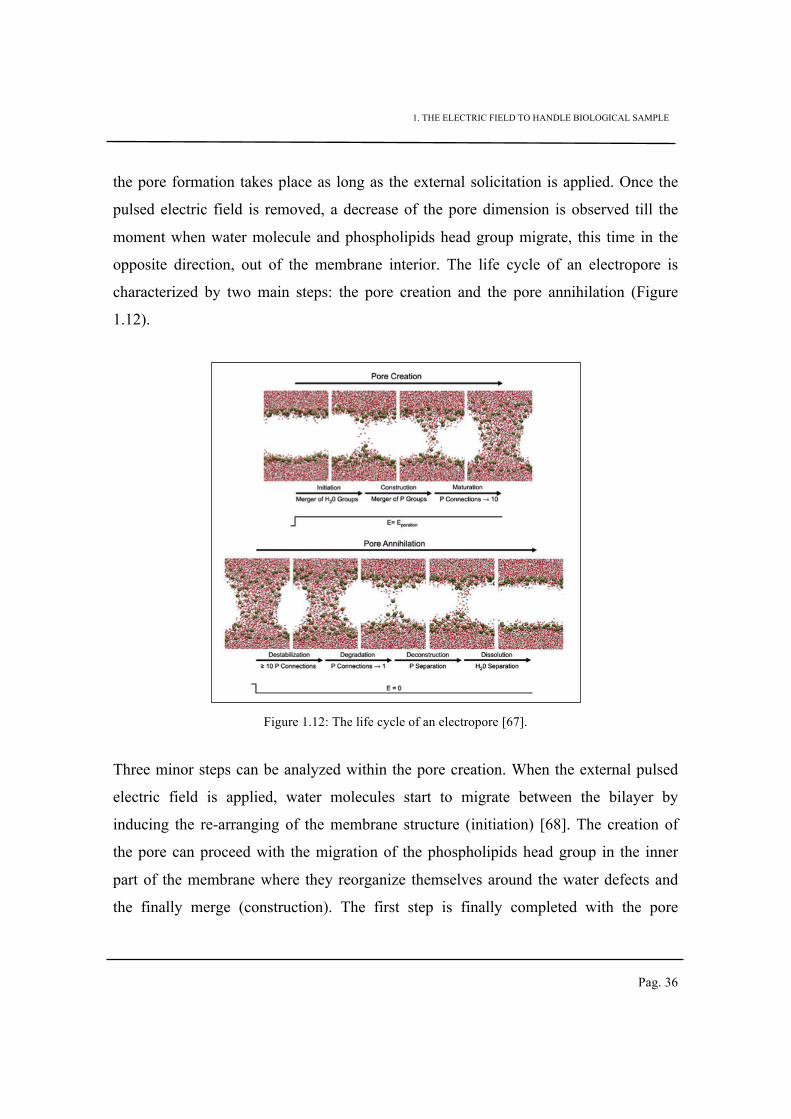
characterized by two main steps: the pore creation and the pore annihilation (Figure
1.12).
Figure 1.12: The life cycle of an electropore [67].
Three minor steps can be analyzed within the pore creation. When the external pulsed
electric field is applied, water molecules start to migrate between the bilayer by
inducing the re-arranging of the membrane structure (initiation) [68]. The creation of
the pore can proceed with the migration of the phospholipids head group in the inner
part of the membrane where they reorganize themselves around the water defects and
the finally merge (construction). The first step is finally completed with the pore
1. THE ELECTRIC FIELD TO HANDLE BIOLOGICAL SAMPLE
Pag. 37
evolution (maturation). Pore annihilation begins when the pulsed electric field is
removed, at this time the pore size pass through a quasi-stable step while it decreases its
size (destabilization). The phospholipids head groups and the water molecules start to
migrate to the out of the membrane (degradation), when the phospholipids are
completely out of the membrane the deconstruction step is achieved; now only water
molecules are inside the bilayer, but they move quickly to the two sides of the
membrane in order to restore the original membrane structure (dissolution). Pore
annihilation is a longer process compare to pore creation, MD also showed how some
steps of the pore life-cycle are field-dependent while other are less affected by the
electric field strength [66]. Pulsed electric field characteristics cannot be chosen by the
customer because of the power limit of the computer, indeed in MD simulation we
previously mentioned fs pulses are applied by assuming that it was enough to change
the dynamic structure of the membrane and to induce the permeabilization.
1.2.3 The lipid bilayer “destabilization” theory
Electropermeabilization can not be reduced to simply formation of “holes” in the cell
membrane since a large part of physiological control is hidden by the phenomenon [69].
The transient cell membrane destabilization represents a stress for the cell, which can
affect its functionality and, in the worst case, its viability. After the application of a
pulsed electric field, cells need to be monitored, for minutes/hours, which is crucial in
order to check the damage induced on them.
When applying to the cell a “long” pulse (which means ms duration pulses) through
plate electrodes we can observe an induced electropermeabilization meaning that the
organization of the membrane is changed and we have an exchange across the
membrane. When the electric field is removed a “resealing” process is observed,
1. THE ELECTRIC FIELD TO HANDLE BIOLOGICAL SAMPLE
Pag. 38
meaning that the permeabilization is slowly going to disappear (several seconds or
minutes), but by the time the internal compounds are totally changed and some
molecules could be extracted from the inner compartment. Indeed, the
electropermeabilization phenomenon appears in two consecutives steps, one during the
pulse application and another one after pulse application; the two processes have
different kinetics. The first step is fast (µs to ms) and short, the pulse needs to be
present but there is a limit linked to its width in order to avoid cell death. During this
step electrophoretic effects can be observed. The second step, on the other hand, is a
slow process, which lasts for long time after the pulse from a few seconds to several
minutes.
When pulses are applied they induce an increase of the membrane difference potential
(trigger); if a critical value is reached (200mV) the lipid bilayer is not able to withstand
the forces on its membrane, thus the membrane can become leaky. The field strength
influence mostly two aspects, it first triggers the permeabilization of the cell membrane
and it is responsible of the surface geometry affected by the permeabilization. The leaky
state induced on the membrane is followed by a reorganisation of the membrane
(expansion) that takes place in a longer time scale (order of ms). Furthermore the
density of the defects that appear on the membrane can be controlled by the pulse
duration.
The increased conductance of the permeabilized part of the cell membrane quickly
decrease as soon as the external field decrease below the critical value (stabilisation),
nevertheless the cell membrane still remains permeable to some chemical compounds.
A slow annihilation of leaks (time scale of s) is observed and the membrane is thus able
to recover its integrity (resealing). The resealing is strongly dependent on the
temperature, so a really fast resealing takes place at 37°C while cell can be kept
permeabilized for hours at low temperature (4°C). After the resealing, the viability is
1. THE ELECTRIC FIELD TO HANDLE BIOLOGICAL SAMPLE
Pag. 39
not affected but the membrane properties are still modified and the cell needs hours in
order to get back to the initial conditions.
Furthermore a faster resealing of lipid assemblies was remarked in lipid assemblies
while it revealed to be slower in the case of cells. The difference highlights how the
permeabilization is not just a matter or re-organisation of the lipid bilayer, but rather a
cellular process that involves also the entire cell behaviour. Indeed during the resealing
step a production of the reactive oxygen species in the permeabilized part of the cell
surface was recorded. In last step of the phenomenon the cell totally recovered its
original functions for a reversible electropermeabilization, in the case where induced
alterations could not be repaired lead to cell death on the long term [70].
1.2.4 The combined theory
A well known parable from the Jain religion talks about six blind men were asked to
determine what an elephant looked like by feeling different parts of the elephant's body.
“The blind man who feels a leg says the elephant is like a pillar; the one who feels the
tail says the elephant is like a rope; the one who feels the trunk says the elephant is like
a tree branch; the one who feels the ear says the elephant is like a hand fan; the one who
feels the belly says the elephant is like a wall; and the one who feels the tusk says the
elephant is like a solid pipe.
A king explains to them: All of you are right. The reason every one of you is telling it
differently is because each one of you touched the different part of the elephant. So,
actually the elephant has all the features you mentioned.”
The parable illustrates a range of truths, it implies that one's subjective experience can
be true, but such experience is limited and wrong unless all the others complete it.
In a similar way, we have seen two different theories employed and justified from
different research groups, nevertheless as previously mentioned, the
1. THE ELECTRIC FIELD TO HANDLE BIOLOGICAL SAMPLE
Pag. 40
electropermeabilization phenomenon is such a complex phenomenon that it can be
explained only if both theories are taken into account and combined.
The transient capability of the cell membrane of becoming permeable to molecules after
pulsed electric field application is indeed due to a structure change of the lipid bilayer,
which is destabilized with respect to the normal condition as well as to the creation and
annihilation of electropores, which represents an easy path for ionic and molecular
transport through the otherwise impermeable and selective membrane.
1.3 The influential parameters
Pulses parameters such as amplitude, width, repetitiona frequency, etc. are of primary
importance within the permeabilization process since they determine the level of
permeabilization achieved. Indeed their influence is hereafter investigated.
1.3.1 The pulses amplitude and duration
The permeabilization threshold value of transmembrane potential is substantially the
same independent of the cell type. Furthermore the permeabilization threshold is lower
for adherent cells (300 V/cm for adherent CHO cells) for cells in suspension (700 V/cm
for CHO cells in suspension ) This property can be useful in the presence of complex
tissues, which contains different type cell if we want to affect certain types of larger size
cell [71].
The EF amplitude is a parameter, which influences the permeabilized surface without
affecting intracellular organelles [72, 73]. Indeed, transfection experiments performed
on isolated mitochondria require an electric field 10 to 100 times higher than the fields
generally used in vitro and in vivo to permeabilize the cells [74].
As well as for the EF amplitude, also the duration has an effect on the permeabilization
1. THE ELECTRIC FIELD TO HANDLE BIOLOGICAL SAMPLE
Pag. 41
phenomenon, it can be remarked from the literature that the threshold beyond which the
permeabilization occurs is strongly dependent on the duration of the pulse [75].
It appears that the permeabilization threshold is strictly related to the pulse duration,
indeed in one study [73] for adherent CHO cells with pulse durations from 2 µs to 20 µs
it was found that there is a clear relationship between the EF threshold and the pulse
duration (see equation 1.29).
Ethreshold (kV / cm) =1.5
w(µs)+0.3
(1.29)
Furthermore other studies showed how the pulse width can also have an effect on the
pore size, thus small duration pulses induce the creation of a large number of small
electropores while long duration pulses cause the creation of larger electropores since
they have more time to enlarge [76].
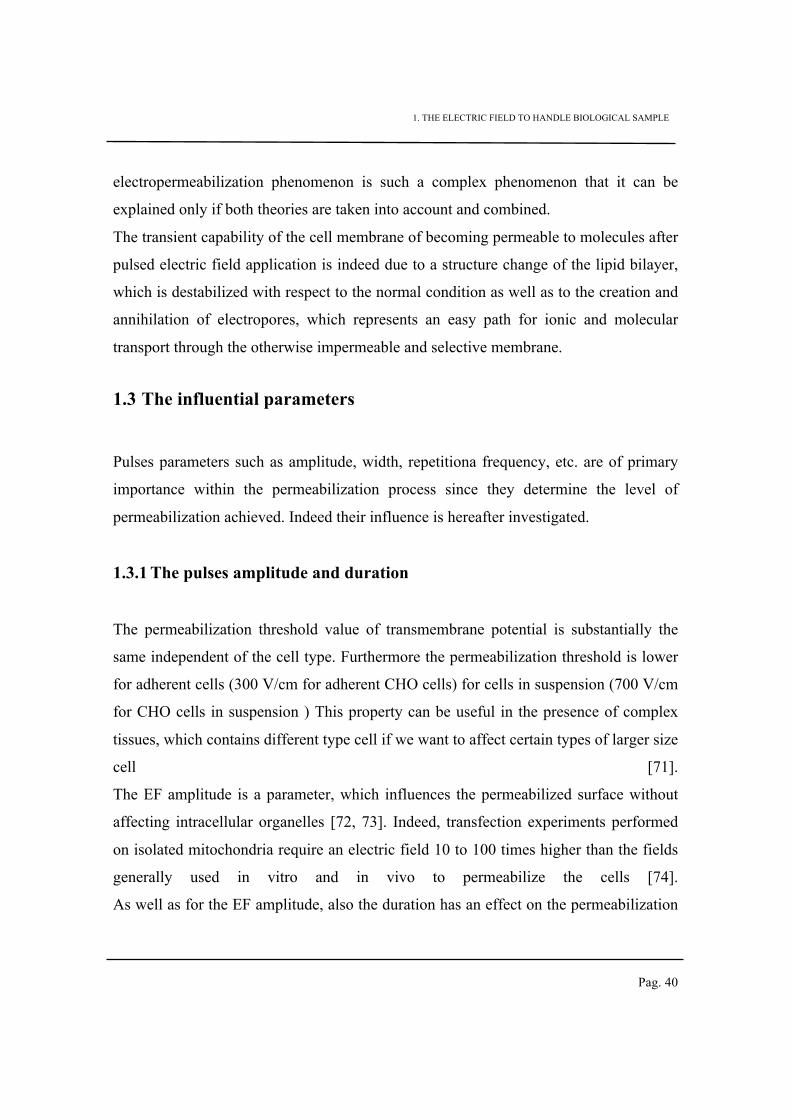
The figure below summarizes some effects and some application related to both pulse
amplitude and duration:
Figure 1.13: Different effects obtained when applying PEF to a cell. Reversible electropermeabilization,
irreversible electropermeabilization and thermal damage as a function of electric field strength and
exposure duration [77].
1. THE ELECTRIC FIELD TO HANDLE BIOLOGICAL SAMPLE
Pag. 42
According to the Figure 1.13, the same level of permeabilization can be achieved by
combining the pulse duration and its amplitude. However below some critical values the
permeabilization does not accur whichever the EF applied or the pulse width set.
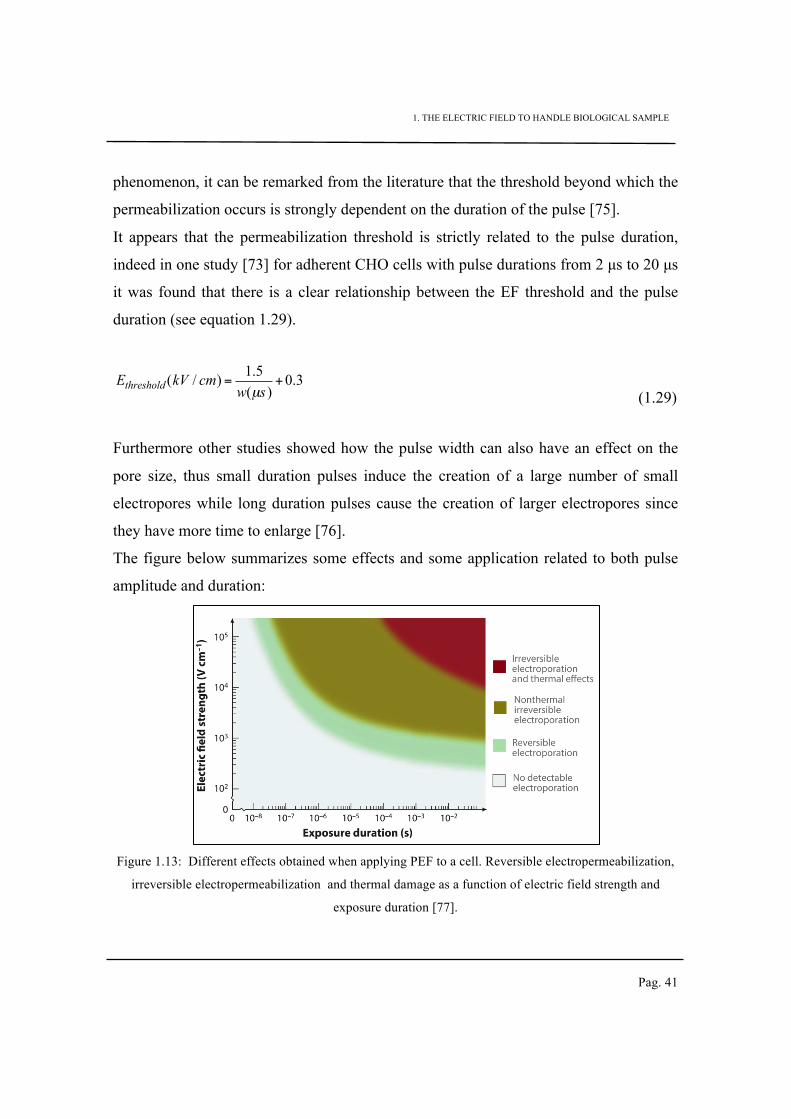
1.3.2 The pulse count
Additionally, the number of pulses notably influences the permeabilization efficiency.
Besides the fact that the evolution of the level of permeabilization is not linear with the
number of pulses, different levels of permeabilization are achieved when tuning the
pulse count (Figure 1.14).
Figure 1.14: Influence of the specific energy Q on cell permeabilization of potato tissue [78].
1.3.3 The pulse shape
Another parameter that has been studied due to its effect on the permeabilization is the
pulse’s shape. In a presented study [79] the efficiency due to a different pulses shape
has been compared, thus rectangular, triangular and sine pulses have been studied.
1. THE ELECTRIC FIELD TO HANDLE BIOLOGICAL SAMPLE
Pag. 43
Results reveal that electropermeabilization, cell death, and the peak of the uptake, all
occur at the lowest EF value for rectangular pulses, and at the highest EF value for
triangular pulses. Among the parameters that describe the pulse shape, the time during
which the pulse amplitude exceeds a certain critical value has a major role in the
efficiency of electropermeabilization. The theory of the electroporation actually
attributes the increase of plasma membrane permeability to the formation of hydrophilic
structures (‘‘aqueous pores’’) through the lipid bilayer [80]. There is thus a threshold of
transmembrane voltage above which formation of aqueous pores becomes energetically
favourable. Indeed the probability of formation of individual pores increases with the
duration of the above-threshold transmembrane voltage, and thus with the duration of
electric pulses.
1.3.4 The pulse repetition frequency
The influence of the repetition frequency was recently investigated thanks to the
evolution of new pulse generators, control systems and visualization techniques. Indeed
Pucihar et al. [81] show how by increasing the repetition frequency up to 8.3 kHz the
uptake of Lucifer Yellow (LY) stays at similar levels. By applying 26 pulses of 30 ms
width, the maximum uptake of LY was similar for the two repetitions frequency
employed (1Hz and 8.3 Hz), but the voltage needed for this is different (respectively
219 V for 1Hz and 335V for 8.3V). By tuning the EF strength at high frequency the
degree of permeabilization achieved is lower (Figure 1.15), the results is in agreement
with the theory of the cell with an RC membrane (see section 2.2.1) [60].
1. THE ELECTRIC FIELD TO HANDLE BIOLOGICAL SAMPLE
Pag. 44
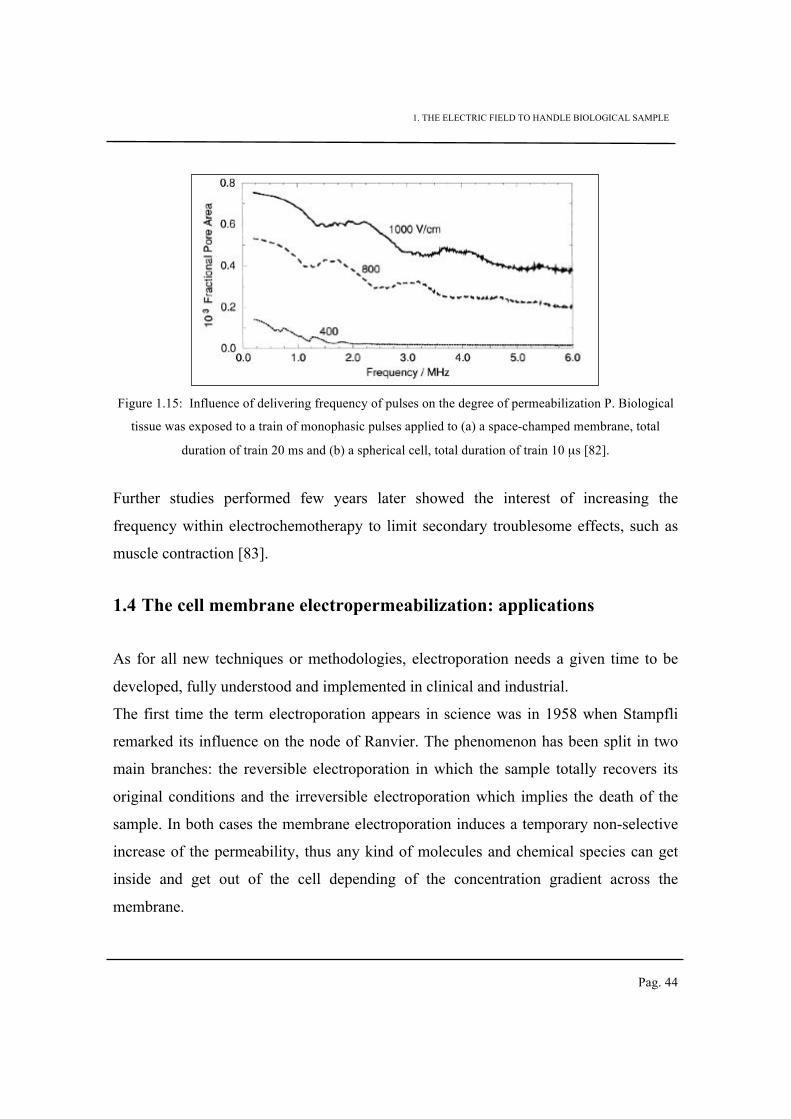
Figure 1.15: Influence of delivering frequency of pulses on the degree of permeabilization P. Biological
tissue was exposed to a train of monophasic pulses applied to (a) a space-champed membrane, total
duration of train 20 ms and (b) a spherical cell, total duration of train 10 µs [82].
Further studies performed few years later showed the interest of increasing the
frequency within electrochemotherapy to limit secondary troublesome effects, such as
muscle contraction [83].
1.4 The cell membrane electropermeabilization: applications
As for all new techniques or methodologies, electroporation needs a given time to be
developed, fully understood and implemented in clinical and industrial.
The first time the term electroporation appears in science was in 1958 when Stampfli
remarked its influence on the node of Ranvier. The phenomenon has been split in two
main branches: the reversible electroporation in which the sample totally recovers its
original conditions and the irreversible electroporation which implies the death of the
sample. In both cases the membrane electroporation induces a temporary non-selective
increase of the permeability, thus any kind of molecules and chemical species can get
inside and get out of the cell depending of the concentration gradient across the
membrane.
1. THE ELECTRIC FIELD TO HANDLE BIOLOGICAL SAMPLE
Pag. 45
Applications have been proposed, ranging from gene electrotransfer in biotechnology,
biology, and medicine to cell killing in water sterilization, food preservation, and tissue
ablation.
1.4.1 The applications in industry
Electroporation is an innovative method widely used in food processing to support the
extraction of intracellular components such as sugar from beets [84, 85] or juice from
fruits [86]. It is also a promising tool used for water sterilization and food preservation
[87] or to extract lipid from algae for renewable energy production [88].
Extraction of sugar from beets
One of the largest scale industrial applications of PEF is the extraction of sugar from
beets. In order to do it sugar beets are cut into thin slices (called cossettes) and treated
thermally with as little water as possible. Substances extraction takes place through
diffusion and it is possible due to the destruction of cell membrane achieved by thermal
denaturation at temperatures above 70˚C [89]. Since the diffusion coefficient is
proportional to temperature, the extraction should take place at highest temperature as
possible, however a too high temperature causes the denaturation of other cell wall
substances that can thus become water-soluble and lead to impurities in the juice. A
good compromise is represented by a temperature denaturation of 70-78°C and an
extraction temperature of 68-73°C. The high temperature allows some bacteria
surviving and thus causes a loss on the sugar production, thus the system needs some
disinfectants for the purification procedure.
A combination of pressing and PEF-treatment could help to save energy consumption
and to decrease the cost linked to purification products, nevertheless this procedure is
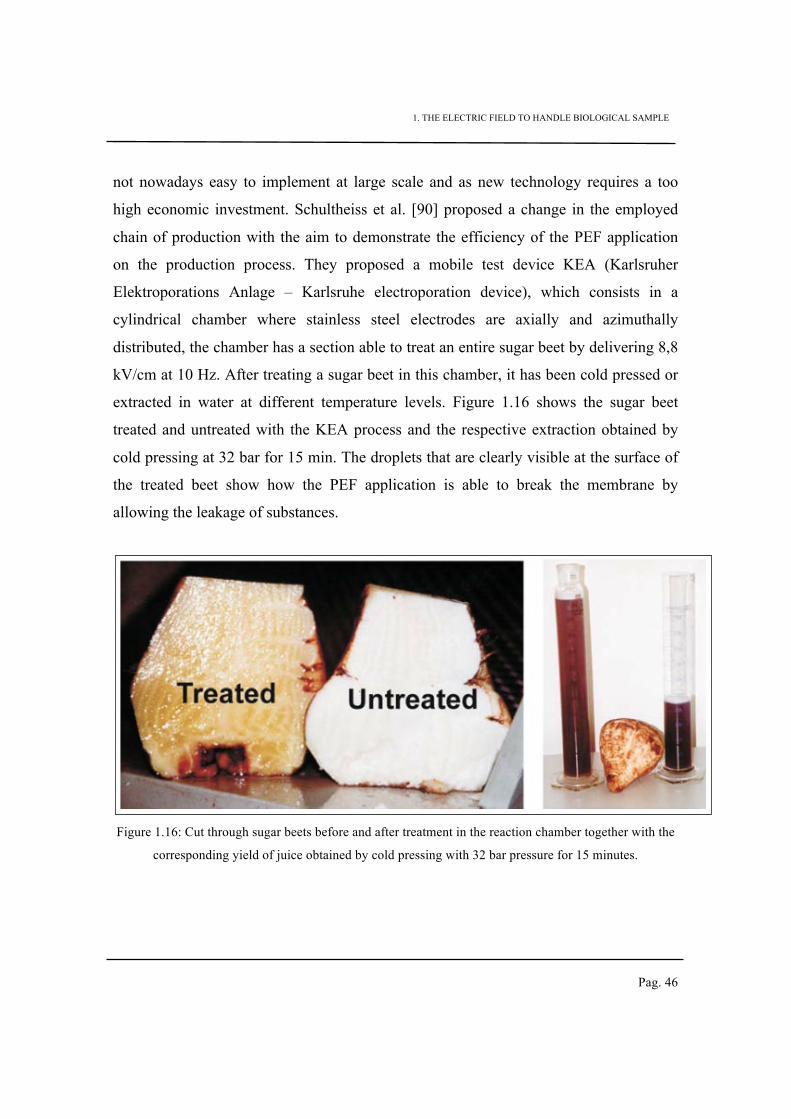
1. THE ELECTRIC FIELD TO HANDLE BIOLOGICAL SAMPLE
Pag. 46
not nowadays easy to implement at large scale and as new technology requires a too
high economic investment. Schultheiss et al. [90] proposed a change in the employed
chain of production with the aim to demonstrate the efficiency of the PEF application
on the production process. They proposed a mobile test device KEA (Karlsruher
Elektroporations Anlage – Karlsruhe electroporation device), which consists in a
cylindrical chamber where stainless steel electrodes are axially and azimuthally
distributed, the chamber has a section able to treat an entire sugar beet by delivering 8,8
kV/cm at 10 Hz. After treating a sugar beet in this chamber, it has been cold pressed or
extracted in water at different temperature levels. Figure 1.16 shows the sugar beet
treated and untreated with the KEA process and the respective extraction obtained by
cold pressing at 32 bar for 15 min. The droplets that are clearly visible at the surface of
the treated beet show how the PEF application is able to break the membrane by
allowing the leakage of substances.
Figure 1.16: Cut through sugar beets before and after treatment in the reaction chamber together with the
corresponding yield of juice obtained by cold pressing with 32 bar pressure for 15 minutes.
1. THE ELECTRIC FIELD TO HANDLE BIOLOGICAL SAMPLE
Pag. 47
Extraction of juice from fruits
Some of the most used methods employed in food industry for juice and oil extraction
consist in conventional disintegration techniques such as pressing, thermal treatments
and enzymatic treatments; their aim is to mechanically destroy the cell membrane in
order to extract different intracellular compounds. Unfortunately those techniques can
degrade the quality of the extracted products by destroying tissue, deteriorating textural
properties or causing loss of nutritionally compounds.
Thus PEF can be applied in order to achieve a cell membrane permeabilization without
changing important properties of the sample [86]. It was actually proven that no
changes were remarked on pH value, total sugars and total acidity. Furthermore the
purity and the clarity of the juice extraction are enhanced and even the content of many
nutritionally valuable compounds was retained or even enhanced [91]. A strong point is
also represented by the fact that the use of PEF is a technique that can be easily
integrated in already existing industrial process and it does not require the development
of a new extraction procedure (figure 1.17).
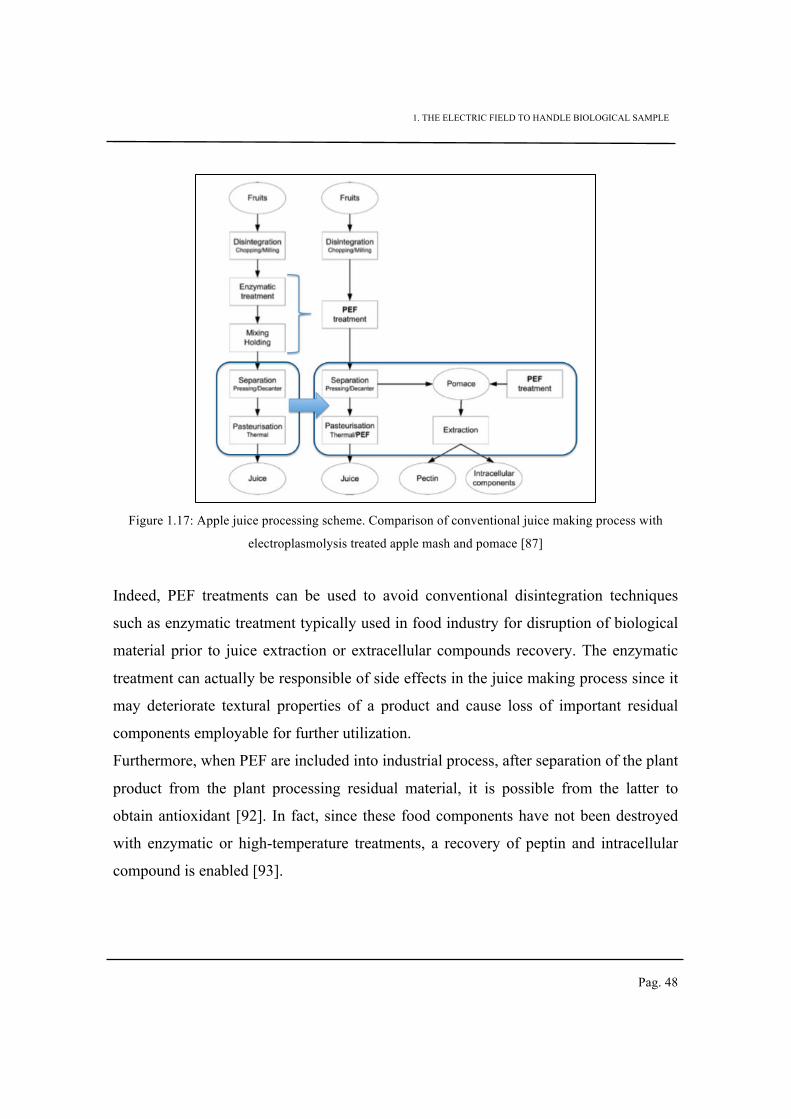
1. THE ELECTRIC FIELD TO HANDLE BIOLOGICAL SAMPLE
Pag. 48
Figure 1.17: Apple juice processing scheme. Comparison of conventional juice making process with
electroplasmolysis treated apple mash and pomace [87]
Indeed, PEF treatments can be used to avoid conventional disintegration techniques
such as enzymatic treatment typically used in food industry for disruption of biological
material prior to juice extraction or extracellular compounds recovery. The enzymatic
treatment can actually be responsible of side effects in the juice making process since it
may deteriorate textural properties of a product and cause loss of important residual
components employable for further utilization.
Furthermore, when PEF are included into industrial process, after separation of the plant
product from the plant processing residual material, it is possible from the latter to
obtain antioxidant [92]. In fact, since these food components have not been destroyed
with enzymatic or high-temperature treatments, a recovery of peptin and intracellular
compound is enabled [93].
1. THE ELECTRIC FIELD TO HANDLE BIOLOGICAL SAMPLE
Pag. 49
PEF treatments can thus enhance the quantity of juice yield obtained and result in
higher pigment release in juice than from samples processed in a conventional way
(higher ß-carotene content for istance [94].
Producers have also to take into account that good flavour and colour characteristics of
a product together with high nutritive value is of primary importance for a customers
and PEF treatment was observed not to deterio- rate these properties maintaining fresh
characteristics of the final product.
Water sterilization
The PEF treatment has found wide applications in food industry as mentioned
previously in the disintegration or pasteurization of food products, but its use may also
be useful in the treatment of wastewater, also considered as a product generated during
processing. For example, the sludge as wastewater process result consists of large
quantities of organic material mostly in the form of a variety of different organisms.
Koners et al [95] have shown a better separation of the sludge and a 45% reduction of
total suspended solids in the excess sludge, by applying 15 kV/cm EF and an input
energy of 100 kJ/l (figure 1.18). Compared to the traditional disintegration techniques
(heat treatment, ultra sound treatments or mechanical rupture), PEF treatment induces a
more efficient permeabilization of the cell membranes with the advantage of a short
processing times.
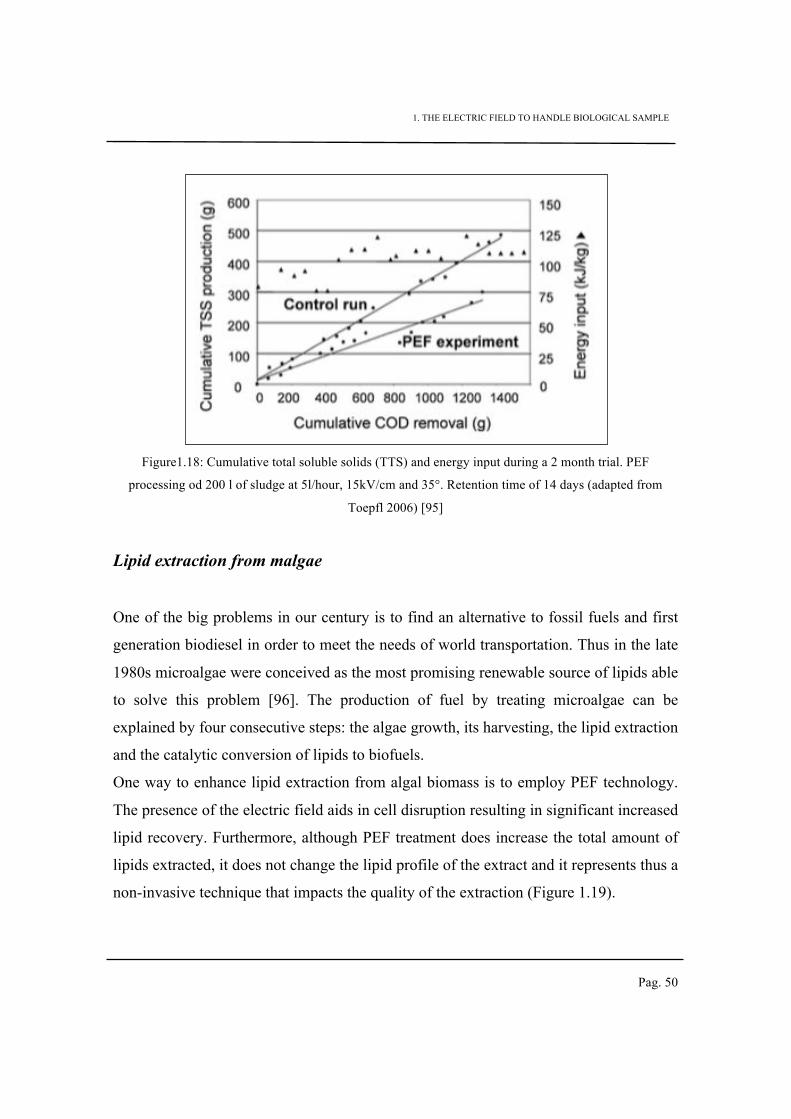
1. THE ELECTRIC FIELD TO HANDLE BIOLOGICAL SAMPLE
Pag. 50
Figure1.18: Cumulative total soluble solids (TTS) and energy input during a 2 month trial. PEF
processing od 200 l of sludge at 5l/hour, 15kV/cm and 35°. Retention time of 14 days (adapted from
Toepfl 2006) [95]
Lipid extraction from malgae
One of the big problems in our century is to find an alternative to fossil fuels and first
generation biodiesel in order to meet the needs of world transportation. Thus in the late
1980s microalgae were conceived as the most promising renewable source of lipids able
to solve this problem [96]. The production of fuel by treating microalgae can be
explained by four consecutive steps: the algae growth, its harvesting, the lipid extraction
and the catalytic conversion of lipids to biofuels.
One way to enhance lipid extraction from algal biomass is to employ PEF technology.
The presence of the electric field aids in cell disruption resulting in significant increased
lipid recovery. Furthermore, although PEF treatment does increase the total amount of
lipids extracted, it does not change the lipid profile of the extract and it represents thus a
non-invasive technique that impacts the quality of the extraction (Figure 1.19).
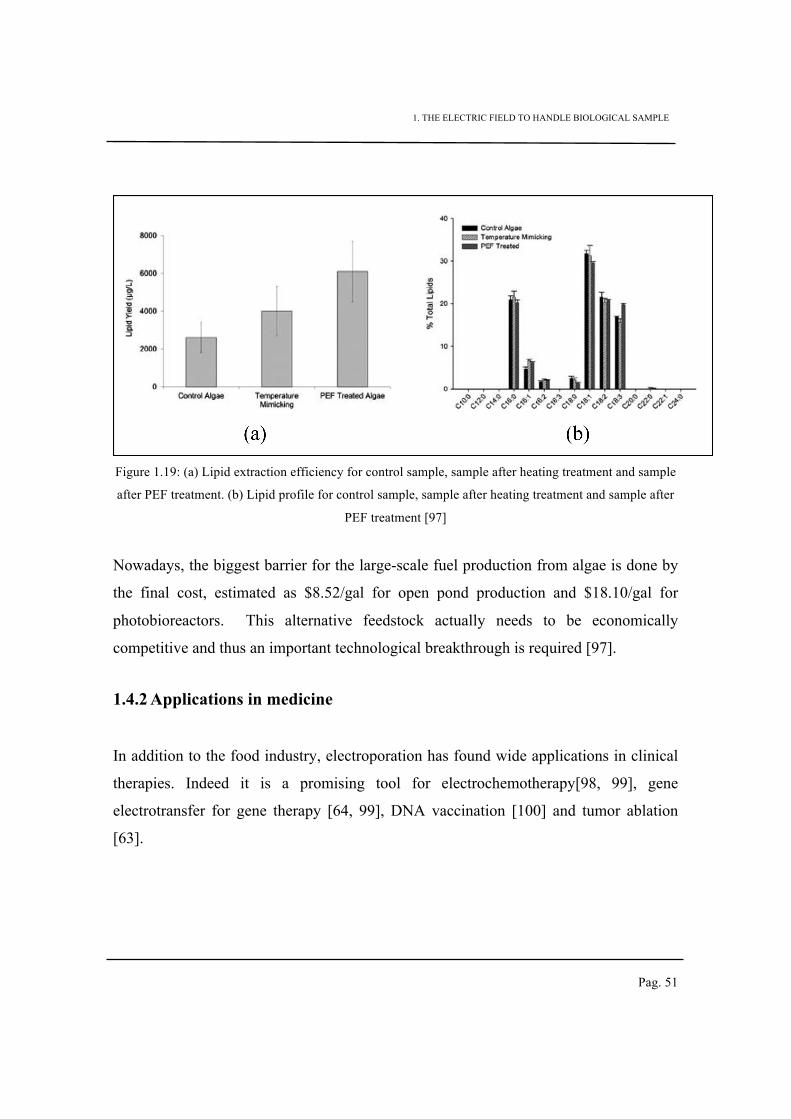
1. THE ELECTRIC FIELD TO HANDLE BIOLOGICAL SAMPLE
Pag. 51
Figure 1.19: (a) Lipid extraction efficiency for control sample, sample after heating treatment and sample
after PEF treatment. (b) Lipid profile for control sample, sample after heating treatment and sample after
PEF treatment [97]
Nowadays, the biggest barrier for the large-scale fuel production from algae is done by
the final cost, estimated as $8.52/gal for open pond production and $18.10/gal for
photobioreactors. This alternative feedstock actually needs to be economically
competitive and thus an important technological breakthrough is required [97].
1.4.2 Applications in medicine
In addition to the food industry, electroporation has found wide applications in clinical
therapies. Indeed it is a promising tool for electrochemotherapy[98, 99], gene
electrotransfer for gene therapy [64, 99], DNA vaccination [100] and tumor ablation
[63].
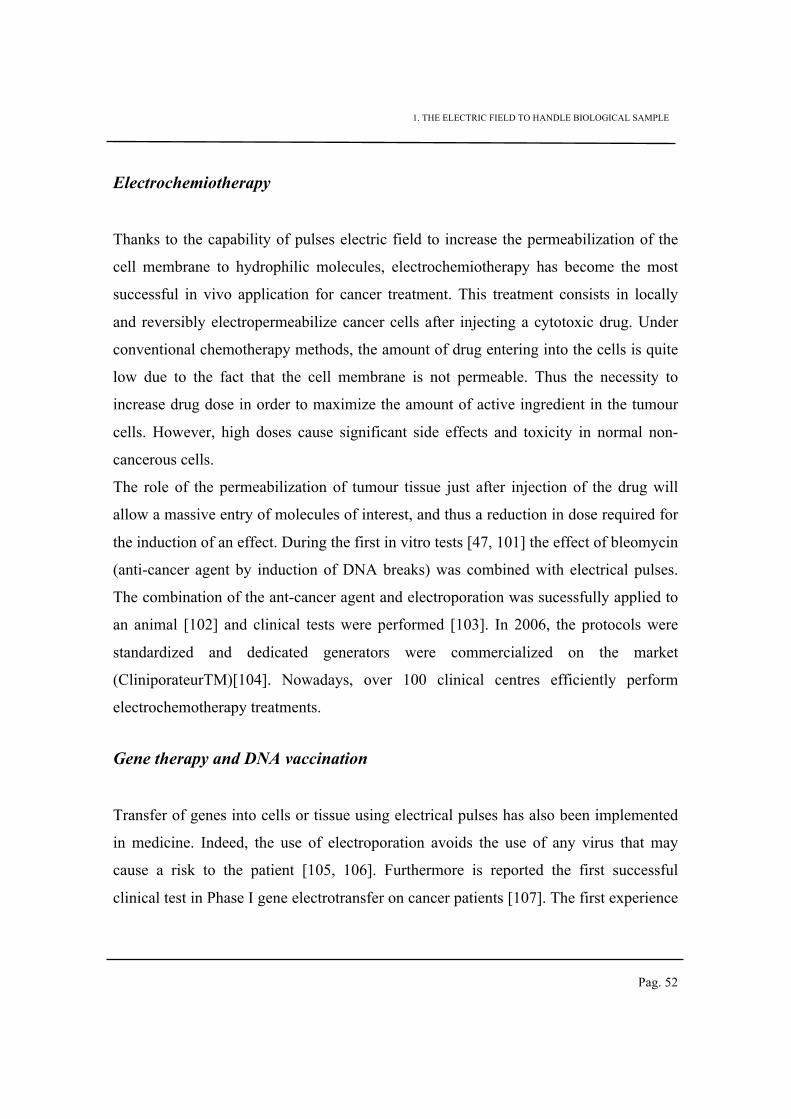
1. THE ELECTRIC FIELD TO HANDLE BIOLOGICAL SAMPLE
Pag. 52
Electrochemiotherapy
Thanks to the capability of pulses electric field to increase the permeabilization of the
cell membrane to hydrophilic molecules, electrochemiotherapy has become the most
successful in vivo application for cancer treatment. This treatment consists in locally
and reversibly electropermeabilize cancer cells after injecting a cytotoxic drug. Under
conventional chemotherapy methods, the amount of drug entering into the cells is quite
low due to the fact that the cell membrane is not permeable. Thus the necessity to
increase drug dose in order to maximize the amount of active ingredient in the tumour
cells. However, high doses cause significant side effects and toxicity in normal non-
cancerous cells.
The role of the permeabilization of tumour tissue just after injection of the drug will
allow a massive entry of molecules of interest, and thus a reduction in dose required for
the induction of an effect. During the first in vitro tests [47, 101] the effect of bleomycin
(anti-cancer agent by induction of DNA breaks) was combined with electrical pulses.
The combination of the ant-cancer agent and electroporation was sucessfully applied to
an animal [102] and clinical tests were performed [103]. In 2006, the protocols were
standardized and dedicated generators were commercialized on the market
(CliniporateurTM)[104]. Nowadays, over 100 clinical centres efficiently perform
electrochemotherapy treatments.
Gene therapy and DNA vaccination
Transfer of genes into cells or tissue using electrical pulses has also been implemented
in medicine. Indeed, the use of electroporation avoids the use of any virus that may
cause a risk to the patient [105, 106]. Furthermore is reported the first successful
clinical test in Phase I gene electrotransfer on cancer patients [107]. The first experience
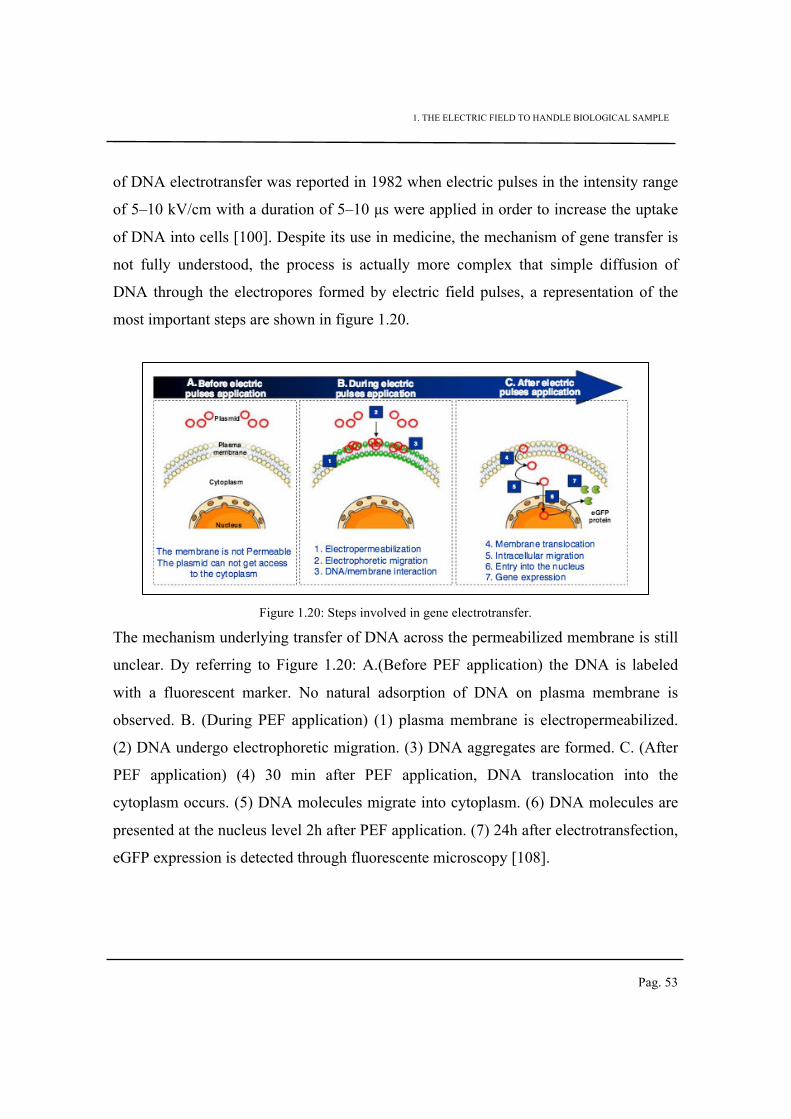
1. THE ELECTRIC FIELD TO HANDLE BIOLOGICAL SAMPLE
Pag. 53
of DNA electrotransfer was reported in 1982 when electric pulses in the intensity range
of 5–10 kV/cm with a duration of 5–10 µs were applied in order to increase the uptake
of DNA into cells [100]. Despite its use in medicine, the mechanism of gene transfer is
not fully understood, the process is actually more complex that simple diffusion of
DNA through the electropores formed by electric field pulses, a representation of the
most important steps are shown in figure 1.20.
Figure 1.20: Steps involved in gene electrotransfer.
The mechanism underlying transfer of DNA across the permeabilized membrane is still
unclear. Dy referring to Figure 1.20: A.(Before PEF application) the DNA is labeled
with a fluorescent marker. No natural adsorption of DNA on plasma membrane is
observed. B. (During PEF application) (1) plasma membrane is electropermeabilized.
(2) DNA undergo electrophoretic migration. (3) DNA aggregates are formed. C. (After
PEF application) (4) 30 min after PEF application, DNA translocation into the
cytoplasm occurs. (5) DNA molecules migrate into cytoplasm. (6) DNA molecules are
presented at the nucleus level 2h after PEF application. (7) 24h after electrotransfection,
eGFP expression is detected through fluorescente microscopy [108].
1. THE ELECTRIC FIELD TO HANDLE BIOLOGICAL SAMPLE
Pag. 54
MCTS Electrotransfer
Multicellular tumor spheroid (MCTS) represents an innovative, relevant model to study
the electrotransfer process in tumor [109]. In MCTS cells are organized in a complex
3D multicellular structure where extracellular matrix and cell-cell interaction are
recognizable; furthermore due to a gradient of oxigen and nutrients from the outer layer
to the inner compartment, MCTS display a differentiation that is typical of the in vivo
tumor [110]. Nowadays spheroids are thus used to elucidate the mechanisms of
electrotransfer and to explain differences of efficacy obtained between in vitro and in
vivo studies [109, 111].
When electric field pulses are applied to the spheroid, the latter become permeabilized
and it changes its structure; it is thus possible to monitor the delivery and quantify the
effects of antitumor drugs in order to check the efficiency of the treatment [111].
As past literature has demonstrated [109], for classical electric conditions (train of 10
electric pulses, with amplitude of 500V/cm and width 5ms, delivered at 1Hz), it is
possible to obtain almost 23% of correctly trasnfected cells and the percentace in the
case of spheroid has revealed to be less than 1%.
These results show how the spheroid can be profitably used to mimic the in vivo
situation, optimize the electrotranfer and prevent potential failures.
Tumor ablation
In the domain of irreversible eletcropermeabilization it is possible to permanently
damage the tumour without intervening by surgery [63]. Indeed, the increase of the
pulse duration or of the pulses number may lead to extensive or permanent
permeabilization of the cell membrane, which eventually provokes the cell death due to
ions leakage. The irreversible electropermeabilization associated to minimal thermal
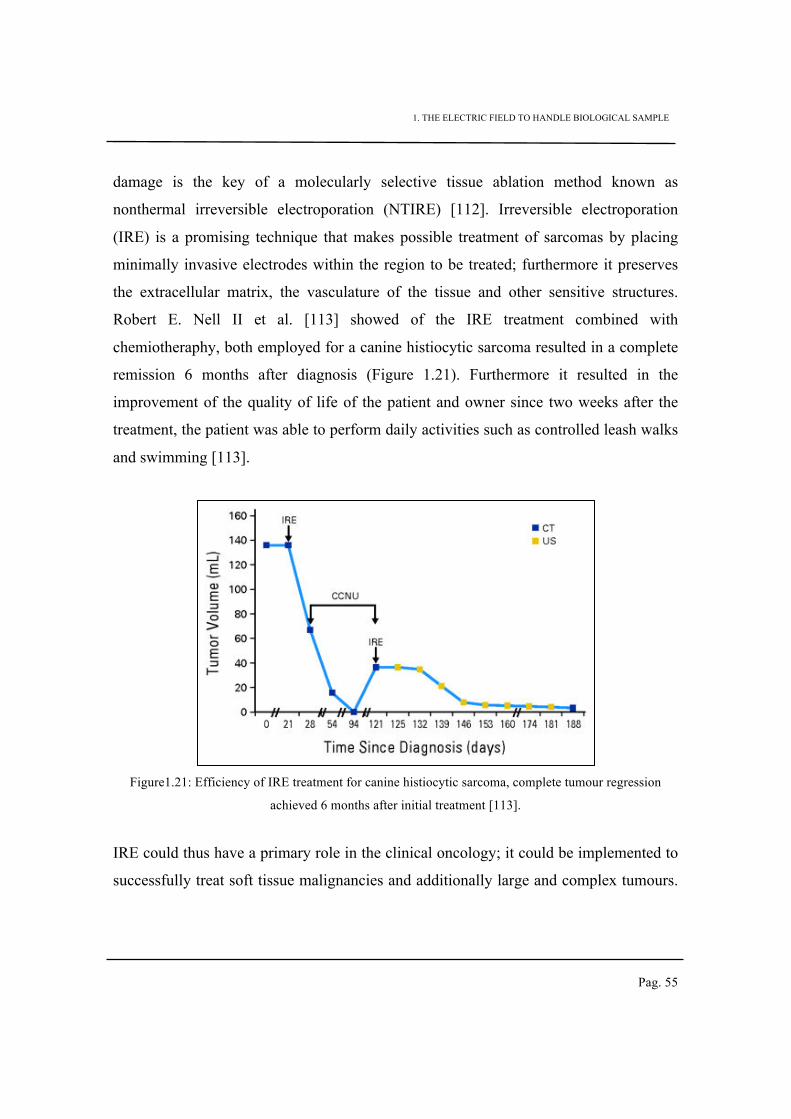
1. THE ELECTRIC FIELD TO HANDLE BIOLOGICAL SAMPLE
Pag. 55
damage is the key of a molecularly selective tissue ablation method known as
nonthermal irreversible electroporation (NTIRE) [112]. Irreversible electroporation
(IRE) is a promising technique that makes possible treatment of sarcomas by placing
minimally invasive electrodes within the region to be treated; furthermore it preserves
the extracellular matrix, the vasculature of the tissue and other sensitive structures.
Robert E. Nell II et al. [113] showed of the IRE treatment combined with
chemiotheraphy, both employed for a canine histiocytic sarcoma resulted in a complete
remission 6 months after diagnosis (Figure 1.21). Furthermore it resulted in the
improvement of the quality of life of the patient and owner since two weeks after the
treatment, the patient was able to perform daily activities such as controlled leash walks
and swimming [113].
Figure1.21: Efficiency of IRE treatment for canine histiocytic sarcoma, complete tumour regression
achieved 6 months after initial treatment [113].
IRE could thus have a primary role in the clinical oncology; it could be implemented to
successfully treat soft tissue malignancies and additionally large and complex tumours.
1. THE ELECTRIC FIELD TO HANDLE BIOLOGICAL SAMPLE
Pag. 56
Indeed, it reveals to be feasible, effective and extremely attractive due to its minimal
invasiveness.
1.5 Conclusion
Since the past, the effects of the electric field on the particles have been investigated
from several researchers and research groups; thus several techniques based on the
application of the electric field on the living have been employed, especially in the field
of cell biology. In addition the use of PEF revealed to be a promising tool for other
applications in the matter of food industry and food preservation as well as for biofuel
production.
The efficiency of the elctropermeabilization is determined by the electric pulse
parameters such as pulses amplitude, width and number. Their optimal values actually
play an important role in the optimization of the permeabilization. Furthermore, when
electric pulses parameters are not properly set cell viability is affected and irreversible
electroporation takes place. We thus investigated the influence of pulses parameters in
relation to the permeabilization level within a biological tissue through bioimpedance
measurements.
Nowadays electropermeabilization is widely used in biology and food industry,
nevertheless the knowledge of the dielectric characteristics (such as permittivity and
conductivity of the membrane and the cytoplasm) of treated cells represents an
important tile which needs to be investigated since it strictly influences the pulses
electric field optimization. Starting from this consideration, we used the combination of
three electric field solicitations (electrorotation, dielectrophoresis and pulses electric
field) with the aim to establish the fingerprint of the cell and estimate its changes due to
electropermeabilization.
1. THE ELECTRIC FIELD TO HANDLE BIOLOGICAL SAMPLE
Pag. 57
The literature offers a great quantity of studies regarding the basic mechanisms of
electroporation at the single cell level, however when approaching a cell tissue model,
the phenomenon become way more complex since the tissue is composed by cells in
close contact and their proximity affects their communication. Thus the importance of a
model that can mimic the in vivo cells organization changes when the permeabilization
occurs: the 3D multicellular spheroid. The spheroid is actually composed of cell
organized in a matrix where typical connections of the in vivo tissue are reproduced.

1. THE ELECTRIC FIELD TO HANDLE BIOLOGICAL SAMPLE
Pag. 58
2. BIOIMPEDANCE MEASUREMENT AS A METHOD TO MONITOR BIOLOGICAL TISSUE PERMEABILIZATION
Pag. 59
Chapter 2
Bioimpedance measurement as a method to monitor
biological tissue permeabilization
Bioimpedance measurement reveals to be a promising tool in biomedical engineering
since it represents a method to monitor the physiological variations of a biological
tissue. Furthermore the detection of dielectric properties changes due to pulsed electric
field (PEF) application is a way to study the effect of the permeabilization phenomenon.
Nowadays, there is a growing interest in the application of PEF to the tissue since it
represents a non-thermal technology for clinical and industrial application [98, 99, 114,
115]. For example it has been shown how the PEF application enhances the
effectiveness of the chemotherapeutic drugs since it allow non-permeant molecules to
enter into the cell [98]. Preclinical trials with mice have shown the great advantage of
the local delivery achieved by applying the PEF after the administration of the drug
[103, 116]. As just mentioned, the tissue permeabilization represents also a field of
interest for industrial application such as food preservation and processing [117].
The capability of monitoring in real time physiological changes of the tissue is a way to
customize treatments and optimized experimental conditions.
Thus several groups investigated tissue permeabilization by using either optical or
electrical methods (fluorescence microscopy and bioimpedance spectroscopy
respectively). In the case of fluorescence spectroscopy, the idea is to insert into the
tissue a dye which emits an optical signal when the permeabilization is successfully
2. BIOIMPEDANCE MEASUREMENT AS A METHOD TO MONITOR BIOLOGICAL TISSUE PERMEABILIZATION
Pag. 60
achieved; the tissue is previously treated by PEF and successively stimulated at a
characteristic excitation wavelength in order to check if there is an emission signal, in
some cases the detection is performed after few days depending on the fluorescence
molecule employed. This technique reveals to be efficient and precise, nevertheless a
proper experimental platform needs to be set in order to perform the study and,
consequently, associated costs are really high.
Compare to fluorescence methods, bioimpedance technique is easily implemented (only
a set of 2 or 4 electrodes are needed and a low-cost instrumentation) and it has the
advantage of monitoring physiological changes in real time.
We thus propose to use bioimpedance spectroscopy as an innovative approach to
monitor, quantify and analyze changes induced by various characteristics of PEF
applied by a simple pair of metal needles inserted in the tissue. The dependence of the
tissue model (here the Cole-Cole model) with the level of permeabilization is deeply
examined and discussed.
Furthermore the monitoring of the bioimpedance of a cell tissue is a method that can be
used to determine the efficiency of its electropermeabilization with respect to different
PEF characteristics. Such analysis might be the key to determine the appropriate
electrical conditions to achieve the desired degree of tissue permeabilization without
causing unrecoverable alteration of the tissue.
1.6 The impedance spectroscopy.
In last years impedance spectroscopy revealed to play an important role in fundamental
and applied electrochemistry and materials science. Indeed it was widely employed to
characterize the electrical behavior of complex systems. Furthermore thanks to the
current availability of commercial devices, able to cover from the millihertz to
megahertz frequency range, it appears certain that impedance studies will become
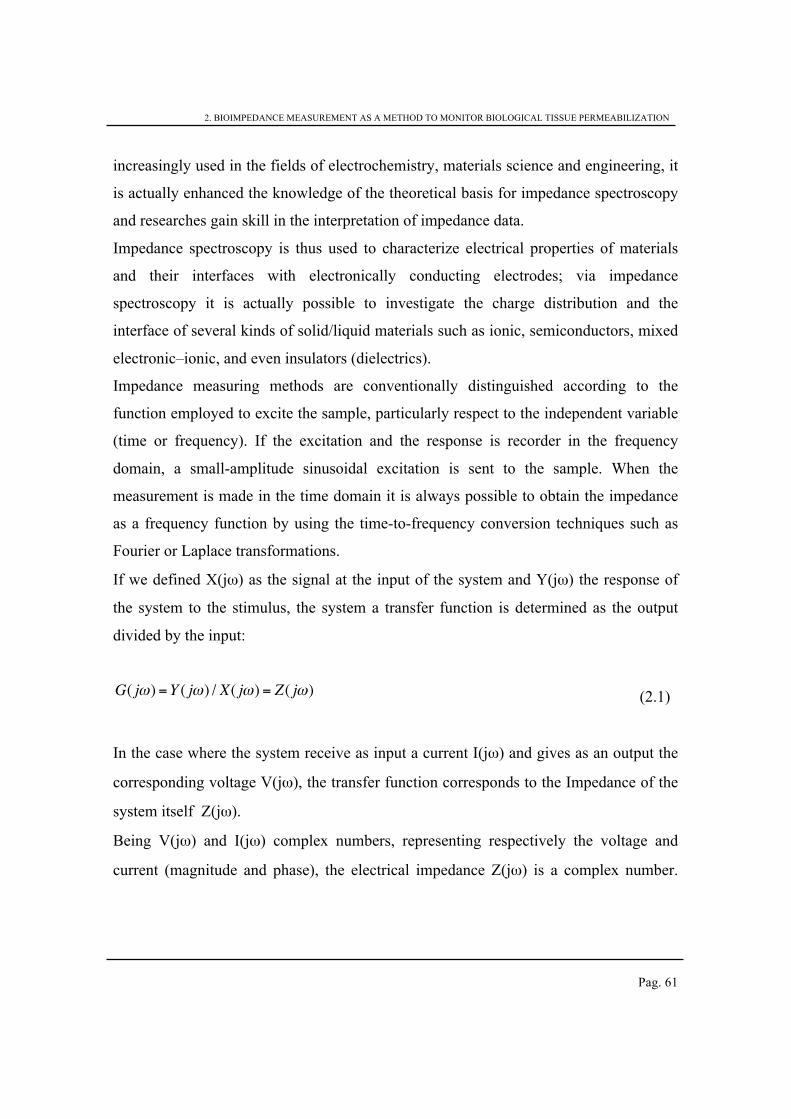
2. BIOIMPEDANCE MEASUREMENT AS A METHOD TO MONITOR BIOLOGICAL TISSUE PERMEABILIZATION
Pag. 61
increasingly used in the fields of electrochemistry, materials science and engineering, it
is actually enhanced the knowledge of the theoretical basis for impedance spectroscopy
and researches gain skill in the interpretation of impedance data.
Impedance spectroscopy is thus used to characterize electrical properties of materials
and their interfaces with electronically conducting electrodes; via impedance
spectroscopy it is actually possible to investigate the charge distribution and the
interface of several kinds of solid/liquid materials such as ionic, semiconductors, mixed
electronic–ionic, and even insulators (dielectrics).
Impedance measuring methods are conventionally distinguished according to the
function employed to excite the sample, particularly respect to the independent variable
(time or frequency). If the excitation and the response is recorder in the frequency
domain, a small-amplitude sinusoidal excitation is sent to the sample. When the
measurement is made in the time domain it is always possible to obtain the impedance
as a frequency function by using the time-to-frequency conversion techniques such as
Fourier or Laplace transformations.
If we defined X(jω) as the signal at the input of the system and Y(jω) the response of
the system to the stimulus, the system a transfer function is determined as the output
divided by the input:
G( jω) =Y ( jω) / X( jω) = Z( jω) (2.1)
In the case where the system receive as input a current I(jω) and gives as an output the
corresponding voltage V(jω), the transfer function corresponds to the Impedance of the
system itself Z(jω).
Being V(jω) and I(jω) complex numbers, representing respectively the voltage and
current (magnitude and phase), the electrical impedance Z(jω) is a complex number.
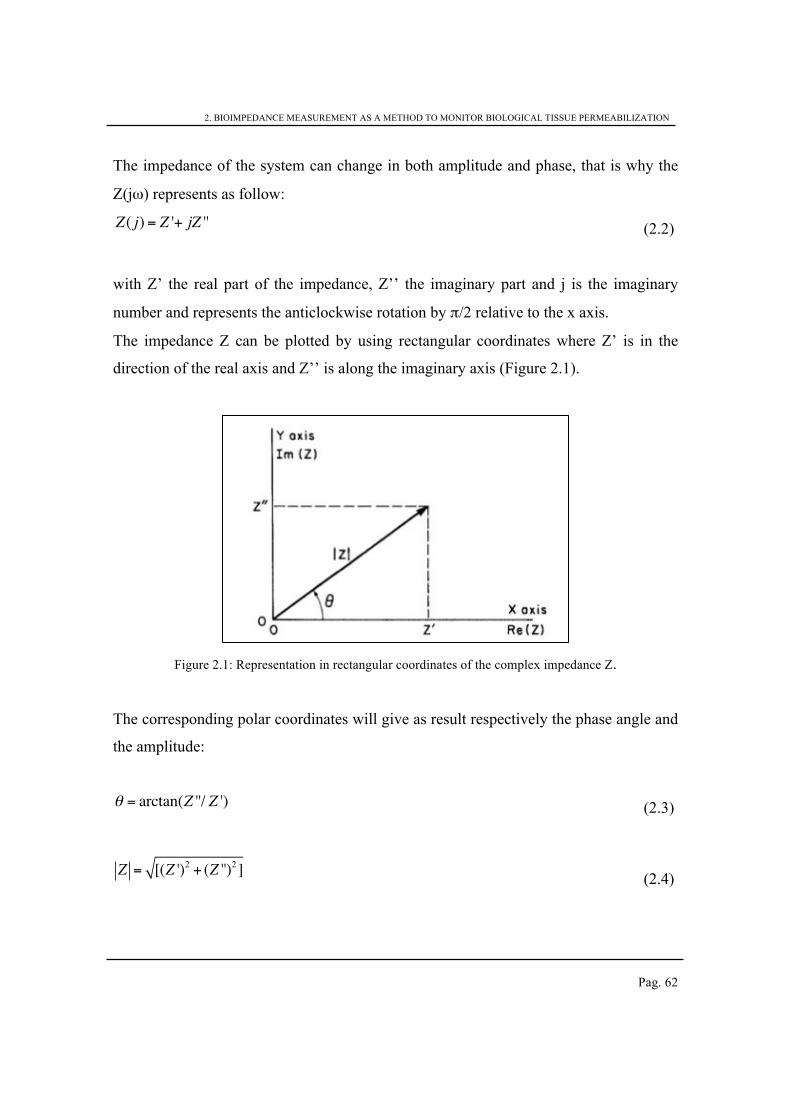
2. BIOIMPEDANCE MEASUREMENT AS A METHOD TO MONITOR BIOLOGICAL TISSUE PERMEABILIZATION
Pag. 62
The impedance of the system can change in both amplitude and phase, that is why the
Z(jω) represents as follow:
Z( j) = Z '+ jZ '' (2.2)
with Z’ the real part of the impedance, Z’’ the imaginary part and j is the imaginary
number and represents the anticlockwise rotation by π/2 relative to the x axis.
The impedance Z can be plotted by using rectangular coordinates where Z’ is in the
direction of the real axis and Z’’ is along the imaginary axis (Figure 2.1).
Figure 2.1: Representation in rectangular coordinates of the complex impedance Z.
The corresponding polar coordinates will give as result respectively the phase angle and
the amplitude:
θ = arctan(Z ''/ Z ') (2.3)
Z = [(Z ')2+ (Z '')
2] (2.4)
2. BIOIMPEDANCE MEASUREMENT AS A METHOD TO MONITOR BIOLOGICAL TISSUE PERMEABILIZATION
Pag. 63
In this chapter Z will be treated as frequency-dependent and the resulting evolution of Z
respect to angular frequency w will give information about the full system: the
impedance of the tissue and its interface with the electrodes.
2.1.1 The Bioimpedance
The term “bioimpedance” is employed when electrical properties of a biological tissue
are measured by using a current flows through it. Indeed bioimpedance deals with the
capability of the tissue to oppose (“impede”) the passage of current circulation due to
sample electrical properties. The bioimpedance measurement is frequency dependent
and it varies with the different tissue type. The first impedance measurements on
biological tissue refer to the late eighteenth century, with the experiments made by
Galvani [118]. This field was investigated in order to know more about electrical
properties of the sample under test.
It is common practice to depict equivalent circuit models of the tissue bioimpedance in
order to attribute a physical meaning to the impedance parameters.
On a macroscopic scale, the living body is composed of a wide variety of biological
tissues with very different properties. Within the biological tissues it is possible to
distinguish between animal tissues and plant tissues.
Animal tissues mostly get formed during embryonic development from the three germ
layers (ectoderm, mesoderm, endoderm). Animal tissues consist of specialized cells
organized in an environment were a specific fluid fills the intercellular spaces
(extracellular matrix). They are grouped into four main categories: epithelial,
connective, nervous, and muscular. The epithelial tissue has a protective function
(epithelium); the connective tissue plays a function of connection and support for the
other tissues; muscle tissue is constituted by cells called muscle fibers (muscle); the
2. BIOIMPEDANCE MEASUREMENT AS A METHOD TO MONITOR BIOLOGICAL TISSUE PERMEABILIZATION
Pag. 64
nerve tissue is specialized in receiving stimuli and transmit nerve signals (nervous
system).
In the case of plant it is possible to distinguish between differentiated tissues derived
from the undifferentiated cells of an embryonic tissues, which is therefore able to
produce new tissues throughout all the plant life. Plant tissues are classified into
tegumentary tissues (which constitute shell of the plant such as cork and bark);
conductive tissues responsible of the plant support and fundamental tissues with the
function of support, filling, and reserve.
Nevertheless, despite the differentiation and the specific functions, a biological tissue
can be considered composed by an agglomerate of cell with similar form, structure and
functions that, in the majority of cases, have common embryological origin.
The various functions are distributed among distinct populations of cells, tissues and
organs, which can also be very far apart, thus a complex communication network is
required. The signal between cells can be transmitted by two different ways related to
the distance between them: between cells distant from each other, the signals must be
exchanged in an indirect manner, through the secretion of substances such as hormones;
is cells are close, communication takes place in a direct way, through structures which
allow communication between adjacent cells (membrane proteins for instance) [119].
The electrical properties of a biological tissue is determined by its components, thus by
the cells that compose the tissue itself.
As a first approximation, each of these cell can be considered as a membrane that
encloses an intracellular compartment submerged on a extracellular medium. The cell
constitution is actually far more complex, in fact the extracellular medium, which
bathes the cells, contains protein and electrolyte (plasma, interstitial fluid) and the cell,
enclosed by a plasma membrane lipid bilayer, contains organelles and the cell nucleus.
Moreover a tissue can be defined as an “aggregate of cells (and of substances produced
by them) with similar structure and similar functions, and, for the most part, with
common embryological origin [120]”.
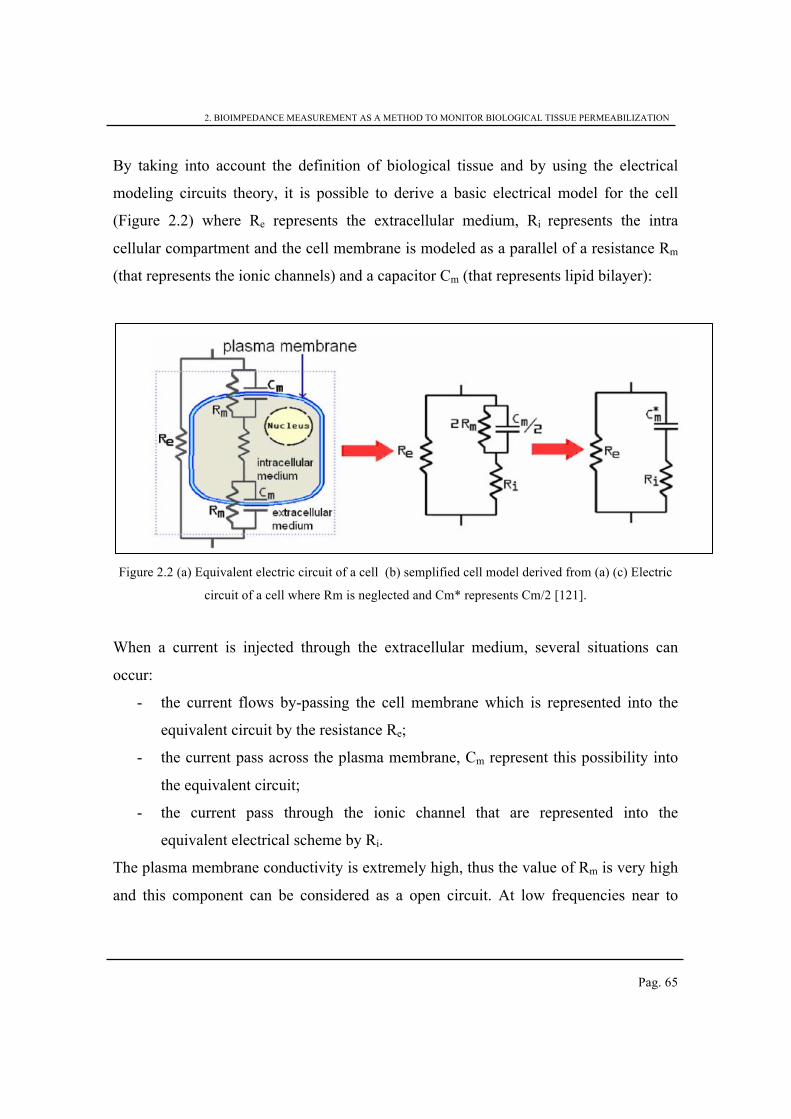
2. BIOIMPEDANCE MEASUREMENT AS A METHOD TO MONITOR BIOLOGICAL TISSUE PERMEABILIZATION
Pag. 65
By taking into account the definition of biological tissue and by using the electrical
modeling circuits theory, it is possible to derive a basic electrical model for the cell
(Figure 2.2) where Re represents the extracellular medium, Ri represents the intra
cellular compartment and the cell membrane is modeled as a parallel of a resistance Rm
(that represents the ionic channels) and a capacitor Cm (that represents lipid bilayer):
Figure 2.2 (a) Equivalent electric circuit of a cell (b) semplified cell model derived from (a) (c) Electric
circuit of a cell where Rm is neglected and Cm* represents Cm/2 [121].
When a current is injected through the extracellular medium, several situations can
occur:
- the current flows by-passing the cell membrane which is represented into the
equivalent circuit by the resistance Re;
- the current pass across the plasma membrane, Cm represent this possibility into
the equivalent circuit;
- the current pass through the ionic channel that are represented into the
equivalent electrical scheme by Ri.
The plasma membrane conductivity is extremely high, thus the value of Rm is very high
and this component can be considered as a open circuit. At low frequencies near to
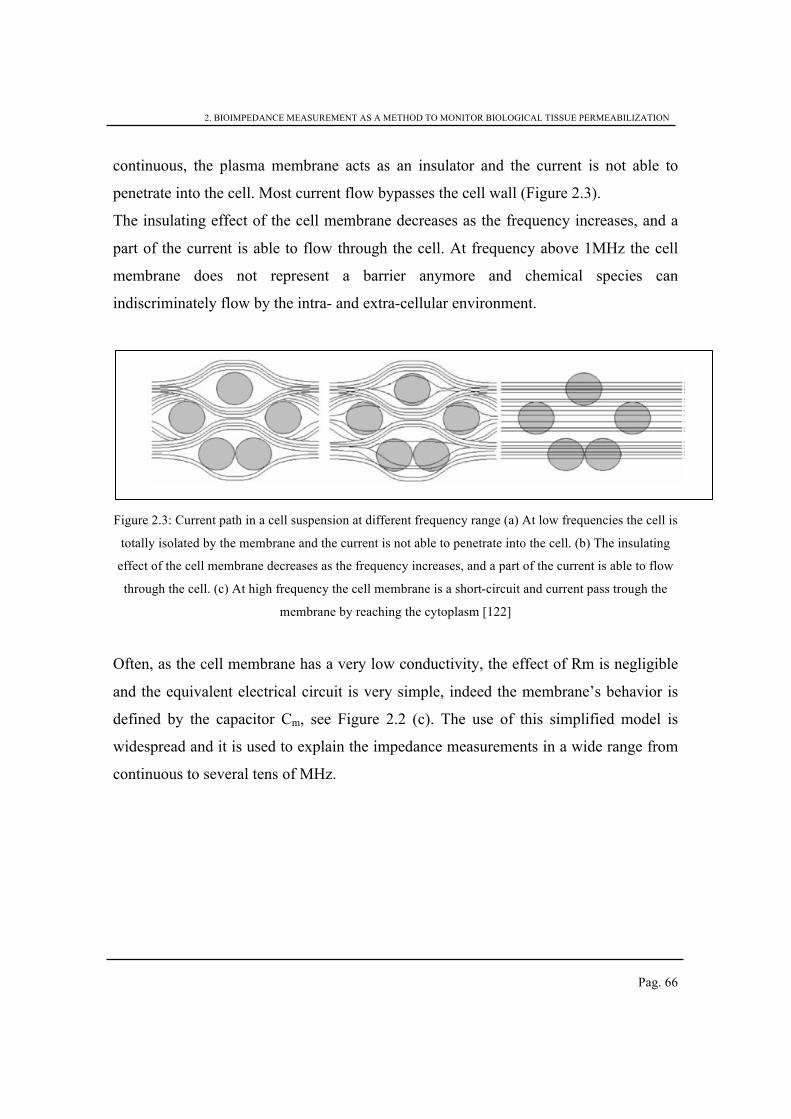
2. BIOIMPEDANCE MEASUREMENT AS A METHOD TO MONITOR BIOLOGICAL TISSUE PERMEABILIZATION
Pag. 66
continuous, the plasma membrane acts as an insulator and the current is not able to
penetrate into the cell. Most current flow bypasses the cell wall (Figure 2.3).
The insulating effect of the cell membrane decreases as the frequency increases, and a
part of the current is able to flow through the cell. At frequency above 1MHz the cell
membrane does not represent a barrier anymore and chemical species can
indiscriminately flow by the intra- and extra-cellular environment.
Figure 2.3: Current path in a cell suspension at different frequency range (a) At low frequencies the cell is
totally isolated by the membrane and the current is not able to penetrate into the cell. (b) The insulating
effect of the cell membrane decreases as the frequency increases, and a part of the current is able to flow
through the cell. (c) At high frequency the cell membrane is a short-circuit and current pass trough the
membrane by reaching the cytoplasm [122]
Often, as the cell membrane has a very low conductivity, the effect of Rm is negligible
and the equivalent electrical circuit is very simple, indeed the membrane’s behavior is
defined by the capacitor Cm, see Figure 2.2 (c). The use of this simplified model is
widespread and it is used to explain the impedance measurements in a wide range from
continuous to several tens of MHz.
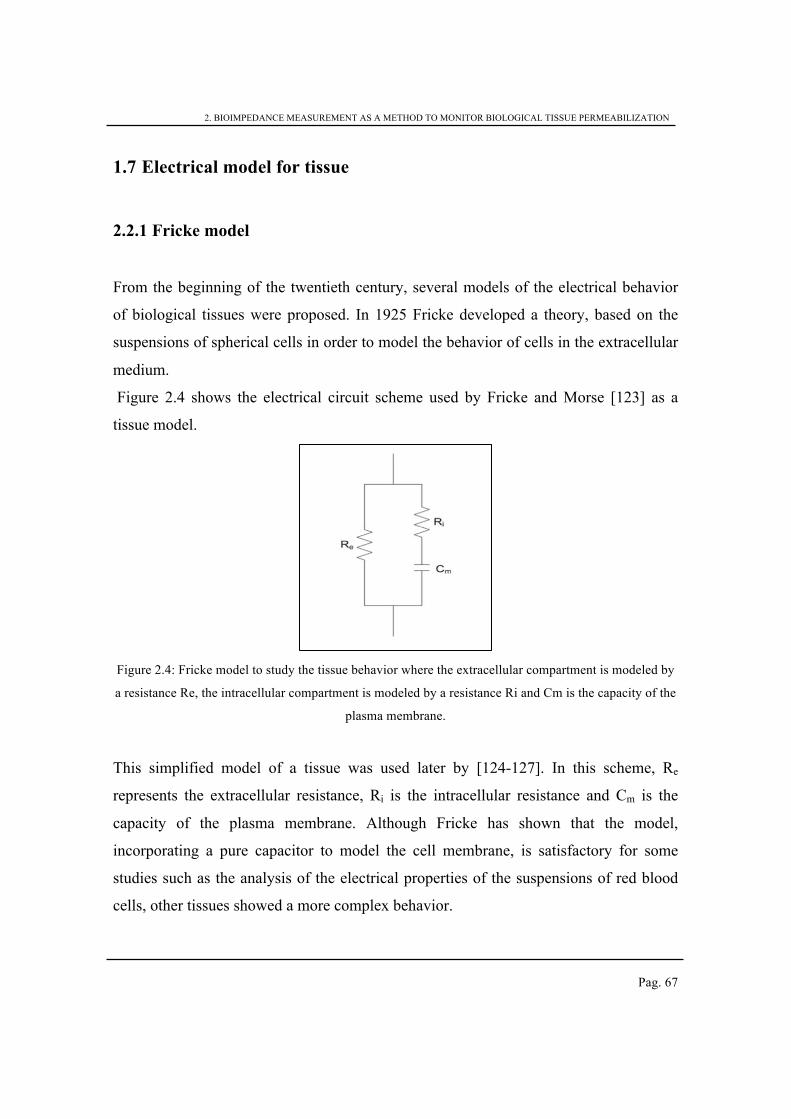
2. BIOIMPEDANCE MEASUREMENT AS A METHOD TO MONITOR BIOLOGICAL TISSUE PERMEABILIZATION
Pag. 67
1.7 Electrical model for tissue
2.2.1 Fricke model
From the beginning of the twentieth century, several models of the electrical behavior
of biological tissues were proposed. In 1925 Fricke developed a theory, based on the
suspensions of spherical cells in order to model the behavior of cells in the extracellular
medium.
Figure 2.4 shows the electrical circuit scheme used by Fricke and Morse [123] as a
tissue model.
Figure 2.4: Fricke model to study the tissue behavior where the extracellular compartment is modeled by
a resistance Re, the intracellular compartment is modeled by a resistance Ri and Cm is the capacity of the
plasma membrane.
This simplified model of a tissue was used later by [124-127]. In this scheme, Re
represents the extracellular resistance, Ri is the intracellular resistance and Cm is the
capacity of the plasma membrane. Although Fricke has shown that the model,
incorporating a pure capacitor to model the cell membrane, is satisfactory for some
studies such as the analysis of the electrical properties of the suspensions of red blood
cells, other tissues showed a more complex behavior.
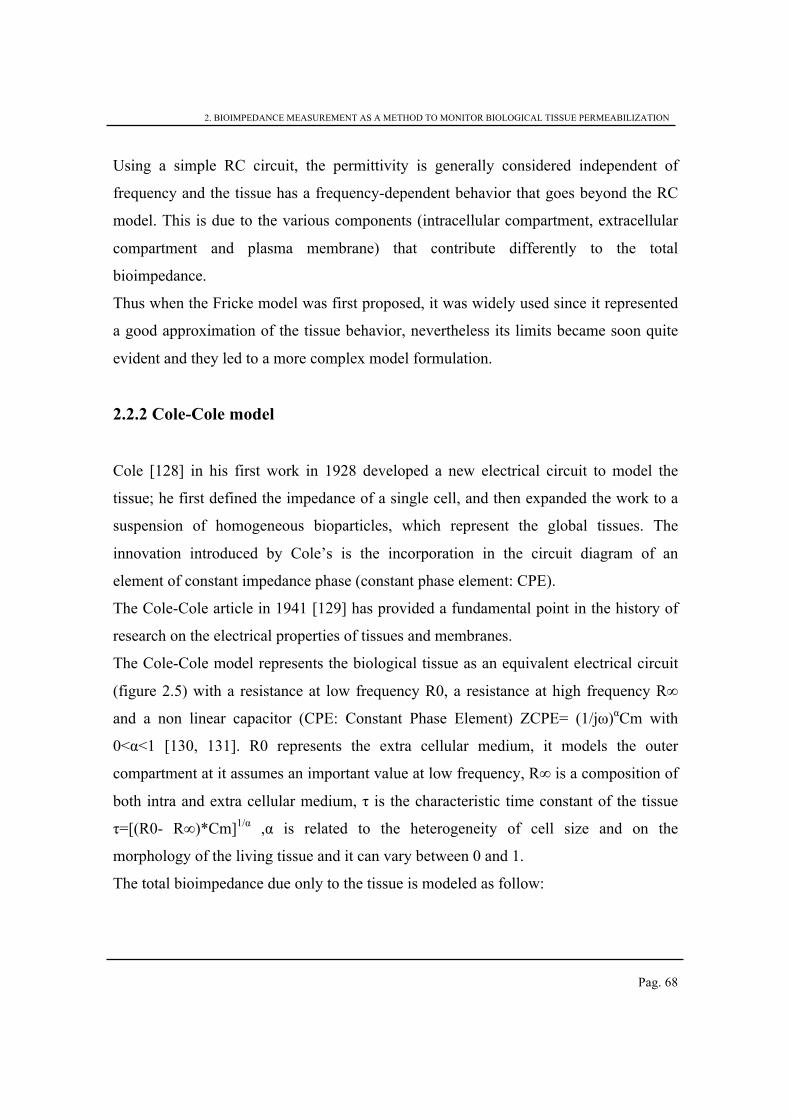
2. BIOIMPEDANCE MEASUREMENT AS A METHOD TO MONITOR BIOLOGICAL TISSUE PERMEABILIZATION
Pag. 68
Using a simple RC circuit, the permittivity is generally considered independent of
frequency and the tissue has a frequency-dependent behavior that goes beyond the RC
model. This is due to the various components (intracellular compartment, extracellular
compartment and plasma membrane) that contribute differently to the total
bioimpedance.
Thus when the Fricke model was first proposed, it was widely used since it represented
a good approximation of the tissue behavior, nevertheless its limits became soon quite
evident and they led to a more complex model formulation.
2.2.2 Cole-Cole model
Cole [128] in his first work in 1928 developed a new electrical circuit to model the
tissue; he first defined the impedance of a single cell, and then expanded the work to a
suspension of homogeneous bioparticles, which represent the global tissues. The
innovation introduced by Cole’s is the incorporation in the circuit diagram of an
element of constant impedance phase (constant phase element: CPE).
The Cole-Cole article in 1941 [129] has provided a fundamental point in the history of
research on the electrical properties of tissues and membranes.
The Cole-Cole model represents the biological tissue as an equivalent electrical circuit
(figure 2.5) with a resistance at low frequency R0, a resistance at high frequency R∞
and a non linear capacitor (CPE: Constant Phase Element) ZCPE= (1/jω)αCm with
0<α<1 [130, 131]. R0 represents the extra cellular medium, it models the outer
compartment at it assumes an important value at low frequency, R∞ is a composition of
both intra and extra cellular medium, τ is the characteristic time constant of the tissue
τ=[(R0- R∞)*Cm]1/α ,α is related to the heterogeneity of cell size and on the
morphology of the living tissue and it can vary between 0 and 1.
The total bioimpedance due only to the tissue is modeled as follow:
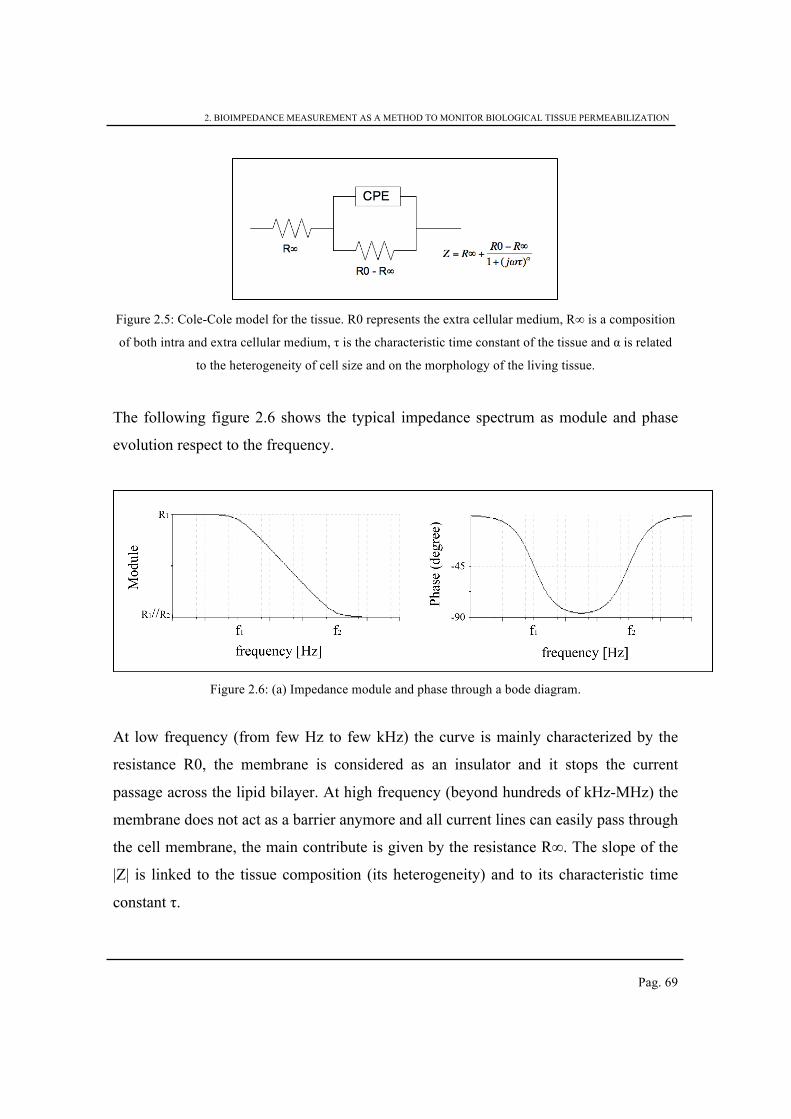
2. BIOIMPEDANCE MEASUREMENT AS A METHOD TO MONITOR BIOLOGICAL TISSUE PERMEABILIZATION
Pag. 69
Figure 2.5: Cole-Cole model for the tissue. R0 represents the extra cellular medium, R∞ is a composition
of both intra and extra cellular medium, τ is the characteristic time constant of the tissue and α is related
to the heterogeneity of cell size and on the morphology of the living tissue.
The following figure 2.6 shows the typical impedance spectrum as module and phase
evolution respect to the frequency.
Figure 2.6: (a) Impedance module and phase through a bode diagram.
At low frequency (from few Hz to few kHz) the curve is mainly characterized by the
resistance R0, the membrane is considered as an insulator and it stops the current
passage across the lipid bilayer. At high frequency (beyond hundreds of kHz-MHz) the
membrane does not act as a barrier anymore and all current lines can easily pass through
the cell membrane, the main contribute is given by the resistance R∞. The slope of the
|Z| is linked to the tissue composition (its heterogeneity) and to its characteristic time
constant τ.
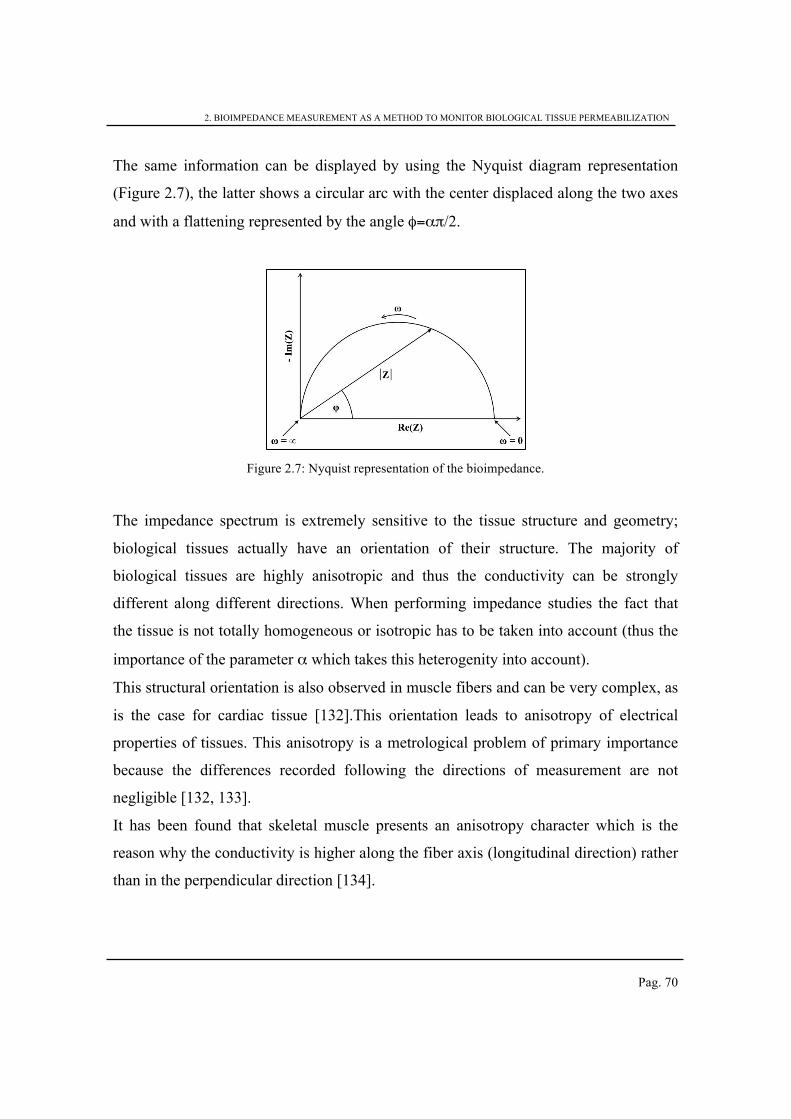
2. BIOIMPEDANCE MEASUREMENT AS A METHOD TO MONITOR BIOLOGICAL TISSUE PERMEABILIZATION
Pag. 70
The same information can be displayed by using the Nyquist diagram representation
(Figure 2.7), the latter shows a circular arc with the center displaced along the two axes
and with a flattening represented by the angle φ=απ/2.
Figure 2.7: Nyquist representation of the bioimpedance.
The impedance spectrum is extremely sensitive to the tissue structure and geometry;
biological tissues actually have an orientation of their structure. The majority of
biological tissues are highly anisotropic and thus the conductivity can be strongly
different along different directions. When performing impedance studies the fact that
the tissue is not totally homogeneous or isotropic has to be taken into account (thus the
importance of the parameter α which takes this heterogenity into account).
This structural orientation is also observed in muscle fibers and can be very complex, as
is the case for cardiac tissue [132].This orientation leads to anisotropy of electrical
properties of tissues. This anisotropy is a metrological problem of primary importance
because the differences recorded following the directions of measurement are not
negligible [132, 133].
It has been found that skeletal muscle presents an anisotropy character which is the
reason why the conductivity is higher along the fiber axis (longitudinal direction) rather
than in the perpendicular direction [134].
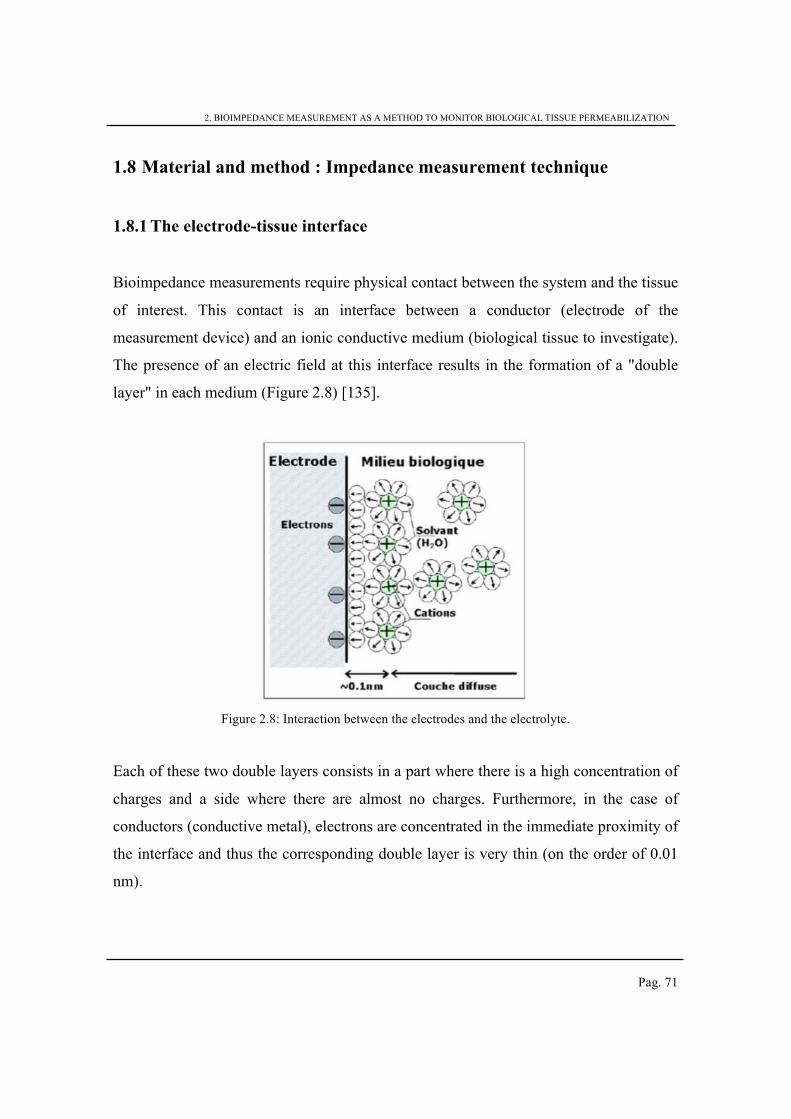
2. BIOIMPEDANCE MEASUREMENT AS A METHOD TO MONITOR BIOLOGICAL TISSUE PERMEABILIZATION
Pag. 71
1.8 Material and method : Impedance measurement technique
1.8.1 The electrode-tissue interface
Bioimpedance measurements require physical contact between the system and the tissue
of interest. This contact is an interface between a conductor (electrode of the
measurement device) and an ionic conductive medium (biological tissue to investigate).
The presence of an electric field at this interface results in the formation of a "double
layer" in each medium (Figure 2.8) [135].
Figure 2.8: Interaction between the electrodes and the electrolyte.
Each of these two double layers consists in a part where there is a high concentration of
charges and a side where there are almost no charges. Furthermore, in the case of
conductors (conductive metal), electrons are concentrated in the immediate proximity of
the interface and thus the corresponding double layer is very thin (on the order of 0.01
nm).
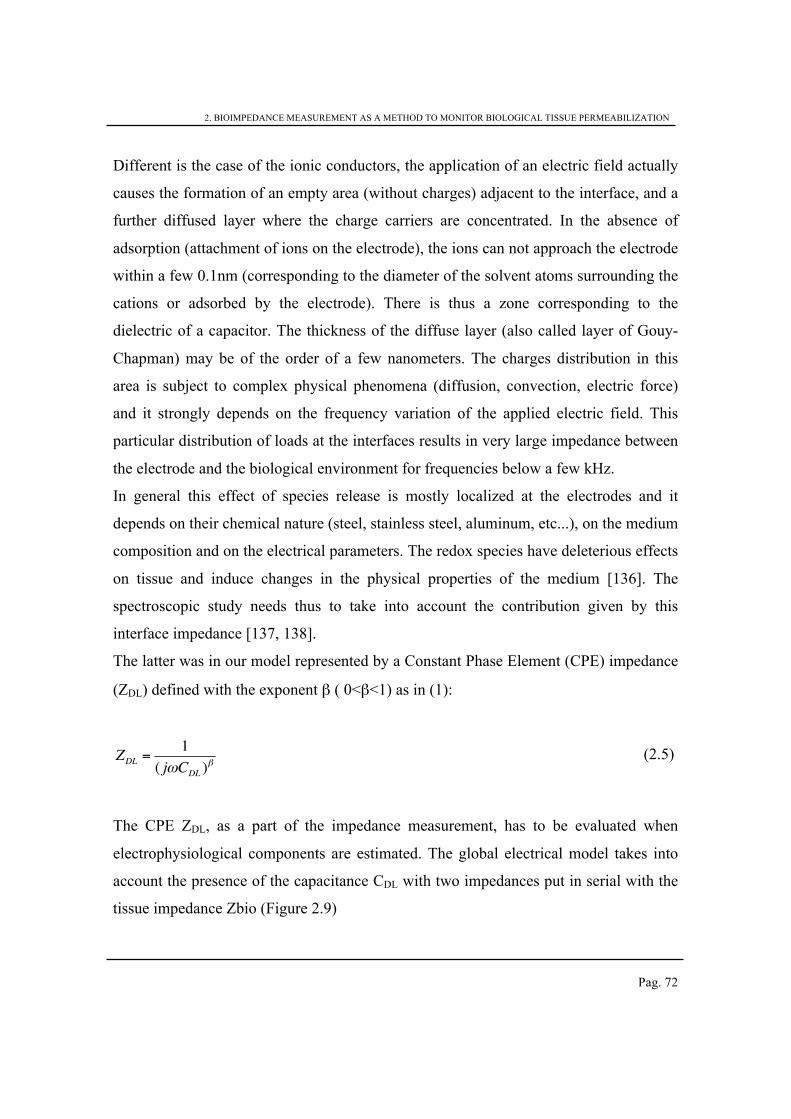
2. BIOIMPEDANCE MEASUREMENT AS A METHOD TO MONITOR BIOLOGICAL TISSUE PERMEABILIZATION
Pag. 72
Different is the case of the ionic conductors, the application of an electric field actually
causes the formation of an empty area (without charges) adjacent to the interface, and a
further diffused layer where the charge carriers are concentrated. In the absence of
adsorption (attachment of ions on the electrode), the ions can not approach the electrode
within a few 0.1nm (corresponding to the diameter of the solvent atoms surrounding the
cations or adsorbed by the electrode). There is thus a zone corresponding to the
dielectric of a capacitor. The thickness of the diffuse layer (also called layer of Gouy-
Chapman) may be of the order of a few nanometers. The charges distribution in this
area is subject to complex physical phenomena (diffusion, convection, electric force)
and it strongly depends on the frequency variation of the applied electric field. This
particular distribution of loads at the interfaces results in very large impedance between
the electrode and the biological environment for frequencies below a few kHz.
In general this effect of species release is mostly localized at the electrodes and it
depends on their chemical nature (steel, stainless steel, aluminum, etc...), on the medium
composition and on the electrical parameters. The redox species have deleterious effects
on tissue and induce changes in the physical properties of the medium [136]. The
spectroscopic study needs thus to take into account the contribution given by this
interface impedance [137, 138].
The latter was in our model represented by a Constant Phase Element (CPE) impedance
(ZDL) defined with the exponent β ( 0<β<1) as in (1):
ZDL =1
( jωCDL )β
(2.5)
The CPE ZDL, as a part of the impedance measurement, has to be evaluated when
electrophysiological components are estimated. The global electrical model takes into
account the presence of the capacitance CDL with two impedances put in serial with the
tissue impedance Zbio (Figure 2.9)
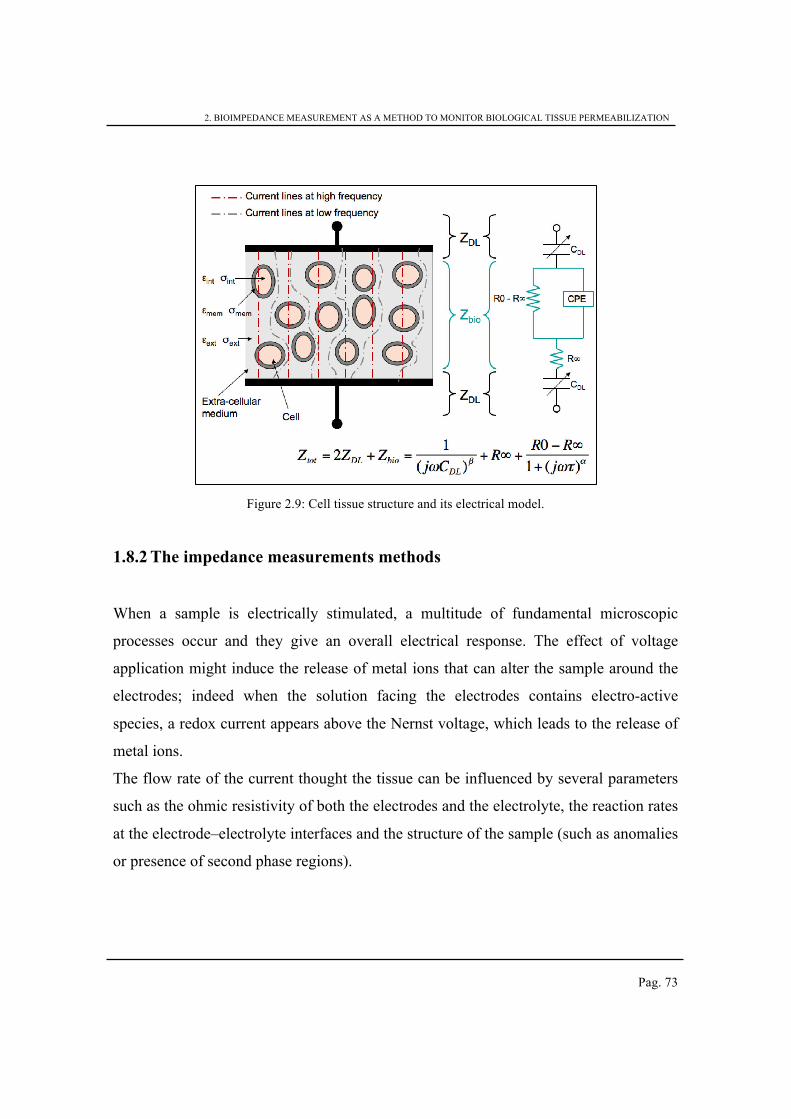
2. BIOIMPEDANCE MEASUREMENT AS A METHOD TO MONITOR BIOLOGICAL TISSUE PERMEABILIZATION
Pag. 73
Figure 2.9: Cell tissue structure and its electrical model.
1.8.2 The impedance measurements methods
When a sample is electrically stimulated, a multitude of fundamental microscopic
processes occur and they give an overall electrical response. The effect of voltage
application might induce the release of metal ions that can alter the sample around the
electrodes; indeed when the solution facing the electrodes contains electro-active
species, a redox current appears above the Nernst voltage, which leads to the release of
metal ions.
The flow rate of the current thought the tissue can be influenced by several parameters
such as the ohmic resistivity of both the electrodes and the electrolyte, the reaction rates
at the electrode–electrolyte interfaces and the structure of the sample (such as anomalies
or presence of second phase regions).
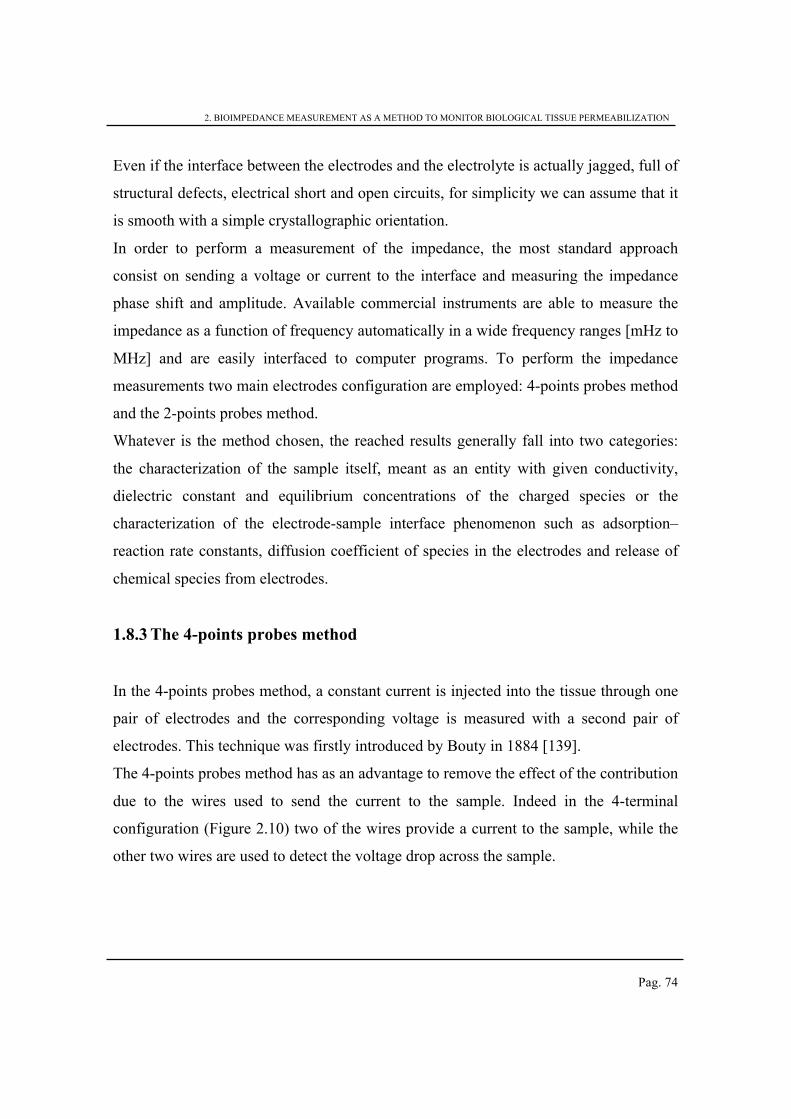
2. BIOIMPEDANCE MEASUREMENT AS A METHOD TO MONITOR BIOLOGICAL TISSUE PERMEABILIZATION
Pag. 74
Even if the interface between the electrodes and the electrolyte is actually jagged, full of
structural defects, electrical short and open circuits, for simplicity we can assume that it
is smooth with a simple crystallographic orientation.
In order to perform a measurement of the impedance, the most standard approach
consist on sending a voltage or current to the interface and measuring the impedance
phase shift and amplitude. Available commercial instruments are able to measure the
impedance as a function of frequency automatically in a wide frequency ranges [mHz to
MHz] and are easily interfaced to computer programs. To perform the impedance
measurements two main electrodes configuration are employed: 4-points probes method
and the 2-points probes method.
Whatever is the method chosen, the reached results generally fall into two categories:
the characterization of the sample itself, meant as an entity with given conductivity,
dielectric constant and equilibrium concentrations of the charged species or the
characterization of the electrode-sample interface phenomenon such as adsorption–
reaction rate constants, diffusion coefficient of species in the electrodes and release of
chemical species from electrodes.
1.8.3 The 4-points probes method
In the 4-points probes method, a constant current is injected into the tissue through one
pair of electrodes and the corresponding voltage is measured with a second pair of
electrodes. This technique was firstly introduced by Bouty in 1884 [139].
The 4-points probes method has as an advantage to remove the effect of the contribution
due to the wires used to send the current to the sample. Indeed in the 4-terminal
configuration (Figure 2.10) two of the wires provide a current to the sample, while the
other two wires are used to detect the voltage drop across the sample.
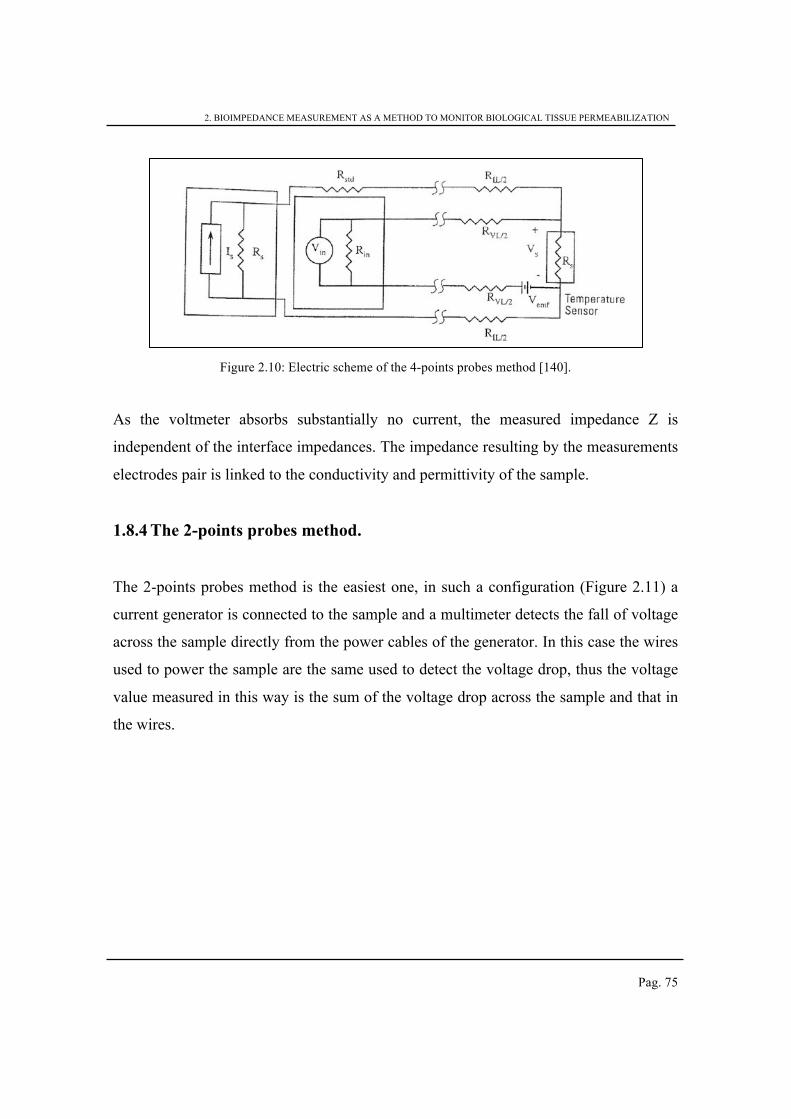
2. BIOIMPEDANCE MEASUREMENT AS A METHOD TO MONITOR BIOLOGICAL TISSUE PERMEABILIZATION
Pag. 75
Figure 2.10: Electric scheme of the 4-points probes method [140].
As the voltmeter absorbs substantially no current, the measured impedance Z is
independent of the interface impedances. The impedance resulting by the measurements
electrodes pair is linked to the conductivity and permittivity of the sample.
1.8.4 The 2-points probes method.
The 2-points probes method is the easiest one, in such a configuration (Figure 2.11) a
current generator is connected to the sample and a multimeter detects the fall of voltage
across the sample directly from the power cables of the generator. In this case the wires
used to power the sample are the same used to detect the voltage drop, thus the voltage
value measured in this way is the sum of the voltage drop across the sample and that in
the wires.
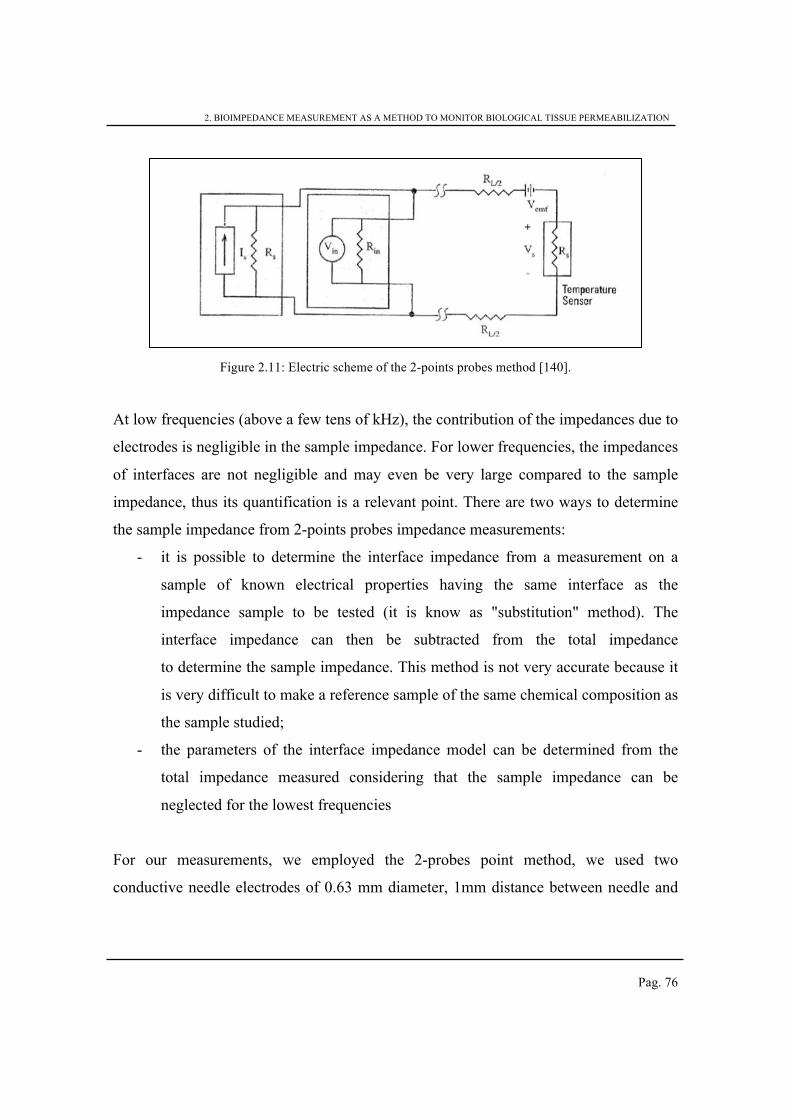
2. BIOIMPEDANCE MEASUREMENT AS A METHOD TO MONITOR BIOLOGICAL TISSUE PERMEABILIZATION
Pag. 76
Figure 2.11: Electric scheme of the 2-points probes method [140].
At low frequencies (above a few tens of kHz), the contribution of the impedances due to
electrodes is negligible in the sample impedance. For lower frequencies, the impedances
of interfaces are not negligible and may even be very large compared to the sample
impedance, thus its quantification is a relevant point. There are two ways to determine
the sample impedance from 2-points probes impedance measurements:
- it is possible to determine the interface impedance from a measurement on a
sample of known electrical properties having the same interface as the
impedance sample to be tested (it is know as "substitution" method). The
interface impedance can then be subtracted from the total impedance
to determine the sample impedance. This method is not very accurate because it
is very difficult to make a reference sample of the same chemical composition as
the sample studied;
- the parameters of the interface impedance model can be determined from the
total impedance measured considering that the sample impedance can be
neglected for the lowest frequencies
For our measurements, we employed the 2-probes point method, we used two
conductive needle electrodes of 0.63 mm diameter, 1mm distance between needle and
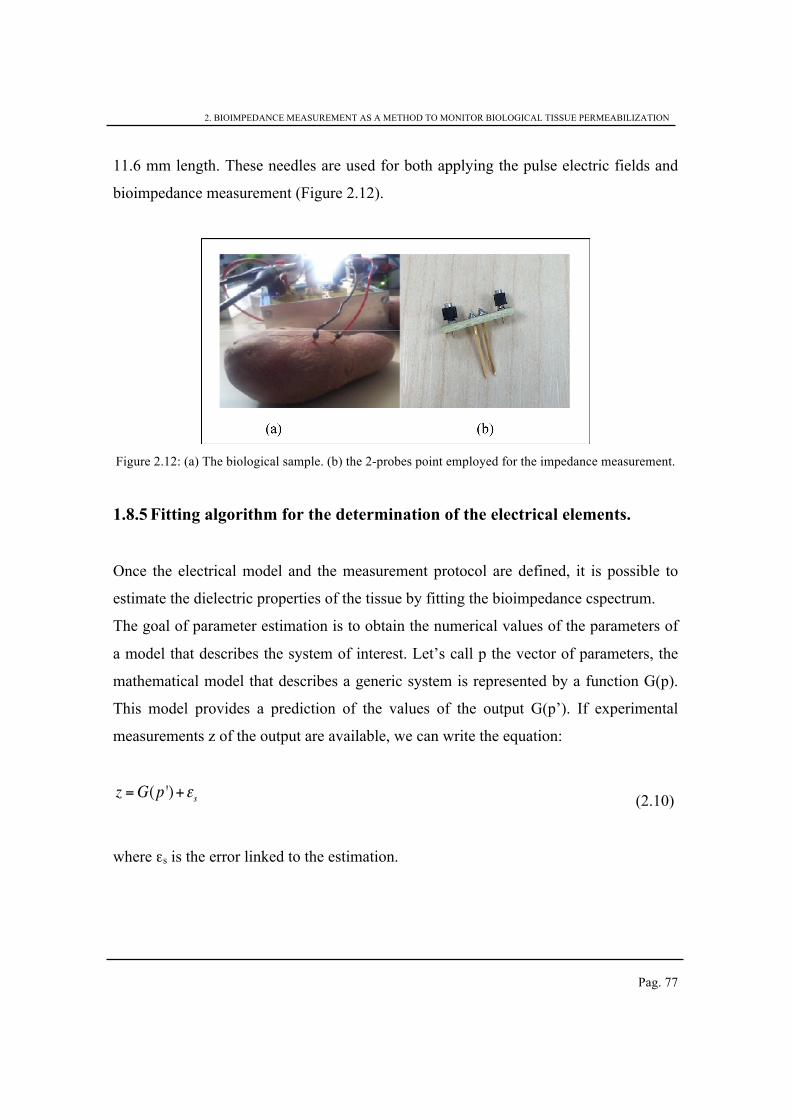
2. BIOIMPEDANCE MEASUREMENT AS A METHOD TO MONITOR BIOLOGICAL TISSUE PERMEABILIZATION
Pag. 77
11.6 mm length. These needles are used for both applying the pulse electric fields and
bioimpedance measurement (Figure 2.12).
Figure 2.12: (a) The biological sample. (b) the 2-probes point employed for the impedance measurement.
1.8.5 Fitting algorithm for the determination of the electrical elements.
Once the electrical model and the measurement protocol are defined, it is possible to
estimate the dielectric properties of the tissue by fitting the bioimpedance cspectrum.
The goal of parameter estimation is to obtain the numerical values of the parameters of
a model that describes the system of interest. Let’s call p the vector of parameters, the
mathematical model that describes a generic system is represented by a function G(p).
This model provides a prediction of the values of the output G(p’). If experimental
measurements z of the output are available, we can write the equation:
z =G(p ')+εs (2.10)
where εs is the error linked to the estimation.
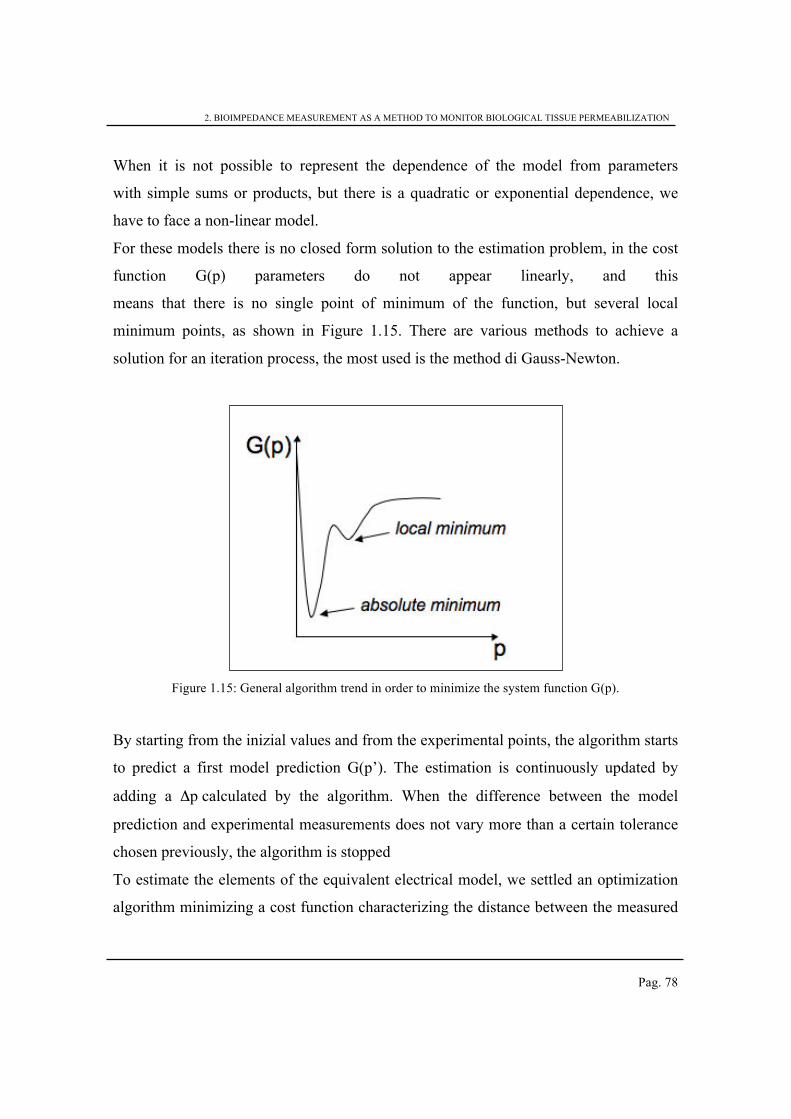
2. BIOIMPEDANCE MEASUREMENT AS A METHOD TO MONITOR BIOLOGICAL TISSUE PERMEABILIZATION
Pag. 78
When it is not possible to represent the dependence of the model from parameters
with simple sums or products, but there is a quadratic or exponential dependence, we
have to face a non-linear model.
For these models there is no closed form solution to the estimation problem, in the cost
function G(p) parameters do not appear linearly, and this
means that there is no single point of minimum of the function, but several local
minimum points, as shown in Figure 1.15. There are various methods to achieve a
solution for an iteration process, the most used is the method di Gauss-Newton.
Figure 1.15: General algorithm trend in order to minimize the system function G(p).
By starting from the inizial values and from the experimental points, the algorithm starts
to predict a first model prediction G(p’). The estimation is continuously updated by
adding a Δp calculated by the algorithm. When the difference between the model
prediction and experimental measurements does not vary more than a certain tolerance
chosen previously, the algorithm is stopped
To estimate the elements of the equivalent electrical model, we settled an optimization
algorithm minimizing a cost function characterizing the distance between the measured
2. BIOIMPEDANCE MEASUREMENT AS A METHOD TO MONITOR BIOLOGICAL TISSUE PERMEABILIZATION
Pag. 79
impedance spectrum z and the impedance estimated with these electrical elements. The
cost function to be minimized is defined as in equation 2.10:
C = argmin p z−G(ω, p)2
j=1
N
∑ (2.16)
where G(ω,p) is the estimated impedance, z is the measured impedance, both depending
on the electrical pulsation ω. p represents the parameters (elements of the electrical
model) to be estimated. N represents the number of measurement points used for the
minimization.
The algorithm was implemented thanks to the function 'lsqcurvefit', in MATLABTM
environment. This function, to perform the minimization of C, uses the Levenberg-
Marquardt algorithm known for its robustness which is one of Gauss-Newton methods.
1.9 Bioimpedance changes due to electroporation
Recently it has been proposed that bioimpedance measurements can provide real time
feedback on the outcome of the electroporation treatments [141].
Pulsed Electric Field (PEF) applied to cells or cell tissues induces a biological change
on the cell’s properties, in particular to its membrane that becomes permeabilized
(electropermeabilization phenomenon) [64, 80, 112, 142, 143]. This phenomenon
temporarily increases the capability of the cell membrane to be crossed by ions and
macromolecules.
The permeabilization of a tissue reveals to be complicated to analyze since a tissue is
composed of cells that are close to each other, furthermore neighboring cells, even if
they are not in direct contact, affect each other due to mutual electrical shading [144-
146].
2. BIOIMPEDANCE MEASUREMENT AS A METHOD TO MONITOR BIOLOGICAL TISSUE PERMEABILIZATION
Pag. 80
1.9.1 Degree of tissue permeabilization
As previously affirmed, the bioimpedance of tissues is often used to characterize the
changes induced by the electrical field on tissues [141]. An equivalent electric circuit
can model impedance changes in normal conditions and after PEF application.
According to the current models (Cole-Cole model [121, 130]) the components are
linked to the physical elements of the cell or cell tissue (resistances for the ionic
conductions, capacitances for the polarization effects and the charging at the cell
membrane, constant phase element to characterize the size dispersion of cells in a
circuit [121, 130, 131]).
The Cole-Cole model characterizes electrically a biological tissue and highlights some
phenomena that induce cellular structure changes. Thus, extraction of Cole-Cole
bioimpedance components is a common practice to evaluate physiological and
pathological status of a biological tissue [147].
In our work biological tests were performed on vegetal tissue (Solanum tuberosum
potatoes). Bio-impedance evolution with respect of time before and after application of
PEF was investigated.
The measured bioimpedance (Figure 2.13) was analyzed by using the following
methodology: (i) From the bioimpedance measurements (Ztot) obtained before and after
the pulses, both the contribution of the tips/tissue interface (electrochemical effect:
ZDL) and the contribution of the tissue (biological effect: Zbio) (Figure 2.13) were
separated, (ii) then from the fitting algorithm the tissue components were extracted (iii)
and the degree of permeabilization P due to the application of the pulses was finally
calculated.
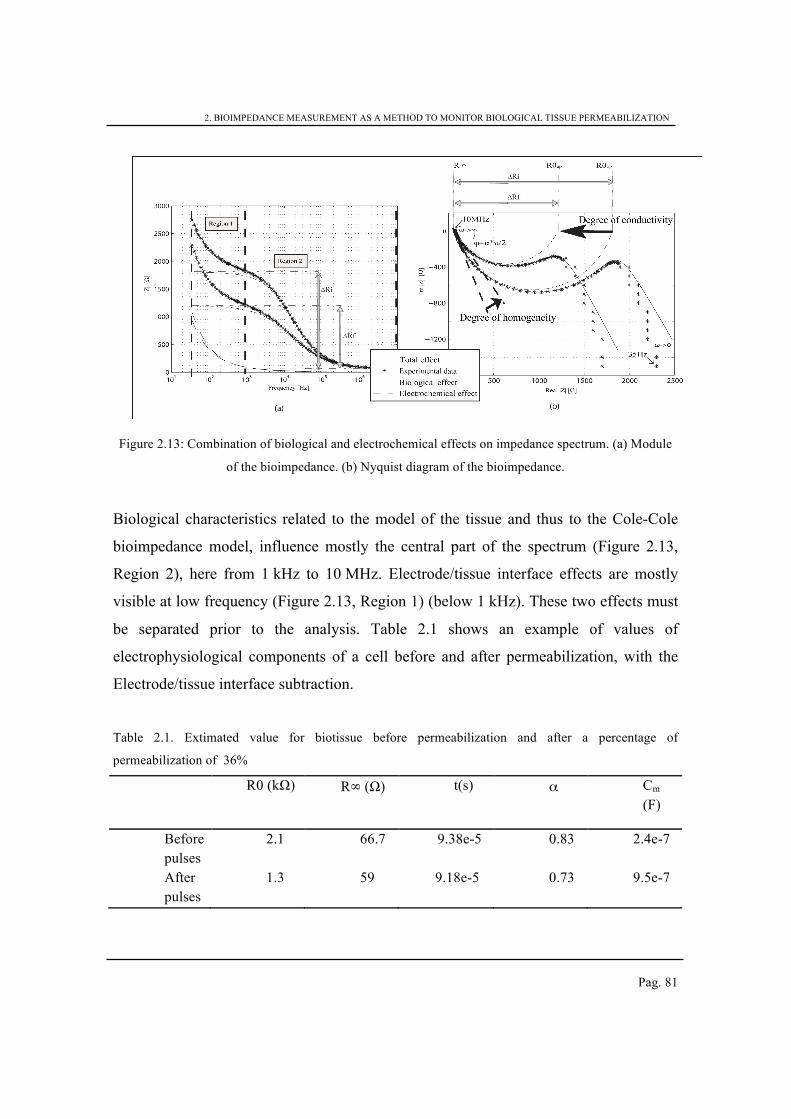
2. BIOIMPEDANCE MEASUREMENT AS A METHOD TO MONITOR BIOLOGICAL TISSUE PERMEABILIZATION
Pag. 81
Figure 2.13: Combination of biological and electrochemical effects on impedance spectrum. (a) Module
of the bioimpedance. (b) Nyquist diagram of the bioimpedance.
Biological characteristics related to the model of the tissue and thus to the Cole-Cole
bioimpedance model, influence mostly the central part of the spectrum (Figure 2.13,
Region 2), here from 1 kHz to 10 MHz. Electrode/tissue interface effects are mostly
visible at low frequency (Figure 2.13, Region 1) (below 1 kHz). These two effects must
be separated prior to the analysis. Table 2.1 shows an example of values of
electrophysiological components of a cell before and after permeabilization, with the
Electrode/tissue interface subtraction.
Table 2.1. Extimated value for biotissue before permeabilization and after a percentage of
permeabilization of 36%
R0 (kΩ) R∞ (Ω) t(s) α Cm
(F)
Before
pulses
2.1 66.7 9.38e-5 0.83 2.4e-7
After
pulses
1.3 59 9.18e-5 0.73 9.5e-7
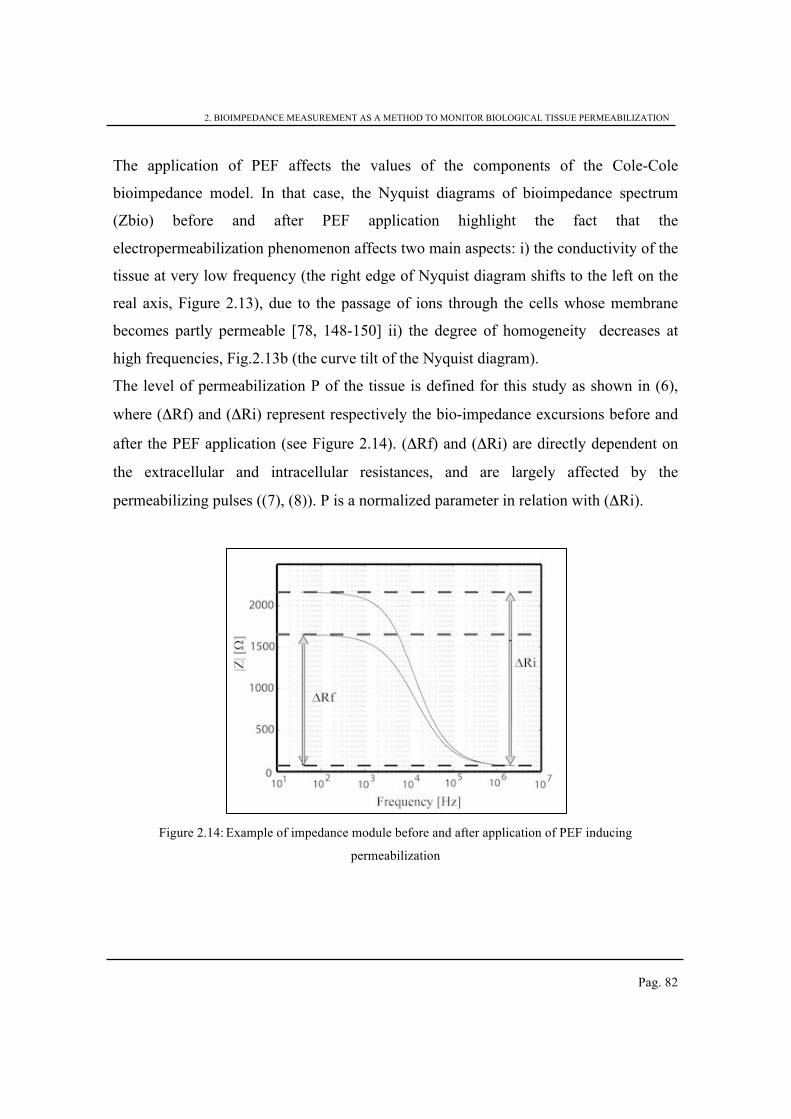
2. BIOIMPEDANCE MEASUREMENT AS A METHOD TO MONITOR BIOLOGICAL TISSUE PERMEABILIZATION
Pag. 82
The application of PEF affects the values of the components of the Cole-Cole
bioimpedance model. In that case, the Nyquist diagrams of bioimpedance spectrum
(Zbio) before and after PEF application highlight the fact that the
electropermeabilization phenomenon affects two main aspects: i) the conductivity of the
tissue at very low frequency (the right edge of Nyquist diagram shifts to the left on the
real axis, Figure 2.13), due to the passage of ions through the cells whose membrane
becomes partly permeable [78, 148-150] ii) the degree of homogeneity decreases at
high frequencies, Fig.2.13b (the curve tilt of the Nyquist diagram).
The level of permeabilization P of the tissue is defined for this study as shown in (6),
where (ΔRf) and (ΔRi) represent respectively the bio-impedance excursions before and
after the PEF application (see Figure 2.14). (ΔRf) and (ΔRi) are directly dependent on
the extracellular and intracellular resistances, and are largely affected by the
permeabilizing pulses ((7), (8)). P is a normalized parameter in relation with (ΔRi).
Figure 2.14: Example of impedance module before and after application of PEF inducing
permeabilization
2. BIOIMPEDANCE MEASUREMENT AS A METHOD TO MONITOR BIOLOGICAL TISSUE PERMEABILIZATION
Pag. 83
P =ΔRi −ΔR f
ΔRi*100
(2.6)
ΔRi = R0bp − R∞bp (2.7)
ΔR f = R0ap − R∞ap (2.8)
The bioimpedance spectrum represented in Figure 2.14 is also used to estimate the
bioimpedance components of the tissue (R0, R∞, τ and α), and their variations with the
permeabilizing pulses. For the needs of this study, a normalized component evolution
before and after pulses application was also defined as follows:
χ ( f ) = χap / χbp (2.9)
All impedance components discussed in the thesis are averaged from at least
7 successive measurements on the same vegetal sample. Indeed the variability of tissue
characteristics in different vegetal samples is considerable. However, even in the case
where the same sample is used, the variability of cell sizes and shapes, as well as the
variability of the quality of the contact between the tissue and the electrodes cannot be
avoided, which might affect the sensitivity of the determination of the degree of
permeabilization [151].
1.9.2 Instrumentation and experimental setup
The pulsed electric field was applied with a function generator Agilent 33250A.
Respective effects of the amplitude, pulse width and pulses number of the waveform
was investigated. Desired pulses amplitude was achieved by using an amplifier NF
corporation HSA4101.
2. BIOIMPEDANCE MEASUREMENT AS A METHOD TO MONITOR BIOLOGICAL TISSUE PERMEABILIZATION
Pag. 84
The measurements were performed by using impedance analyzer (HP 4194A). As
previously explained, we used two conductive needle electrodes both used to apply the
pulse electric fields and measure the bioimpedance. The electric field considered in each
experiment is taken as the ratio between the voltage applied and the distance d (d=1mm)
between the two needles.
The impedance analyzer was controlled with MATLABTM through GPIB (General
Purpose Interface Bus) interface.
1.9.3 Influence of pulses parameters on the tissue permeabilization.
The efficiency of the permeabilization of biological tissue depends on several
parameters, such as the molecular composition of the tissue, the chemical interaction
with electrodes, but above all on the electric field pulses parameters applied to
permeabilize the membrane. As already mentioned in the Section 1, the study of those
characteristic has been investigated by several groups [79, 136, 152]. In our study we
also performed some measurements in order to clarify the role of the pulse’s width, its
amplitude, its count and its rising/falling time is the electropermeabilization process.
Influence of the pulse duration
Using a train of respectively 50-100-200-500 µs squared unipolar pulses delivered with
a frequency of 1 Hz, corresponding to the field amplitude E=500 V/cm, it was
confirmed that the degree of permeabilization P is in relation with the pulse duration
and its repetition (Figure 2.16). Cell membranes are indeed more affected by the pulse
when its duration increases and when several pulses are applied (Figure 2.16).
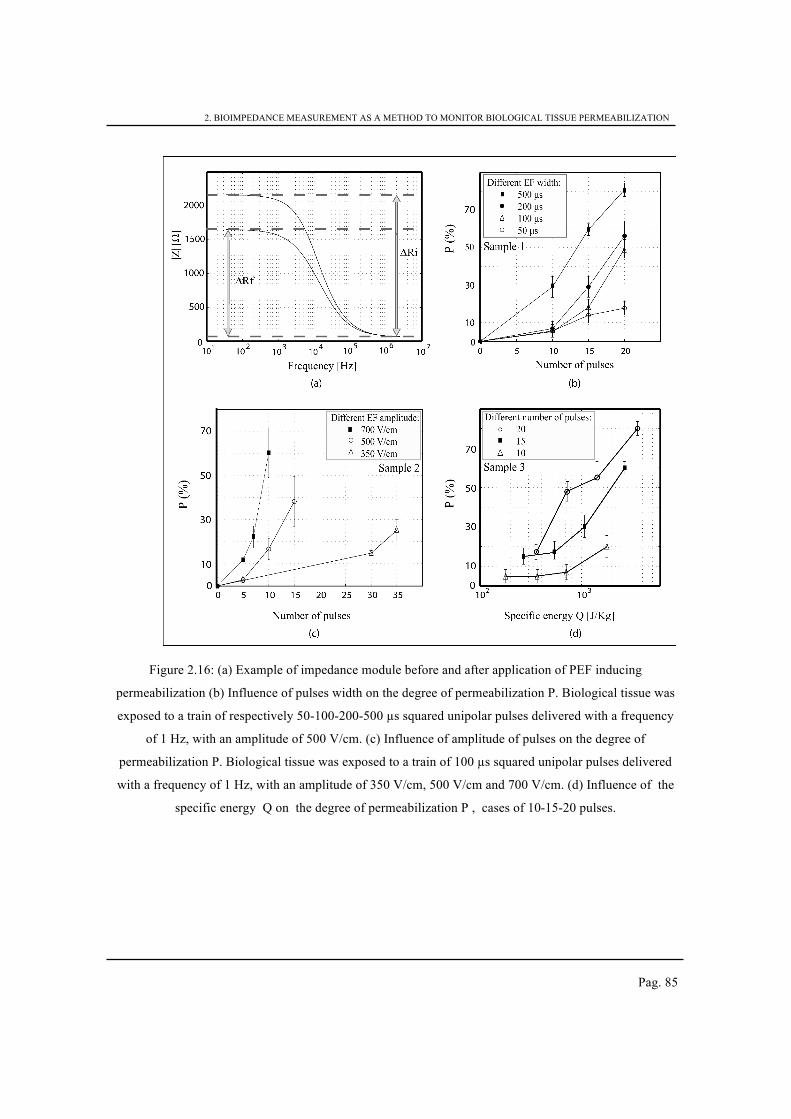
2. BIOIMPEDANCE MEASUREMENT AS A METHOD TO MONITOR BIOLOGICAL TISSUE PERMEABILIZATION
Pag. 85
Figure 2.16: (a) Example of impedance module before and after application of PEF inducing
permeabilization (b) Influence of pulses width on the degree of permeabilization P. Biological tissue was
exposed to a train of respectively 50-100-200-500 µs squared unipolar pulses delivered with a frequency
of 1 Hz, with an amplitude of 500 V/cm. (c) Influence of amplitude of pulses on the degree of
permeabilization P. Biological tissue was exposed to a train of 100 µs squared unipolar pulses delivered
with a frequency of 1 Hz, with an amplitude of 350 V/cm, 500 V/cm and 700 V/cm. (d) Influence of the
specific energy Q on the degree of permeabilization P , cases of 10-15-20 pulses.
2. BIOIMPEDANCE MEASUREMENT AS A METHOD TO MONITOR BIOLOGICAL TISSUE PERMEABILIZATION
Pag. 86
Influence of the pulse amplitude and of the number of pulses
The permeabilization efficiency is notably influenced by the PEF amplitude, as
increasing the amplitudes induces an higher degree of permeabilization (Figure 2.16),
Indeed with a train of 100 µs squared unipolar pulses delivered with a frequency of
1 Hz, corresponding to the field amplitude E=350 V/cm, the permeabilization of the
tissue remains low whereas with a train of 100 µs squared unipolar pulses delivered
with a frequency of 1 Hz, E=500 V/cm the tissue is permeabilized even with a low
number of pulses (Figure 2.16). Besides, Figure 16 shows that the evolution of the level
of permeabilization is neither linear with the electric pulse amplitude, nor with the
number of pulses. Different levels of permeabilization are achieved when tuning PEF
strength as well as pulses number.
A way to better control the level of permeabilization is to reduce the PEF intensity
while increasing their cumulative effect with higher number of pulses. Nevertheless the
treatment time might be drastically increased in that case, due to the nonlinear
dependence between the number of pulses and the permeabilization level (Fig.2.16, case
of E=350 V/cm).
Influence of the pulse rise time
Keeping the amplitude and duration constant for applied PEF, the rising time and falling
time of pulses had been tuned in order to estimate their influence on permeabilization.
The experimental results highlight that these PEF characteristics, with rising time and
falling time evolution between 5 ns up to 1 µs, do not have a significant effect on the
level of permeabilization, at least in these experimental conditions. The same result was
also shown by another group [79], that performed electropermeabilization
measurements on a cuvette with pulses of different rise- and fall-time.
2. BIOIMPEDANCE MEASUREMENT AS A METHOD TO MONITOR BIOLOGICAL TISSUE PERMEABILIZATION
Pag. 87
Influence of thermal effects
The temperature dependence of EF effects on tissue permeabilization is another aspect
that needs to be taken into account. It was actually proven that higher degrees of
permeabilization are achieved when the exposed tissue is also submitted to heat
solicitation [115, 153].
In the present situation, the temperature elevation induced within the vegetal tissue by
the application of PEF was evaluated in order to distinguish the permeabilization
phenomena from the heating effects on the tissue:
ΔT =σE
2
ρCp
t
(2.17)
where σ represents the tissue conductivity (approximated to 0.1 S/m), ρ represents its
volume density (700 kg m-3) and Cp its specific heat (Cp=3.8 kJ (kg K)-1). ΔT
corresponds to the temperature elevation proportional to the duration of the electric field
pulse.
For the highest electric field applied during experiments (700 V/cm), and the longest
pulse width (500 µs), the temperature elevation estimation was: ΔT=0.09 K, which can
be neglected.
Influence of the specific energy per pulse
The relation between the degree of permeabilization P and the specific energy per pulse
Q (defined as follows [78] was investigated (Figure 2.16):
2. BIOIMPEDANCE MEASUREMENT AS A METHOD TO MONITOR BIOLOGICAL TISSUE PERMEABILIZATION
Pag. 88
Q =σE
2
ρt
(2.18)
where σ represents the tissue permittivity (σ=0.1 S/m), ρ the tissue volume density
(r=700 kg m-3), E the field amplitude (E=500 V/cm), t the pulse’s width.
With permeabilizing pulses corresponding to a field amplitude E=500 V/cm, the
permeabilization level is represented with respect to Q, for three different numbers of
applied PEF (Figure 2.16). Considering the presented specific experimental conditions,
the level of permeabilization increases with the specific energy per pulse as well as with
the number of pulses. Indeed tuning both Q and the number of pulses permits the
control to the electropermeabilization level, as mentioned in [78].
1.9.4 Effect of electropermeabilization with respect to Cole-Cole equation
As discussed, a method to monitor the level of electropermeabilization of a tissue is the
estimation of its bioimpedance components. Different methods can be used for that
purpose: the analysis of the transient time response [154] or the analysis of the
frequency response, as developed hereafter. The components of the Cole-Cole model
(R0, R∞, τ, α) are estimated thanks to the fitting algorithm. On the basis of those four
components, Cm is then deduced from the expression of t. An example of the
estimation of Cole-Cole components, from both experimental and model spectra is
represented in Figure 2.13: the star line corresponds to the measured spectrum of
bioimpedance whereas the continuous line represents the estimated spectrum of the
bioimpedance (fitting error lower than 1 %); The fitting method permits to isolate the
contribution of electrodes polarization.
Figure 2.17 shows how the Cole-Cole components (R0, R∞, τ, α) as well as the
capacitance Cm evolve with an increasing degree of permeabilization.
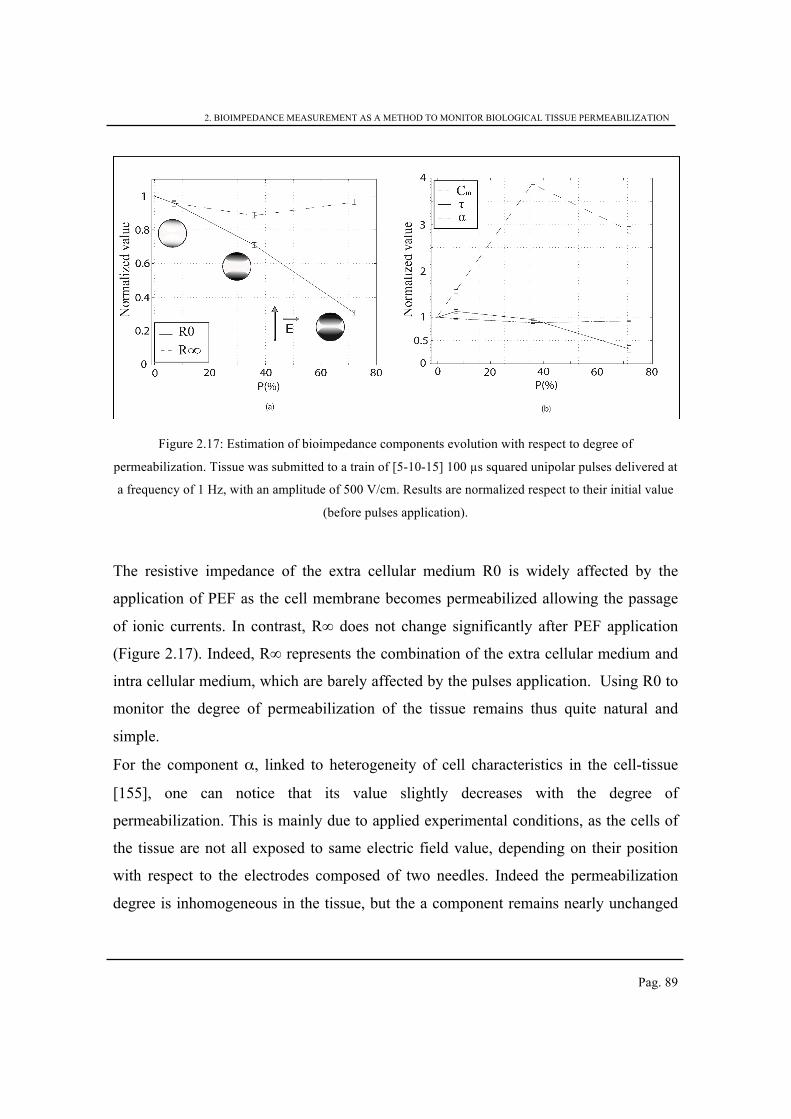
2. BIOIMPEDANCE MEASUREMENT AS A METHOD TO MONITOR BIOLOGICAL TISSUE PERMEABILIZATION
Pag. 89
Figure 2.17: Estimation of bioimpedance components evolution with respect to degree of
permeabilization. Tissue was submitted to a train of [5-10-15] 100 µs squared unipolar pulses delivered at
a frequency of 1 Hz, with an amplitude of 500 V/cm. Results are normalized respect to their initial value
(before pulses application).
The resistive impedance of the extra cellular medium R0 is widely affected by the
application of PEF as the cell membrane becomes permeabilized allowing the passage
of ionic currents. In contrast, R∞ does not change significantly after PEF application
(Figure 2.17). Indeed, R∞ represents the combination of the extra cellular medium and
intra cellular medium, which are barely affected by the pulses application. Using R0 to
monitor the degree of permeabilization of the tissue remains thus quite natural and
simple.
For the component α, linked to heterogeneity of cell characteristics in the cell-tissue
[155], one can notice that its value slightly decreases with the degree of
permeabilization. This is mainly due to applied experimental conditions, as the cells of
the tissue are not all exposed to same electric field value, depending on their position
with respect to the electrodes composed of two needles. Indeed the permeabilization
degree is inhomogeneous in the tissue, but the a component remains nearly unchanged
2. BIOIMPEDANCE MEASUREMENT AS A METHOD TO MONITOR BIOLOGICAL TISSUE PERMEABILIZATION
Pag. 90
because it is dominated by the characteristics of the heterogeneity of the not
permeabilized tissue.
The variation of τ is directly linked to the variation of the membranes capacitance Cm
as described in the first part of the paper. For the lower level of permeabilization
(P<10 %), where t increases softly, water molecules penetrating the membranes
contribute to the rise of Cm, as already mentioned by other studies [67, 156], due to the
larger relative permittivity of the water compared to the one of the phospholipids. In
addition, the thinning of the cell membrane due to the increasing of electrostatic
pressure induced by the application of PEF might contribute to the elevation of Cm.
Nevertheless, for higher degrees of permeabilization, the spatial heterogeneity of the
applied electrical field due to applied experimental conditions leads to a large increase
of the ionic conductivity in the permeabilized zone of the tissue where the cell
membranes are destructured. The validity of a global Cole-Cole model for the whole
tissue should be examined carefully in that case. Until a large degree of
permeabilization is reached (P<40 %), the estimated time-constant t barely changes, as
it is dominated by the characteristic time-constant of the non-permeabilized part of the
sample. This leads to a large over-estimation of Cm, due to the averaging effect of the
employed model that does not take into account the spatial heterogeneity of the
permeabilization. Cm does not represent anymore the membrane capacitances for high
levels of permeabilization.
Finally the use of the Cm component as a permeabilization level indicator is sensitive
and well adapted for the low levels of permeabilization (P<10 %). The use of this
component, estimated from a global Cole-Cole bioimpedance model for the whole
tissue, is more limited when high permeabilization levels are considered (P>40 %).
Indeed such a global model does not reflect spatial heterogeneity of the
permeabilization in the applied experimental conditions.
2. BIOIMPEDANCE MEASUREMENT AS A METHOD TO MONITOR BIOLOGICAL TISSUE PERMEABILIZATION
Pag. 91
1.10 From bioimpedance to electrorotation - the importance of the
miniaturization.
In order to have a complete overview of the permeabilization phenomenon a
microscopic study (single cell level) is performed.
In this case the system is composed by miniaturized devices, thus a deep check of the
new generated physical balances needs to be investigated. Nevertheless, the
miniaturization approach reveals to be useful when micro-species are under
investigation.
In microdevices where electrical solicitations are applied, the miniaturization has the
advantage of reducing the temperature rise resulting from the heat generation by Joule
effect, the heat exchanges are actually favored by a better ration surface to volume,
which limits the temperature rise to only a few degrees [157]. This is strictly true if the
heat is easily dissipated. It is therefore advantageous to have devices which are good
thermal conductors: such as silicon substrate instead of glass or polymer. Furthermore
the scale effect enables to obtain high electric fields value with a power supply voltage
of a few volts, indeed for a distance between the two electrodes d = 1cm or d = 100 µm
we can reduce the voltage of one thousand and get the same dielectrophoretic force
[158].
However a disadvantage of microelectrodes is that their impedance is much higher
compared to macro-electrodes due to the interface phenomenon. The result of this
phenomenon is a so-called “interface capacitance”, or “double layer capacitance”
resulting from interaction between ions and molecules in the boundary between the
surface of the electrolyte and the measuring electrodes. This capacitance is inversely
proportional to the electrode surface [159]. Therefore, this double layer capacitance
creates an additional phenomenon in the measurement by increasing the measurement
error [160, 161]. The detection of a single cell bioimpedance spectrum is thus
2. BIOIMPEDANCE MEASUREMENT AS A METHOD TO MONITOR BIOLOGICAL TISSUE PERMEABILIZATION
Pag. 92
complicated and it requires a proper biochip structure to avoid contribution due to the
interface between electrodes and the sample.
The investigation of the permeabilization phenomenon at the single cell level, which
will be the core of the next chapter, will be thus not performed with bioimpedence
measurements, but with a technique where different electrical solicitations (DEP, ROT
and PEF) are combined.
3. MONITORING THE PERMEABILIZATION OF A SINGLE CELL IN A MICROFLUIDIC DEVICE WITH A COMBINED
DIELECTROPHORESIS AND ELECTROROTATION TECHNIQUE
Pag. 93
Chapter 3
Monitoring the permeabilization of a single cell in a
microfluidic device with a combined dielectrophoresis
and electrorotation technique
The interest for single cell characterization is explained both by the need to diagnose
illness (cancer, for instance) and the importance of understanding how external electric
solicitations can impact the cell and its development (electromagnetic exposure, for
example).
The study of the electric field effects on the body requires a preliminary knowledge of
the phenomena which occur at the level of the cell, the basic unit of life. Thanks to
improvements in biochemistry, genetics and laboratory techniques, the mechanisms
regulating the inner behavior of the cell are being better understood.
A single cell represents a complex biological/physical structure and its study involves
vast areas of investigation. In the presented work, we mostly investigate the electrical
properties of the cell in order to understand qualitatively and quantitatively the effect of
the electric field. In particular, one of our main objectives is to measure the electrical
parameters of the main cellular compartments, such as the cytoplasm and membrane, in
order to propose a tool to analyze the behavior of the cell subjected to an electric field
source. The study of the interaction of the field with cells is considered as a step to be
3. MONITORING THE PERMEABILIZATION OF A SINGLE CELL IN A MICROFLUIDIC DEVICE WITH A COMBINED
DIELECTROPHORESIS AND ELECTROROTATION TECHNIQUE
Pag. 94
associated to the study of the tissue behavior (presented in the previous chapter) in order
to acquire a complete overview of the electropermeabilization phenomenon at different
size-scale.
Over the past decades, AC electrokinetic phenomena such as dielectrophoresis,
travelling wave dielectrophoresis and electrorotation have been increasingly
investigated in lab-on-chip and microfluidic devices [8, 162, 163].
Electric field pulses can actually increase the permeability of the cell membrane by
changing its structure [73]; a reversible or non-reversible electropermeabilization can
thus be achieved.
Several studies have been proposed regarding the investigation of cell permeabilization
and its efficiency, with certain presenting the fluorescence miscroscopy as a method of
investigation [79, 136, 152]. The electropermeabilization is thus quantified by analyzing
the penetration of non-permeant dyes (such as trypan blue), the penetration of
fluorescent dyes (such as propidium iodide or calcein) or by measuring the release of
the intracellular compound (such as ATP) [57]. When employing this method, cells are
usually submerged in a buffer containing the dye, PEF are induced and after an
incubation time of few minutes (5 minutes in the case of trypan blue) observed under a
microscope [73].
In other studies, researchers employ the classic cell biology approach, they work on a
large number of cells by performing experiments in cuvette, and the access to particular
relevant parameters from a global measurement is possible by averaging over the cell
population. Sometimes this approach does not reflect the cellular diversity and may be
not sufficient. It then becomes necessary to perform measurements on single cells,
which is the only way to obtain proper assess to the characteristic inhomogeneity of the
sample.
We thus propose a combination of three electrical solicitations (conventional
dielectrophoresis, electrorotation, PEF) within a microfluidic device in order to monitor
3. MONITORING THE PERMEABILIZATION OF A SINGLE CELL IN A MICROFLUIDIC DEVICE WITH A COMBINED
DIELECTROPHORESIS AND ELECTROROTATION TECHNIQUE
Pag. 95
in-situ the dielectric properties of a single cell, and its changes during
electropermeabilization. Furthermore, we propose to characterize the efficiency of the
electropermeabilization protocols for drug delivery by using such approaches.
1.11 The cell and its dielectric properties
The cell represents the elementary living unit. From an electrical point of view the cell
can be modeled by taking into account the existence or absence of nucleus and
organelles within it as well as by considering the presence of a single cell membrane or
a cell wall, thus a cell can be classified as:
- prokaryotic cell (no nucleus and with a cell membrane and a wall), generally
associated with the multi-shell model for dielectric characterization;
- eukaryotic cell (with the presence of the nucleus and a cell membrane such as
for mammalian cells), generally associated to the single-shell model for
dielectric characterization.
Furthermore the species composed by eukaryotic cells are divided into two main
categories: unicellular organisms and multicellular organisms where cells are grouped
into tissues to form the different organs. The typical diameter size of eukaryotic cells is
in the range of ten micrometers.
Notwithstanding that cells can be responsible for extremely different functions inside
the body, their structure remains universal: a bilayer membrane (surrounded in some
cases by a wall), the inner compartment (the cytoplasm with all organelles) and the
outer compartment (the external medium).
The cellular membrane is mainly composed of a lipid bilayer where the hydrophilic
head is facing the medium due to their hydrophilic properties. The phospholipid
molecules confers a very fluid structure to the plasma membrane : in fact, the two layers
of phospholipid tails can easily slide onto each other.
3. MONITORING THE PERMEABILIZATION OF A SINGLE CELL IN A MICROFLUIDIC DEVICE WITH A COMBINED
DIELECTROPHORESIS AND ELECTROROTATION TECHNIQUE
Pag. 96
This structure also enables the cellular membrane to carry on an important selective
function. Since the two layers of phospholipid tails are hydrophobic, the only
substances that can cross the membrane are other hydrophobic substances (such as
lipids, steroid hormones and fatty acids) or very small molecules, such as molecules of
water. Instead, the hydrophilic substances (ions and polar molecules) cannot pass
trhough the phospholipid bilayer of the membrane and are therefore unable to enter into
the cell without the intervention of some mechanisms which involve membrane
channels. The phospholipids bilayer also contains cholesterol molecules (which affect
the membrane rigidity), membrane proteins and glycoproteins. Membrane proteins are
divided into two categories: the integral proteins and peripherial proteins.
While the integral proteins are linked to the lipid bilayer and passes sevrsl
transmembrane domains.
The peripherial proteins are based on one of the two sides of the membrane and have no
connection with the hydrophobic interior of the bilayer.
The cytoplasm is composed of a viscose substance, the cytosol, consisting of water
(which represents 75-85% of the total weight of the cell), inorganic substances
dissociated into ionic form (especially K+ ions, Na+, Ca++ and Mg++ ) and different
organic molecules (including proteins with enzymatic or structural functions). It
contains specific organels such as the nucleus, mitochondria, chloroplasts, the
endoplasmic reticulum, the Golgi apparatus, and lysosomes. The nucleus is protected by
a porous nuclear membrane. Within the nucleus, the DNA codes all the information
necessary for the regulation of cellular activities and for the determination of the
characteristics of each single cell.
Indeed, from a biological point of view, the cell is an extremely complex reality
regulated by a complicated system where each components perform a specific vital
function.
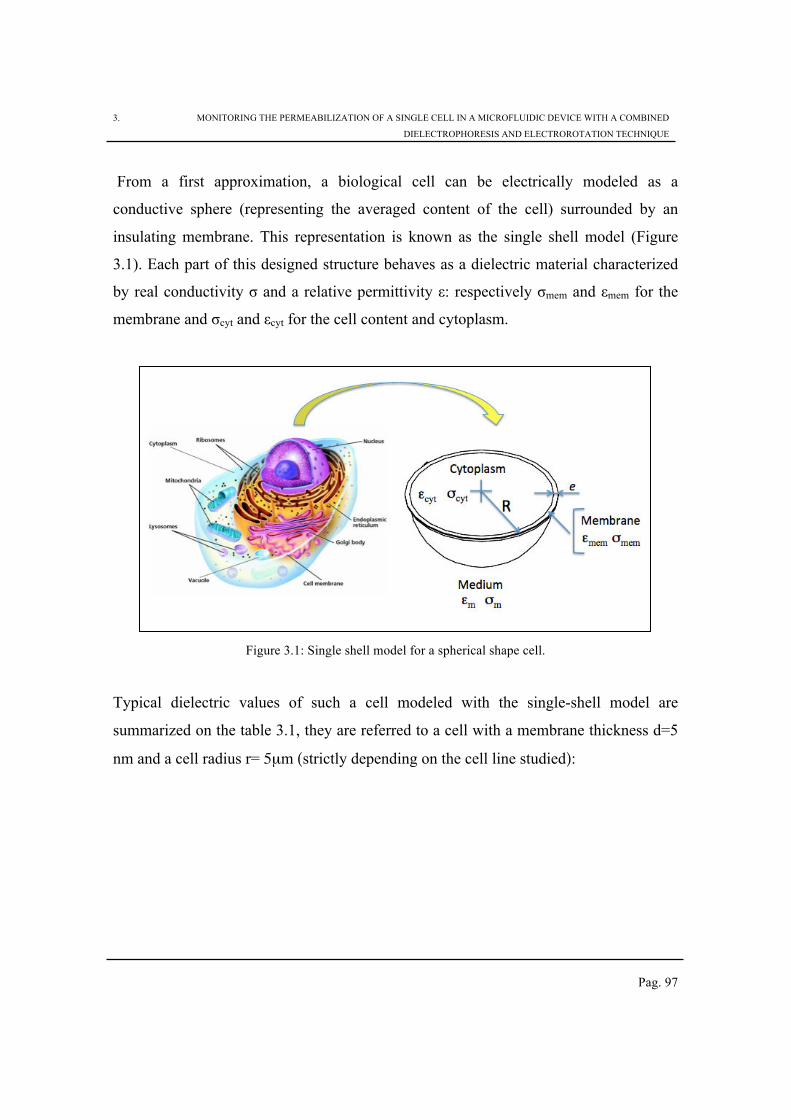
3. MONITORING THE PERMEABILIZATION OF A SINGLE CELL IN A MICROFLUIDIC DEVICE WITH A COMBINED
DIELECTROPHORESIS AND ELECTROROTATION TECHNIQUE
Pag. 97
From a first approximation, a biological cell can be electrically modeled as a
conductive sphere (representing the averaged content of the cell) surrounded by an
insulating membrane. This representation is known as the single shell model (Figure
3.1). Each part of this designed structure behaves as a dielectric material characterized
by real conductivity σ and a relative permittivity ε: respectively σmem and εmem for the
membrane and σcyt and εcyt for the cell content and cytoplasm.
Figure 3.1: Single shell model for a spherical shape cell.
Typical dielectric values of such a cell modeled with the single-shell model are
summarized on the table 3.1, they are referred to a cell with a membrane thickness d=5
nm and a cell radius r= 5µm (strictly depending on the cell line studied):
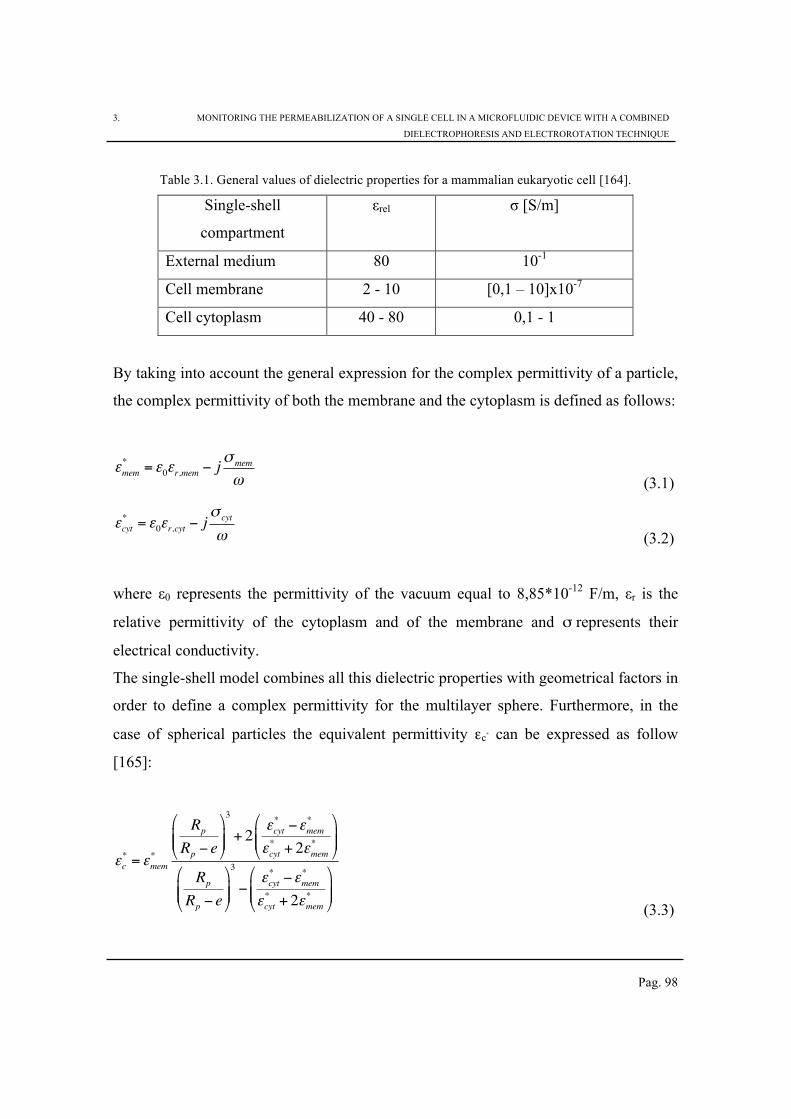
3. MONITORING THE PERMEABILIZATION OF A SINGLE CELL IN A MICROFLUIDIC DEVICE WITH A COMBINED
DIELECTROPHORESIS AND ELECTROROTATION TECHNIQUE
Pag. 98
Table 3.1. General values of dielectric properties for a mammalian eukaryotic cell [164].
Single-shell
compartment
εrel σ [S/m]
External medium 80 10-1
Cell membrane 2 - 10 [0,1 – 10]x10-7
Cell cytoplasm 40 - 80 0,1 - 1
By taking into account the general expression for the complex permittivity of a particle,
the complex permittivity of both the membrane and the cytoplasm is defined as follows:
εmem
*= ε
0εr,mem
− jσ
mem
ω (3.1)
εcyt
*= ε
0εr,cyt
− jσ
cyt
ω (3.2)
where ε0 represents the permittivity of the vacuum equal to 8,85*10-12 F/m, εr is the
relative permittivity of the cytoplasm and of the membrane and σ represents their
electrical conductivity.
The single-shell model combines all this dielectric properties with geometrical factors in
order to define a complex permittivity for the multilayer sphere. Furthermore, in the
case of spherical particles the equivalent permittivity εc∗ can be expressed as follow
[165]:
εc
*= ε
mem
*
Rp
Rp− e
"
#$$
%
&''
3
+ 2εcyt
* −εmem
*
εcyt
*+ 2ε
mem
*
"
#$$
%
&''
Rp
Rp− e
"
#$$
%
&''
3
−εcyt
* −εmem
*
εcyt
*+ 2ε
mem
*
"
#$$
%
&''
(3.3)
3. MONITORING THE PERMEABILIZATION OF A SINGLE CELL IN A MICROFLUIDIC DEVICE WITH A COMBINED
DIELECTROPHORESIS AND ELECTROROTATION TECHNIQUE
Pag. 99
where R is the radius of the cell and e represents the thickness of the cell membrane
(about 5 nm).
When an external electric solicitation is applied to the cell, the response of the latter is
due to the interaction between the cell itself (and thus its complex permittivity εc) and
the extracellular medium (characterized by a conductivity σm and a permittivity εm). The
Clausius-Mossotti factor fCM summurizes this dielectric interaction.
fCM is a complex number the value of which depends on value depends on the dielectric
properties of the external medium, on the polarisable particle and on the shape of the
particle; it evolves in respect of the angular frequency of the applied AC electric
solicitation.
The Clausius-Mossotti factor is expressed as follow:
fCM =εp*−εm
*
εp*+ 2εm
*
(3.4)
where ε∗p and ε∗m are respectively the complex permittivities of the polarizable particle
(the cell) and the medium.
1.12 The cell polarization due to electric field application
The exposure of a cell (considered as a dielectric particle) to an electric field leads to its
polarization. Under the effect of a non-uniform electric field, an internal reorganization
of charges polarizes the cell and confers to it the properties of a dipole. The charge
organization depends on the electric field frequency, thus at each range of frequencies
the behavior and the effects are different:
3. MONITORING THE PERMEABILIZATION OF A SINGLE CELL IN A MICROFLUIDIC DEVICE WITH A COMBINED
DIELECTROPHORESIS AND ELECTROROTATION TECHNIQUE
Pag. 100
- at low frequency the structure of the cell membrane is predominant, the latter
actually behaves as a insulator
- at high frequency a current starts to flow in the intracellular medium, from an
electrical point of view the membrane is considered as a short-circuit. The
conductivity increases and becomes representative of both the extra and the
intracellular compartment [166].
Internal ions move toward the electrode of opposite polarity; nevertheless they are
stopped by the plasma membrane [167]. The same process occurs within the
extracellular compartment leading to charge accumulation at the cell / medium
interface.
The resulting medium polarization due to the applied electric field can have several
origins and the mechanisms occur at a characteristic time response. Some of them are
instantaneous while others need some time after the polarization is achieved to take
place. Indeed there are different mechanisms of polarization: the electronic polarization
(polarization arising from the displacement of electrons with respect to the nuclei with
which they are associated, upon application of an external electric field.), the ionic
polarization (referred to the ionic movement due to the applied electric field), the
orientation polarization (also known as dipole polarization, arising from the orientation
of molecules which have permanent dipole moments arising from an asymmetric charge
distribution) and the interfacial polarization (linked to the charges that move within the
interface between two material having different dielectric properties).
Impedance studies showed that the cell presents three frequency-dependent dispersion
or relaxations when the AC solicitation is applied [168]. This dispersion is associated
with absorption of energy from the AC by the dielectric body and they are known as
dispersion α, β and γ (Figure 3.2).
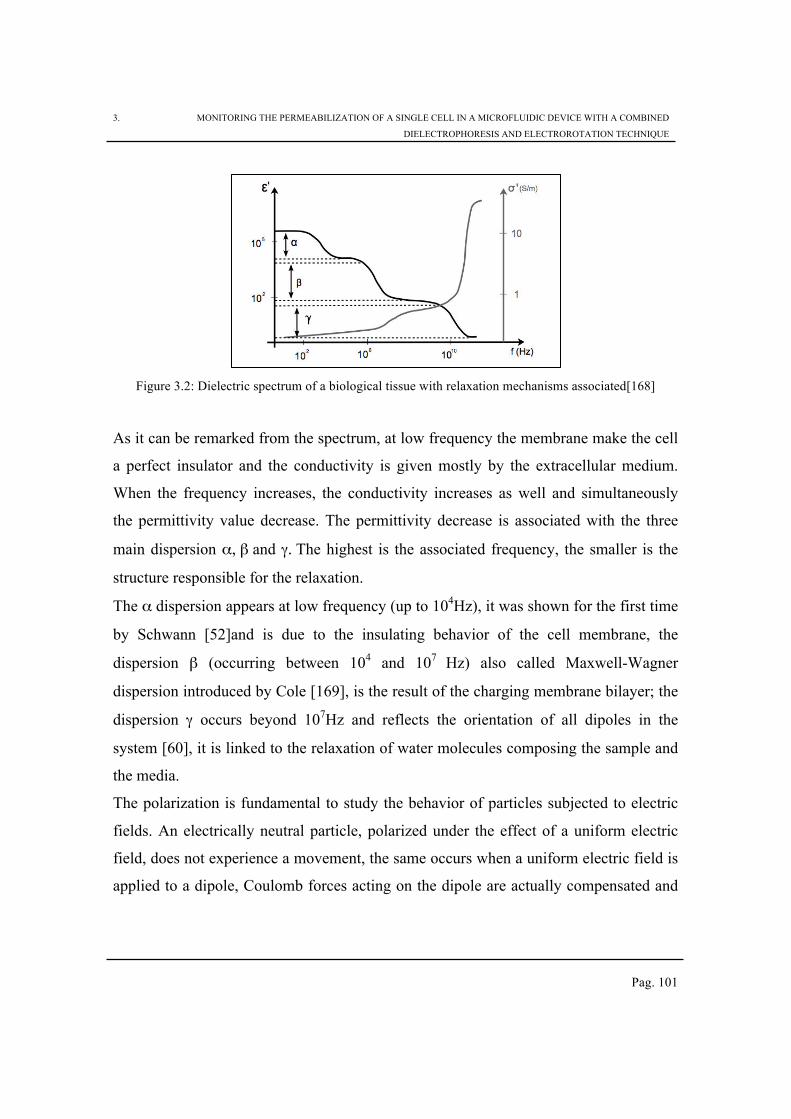
3. MONITORING THE PERMEABILIZATION OF A SINGLE CELL IN A MICROFLUIDIC DEVICE WITH A COMBINED
DIELECTROPHORESIS AND ELECTROROTATION TECHNIQUE
Pag. 101
Figure 3.2: Dielectric spectrum of a biological tissue with relaxation mechanisms associated[168]
As it can be remarked from the spectrum, at low frequency the membrane make the cell
a perfect insulator and the conductivity is given mostly by the extracellular medium.
When the frequency increases, the conductivity increases as well and simultaneously
the permittivity value decrease. The permittivity decrease is associated with the three
main dispersion α, β and γ. The highest is the associated frequency, the smaller is the
structure responsible for the relaxation.
The α dispersion appears at low frequency (up to 104Hz), it was shown for the first time
by Schwann [52]and is due to the insulating behavior of the cell membrane, the
dispersion β (occurring between 104 and 107 Hz) also called Maxwell-Wagner
dispersion introduced by Cole [169], is the result of the charging membrane bilayer; the
dispersion γ occurs beyond 107Hz and reflects the orientation of all dipoles in the
system [60], it is linked to the relaxation of water molecules composing the sample and
the media.
The polarization is fundamental to study the behavior of particles subjected to electric
fields. An electrically neutral particle, polarized under the effect of a uniform electric
field, does not experience a movement, the same occurs when a uniform electric field is
applied to a dipole, Coulomb forces acting on the dipole are actually compensated and
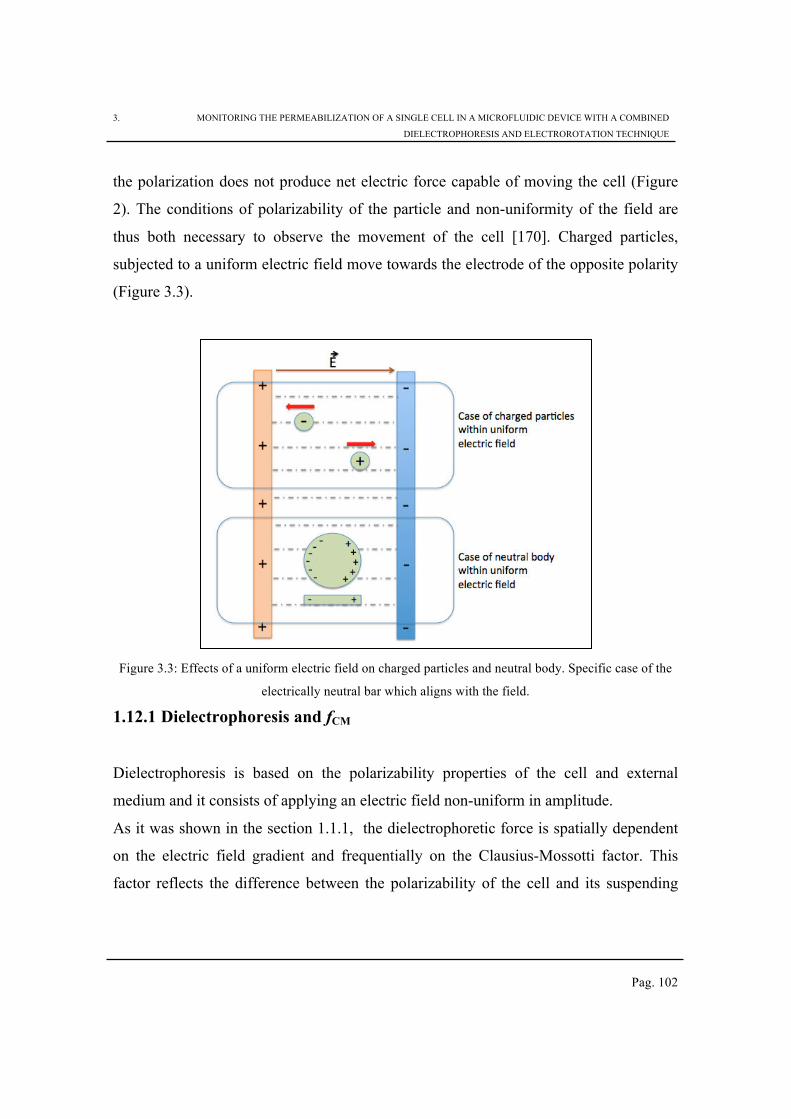
3. MONITORING THE PERMEABILIZATION OF A SINGLE CELL IN A MICROFLUIDIC DEVICE WITH A COMBINED
DIELECTROPHORESIS AND ELECTROROTATION TECHNIQUE
Pag. 102
the polarization does not produce net electric force capable of moving the cell (Figure
2). The conditions of polarizability of the particle and non-uniformity of the field are
thus both necessary to observe the movement of the cell [170]. Charged particles,
subjected to a uniform electric field move towards the electrode of the opposite polarity
(Figure 3.3).
Figure 3.3: Effects of a uniform electric field on charged particles and neutral body. Specific case of the
electrically neutral bar which aligns with the field.
1.12.1 Dielectrophoresis and fCM
Dielectrophoresis is based on the polarizability properties of the cell and external
medium and it consists of applying an electric field non-uniform in amplitude.
As it was shown in the section 1.1.1, the dielectrophoretic force is spatially dependent
on the electric field gradient and frequentially on the Clausius-Mossotti factor. This
factor reflects the difference between the polarizability of the cell and its suspending
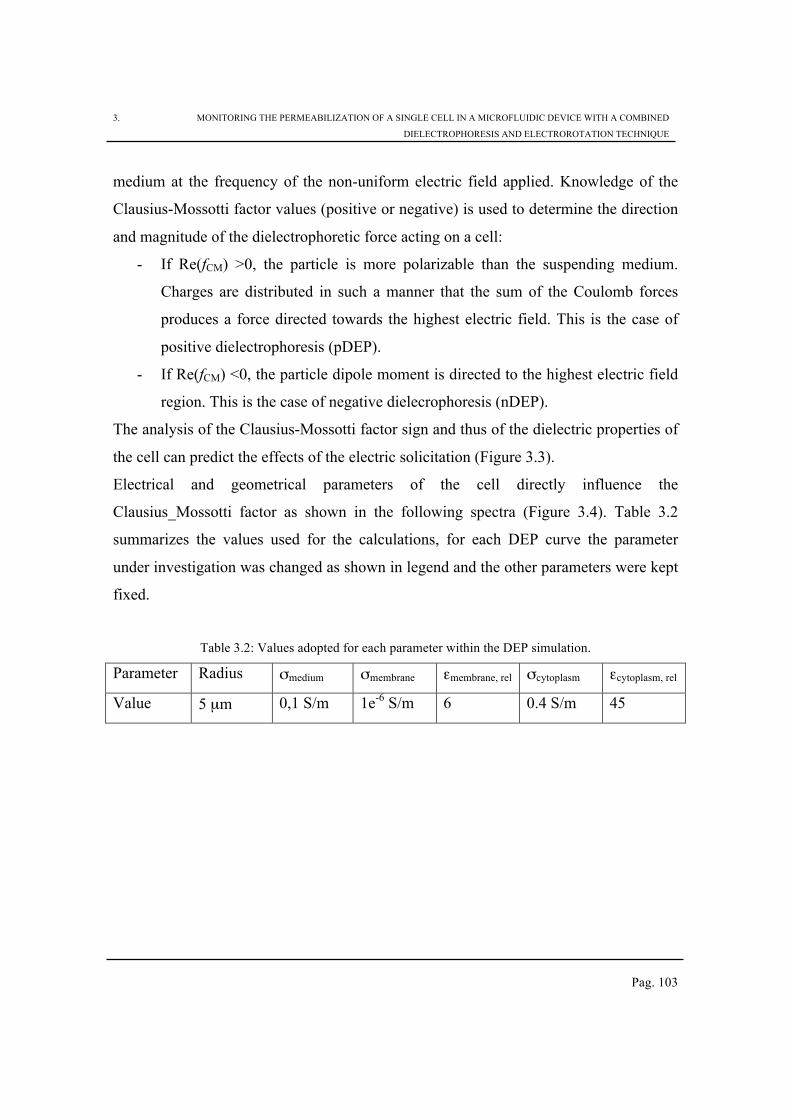
3. MONITORING THE PERMEABILIZATION OF A SINGLE CELL IN A MICROFLUIDIC DEVICE WITH A COMBINED
DIELECTROPHORESIS AND ELECTROROTATION TECHNIQUE
Pag. 103
medium at the frequency of the non-uniform electric field applied. Knowledge of the
Clausius-Mossotti factor values (positive or negative) is used to determine the direction
and magnitude of the dielectrophoretic force acting on a cell:
- If Re(fCM) >0, the particle is more polarizable than the suspending medium.
Charges are distributed in such a manner that the sum of the Coulomb forces
produces a force directed towards the highest electric field. This is the case of
positive dielectrophoresis (pDEP).
- If Re(fCM) <0, the particle dipole moment is directed to the highest electric field
region. This is the case of negative dielecrophoresis (nDEP).
The analysis of the Clausius-Mossotti factor sign and thus of the dielectric properties of
the cell can predict the effects of the electric solicitation (Figure 3.3).
Electrical and geometrical parameters of the cell directly influence the
Clausius_Mossotti factor as shown in the following spectra (Figure 3.4). Table 3.2
summarizes the values used for the calculations, for each DEP curve the parameter
under investigation was changed as shown in legend and the other parameters were kept
fixed.
Table 3.2: Values adopted for each parameter within the DEP simulation.
Parameter Radius σmedium σmembrane εmembrane, rel σcytoplasm εcytoplasm, rel
Value 5 µm 0,1 S/m 1e-6 S/m 6 0.4 S/m 45
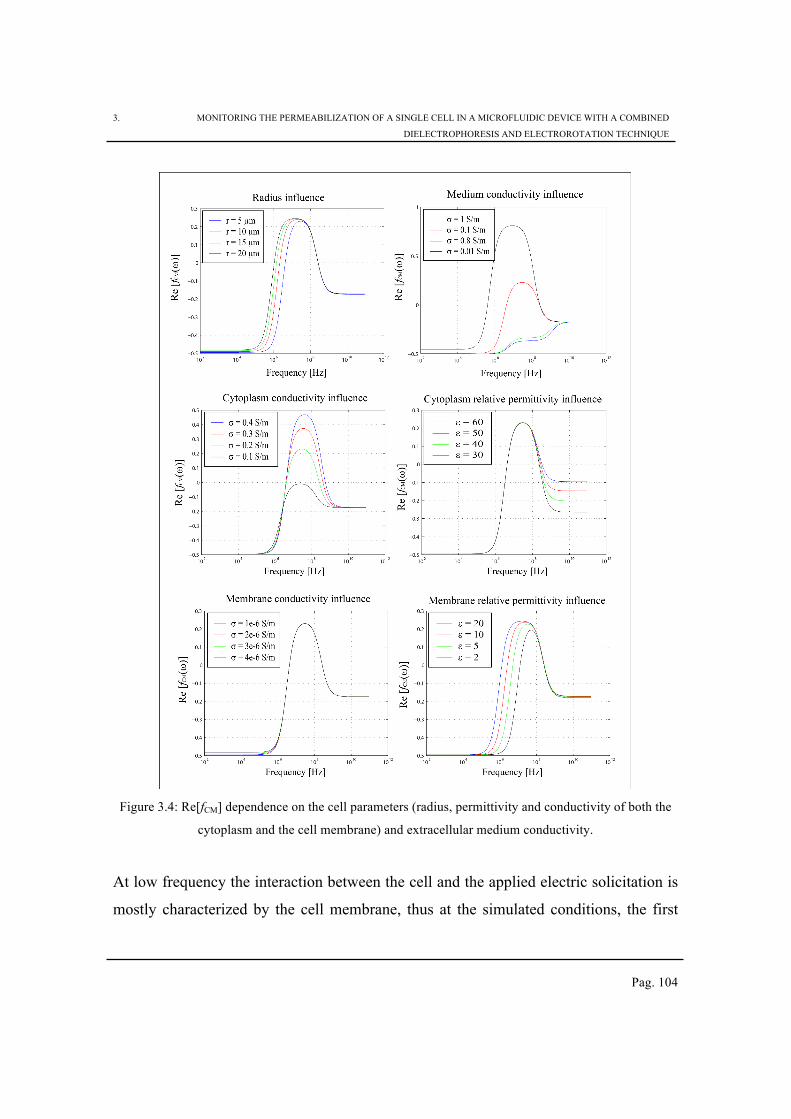
3. MONITORING THE PERMEABILIZATION OF A SINGLE CELL IN A MICROFLUIDIC DEVICE WITH A COMBINED
DIELECTROPHORESIS AND ELECTROROTATION TECHNIQUE
Pag. 104
Figure 3.4: Re[fCM] dependence on the cell parameters (radius, permittivity and conductivity of both the
cytoplasm and the cell membrane) and extracellular medium conductivity.
At low frequency the interaction between the cell and the applied electric solicitation is
mostly characterized by the cell membrane, thus at the simulated conditions, the first
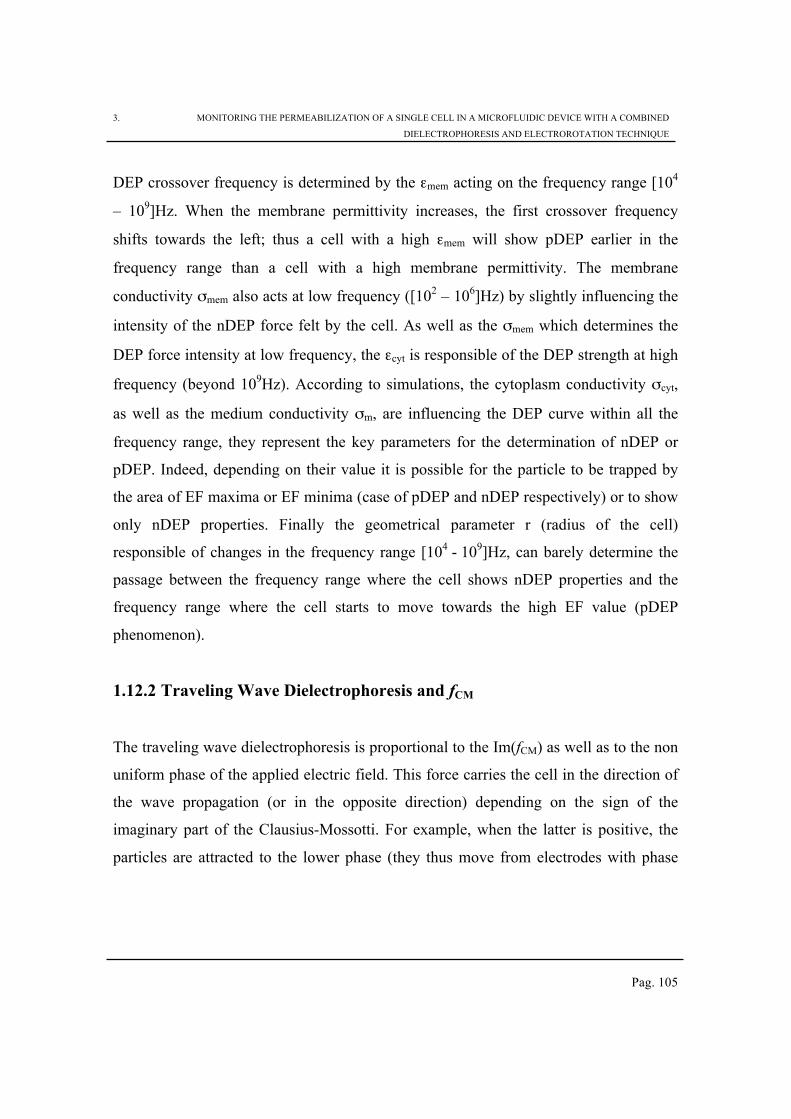
3. MONITORING THE PERMEABILIZATION OF A SINGLE CELL IN A MICROFLUIDIC DEVICE WITH A COMBINED
DIELECTROPHORESIS AND ELECTROROTATION TECHNIQUE
Pag. 105
DEP crossover frequency is determined by the εmem acting on the frequency range [104
– 109]Hz. When the membrane permittivity increases, the first crossover frequency
shifts towards the left; thus a cell with a high εmem will show pDEP earlier in the
frequency range than a cell with a high membrane permittivity. The membrane
conductivity σmem also acts at low frequency ([102 – 106]Hz) by slightly influencing the
intensity of the nDEP force felt by the cell. As well as the σmem which determines the
DEP force intensity at low frequency, the εcyt is responsible of the DEP strength at high
frequency (beyond 109Hz). According to simulations, the cytoplasm conductivity σcyt,
as well as the medium conductivity σm, are influencing the DEP curve within all the
frequency range, they represent the key parameters for the determination of nDEP or
pDEP. Indeed, depending on their value it is possible for the particle to be trapped by
the area of EF maxima or EF minima (case of pDEP and nDEP respectively) or to show
only nDEP properties. Finally the geometrical parameter r (radius of the cell)
responsible of changes in the frequency range [104 - 109]Hz, can barely determine the
passage between the frequency range where the cell shows nDEP properties and the
frequency range where the cell starts to move towards the high EF value (pDEP
phenomenon).
1.12.2 Traveling Wave Dielectrophoresis and fCM
The traveling wave dielectrophoresis is proportional to the Im(fCM) as well as to the non
uniform phase of the applied electric field. This force carries the cell in the direction of
the wave propagation (or in the opposite direction) depending on the sign of the
imaginary part of the Clausius-Mossotti. For example, when the latter is positive, the
particles are attracted to the lower phase (they thus move from electrodes with phase
3. MONITORING THE PERMEABILIZATION OF A SINGLE CELL IN A MICROFLUIDIC DEVICE WITH A COMBINED
DIELECTROPHORESIS AND ELECTROROTATION TECHNIQUE
Pag. 106
90° to the electrodes with phase 0°, direction called “co-field TW”) and if the sign is
negative, the movement is towards the highest phase (“anti-field TW”) [171].
1.12.3 Electrorotation and fCM
When the electrodes disposition is along a line and thus the travelling wave is linear, the
field induces a translational movement of the particle (TWD discussed in the previous
paragraph). In the case where the electric field is rotating, the particle experiences a
rotational movement as the induced dipole m tries to align with the rotational applied
electric field E (Section 1.1.3).
The electrorotation, as well as the TWD, is proportional to the imaginary part of the
Clausius-Mossotti factor and the rotational direction of the cell depends on its sign.
When Im(fCM)>0 the cell rotates in the opposite direction of the field, otherwise the
rotation of both the field and the cell follow the same direction.
The electrorotation spectrum is sensitive to the dielectric properties of the cell and it
changes depending on the value of the permittivity and the conductivity of the
cytoplasm and of the membrane and in respect with the radius and the extracellular
medium as shown in Figure 3.5. For each ROT curve the parameter under investigation
was changed as shown in legend and the other parameters were kept fixed (see Table
3.2).
3. MONITORING THE PERMEABILIZATION OF A SINGLE CELL IN A MICROFLUIDIC DEVICE WITH A COMBINED
DIELECTROPHORESIS AND ELECTROROTATION TECHNIQUE
Pag. 107
Figure 3.5: influence of cell parameters (radius, permittivity and conductivity of both the cytoplasm and
the cell membrane) and extracellular medium conductivity on the electrorotation spectrum.
3. MONITORING THE PERMEABILIZATION OF A SINGLE CELL IN A MICROFLUIDIC DEVICE WITH A COMBINED
DIELECTROPHORESIS AND ELECTROROTATION TECHNIQUE
Pag. 108
As past literature has demonstrated [6, 29], the first pic of the curve is related to the
membrane properties while the positive pic is mainly due to the characteristic of the
cytoplasm. This dependency is quite remarkable from the Figure 3.5, the changes in the
membrane conductivity and permittivity actually modify the curve at low frequency
while the changes in the cytoplasm conductivity and permittivity mostly influence the
second pic of the curve.
The cytoplasm permittivity εcyt is responsible of the rotational velocity of the cell at
high frequency, at that frequency the membrane does not represent a barrier anymore
and thus the inner compartment of the cell determines the effects of the applied electric
field. The εcyt appears in a large frequency range of the electrorotation spectrum by
modifying the spectrum in terms of highest rotational velocity achieved by the cell. The
membrane dielectric properties are fully present at the first pic of the curve, the
membrane conductivity σcmem influences the shape and the negative pic while the
membrane permittivity εcmem causes a shift of the negative pic to the lowest frequency
and a consequent shift of the crossover frequency at which the rotational direction is
inverted. The cell radius affects the crossover frequency, it induces a shift of the
spectrum towards low frequencies. Different is the case of the medium conductivity
whose change could totally modify the shape of the curve till a point where no positive
pic is detected anymore.
A set of measurements placed at relatively low frequency (till 107 Hz) can lead to a
study of the membrane properties, while a more accurate estimation of the cytoplasm
properties can be obtained with measurements covering the high frequency range
(beyond 108 Hz).
The electrorotation is revealed to be more sensitive in respect of parameter changes
compare to the dielectrophoresis, small changes of membrane conductivity for instance
are more easily detectable from the ROT curve since they provoke a bigger
modification of the curve with respect to the Re[fCM(ω)] curve. According to our
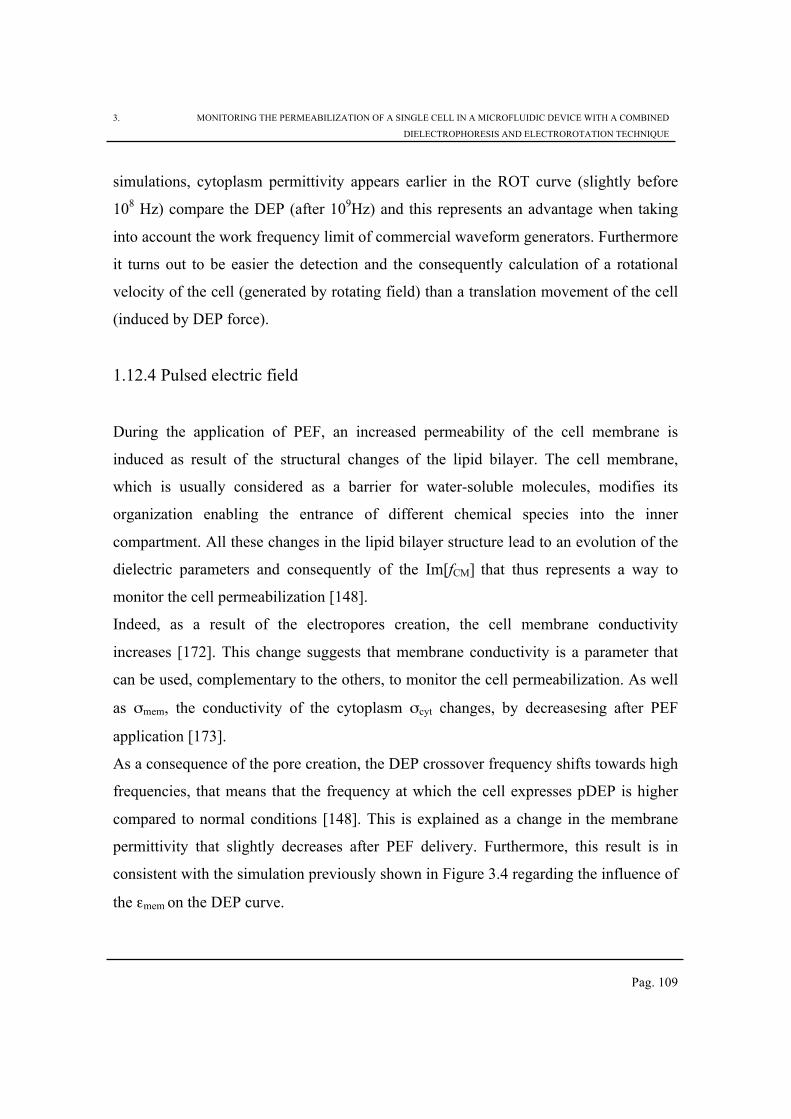
3. MONITORING THE PERMEABILIZATION OF A SINGLE CELL IN A MICROFLUIDIC DEVICE WITH A COMBINED
DIELECTROPHORESIS AND ELECTROROTATION TECHNIQUE
Pag. 109
simulations, cytoplasm permittivity appears earlier in the ROT curve (slightly before
108 Hz) compare the DEP (after 109Hz) and this represents an advantage when taking
into account the work frequency limit of commercial waveform generators. Furthermore
it turns out to be easier the detection and the consequently calculation of a rotational
velocity of the cell (generated by rotating field) than a translation movement of the cell
(induced by DEP force).
1.12.4 Pulsed electric field
During the application of PEF, an increased permeability of the cell membrane is
induced as result of the structural changes of the lipid bilayer. The cell membrane,
which is usually considered as a barrier for water-soluble molecules, modifies its
organization enabling the entrance of different chemical species into the inner
compartment. All these changes in the lipid bilayer structure lead to an evolution of the
dielectric parameters and consequently of the Im[fCM] that thus represents a way to
monitor the cell permeabilization [148].
Indeed, as a result of the electropores creation, the cell membrane conductivity
increases [172]. This change suggests that membrane conductivity is a parameter that
can be used, complementary to the others, to monitor the cell permeabilization. As well
as σmem, the conductivity of the cytoplasm σcyt changes, by decreasesing after PEF
application [173].
As a consequence of the pore creation, the DEP crossover frequency shifts towards high
frequencies, that means that the frequency at which the cell expresses pDEP is higher
compared to normal conditions [148]. This is explained as a change in the membrane
permittivity that slightly decreases after PEF delivery. Furthermore, this result is in
consistent with the simulation previously shown in Figure 3.4 regarding the influence of
the εmem on the DEP curve.
3. MONITORING THE PERMEABILIZATION OF A SINGLE CELL IN A MICROFLUIDIC DEVICE WITH A COMBINED
DIELECTROPHORESIS AND ELECTROROTATION TECHNIQUE
Pag. 110
1.13 Material and method : Combination of electric solicitations for
cell manipulation.
As previously reported, the electrorotation and conventional dielectrophoresis are linked
to the imaginary part and the real part of Clausius Mossotti factor respectively and they
can be experienced by the cell simultaneously.
We investigated the combination of three types of electrical solicitation (DEP,
electrorotation, PEF) within a microfluidic device, in order to monitor and analyze the
electro-physiological properties of two different cell lines (human leukemic T cell
lymphoblast and murine melanoma cell B16F10) submitted to a pulsed electric field.
The cell is trapped and isolated thanks to a negative DEP force (nDEP), and electrically
characterized by electrorotation experiments before and after treatment by PEF.
1.13.1 The design of the electrodes structure.
The proposed biodevice should firstly achieve the cell trapping by DEP, then induce the
rotational movement by superimposing ROT and finally apply the PEF to permeabilize
the cell membrane. Several possible designs for the electrodes were investigated in
order to fulfill the desired functions with optimal performances.
Finite element simulations COMSOLTM Multiphysics 3.5(COMSOL Inc., Newton, MA)
were used to evaluate the electric field mapping within the biodevice, in the area
delimited by the four-electrodes set (see figure 3.6c-d).
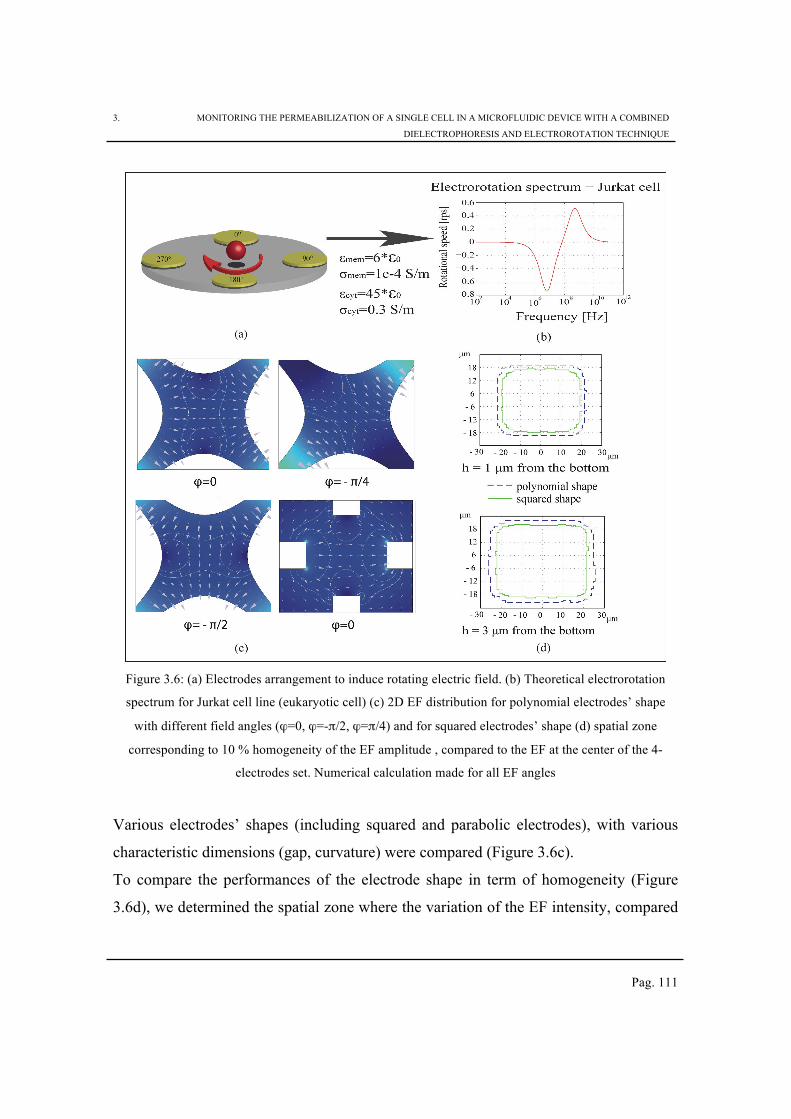
3. MONITORING THE PERMEABILIZATION OF A SINGLE CELL IN A MICROFLUIDIC DEVICE WITH A COMBINED
DIELECTROPHORESIS AND ELECTROROTATION TECHNIQUE
Pag. 111
Figure 3.6: (a) Electrodes arrangement to induce rotating electric field. (b) Theoretical electrorotation
spectrum for Jurkat cell line (eukaryotic cell) (c) 2D EF distribution for polynomial electrodes’ shape
with different field angles (ϕ=0, ϕ=-π/2, ϕ=π/4) and for squared electrodes’ shape (d) spatial zone
corresponding to 10 % homogeneity of the EF amplitude , compared to the EF at the center of the 4-
electrodes set. Numerical calculation made for all EF angles
Various electrodes’ shapes (including squared and parabolic electrodes), with various
characteristic dimensions (gap, curvature) were compared (Figure 3.6c).
To compare the performances of the electrode shape in term of homogeneity (Figure
3.6d), we determined the spatial zone where the variation of the EF intensity, compared
3. MONITORING THE PERMEABILIZATION OF A SINGLE CELL IN A MICROFLUIDIC DEVICE WITH A COMBINED
DIELECTROPHORESIS AND ELECTROROTATION TECHNIQUE
Pag. 112
to the EF at the center of the structure is less than 10%. The operation was repeated for
all field angles (Figure 3.6d). The field homogeneity is of prime importance when
applying electrorotation, as an homogeneous torque is required in the trapping zone in
order to estimate the cell electrical parameters from electrorotation experiments. The
polynomial electrode showed the best performance in terms of homogeneity for the
rotating field amplitude.
In addition, the polynomial electrodes have the advantage of being capable of
generating a radial DEP force in the plane (it only depends on the distance from the
center of the four-electrode set [51]).
The parabolic electrodes were defined with polynomials derived from Laplace’s
equations, their edges lying on a circle centered in zero with a radius of A (equation
of the equipotentials: x
2− y
2= ±A).
By imposing a potential V1 and V2 on adjacent polynomial electrodes, at any point (x,
y) of the central area between the four electrodes structure the potential obtained ϕ can
be expressed as [20]:
φ(x, y) =Vi
A(x
2− y
2)
i =1,2 (3.5)
From the latter, and expression of the EF along the x and y axis and the expression of
the EF norm can be deduced as follow:
Ex=∂ϕ
∂x= −
V2−V
1
Ax (3.6)
Ey =∂ϕ
∂y= −
V2−V
1
Ay (3.7)
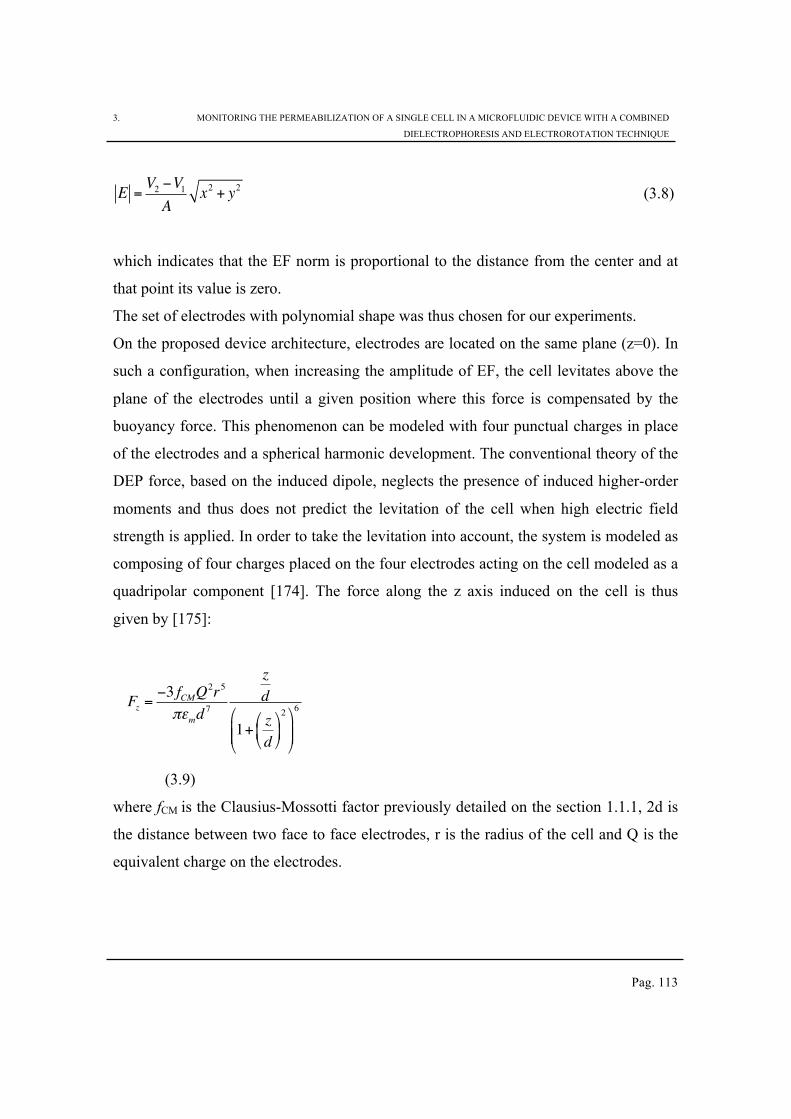
3. MONITORING THE PERMEABILIZATION OF A SINGLE CELL IN A MICROFLUIDIC DEVICE WITH A COMBINED
DIELECTROPHORESIS AND ELECTROROTATION TECHNIQUE
Pag. 113
E =V2−V
1
Ax2+ y
2 (3.8)
which indicates that the EF norm is proportional to the distance from the center and at
that point its value is zero.
The set of electrodes with polynomial shape was thus chosen for our experiments.
On the proposed device architecture, electrodes are located on the same plane (z=0). In
such a configuration, when increasing the amplitude of EF, the cell levitates above the
plane of the electrodes until a given position where this force is compensated by the
buoyancy force. This phenomenon can be modeled with four punctual charges in place
of the electrodes and a spherical harmonic development. The conventional theory of the
DEP force, based on the induced dipole, neglects the presence of induced higher-order
moments and thus does not predict the levitation of the cell when high electric field
strength is applied. In order to take the levitation into account, the system is modeled as
composing of four charges placed on the four electrodes acting on the cell modeled as a
quadripolar component [174]. The force along the z axis induced on the cell is thus
given by [175]:
Fz =−3 fCMQ
2r5
πεmd7
z
d
1+z
d
"
#$
%
&'
2"
#$$
%
&''
6
(3.9)
where fCM is the Clausius-Mossotti factor previously detailed on the section 1.1.1, 2d is
the distance between two face to face electrodes, r is the radius of the cell and Q is the
equivalent charge on the electrodes.
3. MONITORING THE PERMEABILIZATION OF A SINGLE CELL IN A MICROFLUIDIC DEVICE WITH A COMBINED
DIELECTROPHORESIS AND ELECTROROTATION TECHNIQUE
Pag. 114
Thanks to this levitation, the friction force between the cell and the substrate is
advantageously avoided.
1.13.2 The biochip fabrication.
We designed and fabricated an electrorotation microfluidic device composed of 4
parabolic planar electrodes, deposited on a glass substrate, with 75 µm and 150 µm
distance between face-to-face electrodes (Figure 3.7). A 20 nm chromium adhesion
layer, covered by 150 nm thick gold layer, was sputtered on a quartz substrate. A first
photolithography was employed to pattern both layers, the process included the
deposition of S1805 Shipley photoresist by spin coating at v=1000 rpm for 30 s, a
prebake at 115 °C for 1 min was performed followed by the UV illumination
(intensity=16 mW/cm2, t=8 s). A developing step was then performed (by using the
developer 351 for 1 min), followed by the Au etching with KI (4g KI, 1g I2, 40ml H2O,
t=7 s) and the Cr etching (ChromeEtch18 micro resist technology, t=45 s). The resist
was finally removed with acetone (see figure 3.7). The microfluidic level was patterned
thanks to a second photolithography: a 30 µm high microfluidic chamber was defined
by SU8 thick resist, which deposition was made by SU8 2025 spincoating in 2 steps the
first one for 5 at a velocity v1=500 rpm and a second for 30 s at a velocity v2=3000 rpm.
A soft-baking preceded the UV illumination (intensity=16 mW/cm2, t=18 s). The
procedure ended with a post-bake exposure, a developing (MicroChem SU8 developer,
t=6 min) and hard-baking (T=175 °C, t=2 h). The fluidic chamber was covered by a
microscope slide (d=170 µm) for the optical observation and recording of the cell
electrorotation.
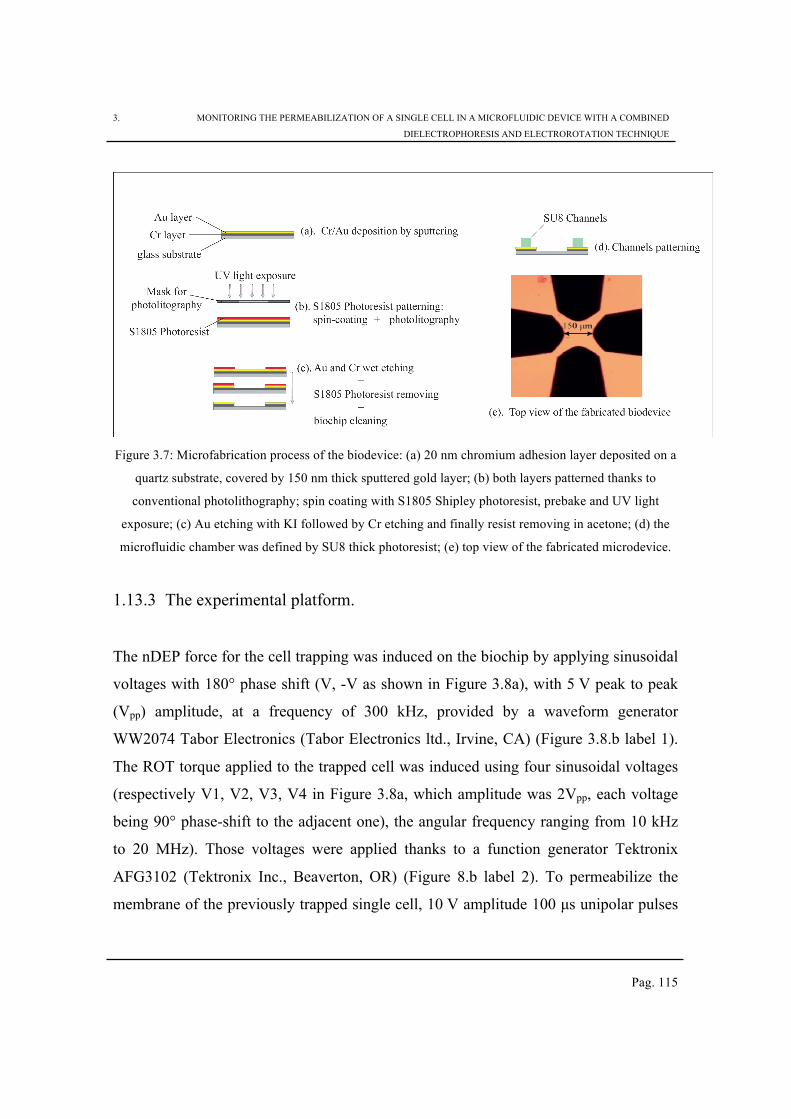
3. MONITORING THE PERMEABILIZATION OF A SINGLE CELL IN A MICROFLUIDIC DEVICE WITH A COMBINED
DIELECTROPHORESIS AND ELECTROROTATION TECHNIQUE
Pag. 115
Figure 3.7: Microfabrication process of the biodevice: (a) 20 nm chromium adhesion layer deposited on a
quartz substrate, covered by 150 nm thick sputtered gold layer; (b) both layers patterned thanks to
conventional photolithography; spin coating with S1805 Shipley photoresist, prebake and UV light
exposure; (c) Au etching with KI followed by Cr etching and finally resist removing in acetone; (d) the
microfluidic chamber was defined by SU8 thick photoresist; (e) top view of the fabricated microdevice.
1.13.3 The experimental platform.
The nDEP force for the cell trapping was induced on the biochip by applying sinusoidal
voltages with 180° phase shift (V, -V as shown in Figure 3.8a), with 5 V peak to peak
(Vpp) amplitude, at a frequency of 300 kHz, provided by a waveform generator
WW2074 Tabor Electronics (Tabor Electronics ltd., Irvine, CA) (Figure 3.8.b label 1).
The ROT torque applied to the trapped cell was induced using four sinusoidal voltages
(respectively V1, V2, V3, V4 in Figure 3.8a, which amplitude was 2Vpp, each voltage
being 90° phase-shift to the adjacent one), the angular frequency ranging from 10 kHz
to 20 MHz). Those voltages were applied thanks to a function generator Tektronix
AFG3102 (Tektronix Inc., Beaverton, OR) (Figure 8.b label 2). To permeabilize the
membrane of the previously trapped single cell, 10 V amplitude 100 µs unipolar pulses
3. MONITORING THE PERMEABILIZATION OF A SINGLE CELL IN A MICROFLUIDIC DEVICE WITH A COMBINED
DIELECTROPHORESIS AND ELECTROROTATION TECHNIQUE
Pag. 116
provided by Agilent 33250A (Agilent Technologies, Santa Clara, CA) function
generator were delivered with a frequency of 1 Hz (Figure 3.8.b label 3). Generators
were synchronized and controlled using a Labview interface (NI Labvies, Austin, TX).
A single cell was firstly trapped in the center of the four electrodes using negative
dielectrophoresis force (nDEP) [55], and then submitted to an electrorotation torque
(ROT) induced by a propagative rotating electrical field [56]. Pulsed Electric Field
(PEF) was superposed to induce the electropermeabilization effect (Figure 3.8a). These
three field solicitations were applied simultaneously thanks to homemade external
electronics (composed by summing amplifiers, Figure 3.8.b label 4)
Movement of cells, observed under a microscope, were acquired with an ultra-fast
camera and finally digitalized (Figure 3.8a label 5). From the analysis of images
sequence, the rotational velocity versus frequency was calculated. Two electrorotation
spectra related to cell characteristic both before pulse application (BP) and after pulses
application (AP) were acquired and analyzed. The changing of the electrical parameters,
induced by the PEF application, was monitored thanks to the use of the fitting algorithm
between the experimental and theoretical spectra.
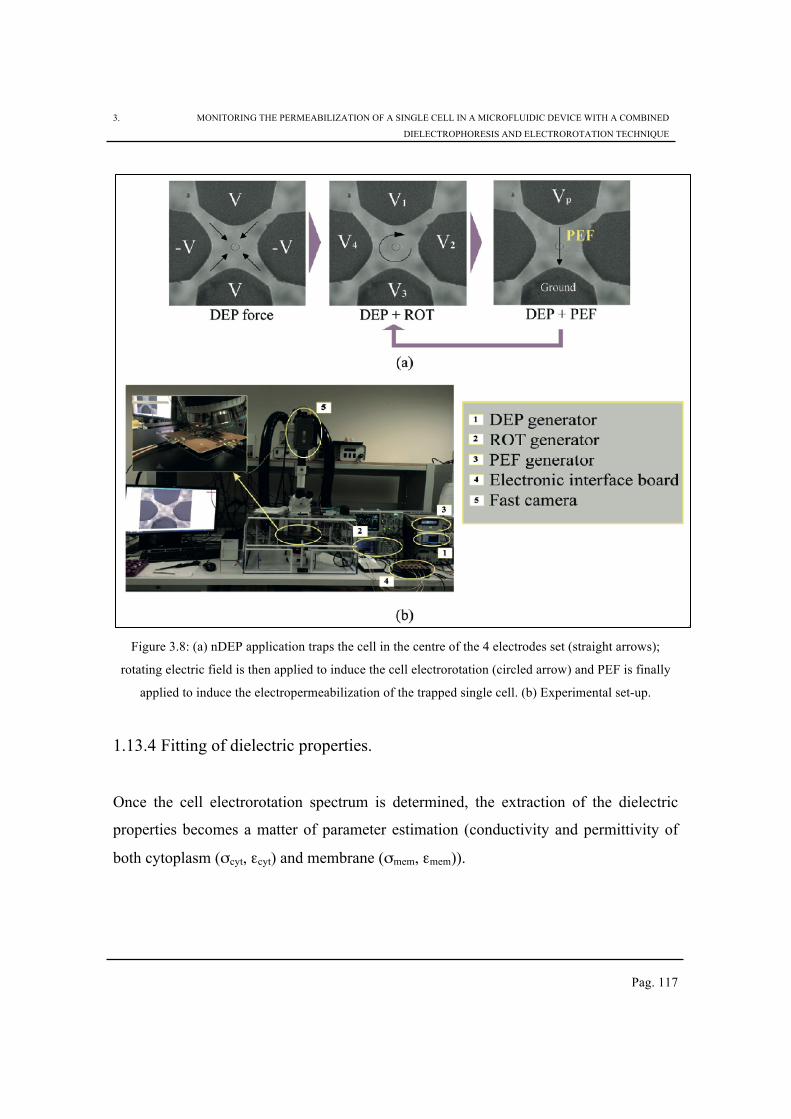
3. MONITORING THE PERMEABILIZATION OF A SINGLE CELL IN A MICROFLUIDIC DEVICE WITH A COMBINED
DIELECTROPHORESIS AND ELECTROROTATION TECHNIQUE
Pag. 117
Figure 3.8: (a) nDEP application traps the cell in the centre of the 4 electrodes set (straight arrows);
rotating electric field is then applied to induce the cell electrorotation (circled arrow) and PEF is finally
applied to induce the electropermeabilization of the trapped single cell. (b) Experimental set-up.
1.13.4 Fitting of dielectric properties.
Once the cell electrorotation spectrum is determined, the extraction of the dielectric
properties becomes a matter of parameter estimation (conductivity and permittivity of
both cytoplasm (σcyt, εcyt) and membrane (σmem, εmem)).
3. MONITORING THE PERMEABILIZATION OF A SINGLE CELL IN A MICROFLUIDIC DEVICE WITH A COMBINED
DIELECTROPHORESIS AND ELECTROROTATION TECHNIQUE
Pag. 118
Nevertheless, the rotational velocity of the cell driven by the electrorotation torque is
non-linearly dependent on the dielectric properties of the cell. As a matter of
consequence, the function to be minimized, that characterizes the distance between
experimental and theoretical spectra, is highly non-linear and may present several local
minima.
Gauss-Newton algorithms, and in particular trust-region-reflective algorithm provide a
solution for solving such non-linear criteria to be minimized. In our case, the least
nonlinear squares algorithm included in Matlab software © (Mathworks, Natick, MA)
was used and adapted to our problem. Trust region algorithms were chosen because
they are reliable and robust, as they can be applied to ill-conditioned problems [176].
The trust region approach is based on the approximation of the studied function f by a
model q, in a neighborhood N (the trust region). The approximate model q is minimized
within N, playing with the parameters. Whether these parameters minimize or do not
minimize f, the trust-region is widened or shrunk.
The non linear cost function to be minimized in our problem is
∑=
Ω−=n
i
p pzpf1
2),(minarg),( ωω
(3.14)
where Ω(ω,p) is the estimated angular velocity as expressed in the equation 1.18
(section 1.1.3), z is the measured rotational velocity of the cell, p represents the
parameters to be estimated (real conductivity and real permittivity of the cytoplasm and
of the membrane). n represents the number of iterations used for the convergence.
The algorithm was initialized using initial values taken from literature [164]. Details
about the estimation program is available in the ANNEX A.
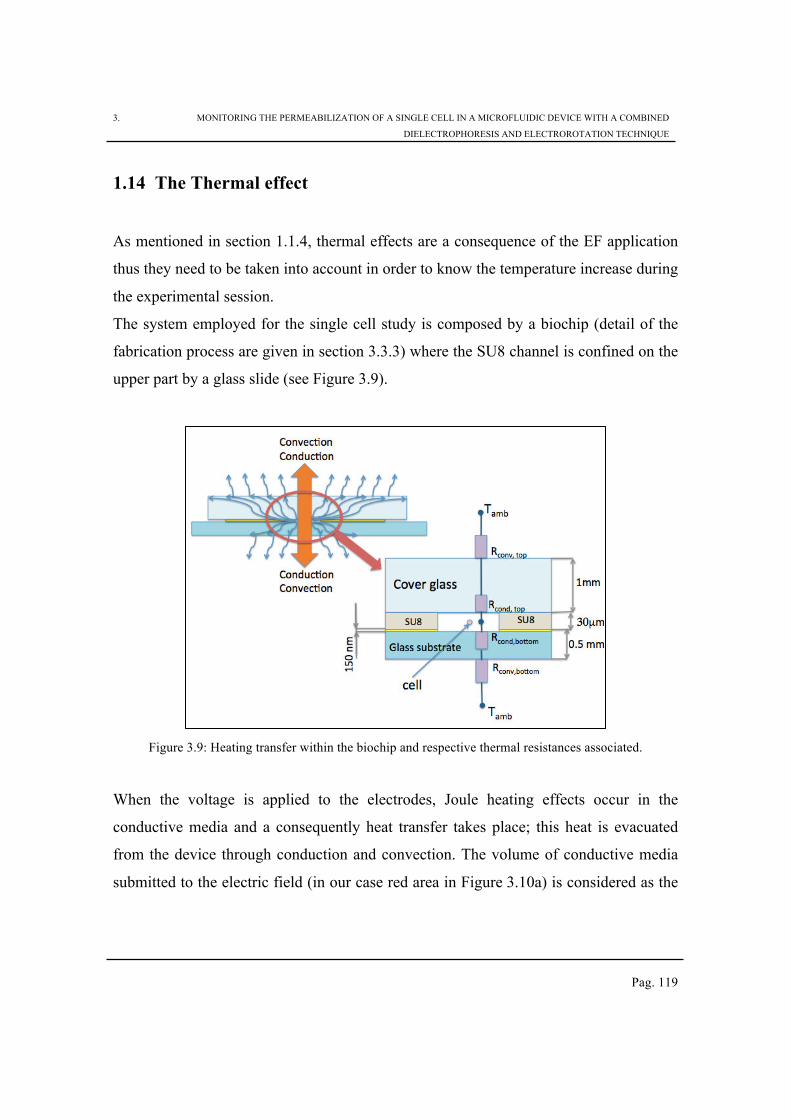
3. MONITORING THE PERMEABILIZATION OF A SINGLE CELL IN A MICROFLUIDIC DEVICE WITH A COMBINED
DIELECTROPHORESIS AND ELECTROROTATION TECHNIQUE
Pag. 119
1.14 The Thermal effect
As mentioned in section 1.1.4, thermal effects are a consequence of the EF application
thus they need to be taken into account in order to know the temperature increase during
the experimental session.
The system employed for the single cell study is composed by a biochip (detail of the
fabrication process are given in section 3.3.3) where the SU8 channel is confined on the
upper part by a glass slide (see Figure 3.9).
Figure 3.9: Heating transfer within the biochip and respective thermal resistances associated.
When the voltage is applied to the electrodes, Joule heating effects occur in the
conductive media and a consequently heat transfer takes place; this heat is evacuated
from the device through conduction and convection. The volume of conductive media
submitted to the electric field (in our case red area in Figure 3.10a) is considered as the
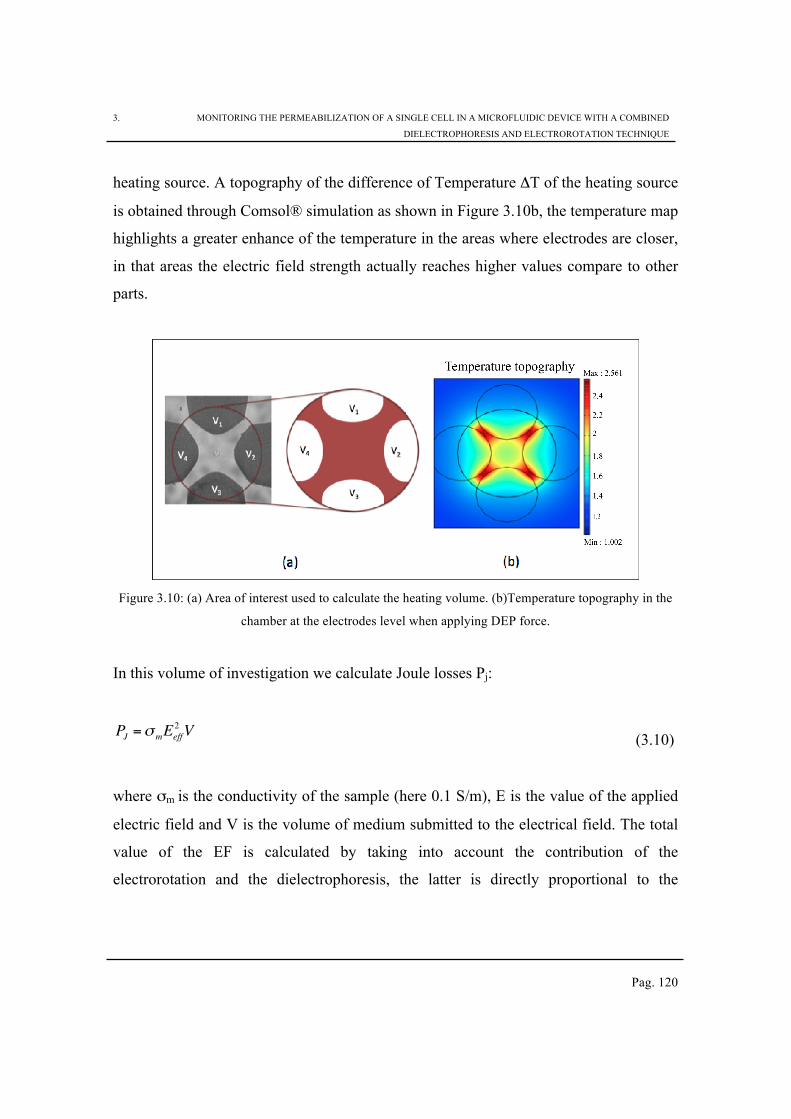
3. MONITORING THE PERMEABILIZATION OF A SINGLE CELL IN A MICROFLUIDIC DEVICE WITH A COMBINED
DIELECTROPHORESIS AND ELECTROROTATION TECHNIQUE
Pag. 120
heating source. A topography of the difference of Temperature ΔT of the heating source
is obtained through Comsol® simulation as shown in Figure 3.10b, the temperature map
highlights a greater enhance of the temperature in the areas where electrodes are closer,
in that areas the electric field strength actually reaches higher values compare to other
parts.
Figure 3.10: (a) Area of interest used to calculate the heating volume. (b)Temperature topography in the
chamber at the electrodes level when applying DEP force.
In this volume of investigation we calculate Joule losses Pj:
PJ =σ mEeff
2V
(3.10)
where σm is the conductivity of the sample (here 0.1 S/m), E is the value of the applied
electric field and V is the volume of medium submitted to the electrical field. The total
value of the EF is calculated by taking into account the contribution of the
electrorotation and the dielectrophoresis, the latter is directly proportional to the
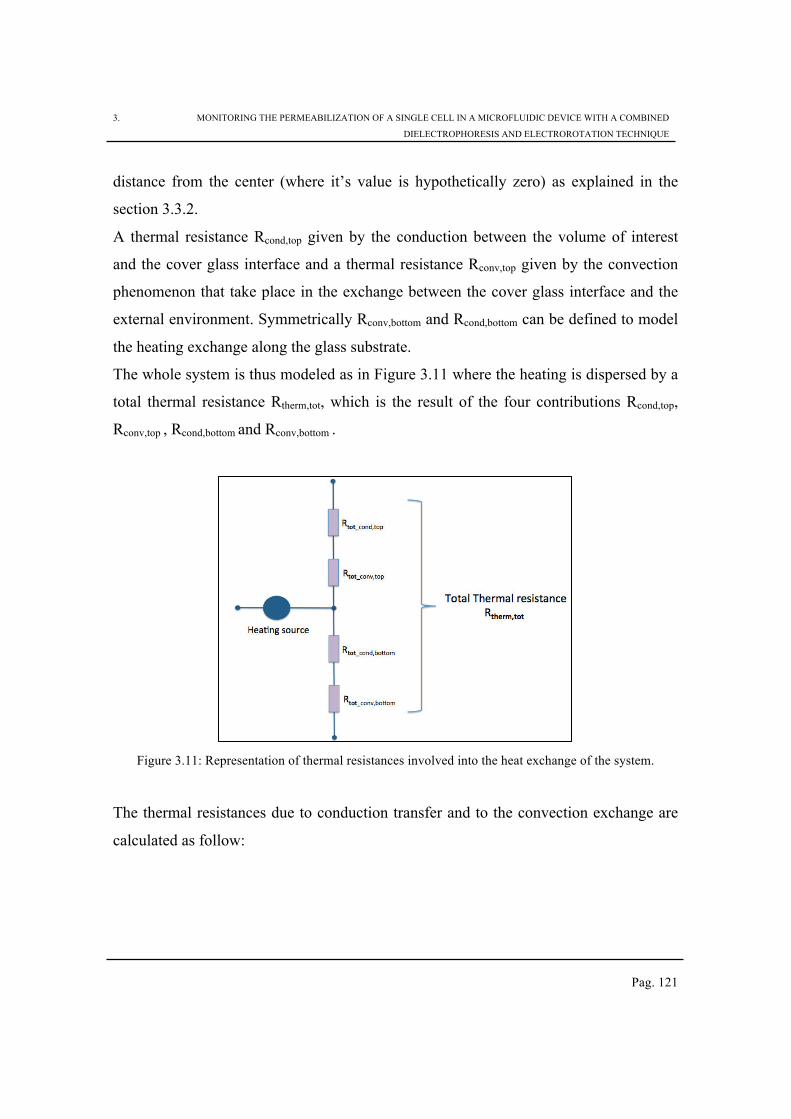
3. MONITORING THE PERMEABILIZATION OF A SINGLE CELL IN A MICROFLUIDIC DEVICE WITH A COMBINED
DIELECTROPHORESIS AND ELECTROROTATION TECHNIQUE
Pag. 121
distance from the center (where it’s value is hypothetically zero) as explained in the
section 3.3.2.
A thermal resistance Rcond,top given by the conduction between the volume of interest
and the cover glass interface and a thermal resistance Rconv,top given by the convection
phenomenon that take place in the exchange between the cover glass interface and the
external environment. Symmetrically Rconv,bottom and Rcond,bottom can be defined to model
the heating exchange along the glass substrate.
The whole system is thus modeled as in Figure 3.11 where the heating is dispersed by a
total thermal resistance Rtherm,tot, which is the result of the four contributions Rcond,top,
Rconv,top , Rcond,bottom and Rconv,bottom .
Figure 3.11: Representation of thermal resistances involved into the heat exchange of the system.
The thermal resistances due to conduction transfer and to the convection exchange are
calculated as follow:
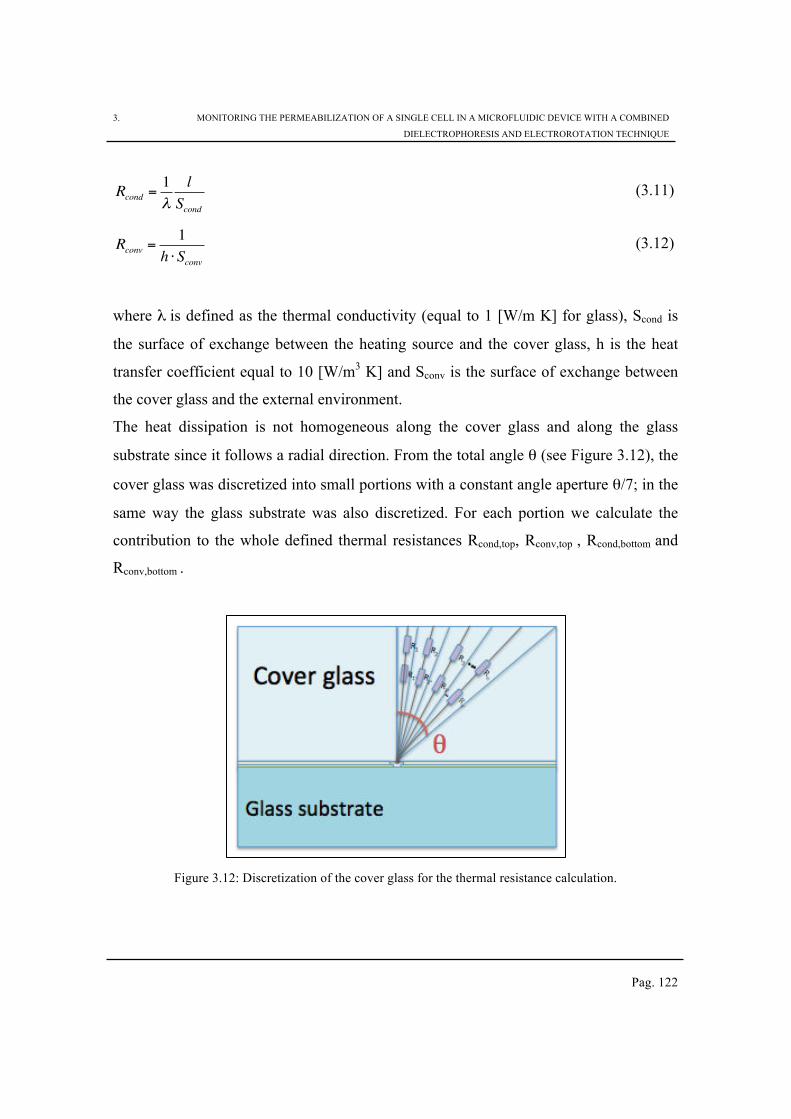
3. MONITORING THE PERMEABILIZATION OF A SINGLE CELL IN A MICROFLUIDIC DEVICE WITH A COMBINED
DIELECTROPHORESIS AND ELECTROROTATION TECHNIQUE
Pag. 122
Rcond
=1
λ
l
Scond
(3.11)
Rconv
=1
h ⋅Sconv
(3.12)
where λ is defined as the thermal conductivity (equal to 1 [W/m K] for glass), Scond is
the surface of exchange between the heating source and the cover glass, h is the heat
transfer coefficient equal to 10 [W/m3 K] and Sconv is the surface of exchange between
the cover glass and the external environment.
The heat dissipation is not homogeneous along the cover glass and along the glass
substrate since it follows a radial direction. From the total angle θ (see Figure 3.12), the
cover glass was discretized into small portions with a constant angle aperture θ/7; in the
same way the glass substrate was also discretized. For each portion we calculate the
contribution to the whole defined thermal resistances Rcond,top, Rconv,top , Rcond,bottom and
Rconv,bottom .
Figure 3.12: Discretization of the cover glass for the thermal resistance calculation.
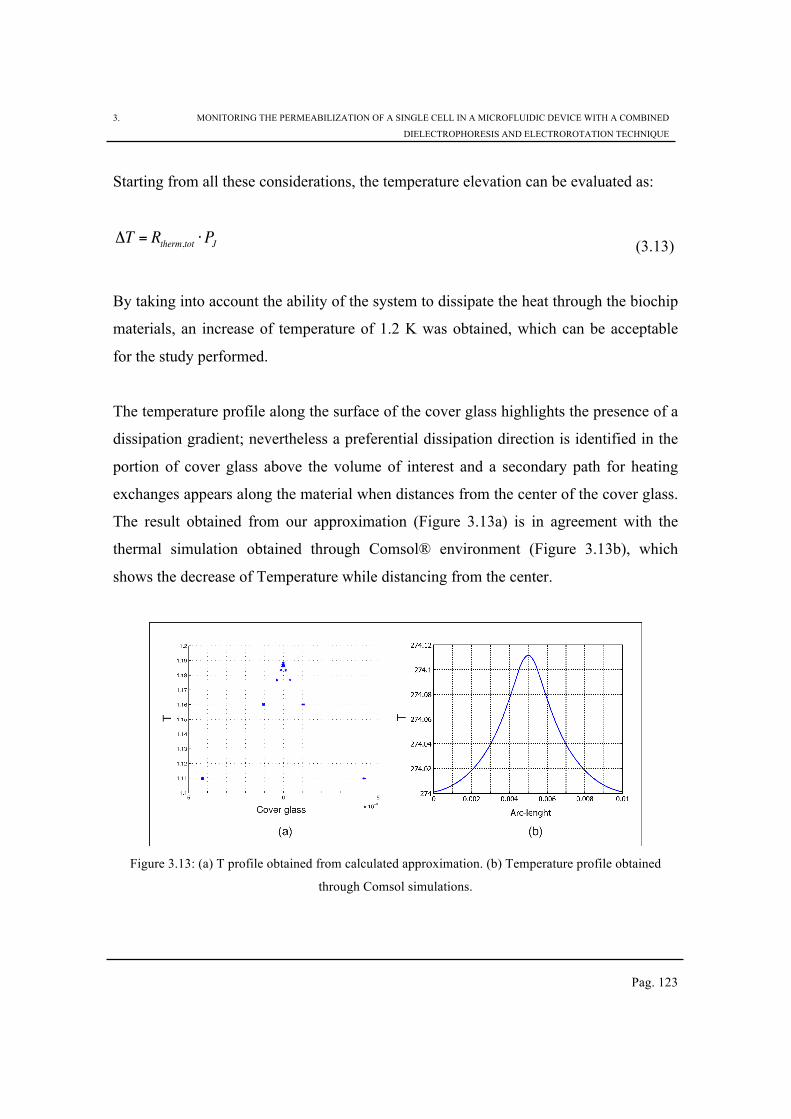
3. MONITORING THE PERMEABILIZATION OF A SINGLE CELL IN A MICROFLUIDIC DEVICE WITH A COMBINED
DIELECTROPHORESIS AND ELECTROROTATION TECHNIQUE
Pag. 123
Starting from all these considerations, the temperature elevation can be evaluated as:
ΔT = Rtherm,tot
⋅PJ (3.13)
By taking into account the ability of the system to dissipate the heat through the biochip
materials, an increase of temperature of 1.2 K was obtained, which can be acceptable
for the study performed.
The temperature profile along the surface of the cover glass highlights the presence of a
dissipation gradient; nevertheless a preferential dissipation direction is identified in the
portion of cover glass above the volume of interest and a secondary path for heating
exchanges appears along the material when distances from the center of the cover glass.
The result obtained from our approximation (Figure 3.13a) is in agreement with the
thermal simulation obtained through Comsol® environment (Figure 3.13b), which
shows the decrease of Temperature while distancing from the center.
Figure 3.13: (a) T profile obtained from calculated approximation. (b) Temperature profile obtained
through Comsol simulations.
3. MONITORING THE PERMEABILIZATION OF A SINGLE CELL IN A MICROFLUIDIC DEVICE WITH A COMBINED
DIELECTROPHORESIS AND ELECTROROTATION TECHNIQUE
Pag. 124
The evaluation of the thermal effect needs to be validated by more precise methods,
indeed a temperature topography could be mapped by using a staining fluorescent dye
as shown in the literature [177].
1.15 The permeabilization analysis with the combined DEP and ROT
techniques.
The presented microfluidic device, combining DEP and ROT to monitor the
permeabilization induced by PEF application, was used to carry on experiments with
two different cell lines: Jurkat E 6.1 and B16F10.
Jurkat cells (human leukemic T cell lymphoblast) were cultured in RPMI 1640
Medium, supplemented with 10% fetal bovine serum and 1 % penicillin/streptomycin
while B16F10 cell line (murine melanoma cell) were cultured in DMEM Medium,
supplemented with 10% fetal bovine serum and 1 % penicillin/streptomycin. The
experimental protocol adopted to prepare the sample was the same for both cell lines.
Cells were collected by centrifugation, washed three times with a low conductivity
buffer (σm=0.1 S/m) and re-suspended in an isotonic medium (σm=0.1 S/m) prepared
for the electrorotation experiments. The experimental buffer is prepared by mixing into
deionized water 0.25mM of sucrose, 10mM of TRIS (Tris-hydroxymethyl-
aminomethane) and 1mM of MgCl2. The resulting pH value is 7 and the osmolarity of
300mOsm.
As previously mentioned the single cell was trapped in the center by nDEP, while
electrorotation was induced in order to extract the electrophysiological properties from
the spectrum acquired before and after the PEF application.
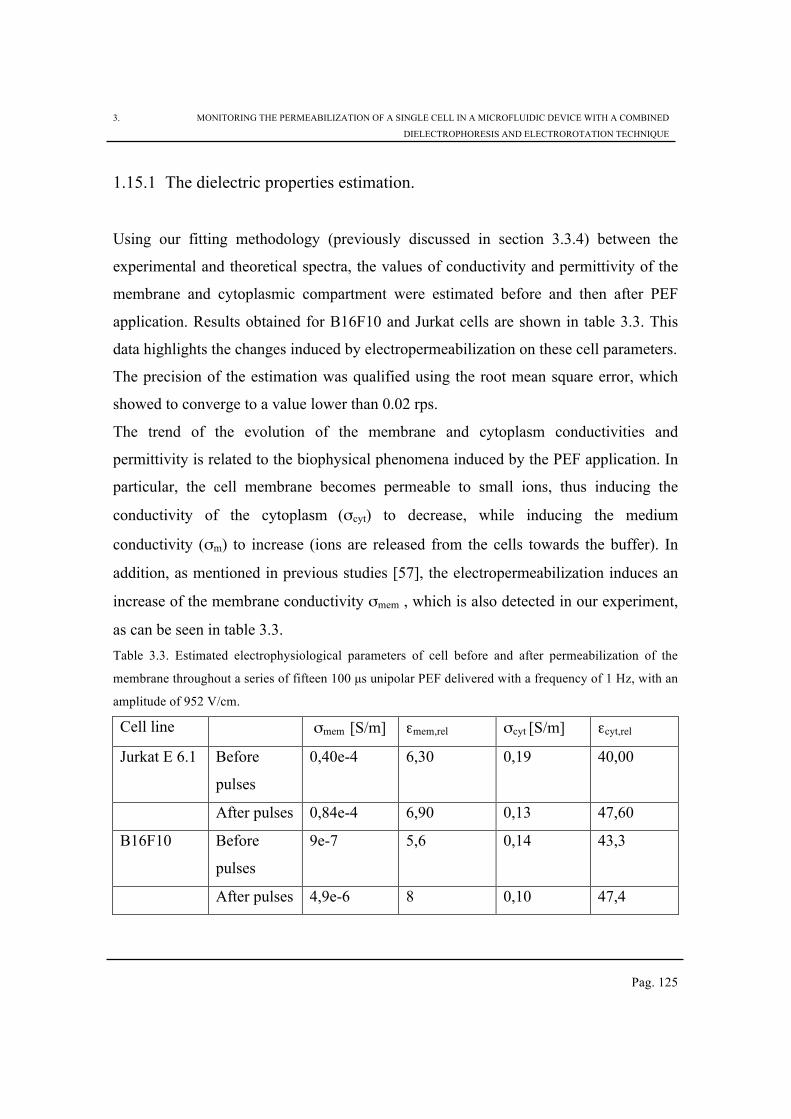
3. MONITORING THE PERMEABILIZATION OF A SINGLE CELL IN A MICROFLUIDIC DEVICE WITH A COMBINED
DIELECTROPHORESIS AND ELECTROROTATION TECHNIQUE
Pag. 125
1.15.1 The dielectric properties estimation.
Using our fitting methodology (previously discussed in section 3.3.4) between the
experimental and theoretical spectra, the values of conductivity and permittivity of the
membrane and cytoplasmic compartment were estimated before and then after PEF
application. Results obtained for B16F10 and Jurkat cells are shown in table 3.3. This
data highlights the changes induced by electropermeabilization on these cell parameters.
The precision of the estimation was qualified using the root mean square error, which
showed to converge to a value lower than 0.02 rps.
The trend of the evolution of the membrane and cytoplasm conductivities and
permittivity is related to the biophysical phenomena induced by the PEF application. In
particular, the cell membrane becomes permeable to small ions, thus inducing the
conductivity of the cytoplasm (σcyt) to decrease, while inducing the medium
conductivity (σm) to increase (ions are released from the cells towards the buffer). In
addition, as mentioned in previous studies [57], the electropermeabilization induces an
increase of the membrane conductivity σmem , which is also detected in our experiment,
as can be seen in table 3.3.
Table 3.3. Estimated electrophysiological parameters of cell before and after permeabilization of the
membrane throughout a series of fifteen 100 µs unipolar PEF delivered with a frequency of 1 Hz, with an
amplitude of 952 V/cm.
Cell line σmem [S/m] εmem,rel σcyt [S/m] εcyt,rel
Jurkat E 6.1 Before
pulses
0,40e-4 6,30 0,19 40,00
After pulses 0,84e-4 6,90 0,13 47,60
B16F10 Before
pulses
9e-7 5,6 0,14 43,3
After pulses 4,9e-6 8 0,10 47,4
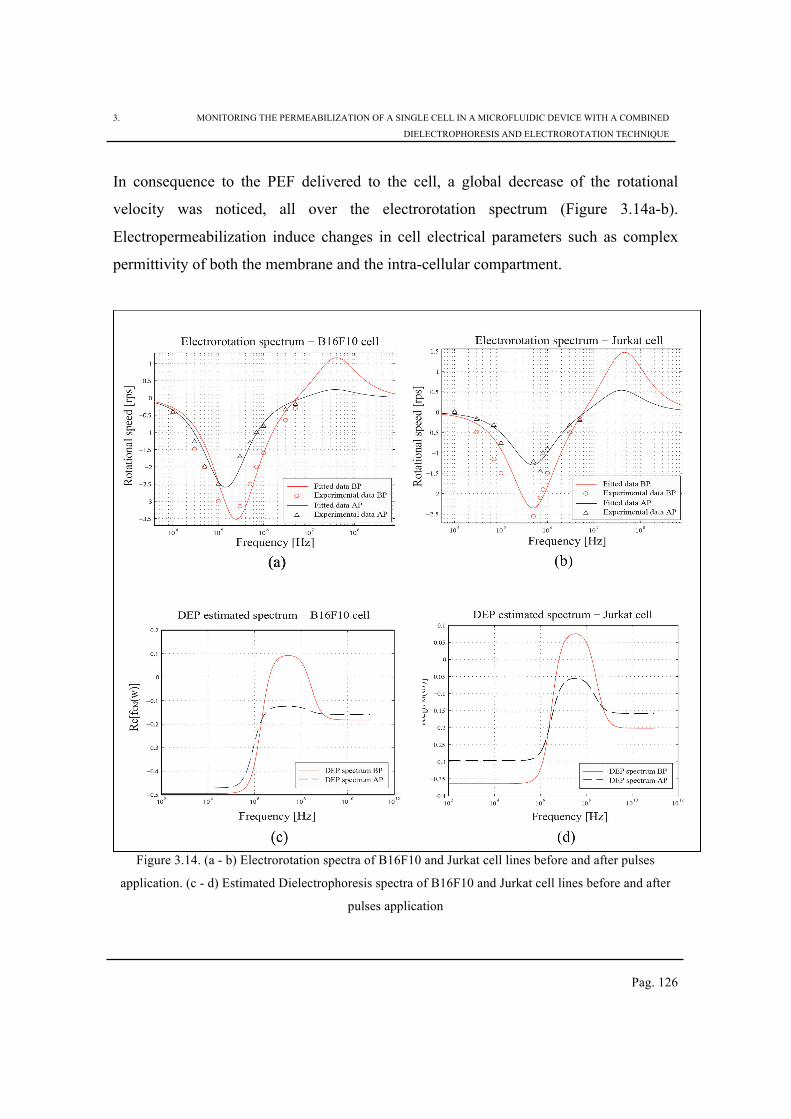
3. MONITORING THE PERMEABILIZATION OF A SINGLE CELL IN A MICROFLUIDIC DEVICE WITH A COMBINED
DIELECTROPHORESIS AND ELECTROROTATION TECHNIQUE
Pag. 126
In consequence to the PEF delivered to the cell, a global decrease of the rotational
velocity was noticed, all over the electrorotation spectrum (Figure 3.14a-b).
Electropermeabilization induce changes in cell electrical parameters such as complex
permittivity of both the membrane and the intra-cellular compartment.
Figure 3.14. (a - b) Electrorotation spectra of B16F10 and Jurkat cell lines before and after pulses
application. (c - d) Estimated Dielectrophoresis spectra of B16F10 and Jurkat cell lines before and after
pulses application
3. MONITORING THE PERMEABILIZATION OF A SINGLE CELL IN A MICROFLUIDIC DEVICE WITH A COMBINED
DIELECTROPHORESIS AND ELECTROROTATION TECHNIQUE
Pag. 127
As mentioned in the literature [58], water defects are introduced within the membrane
during the electropore formation, followed by a reorganization of the phospholipids
head. Such water molecules’ introduction and bilayer reorganization lead to the increase
of the membrane conductivity (σmem) [178], and permittivity [173]. The lipid bilayer
conductivity is linked to the increasing of both number and size of electropores [172].
The evolution of the imaginary part of fCM(ω), which is dependent on the parameters’
evolution after PEF application, is in good accordance with the experimental
observations of the rotational velocity of the cell. Indeed, the evolution of the
parameters (decrease of σcyt, increase of σm, σmem and εmem) induces a decrease of the
imaginary part of fCM(ω), that lead to a diminution of the rotational velocity.
PEF application also influences the DEP properties of the cell, as we already mentioned
in a previous study [179]. The real part of the Clausius-Mossotti factor is deduced from
the estimated electrical parameters: Figure 3.14c-d highlights the fact that when
permeabilized, the cells lose progressively their capability to respond to positive
dielectrophoretic force (pDEP). For the higher degrees of permeabilization, cells
become less polarizable than the surrounding medium, regardless of the frequency of
the applied field. Thus, the capability to respond to pDEP (bandwidth corresponding to
pDEP in the spectrum) might be an indicator of the degree of permeabilization.
Such a microfluidic platform is very convenient to monitor a single cell: indeed it
highlights the increase of its membrane conductivity, and simultaneous decrease of its
cytoplasm conductivity after PEF application. The evolution of the permittivity of both
membrane and cytoplasm was also monitored, thanks to our parameter estimation
method.
This technique combining conventional dielectrophoresis and electrorotation to analyze
the evolution of cell dielectric properties might be a relevant method when monitoring
the level of electropermeabilization.
3. MONITORING THE PERMEABILIZATION OF A SINGLE CELL IN A MICROFLUIDIC DEVICE WITH A COMBINED
DIELECTROPHORESIS AND ELECTROROTATION TECHNIQUE
Pag. 128
1.16 Electrorotation experiment to detect cancer progression.
Identification, selection and separation of biological particles from complex sample
interrogation are of fundamental importance in the generation of new era cancer
diagnostic and treatment.
Cancer includes a large number of tumor diseases, which affect various types of cells
and tissues and have different characteristics depending on the affected organ and of the
degree of malignancy.
Nevertheless, despite a wide spectrum of tumor disease, its various forms share some
characteristics, among which include the proliferative capacity of the cells composing
the tumor and their aggressiveness towards the other tissues of the host.
The previously presented method, the rotating electric field through a sample medium
can be used to elucidate the phenotypic differences of sequentially staged cancer cells.
These differences can be detected as electro-physiological traits intrinsic to a cell which
are both dependent upon structures both on/within the cell.
We describe in this section how the combined ROT and DEP techniques have been used
in the framework of a collaboration to detect minute changes in cancer cells at different
stage of the disease.
These experiments were done within the partnership between our group (BIOMIS, ENS
Cachan within the IDA, CNRS SATIE) and prof. Rafael V. Davalos at the University
"Virginia Tech - Wake Forest University School of Biomedical Engineering and
Sciences "(Blacksburg, Virginia, USA). The European COST Electroporation (STSM)
supported the collaboration.
The cells provided by the biological department at VirginiaTech were Mice Ovarian
Surface Epithelial cells, which is a cell line that mimics the progression of ovarian
cancer from early/non-tumorigenic to late/highly aggressive cancer stages:
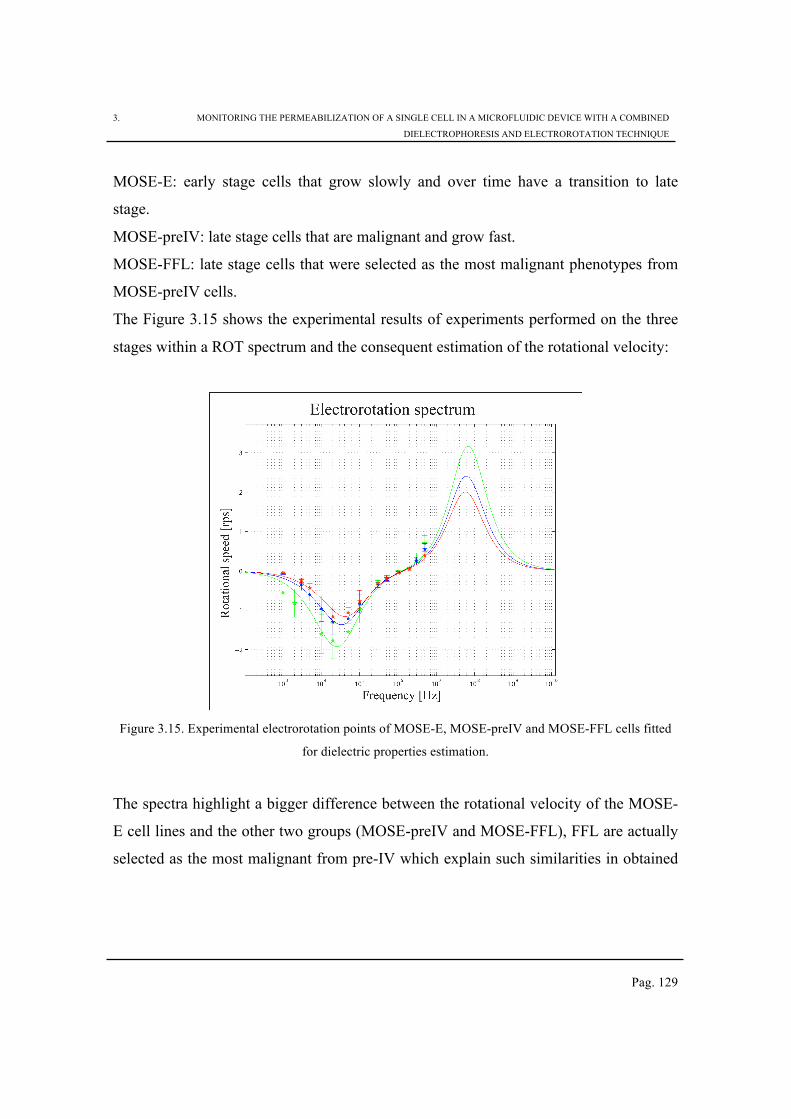
3. MONITORING THE PERMEABILIZATION OF A SINGLE CELL IN A MICROFLUIDIC DEVICE WITH A COMBINED
DIELECTROPHORESIS AND ELECTROROTATION TECHNIQUE
Pag. 129
MOSE-E: early stage cells that grow slowly and over time have a transition to late
stage.
MOSE-preIV: late stage cells that are malignant and grow fast.
MOSE-FFL: late stage cells that were selected as the most malignant phenotypes from
MOSE-preIV cells.
The Figure 3.15 shows the experimental results of experiments performed on the three
stages within a ROT spectrum and the consequent estimation of the rotational velocity:
Figure 3.15. Experimental electrorotation points of MOSE-E, MOSE-preIV and MOSE-FFL cells fitted
for dielectric properties estimation.
The spectra highlight a bigger difference between the rotational velocity of the MOSE-
E cell lines and the other two groups (MOSE-preIV and MOSE-FFL), FFL are actually
selected as the most malignant from pre-IV which explain such similarities in obtained
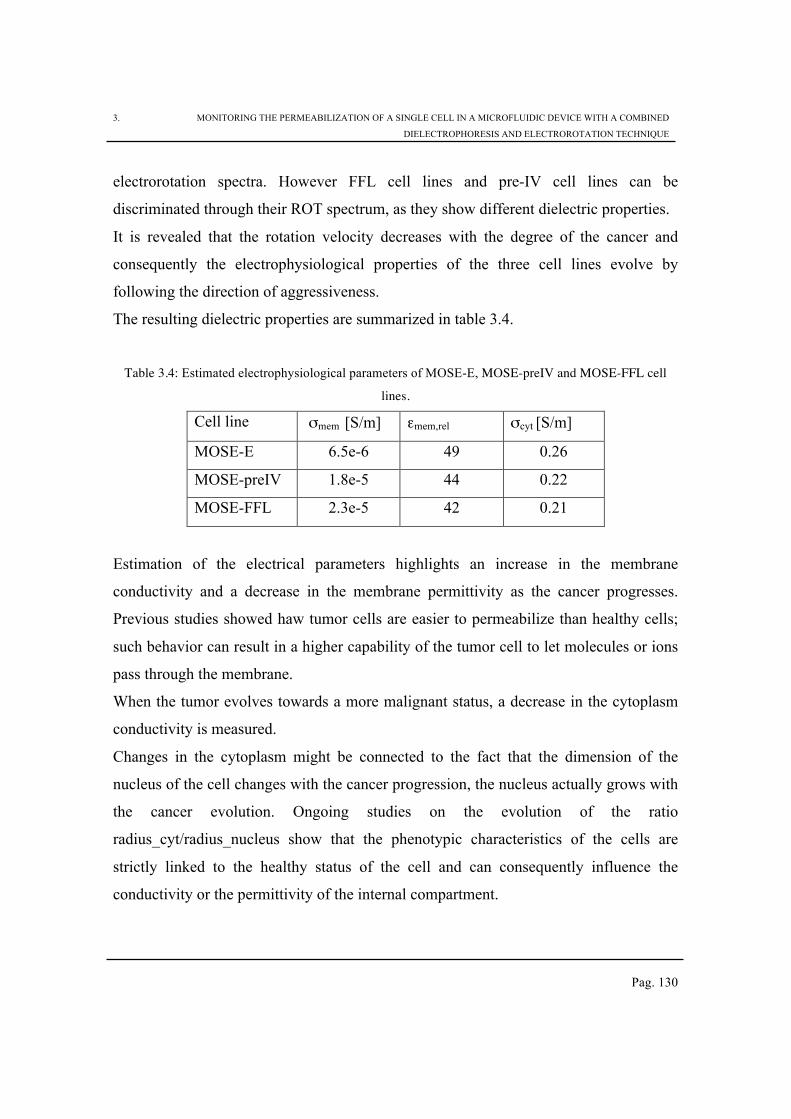
3. MONITORING THE PERMEABILIZATION OF A SINGLE CELL IN A MICROFLUIDIC DEVICE WITH A COMBINED
DIELECTROPHORESIS AND ELECTROROTATION TECHNIQUE
Pag. 130
electrorotation spectra. However FFL cell lines and pre-IV cell lines can be
discriminated through their ROT spectrum, as they show different dielectric properties.
It is revealed that the rotation velocity decreases with the degree of the cancer and
consequently the electrophysiological properties of the three cell lines evolve by
following the direction of aggressiveness.
The resulting dielectric properties are summarized in table 3.4.
Table 3.4: Estimated electrophysiological parameters of MOSE-E, MOSE-preIV and MOSE-FFL cell
lines.
Cell line σmem [S/m] εmem,rel σcyt [S/m]
MOSE-E 6.5e-6 49 0.26
MOSE-preIV 1.8e-5 44 0.22
MOSE-FFL 2.3e-5 42 0.21
Estimation of the electrical parameters highlights an increase in the membrane
conductivity and a decrease in the membrane permittivity as the cancer progresses.
Previous studies showed haw tumor cells are easier to permeabilize than healthy cells;
such behavior can result in a higher capability of the tumor cell to let molecules or ions
pass through the membrane.
When the tumor evolves towards a more malignant status, a decrease in the cytoplasm
conductivity is measured.
Changes in the cytoplasm might be connected to the fact that the dimension of the
nucleus of the cell changes with the cancer progression, the nucleus actually grows with
the cancer evolution. Ongoing studies on the evolution of the ratio
radius_cyt/radius_nucleus show that the phenotypic characteristics of the cells are
strictly linked to the healthy status of the cell and can consequently influence the
conductivity or the permittivity of the internal compartment.
3. MONITORING THE PERMEABILIZATION OF A SINGLE CELL IN A MICROFLUIDIC DEVICE WITH A COMBINED
DIELECTROPHORESIS AND ELECTROROTATION TECHNIQUE
Pag. 131
Nevertheless, since the fitting is made mainly on the experimental points located at low
frequency only hypotheses concerning the cytoplasm dielectric evolution can be
advanced. Further measurements need to be performed in order to validate our
hypothesis.
1.17 Electrorotation as a versatile tool to estimate dielectric properties
of multi-scale biological samples.
The study of the rotational velocity as a function of the frequency and the employment
of the fitting algorithm, results in the dielectric properties of the biosample.
The microfluidic system described in this chapter provides an efficient tool to analyze
and monitor in-situ the dielectric properties of a single cell, and its changes during
electropermeabilization.
The dielectric properties of the trapped cell were extracted from the electrorotation
spectrum with our dedicated fitting algorithm, which allowed us to characterize the
level of permeabilization, in the case of two cell lines (Jurkat cell line and B16F10 cell
line), prior and then after the application of pulsed electric field solicitation.
We observed an increase of the membrane conductivity and permittivity after the PEF
application due to water molecules introduction into the lipid bilayer as well as to the
pore formation. The permeabilization of the cell membrane and consequently its
capability to let pass to small ions, also resulted is a decrease of the cytoplasm
conductivity.
It has also been shown along the chapter that the electrorotation can be employed to
detect minute changes not only between different biological species, but also within the
same sample to identify the stage of cancer for instance.
3. MONITORING THE PERMEABILIZATION OF A SINGLE CELL IN A MICROFLUIDIC DEVICE WITH A COMBINED
DIELECTROPHORESIS AND ELECTROROTATION TECHNIQUE
Pag. 132
The work performed during the scientific collaboration at VirginiaTech highlights
important changes in the dielectric properties of both cytoplasm and membrane induced
by the cancer disease. Although the proximity in health conditions between MOSE-
preIV and MOSE-FFL cell lines, the electrorotation is revealed to be extremely
sensitive. Indeed when the stage of cancer evolves the membrane become more
permeable since its membrane conductivity increases and the internal re-structuration
leads to a decrease of cytoplam conductivity.
The next chapter will demonstrate the versatility of the method by showing its
efficiency for a different scale sample; electrorotation will be actually employed to
monitor the permeabilization of larger size sample such as spheroids. Spheroids
represent a promising model for the in vitro cancer investigation since they can combine
the accuracy of the in vivo tests with the advantages of the in vitro study, a throrough
description of this tumor model will be treated hereafter.
4. THE SPHEROID, A PROMISING “IN VITRO” MODEL FOR TUMOR ANALYSIS: TOWARDS THE PERMEABILIZATION STUDY
Pag. 133
Chapter 4
The spheroid, a promising “in vitro” model for tumor
analysis: towards the permeabilization study
The study presented in the previous chapter about the single cell permeabilization
analysis through the electrorotation technique provides an insight as to how a single
cell reacts to PEF application. In this chapter, we extend the application of this method
to multicellular organization.
In the case of 2-D cell culture, cells create an extracellular matrix that is different than
the matrix of cells within the tissue environment. The extracellular matrix is less dense
than in the biological tissue and it cannot properly model the barrier for tissue
permeabilization and drug delivery.
Some groups avoid this problem by using animal testing. Although this provides us with
good examples of in vivo tumors, it raises complications in terms of experimental
protocol and ethical permission [180]. Furthermore the experiments performed on
animals are based on the induced tumor that grows in a healthy environment. In reality,
the tumor grows little by little and changes the environment around itself by
compromising important tissue structure and functions. The injection of a tumor into a
patient (the animal in this case) who is in good health does not properly demonstrate
the reality of the disease progress. When tumor cells are injected into the animal in
order to induce cancer, the injected tumor cells are already able to develop the disease
4. THE SPHEROID, A PROMISING “IN VITRO” MODEL FOR TUMOR ANALYSIS: TOWARDS THE PERMEABILIZATION STUDY
Pag. 134
and so the process that normally takes place in “natural” conditions is altered. Indeed, a
relationship exists between cancer and its host given its internal development. This
relationship is not present in a simulated injection into a patient who has a fully
functioning immune system [181].
Nevertheless, the animal model represents the only way, at present, to study the
development of cancer’s development in a body where the immune system response
can be investigated.
In this context, the study of a new, more human-reliable model is imperative for basic
research purposes. The combination of in vivo cancer’s behavior, provided through
animal- testing, alongside the advantages of in vitro experiments could represent a
challenge for this area of investigation. Indeed, a 3D multicellular model reproduces the
tissue-like structure and it can mimic many aspects of the human response [182]. Thus,
3D spheroids are a physiologically relevant model which can reproduce biological
functions and responses of real tissue better than the traditional 2D cell monolayers
culture .
Nowadays, the use of the spheroid model can enhance our understanding of tumor
behaviour [183, 184]. Indeed, spheroids are used for the screening of therapeutic
molecules [185, 186], in order to test the efficiency of cancer treatments [187] and the
capability of a carrier to penetrate the cell membrane [188, 189].
Adopting them as a model in the study of the effects of antitumor drugs [190, 191]
shows their pertinence and their relevance for assessing the efficiency of molecules
[192].
Some groups culture spheroids taken directly from the patient biopsies [193, 194] ,
which is a very promising alternative to treatments, as the model can in fact be used in
clinical practice to select customized medication and treatments for each patient.
In this context, the multicellular spheroid is revealed to be an advantageous tool in the
study of the complex reaction of the biological tissue when PEF are applied [195]. More
than a mere aggregate of cells, spheroids are a complex cell matrix where each
4. THE SPHEROID, A PROMISING “IN VITRO” MODEL FOR TUMOR ANALYSIS: TOWARDS THE PERMEABILIZATION STUDY
Pag. 135
component (the cells) has a specific function for the whole structure growth, and where
cells communicate amongst themselves through a specific vascularized biological
tissue. Due to their heterogenic structure, they can represent a potential bridge to cover
the gap between human studies and animal testing [196, 197].
1.18 The multicellular spheroid.
The multicellular spheroids appeared in science in 1970, initially described by
Sutherland et al. [198]. They were presented as a system of cells placed in a 3D space
characterized by a synergy and the complexity typical of biological tissue, showing a
structure particularly close to cancer’s biological tissue [110]. A spheroid is composed
of three main macroscopic layers (Figure 4.1b): an external proliferative compartment
where the cells remaing highly active and carry on their regular activities, an
intermediate compartment where cells are in a quiescent state and eventually a necrotic
core (its presence depends on the size of the spheroid). It is thus possible to recognize a
gradient in the state of the cells’ health when moving from the external side to the inner
compartment of the spheroid structure. When approaching the core of the spheroid, a
lack of oxygen provokes a hypoxic condition and thus the inner compartment becomes
necrotic, corresponding with a typical, unvascularized tumor tissue [199].
The thickness of each layer composing the spheroid depends on the whole size of the
sample and varies depending on the cell line employed. Figure 4.1a shows the
proportional size of these compartments, and refers to various gradients of depicted
metabolites [200]. The figure 4.1b highlights the similarity between cancer and the
spheroid, which thus represents a simplified cancer prototype.
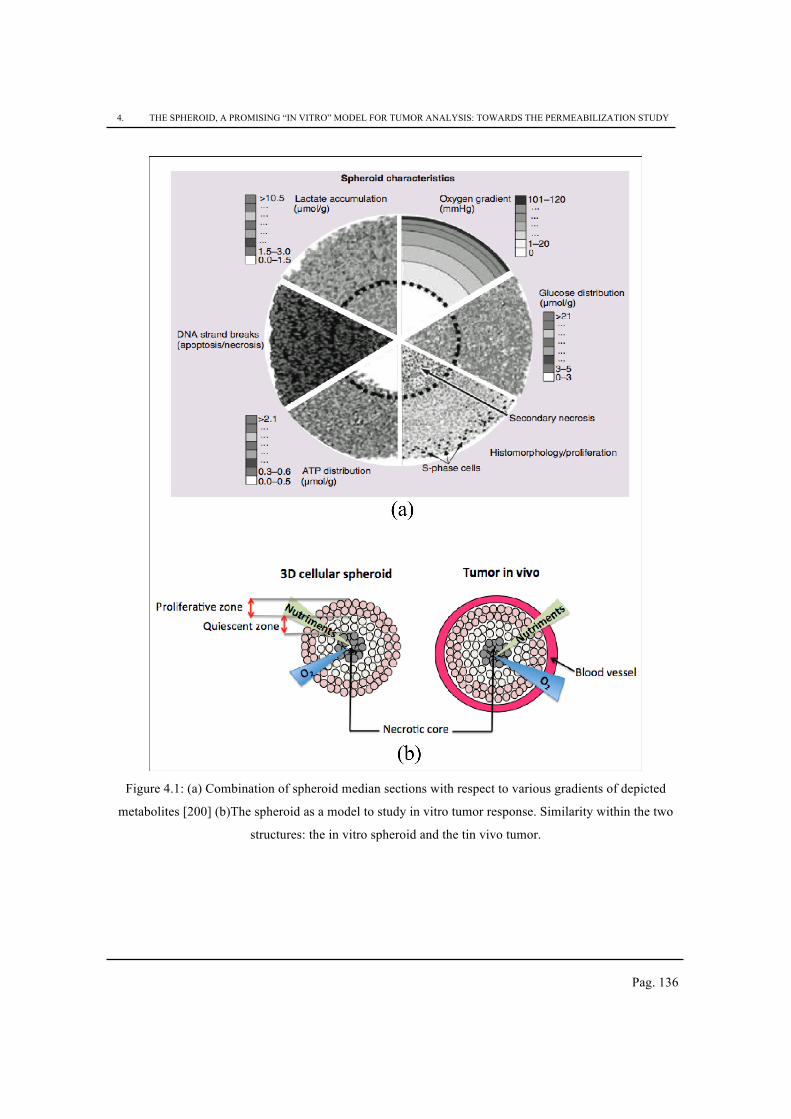
4. THE SPHEROID, A PROMISING “IN VITRO” MODEL FOR TUMOR ANALYSIS: TOWARDS THE PERMEABILIZATION STUDY
Pag. 136
Figure 4.1: (a) Combination of spheroid median sections with respect to various gradients of depicted
metabolites [200] (b)The spheroid as a model to study in vitro tumor response. Similarity within the two
structures: the in vitro spheroid and the tin vivo tumor.
4. THE SPHEROID, A PROMISING “IN VITRO” MODEL FOR TUMOR ANALYSIS: TOWARDS THE PERMEABILIZATION STUDY
Pag. 137
The presence of extracellular matrix and the complex composition of the spheroid
(different levels with cells at different states) creates a microenvironment, the response
of which is different from that obtained with cells cultured in a conventional manner
(2D) [201]. Indeed, most cell types, when cultured in 3D, secrete components that lead
to the formation of an extracellular matrix, advantageous to the biological investigation
[202-204].
Several known cancer cells can be treated in order to obtain spheroids [204-206].
Furthermore, it is also possible to cultivate different cell lines and create a
heterogeneous cellular microenvironment, which better reflects reality [207, 208]. One
of the limits presented by the spheroid is that they are not always able to reproduce the
tumor microenvironment, which implies the presence of non-tumor cells and stroma
[209].
Even if the 3D multicellular culture is more physiologically relevant than the 2D cell-
based models it presents some limits and can fail when reproducing real tissue
responses:
- The experimental medium represents a disadvantage of the cell culture system
(its conductivity is usually low to avoid Joule heating) and it can in fact modify
the effects of certain drugs and fail to mimic the system under investigation.
- Even when the 3D cell culture is developed starting from a patient’s biopsy, the
latter may not be representative of the whole tumor and thus cannot fully predict
its response.
- The experimental microenvironment never replaces the original physiologic
conditions and thus some aspects can be missed (the immune response
contribution for instance).
- It is impossible to perfectly reproduce the drug dose and duration of exposure
since the sample size is much smaller than the real tumor’s volume.
- In consequence, the evaluation of the clinical utility of the test can be difficult
4. THE SPHEROID, A PROMISING “IN VITRO” MODEL FOR TUMOR ANALYSIS: TOWARDS THE PERMEABILIZATION STUDY
Pag. 138
Despite such limitations, important positive correlations were obtained from specific
neoplasms such as gastric [210], ovarian [211] and colorectal [212].
1.19 Spheroid: a model for electropermeabilization
Nowadays, despite some difficulties linked to the limit of the 3D cell culture, the
spheroids represent a promising model for in vivo tumors. For instance, multicellular
spheroids can be used during the permeabilization process in order to study the effect
of electrochemiotherapy treatment; the efficiency of the permeabilization was tested
from Gibot et al. [111] by using the PI penetration.
As complex structure compare to the single cell, the spheroid requires specific PEF
conditions in order to be permeabilized. Hereafter we reported some results derived
from the literature regarding the effects of PEF on the level of permeabilization of the
spheroid and on its morphology [111].
The permeability of the spheroid after the application of PEF was visualized after
labeling the cells with propidium iodide (PI). Images were studied 30 minutes after the
application of PEF a duration which normally allows the plasma membrane to recover
its integrity [69] and which depends on the electrical parameters used and the set
temperature. By extending the results obtained from isolated cells to spheroids; one can
suggest that the cells in which the PI is detected after this time are permeabilized
irreversibly, thereafter dying from electroporation.
In order to have a complete overview of the phenomenon, the electropermeabilization of
the spheroid was studied by Chpinet et al. [109] using both confocal microscopy and
flow cytometry. The confocal microscopy is useful to have a qualitative response and
the flow cytometry is important to quantify the response of the single cell after its
dissociation from the spheroids. The Figure 4.2b presents images obtained with
confocal microscope, the spheroid was subjected to electric field of increasing intensity;
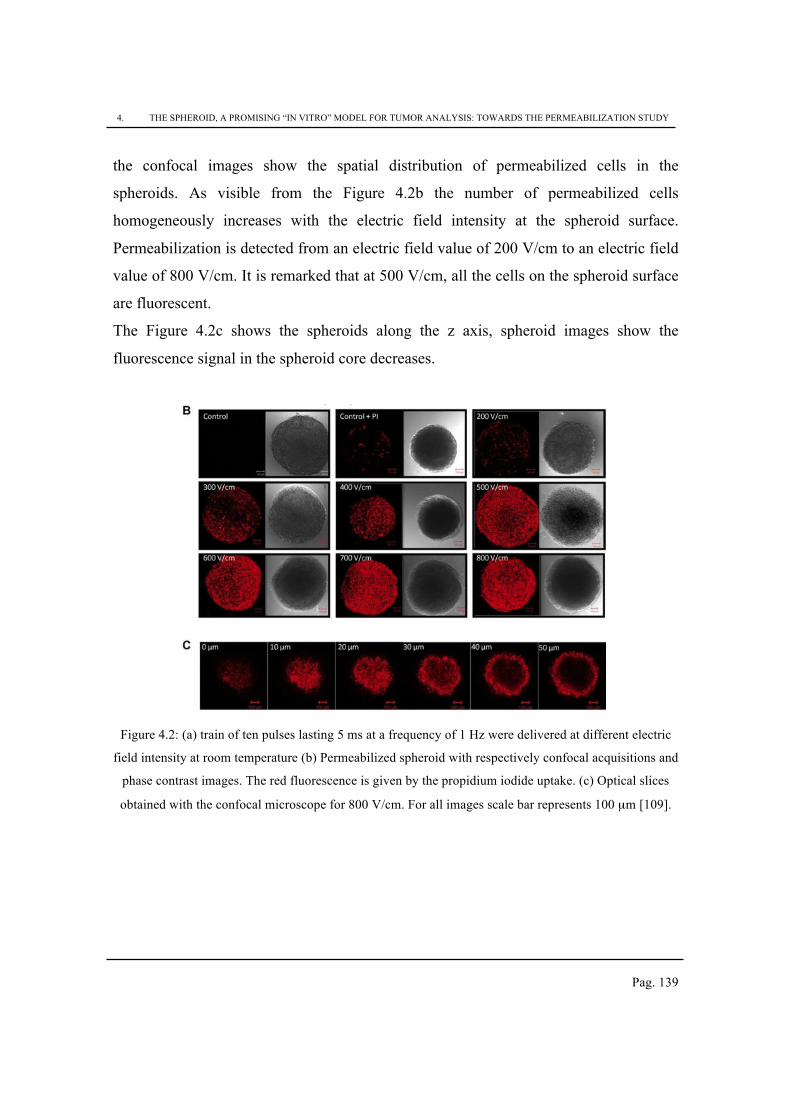
4. THE SPHEROID, A PROMISING “IN VITRO” MODEL FOR TUMOR ANALYSIS: TOWARDS THE PERMEABILIZATION STUDY
Pag. 139
the confocal images show the spatial distribution of permeabilized cells in the
spheroids. As visible from the Figure 4.2b the number of permeabilized cells
homogeneously increases with the electric field intensity at the spheroid surface.
Permeabilization is detected from an electric field value of 200 V/cm to an electric field
value of 800 V/cm. It is remarked that at 500 V/cm, all the cells on the spheroid surface
are fluorescent.
The Figure 4.2c shows the spheroids along the z axis, spheroid images show the
fluorescence signal in the spheroid core decreases.
Figure 4.2: (a) train of ten pulses lasting 5 ms at a frequency of 1 Hz were delivered at different electric
field intensity at room temperature (b) Permeabilized spheroid with respectively confocal acquisitions and
phase contrast images. The red fluorescence is given by the propidium iodide uptake. (c) Optical slices
obtained with the confocal microscope for 800 V/cm. For all images scale bar represents 100 µm [109].
4. THE SPHEROID, A PROMISING “IN VITRO” MODEL FOR TUMOR ANALYSIS: TOWARDS THE PERMEABILIZATION STUDY
Pag. 140
The study performed on the multicellular spheroid cohesion from L. Gibot et al. [111]
also highlights the changes in the morphology due to PEF application.
The study highlights that the outer cell layer of the spheroid does not appear
homogeneously positive to the PI, unlabeled areas are noticeable and many positive
cells are present in the medium around the spheroid. This is due to the fact that dead
cells are detached from the spheroid during the manipulations following the effect of
PEF.
Furthermore, it has to be noticed that, in the case of mixed spheroids i.e. spheroids
where both cancer and healthy cells are presented into the structure, only normal cells
remain viable after ECT while tumor cells are totally destroyed. The same results had
been observed on patients by clinicians [213], and we can thus deduce that the mixed
spheroids are a proper predictable in vitro model for therapeutic response.
Laure Gibot et al. [111] demonstrated that the structure of a multicellular spheroid
changes when specific antitumor drugs (bleomycin, cisplatin or doxorubicin) are
injected and PEF are simultaneously applied. They showed changes when the spheroids
were treated with only anti-tumor drugs and with anti-tumor drugs + the ECT method.
The effect of PEF on spheroid does not apparently change the macroscopic structure of
the sample nor does it preserve its margins. The case of PEF combined with the
insertion of antitumor drugs highlights a different response; in this case the edge of the
spheroid actually appears damaged and small aggregates of cells start to dissociate from
the periphery of the spheroid depending on the drug employed (bleomycin, cisplatin or
doxorubicin).
This study demonstrates that the injection of tumor drugs has a drastic effect on the
spheroid structure, and thus eventually on the tumor structure, when PEF are applied.
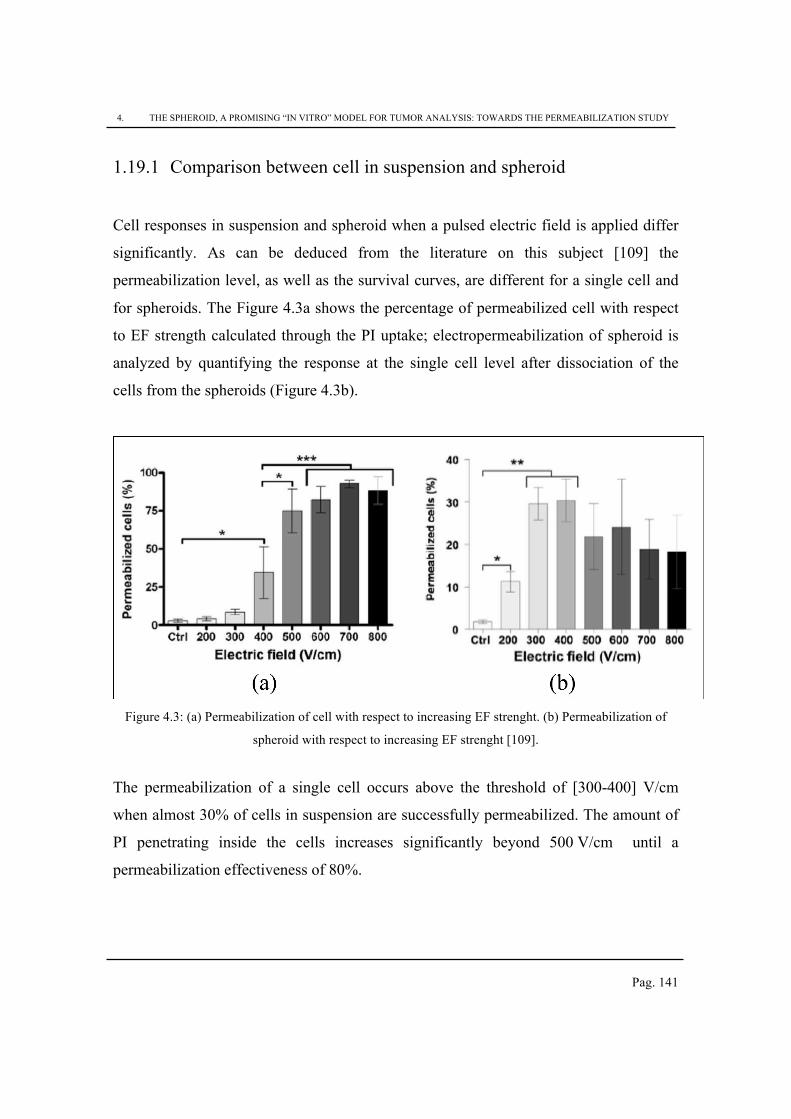
4. THE SPHEROID, A PROMISING “IN VITRO” MODEL FOR TUMOR ANALYSIS: TOWARDS THE PERMEABILIZATION STUDY
Pag. 141
1.19.1 Comparison between cell in suspension and spheroid
Cell responses in suspension and spheroid when a pulsed electric field is applied differ
significantly. As can be deduced from the literature on this subject [109] the
permeabilization level, as well as the survival curves, are different for a single cell and
for spheroids. The Figure 4.3a shows the percentage of permeabilized cell with respect
to EF strength calculated through the PI uptake; electropermeabilization of spheroid is
analyzed by quantifying the response at the single cell level after dissociation of the
cells from the spheroids (Figure 4.3b).
Figure 4.3: (a) Permeabilization of cell with respect to increasing EF strenght. (b) Permeabilization of
spheroid with respect to increasing EF strenght [109].
The permeabilization of a single cell occurs above the threshold of [300-400] V/cm
when almost 30% of cells in suspension are successfully permeabilized. The amount of
PI penetrating inside the cells increases significantly beyond 500 V/cm until a
permeabilization effectiveness of 80%.
4. THE SPHEROID, A PROMISING “IN VITRO” MODEL FOR TUMOR ANALYSIS: TOWARDS THE PERMEABILIZATION STUDY
Pag. 142
Spheroids are revealed to have a permeabilization threshold lower than the single cell;
indeed, already at 200 V/cm a remarkable permeabilization percentage is recorded. The
highest percentage of permeabilizion in spheroid is obtained for field amplitude
between 300 V/cm and 400 V/cm. This percentage actually decreases and reaches a
plateau above 500 V/cm. This upper limit in the permeabilization percentage is a clear
sign of the difficulty in permeabilizing the inner shell of the spheroid, whichever EF is
applied. One reason can be found in the spheroid structure : cell-cell contact strongly
affects the shape of the cells composing the spheroid, therefore the EF inside the
spheroid can be modified by such complex structures if its permeabilization
effectiveness is compromised [146].
Notable differences are also observed on the viability, indeed single cell survival is
slightly affected at 400 V/cm and it drastically collapses above 500 V/cm, while
spheroids show a better recovery capability even when a high electric field is applied.
When the cell viability is strongly compromised (500 V/cm), the spheroids only show a
stop growth for the first 2 days and then they return to grow normally. Furthermore,
when field strength of 800 V/cm is induced, spheroids show a loss of cells from the
outer layer by a consequent decrease in size, but after 6 days they return to their normal
growth rate.
1.20 Material and method : Study of spheroid’s permeabilization
through the combined DEP and ROT technique
The multicellular spheroid can be used to optimize the in vivo technique. It has been
shown that PEF applied to the spheroid induce a change in the outer layer and, if the EF
strength is high enough, cause the permeabilization of the whole sample.
In the case of the single cell, as with multicellular spheroids, electrical parameters
changing thanks to electrical solicitations provide a method of obtaining the fingerprint
4. THE SPHEROID, A PROMISING “IN VITRO” MODEL FOR TUMOR ANALYSIS: TOWARDS THE PERMEABILIZATION STUDY
Pag. 143
of the spheroid state. The knowledge of dielectric parameters’ evolution with respect to
PEF application is necessary to optimize cancer treatment and obtain customized
therapies.
The estimation of the dielctric properties of the spheroid has been performed by using
the same method presented in the section 3.3 for the dielectric characterization of single
cells. The estimation of the electric properties has been obtained by implementing the
fitting algorithm shown in section 3.4. Indeed, as the spheroid is assimilated to a spheric
shaped object, it can be studied through the Clausius-Mossotti factor fCM. The thorny
aspect is represented by the heterogeneity of the 3D spheroid structure and consequently
by the definition of the complex permittivity of the whole object ε*object.
1.20.1 The spheroid modeling
The electric model of the spheroid is difficult to establish as such cell assembly is three
dimensional and includes three different cellular stages: proliferative cells in the outer
layers, quiescent cells in the center of the spheroid, and possible dead cells in the heart
[214].
Different electric model have been tested in order to find the one that properly reflects
the behavior of the sample undergoing electric solicitations.
- Homogeneous particle model
Our first approach is to investigate how efficient the simple model, where the spheroid
is considered as an homogenous particle characterized by a complex permittivity εp*
and surrounded by the buffer with a permittivity εm and conductivity σm. If we take into
account the contribution of the spheroid’s outer shell, this model could represent an
approximation at low frequency.
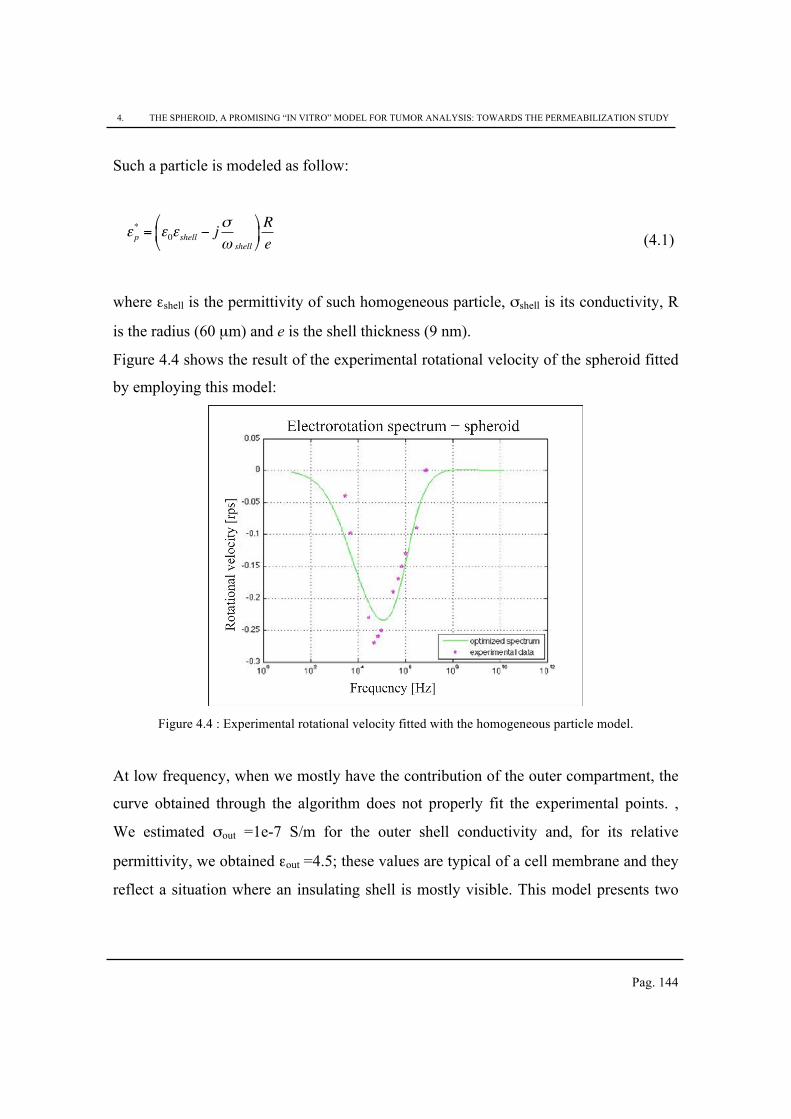
4. THE SPHEROID, A PROMISING “IN VITRO” MODEL FOR TUMOR ANALYSIS: TOWARDS THE PERMEABILIZATION STUDY
Pag. 144
Such a particle is modeled as follow:
εp*= ε
0εshell − j
σ
ω shell
"
#$
%
&'R
e (4.1)
where εshell is the permittivity of such homogeneous particle, σshell is its conductivity, R
is the radius (60 µm) and e is the shell thickness (9 nm).
Figure 4.4 shows the result of the experimental rotational velocity of the spheroid fitted
by employing this model:
Figure 4.4 : Experimental rotational velocity fitted with the homogeneous particle model.
At low frequency, when we mostly have the contribution of the outer compartment, the
curve obtained through the algorithm does not properly fit the experimental points. ,
We estimated σout =1e-7 S/m for the outer shell conductivity and, for its relative
permittivity, we obtained εout =4.5; these values are typical of a cell membrane and they
reflect a situation where an insulating shell is mostly visible. This model presents two
4. THE SPHEROID, A PROMISING “IN VITRO” MODEL FOR TUMOR ANALYSIS: TOWARDS THE PERMEABILIZATION STUDY
Pag. 145
main limits: it does not take into account the heterogeneity gradient of the spheroid
which is a peculiar structural characteristic of the sample, and for high frequency, it
does not demonstrate the presence of the inner compartment that subsequently cannot be
electrically characterized.
- Single shell model
A model more complex than the one just described is represented by the single shell
model (previously showed on the Section 3.1 and 3.4.1) where the sample is considered
as composed of two main compartments: the outer shell of a given thickness
(characterized by permittivity εr,out and conductivity σr,out), an inner compartment also
characterized by a given complex permittivity εin* , everything submerged into a buffer
which has its proper permittivity εm and conductivity σm.
The particle is modeled as follow:
εp
*= ε
out
*
Rp
Rp− e
"
#$$
%
&''
3
+ 2εin
* −εout
*
εin
*+ 2ε
out
*
"
#$
%
&'
Rp
Rp− e
"
#$$
%
&''
3
−εin
* −εout
*
εin
*+ 2ε
out
*
"
#$
%
&'
(4.2)
where
εout
*= ε
0εr,out
− jσ
out
ω (4.3)
εin
*= ε
0εr,in− j
σin
ω (4.4)
Rp represents the radius of the spheroid (Rp=60 µm) and e is the thickness of the outer
layer (e=9 nm).
4. THE SPHEROID, A PROMISING “IN VITRO” MODEL FOR TUMOR ANALYSIS: TOWARDS THE PERMEABILIZATION STUDY
Pag. 146
As can be remarked from the Figure 4.5, the single-shell model looks more appropriate
than the previous model since it is able to make an estimation for both low and high
frequencies.
Figure 4.5 : Experimental rotational velocity fitted with the single-shell model.
Nevertheless, the fitting curve clearly reflects one limit of the employed single-shell
model for the spheroid investigation; the negative part of the curve does not follow the
experimental points and looks too narrow.
The widening of the fitting curve is due to the fact that the heterogeneity of the spheroid
structure is not modeled within the single-shell model. The heterogeneity gradient
typical of the spheroid therefore has a proper distribution (or dispersion) that needs to
be taken into account during the modeling process. This heterogeneity confers to the
curve a more wide-spread shape.
4. THE SPHEROID, A PROMISING “IN VITRO” MODEL FOR TUMOR ANALYSIS: TOWARDS THE PERMEABILIZATION STUDY
Pag. 147
- Near single-shell model
We thus propose a simplified model relatively near to the one used in the case of the
single cell . This model can distinguish the electrical parameters of the successive cell
shells that form the spheroid. Since the spheroids employed are relatively small (their
radius is estimated to be about 60 µm) we can consider that the inner necrotic core is
absent. The spheroid is composed of an inner compartment (as we had an “equivalent
cytoplasm” in the case of the single cell) and a barrier (in the same manner as the
membrane for the single cell) (Figure 4.6).
Figure 4.6 : Spheroid equivalent model obtained from the modified single-shell model.
However, the fact that both shells (outer shell and inner compartment) are composed of
a cell aggregate presents a size dispersion and heterogeneity typical of the tissue-like
material that must be taken into account through dispersion factors α and β (equation
4.5, 4.6), as we did for the cell tissue modeling (Section 2.2.2).
The complex permittivity of the inner and outer compartment thus becomes:
4. THE SPHEROID, A PROMISING “IN VITRO” MODEL FOR TUMOR ANALYSIS: TOWARDS THE PERMEABILIZATION STUDY
Pag. 148
εin
*= ε
0εr,in− j
σin
(ω)α (4.5)
εout
*= ε
0εr,out
− jσ
out
(ω)β (4.6)
where ε0 represents the permittivity of the vacuum equal to 8,85*10-12 F/m, εr,in and ,
εr,out are respectively the relative permittivities of the inner compartment and of the
outer shell and σin and σout represents their electrical conductivities.
The factors α and β can vary across the range [0,1] indicating respectively the lowest
and higher degree of homogeneity.
The Clausius-Mossotti factor fCM defines the interaction between the spheroid itself
(characterized by a complex permittivity εp*) and the extracellular medium
(characterized by a complex permittivity εm*) due to an external electric solicitation:
fCM =εp*−εm
*
εp*+ 2εm
*
(4.7)
1.21 The multicellular spheroid preparation
The spheroid preparation was made by Dr. Emilie Bayart from the department of
“Radiothérapie Moleculaire” (UMR “Radiothérapie Moleculaire”, Inserm U1030-
Université Paris XI) in Gustave Roussy Cancer Campus (Villejuif, France).
Human U87MG glioblastoma cell line was obtained from the tissue bank of the Brain
Tumor Research Center (University of California–San Francisco, San Francisco, CA).
Cells were grown as monolayer in Dulbecco’s modified Eagle’s minimum medium with
glutamax (Life technologies), added with 10% fetal calf serum (PAA) and 1% penicillin
and streptomycin (Life technologies). To produce spheroids, cells were grown in
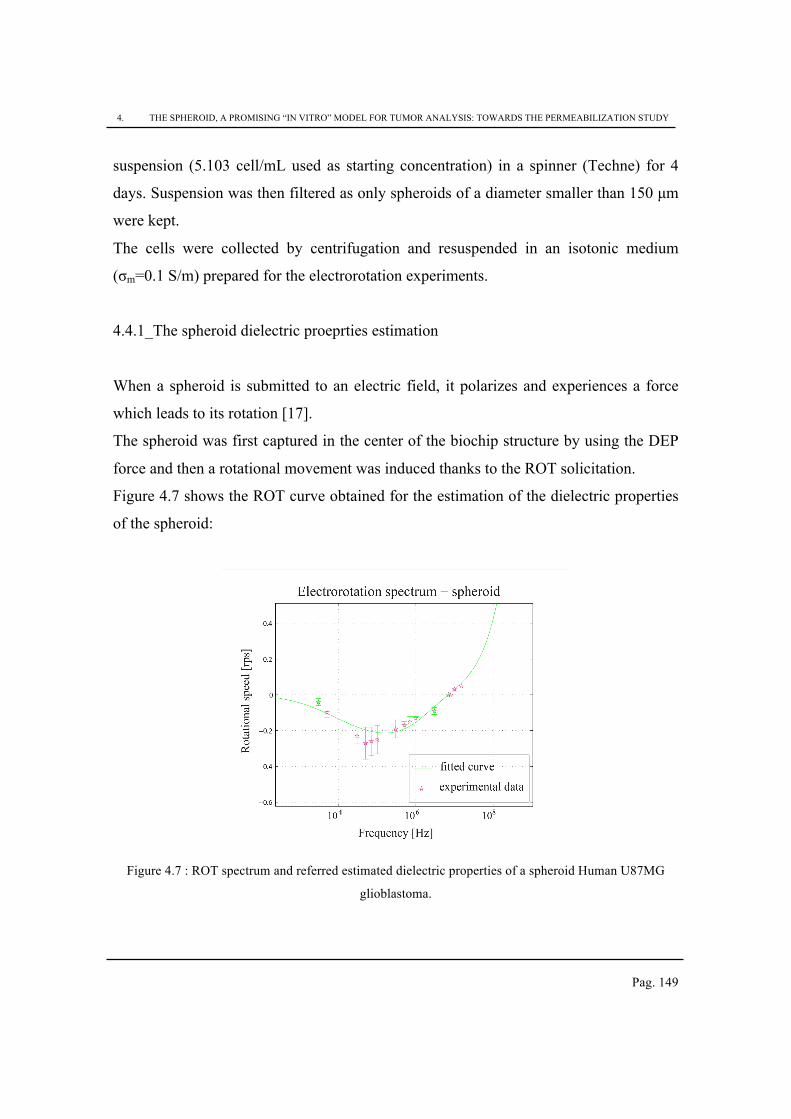
4. THE SPHEROID, A PROMISING “IN VITRO” MODEL FOR TUMOR ANALYSIS: TOWARDS THE PERMEABILIZATION STUDY
Pag. 149
suspension (5.103 cell/mL used as starting concentration) in a spinner (Techne) for 4
days. Suspension was then filtered as only spheroids of a diameter smaller than 150 µm
were kept.
The cells were collected by centrifugation and resuspended in an isotonic medium
(σm=0.1 S/m) prepared for the electrorotation experiments.
4.4.1_The spheroid dielectric proeprties estimation
When a spheroid is submitted to an electric field, it polarizes and experiences a force
which leads to its rotation [17].
The spheroid was first captured in the center of the biochip structure by using the DEP
force and then a rotational movement was induced thanks to the ROT solicitation.
Figure 4.7 shows the ROT curve obtained for the estimation of the dielectric properties
of the spheroid:
Figure 4.7 : ROT spectrum and referred estimated dielectric properties of a spheroid Human U87MG
glioblastoma.
4. THE SPHEROID, A PROMISING “IN VITRO” MODEL FOR TUMOR ANALYSIS: TOWARDS THE PERMEABILIZATION STUDY
Pag. 150
The analysis of the first results obtained with the spheroid shows the predominant
insulating behaviour of the outer cell layer of the cell assembly (negative peak of the
velocity at low frequencies). A fitting within this low frequency region between the
negative velocity peak and the modified single shell model leads to the permitivitty and
conductivity of the outer shell and inner shell respectively, as provided in the table 4.1:
Table 4.1. Estimated electrophysiological parameters of spheroid Human U87MG glioblastoma.
Spheroid σout [S/m] εr,out σin [S/m] εr,in α β
Human
U87MG
glioblastoma
1,5e-7 6 0,6 57 0,9 0,46
1.22 The spheroid for permeabilization study.
To study how the electropermeabilization affected the dielectric prameters of the
spheroid, the latter was subjected to a train of 10 PEF with 3kV/cm amplitude and 100
µs, delivered with a frequency of 1Hz. Once the permeabilization was achieved, the
ROT was applied in order to record the changes in dielectric properties.
Figure 4.8 shows how the ROT spectrum changes due to the PEF application:
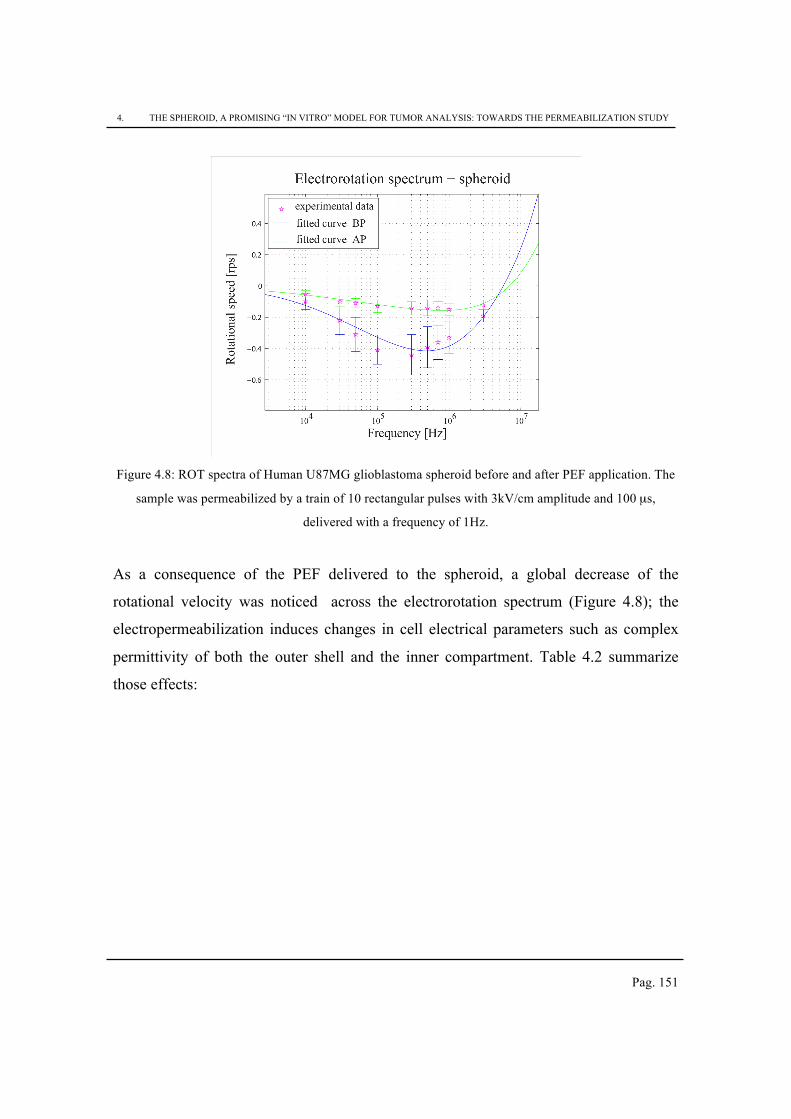
4. THE SPHEROID, A PROMISING “IN VITRO” MODEL FOR TUMOR ANALYSIS: TOWARDS THE PERMEABILIZATION STUDY
Pag. 151
Figure 4.8: ROT spectra of Human U87MG glioblastoma spheroid before and after PEF application. The
sample was permeabilized by a train of 10 rectangular pulses with 3kV/cm amplitude and 100 µs,
delivered with a frequency of 1Hz.
As a consequence of the PEF delivered to the spheroid, a global decrease of the
rotational velocity was noticed across the electrorotation spectrum (Figure 4.8); the
electropermeabilization induces changes in cell electrical parameters such as complex
permittivity of both the outer shell and the inner compartment. Table 4.2 summarize
those effects:
4. THE SPHEROID, A PROMISING “IN VITRO” MODEL FOR TUMOR ANALYSIS: TOWARDS THE PERMEABILIZATION STUDY
Pag. 152
Table 4.2. Estimated electrophysiological parameters of spheroid before and after permeabilization of the
membrane throughout a series of ten 100 µs unipolar PEF delivered with a frequency of 1 Hz, with an
amplitude of 3 kV/cm.
Spheroid σout
[S/m]
εout,rel σin
[S/m]
εin,rel α β
Human
U87MG
glioblastoma
Before
pulses 1,5e-7 4,9 0,45 16,7 0,95 0,48
After
pulses 1e-6 6,98 0,79 52,5 0,9 0,54
The cells located on the external layer are subjected to a higher degree of
permeabilization and show changes in conductivity of the outer shell comparable to
those observed during the single cell permeabilization experiments. As was noticed
during the single cell study, after permeabilization the conductivity and the permittivity
of the outer layer increases due to water molecules that are introduced within the cell
matrix. Due to PEF application, the interspace between cells composing the spheroid is
damaged and the emergence of gaps between the cells occurs. Some cells separate from
the structure as previously reported [111] and the interspace that is created is filled by
the medium that normally surrounds the spheroid. We advance the hypothesis that the
insertion of this medium into the matrix can be considered as a possible contribution to
the consequent inner conductivity enhancement.
The homogeneity of the inner compartment is barely influenced by the PEF application,
and as such, we hypothesize that in our experimental conditions, the inner compartment
is barely affected and its structure does not show remarkable changes. Different is the
case of the outer compartment, which is strongly affected by the PEF application, as
important damages occur at the external layer. A slight increase of the homogeneity
factor β is estimated. Nevertheless, the spheroid preserves it heterogenic character.
4. THE SPHEROID, A PROMISING “IN VITRO” MODEL FOR TUMOR ANALYSIS: TOWARDS THE PERMEABILIZATION STUDY
Pag. 153
Further investigation of a more realistic model, possibly corresponding with the
observations of this experiment, yet taking into account the complexity and
heterogeneity of the spheroid, is desirable.
1.23 Conclusion
In this chapter we applied the electrorotation to determine the fingerprint of the 3D
cellular model.
The 3D multicellular spheroid can be assimilated to a spherical shaped object and thus
can be studied through the Clausiu-Mossotti factor fCM. We have shown that the
combined DEP and ROT technique can be applied to characterize, from a dielectric
point of view, the multicellular spheroid. Furthermore, the evolution of dielectric
properties after PEF application can be investigated in the same manner. The detection
of small changes in the complex permittivity of both the inner and the outer
compartments shows the relevance of the method and its sensitivity. When the
permeabilization occurs, the permittivity and the conductivities of both the inner and
outer compartments evolve. In the destruction of the outer shell structure, “electro-
paths” are constructed through the outer compartment, as a consequence small
molecules getting inside the inner compartment by passing through the outer shell gaps.
The conductivity and the permittivity of the outer layer increase. No remarkable effects
are noticed on the parameters modeling the homogeneity of the inner compartment,
which is most likely due to the fact that the level of permeabilization achieved is not
enough to compromise the inner structure.
The use of a modified single-shell model represents a first approach to investigate the
changes in dielectric properties during the permeabilization process. The introduction of
the two-dispersion factors α and β demonstrates the concept of heterogeneity that is
4. THE SPHEROID, A PROMISING “IN VITRO” MODEL FOR TUMOR ANALYSIS: TOWARDS THE PERMEABILIZATION STUDY
Pag. 154
missing from the single-shell model. Nevertheless a new electrical model must be
developed in order to better mimic the spheroid response to PEF application.
The 3D cell-based model can improve the predictability of the cell-based assay.
Furthermore if cells are collected from the primary tumor cells of the patient, the
solutions achieved are far beyond what can be done in animal studies; the personal
response of each tumor to the PEF application can be investigated quickly and safely
and provides a real, personally adapted solution for each patient.
CONCLUSION AND PERSPECTIVES
Pag. 155
Conclusion and perspectives
Electric field is commonly used to interact with living cells, therefore AC electrokinetic
phenomena such as dielectrophoresis, travelling wave dielectrophoresis and
electrorotation are quickly becoming popular manipulation tools for lab-on-chip and
microfluidic devices.
In addition, pulsed electric fields (PEF) are applied to provoke cell membrane
permeabilization, which is a technique that temporarily increases the capability of a
cell’s membrane to allow the passage of various macromolecules. The
electropermeabilization achieved can be reversible or not reversible depending on
pulses characteristics.
This work presents an electrical engineering approach to quantify and analyze dielectric
changes induced by various characteristics of PEF applied at different scale level:
macro-scale level (tissue characterization), micro-scale level (single cell
characterization), as well as intermediate level (spheroid study).
First, the monitoring of the bioimpedance of a cell tissue is presented as a method to
determine the efficiency of its electropermeabilization with respect to different PEF
characteristics. Such analysis might be the key to dynamically determine the appropriate
electrical conditions to achieve the desired degree of tissue permeabilization without
causing unrecoverable alteration of the tissue.
We demonstrated how pulse characteristics, such as rising time and falling time,
reveal not to have a crucial effect on permeabilization efficiency, at least in the present
experimental conditions. Furthermore it has been shown that the intensity of the PEF as
CONCLUSION AND PERSPECTIVES
Pag. 156
well as the number of pulses has a direct but highly nonlinear influence on the degree of
permeabilization of the tissue. A better control of the permeabilization can be achieved
by simultaneously reducing the field intensity while increasing the number of pulses.
The dependence of the Cole-Cole model with the level of permeabilization is
discussed. A large effect of PEF application is observed on R0 and Cm whereas a
smaller dependence is observed on α and τ. R∞ remains almost at a constant value. We
figure out how the level of permeabilization and its homogeneity can be monitored by
using the combination of two components of the Cole-Cole bioimpedance model: the
capacitance Cm, which is the most sensitive indicator for the low levels of
permeabilization (P<10-20 %) and the resistance R0, which characterizes fairly well the
higher level of permeabilization.
Concerning the study of single cells and spheroids we used the electrorotation
technique to monitor the level of permeabilization. This is an alternative method to
impedance measurements.
Mechanical velocity measurements on the biological objects submitted to several
types of electrical solicitations (Dielectrophoresis, Electrorotation and Pulsed electric
field) was performed and discussed. In the proposed system, the dielectrophoresis is
first applied to trap the sample where a rotating electric field induces a rotational
movement of the sample. The rotational velocity analysis is then used for dielectric
properties estimation, thanks to a fitting algorithm that we developped. The system was
successfully tested with two different cell lines (Jurkat cell line and B16F10 cell line)
and with spheroids (human glioblastoma cell lines U87MG) on the frequency range of
10 kHz up to 20 MHz. Electric field pulses were finally applied in order to permeabilize
the cell membrane in condition of reversibility.
After the application of electric field pulses the structure of the cell membrane
experiences a structure change and thus electropores may be formed. The formation of
the latter allows small molecules to enter inside the sample by reaching the intracellular
CONCLUSION AND PERSPECTIVES
Pag. 157
compartment. As a consequence the dielectric properties of the sample (conductivity
and permittivity of both the membrane and the inner compartment) change. The
combined DEP-ROT technique proposed in this work can be used as a method to
monitor electropermeabilization phenomenon with the analysis of cell dielectric
properties changes.
Furthermore, the dielectrophoresis spectrum (Clausius Mossotti factor) can be
deduced from the electroporation spectrum. This is very informative for detection and
sorting experiments based on the dielectric properties of the biosample.
We finally discuss the use of such real-time analysis for the study of spheroids
within a microfluidic platform. Spheroids are actually recognized as the emerging three-
dimensional (3D) model to reproduce and study the development of cancer in tissue-like
structure.
The combined use of a stationary electrical field and a rotational field to monitor
the permabilization of such complex living structure might contribute to offer new
approaches for cancer diagnosis and treatments. The experiments performed on human
glioblastoma cell lines U87MG show promising results with respect to the conventional
2D cellular culture. However, they highlight the need of a more realistic model to
properly reflect the electrophysiological response of a spheroid under the effect of a
pulsed electric field.
Within this work performed in the three years of my PhD, we investigated how the
study of the dielectric properties of a biological sample can be used to monitor its
permeabilization. Nevertheless there are many aspects that need to be investigated and
better understood:
- A characterization of the level of permeabilization using specific fluorescent
markers might be very complementary to the ROT methodology that we
developped. Preliminary measurements are undergoing, using Propidium Iodide
CONCLUSION AND PERSPECTIVES
Pag. 158
(PI) that fluoresces once intercalated in the DNA. However PI is known for its
toxicity and can only give a binary response about the succesfull
permeabilization. The use of a non toxic fluorocrome (Calcein for instance)
could give important information regarding the permeabilization (reversibility).
- The viability of the cells, once submitted to all these field sollicitations (DEP,
ROT, PEFs) should be confirmed more systematically, in order to characterize
the side-effects of those treatments. To do so, the biosample recovering should
be included in the design (in flow electroporation).
- The so called “co-culture” of spheroid from different cell lines should be used in
order to mimic the tumor microenvironment or presence of the immune system.
The production of bigger size spheroids (order of centimeter) could represent a
way to better simulate the tumor behavior and to optimized the system to deliver
PEF. A additional study of the biochip design needs to be faced in order to keep
favorable electric topography distribution, as well as the use a higher level
models, taking into account the successive concentric layers. Bio-impedance
could be a way to dynamically monitor dielectric properties of large spheroids,
and an increase of the frequency range (up to GHz) should give access of its
internal organization.

ANNEX A - Fitting algorithm implemented on Matlab®
Pag. 159
ANNEX A - Fitting algorithm implemented on
Matlab®
close all
clear all
%%%%%%%%%%%%%%%%%%%%%%%%%%%%%%%%%%%%%%%%%%%%%%%%%%%%%%%%%%
%%
%% DEFINITION OF THEORETICAL CELL DIELECTRIC PARAMETERS
%%%%%%%%%%%%%%%%%%%%%%%%%%%%%%%%%%%%%%%%%%%%%%%%%%%%%%%%%%
%%
epso = 8.82e-12;
%parameters cell
R =7e-6; %Radius of the cell
d = 8e-9; %thickness of the cell membrane
%Parameters membrane
emem = 6; %relative membrane permittivity
sigmme = 1e-4; %membrane conductivity

ANNEX A - Fitting algorithm implemented on Matlab®
Pag. 160
sigmme_t=sigmme;
epsme = emem*epso;
epsme_t=epsme;
%Parameters cytoplasm
ecitrel = 45 %relative cytoplasm permittivity
sigmc = 0.4; %cytoplasm conductivity
sigmc_t=sigmc;
epsc = ecitrel*epso;
epsc_t=epsc;
%Parameters medium
emezrel = 80;
sigmmi = 0.1;
epsmi = emezrel*epso;
%%%%%%%%%%%%%%%%%%%%%%%%%%%%%%%%%%%%%%%%%%%%%%%%%%%%%%%%%%
%%
%% CALCULATION
%%%%%%%%%%%%%%%%%%%%%%%%%%%%%%%%%%%%%%%%%%%%%%%%%%%%%%%%%%
%%
% Definition of complex permittivity of the medium, the
membrane % and thE cytoplasm (EMI, EC, and
EMErespectively) as function of % the frequency w
% p1 = epsc, p2 = sigmc
% p3 = epsme, p4 = sigmme

ANNEX A - Fitting algorithm implemented on Matlab®
Pag. 161
emi = @(w)epsmi-i*sigmmi./w; %only function of w
ec = @(w,p1,p2)p1-i*p2./w; %function of w,p1,p2
eme = @(w,p3,p4)p3-i*p4./w; %function of w,p3,p4
% Definition of complex permittivity of the particle (EP),
of the
% Clausiu-Mossotti factor (Ke) and of the rotational
velocity of % the cell (omega) as function of
w,p1,p2,p3,p4.
ep = @(w,p1,p2,p3,p4)eme(w,p3,p4).*...
(((R+e)/R)^3+2*(ec(w,p1,p2)-
eme(w,p3,p4))./(ec(w,p1,p2)+2*eme(w,p3,p4)))./...
(((R+e)/R)^3-(ec(w,p1,p2)-
eme(w,p3,p4))./(ec(w,p1,p2)+2*eme(w,p3,p4)));
Ke = @(w,p1,p2,p3,p4)(ep(w,p1,p2,p3,p4)-
emi(w))./(ep(w,p1,p2,p3,p4)+2*emi(w));
Ksi = 80*epso*(3e3)^2/(2*1e-3);
omega = @(w,p1,p2,p3,p4)-Ksi.*imag(Ke(w,p1,p2,p3,p4));
%% Calculation of theoretical ROT curve
n=0;
for a=2:10,
for b= 1:0.01:9,
n=n+1;
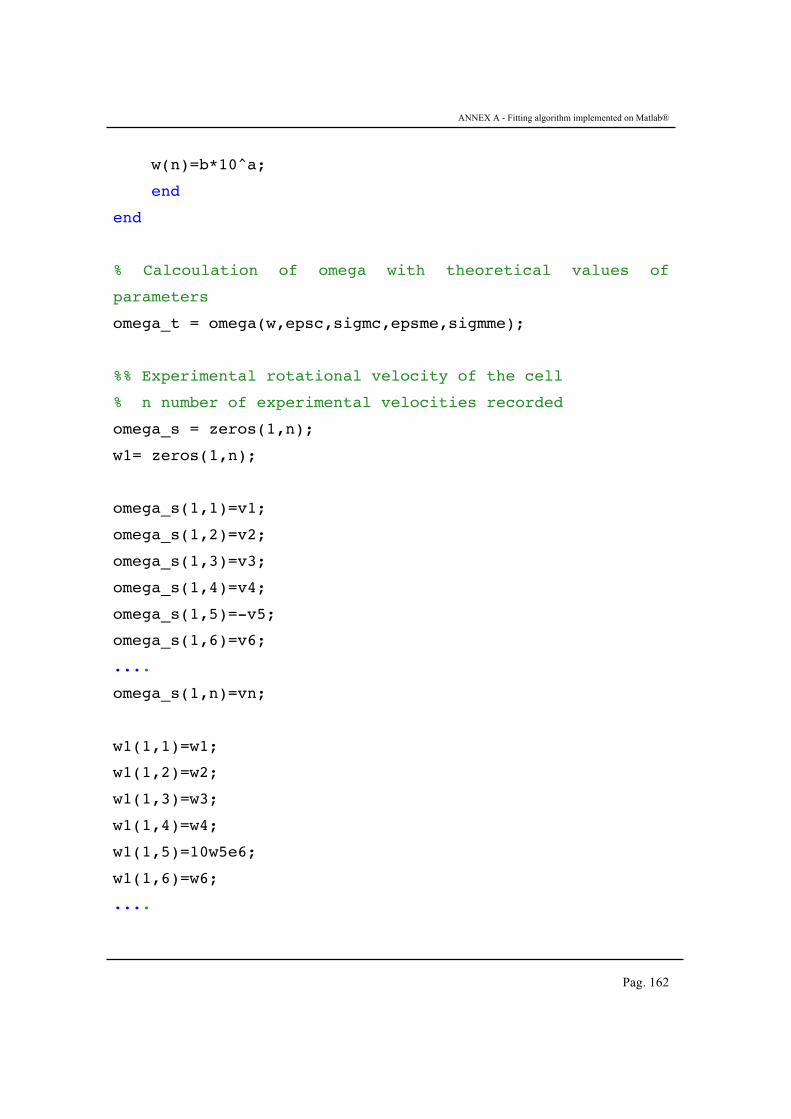
ANNEX A - Fitting algorithm implemented on Matlab®
Pag. 162
w(n)=b*10^a;
end
end
% Calcoulation of omega with theoretical values of
parameters
omega_t = omega(w,epsc,sigmc,epsme,sigmme);
%% Experimental rotational velocity of the cell
% n number of experimental velocities recorded
omega_s = zeros(1,n);
w1= zeros(1,n);
omega_s(1,1)=v1;
omega_s(1,2)=v2;
omega_s(1,3)=v3;
omega_s(1,4)=v4;
omega_s(1,5)=-v5;
omega_s(1,6)=v6;
....
omega_s(1,n)=vn;
w1(1,1)=w1;
w1(1,2)=w2;
w1(1,3)=w3;
w1(1,4)=w4;
w1(1,5)=10w5e6;
w1(1,6)=w6;
....

ANNEX A - Fitting algorithm implemented on Matlab®
Pag. 163
w1(1,n)=wn;
% Plot of the experimental rotational velocities
semilogx(w1,omega_s,'ko');
title('ROT spectrum cell');
grid on
%%%%%%%%%%%%%%%%%%%%%%%%%%%%%%%%%%%%%%%%%%%%%%%%%%%%%%%%%%
%%
%% FITTING OF THE CURBE BY USING "lsqcurvefit"
%%%%%%%%%%%%%%%%%%%%%%%%%%%%%%%%%%%%%%%%%%%%%%%%%%%%%%%%%%
%%
% with 'lsqcurvefit' WE do not have to declare the cost
function % to minimize, 'lsqcurvefit' automatically
calculates the root % mean square by using experimental
data(ydata) and the model of % the curve.
xdata = 2*pi*w1;
ydata= omega_s;
%the curve model have to be built up as it is showed
below:
% first parameter (p) -> vector of parameters (epsc,
sigmc, % epsme, sigmme)
% second parameter (x) -> vector of indipendent variable
(w)
model = @(p,x)omega(x,p(1),p(2),p(3),p(4));

ANNEX A - Fitting algorithm implemented on Matlab®
Pag. 164
for k=1:500
options = optimset;
options = optimset(options,'MaxFunEvals', k);
options = optimset(options,'MaxIter', 1000);
options = optimset(options,'TolFun', 1e-9);
options = optimset(options,'TolX', 1e-12);
problem = createOptimProblem('lsqcurvefit','objective',mod
el,
'xdata',xdata,
'ydata',ydata,
'x0',[ecitrel*epso sigmc epsme*epso
sigmme],...
'lb',[40*epso 0.1 2*epso 1e-7],...
'ub',[80*epso 1 10*epso 10e-7 ],...
'options',options);
[poptim,resnorm,residual,exitflag,output]=lsqcurvefit(prob
lem)
end
%%%%%%%%%%%%%%%%%%%%%%%%%%%%%%%%%%%%%%%%%%%%%%%%%%%%%%%%%%
%%%%%%
%% FINAL PLOT OF EXPERIMENTAL ROT CURVE AND ESTIMATED ROT
CURVE
%%%%%%%%%%%%%%%%%%%%%%%%%%%%%%%%%%%%%%%%%%%%%%%%%%%%%%%%%%
%%%%%%

ANNEX A - Fitting algorithm implemented on Matlab®
Pag. 165
%% Calculation of the ROT curve by using estimated
parameters
omega_optim = model(poptim,w);
% The latter can be done also use the function omega
defined on % the top of the script :
% omega_optim =
omega(w,poptim(1),poptim(2),poptim(3),poptim(4));
figure(1)
semilogx(w/2/pi,omega_optim,'k');
hold on;
semilogx(w1,omega_s,'ko');
hold on
title('Electrorotation spectrum');
legend('optimized spectrum','experimental data',4);
xlabel('Frequency')
ylabel('Rotational speed')
grid on
%Estimated parameters
epsc=poptim(1)/epso
sigmc=poptim(2)
epsme=poptim(3)/epso
sigmme=poptim(4)

ANNEX A - Fitting algorithm implemented on Matlab®
Pag. 166
References
Pag. 167
References
1. Maxwell, J.C., A treatise on electricity and magnetism. Vol. 1. 1881: Clarendon press.
2. Pohl, H.A., Some effects of nonuniform fields on dielectrics. Journal of Applied Physics, 1958. 29(8): p. 1182-1188.
3. Kumemura, M., et al., Single DNA molecule isolation and trapping in a microfluidic device. ChemPhysChem, 2007. 8(12): p. 1875-1880.
4. Washizu, M. and O. Kurosawa, Electrostatic manipulation of DNA in microfabricated structures. Industry Applications, IEEE Transactions on, 1990. 26(6): p. 1165-1172.
5. Aladame, N. B. AlbertsD. BrayJ. LewisM. RaffK. RobertsJ. D. WatsonBiologie moléculaire de la cellule1986Flammarion Médecine SciencesParis (Traduit de l’am’ricain par M. Minkowski). 1 vol.(21× 27, 5 cm), 1146+ xxiii pages. Prix: broché, 610 FF/Rié, 695 FF. in Annales de l'Institut Pasteur/Immunologie. 1987. Elsevier Masson.
6. Goater, A. and R. Pethig, Electrorotation and dielectrophoresis. Parasitology, 1999. 117(07): p. 177-189.
7. Hartley, G., The application of the Debye-Hückel theory to colloidal electrolytes. Transactions of the Faraday Society, 1935. 31: p. 31-50.
8. Hughes, M.P., Nanoelectromechanics in engineering and biology. 2002: CRC press.
9. Cheng, J., et al., Isolation of cultured cervical carcinoma cells mixed with peripheral blood cells on a bioelectronic chip. Analytical chemistry, 1998. 70(11): p. 2321-2326.
10. Hamdi, F.S., Interaction champ électrique cellule :Conception de puces microfluidiques pour l’appariement cellulaire et la fusion par champ électrique pulse, in SATIE. 2013, ENS Cachan.
11. Çetin, B. and D. Li, Dielectrophoresis in microfluidics technology. Electrophoresis, 2011. 32(18): p. 2410-2427.
12. Jones, T., Dielectrophoresis and magnetophoresis. Electromechanics of particles, 1995: p. 34-82.
13. Wang, X.-B., et al., A unified theory of dielectrophoresis and travelling wave dielectrophoresis. Journal of Physics D: Applied Physics, 1994. 27(7): p. 1571.
14. Pethig, R., M.S. Talary, and R.S. Lee, Enhancing traveling-wave dielectrophoresis with signal superposition. Engineering in Medicine and Biology Magazine, IEEE, 2003. 22(6): p. 43-50.
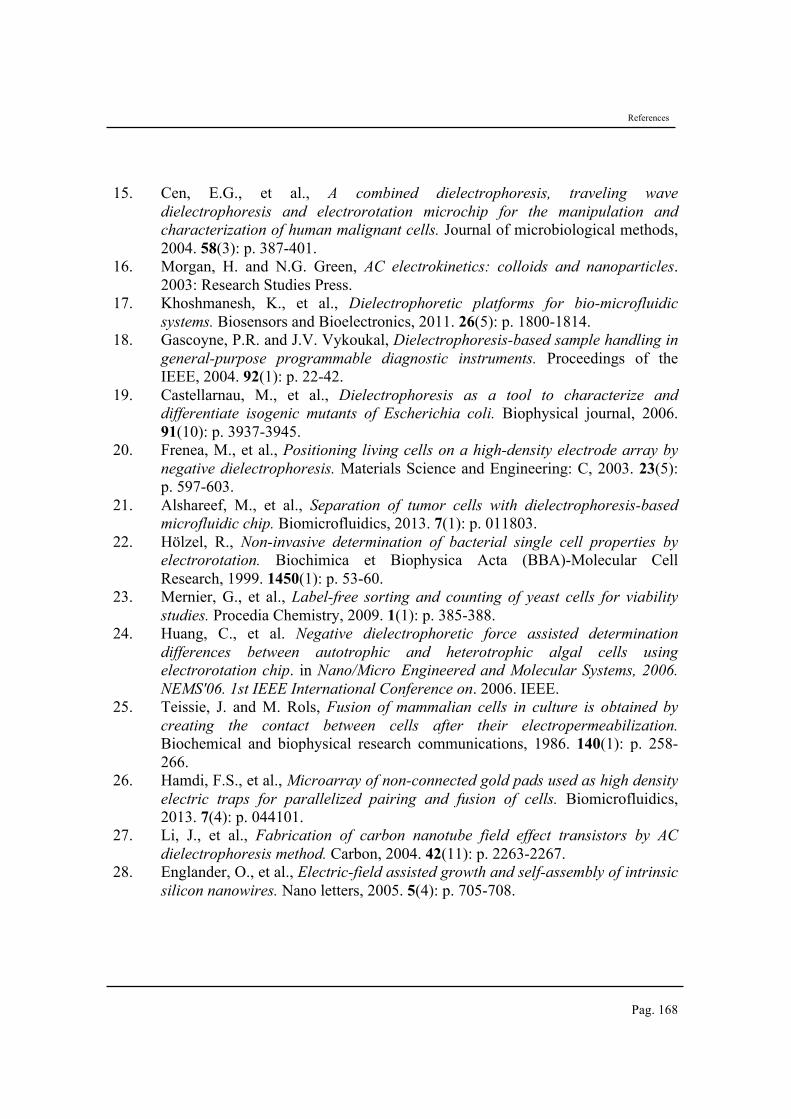
References
Pag. 168
15. Cen, E.G., et al., A combined dielectrophoresis, traveling wave dielectrophoresis and electrorotation microchip for the manipulation and characterization of human malignant cells. Journal of microbiological methods, 2004. 58(3): p. 387-401.
16. Morgan, H. and N.G. Green, AC electrokinetics: colloids and nanoparticles. 2003: Research Studies Press.
17. Khoshmanesh, K., et al., Dielectrophoretic platforms for bio-microfluidic systems. Biosensors and Bioelectronics, 2011. 26(5): p. 1800-1814.
18. Gascoyne, P.R. and J.V. Vykoukal, Dielectrophoresis-based sample handling in general-purpose programmable diagnostic instruments. Proceedings of the IEEE, 2004. 92(1): p. 22-42.
19. Castellarnau, M., et al., Dielectrophoresis as a tool to characterize and differentiate isogenic mutants of Escherichia coli. Biophysical journal, 2006. 91(10): p. 3937-3945.
20. Frenea, M., et al., Positioning living cells on a high-density electrode array by negative dielectrophoresis. Materials Science and Engineering: C, 2003. 23(5): p. 597-603.
21. Alshareef, M., et al., Separation of tumor cells with dielectrophoresis-based microfluidic chip. Biomicrofluidics, 2013. 7(1): p. 011803.
22. Hölzel, R., Non-invasive determination of bacterial single cell properties by electrorotation. Biochimica et Biophysica Acta (BBA)-Molecular Cell Research, 1999. 1450(1): p. 53-60.
23. Mernier, G., et al., Label-free sorting and counting of yeast cells for viability studies. Procedia Chemistry, 2009. 1(1): p. 385-388.
24. Huang, C., et al. Negative dielectrophoretic force assisted determination differences between autotrophic and heterotrophic algal cells using electrorotation chip. in Nano/Micro Engineered and Molecular Systems, 2006. NEMS'06. 1st IEEE International Conference on. 2006. IEEE.
25. Teissie, J. and M. Rols, Fusion of mammalian cells in culture is obtained by creating the contact between cells after their electropermeabilization. Biochemical and biophysical research communications, 1986. 140(1): p. 258-266.
26. Hamdi, F.S., et al., Microarray of non-connected gold pads used as high density electric traps for parallelized pairing and fusion of cells. Biomicrofluidics, 2013. 7(4): p. 044101.
27. Li, J., et al., Fabrication of carbon nanotube field effect transistors by AC dielectrophoresis method. Carbon, 2004. 42(11): p. 2263-2267.
28. Englander, O., et al., Electric-field assisted growth and self-assembly of intrinsic silicon nanowires. Nano letters, 2005. 5(4): p. 705-708.
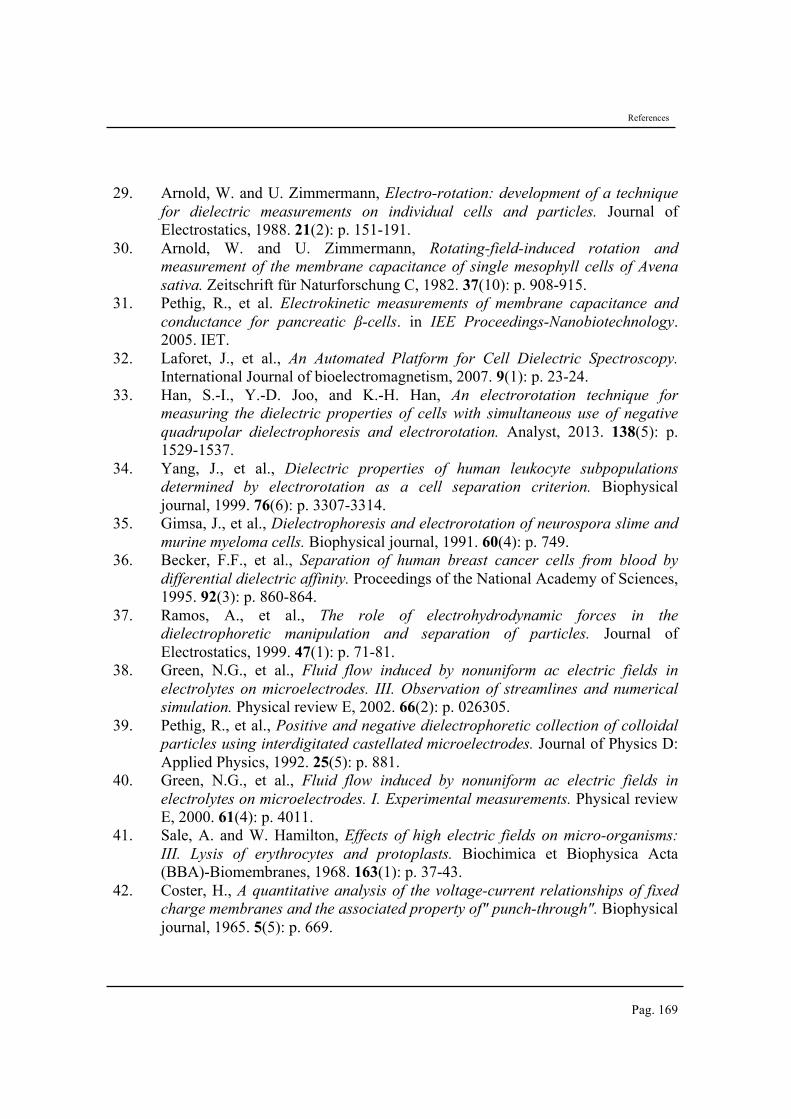
References
Pag. 169
29. Arnold, W. and U. Zimmermann, Electro-rotation: development of a technique for dielectric measurements on individual cells and particles. Journal of Electrostatics, 1988. 21(2): p. 151-191.
30. Arnold, W. and U. Zimmermann, Rotating-field-induced rotation and measurement of the membrane capacitance of single mesophyll cells of Avena sativa. Zeitschrift für Naturforschung C, 1982. 37(10): p. 908-915.
31. Pethig, R., et al. Electrokinetic measurements of membrane capacitance and conductance for pancreatic β-cells. in IEE Proceedings-Nanobiotechnology. 2005. IET.
32. Laforet, J., et al., An Automated Platform for Cell Dielectric Spectroscopy. International Journal of bioelectromagnetism, 2007. 9(1): p. 23-24.
33. Han, S.-I., Y.-D. Joo, and K.-H. Han, An electrorotation technique for measuring the dielectric properties of cells with simultaneous use of negative quadrupolar dielectrophoresis and electrorotation. Analyst, 2013. 138(5): p. 1529-1537.
34. Yang, J., et al., Dielectric properties of human leukocyte subpopulations determined by electrorotation as a cell separation criterion. Biophysical journal, 1999. 76(6): p. 3307-3314.
35. Gimsa, J., et al., Dielectrophoresis and electrorotation of neurospora slime and murine myeloma cells. Biophysical journal, 1991. 60(4): p. 749.
36. Becker, F.F., et al., Separation of human breast cancer cells from blood by differential dielectric affinity. Proceedings of the National Academy of Sciences, 1995. 92(3): p. 860-864.
37. Ramos, A., et al., The role of electrohydrodynamic forces in the dielectrophoretic manipulation and separation of particles. Journal of Electrostatics, 1999. 47(1): p. 71-81.
38. Green, N.G., et al., Fluid flow induced by nonuniform ac electric fields in electrolytes on microelectrodes. III. Observation of streamlines and numerical simulation. Physical review E, 2002. 66(2): p. 026305.
39. Pethig, R., et al., Positive and negative dielectrophoretic collection of colloidal particles using interdigitated castellated microelectrodes. Journal of Physics D: Applied Physics, 1992. 25(5): p. 881.
40. Green, N.G., et al., Fluid flow induced by nonuniform ac electric fields in electrolytes on microelectrodes. I. Experimental measurements. Physical review E, 2000. 61(4): p. 4011.
41. Sale, A. and W. Hamilton, Effects of high electric fields on micro-organisms: III. Lysis of erythrocytes and protoplasts. Biochimica et Biophysica Acta (BBA)-Biomembranes, 1968. 163(1): p. 37-43.
42. Coster, H., A quantitative analysis of the voltage-current relationships of fixed charge membranes and the associated property of" punch-through". Biophysical journal, 1965. 5(5): p. 669.
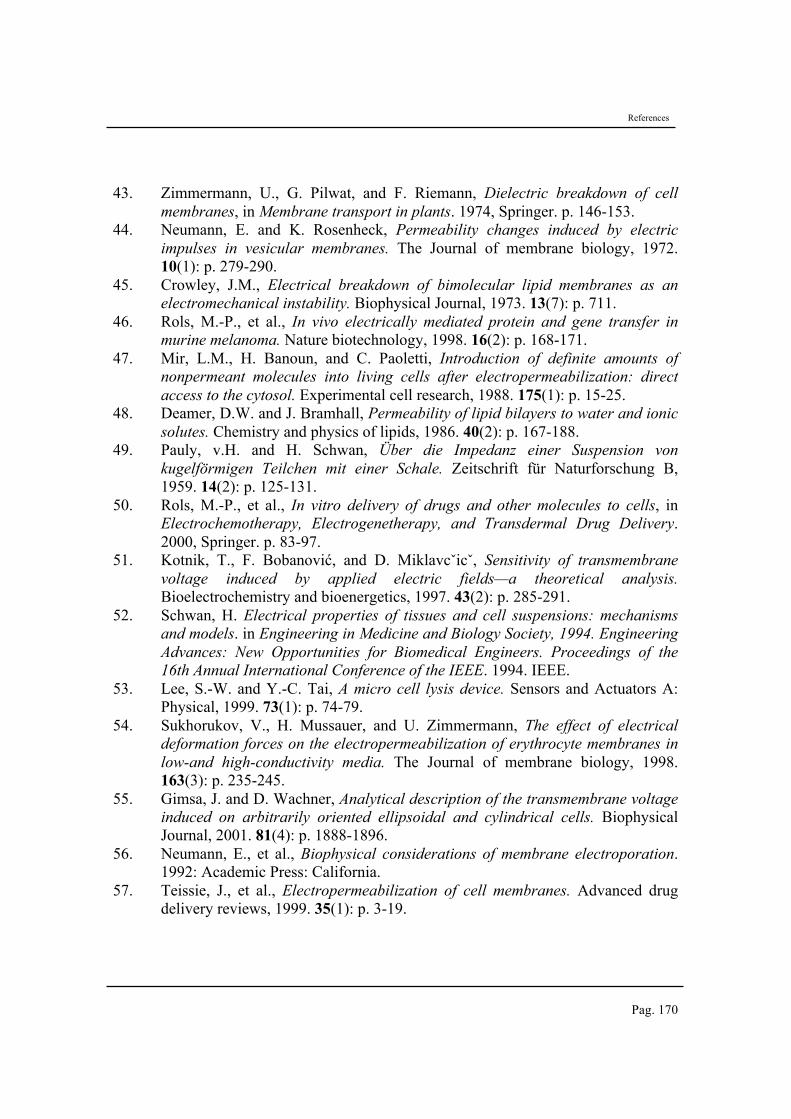
References
Pag. 170
43. Zimmermann, U., G. Pilwat, and F. Riemann, Dielectric breakdown of cell membranes, in Membrane transport in plants. 1974, Springer. p. 146-153.
44. Neumann, E. and K. Rosenheck, Permeability changes induced by electric impulses in vesicular membranes. The Journal of membrane biology, 1972. 10(1): p. 279-290.
45. Crowley, J.M., Electrical breakdown of bimolecular lipid membranes as an electromechanical instability. Biophysical Journal, 1973. 13(7): p. 711.
46. Rols, M.-P., et al., In vivo electrically mediated protein and gene transfer in murine melanoma. Nature biotechnology, 1998. 16(2): p. 168-171.
47. Mir, L.M., H. Banoun, and C. Paoletti, Introduction of definite amounts of nonpermeant molecules into living cells after electropermeabilization: direct access to the cytosol. Experimental cell research, 1988. 175(1): p. 15-25.
48. Deamer, D.W. and J. Bramhall, Permeability of lipid bilayers to water and ionic solutes. Chemistry and physics of lipids, 1986. 40(2): p. 167-188.
49. Pauly, v.H. and H. Schwan, Über die Impedanz einer Suspension von kugelförmigen Teilchen mit einer Schale. Zeitschrift für Naturforschung B, 1959. 14(2): p. 125-131.
50. Rols, M.-P., et al., In vitro delivery of drugs and other molecules to cells, in Electrochemotherapy, Electrogenetherapy, and Transdermal Drug Delivery. 2000, Springer. p. 83-97.
51. Kotnik, T., F. Bobanović, and D. Miklavcˇicˇ, Sensitivity of transmembrane voltage induced by applied electric fields—a theoretical analysis. Bioelectrochemistry and bioenergetics, 1997. 43(2): p. 285-291.
52. Schwan, H. Electrical properties of tissues and cell suspensions: mechanisms and models. in Engineering in Medicine and Biology Society, 1994. Engineering Advances: New Opportunities for Biomedical Engineers. Proceedings of the 16th Annual International Conference of the IEEE. 1994. IEEE.
53. Lee, S.-W. and Y.-C. Tai, A micro cell lysis device. Sensors and Actuators A: Physical, 1999. 73(1): p. 74-79.
54. Sukhorukov, V., H. Mussauer, and U. Zimmermann, The effect of electrical deformation forces on the electropermeabilization of erythrocyte membranes in low-and high-conductivity media. The Journal of membrane biology, 1998. 163(3): p. 235-245.
55. Gimsa, J. and D. Wachner, Analytical description of the transmembrane voltage induced on arbitrarily oriented ellipsoidal and cylindrical cells. Biophysical Journal, 2001. 81(4): p. 1888-1896.
56. Neumann, E., et al., Biophysical considerations of membrane electroporation. 1992: Academic Press: California.
57. Teissie, J., et al., Electropermeabilization of cell membranes. Advanced drug delivery reviews, 1999. 35(1): p. 3-19.
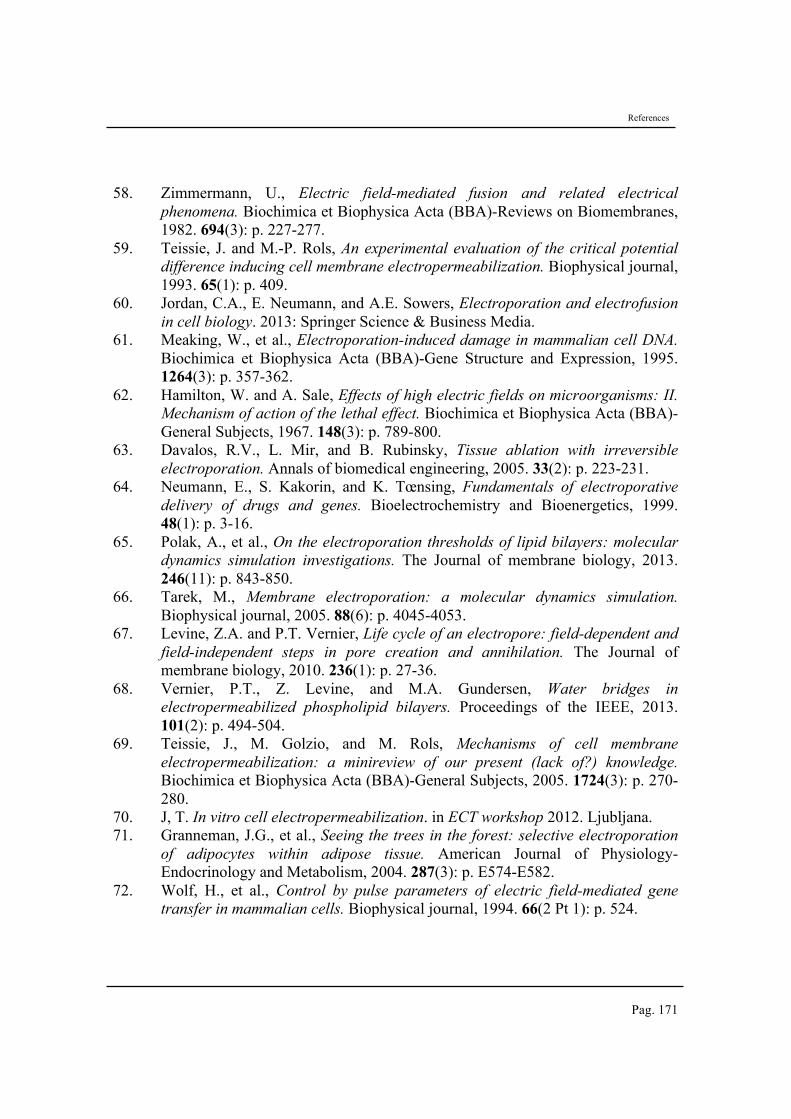
References
Pag. 171
58. Zimmermann, U., Electric field-mediated fusion and related electrical phenomena. Biochimica et Biophysica Acta (BBA)-Reviews on Biomembranes, 1982. 694(3): p. 227-277.
59. Teissie, J. and M.-P. Rols, An experimental evaluation of the critical potential difference inducing cell membrane electropermeabilization. Biophysical journal, 1993. 65(1): p. 409.
60. Jordan, C.A., E. Neumann, and A.E. Sowers, Electroporation and electrofusion in cell biology. 2013: Springer Science & Business Media.
61. Meaking, W., et al., Electroporation-induced damage in mammalian cell DNA. Biochimica et Biophysica Acta (BBA)-Gene Structure and Expression, 1995. 1264(3): p. 357-362.
62. Hamilton, W. and A. Sale, Effects of high electric fields on microorganisms: II. Mechanism of action of the lethal effect. Biochimica et Biophysica Acta (BBA)-General Subjects, 1967. 148(3): p. 789-800.
63. Davalos, R.V., L. Mir, and B. Rubinsky, Tissue ablation with irreversible electroporation. Annals of biomedical engineering, 2005. 33(2): p. 223-231.
64. Neumann, E., S. Kakorin, and K. Tœnsing, Fundamentals of electroporative delivery of drugs and genes. Bioelectrochemistry and Bioenergetics, 1999. 48(1): p. 3-16.
65. Polak, A., et al., On the electroporation thresholds of lipid bilayers: molecular dynamics simulation investigations. The Journal of membrane biology, 2013. 246(11): p. 843-850.
66. Tarek, M., Membrane electroporation: a molecular dynamics simulation. Biophysical journal, 2005. 88(6): p. 4045-4053.
67. Levine, Z.A. and P.T. Vernier, Life cycle of an electropore: field-dependent and field-independent steps in pore creation and annihilation. The Journal of membrane biology, 2010. 236(1): p. 27-36.
68. Vernier, P.T., Z. Levine, and M.A. Gundersen, Water bridges in electropermeabilized phospholipid bilayers. Proceedings of the IEEE, 2013. 101(2): p. 494-504.
69. Teissie, J., M. Golzio, and M. Rols, Mechanisms of cell membrane electropermeabilization: a minireview of our present (lack of?) knowledge. Biochimica et Biophysica Acta (BBA)-General Subjects, 2005. 1724(3): p. 270-280.
70. J, T. In vitro cell electropermeabilization. in ECT workshop 2012. Ljubljana. 71. Granneman, J.G., et al., Seeing the trees in the forest: selective electroporation
of adipocytes within adipose tissue. American Journal of Physiology-Endocrinology and Metabolism, 2004. 287(3): p. E574-E582.
72. Wolf, H., et al., Control by pulse parameters of electric field-mediated gene transfer in mammalian cells. Biophysical journal, 1994. 66(2 Pt 1): p. 524.
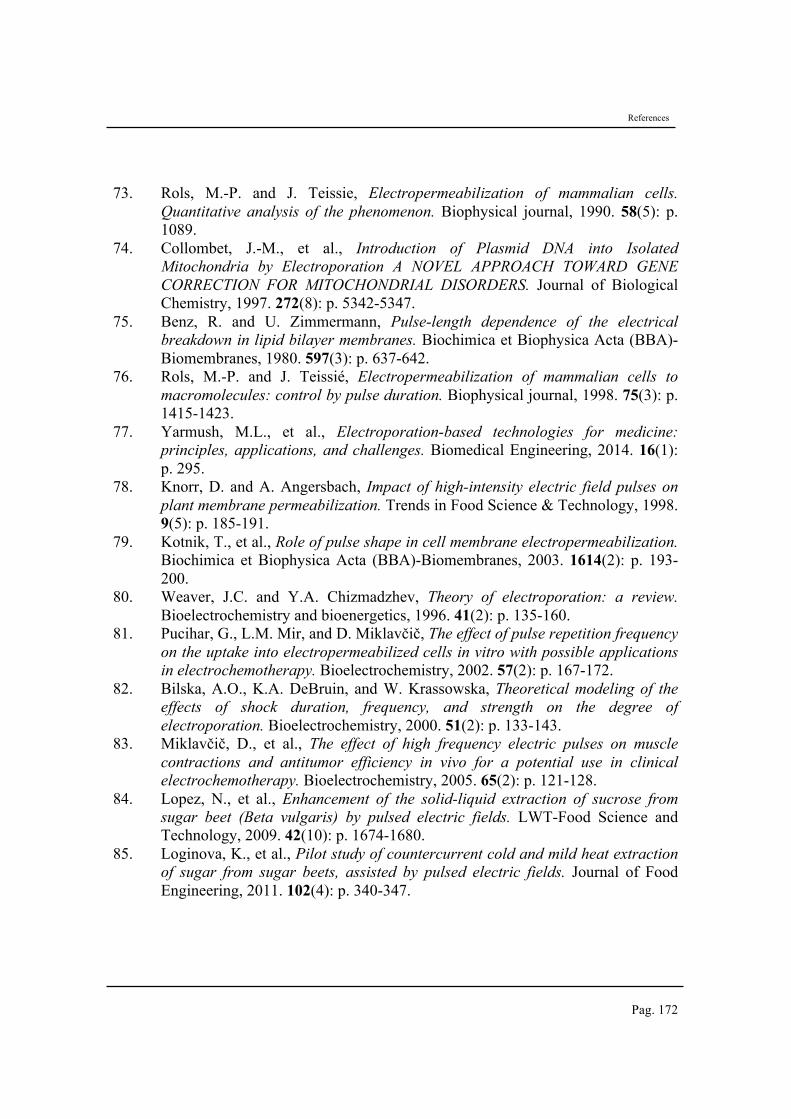
References
Pag. 172
73. Rols, M.-P. and J. Teissie, Electropermeabilization of mammalian cells. Quantitative analysis of the phenomenon. Biophysical journal, 1990. 58(5): p. 1089.
74. Collombet, J.-M., et al., Introduction of Plasmid DNA into Isolated Mitochondria by Electroporation A NOVEL APPROACH TOWARD GENE CORRECTION FOR MITOCHONDRIAL DISORDERS. Journal of Biological Chemistry, 1997. 272(8): p. 5342-5347.
75. Benz, R. and U. Zimmermann, Pulse-length dependence of the electrical breakdown in lipid bilayer membranes. Biochimica et Biophysica Acta (BBA)-Biomembranes, 1980. 597(3): p. 637-642.
76. Rols, M.-P. and J. Teissié, Electropermeabilization of mammalian cells to macromolecules: control by pulse duration. Biophysical journal, 1998. 75(3): p. 1415-1423.
77. Yarmush, M.L., et al., Electroporation-based technologies for medicine: principles, applications, and challenges. Biomedical Engineering, 2014. 16(1): p. 295.
78. Knorr, D. and A. Angersbach, Impact of high-intensity electric field pulses on plant membrane permeabilization. Trends in Food Science & Technology, 1998. 9(5): p. 185-191.
79. Kotnik, T., et al., Role of pulse shape in cell membrane electropermeabilization. Biochimica et Biophysica Acta (BBA)-Biomembranes, 2003. 1614(2): p. 193-200.
80. Weaver, J.C. and Y.A. Chizmadzhev, Theory of electroporation: a review. Bioelectrochemistry and bioenergetics, 1996. 41(2): p. 135-160.
81. Pucihar, G., L.M. Mir, and D. Miklavčič, The effect of pulse repetition frequency on the uptake into electropermeabilized cells in vitro with possible applications in electrochemotherapy. Bioelectrochemistry, 2002. 57(2): p. 167-172.
82. Bilska, A.O., K.A. DeBruin, and W. Krassowska, Theoretical modeling of the effects of shock duration, frequency, and strength on the degree of electroporation. Bioelectrochemistry, 2000. 51(2): p. 133-143.
83. Miklavčič, D., et al., The effect of high frequency electric pulses on muscle contractions and antitumor efficiency in vivo for a potential use in clinical electrochemotherapy. Bioelectrochemistry, 2005. 65(2): p. 121-128.
84. Lopez, N., et al., Enhancement of the solid-liquid extraction of sucrose from sugar beet (Beta vulgaris) by pulsed electric fields. LWT-Food Science and Technology, 2009. 42(10): p. 1674-1680.
85. Loginova, K., et al., Pilot study of countercurrent cold and mild heat extraction of sugar from sugar beets, assisted by pulsed electric fields. Journal of Food Engineering, 2011. 102(4): p. 340-347.
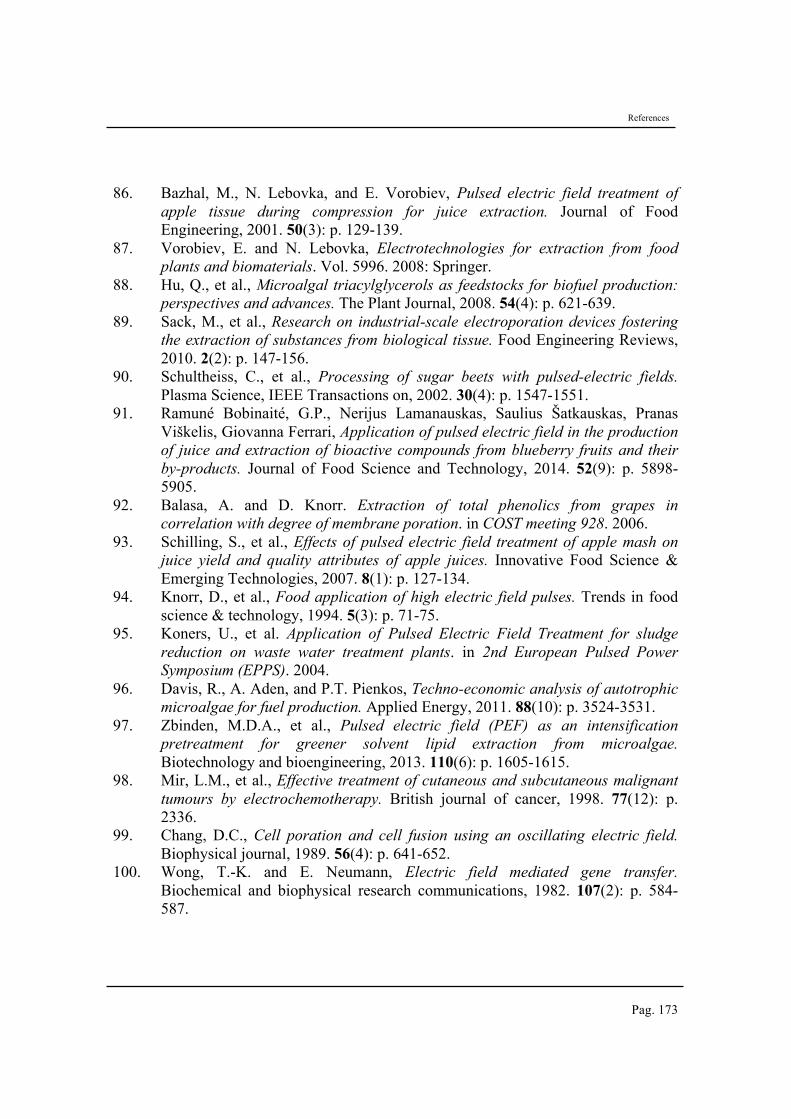
References
Pag. 173
86. Bazhal, M., N. Lebovka, and E. Vorobiev, Pulsed electric field treatment of apple tissue during compression for juice extraction. Journal of Food Engineering, 2001. 50(3): p. 129-139.
87. Vorobiev, E. and N. Lebovka, Electrotechnologies for extraction from food plants and biomaterials. Vol. 5996. 2008: Springer.
88. Hu, Q., et al., Microalgal triacylglycerols as feedstocks for biofuel production: perspectives and advances. The Plant Journal, 2008. 54(4): p. 621-639.
89. Sack, M., et al., Research on industrial-scale electroporation devices fostering the extraction of substances from biological tissue. Food Engineering Reviews, 2010. 2(2): p. 147-156.
90. Schultheiss, C., et al., Processing of sugar beets with pulsed-electric fields. Plasma Science, IEEE Transactions on, 2002. 30(4): p. 1547-1551.
91. Ramuné Bobinaité, G.P., Nerijus Lamanauskas, Saulius Šatkauskas, Pranas Viškelis, Giovanna Ferrari, Application of pulsed electric field in the production of juice and extraction of bioactive compounds from blueberry fruits and their by-products. Journal of Food Science and Technology, 2014. 52(9): p. 5898-5905.
92. Balasa, A. and D. Knorr. Extraction of total phenolics from grapes in correlation with degree of membrane poration. in COST meeting 928. 2006.
93. Schilling, S., et al., Effects of pulsed electric field treatment of apple mash on juice yield and quality attributes of apple juices. Innovative Food Science & Emerging Technologies, 2007. 8(1): p. 127-134.
94. Knorr, D., et al., Food application of high electric field pulses. Trends in food science & technology, 1994. 5(3): p. 71-75.
95. Koners, U., et al. Application of Pulsed Electric Field Treatment for sludge reduction on waste water treatment plants. in 2nd European Pulsed Power Symposium (EPPS). 2004.
96. Davis, R., A. Aden, and P.T. Pienkos, Techno-economic analysis of autotrophic microalgae for fuel production. Applied Energy, 2011. 88(10): p. 3524-3531.
97. Zbinden, M.D.A., et al., Pulsed electric field (PEF) as an intensification pretreatment for greener solvent lipid extraction from microalgae. Biotechnology and bioengineering, 2013. 110(6): p. 1605-1615.
98. Mir, L.M., et al., Effective treatment of cutaneous and subcutaneous malignant tumours by electrochemotherapy. British journal of cancer, 1998. 77(12): p. 2336.
99. Chang, D.C., Cell poration and cell fusion using an oscillating electric field. Biophysical journal, 1989. 56(4): p. 641-652.
100. Wong, T.-K. and E. Neumann, Electric field mediated gene transfer. Biochemical and biophysical research communications, 1982. 107(2): p. 584-587.
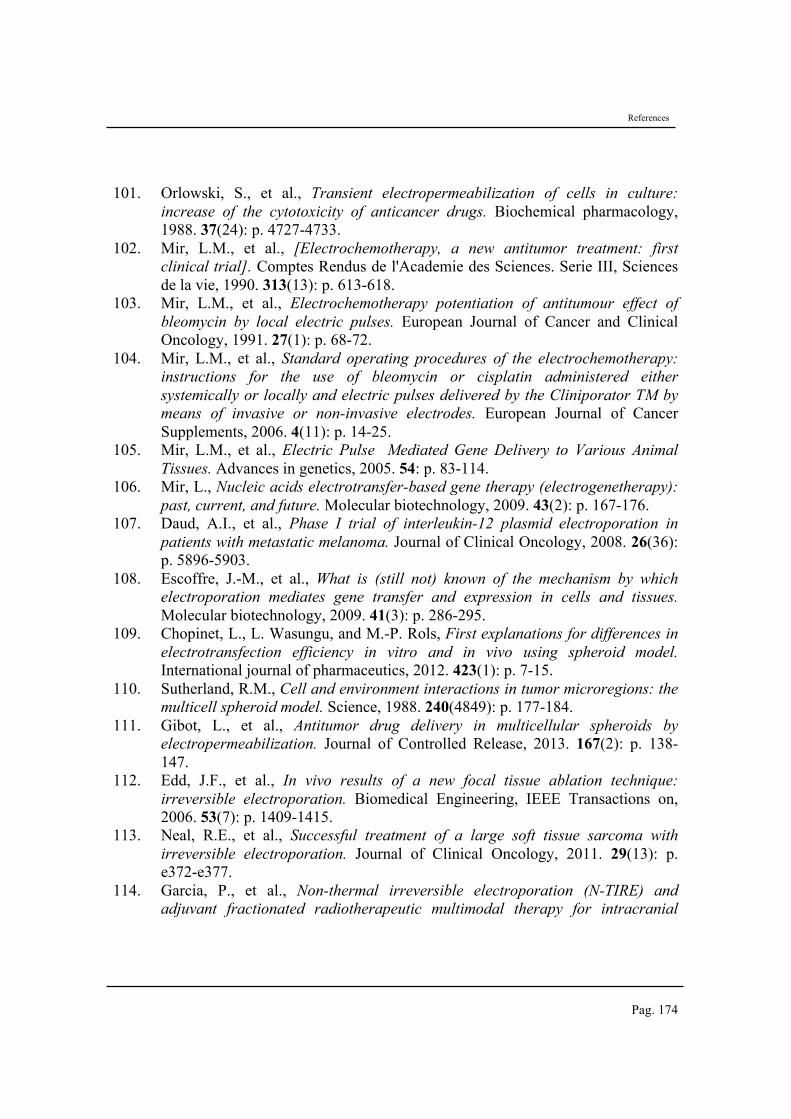
References
Pag. 174
101. Orlowski, S., et al., Transient electropermeabilization of cells in culture: increase of the cytotoxicity of anticancer drugs. Biochemical pharmacology, 1988. 37(24): p. 4727-4733.
102. Mir, L.M., et al., [Electrochemotherapy, a new antitumor treatment: first clinical trial]. Comptes Rendus de l'Academie des Sciences. Serie III, Sciences de la vie, 1990. 313(13): p. 613-618.
103. Mir, L.M., et al., Electrochemotherapy potentiation of antitumour effect of bleomycin by local electric pulses. European Journal of Cancer and Clinical Oncology, 1991. 27(1): p. 68-72.
104. Mir, L.M., et al., Standard operating procedures of the electrochemotherapy: instructions for the use of bleomycin or cisplatin administered either systemically or locally and electric pulses delivered by the Cliniporator TM by means of invasive or non-invasive electrodes. European Journal of Cancer Supplements, 2006. 4(11): p. 14-25.
105. Mir, L.M., et al., Electric Pulse�Mediated Gene Delivery to Various Animal Tissues. Advances in genetics, 2005. 54: p. 83-114.
106. Mir, L., Nucleic acids electrotransfer-based gene therapy (electrogenetherapy): past, current, and future. Molecular biotechnology, 2009. 43(2): p. 167-176.
107. Daud, A.I., et al., Phase I trial of interleukin-12 plasmid electroporation in patients with metastatic melanoma. Journal of Clinical Oncology, 2008. 26(36): p. 5896-5903.
108. Escoffre, J.-M., et al., What is (still not) known of the mechanism by which electroporation mediates gene transfer and expression in cells and tissues. Molecular biotechnology, 2009. 41(3): p. 286-295.
109. Chopinet, L., L. Wasungu, and M.-P. Rols, First explanations for differences in electrotransfection efficiency in vitro and in vivo using spheroid model. International journal of pharmaceutics, 2012. 423(1): p. 7-15.
110. Sutherland, R.M., Cell and environment interactions in tumor microregions: the multicell spheroid model. Science, 1988. 240(4849): p. 177-184.
111. Gibot, L., et al., Antitumor drug delivery in multicellular spheroids by electropermeabilization. Journal of Controlled Release, 2013. 167(2): p. 138-147.
112. Edd, J.F., et al., In vivo results of a new focal tissue ablation technique: irreversible electroporation. Biomedical Engineering, IEEE Transactions on, 2006. 53(7): p. 1409-1415.
113. Neal, R.E., et al., Successful treatment of a large soft tissue sarcoma with irreversible electroporation. Journal of Clinical Oncology, 2011. 29(13): p. e372-e377.
114. Garcia, P., et al., Non-thermal irreversible electroporation (N-TIRE) and adjuvant fractionated radiotherapeutic multimodal therapy for intracranial
References
Pag. 175
malignant glioma in a canine patient. Technology in cancer research & treatment, 2011. 10(1): p. 73-83.
115. Lebovka, N.I., I. Praporscic, and E. Vorobiev, Combined treatment of apples by pulsed electric fields and by heating at moderate temperature. Journal of Food Engineering, 2004. 65(2): p. 211-217.
116. Belehradek, J., et al., Electrochemotherapy of spontaneous mammary tumours in mice. European Journal of Cancer and Clinical Oncology, 1991. 27(1): p. 73-76.
117. Taiwo, K., A. Angersbach, and D. Knorr, Influence of high intensity electric field pulses and osmotic dehydration on the rehydration characteristics of apple slices at different temperatures. Journal of Food Engineering, 2002. 52(2): p. 185-192.
118. Foster, K.R. and H.P. Schwan, Dielectric properties of tissues. Handbook of biological effects of electromagnetic fields, 1995. 2: p. 25-102.
119. http://www.sapere.it/sapere/medicina-e-salute/il-medico-risponde/guida-alla-Biologia-cellulare/le-comunicazioni-all%E2%80%99interno-dell%E2%80%99organismo/comunicazioni-tra-cellule.html.
120. Treccani. http://www.treccani.it/. 121. Fricke, H., A mathematical treatment of the electric conductivity and capacity of
disperse systems I. The electric conductivity of a suspension of homogeneous spheroids. Physical Review, 1924. 24(5): p. 575.
122. IBRAHIM, M., Mesure de bioimpedance électrique par capteur interdigités. 2012.
123. Fricke, H. and S. Morse, The electric capacity of tumors of the breast. The Journal of Cancer Research, 1926. 10(3): p. 340-376.
124. Ohmine, Y., et al., Noninvasive measurement of the electrical bioimpedance of breast tumors. Anticancer research, 1999. 20(3B): p. 1941-1946.
125. Morimoto, T., et al., Measurement of the electrical bio-impedance of breast tumors. European surgical research, 1990. 22(2): p. 86-92.
126. Morimoto, T., et al., A study of the electrical bio-impedance of tumors. Investigative Surgery, 1993. 6(1): p. 25-32.
127. Chauveau, N., et al., Ex vivo discrimination between normal and pathological tissues in human breast surgical biopsies using bioimpedance spectroscopy. Annals of the New York Academy of Sciences, 1999. 873(1): p. 42-50.
128. Cole, K.S., Electric impedance of suspensions of spheres. The Journal of general physiology, 1928. 12(1): p. 29-36.
129. Cole, K.S. and R.H. Cole, Dispersion and absorption in dielectrics I. Alternating current characteristics. The Journal of Chemical Physics, 1941. 9(4): p. 341-351.
130. Elwakil, A.S. and B. Maundy, Extracting the Cole-Cole impedance model parameters without direct impedance measurement. Electronics letters, 2010. 46(20): p. 1367-1368.
References
Pag. 176
131. Cima, L.F. and L.M. Mir, Macroscopic characterization of cell electroporation in biological tissue based on electrical measurements. Applied physics letters, 2004. 85(19): p. 4520-4522.
132. Steendijk, P., et al., The four-electrode resistivity technique in anisotropic media: theoretical analysis and application on myocardial tissue in vivo. Biomedical Engineering, IEEE Transactions on, 1993. 40(11): p. 1138-1148.
133. Saha, S. and P.A. Williams, Electric and dielectric properties of wet human cortical bone as a function of frequency. Biomedical Engineering, IEEE Transactions on, 1992. 39(12): p. 1298-1304.
134. Plonsey, R., Bioelectric phenomena. 1969: Wiley Online Library. 135. Grimnes, S. and O. Martinsen, Bioimpedance and Bioelectricity Basics. 2000.
San Diego: Academic Press. 136. Kotnik, T., D. Miklavčič, and L.M. Mir, Cell membrane electropermeabilization
by symmetrical bipolar rectangular pulses: Part II. Reduced electrolytic contamination. Bioelectrochemistry, 2001. 54(1): p. 91-95.
137. Zoltowski, P., On the electrical capacitance of interfaces exhibiting constant phase element behaviour. Journal of Electroanalytical Chemistry, 1998. 443(1): p. 149-154.
138. Schuhmann, D., Propriétés électriques des interfaces chargées:(prép. à la suite de l'école d'été de Saint-Mathieu-de-Tréviers sur les interfaces chargées 1975). 1978: Masson.
139. Campbell, I.D. and R.A. Dwek, Biological spectroscopy. 1984: Benjamin/Cummings Pub. Co.
140. http://www.phisics.unipa.it. 141. Castellví, Q., Bioimpedance Measurements and the Electroporation
Phenomenon. 142. Fincan, M. and P. Dejmek, In situ visualization of the effect of a pulsed electric
field on plant tissue. Journal of Food Engineering, 2002. 55(3): p. 223-230. 143. Angersbach, A., V. Heinz, and D. Knorr, Effects of pulsed electric fields on cell
membranes in real food systems. Innovative Food Science & Emerging Technologies, 2000. 1(2): p. 135-149.
144. Susil, R., D. Šemrov, and D. Miklavcic, Electric Field-Induced Transmembrane Potential Depends on Cell Density and Organizatio. Electromagnetic Biology and Medicine, 1998. 17(3): p. 391-399.
145. Pucihar, G., et al., Numerical determination of transmembrane voltage induced on irregularly shaped cells. Annals of biomedical engineering, 2006. 34(4): p. 642-652.
146. Pavlin, M., N. Pavšelj, and D. Miklavčič, Dependence of induced transmembrane potential on cell density, arrangement, and cell position inside a cell system. Biomedical Engineering, IEEE Transactions on, 2002. 49(6): p. 605-612.
References
Pag. 177
147. Genescà1a, M., et al., Electrical bio-impedance monitoring of rat kidneys during cold preservation by employing a silicon probe. 2004.
148. Moisescu, M.G., et al., Changes of cell electrical parameters induced by electroporation. A dielectrophoresis study. Biochimica et Biophysica Acta (BBA)-Biomembranes, 2013. 1828(2): p. 365-372.
149. Ersus, S. and D.M. Barrett, Determination of membrane integrity in onion tissues treated by pulsed electric fields: use of microscopic images and ion leakage measurements. Innovative Food Science & Emerging Technologies, 2010. 11(4): p. 598-603.
150. Ade-Omowaye, B., et al., Comparative evaluation of the effects of pulsed electric field and freezing on cell membrane permeabilisation and mass transfer during dehydration of red bell peppers. Innovative Food Science & Emerging Technologies, 2003. 4(2): p. 177-188.
151. Gaynor, P. and P. Bodger, Physical modelling of electroporation in close cell-to-cell proximity environments. Physics in medicine and biology, 2006. 51(12): p. 3175.
152. Kotnik, T., et al., Cell membrane electropermeabilization by symmetrical bipolar rectangular pulses: Part I. Increased efficiency of permeabilization. Bioelectrochemistry, 2001. 54(1): p. 83-90.
153. Lebovka, N.I., et al., Temperature enhanced electroporation under the pulsed electric field treatment of food tissue. Journal of food engineering, 2005. 69(2): p. 177-184.
154. Freeborn, T.J., B. Maundy, and A. Elwakil, Numerical extraction of Cole-Cole impedance parameters from step response. Nonlinear Theory and Its Applications, IEICE, 2011. 2(4): p. 548-561.
155. Ivorra, A., et al., Bioimpedance dispersion width as a parameter to monitor living tissues. Physiological measurement, 2005. 26(2): p. S165.
156. Oblak, J., et al., Feasibility study for cell electroporation detection and separation by means of dielectrophoresis. Bioelectrochemistry, 2007. 71(2): p. 164-171.
157. Washizu, M., et al., Orientation and transformation of flagella in electrostatic field. Industry Applications, IEEE Transactions on, 1992. 28(5): p. 1194-1202.
158. Voldman, J., Electrical forces for microscale cell manipulation. Annu. Rev. Biomed. Eng., 2006. 8: p. 425-454.
159. Franks, W., et al., Impedance characterization and modeling of electrodes for biomedical applications. Biomedical Engineering, IEEE Transactions on, 2005. 52(7): p. 1295-1302.
160. Price, D.T., A.R.A. Rahman, and S. Bhansali, Design rule for optimization of microelectrodes used in electric cell-substrate impedance sensing (ECIS). Biosensors and Bioelectronics, 2009. 24(7): p. 2071-2076.
References
Pag. 178
161. Macdonald, J.R. and E. Barsoukov, Impedance spectroscopy: theory, experiment, and applications. History, 2005. 1: p. 8.
162. Salomon, S., T. Leichlé, and L. Nicu, A dielectrophoretic continuous flow sorter using integrated microelectrodes coupled to a channel constriction. Electrophoresis, 2011. 32(12): p. 1508-1514.
163. Gascoyne, P., et al., Microsample preparation by dielectrophoresis: isolation of malaria. Lab on a Chip, 2002. 2(2): p. 70-75.
164. Gascoyne, P., et al., Dielectrophoretic detection of changes in erythrocyte membranes following malarial infection. Biochimica et Biophysica Acta (BBA)-Biomembranes, 1997. 1323(2): p. 240-252.
165. Pohl, H., Dielectrophoresis Cambridge University Press, Cambridge, England, 1978. 7 TB Jones, Electromechanics of Particles. 1995, Cambridge University Press, Cambridge, England.
166. Asami, K. and T. Yonezawa, Dielectric behavior of wild-type yeast and vacuole-deficient mutant over a frequency range of 10 kHz to 10 GHz. Biophysical journal, 1996. 71(4): p. 2192.
167. Mahaworasilpa, T.L., H.G. Coster, and E.P. George, Forces on biological cells due to applied alternating (AC) electric fields. I. Dielectrophoresis. Biochimica et Biophysica Acta (BBA)-Biomembranes, 1994. 1193(1): p. 118-126.
168. Schwan, H., Alternating current spectroscopy of biological substances. Proceedings of the IRE, 1959. 47(11): p. 1841-1855.
169. Cole, K.S., Membranes, ions, and impulses: a chapter of classical biophysics. Vol. 5. 1968: Univ of California Press.
170. Zimmermann, U. and G.A. Neil, Electromanipulation of cells. 1996: CRC press. 171. Gascoyne, P.R., et al., Dielectrophoresis-based programmable fluidic
processors. Lab on a Chip, 2004. 4(4): p. 299-309. 172. Pavlin, M., et al., Effect of cell electroporation on the conductivity of a cell
suspension. Biophysical journal, 2005. 88(6): p. 4378-4390. 173. Hamdi, F.S., et al., How medium osmolarity influences dielectrophoretically
assisted on-chip electrofusion. Bioelectrochemistry, 2014. 100: p. 27-35. 174. Washizu, M. and T. Jones, Multipolar dielectrophoretic force calculation.
Journal of Electrostatics, 1994. 33(2): p. 187-198. 175. Hartley, L., K. Kaler, and R. Paul, Quadrupole levitation of microscopic
dielectric particles. Journal of Electrostatics, 1999. 46(4): p. 233-246. 176. Byrd, R.H., R.B. Schnabel, and G.A. Shultz, A trust region algorithm for
nonlinearly constrained optimization. SIAM Journal on Numerical Analysis, 1987. 24(5): p. 1152-1170.
177. Arata, H.F., et al., Temperature distribution measurement on microfabricated thermodevice for single biomolecular observation using fluorescent dye. Sensors and Actuators B: Chemical, 2006. 117(2): p. 339-345.
References
Pag. 179
178. Chernomordik, L., et al., The electrical breakdown of cell and lipid membranes: the similarity of phenomenologies. Biochimica et Biophysica Acta (BBA)-Biomembranes, 1987. 902(3): p. 360-373.
179. Hamdi, F., et al. Self control of cell electroporation by dielectrophoresis transition. in Nanobiotech. 2011.
180. Lilienblum, W., et al., Alternative methods to safety studies in experimental animals: role in the risk assessment of chemicals under the new European Chemicals Legislation (REACH). Archives of toxicology, 2008. 82(4): p. 211-236.
181. Riccardo, F., V. Rolih, and F. Cavallo. Animal Models for Translational Cancer Immunotherapy Studies. in 1st World Congress on Electroporation and Pulsed Electric Fields in Biology, Medicine and Food & Environmental Technologies. 2016. Springer.
182. Mazzoleni, G., D. Di Lorenzo, and N. Steimberg, Modelling tissues in 3D: the next future of pharmaco-toxicology and food research? Genes & nutrition, 2009. 4(1): p. 13-22.
183. Valcárcel, M., et al., Three-dimensional growth as multicellular spheroid activates the proangiogenic phenotype of colorectal carcinoma cells via LFA-1-dependent VEGF: implications on hepatic micrometastasis. J Transl Med, 2008. 6(9): p. 57.
184. Truchet, I., et al., Estrogen and antiestrogen-dependent regulation of breast cancer cell proliferation in multicellular spheroids: Influence of cell microenvironment. International journal of oncology, 2008. 32(5): p. 1033-1039.
185. Shin, C.S., et al., Development of an in vitro 3D tumor model to study therapeutic efficiency of an anticancer drug. Molecular pharmaceutics, 2013. 10(6): p. 2167-2175.
186. Friedrich, J., et al., Spheroid-based drug screen: considerations and practical approach. Nature protocols, 2009. 4(3): p. 309-324.
187. Gibot, L. and M.-P. Rols, Progress and prospects: the use of 3D spheroid model as a relevant way to study and optimize DNA electrotransfer. Current gene therapy, 2013. 13(3): p. 175-181.
188. Kim, T.-H., et al., The delivery of doxorubicin to 3-D multicellular spheroids and tumors in a murine xenograft model using tumor-penetrating triblock polymeric micelles. Biomaterials, 2010. 31(28): p. 7386-7397.
189. Bandekar, A., et al., Antitumor efficacy following the intracellular and interstitial release of liposomal doxorubicin. Biomaterials, 2012. 33(17): p. 4345-4352.
190. Dufau, I., et al., Multicellular tumor spheroid model to evaluate spatio-temporal dynamics effect of chemotherapeutics: application to the gemcitabine/CHK1 inhibitor combination in pancreatic cancer. BMC cancer, 2012. 12(1): p. 15.
References
Pag. 180
191. Chitcholtan, K., P.H. Sykes, and J.J. Evans, The resistance of intracellular mediators to doxorubicin and cisplatin are distinct in 3D and 2D endometrial cancer. J Transl Med, 2012. 10: p. 38.
192. Li, C.-L., et al., Survival advantages of multicellular spheroids vs. monolayers of HepG2 cells in vitro. Oncology reports, 2008. 20(6): p. 1465-1471.
193. Fehlauer, F., et al., Combined modality therapy of gemcitabine and irradiation on human glioma spheroids derived from cell lines and biopsy tissue. Oncology reports, 2006. 15(1): p. 97-105.
194. Burgués, J.P., et al., A chemosensitivity test for superficial bladder cancer based on three-dimensional culture of tumour spheroids. European urology, 2007. 51(4): p. 962-970.
195. Burdett, E., et al., Engineering tumors: a tissue engineering perspective in cancer biology. Tissue Engineering Part B: Reviews, 2010. 16(3): p. 351-359.
196. Pampaloni, F., E.G. Reynaud, and E.H. Stelzer, The third dimension bridges the gap between cell culture and live tissue. Nature reviews Molecular cell biology, 2007. 8(10): p. 839-845.
197. Kim, J.B. Three-dimensional tissue culture models in cancer biology. in Seminars in cancer biology. 2005. Elsevier.
198. Sutherland, R.M., J.A. McCredie, and W.R. Inch, Growth of multicell spheroids in tissue culture as a model of nodular carcinomas. Journal of the National Cancer Institute, 1971. 46(1): p. 113-120.
199. Friedrich, J., R. Ebner, and L.A. Kunz-Schughart, Experimental anti-tumor therapy in 3-D: spheroids–old hat or new challenge? International journal of radiation biology, 2007. 83(11-12): p. 849-871.
200. Benien, P. and A. Swami, 3D tumor models: history, advances and future perspectives. Future Oncology, 2014. 10(7): p. 1311-1327.
201. Lobjois, V., et al., Cell cycle and apoptotic effects of SAHA are regulated by the cellular microenvironment in HCT116 multicellular tumour spheroids. European Journal of Cancer, 2009. 45(13): p. 2402-2411.
202. Santini, M.T., G. Rainaldi, and P.L. Indovina, Apoptosis, cell adhesion and the extracellular matrix in the three-dimensional growth of multicellular tumor spheroids. Critical reviews in oncology/hematology, 2000. 36(2): p. 75-87.
203. Nederman, T., et al., Demonstration of an extracellular matrix in multicellular tumor spheroids. Cancer Research, 1984. 44(7): p. 3090-3097.
204. Marrero, B., J.L. Messina, and R. Heller, Generation of a tumor spheroid in a microgravity environment as a 3D model of melanoma. In Vitro Cellular & Developmental Biology-Animal, 2009. 45(9): p. 523-534.
205. Wasungu, L., et al., A 3D in vitro spheroid model as a way to study the mechanisms of electroporation. International journal of pharmaceutics, 2009. 379(2): p. 278-284.
References
Pag. 181
206. Dongari-Bagtzoglou, A. and H. Kashleva, Development of a highly reproducible three-dimensional organotypic model of the oral mucosa. Nature protocols, 2006. 1(4): p. 2012-2018.
207. Nakamura, K., et al., Apoptosis induction of human lung cancer cell line in multicellular heterospheroids with humanized antiganglioside GM2 monoclonal antibody. Cancer research, 1999. 59(20): p. 5323-5330.
208. Kelm, J.M., et al., Method for generation of homogeneous multicellular tumor spheroids applicable to a wide variety of cell types. Biotechnology and bioengineering, 2003. 83(2): p. 173-180.
209. Billottet, C. and J. Jouanneau, [Tumor-stroma interactions]. Bulletin du cancer, 2008. 95(1): p. 51-56.
210. Kubota, T., et al., Cancer chemotherapy chemosensitivity testing is useful in evaluating the appropriate adjuvant cancer chemotherapy for stages III/IV gastric cancers without peritoneal dissemination. Anticancer research, 2002. 23(1B): p. 583-587.
211. Taylor, C., et al., Chemosensitivity testing predicts survival in ovarian cancer. European journal of gynaecological oncology, 2000. 22(4): p. 278-282.
212. Kabeshima, Y., et al., Clinical usefulness of chemosensitivity test for advanced colorectal cancer. Anticancer research, 2001. 22(5): p. 3033-3037.
213. Gibot, L., et al. Mixed Spheroids as a Relevant 3D Biological Tool to Understand Therapeutic Window of Electrochemotherapy. in 1st World Congress on Electroporation and Pulsed Electric Fields in Biology, Medicine and Food & Environmental Technologies: Portorož, Slovenia, September 6–10, 2015. 2015. Springer.
214. Chopinet-Mayeux, L., Effets des champs électriques pulsés milli et nanosecondes sur cellules et tissus. 2013, Université Paul Sabatier-Toulouse III.
List of publications
Pag. 182
List of publications
Journal publications
Claudia Irene Trainito, Olivier Français, Bruno Le Pioufle, “Analysis of pulsed
electric field effects on cellular tissue with Cole-Cole model: monitoring permeabilization under inhomogeneous electrical field with bioimpedance parameter variations”. Innovative Food Science & Emerging Technologies, February 2015
Claudia Irene Trainito, Olivier Français, Bruno Le Pioufle, “Monitoring the
permeabilization of a single cell in a microfluidic device, through the estimation of its dielectric properties based on combined dielectrophoresis and electrorotation in-situ experiments.” Electrophoresis journal, February 2015.
Emilie Bisceglia, Myriam Cubizolles, Claudia Irene Trainito, Jean Berthier, Catherine
Pudda, Olivier Français, Frédéric Mallard, Bruno Le Pioufle, “A generic label free method based on dielectrophoresis for the continuous separation of microorganism from whole blood samples.” Sensors and Actuators B: Chemical, June 2015
Rémi Sieskind, Claudia Irene Trainito, Olivier Français, Bruno Le Pioufle,
“Microsystème dédié à l’étude de la polarisation diélectrique de micro-particules dans le cadre de formation master recherche : application au micro-positionnement 3D de cellules par force de diélectrophorèse” Journal sur l'enseignement des sciences et technologies de l'information et des systèmes, February 2015
Conference proceeding
Claudia Trainito, Emilie Bayart, Emilie Bisceglia, Frederic Subra, Olivier Français,
Bruno Le Pioufle,“Electrorotation as a versatile tool to estimate dielectric properties of multi-scale biological samples: from single cell to spheroid analysis.”, 1st World Congress on Electroporation and Pulsed Electric Fields in Biology, Medicine and Food & Environmental Technologies (WC2015), September 2015, Portoroz, Slovenia.
Claudia Trainito, Olivier Français, Bruno Le Pioufle,“A microfluidic device to
determine dielectric properties of a single cell: a combined dielectrophoresis and electrorotation technique.”, Microfluidics 2014. Limerick, Ireland
List of publications
Pag. 183
Claudia Trainito, Olivier Français, Bruno Le Pioufle,“ Monitoring in real time the
dielectric properties of a single cell combining dielectrophoresis and electrorotation experiments in a microfluidic device : towards electropermeabilization analysis.”, Dielectrophoresis 2014. London, United Kingdom.
Olivier Français, Bruno Le Pioufle, Claudia Trainito. Etude et mise en oeuvre d’un
microsystème fluidique pour la caractérisation diélectrique de cellules biologiques par électrorotation. Symposium de Génie Electrique, July 2014. Cachan, France.
Rémi Sieskind, Claudia Trainito, Olivier Français, Bruno Le Pioufle, “Microsystème
dédié à l’étude de la polarisation diélectrique de micro-particules dans le cadre de formation master recherche : application au micro- positionnement 3D de cellules par force de diélectrophorèse” Colloque d'enseignement des technologies et des sciences de l'information et des systèmes – CETSIS October 2014. Besançon, France.
Claudia Trainito, Olivier Français, Bruno Le Pioufle,“Determination of electro-
physiological properties of cell by eletrorotation” EBTT November 2012, Ljubljana, Slovenia.
Bazzani, M., Conzon, D., Scalera, A., Spirito, M. A., & Trainito, C. I.. Enabling the
IoT paradigm in e-health solutions through the VIRTUS middleware. IUCC-2012 June 2012. Liverpool, United Kingdom.

Université Paris-Saclay Espace Technologique / Immeuble Discovery
Route de l’Orme aux Merisiers RD 128 / 91190 Saint-Aubin, France
Université Paris-Saclay Espace Technologique / Immeuble Discovery
Route de l’Orme aux Merisiers RD 128 / 91190 Saint-Aubin, France
Titre : Etude de la perméabilisation d’une membrane cellulaire par un champ électrique pulsé:
développement d’une modélisation électrique – caractérisation sur biopuces à cellules
Mots clés : perméabilisation cellulaire, champ électrique pulsé, modélisation électrique, biopuces
microfuidiques
Résumé : L’utilisation du champ électrique pour
agir sur le vivant permet d’envisager la recherche de
nouveaux traitements contre le cancer :
l’ElectroChimioThérapie, la thérapie génique,
l’immunothérapie.
L’application d’impulsions électriques sur des
cellules ou des tissus induit un changement sur leurs
membranes qui deviennent perméables. Ce
phénomène permet d'augmenter temporairement la
capacité des membranes cellulaires à laisser passer
les ions et les macromolécules. Ces phénomènes ne
sont pas totalement maitrisés ni compris par la
communauté scientifique. Ainsi le but de mon
travail de thèse est de contribuer à modéliser et
caractériser les phénomènes biophysiques
intervenant lors de l’application de sollicitations
électrique.
En particulier nous essayons d’obtenir une signature
électrique, sur une large bande de fréquence, de
l’évolution en temps réel des
propriétés de systèmes biologiques
(tissus/cellules/systèmes membranaires), en réponse
à des stimuli électriques.
Ce travail de thèse a débouché sur l’établissement de
modèles analytiques électriques macroscopiques;
cependant une approche microscopique a été
également abordée. Les expériences effectuées sur
des biopuces microfluidiques appareillées de réseaux
d’électrodes ont permis de confronter les modèles à
la réalité physique et biologique, les microsystèmes
employés offrent les avantages de la miniaturisation
et permettent de travailler au niveau de la cellule
unique, appliquant des champs électriques de forte
amplitude, de forte fréquence, localisés spatialement.
Title : Study of cell membrane permeabilization induced by pulsed electric field – electrical
modelling and characterization on biochip.
Keywords : cell membrane permeabilization, pulsed electric field, cell modelling, microfluidics
biochip
Abstract : The use of the electric field to interact
with cells provides promising tools for new cancer
treatments: electrochemotherapy, gene therapy,
immunotherapy.
The application of electrical pulses to cells or cell
tissues induces a change on their properties, in
particular on their membrane, which becomes
permeabilized. This phenomenon temporarily
increases the capability of cell membranes to be
passed from ions and macromolecules. These
phenomena are not fully understood by the
scientific community, so the purpose of my thesis is
to contribute to model and characterize the
biophysical phenomena occurring during the
application of electric pulses.
In particular we investigate, on a wide frequency
band, dielectric properties changes induced on
biological systems (tissue/cell/membrane) in
response to electrical solicitations.
We investigate the dynamics of
electropermeabilization at the macroscopic level
(cell tissues) through electrical analytical models;
however, a microscopic approach is also discussed.
Experiments on microfluidic biochip are used to
explain, the physical and biological phenomena
occurring during permeabilization. The use of
miniaturized devices (microsystems) for single cell
investigation offers the advantages of applying
electric fields with high amplitude, high frequency,
spatially localized.
Related Documents