Sequence Analysis (II) Yuh-Shan Jou ( 周周周 ) [email protected] Institute of Biomedical Sciences, Academia Sinica

Sequence Analysis (II) Yuh-Shan Jou ( 周玉山 ) [email protected] Institute of Biomedical Sciences, Academia Sinica.
Jan 03, 2016
Welcome message from author
This document is posted to help you gain knowledge. Please leave a comment to let me know what you think about it! Share it to your friends and learn new things together.
Transcript

Sequence Analysis (II)
Yuh-Shan Jou (周玉山 )[email protected]
Institute of Biomedical Sciences, Academia Sinica

Other Areas to Cover
• Genomic Data
• Annotation
• Common Domains prediction WWW
• Other Useful Genome Browsers


But first, some vocabulary...
YACs Yeast Artificial Chromosomes Yeast linear vector to propagate large DNA inserts (100 kb to Mb) Uses yeast centromere and telomeres to propagate insert as a chromosome
BACs Bacterial Artificial Chromosomes E. coli circular plasmid designed to carry large inserts (100-300 kb), single
copy (reduces occurrence of chimeric clones)
Cosmid E. coli circular plasmid holds 5 to 50 kb inserts, multicopy
Plasmids E. coli circular vectors designed to propagate DNA inserts (~1 to 10,000 bp)
Usually have origin of replication and antibiotic resistance marker (pUC8)
M13 E. coli phage adapted for DNA sequencing. Can clone small DNA inserts in
double stranded plasmid version, and convert to single strand version for sequencing

cDNA complementary DNA DNA synthesized from RNA using reverse transcriptase (an RNA-
dependent DNA polymerase)
EST Expressed Sequence Tag Single pass DNA sequence run of a cDNA insert in a plasmid from one end
ORF Open Reading Frame A region of at least 100 codons that is uninterrupted by stop
codons and thus potentially encodes a protein
SNP Single Nucleotide Polymorphism A single base that differs among members of a population. Can be detected by “genotyping”by PCR. Responsible for much trait diversity in
populations (physical appearance, diseases, drug response).
Satellite Marker Short tandem repeat (CACACACACACACACACAC, eg.) with length polymorphisms in a population (10 CA’s vs 25, eg.). Can be detected by genotyping. Often used for screening affected populations for disease genes(LOD scores).
STS Sequenced Tag Site Short (~500 bp) segment of DNA of known sequence mapped to location

EnsemblDatabase and Web
Browser
Erin Pleasance
Canada’s Michael Smith Genome Sciences Centre, Vancouver

Lecture 7.1 7
www.ensembl.org

What is Ensembl?• Joint project of EBI and Sanger
• Automated annotation of eukaryotic genomes
• Open source software
• Relational database system
• Web interface “The main aim of this campaign is to encourage
scientists across the world - in academia, pharmaceutical companies, and the biotechnology and
computer industries - to use this free information.”- Dr. Mike Dexter, Director of the Wellcome Trust

TPMD: http://tpmd.nhri.org.tw
Nucleic Acids Research, 2005, Vol. 33, Database issue D174-D177


Ensembl components
Genes(GeneView, TransView,
ExonView, ProtView)
SNPs and Haplotypes(SNPView, GeneSNPView,
HaploView, LDView)Diseases
(DiseaseView)
Markers(MarkerView)
Families(DomainView,
FamilyView
Functions(GOView)
GenomeSequence(ContigView)
ComparativeGenomics
(ContigView, MultiContigView,SyntenyView, GeneView)
Search tools:Data:
SequenceSimilarity
(BLAST, SSAHA)
Text(TextView)
Anything(EnsMart)
OtherAnnotations
Chromosomes(ChromoView, KaryoView,
CytoView, MapView)

Example 1: Exploring Caspase-3
• Aim to demonstrate basic browsing and views• Caspase-3 is a gene involved in apoptosis (cell
suicide)• We will look at:
– Gene annotation
– SNPs
– Orthologs and genome alignments
– Alternative transcripts and EST genes

Example 1: Exploring Caspase-3
http://www.ensembl.org
Go to human homepage

Species-specific homepage
Statistics of current release
Site map

Finding the tool/view: Site Map

Text SearchSpecies-specific homepagecaspase-3Gene
Click Back to

GeneView
ContigView
ProteinView
ExonViewTransView of transcript
SNPView
ExportView

GeneView
Orthologs predicted by sequence
similarity and synteny
GeneDAS: Get data from external sources
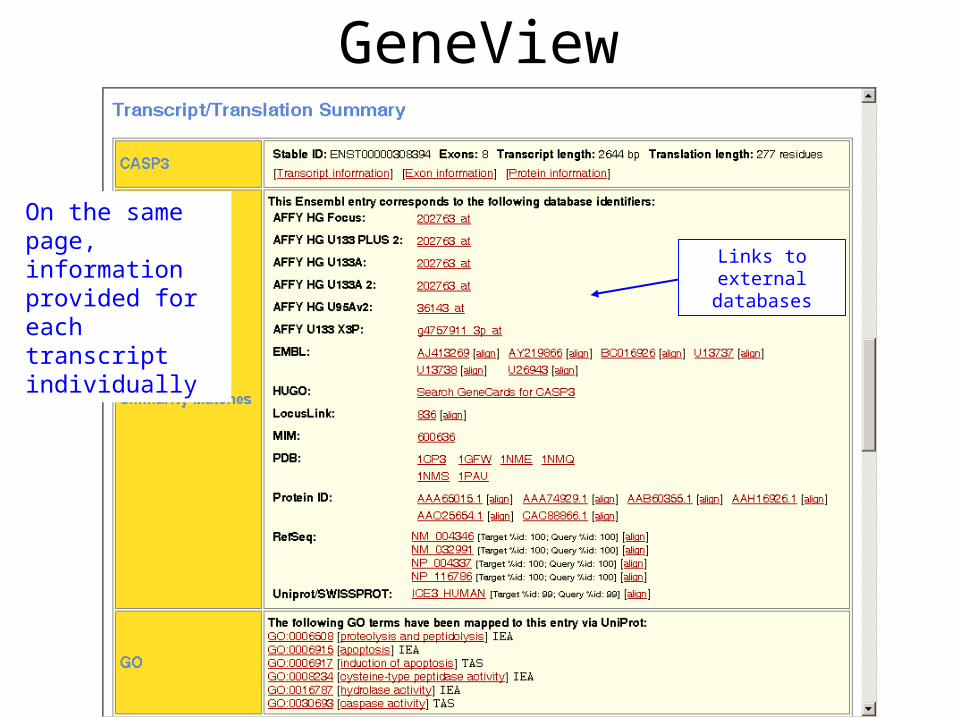
GeneView
Links to external databases
On the same page, information provided for each transcript individually

GeneView

GeneSNPView

Other SNP/Haplotype tools• SNPView
• ProteinView (protein sequence with SNP markup)
• LDView: View linkage disequilibrium (only limited regions)
• HaploView: View haplotypes (only limited regions)

GeneViewClick Back to

ContigView
Sequence contigs
Chromosome and bands

ContigView: Detailed View
Other tracks: Aligned
sequences etc.
Gene annotations
See other tracks, options
in menusTargetted gene
predictions(2 alternative transcripts)
EST genes
Genscan predictions

ContigView

MultiContigView
Rat ortholog
DNA sequence homology

Other Comparative
Genomics Tools• Saw gene orthology,
DNA homology• Other view is
SyntenyView• Also access
comparative genomics through EnsMart

Data Mining with EnsMart
• Allows very fast, cross-data source querying• Search for genes (features, sequences, etc.) or
SNPs based on– Position; function; domains; similarity; expression;
etc.
• Accessible from Ensembl website (MartView) as well as stand-alone
• Extremely powerful for data mining

Example 2: EnsMart
• A new disease locus has been mapped between markers D21S1991 and D21S171. It may be that the gene involved has already been identified as having a role in another disease. What candidates are in this region?

Example 2: EnsMart
• EnsMart is based on BioMart
• http://www.ensembl.org/Multi/martview
OR
• http://www.ebi.ac.uk/BioMart/martview

EnsMart: Choosing your dataset

EnsMart: Filtering
D21S1991
D21S171
21

EnsMart: OutputNote you can
output different types of information
eg. sequences

EnsMart: Output

Sequence Similarity Searching
• Use SSAHA for exact matches (fast)
• Use BLAST for more distant similarity (slow)

EnsEMBL BLAST

Lecture 5.1 38
The ideal annotation of “Gene”
Ideal Gene
All mRNAs
All proteins
All structures
All SNPs
All clones
• All protein modifications• Ontologies • Interactions (complexes, pathways, networks)•Expression (where and when, and how much)•Evolutionary relationships
Promoter(s)

gene number in the human genome
• Consortium 30.000 ~ 40.000 2001
• Celera 27.000 ~ 38.000 2001
• Consortium+Celera 50.000 Hogenesch et al. 2001
• DBsearches 65.000 ~ 75.000 Wrigth et al., 2001
• HumanGenomeSciences 90.000 ~ 120.000 Haseltine, 2001
• Consortium Build 34 35,000 ~ 40,000 April, 2003
• Consortium Build 35 20,000 ~ 25,000 Nature 431:931, 2004

Human Genome Project -- “Why sequence junk?!”
• 90% of human genome (3.3x10⁹) in finished status, ie 99% of euchromatin.
• 45% of the genome are repeat sequences.
• 5% of the genome encodes genes (1.5% is coding).
• 35,000 ~ 40,000 genes with multiple splicing products per gene (build 34).
• Finish at April, 2003 & single chromosome papers published one by one.
• The entire human genome was finished again Oct. 2004.Build 35 assembly with 2.85 billion nucleotides interrupted by only 341 gaps. It covers 99% of the euchromatic genome with an error rate of 1 / 100,000 bases. The human genome seems to encode only 20,000–25,000 protein-coding genes. (Nature 431:931-945, 2004).
Cost of Genome sequencing: average US $1 per base.= 3.3 billion US dollars to sequence the human genome.

Ab initio gene identification
• Goals– Identify coding exons– Seek gene structure information– Get a protein sequence for further analysis
• Relevance– Characterization of anonymous DNA genomic
sequences– Works on all DNA sequences

Gene Finding on the Web
GRAIL: Oak Ridge Natl. Lab, Oak Ridge, TN– http://compbio.ornl.gov/grailexp
ORFfinder: NCBI– http://www.ncbi.nlm.nih.gov/gorf/gorf.html
DNA translation: Univ. of Minnesota Med. School– http://alces.med.umn.edu/webtrans.html
GenLang– http://cbil.humgen.upenn.edu/~sdong/genlang.html
BCM GeneFinder: Baylor College of Medicine, Houston, TX
– http://dot.imgen.bcm.tmc.edu:9331/seq-search/gene-search.html– http://dot.imgen.bcm.tmc.edu:9331/gene-finder/gf.html

Promoter “Exon 1” | “Intron 1” | “Exon 2” | “Intron 2” | “Exon 3” | “Intron 3” | “Exon 4”
Transcription
Splicing
Translation
polyApolyAcapcap
polyApolyA
StopStop
GU AG GU AG
NucleusNucleus
CytoplasmCytoplasm
GU AG
DNA
Primary transcript
MaturemRNA
StartStart
capcap
Poly-A SignalPoly-A Signal

Relative PerformanceClaverie 1997 Rogic 2000Sn (%) Sp (%) Overall Overall
Individual ExonsMZEF 78 86 0.79HEXON 71 65 0.64SorFind 42 47 0.62GRAIL II 51 57 0.47
Gene StructureGENSCAN 78 81 0.86 0.91FGENES 73 78 0.74 0.83GRAIL II/Gap 51 52 0.66 GeneParser 35 40 0.54HMMgene 0.91

What works best when?
• Genome survey (draft) data:expect only a single exon in any given stretch of contiguous sequence
– BLASTN vs. dbEST (3’ UTR)– BLASTX vs. nr (protein CDS)
• Finished data: large contigs are available, providing context– GENSCAN– HMMgene

Lecture 5.1 46
Things we are looking to annotate?
• CDS
• mRNA
• Alternative RNA
• Promoter and Poly-A Signal
• Pseudogenes
• ncRNA

Pseudogenes• Could be as high as 20-30% of all genomic sequence predictions
could be pseudogene
• Non-functional copy of a gene– Processed pseudogene
• Retro-transposon derived• No 5’ promoters• No introns• Often includes polyA tail
– Non-processed pseudogene• Gene duplication derived
– Both include events that make the gene non-funtional• Frameshift• Stop codons
• We assume pseudogenes have no function, but we really don’t know!

Noncoding RNA (ncRNA)
• ncRNA represent 98% of all transcripts in a mammalian cell
• ncRNA have not been taken into account in gene counts• cDNA• ORF computational prediction• Comparative genomics looking at ORF
• ncRNA can be:– Structural– Catalytic– Regulatory

09_04.jpgNoncoding RNA database: http://biobases.ibch.poznan.pl/ncRNA
Non-encoding genes:
The total number of ncRNAs are still unknown due to difficulty of predicting ncRNA from genome sequences.

Noncoding RNA (ncRNA)
• tRNA – transfer RNA: involved in translation
• rRNA – ribosomal RNA: structural component of ribosome, where translation takes place
• snoRNA – small nucleolar RNA: functional/catalytic in RNA maturation
• Antisense RNA: gene silencing

http://rfam.wustl.edu

http://rna.tbi.univie.ac.at/
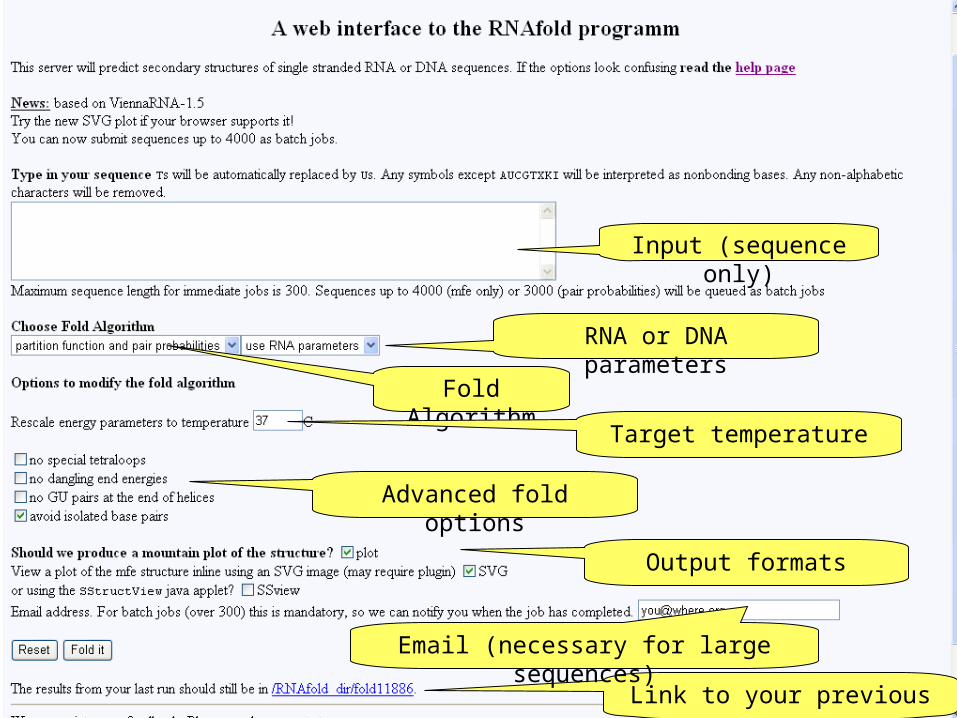
Input (sequence only)
Fold Algorithm
RNA or DNA parameters
Target temperature
Advanced fold options
Output formats
Link to your previous run
Email (necessary for large sequences)

Output in bracket notation
Output - PostScript


Free energy (∆G)
Enthalpy (∆S)
Melting (de-hybridization) temperature

RNAalifold:Predicts consensus secondary structures for
sets of aligned RNA (ClustalW files).
Information from the alignment:
1. Conserved nucleotide pairs are shown normally.
2. Pairs with consistent mutations, which support the structure, are marked by circles.
3. Pairs with inconsistent mutations are shown in two shades of gray.

Graphical Representation – Sequence Logo
• Horizontal axis: position of the base in the sequence.
• Vertical axis: amount of information.
• Letter stack: order indicates importance.
• Letter height: indicates frequency.
• Consensus can be read across the top of the letter columns.
http://www-lmmb.ncifcrf.gov/~toms/sequencelogo.html


Tools on the Web for motifs• MEME – Multiple EM for Motif Elicitation.
http://meme.sdsc.edu/meme/website/• metaMEME- Uses HMM method
http://meme.sdsc.edu/meme• MAST-Motif Alignment and Search Tool
http://meme.sdsc.edu/meme
• TRANSFAC - database of eukaryotic cis-acting regulatory DNA elements and trans-acting factors. http://transfac.gbf.de/TRANSFAC/
• eMotif - allows to scan, make and search for motifs in the protein level. http://motif.stanford.edu/emotif/

Websites for Promoter findingPromoter Scan: NIH Bioinformatics (BIMAS)
http://bimas.dcrt.nih.gov/molbio/proscan/
Promoter Scan II: Univ. of Minnesota & Axyx Pharmaceuticals
http://biosci.cbs.umn.edu/software/proscan/promoterscan.htm
Signal Scan: NIH Bioinformatics (BIMAS)http://bimas.dcrt.nih.gov:80/molbio/signal/index.html
Transcription Element Search (TESS): Center for Bioinformatics, Univ. of Pennsylvaniahttp://www.cbil.upenn.edu/tess/
Search TransFac at GBF with MatInspector, PatSearch, and FunSitePhttp://transfac.gbf-braunschweig.de/TRANSFAC/programs.html
TargetFinder: Telethon Inst.of Genetics and Medicine, Milan, Italy
http://hercules.tigem.it/TargetFinder.html

TFs play a significant role in differentiation in a number of cell
types
The fact that ~ 5% of the genes are predicted to encode
transcription factors underscores the importance of
transcriptional regulation in gene expression (Tupler et al. 2001
Nature. 409:832-833)
The combinatorial nature of transcriptional regulation and
practically unlimited number of cellular conditions significantly
complicate the experimental identification of TF binding sites on
a genome scale
Understanding the transcriptional regulation is a major
challenge
Transcriptional regulatory regionTranscriptional regulatory region
1st exonU1
GU
SR
TSS
GTFsRNAP II
5’ 3’
core promoter region (~100bp)
activator
repressor
70K
regulatory promoter region
1st exon1st exonU1
GUU1
GU
SRSR
TSS
GTFsRNAP II
5’ 3’
core promoter region (~100bp)core promoter region (~100bp)
activator
repressor
70K70K
regulatory promoter region
regulatory promoter region
Computational approaches to identify potential regulatory Computational approaches to identify potential regulatory
elements and modules, and derive new, biologically relevant and elements and modules, and derive new, biologically relevant and
testable hypothesistestable hypothesis

Transcriptional regulatory module
• cis-regulatory elements are sequence-specific regions transcription factors bind
AGGCTA
AGGCTA
CGGTTAAG
CGGTTAAG
GCTAACGC
GCTAAGCG• TFs combinatorially
associate with each other to form modules and regulate their target genes

Mammalian Promoter Dadabase (MPromDb) (http://bioinformatics.med.ohio-state.edu)

MPromDb 1.0 (Mammalian Promoter Database)
(http://bioinformatics.med.ohio-state.edu)
Click here to search the database
Human, mouse & ratSearch by gene symbol; Genbank Acc.Num; Unigene/LocusLink ID; TF binding site name

MPromDb 1.0 (Mammalian Promoter Database)
(http://bioinformatics.med.ohio-state.edu)

MPromDb 1.0 (Mammalian Promoter Database)
(http://bioinformatics.med.ohio-state.edu)
BAX gene promoter with TF binding site annotations, with supporting evidence from 3 PubMed records

MPromDb (Mammalian Promoter Database)
Promoter sequences with annotations of experimentally supported TF binding
sites
Promoter sequences with annotations of computationally predicted TF binding
sitesA platform for statistical analysis & pattern recognition, to predict TF binding
sites in uncharacterized promoters, and model combinatorial association of TF
binding sites
A platform for comparative genomics, to reveal conserved regions across
genomes of different species
Identification of core-promoters
Identification of all the human-mouse-rat homologues pairs
Modeling and identification of TF binding sites & modules


Specific databases of protein sequencesand structures
Swissprot PIR TREMBL (translated from DNA) PDB (Three Dimensional Structures)

Primary Secondary Tertiary Quaternary
Amino acid sequence
Alpha helices &
Beta sheets,
loops.
Packing of secondaryelements.
Packing of several polypeptide chains
Protein Structure

Structure Prediction: Motivation
• Hundreds of thousands of gene sequences translated to proteins (genbanbk, SW, PIR)
• Only about 28000 solved structures (PDB)
• Goal: Predict protein structure based on sequence information

Structure Prediction: Motivation
• Understand protein function– Locate binding sites
• Broaden homology– Detect similar function where sequence differs
• Explain disease– See effect of amino acid changes– Design suitable compensatory drugs

Prediction Approaches
• Primary (sequence) to secondary structure– Sequence characteristics
• Secondary to tertiary structure– Fold recognition– Threading against known structures
• Primary to tertiary structure– Ab initio modelling

Secondary structure prediction
• AGADIR - An algorithm to predict the helical content of peptides • APSSP - Advanced Protein Secondary Structure Prediction Server • GOR - Garnier et al, 1996 • HNN - Hierarchical Neural Network method (Guermeur, 1997) • Jpred - A consensus method for protein secondary structure prediction at
University of Dundee • JUFO - Protein secondary structure prediction from sequence (neural
network) • nnPredict - University of California at San Francisco (UCSF) • PredictProtein - PHDsec, PHDacc, PHDhtm, PHDtopology, PHDthreader,
MaxHom, EvalSec from Columbia University • Prof - Cascaded Multiple Classifiers for Secondary Structure Prediction • PSA - BioMolecular Engineering Research Center (BMERC) / Boston • PSIpred - Various protein structure prediction methods at Brunel University • SOPMA - Geourjon and Delיage, 1995 • SSpro - Secondary structure prediction using bidirectional recurrent neural
networks at University of California • DLP - Domain linker prediction at RIKEN

http://searchlauncher.bcm.tmc.edu/


Multiple Sequence Alignment

ClustalW Algorithm
• Compute pairwise alignment for all the pairs of sequences. • Use the alignment scores to build a phylogenetic tree such
that • similar sequences are neighbors in the tree• distant sequences are distant from each other in the tree.
• The sequences are progressively aligned according to the branching order in the guide tree.
• http://www.ebi.ac.uk/clustalw/
Progressive Sequences Alignment (Higgins and Sharp 1988)

ClustalW InputFast
alignment?
Scoring matrix
Alignment format
Fast alignment
options
Gap scoring
Phylogenetic trees
Input sequences

ClustalW Output (1)
Input sequences
Pairwise alignment scores
Building alignment
Final score

ClustalW Output (2)
Sequence names Sequence positions
Match strength in decreasing order: * : .

Phylogenetic Trees
• Represent closeness between many entities– In our case, genomic or protein sequences
human
chimpmonkey
Observed entity
Unobserved commonality
Distance representation

N Y L S N K Y L S N F S N F L S
N K/- Y L S N F L/- S
N K/- Y/F L/- S
Progressive Sequence Alignment (Protein sequences example)

MSA Approaches• Progressive approach
CLUSTALW (CLUSTALX) PILEUP
T-COFFEE
• Iterative approach: Repeatedly realign subsets of sequences.
MultAlin, DiAlign.
• Statistical Methods:Hidden Markov Models
SAM2K
• Genetic algorithmSAGA

Multiple Alignment tools on the Web (Some URLs)
EMBL-EBIhttp://www.ebi.ac.uk/clustalw/
BCM Search Launcher: Multiple Alignment
http://dot.imgen.bcm.tmc.edu:9331/multi-align/multi-align.html
Multiple Sequence Alignment for Proteins (Wash. U. St. Louis)http://www.ibc.wustl.edu/service/msa/

Editing Multiple Alignments
• There are a variety of tools that can be used to modify a multiple alignment.
• These programs can be very useful in formatting and annotating an alignment for publication.
• An editor can also be used to make modifications by hand to improve biologically significant regions in a multiple alignment created by one of the automated alignment programs.


GCG alignment editors
• Alignments produced with PILEUP (or CLUSTAL) can be adjusted with LINEUP.
• Nicely shaded printouts can be produced with PRETTYBOX
• GCG's SeqLab X-Windows interface has a superb multiple sequence editor - the best editor of any kind.

SeqVu

Editors on the Web• Check out CINEMA (Colour
INteractive Editor for Multiple Alignments)– It is an editor created completely in
JAVA (old browsers beware)– It includes a fully functional version
of CLUSTAL, BLAST, and a DotPlot module
http://www.bioinf.man.ac.uk/dbbrowser/CINEMA2.1/


Questions:
1. Download protein seq and predict domain, secondary structure and post-translational modifications.
2. Download all SARS virus genome and perform MSA.
Related Documents