September 2015

Welcome message from author
This document is posted to help you gain knowledge. Please leave a comment to let me know what you think about it! Share it to your friends and learn new things together.
Transcript

September 2015

PREFACE
The research work is going to give an idea of Last Mile Connectivity (LMC) and it’s
need and importance for the metropolitan and mega cities of India and World, by
providing facts of existing scenario and output of analysis of primary survey. The
research is being done for least mile connectivity, considering study area as Delhi and
five metro stations as study stations, out of 143 metro stations. Primary survey was
conducted for public transport commuters and private commuters in peak and off-peak
hours. The interview of service providers like cycle rickshaw, e-rickshaw, bus operators
and auto rickshaw gave valuable suggestions in formulation of strategies for
improvement.
FOREWORD
Human Settlement Management Institute (HSMI) was established in 1985 as the research
and training wing of Housing and Urban Development Corporation Limited (HUDCO) to
provide training support for professionals engaged with the issues of day to –day practice
of human settlement development. HUDCO is a public sector organization, fully owned
by the Government of India, and it provides techno-financial assistance to all government
agencies at centre, state and local level for housing and urban infrastructure.
HSMI plays a significant role in strengthening the capacities of borrowing agencies,
though training. It helps in generating viable projects to improve HUDCO’s lending
operations directly as well as indirectly. This gives the institute a rare twin character of an
R&T wing for internal capacity building, while also operating as a sector specialist
institute. Through its capacity building, research and documentation activities, HSMI
strives to fulfill the role of a facilitator for healthy debate on key issues in the habitat
sector, act as a catalyst to stimulate innovative policy options & implementation
strategies, and facilitate the participation of all in the dream of achieving sustainable
habitat development.
Over the recent years the institution has been able to make a niche for itself by being one
of the leading players in technical hand-holding and capacity building for successful
completion of some of the major initiatives undertaken by the government of India. Study
inputs, in the form of core conceptual cum feasibility studies, assessment reports, projects
evaluation/ monitoring expertise and imparting a variety of skill sets to the functionaries
who are entrusted in the working spheres of the prestigious Government of India’s
programs, is noteworthy contribution. The institute has always been on a self-renewal
mode; by bring out various structural adjustments keeping in view the ever-growing
challenges in the field of habitat development. The institute has be reoriented around four
Centre of Excellence (CoE) with specialist teams and governing council with national
level experts to guide its day-to-day activities.

ABSTRACT
The prospect of providing economical and convenient “Last Mile Connectivity” (LMC),
that is, from the trip ends to the point of accessing a public transport system, is an area of
much neglect in Indian cities, including Delhi. And in the same time the private vehicle
growth is increasing tremendously in Delhi city since 1991 to 2011. In this alarming
situation, the Last mile connectivity is imperative that a rapid paradigm shift is taken on in
order to move people away from private vehicles towards the role of public transit. The
research discuss about overview of Delhi and present conditions at selected five metro
stations by doing surveys regarding last mile connectivity. The important questions that
the project tries to address are: an assessment of comfort, time, space, cost, incurred in the
LMC as a ratio of the total journey for rapid transportation system users; user preferences
and alternatives available, for LMC; and in the end, whether lack of efficient LMC options
is a decisive element in the commuter’s choice of secret modes and how it involves the
overall efficiency of a public transit organization.

ACKNOWLEDGEMENT
I take the opportunity to thank the management at Human Management Settlement Institute
(HUDCO), Delhi for giving me an opportunity to carry out this research Project. I would
like to express my sincere gratitude to the Executive Director (Training) for giving me
necessary support in the smooth conduct of this project.
I convey my sincere thanks to CMD HUDCO Dr. M. Ravi Kanth for encouraging me for
submit this proposal and carry out the research work.
Thanks are also due to Mr. Nupul Chathurvedi for the analytical and technical support in
giving shape to this report. The works not have been completed without support of Mr.
Arshad Rizvi and his team who conducted necessary surveys for this study.
Lastly I would like to thank my family for their continued support during the entire
research project without which this would not have happened.
Rajiv Sharma September 2015

CONTENTS
PREFACE ..........................................................................................................................
FOREWORD ....................................................................................................................
ABSTRACT .......................................................................................................................
ACKNOWLEDGEMENT ................................................................................................
CONTENTS ......................................................................................................................
List of Tables ................................................................................................................... ii
List of Figures .................................................................................................................. ii
List of Abbreviations ......................................................................................................iv
1. INTRODUCTION ..................................................................................................... 1
1.1 Public Transportation in Indian Scenario .......................................................... 1
1.2 First-Last Mile of the user ................................................................................. 4
1.3 Need for the Study ............................................................................................ 5
1.4 Objective of the Study ...................................................................................... 5
1.5 Resources and Methodology ............................................................................ 5
1.6 Expected Outcomes .......................................................................................... 6
2 LITERATURE STUDY ............................................................................................... 1
2.1 Access And Egress ............................................................................................. 1
2.2 Multi-Modal Trips ............................................................................................. 1
2.3 Different Modes of Connecting Last Mile ......................................................... 2
2.3.1 Walking ..................................................................................................... 2
2.3.2 Bicycle as a Feeder ................................................................................... 3
2.3.3 Cycle Rickshaw ........................................................................................ 4
2.3.4 Feeder Bus ................................................................................................ 4
2.4 Sustainable Urban Transport in India (Role of the Auto-Rickshaw Sector) ...... 4
2.5 Influence Zones of Transit Stations and Feeder Modes ................................... 6
2.6 Public Transportation and Accessibility ............................................................ 8
2.7 Cost to Commuter ............................................................................................. 9
2.8 City Profile, Land-use and Public Transportation Relationship....................... 10
2.9 Transit-oriented development (TOD) ............................................................. 11
2.9.1 Benefits of TOD to Delhi: ....................................................................... 12
2.9.2 Components of TOD: .............................................................................. 13
2.9.3 Demarcation of the TOD influence zone ................................................ 13
2.10 Station Area planning (SAP) ........................................................................... 14
2.11 Mode integration ............................................................................................ 17
i
i
2.11.1 Measuring integration ............................................................................. 18
2.12 Integrate cycling and public transport ............................................................ 18
2.13 Improving Safe Access To Mass Transit Stations ............................................ 19
3 CASE STUDIES ........................................................................................................ 1
3.1 First last mile strategic plan of Los Angeles County .......................................... 1
3.2 Integration in Public Transportation Systems by Vahid Poorjafari and
Mohammad Poorjafari .................................................................................................. 2
3.2.1 The objectives of integration in public transport ...................................... 3
3.3 A Mechanism for Organizing Last-Mile Service Using Non-Dedicated
Fleet(Cheng,Nguyen,Lau 2012) ..................................................................................... 3
3.3.1 Organizing The Last-Mile Service ............................................................ 4
3.4 CHALLENGES AND INTEGRATION OF MUMBAI’S FEEDER ROUTES................... 5
3.4.1 Planning of Feeder Routes ........................................................................ 6
3.5 Report On Rent-A-Bike Program Of Delhi Metro .............................................. 8
4 SELECTION OF STUDY AREA – DELHI & FIVE METRO STATIONS ......................... 10
4.1 Ground reality of Delhi.................................................................................... 10
4.2 Selection of Delhi and Metro stations ............................................................ 11
5 Analysis and Findings .......................................................................................... 13
5.1 Number of Sample ..............................................Error! Bookmark not defined.
5.2 Technique used ...................................................Error! Bookmark not defined.
5.3 Commuters study ............................................................................................ 14
5.3.1 Modal Split for covering last mile .......................................................... 14
5.3.2 Distance, Time and cost incurred in last mile ......................................... 15
5.3.3 Perceived Problems ................................................................................. 18
5.4 Non-Commuters ............................................................................................. 19
5.4.1 Private Vehicle Users .............................................................................. 19
5.4.2 Intermediate Public Transport Operator ................................................. 22
5.5 Detailed analysis of Hauz Khas metro station................................................. 23
5.5.1 Commuters analysis in Peak Hour .......................................................... 24
5.5.2 Commuter Analysis in off-peak hour. ..................................................... 27
5.5.3 Non- Commutes: IPT Operators survey ................................................. 30
5.5.4 Non- Commutes: Private commuter survey ............................................ 31
5.6 Conclusion ....................................................................................................... 34
6 RECOMMENDATIONS ......................................................................................... 36
6.1 Long Term Recommendations ........................................................................ 36
6.2 Short Term Recommendations ....................................................................... 36
ii
ii
Station Area planning (SAP) ....................................................................................... 37
7 ANNEXURES ........................................................................................................ 39
7.1 Annexure 1: Questionnaire for Origin-Destination Ground Survey ................ 39
7.2 Annexure 2: Questionnaire for Origin-Destination Ground Survey ................ 41
7.3 Annexure 3: Questionnaire for Origin-Destination Ground Survey ................ 43
7.4 Annexure 4: Survey Data Analysis................................................................... 42
List of Tables
Table 1: Modal Split in Indian Cities as a % of Total Trips................................................. 2
Table 2: Classification the cities in following six categories ............................................. 3
Table 3: Desirable Modal Split in Indian Cities as a % of Total Trips ................................ 4
Table 4: Defining station area influence zones with accessibility considerations ............ 8
Table 5: Application of TOD Influence Zones .................................................................. 14
Table 6: Transit System Requirements ............................................................................ 18
Table 7: Top 20 Metro stations in terms of ridership, 2014 ............................................ 12
Table 8: Study Area Selection Details ............................................................................ 12
Table 9: Sample Size ...................................................................................................... 13
Table 10: Most Preferred Vehicle ................................................................................... 22
List of Figures
Figure 1 Urban Trips in Indian Cities based on City Size ................................................ 2
Figure 2: Existing Model Split in Indian Cities as a % of Total Trips .................................. 3
Figure 3 Understanding First Mile .................................................................................... 4
Figure 4: Multimodal transport chain, access and egress trips representation .............. 2
Figure 5: Policy Vision for Auto-Rickshaw Sector in Cities ................................................ 5
Figure 6: Probability Curves for access and egress time for Netherlands ........................ 7
Figure 7: Station Area Typology ................................................................................... 15
Figure 8: Station area influence zones, ........................................................................... 16
Figure 9: Station area delineation ................................................................................... 17
Figure 10: Safe access approach ..................................................................................... 20
Figure 11: Existing land use around Indiranagar Metro Station (2011) ......................... 21
Figure 12: Greenhouse Gas Emissions per Person per Trip ............................................... 1
Figure 13 Organising Last Mile Service ........................................................................... 4
Figure 14 Typical Characteristics of a Feeder Bus System (EMBARQ India 2014) ....... 6
Figure 15 Five types of Integration (EMBARQ India 2014) ............................................ 7
Figure 16cycle stand at vishwavidhyalaya metro ............................................................. 9
figure 17 at vishwavidhyalaya metro ................................................................................ 9
Figure 18: Modal Split during Peak Hours ..................................................................... 15
Figure 19: Modal Split during off-Peak Hours ............................................................... 15
Figure 20: Average Distance to Public transportation in peak and off- peak ................. 15
Figure 21: commuters Mode wise Average Distance to Public Transport ...................... 16

iii
iii
Figure 22 TYPE OF VEHICLE ...................................................................................... 20
Figure 23 TRAVEL DISTANCE
Figure 24 TRAVEL TIME .............................................................................................. 20
Figure 25 TRAVEL COST
Figure 26 MONTHLY INCOME .................................................................................. 21
Figure 27 TRIP FREQUENCY
Figure 28 REASON FOR NOT TAKING PUBLIC TRANSPORT .............................. 21
Figure 29 VALUE OF MONEY FOR 10 MIN .............................................................. 21
Figure 30 MODAL SPLIT
Figure 31 OWNERSHIP ................................................................................................. 22
Figure 32 OWNED OPERATIONAL COST
Figure 33 RENTED OPERATIONAL COST ................................................................ 22
Figure 34 At Hauz khas .................................................................................................... 23
Figure 35 Average distance to public transport .............................................................. 24
Figure 36 Influence zones during peak hour ................................................................... 25
Figure 37 MODAL SPLIT .............................................................................................. 25
Figure 38 TRIP PURPOSE
Figure 39 TRIP FREQUENCY ...................................................................................... 26
Figure 40 COMMUTER'S MONTHLY INCOME
Figure 41 PERSONAL VEHICLE ................................................................................. 26
Figure 42 RATING ON PT ............................................................................................ 27
Figure 43 AVERAGE DISTANCE TO PUBLIC TRANSPORT................................... 27
Figure 44 INFLUENCE ZONES DURING OFF-PEAK HOUR .................................. 28
Figure 45 MODAL SPLIT
Figure 46 TRIP PURPOSE ............................................................................................. 28
Figure 47 TRAVEL TIME .............................................................................................. 29
Figure 48 AVERAGE FARE WITH MODE .................................................................. 29
Figure 49 TRIP FREQUENCY
Figure 50 COMMUTER MONTHLY INCOME RANGE ............................................. 30
Figure 51 PERSONAL VEHICLE
Figure 52 RATING FOR PUBLIC TRANSPORT ......................................................... 30
Figure 53 MODAL SPLIT
Figure 54 OWNERSHIP ................................................................................................. 31
Figure 55 OWNED OPERATIONAL COST
Figure 56 RENT OPERATIONAL COST...................................................................... 31
Figure 57 TYPE OF VEHICLE ..................................................................................... 32
Figure 58 TRAVEL DISTANCE
Figure 59 TRAVEL TIME .............................................................................................. 32
Figure 60TRAVEL COST
Figure 61 TRIP FREQUENCY ...................................................................................... 33
Figure 62 REASONS FOR NOT USING PUBLIC TRANSPORT ............................... 33
Figure 63 MONTHLY INCOME
Figure 64 MONEY VALUE FOR 10 MIN .................................................................... 34

iv
iv
List of Abbreviations
BRT Bus Rapid Transit
CBD Central Business District
HUDCO Housing and Urban Development
Corporation Ltd.
HSMI Human Settlement management
Institute (Research and Training
Wing of HUDCO)
IPT Intermediate Public Transport
LMC Last-Mile Connectivity
MoUD Ministry of Urban Development
MRTS Metro Rail Transit System
NMT Non-Motorized Transport
NUTP National Urban Transport Policy
PT Public Transport

1
1. INTRODUCTION
The rapid growth of India’s urban population has put enormous strains on urban transport
systems. It is triggering to grow travel demand in urban cities especially in mega and
metropolitan cities. Efficient public transportation system results in commuters taking
multiple trips and longer trips in a day, thus increasing the load of this system. To bring
efficiency in a network, an integrated and multi-model approach needs to be prepared and
followed. Otherwise, full potential of a network is often not utilized. Like in the present day
metro system, which is overcrowded in certain sections and unable, to get estimated
ridership in many other sections (Tiwari and Advani, 2005).
Moreover, the public ownership and performance of most public transport services has
greatly reduced productivity and inflated prices. Unfortunately, meager financial support and
the utter deficiency of any supportive policies, such as traffic priority for buses, place public
transport in an almost impossible situation. India’s cities desperately need an improved and
expanded public transport service by mixing different modes and effective transfers. This
way optimization of the public transport system can be reached.
By 2051, the population of India is expected to be 1.7 billion. The number of cities with a
population of more than 50 million people is expected to double. There will be 15 cities with
populations in excess of 10 million each and 85 cities with populations between 1 and 10
million. That is the challenge India is confronted with. A recent study by Ministry of Urban
Development (MOUD), Government of India, indicates that daily trips in the top 87 urban
centres are anticipated to become more than double from 228 to 482 million in 24 years
(2007–2031).
Hence, improving public transport is a critical component to bring efficiency in the
performance of the city's transport system, improve quality of life for the city’s growing
population and building city’s economic competitiveness.
1.1 Public Transportation in Indian Scenario
The vehicular growth in Indian cities is increasing at a tremendous speed. It is rather
alarming to note that during the period 1961 to 2011, while the number of cities in India
increased three fold (from 2,363 in to 7,935) and the population increased 5 times (from 79
million to 377 million), the vehicular population marked a whopping increase of
approximately 200 times (from 0.7 million to 142 million) (CSE, 2013). Of this, larger
cities including metro and mega cities constitute the maximum share, with Delhi taking a
clear lead.
Auto rickshaws supply figures in Indian cities indicates that major metro cities exhibit a
higher portion of auto rickshaws ranging between 7 – 13 auto rickshaws per 1000
population, compared to smaller cities supply ranging between 0.3 to 2 auto rickshaws per
1000 population (Wilbur Smith, 2007).
A report drafted in 2008 by Mirabilis Advisory says, “In larger cities, the proportion of
people using conventional public transport was high, and consequently commuters walked
the last mile”. “For example, in cities with more than 8 million population: 22 percent

2
walked all the way, 8 percent used cycles and 44 percent used public transport. This totals
up to 74 percent of people who rely on non-motorized transport for at least part of the
commute,” the report states.
In the Indian context, the size of the city and the percentage of urban trips served by
public transport are directly linked. Hence, larger the city higher is the average share of
public conveyance. So according to this, 30 percent of urban trips are attended by the public
transport in cities with population between 1 and 2 million, whereas it’s 42 percent in urban
centers with populations between 2 and 5 million, and 63 percent in urban centers with
populations over 5 million (Source: Census 2011). Hence, it can be concluded that the rapid
growth of large cities results in a further increase in the future demand for public transport in
India.
In India, main focus on the transportation sector was primarily directed towards
metropolitan cities as these cities were in priority for political and administrative structure,
which resulted in very few studies for small and medium towns due to their low priority. As
a result, the transport planning for small and medium towns got neglected and adhoc.
Table 1: Modal Split in Indian Cities as a % of Total Trips
City Population Walk Cycle Two Wheelers Car Public Transport IPT Total
< 5 lakhs 34 3 26 27 5 5 100
5 – 10 lakhs 32 20 24 12 9 3 100
10 – 20 lakhs 24 19 24 12 13 8 100
20 – 40 lakhs 25 18 29 12 10 6 100
40 – 80 lakhs 25 11 26 10 21 7 100
> 80 lakhs 22 8 9 10 44 7 100
Source: W. Smith Association, MOUD, GOI, (2008).
The Indian cities are classified in six categories for transport studies, by Ministry of Urban
Development, based on their population and travel behavior patterns.
Source: Source: Census 2011)
Figure 1 Urban Trips in Indian Cities based on City Size
3
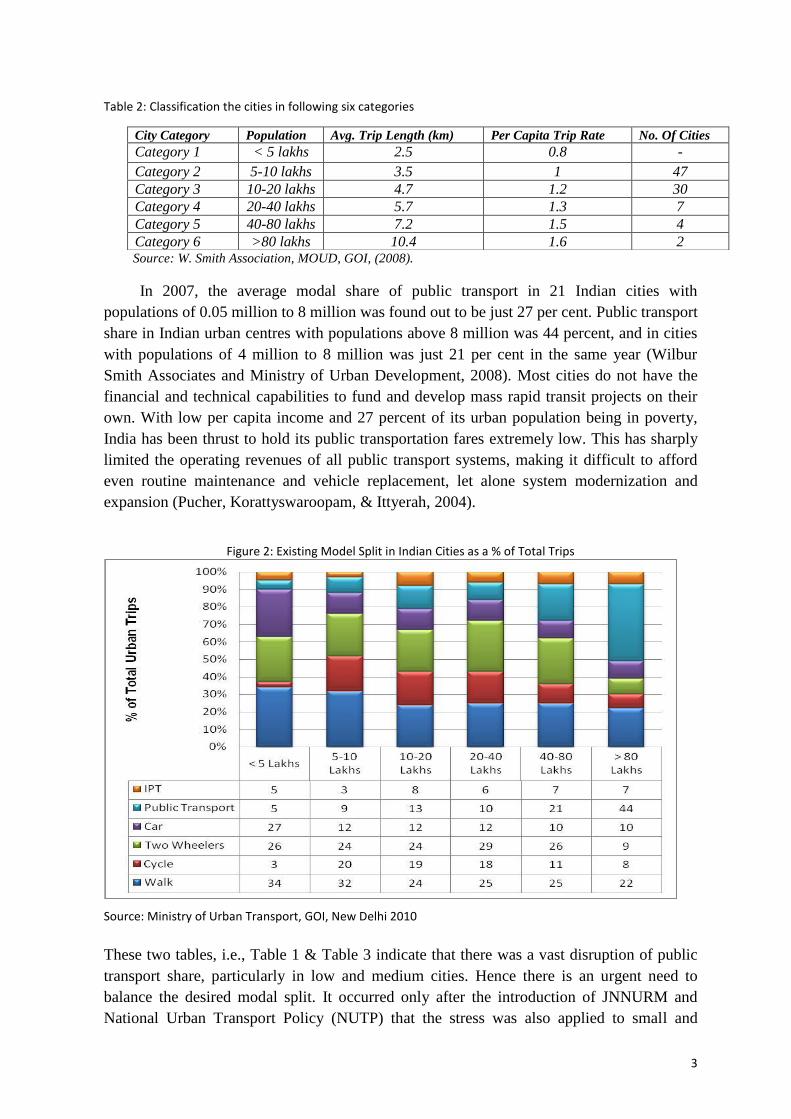
Table 2: Classification the cities in following six categories
Source: W. Smith Association, MOUD, GOI, (2008).
In 2007, the average modal share of public transport in 21 Indian cities with
populations of 0.05 million to 8 million was found out to be just 27 per cent. Public transport
share in Indian urban centres with populations above 8 million was 44 percent, and in cities
with populations of 4 million to 8 million was just 21 per cent in the same year (Wilbur
Smith Associates and Ministry of Urban Development, 2008). Most cities do not have the
financial and technical capabilities to fund and develop mass rapid transit projects on their
own. With low per capita income and 27 percent of its urban population being in poverty,
India has been thrust to hold its public transportation fares extremely low. This has sharply
limited the operating revenues of all public transport systems, making it difficult to afford
even routine maintenance and vehicle replacement, let alone system modernization and
expansion (Pucher, Korattyswaroopam, & Ittyerah, 2004).
Figure 2: Existing Model Split in Indian Cities as a % of Total Trips
Source: Ministry of Urban Transport, GOI, New Delhi 2010
These two tables, i.e., Table 1 & Table 3 indicate that there was a vast disruption of public
transport share, particularly in low and medium cities. Hence there is an urgent need to
balance the desired modal split. It occurred only after the introduction of JNNURM and
National Urban Transport Policy (NUTP) that the stress was also applied to small and
City Category Population Avg. Trip Length (km) Per Capita Trip Rate No. Of Cities
Category 1 < 5 lakhs 2.5 0.8 -
Category 2 5-10 lakhs 3.5 1 47
Category 3 10-20 lakhs 4.7 1.2 30
Category 4 20-40 lakhs 5.7 1.3 7
Category 5 40-80 lakhs 7.2 1.5 4
Category 6 >80 lakhs 10.4 1.6 2
4
medium towns, also especially in public transport sector. The basic emphasis was to
increase the public transport share and change in ridership, so that the various problems like
congestion, pollution and accidents can be minimized in such urban centers as they
experience rapid development due to urbanization and industrialization.
Table 3: Desirable Modal Split in Indian Cities as a % of Total Trips
City Population (in millions) Mass Transport Bicycle Other Modes < 5 lakhs 30-40 30-40 25-35 5-10 lakhs 40-50 25-35 20-30 10-20 lakhs 50-60 20-30 15-25 20-50 lakhs 60-70 15-25 10-20 50 lakhs + 70-85 15-20 10-15
Source: Ministry of Urban Development, Government of India, New Delhi (1998)
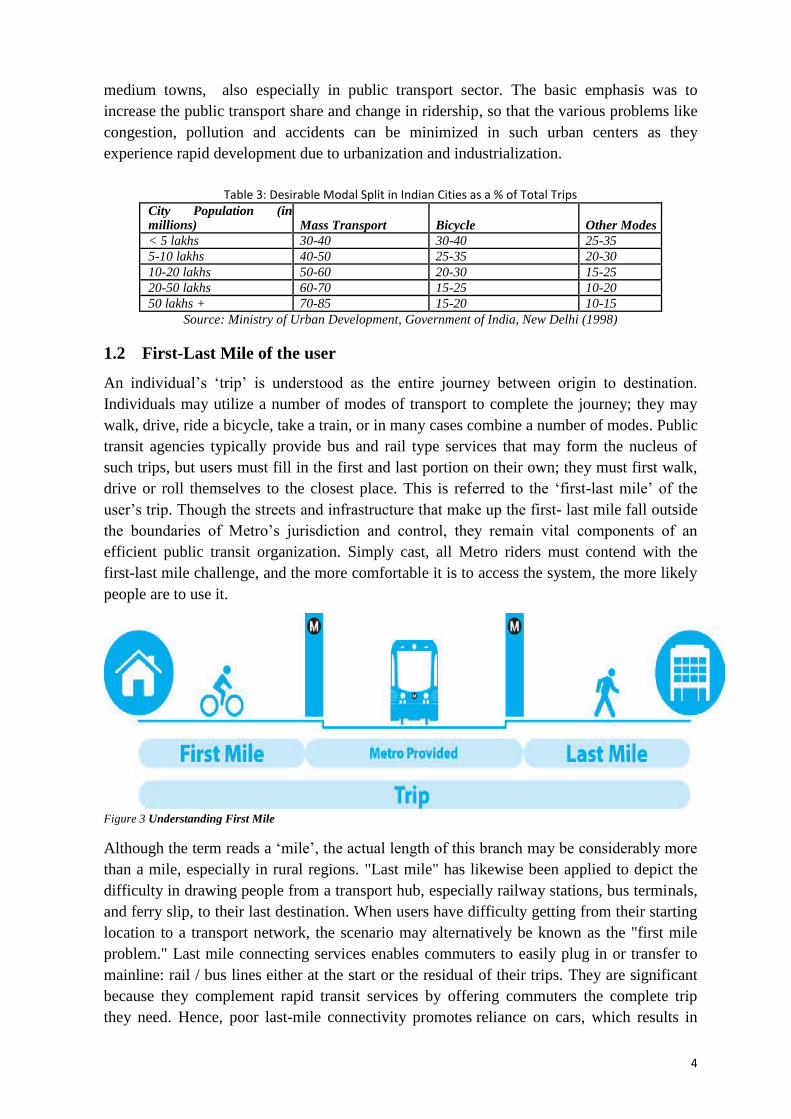
1.2 First-Last Mile of the user
An individual’s ‘trip’ is understood as the entire journey between origin to destination.
Individuals may utilize a number of modes of transport to complete the journey; they may
walk, drive, ride a bicycle, take a train, or in many cases combine a number of modes. Public
transit agencies typically provide bus and rail type services that may form the nucleus of
such trips, but users must fill in the first and last portion on their own; they must first walk,
drive or roll themselves to the closest place. This is referred to the ‘first-last mile’ of the
user’s trip. Though the streets and infrastructure that make up the first- last mile fall outside
the boundaries of Metro’s jurisdiction and control, they remain vital components of an
efficient public transit organization. Simply cast, all Metro riders must contend with the
first-last mile challenge, and the more comfortable it is to access the system, the more likely
people are to use it.
Figure 3 Understanding First Mile
Although the term reads a ‘mile’, the actual length of this branch may be considerably more
than a mile, especially in rural regions. "Last mile" has likewise been applied to depict the
difficulty in drawing people from a transport hub, especially railway stations, bus terminals,
and ferry slip, to their last destination. When users have difficulty getting from their starting
location to a transport network, the scenario may alternatively be known as the "first mile
problem." Last mile connecting services enables commuters to easily plug in or transfer to
mainline: rail / bus lines either at the start or the residual of their trips. They are significant
because they complement rapid transit services by offering commuters the complete trip
they need. Hence, poor last-mile connectivity promotes reliance on cars, which results in

5
more traffic congestion, pollution, and urban sprawl. The person’s reverse trip is also an
important aspect of last mile connectivity. A reverse trip can vary from the initial trip
because of the time of day, traffic, time of year and several other elements.
Often last mile connectivity is synonymous with feeder services. Still, it implies much more
than simply a feeder service; it comprises:
Easy availability of mode and options.
The time and cost incurred in the last mile.
Ease of changing between modes.
Ease of walking/cycling to/from stops/ stations.
1.3 Need for the Study
The prospect of providing economical and convenient “Last Mile Connectivity”
(LMC), that is, from the trip ends to the point of accessing a public transport system, is an
area of much neglect in Indian cities, including Delhi. While feeder services do exist for
metro, their services are limited to a few and selective places. The respite of the demand is
mainly met through Intermediate Public Transport (IPT) such as auto rickshaws (that
sometimes cost more than fifty percent of the entire price of the journey) or through cycle
rickshaws, which are again expensive and confined to certain regions. There remains a lack
of diligent efforts towards integrating these IPTs with rapid transit systems and optimizing
their potential as an LMC option. The deficiency of adequate walkable and cyclable
environment in the city further accentuates the problem of public transport users.
The important questions that the project report tries to address are: an assessment of
comfort, time, space, cost, incurred in the LMC as a ratio of the total journey for rapid
transportation system users; user preferences and alternatives available, for LMC; and in the
end, whether lack of efficient LMC options is a decisive element in the commuter’s choice
of secret modes and how it involves the overall efficiency of a public transit organization.
1.4 Objective of the Study
The main objectives of the project include the following:
i.) To document the present practices of Last-Mile Connectivity as perceived in existing
public transport systems.
ii.) To evaluate the public transport system in order to identify the missing links for
integrated transportation.
iii.) To assess the role of Last-Mile Connectivity in efficient delivery of a Public
Transportation System.
iv.) To prepare a strategy to strengthen Last-Mile Connectivity with a view to improve
Public Transportation Systems in a particular city.
1.5 Resources and Methodology
Delhi has been selected as the case study region. The urban centre has currently two major
types of transportation systems – metro rail transit system (henceforth, referred to as metro)
and urban bus system. This project intends to discuss findings related to last mile
connectivity in inter-city and intra-city public transport systems. Primary survey was
conducted, covering commuter and non-commuter (including IPT Operators and Private

6
Vehicle Users) categories of commuters. Interviews for the commuter group were conducted
at metro stations on identified metro routes of Delhi. Also offices within a range one
kilometre from metro stations were also be included in the study. The studies will be
conducted on working days during peak hours and non-peak hours. The focal point of the
study was to cover regular trips like work and education trips. Stations chosen for the on
ground survey were HUDA City Centre, Hauz Khas, Laxmi Nagar, Anand Vihar ISBT and
Jahangirpuri Metro Stations.
1.6 Expected Outcomes
The study has been designed with the following outcomes in mind:
To be able to analyze the gaps of Last-Mile Connectivity in public transport service
delivery and its impact on overall ridership of a transit system on varied indicators
such as accessibility, affordability, last mile connectivity, etc.
To address the issue of last-mile connectivity in depth with a case study based
approach including primary data collection and analysis to make public transport
comfortable and seamless for its users with integration of private and public modes
of transport.

1
2 LITERATURE STUDY
2.1 Access And Egress
According to Hoogendoorn-Lanser et al. (2006) the access trip is “the trip part from the
origin to the boarding railway station” whereas the egress trip is “the trip part from the
alighting railway station to the destination”. It is evident that these definitions consider the
train as the main mode in the transport chain and are as such not useful for our purpose.
Notwithstanding the above, the complexity of analysing and modeling multi-modal travel
necessitates a more universal and more flexible definition regardless of the main mode used.
The definitions used in this study for access and egress trip are as follows:
The access trip of the multi-modal transport chain is the trip part from the trip origin to the
first entry point of the public transport system. and
The egress trip is then defined as the trip part from the point of alighting the last public
transport leg to the final destination. It is therefore also implied that within the PT system,
different modes may occur, such as bus and Bus Rapid Transit (BRT). This distinction is
necessary, in order to model the transport chains correctly at a later stage.
2.2 Multi-Modal Trips
When one refers the integration of two or more modes (PT and NMT), the concept of
multimodal trips emerges. Therefore, before discussing last mile connectivity further, first
the concept of multimodality is discussed.
According to Van Nes (2002) a multimodal trip is “when two or more different modes are
used for a single trip between which the traveller has to make a transfer”.
According to Hoogendoorn-Lanser et al. (2006) a multimodal trip is “a trip when it involves
at least one transfer between – not necessarily different – mechanized modes”.
It is interesting to have a look at the position of walking in these definitions. Van Nes (2002)
assumes that walking is a universal component at the start and at the end of any trip and
therefore a trip in which walking is the mode for access and egress is not considered a
multimodal trip. HoogendoornLanser et al. (2006) only consider mechanised modes in their
study neglecting not only walking but also cycling as access and egress modes.
Walking, however, is not only a mode of transport in itself, but it is also an important
complementary mode of all motorised modes. In many developing countries people walk
long distances and walking has a high share in modal split (Vasconcellos, 2001). Even
private modes require people to walk to their vehicles and PT trips often require
considerable walking at the access and/or egress end. Considering walking as a transport
mode could potentially make all trips multimodal, as always some walking is involved. This
would render a definition that is pretty useless as a universal definition. In the current study,
we are looking at Last mile connectivity in particular. Here, the importance of walking in
combination with cycling and PT in integrated transport chains compels us to include it as a

2
separate mode. For the purpose of this study, walking is therefore considered a transport
mode in itself. A trip that involves walking can therefore be considered a multi-modal trip.
The notion of main mode is not necessarily made explicit, as this presents no further benefits
in the modelling stage. This brings us to the concept of trip chain.
A useful definition for trip chain is provided by Rietveld et al. (2001) who defines a trip
chain as “an ordered sequence of trips where the endpoint of each trip is equal to the starting
point of the subsequent trip in the chain. The starting point of the first trip is the starting
point of the chain, and the endpoint of the last trip equals the endpoint of the chain”. The
illustrated Figure 3 has been used to understand the concept of of the multi-modal transport
or trip chain.
Figure 4: Multimodal transport chain, access and egress trips representation
Source: Integrating Non-motorized Transport to Public Transport, 2009
2.3 Different Modes of Connecting Last Mile
The type of mode opted for going the last mile, varies at the initial (origin to metro O-M)
and the final (metro to destination M-D) legs of the overall journey, with an exception of
those commuters who opt for walking in the O-M section. Approximately 60% of the
commuters, who walk while reaching the boarding metro station, also opt for the same while
reaching the destination from the metro station.
In general, there are four distinct types of feeder modes in Indian cities: Non-motorized
modes (i.e. walking, cycling), intermediate public transport (i.e. auto-rickshaws, taxis),
shared-ride services (i.e. shared taxis, shared auto-rickshaws) and buses.
2.3.1 Walking
Walking distances vary based on route and trip qualities (such as type of transit
service, transfers and wait time), as well as personal, household, and neighborhood
characteristics. A service area around a transit station or stop is broadly defined as the area
from which potential riders are drawn. Delineating the service area around public transit
stations is a complex and important issue, and is used to determine optimal stop spacing,
identify redundancy and gaps at the route and system levels, and understand and predict
demand for transit.
In Calgary, Canada, Lam and Morrall (1982) observed a median walking distance to bus
stops of 292 m, while the average was 327 m and the 75th percentile, 450 m. Studying
walking distances to rail transit stations in Portland, WA, and San Francisco, CA,
Schlossberg and his collaborators found a median distance of 0.47 miles (756 m)
(Schlossberg et al. 2007). While Daniels and Mulley (2013) found the mean walking
distance to bus service 461 m with 75th percentile at 566 m.
The 85th percentile walking distance to bus transit service is around 524 m from home-
based trip origins, 1,259 m for commuter rail. This finding raises the importance of careful

3
revision of the 400- and 800-m service area rules used in the transit industry. El-Geneidy
Grimsrud (2013) found that Riders walk about 13 m farther for work trips than other types
of trip purposes, again possibly reflecting overall time budgets. Conversely, they walk about
9 m less during the AM peak, when work trips are most frequent, than at other times of day,
probably due to additional services available at such hours such as frequent buses on
otherwise infrequent routes. Males walk about 12 m longer than females and walking
distances decrease by about ½ meter for each year increase in age.
2.3.2 Bicycle as a Feeder
Bicycle is an accessible, low-cost, non-polluting and healthy mode of travel. One of the
ways to promote bicycling is to encourage its use for making access and egress trip of public
transit services. Bike-and-ride refers to the combined use of the bicycle and public transport
for one trip. The combination can take different forms: trip-makers can use the bicycle as a
feedering mode for access trips (at the home-end of a trip), for egress trips (at the activity-
end of a trip), or for both. Average walking speed is approximately 1.2 m/sec and average
bicycling speed is approximately 3 times higher than the walking speed i.e. 3.6 m/sec.
Therefore, use of bicycle as an access trip makes significant addition in catchment area of
public transit service, and time savings to individual users.
Bike-and-ride has recently gained attention as part of the wider search for multimodal
alternatives for the private car (Hine and Scott, 2000; Gorter et al., 2000). The attractiveness
of bike-and-ride lies in its potential to solve one of the key problems of public transport: the
accessibility of stations and stops. As a feedering mode, the bicycle is substantially faster
than walking and more flexible than public transport. The combined use of bicycle and
public transport could thus be a relatively competitive alternative to the private car (e.g.
Keijer and Rietveld, 2000; Brunsing, 1997).
Research work was conducted by Advani and Tiwari (2006) on BICYCLE AS A
FEEDER. In this on board commuter survey was done in Delhi, dividing it into 5 zones on
130 different routes out of total 650 routes of local Public transport service of Delhi. Around
4000 commuters were interviewed for their full trip profile including access and egress time,
cost and mode. A pre-designed survey form was prepared and whole survey was carried out
by trained surveyors and administered. This study shows that the people owning bicycle are
not using it for their access trip. The reason behind this can be
(1) absence of parking facility at bus stops,
(2) short distance from their origin to bus stop,
(3) lack of safe cycling facility along the road.
The study showed that 43% among bicycle owners walk less than or equal to 500m, 48%
walk more than 500 m but less than 1km and 9% walk more 1 km distance. Accepted
walking distance to access the public transit is 500 m, in the present case 58% commuters
have to walk more than acceptable walking distance of 500 m to reach at their bus stop. If a
bicycle friendly infrastructure is created, these 58% commuters can shift to bicycles. This
would reduce travel time by approximately 33% without any additional cost investment out
of the total selected sample of 3632, 711 persons (20%) own bicycle. 652 (18% of total)
have 1 bicycle and 58 (2% of total) have 2 bicycles at home. However, only 6 (0.15%)
persons out of total 3632 are using bicycle for access trip to bus.
4
2.3.3 Cycle Rickshaw
The cycle rickshaw is a local means of transport and also known as pedicab, cyclo, or
trishaw in different part of the world. Cycle rickshaws in the present day scenario are acting
as service providers and access and dispersal modes to MRTS in various stations in Delhi.
Despite their potential role as an access and dispersal mode they are faced to biases in
planning and policy decisions largely owing to lack of an understanding of their
characteristics, contributions and constraint.
Metro user and Cycle rickshaw user surveys were carried out by Gupta and Agarwal
(2008) to assess the role of cycle rickshaws as a feeder mode. . Amongst the cycle
rickshaws users travelling it were observed that females dominate the usage of cycle
rickshaws for reasons of convenience, availability, comfort etc. Cycle rickshaw users are
maximum in the age group of 15-25 yrs (28%) followed by 25-35 yrs (20%).The users are
normally educated and belong to middle to higher income levels with monthly incomes
varying between Rs.15000- 25000 per month. It can be observed that walk and cycle
rickshaws are the major access and dispersal modes at metro stations. While walk constitute
59% of the total access and dispersal trips, cycle rickshaw serves 24% of the total metro
feeder travel demand to and from metro stations. The operational area of cycle rickshaws
varies between 1.4 km to 2.2 km. with the overall weighted average trip length of 1.72 km.
which indicates that it serves short distance commuting needs of its users
2.3.4 Feeder Bus
Feeder bus is a desirable option for passengers that live further than walking distance to
transit stations, especially for those who do not have private vehicles or cannot afford cost of
parking at transit stations. Comparing to park-and-ride, feeder bus generate less traffic
congestion and emissions. However, providing feeder bus service is costly when it has to
time-competitive with cars, especially in low-density areas where number of passengers is
low (TCRP, 2009).
XIE ,GONG AND WANG (2010) offers an all new choice to improve the final leg
connectivity of the transportation system. The shuttle buses operate in short circular routes,
linking the rapid transit stations/stops and the office buildings, residential houses, apartment
buildings and many other sites in local areas together. Buses of smaller sizes are used for
these lines not only to avoid the congestion, but also to serve in a short interval of less than 5
minutes Based on the detailed statistics of the population of local areas and the street-level
traffic data, an innovative layout of the local shuttle bus system is discussed, based on the
multiple-route, maximal-covering/shortest-path (MSMCSP) model. The models are applied
to the local shuttle bus routes in Hepingli area of Dongcheng District, Beijing. Results show
that it is possible to improve the efficiency, convenience and comfort of the public transit
system by the application of the local shuttle bus system theory
2.4 Sustainable Urban Transport in India (Role of the Auto-Rickshaw Sector)
Since the introduction of auto-rickshaws in India in the late 1950s, these vehicles have
become an essential facet of urban mobility for millions of people. Auto rickshaws play a
critical and vibrant role in India’s urban transport schemes. Yet they also represent a very
improvisational and increasingly inefficient sector – and they are getting lost in the

5
switching dynamics of urban mobility in India. Today, with increasing urban populations,
there is growth in demand for urban transport, growth in private motorization and a decline
in public transport share. How do auto rickshaws fit in and sustain a role that is efficient –
for both the operators and their passengers? And how can these three-wheeled wonders
contribute to urban transport sustainability – through both reductions in emissions and safety
for everyone on the roads? These are the questions that are needed to be addressed in recent
transportation system management in a developed nation like India.
As the need for urban transport increases in India, so likewise does the popularity of the
auto-rickshaw. Production of this type of motorized three-wheeler has doubled between
2003 and 2010. In major Indian metropolises, it is responsible for a substantial share of
motorized trips. Schemes to better urban transport must include a policy vision for this
increasingly significant sector. To that goal, this report examines the role the auto-rickshaw
sector can act in encouraging sustainable urban transport in India. It prepares a policy vision
for this sector and presents recommendations on reforms to address sustainability
challenges.
It can be found from this subject field that auto-rickshaw services in urban centres can help
fulfil the objectives of the Shift strategy of encouraging public transport and reducing
private motorization based on the following aspects:
Last mile connectivity to public transport: Auto-rickshaw services, mixed as a
feeder mode, providing such connectivity, can complement public transport systems
by assuring that all sections of the city have easy access to public transport stations.
A door-to-door transport alternative to private motor vehicles: The door-to-door
on-demand service provided by auto-rickshaws will ensure that transportation needs
requiring door-to-door connectivity, such as occasional trips to the airport or
emergency trips for health care can be gathered in cities without having to rely on
private motor vehicles.
The Avoid-Shift-Improve (ASI) framework, one of the key approaches to improving the
sustainability of urban transport systems, underpins this study. ASI sees “sustainability” in
conditions of cutting greenhouse gas emissions, improving energy efficiency, cutting traffic
congestion, and protecting public health and safety by encouraging alternatives to the private
automobile, among other strategies (Bridging the Gap 2011). The ASI framework is based
on three key strategies: avoid unnecessary trips, shift to more sustainable transport modes,
and improve performance in all modes (Dalkmann and Brannigan 2007). While the Avoid
strategy must be pursued on the demand side, through better urban planning and land use
policies, both the Shift and Improve strategies of the ASI framework are relevant to
evaluating the use of the auto-rickshaw sector in encouraging sustainable urban transport.
The policy vision for the auto-rickshaw sector should recognize its role in promoting
sustainable urban transport.
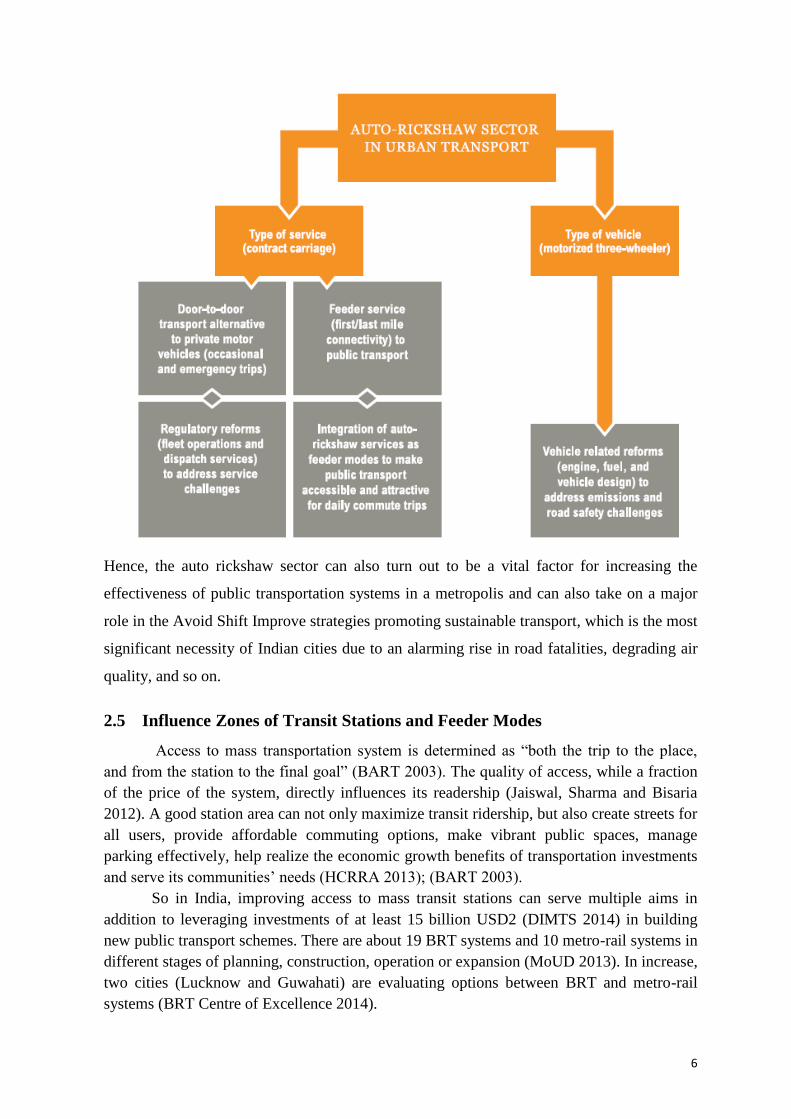
Figure 5: Policy Vision for Auto-Rickshaw Sector in Cities
6
Hence, the auto rickshaw sector can also turn out to be a vital factor for increasing the
effectiveness of public transportation systems in a metropolis and can also take on a major
role in the Avoid Shift Improve strategies promoting sustainable transport, which is the most
significant necessity of Indian cities due to an alarming rise in road fatalities, degrading air
quality, and so on.
2.5 Influence Zones of Transit Stations and Feeder Modes
Access to mass transportation system is determined as “both the trip to the place,
and from the station to the final goal” (BART 2003). The quality of access, while a fraction
of the price of the system, directly influences its readership (Jaiswal, Sharma and Bisaria
2012). A good station area can not only maximize transit ridership, but also create streets for
all users, provide affordable commuting options, make vibrant public spaces, manage
parking effectively, help realize the economic growth benefits of transportation investments
and serve its communities’ needs (HCRRA 2013); (BART 2003).
So in India, improving access to mass transit stations can serve multiple aims in
addition to leveraging investments of at least 15 billion USD2 (DIMTS 2014) in building
new public transport schemes. There are about 19 BRT systems and 10 metro-rail systems in
different stages of planning, construction, operation or expansion (MoUD 2013). In increase,
two cities (Lucknow and Guwahati) are evaluating options between BRT and metro-rail
systems (BRT Centre of Excellence 2014).

7
Still, station areas in India have yet to be perceived as places of connectivity, i.e. where
large masses of people interact with multiple styles of transport, and as homes for living,
exercising and recreation. In fact, these mass transit organizations are being introduced
within the poor quality NMT infrastructure, characterized by a lack of safety, protection,
comfort and convenience (Tiwari and Jain 2013). With 140,000 deaths in India per year due
to road traffic.
Crashes (NCRB 2011), road safety pose a grave concern for non-motorized transport
(NMT) commuters. For example, pedestrians, bicyclists, and motorized two-wheeler riders
constituted 60–90 percent of all traffic fatalities in the urban centres of Mumbai, Delhi, Kota
and Vadodara (Mohan and Tiwari 2000). In Bengaluru, pedestrians accounted for about 51
percent of the total road traffic deaths (NIMHNS 2009).
Information from the Netherlands suggests that, (a) ridership starts declining from a
distance of approximately 150 m and beyond, and (b) 500 m should be considered a
reasonable catchment radius for a walking trip to the station. For the bus, tram and subway
system, mean access and egress times have been found to be 5.9 min of walking, which
transforms to an average length of 393 m to the rail or coach station.
Hence it is correctly pointed out that the quality of public transport is influenced not just
by the character of the primary transport mode, but likewise by the before (access) and after
(egress) modes. Access and egress are the weakest links in a public transport chain. The
interconnectivity of the different modes also becomes important in order to make a trip and
set the availability and convenience of public transport (Krygsman, 2004). Initiatives aimed
at improving access and egress hold potential to significantly cut down public transport trip
time and are inexpensive options compared to the expensive infrastructure and vehicle
enhancement alternatives frequently considered.
Figure 6: Probability Curves for access and egress time for Netherlands
Hence defining a station area influence zone helps in proper planning and implementation of
access and egress modes for smoother transitions and better last mile connectivity. For
example, direct and safe walking connections are most important in close proximity to the
station, where there is often the highest levels of pedestrian activity. Farther away from the
station, bicycle, bus and rickshaw/taxi connections become relatively more important to
ensure convenient access. The station area boundary includes primary zone and secondary

8
zone as shown in Table 4. The catchment area includes the larger feeder area for the mass
transit station.
Table 4: Defining station area influence zones with accessibility considerations
Zone Description Accessibility Considerations
Primary
Zone
Includes the transit
station and immediate
access routes
Generally within 5 minutes or 150m-
250m of the station exits;
The zone must prioritize pedestrian
and cycling access and transfer to
feeder bus, auto-rickshaws and
taxis;
Care must be taken to manage
conflicts between different modes.
Secondary
Zone
Includes the area and
major destinations
around the station,
which can be accessed
by walking and cycling.
An intermediate tertiary
zone maybe considered
beyond the secondary
zone when prioritizing
cycling access.
Direct, safe walking and cycling
connections are most critical and
are to be prioritized.
500m - 750m is generally adopted
internationally. Since walking
distances in India tend to be longer,
this zone can be larger based on the
station typology or average city-level
walking distances, whichever is
higher.
When delineating tertiary zones, the
cycling trip lengths of the station
area should be considered.
Catchment
Area
Catchment areas
include the broader
area of influence from
the mass transit station.
They provide significant
number of passengers
for regional and city-
level stations.
Access by feeder buses, auto-
rickshaws and cycle rickshaws are
critical for the catchment areas.
The catchment areas vary depending
on the route lengths of feeder bus
services and areas served by auto-
rickshaws and taxis.
Source: EMBARQ India, adapted from (Metrolinx 2011), (BART 2003), (CTOD 2008)
2.6 Public Transportation and Accessibility
Accessibility to opportunities such as usage, training, networking, etc., plays an important
part in the welfare of urban populations, making transport a very important network
infrastructure. This is more important for populations that are naturally and socially
disadvantaged, such as low-income groups, women, the physically challenged, and the
marginal and minority population groups. The disadvantaged populations require access to
opportunities much more than the advantaged groups who, by their class, gender and
through belonging to a majority group, earn admittance to all opportunities in animation.

9
Transport studies and transportation planning hardly reflected upon these bi-focal
perspectives and thus have failed to realize that transport is as much a societal event as it is
technological. Accessible transport opens up chances for disadvantaged and marginal
populations as well as conducing to their capabilities, both of which are significant for the
roles of equity as well as poverty alleviation.
Public transport stations must be near to the source and destination of commuters. Preferably
within 500 m of both family and work. Only road based systems can perform this. Rail
based systems, on an average; usually add another 200-300m of walking inside stations
including staircases. This cuts down the acceptance of rail based systems compared to
surface bus systems, especially for minors, the elderly, health impaired (heart disease,
arthritis, and so on) and the physically handicapped. The latter group can account for 20-
30% of the population on any given daytime.
2.7 Cost to Commuter
Bikes, scooters and mopeds comprise 60-80 percent of motor vehicle fleet in Indian cities. In
a metropolis like Delhi, approximately 60-70 percent of households own a motor vehicle (at
least one car, motorcycle, scooter or moped). This means that motorized two-wheeler
ownership has become possible for the main wage earner of lower middle class families and
college students belonging to middle class families. A household earning around Rs.10,000-
15,000 per month (US$ 200-300) can own a motorised two-wheeler. This is a fresh
development in urban living. When European and North American countries and Japan had
similar levels of income vehicle ownerships were very low and people were impelled to
utilize public transport. With such high levels of vehicle ownership it will be very hard to
attract people to public transport unless the latter is made very convenient and cheap. The
marginal cost of moving a motorcycle or scooter is about Rs.0.50-0.70 per km. It is unlikely
that two-wheeler owners will utilize public transport unless the fare is about the same or less
than the Rs.0.50-0.70 per km. Utilization of a two-wheeler, also gives freedom in mobility,
it is easy to park at home and close to place of employment. Two-wheeler riders can also
negotiate traffic snarls better than auto drivers and can come to the forepart of the line at
traffic lights.
Public transport fares in Indian urban centres cannot be higher than about Rs. 0.50 per
kilometre (2005 prices). Any organization which has operating costs above this amount will
have to arrange for subsidies which are not regressive in nature. Research results indicate
that public transport demand is comparatively sensitive to fare changes, then that policy
measures aimed at fare reduction (subsidization) can take on a significant part in advancing
10
the usage of public transport, thus cutting the utilization of private cars. This rules out the
function of most rail based high cost systems.
2.8 City Profile, Land-use and Public Transportation Relationship
Transport systems and city character are interlinked. Land use characteristics of a city can
regulate the type of transfer system it needs, and once a transport system is set instead, it
influences land use characteristics of the city over time. Thus, the type of public transport
system you want in a city will depend on the vision you hold for the future of your
metropolis. If an economically vital large central business district (CBD) exists, it can turn
the primary core for both employment and retail, and therefore lead to the achiever of an
urban rail system (if the organization serves the CBD) because it can generate and attract
trips onto the scheme. Even so, low-income neighbourhoods would still be unsuitable for
urban rail operation.
Apart from the dependence of the urban trips on public transport based on the city size as
shown in Figure 1, there is also a significant variation in the public transport led urban trips
among cities of the same size class. Nearly 80 percent of all trips in Kolkata are in some sort
of public transport, compared to nearly 60 percent in Mumbai, and 42 percent in both
Chennai and Delhi, as depicted in Figure 2. Differences in land use and roadway supply
explain some of the variance. Delhi and Chennai are lower density, more polycentric, and
more spread out than Mumbai and Kolkata. Kolkata as well has more restricted geographies,
since both are located on peninsulas that channel travel and land-use development in only a
few ways. Such focused travel corridors, especially encourage suburban rail use, as in
Mumbai. Delhi has no such geographic restrictions and sprawls out in all ways. Therefore,
Delhi currently relies mainly on auto rickshaws, motorcycles, taxis, and private cars to do
the multi-destinational, less focused travel patterns of its residents (Pucher, J &
Korattywaroopam, N 2005). So, aside from the city size, the need for the public transport
also depends substantially upon various geographical, transport supply & land use practices
of the city.
Experience from existing rail-based transit systems indicates that they are successful in
utilizing their maximum capacities only when implemented in cities that have the following
characteristics:
High density habitation with at least one major very high density, high rise CBD.
Relatively high per capita income.
Cities with low per capita incomes, together with multiple dispersed business districts are
unable to attract high ridership shares, and so rail based systems do not perform to capacity.

11
Therefore, the size of a city should not be used as a sole criterion for deciding the type of
technology to be used for transit systems.
2.9 Transit-oriented development (TOD)
Urbanization in India has been accompanied by an increase in the use of motorized vehicles.
While transit-oriented development (TOD) have been adopted by some Indian cities to arrest
motorized vehicular use, the direct impact of improved accessibility in increasing public
transport ridership has received less attention.
The UTTIPEC India Defined “Transit oriented development (TOD) is essentially any
development, macro or micro that is focused around a transit node, and facilitates complete
ease of access to the transit facility, thereby inducing people to prefer to walk and use public
transportation over personal modes of transport”.
“Transit-oriented development (TOD) is a type of community development that includes a
mixture of housing, office, retail and other amenities in a walk able neighborhood located
around high-quality public transportation”, as defined by Reconnecting America.
The definitions of TOD made by two countries are similar, while the in-depth meaning of
TOD contains two Primary Goals are to:
i. Reduce/ discourages private vehicle dependency and induce public transport use –
through design, policy measures & enforcement.
ii. Provide easy public transport access to the maximum number of people within walking
distance –through densification and enhanced connectivity.
The above goals cannot be addressed by mere addition of transport infrastructure. To
achieve this paradigm shift, TODs offer attractive alternatives to the use of personal modes –
pleasurable walking experiences, very easily accessible and comfortable mass transportation
with easy, convenient and comfortable intermodal transfers for last mile connectivity and
other low cost, comfortable, non- motorized transportation options.
In addition, highest possible population densities (as per local context), enhanced street
connectivity, multimodal networks around transit stations and compact mixed-use
development providing housing, employment, entertainment and civic functions within
walking distance of the transit system offers:
• An enhanced level of accessibility by non-motorized modes,
• A reduced trip length to the average commuter, and
• Economic viability of the public transportation system through substantial non-fare box
revenues.
This, overall, results in lower levels of energy consumption per person for the city for the
transport sector, besides numerous city/ local level benefits, as explained below. The private
investment and development decisions play a large role in the TOD process. According
some of the successful factors for TOD includes:
Zoning that is altered to ensure that developers can pursue the visions planned
Street design guidance that prioritizes station access for people who bike and walk
Creating typologies and metrics that help find the best places to pursue TOD and
support efforts to change how people access transit
12
Transit-specific bicycle and pedestrian master plans, or integration of access to
transit in bicycle and pedestrian master plans
2.9.1 Benefits of TOD to Delhi:
i. Mobility Options for all - Change the paradigm of mobility by enabling a shift from use
of private vehicles towards the use of public transport and alternative modes. Help in
achieving Clean-Air Quality targets for Delhi and the targeted 70-30 (public-private
transport) modal share in favor of public transportation by 2021, as envisaged in the
Transport Demand Forecast Study for 2021.
ii. Better Quality of Life for All - Provide a variety of high-density, mixed-use, mixed-
income housing, employment and recreation options within walking/cycling distance of
each other and of MRTS stations – in order to induce a lifestyle change towards healthier
living and better quality of life. Integrate communities rather than segregating them and
reduce social stigma and dissent.
iii. Give Everyone a Home - Increase the supply of housing stock and commercial space in
the city, which would bring down prices and make living and working in Delhi more
affordable. (Current Need as per Table 18.1 is to provide approx. 3 lakh new dwelling
units per year, with more than 50% of the new housing in the form of 1 and 2 room units
with average plinth area of about 25 - 40 sq.m.)
iv. Market Participates in Better City - Open up development opportunity to the private
sector to bring in investment into the city’s growth and revenue, and also help cross-
subsidize social amenities, affordable housing and public transport, using a variety of
possible development models. Low-income groups can be provided space and shared
amenities in integrated mixed-income communities, thereby reducing further proliferation
of gentrified slums and unauthorized colonies.
v. Self-Sufficiency - Creating high densities would make decentralized infrastructure
provision and management techniques more feasible, thus making it more economical to
recycle water/sewage locally to meet community needs.
vi. Cheaper Public Transport - Provide a significant source of non-fare box revenue for a
public transport fund, which may help reduce ticket prices and increase provision of
public transport facilities.
vii. Reduce Environmental Degradation - Set a clear vision for the growth and
redevelopment of the city in a compact manner, by minimizing sprawl (low density
spread out development). Help save environmentally sensitive lands and virgin lands
through high-density compact development.
viii. Save Public Money - Provide savings in public money through reduction of
investments in physical infrastructure like additional road expansion, piping/cabling
costs, time-cost of traffic congestion and other larges costs associated with low-density
sprawl.
ix. Multi-disciplinary Multi-Departmental Approach - Provide a shift to a more holistic
paradigm of planning where all sectors work together – mobility, planning policy, urban
design, infrastructure and economics – to deliver integrated development.
Benefits to Transit Agencies:
x. Increased ridership due to larger population living/working within walking distance.

13
xi. Value Capture of increased land values for long term cross-subsidy & maintenance of
public transportation.
Benefits to Land, Road & Service Owning Agencies:
xii. Potentially increased revenue from land due to increased development with lesser public
money investment.
xiii. City level reduced infrastructure costs (reduced length of roads, pipes, cables, tunnels,
etc.) due to accommodating the overall planned population within lesser net land area, a
more sustainable way.
xiv. Increased feasibility for sustainable decentralized physical infrastructure.
xv. Increased and more efficient use shared social infrastructure facilities.
2.9.2 Components of TOD:
1. Pedestrian & Cycle/ Cycle-Rickshaw Friendly Environment
2. Connectivity: Create dense networks of streets and paths for all modes.
3. Multi-modal Interchange: Mass transportation modes servicing the area should be well
integrated to afford rapid and comfortable modal transfers.
4. Modal Shift Measures: Shift to Sustainable Modes by Using Design, Technology, Road
Use Regulation, Mixed-Use, Parking Policy and Fiscal Measures
5. Place making and Safety: Urban places should be designed for enjoyment, relaxation and
equity.
6. High Density, Mixed-Income Development: Compact neighborhoods for shorter
commutes and equity for all sections of society.
2.9.3 Demarcation of the TOD influence zone
1. A maximum up to 2000 m. wide belt on both sides of center line of the MRTS Corridor
is designated as TOD Influence Zone, which has been identified in the combined Zonal
Development Plans of Delhi.
2. The entire influence zone shall be considered as “white zone”. Final boundaries of
Influence Zones shall be demarcated as per the Influence Zone Plans.
3. The overall Influence Zone further consists of three sub zones – Zone 1: Intense TOD
Zone, Zone 2: Standard TOD Zone, and Zone 3: TOD Transition Zone. Application of
zones is as per Table 5 below.
4. Development Control Norms of ‘High Density Mixed Income Development’ shall not
be applicable to the TOD Transition Zone.
5. All properties public or private shall be able to avail the norms and benefits of TOD
while complying to an approved Influence Zone Plan, with the following exceptions:
a. Special Areas - Lutyens' Bungalow Zone, Chanakyapuri, DIZ Area and Matasundari
Area and Civil Lines Bungalow Area which may have height restrictions.
b. Monument Regulated Zones (as per ASI guidelines).
c. Flight funnel zones shall follow the height restrictions as per regulations of Airport
Authority of India.
d. Environmental Protection Zones (as per Chapter 9).
e. Seismic Zones such as fault lines.

14
Table 5: Application of TOD Influence Zones Zone 1: Intense TOD Zone Zone 2: Standard TOD Zone Zone 3: TOD Transition Zone
300 M influence zone of
all MRTS Stations.
800m* (10-min walking)
influence zone of
Regional Interchange
Station (i.e. Rail -MRTS,
or two MRTS lines.)
800m* (10-min walking)
influence zone of all
MRTS Stations.
2000m** (10-minute cycling
distance) influence zone of all MRTS
Stations.
300 M influence zone of BRT
corridors.
Zones within Intense or Standard
TOD Zones which are not permitted
for redevelopment but need
enhancements in public realm and
network connectivity.
Source: UTTIPEC, 2012.
2.10 Station Area planning (SAP)
Station areas need to be defined to understand the influence area of the new transport infrastructure,
achieve its ridership potential and minimize its adverse impacts on surrounding neighborhoods.
A station area is more than just an area adjacent to a transit node. It is a place of connectivity where
different modes of transportation – from walking to riding transit – come together seamlessly and
where there is a concentration of working, living, shopping and playing (Metrolinx 2011). More than
its adjacency to a mass transit station defines a well functioning station area. A station area is
described by the ease and number of connections it offers its users and the multiple activities that
occur here. Table 1 lists a few parameters to classify station areas (EMBARQ India 2014b).
The following 3 stages are identified as critical steps in understanding and defining a station area.
a. Station Area Typology
Station area typology can be identified by the scale of the transit stations, the
predominant land use in the area around it with any special historic or environmental
features (Figure 13).

15
Scale: Refers to the scale of the transit stop and the adjoining area. These can be
classified as regional, city-level, sub-center level, neighborhood and suburban. The
number of people boarding and alighting at the station, function of the station (terminal,
transfer, origin or destination), intersection of transit lines, people density and attractors
Figure 7: Station Area Typology
or generators around the station is indicators of these scales.
Predominant use: Refers to the predominant land use surrounding the station. It can be
classified as commercial-office, commercial-retail, institutional, industrial node,
transport hub, mixed or purely residential neighborhood or a recreational node.
Historic precinct and environment overlays: Refers to historic precincts or
environmental features around the station, which can be preserved and enhanced in the
plan.
b. Station Area Influence Zones
The transportation and land use conditions typically vary with distance from the transit
station. When planning in a station area, it is useful to divide it into zones to scope the
planning exercise and understand the needs and opportunities in each area (Metrolinx 2011).
For example, direct and safe walking connections are most important in close proximity to
the station, where there are often the highest levels of pedestrian activity. Farther away from
the station, bicycle, bus and rickshaw/taxi connections become relatively more important to
ensure convenient access. The station area boundary includes primary zone, secondary zone
and tertiary zones (Figure 4). The catchment area includes the larger feeder area for the mass
transit station. Broad guidelines are suggested to assist in defining the influence zones.
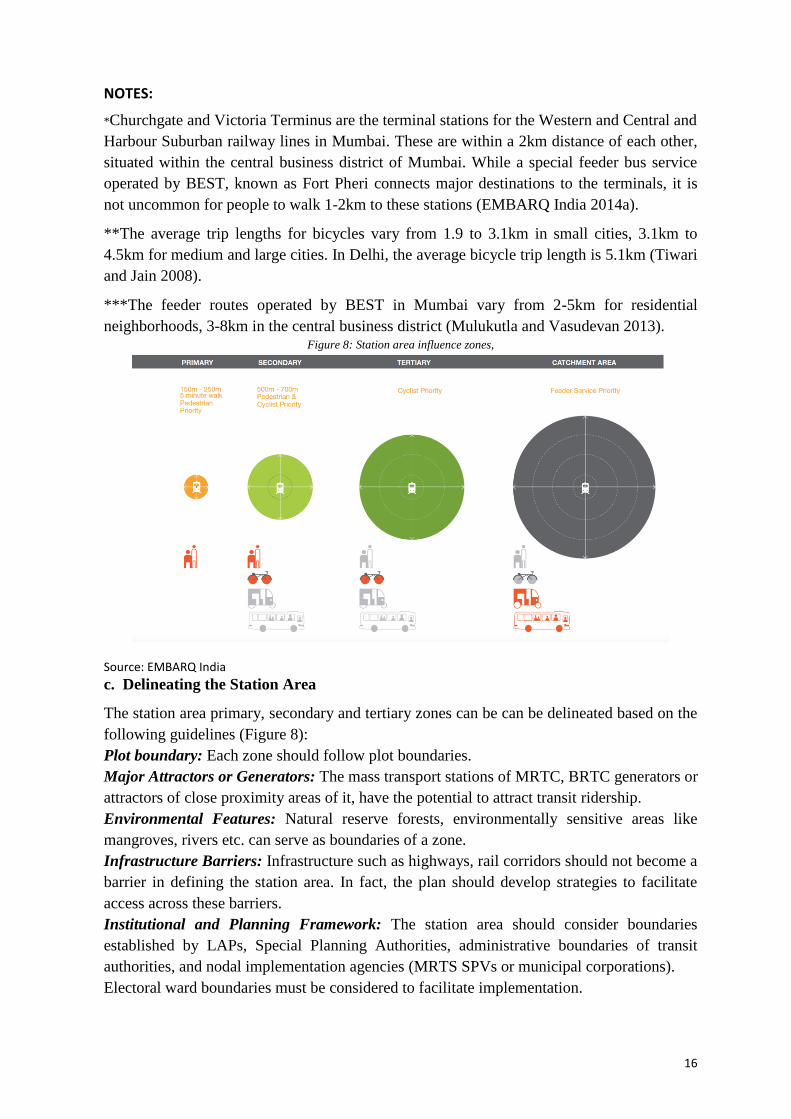
16
NOTES:
*Churchgate and Victoria Terminus are the terminal stations for the Western and Central and
Harbour Suburban railway lines in Mumbai. These are within a 2km distance of each other,
situated within the central business district of Mumbai. While a special feeder bus service
operated by BEST, known as Fort Pheri connects major destinations to the terminals, it is
not uncommon for people to walk 1-2km to these stations (EMBARQ India 2014a).
**The average trip lengths for bicycles vary from 1.9 to 3.1km in small cities, 3.1km to
4.5km for medium and large cities. In Delhi, the average bicycle trip length is 5.1km (Tiwari
and Jain 2008).
***The feeder routes operated by BEST in Mumbai vary from 2-5km for residential
neighborhoods, 3-8km in the central business district (Mulukutla and Vasudevan 2013). Figure 8: Station area influence zones,
Source: EMBARQ India
c. Delineating the Station Area
The station area primary, secondary and tertiary zones can be can be delineated based on the
following guidelines (Figure 8):
Plot boundary: Each zone should follow plot boundaries.
Major Attractors or Generators: The mass transport stations of MRTC, BRTC generators or
attractors of close proximity areas of it, have the potential to attract transit ridership.
Environmental Features: Natural reserve forests, environmentally sensitive areas like
mangroves, rivers etc. can serve as boundaries of a zone.
Infrastructure Barriers: Infrastructure such as highways, rail corridors should not become a
barrier in defining the station area. In fact, the plan should develop strategies to facilitate
access across these barriers.
Institutional and Planning Framework: The station area should consider boundaries
established by LAPs, Special Planning Authorities, administrative boundaries of transit
authorities, and nodal implementation agencies (MRTS SPVs or municipal corporations).
Electoral ward boundaries must be considered to facilitate implementation.

17
Figure 9: Station area delineation
Source: EMBARQ India
2.11 Mode integration
Mode integration in urban trips deals with increasing the ease of ridership through the
establishment of intermodal facilities and connections that ideally would allow people to
reach their destination quicker, with more comfort and at less cost. Given the above, the
potential for the integration of NMT systems to Public Transport (PT) systems. Policies to
promote the use of bicycles as an access mode to PT may generally be targeted at a variety
of groups, depending on the local context:
(i) Current PT users, which would potentially benefit from an improved quality of their
trip.
(ii) Current cyclists that would potentially benefit from increased opportunities to reach
more trip destinations at different distances/travel times, within their travel time
budget.
(iii)Current car users, aiming at providing an attractive trip chain that will induce them to
switch to cycling and PT,
(iv) Potential users of PT that are using other motorized modes such as motorcycles,
scooters etc. And
(v) Pedestrians, which may shift to bicycles in case favorable conditions, are created.
Integration can be studied at different levels of spatial and system hierarchy (both in terms
of facilities at nodal points, the network structure and their interchanges, as well as
positioning of the networks in the urban system).
According to Ibrahim (2003), four types of integration can be distinguished:
1. Physical integration: “seamless” trips with transfer facilities continuously improved
and provided
2. Network integration: different hierarchical levels have to be integrated, and also the
various modes must be connected as well.
3. Fare integration: provision of integrated ticketing system which enables passenger to
use one ticket for any mode
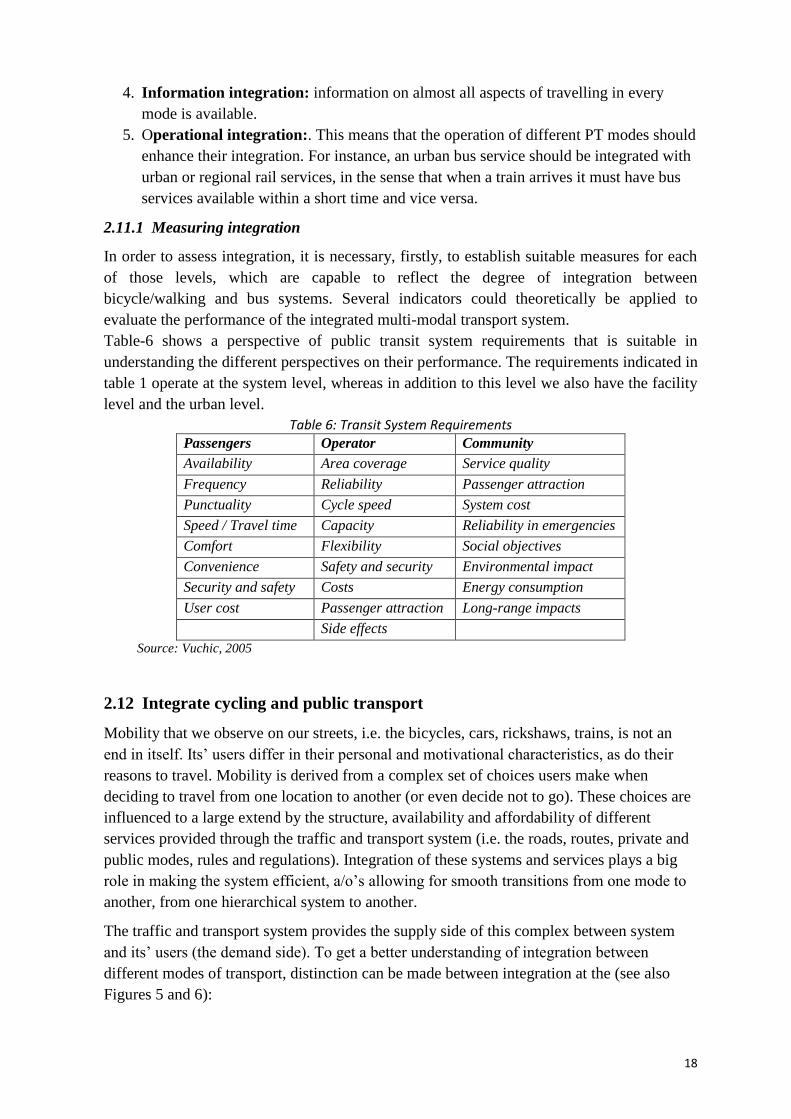
18
4. Information integration: information on almost all aspects of travelling in every
mode is available.
5. Operational integration:. This means that the operation of different PT modes should
enhance their integration. For instance, an urban bus service should be integrated with
urban or regional rail services, in the sense that when a train arrives it must have bus
services available within a short time and vice versa.
2.11.1 Measuring integration
In order to assess integration, it is necessary, firstly, to establish suitable measures for each
of those levels, which are capable to reflect the degree of integration between
bicycle/walking and bus systems. Several indicators could theoretically be applied to
evaluate the performance of the integrated multi-modal transport system.
Table-6 shows a perspective of public transit system requirements that is suitable in
understanding the different perspectives on their performance. The requirements indicated in
table 1 operate at the system level, whereas in addition to this level we also have the facility
level and the urban level.
Table 6: Transit System Requirements Passengers Operator Community
Availability Area coverage Service quality
Frequency Reliability Passenger attraction
Punctuality Cycle speed System cost
Speed / Travel time Capacity Reliability in emergencies
Comfort Flexibility Social objectives
Convenience Safety and security Environmental impact
Security and safety Costs Energy consumption
User cost Passenger attraction Long-range impacts
Side effects
Source: Vuchic, 2005
2.12 Integrate cycling and public transport
Mobility that we observe on our streets, i.e. the bicycles, cars, rickshaws, trains, is not an
end in itself. Its’ users differ in their personal and motivational characteristics, as do their
reasons to travel. Mobility is derived from a complex set of choices users make when
deciding to travel from one location to another (or even decide not to go). These choices are
influenced to a large extend by the structure, availability and affordability of different
services provided through the traffic and transport system (i.e. the roads, routes, private and
public modes, rules and regulations). Integration of these systems and services plays a big
role in making the system efficient, a/o’s allowing for smooth transitions from one mode to
another, from one hierarchical system to another.
The traffic and transport system provides the supply side of this complex between system
and its’ users (the demand side). To get a better understanding of integration between
different modes of transport, distinction can be made between integration at the (see also
Figures 5 and 6):

19
a. Facility level: the nodal interchanges
b. Systems level: the integrated transport system
c. Urban level: the land-use transport system
The mobility pattern of each city is different and so are their solutions. For small and
medium towns, where most of the trips are still being made by walk or NMT, provisions of
planning could include cycle tracks and pedestrian networks. For large cities, which have
long trips, there needs to be a dedicated transport system that integrates various modes. To
effectively coordinate the interaction of various modes and their integration, a city level
transport authority is needed. The authority will have to work on measures like traffic
calming, together with attempting to maximize the transition of commuters from motorized
modes of transport to non-motorized modes and public transport.
2.13 Improving Safe Access To Mass Transit Stations
Access to mass transit is defined as “both the trip to the station, and from the station to the
final destination” (BART 2003). The quality of access, while a fraction of the cost of the
system, directly influences its ridership (Jaiswal, Sharma and Bisaria 2012). A good station
area can not only maximize transit ridership, but also create streets for all users, provide
affordable commuting options, make vibrant public spaces, manage parking effectively, help
realize the economic development benefits of transit investments and serve its communities’
needs (HCRRA 2013); (BART 2003).
The station areas in India have yet to be perceived as places of connectivity, i.e. where large
volumes of people interact with multiple modes of transport, and as places for living,
working and recreation. In fact, these mass transit systems are being inserted within poor
quality NMT infrastructure, characterized by a lack of safety, security, comfort and
convenience (Tiwari and Jain 2013). With 140,000 deaths in India per year due to road
traffic crashes (NCRB 2011), road safety poses a serious concern for non-motorized
transport (NMT) commuters. For example, pedestrians, cyclists, and motorized two-wheeler
riders constituted 60–90 percent of all traffic fatalities in the cities of Mumbai, Delhi, Kota
and Vadodara (Mohan and Tiwari 2000).
Thus in India, improving access to mass transit stations can serve multiple objectives in
addition to leveraging investments of at least 15 billion USD2 (DIMTS 2014) in building
new public transport systems. There are about 19 BRT systems and 10 metro-rail systems in
different stages of planning, construction, operation or expansion (MoUD 2013). In addition,
two cities (Lucknow and Guwahati) are evaluating options between BRT and metro-rail
systems (BRT Centre of Excellence 2014).
The station accessibility projects across the country vary in their approach and area of
intervention see example in Box- 1.
Box 2-1: Station accessibility projects in India
Mumbai: The Station Area Traffic Improvement Schemes (SATIS) were limited to the construction
of 37 skywalks to suburban railway stations. Pedestrian access, buses, intermediate para-transport
services or at-grade street infrastructure were not integrated with the skywalk projects at most
station areas (EMBARQ India 2010). Additionally, the SATIS projects implemented around the
metro-rail corridor limit their intervention to 330m around the station (BEST, Railways & MMRDA

20
plan seamless connectivity with dedicated stops at Metro Stations.” Rail News. 18 March 2014)
and do not address the pedestrian catchment area.
Delhi: interventions have been limited to the provision of feeder bus services (DMRC), and
Bengaluru: Adopted a more holistic approach, that it has initiated a request for proposals (RFP)
for the preparation of station accessibility plans for 10 stations along the Namma Metro system.
There is a Huge need for to tie the different objectives of station areas, to provide improved
connectivity, accessibility, safety, security, economic possibilities and enjoyment for its
users. Thus, EMBARQ India has developed a Safe Access Manual, which focuses on
improving accessibility to mass transit stations. In consonance with the National Urban
Transport Policy (NUTP) (MoUD 2006b), the manual places people at the center and
highlights strategies, guidelines and case studies to achieve pedestrian and cycling priority,
seamless integration with feeder network and infrastructure, improved safety and security,
parking management and an enhanced public realm in station areas. Figure 1 is a guide on
what should be emphasized when preparing a station accessibility plan, how can the plan be
implemented, how can the plan, its implementation and impact be evaluated and what are
the learning’s from different cities.
Figure 10: Safe access approach
Source: EMBARQ, India.
Box 2-2: Indiranagar Metro Station Accessibility Plan, Bengaluru The Bengaluru Metro Rail Corporation Limited (BMRCL), created as a joint venture by the
Government of Karnataka and Government of India, is building the Namma Metro or Bengaluru
Metro Rail. The construction of Phase 1 began in 2007. Reach 1 (6.7km) from MG Road to
Baiyappanahalli Station, is in operation since October 2011 (BMRCL 2011).
The Indiranagar Metro Station Accessibility Plan was prepared by EMBARQ India in partnership
with the Directorate of Urban Land Transport (DULT), and Bruhat Bangalore Mahanagara Palike
(BBMP) in 2011 with the objective to demonstrate a methodology for station accessibility plan
preparation, which could be scaled up to all 40 metro stations along Phase I.
The station area was delineated within 500m of the metro station. It is a predominantly residential
neighbourhood with commercial activities along the main roads and large generators like medical
and educational institutions (Figure 10). The residential population is around 34,0009 (Census India
2000) with an average density of 900 to 1200 persons per hectare.
The pedestrian origin-destination surveys revealed that at least 50 percent of the trips originated or
terminated in Indiranagar. Further, at least 75 percent of the residents, visitors and passers-by felt
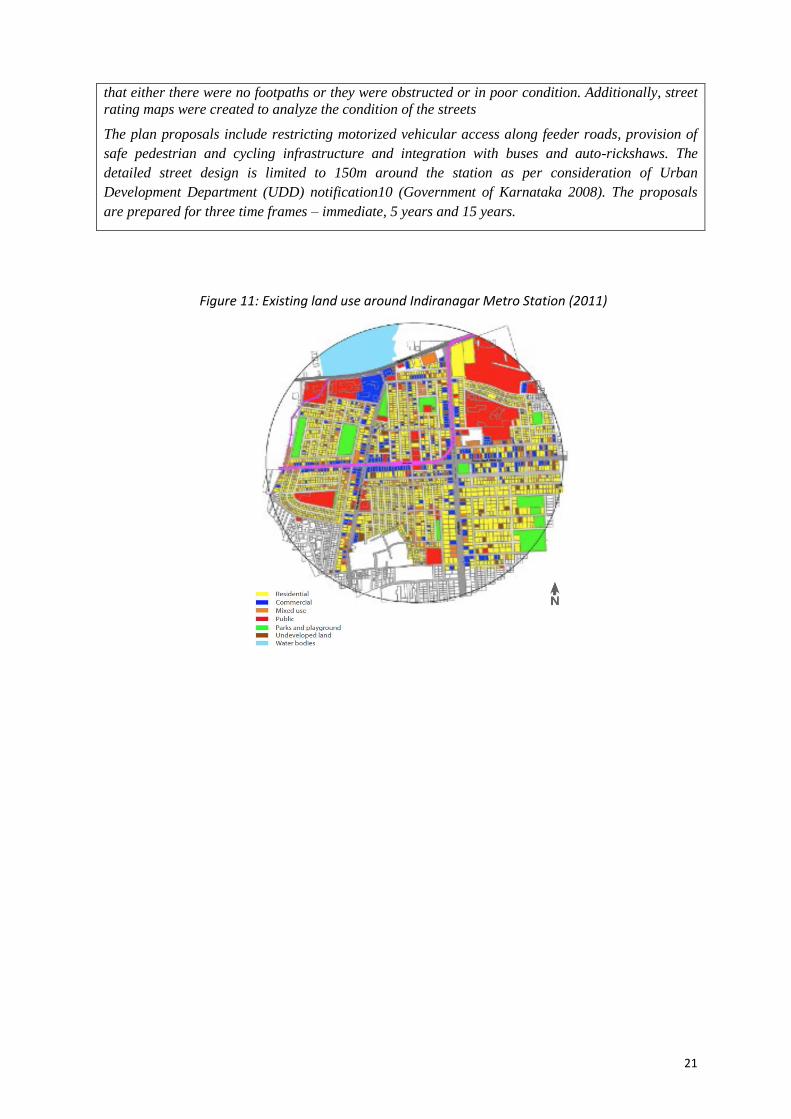
21
that either there were no footpaths or they were obstructed or in poor condition. Additionally, street
rating maps were created to analyze the condition of the streets
The plan proposals include restricting motorized vehicular access along feeder roads, provision of
safe pedestrian and cycling infrastructure and integration with buses and auto-rickshaws. The
detailed street design is limited to 150m around the station as per consideration of Urban
Development Department (UDD) notification10 (Government of Karnataka 2008). The proposals
are prepared for three time frames – immediate, 5 years and 15 years.
Figure 11: Existing land use around Indiranagar Metro Station (2011)
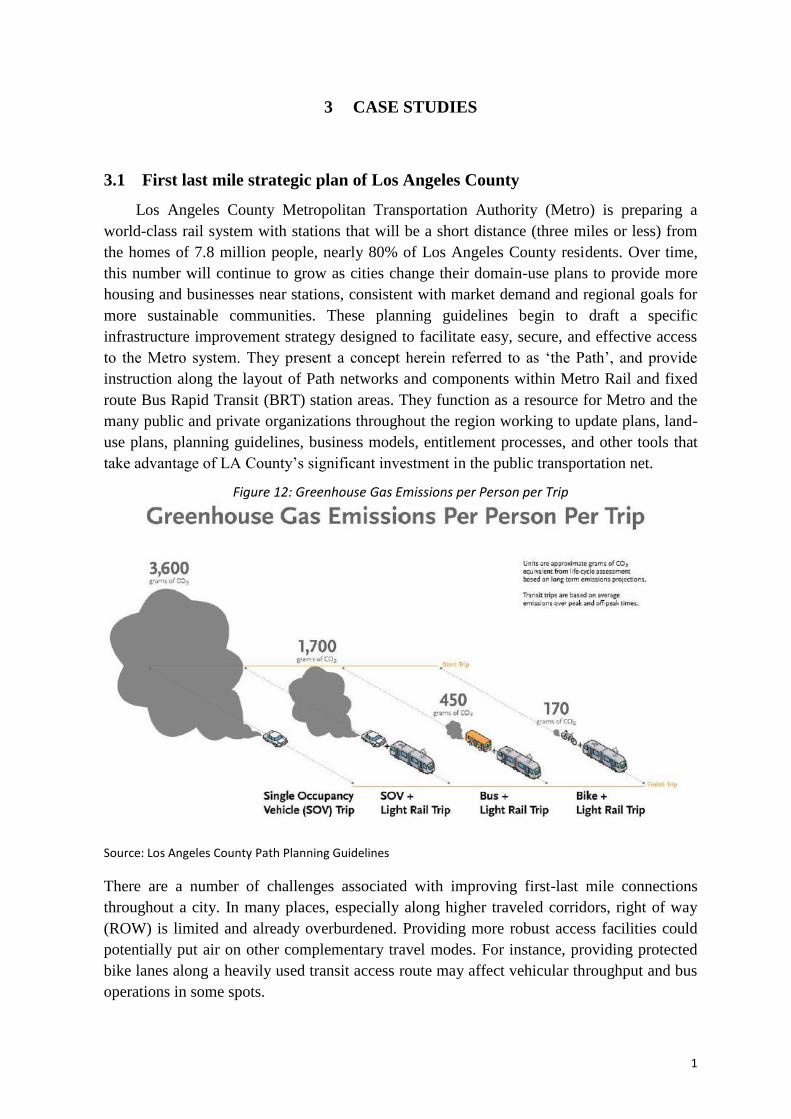
1
3 CASE STUDIES
3.1 First last mile strategic plan of Los Angeles County
Los Angeles County Metropolitan Transportation Authority (Metro) is preparing a
world-class rail system with stations that will be a short distance (three miles or less) from
the homes of 7.8 million people, nearly 80% of Los Angeles County residents. Over time,
this number will continue to grow as cities change their domain-use plans to provide more
housing and businesses near stations, consistent with market demand and regional goals for
more sustainable communities. These planning guidelines begin to draft a specific
infrastructure improvement strategy designed to facilitate easy, secure, and effective access
to the Metro system. They present a concept herein referred to as ‘the Path’, and provide
instruction along the layout of Path networks and components within Metro Rail and fixed
route Bus Rapid Transit (BRT) station areas. They function as a resource for Metro and the
many public and private organizations throughout the region working to update plans, land-
use plans, planning guidelines, business models, entitlement processes, and other tools that
take advantage of LA County’s significant investment in the public transportation net.
Figure 12: Greenhouse Gas Emissions per Person per Trip
Source: Los Angeles County Path Planning Guidelines
There are a number of challenges associated with improving first-last mile connections
throughout a city. In many places, especially along higher traveled corridors, right of way
(ROW) is limited and already overburdened. Providing more robust access facilities could
potentially put air on other complementary travel modes. For instance, providing protected
bike lanes along a heavily used transit access route may affect vehicular throughput and bus
operations in some spots.

2
Coordination is a challenge; there are many custodians of the public realm throughout a city.
Metro is committed to the “continuous improvement of an efficient and effective
transportation system for a city” but Metro does not possess or have jurisdictional control
over transit access routes beyond the immediate confines of station facilities.
Financial support is set; on that point are numerous competing demands on public funds
throughout a city. From a user perspective cost is a challenge; pay-for-service access
solutions can be promising, but do not serve those already struggling to compensate for
basic transit services. There are ranges of site-specific physical challenges faced by
individual transit users. For some, the stations remain too far to access in a fair amount of
time. Others don’t move fast or nimbly enough to comfortably contend with broken
sidewalks and hazardous street crossings. Some are afraid to hit the little walk from stations
in the dark, which again raises safety issues of women passengers in a nation like ours. All
of these challenges can be addressed through thoughtful consideration, strategic planning,
engineering, design and most importantly - active coordination.
3.2 Integration in Public Transportation Systems by Vahid Poorjafari and
Mohammad Poorjafari
The number of urban trips has been increasing dramatically over the past decades. The
main reason for this growth is the change of trip patterns, dispersal of urban activities and
the sharp increase in car ownership and use in cities. The considerable growth of car-based
trips in cities over the past decades has increased the importance of enhancing public
transport as an alternative to compete with cars. Since the diverse public transport modes
(e.g. MRT, LRT, bus, etc.) are being planned and constructed, especially in developing
countries, the necessity of coordination and cooperation of these modes is becoming more
and more critical. However, by considering the daily increment in environmental emission,
specifically air pollution produced by vehicles, and the limitation of natural resources, it is
obvious that increasing of car-based trips is a critical threat to the global environment.
The term of ‘integration’ in public transport or ‘integrated public transport’ is similar to the
concept of intermodal, which is generally used for the transport of goods. This concept is
generally defined as a system that provides seamless (or ideally door-to-door) public
transport services for passengers.
NEA defines integration by further and more comprehensive statement as “ The
organization process through which elements of the passenger transport system (network
and infrastructure, tariffs and ticketing, information and marketing, etc.) are, across modes
and operators, brought into closer and more efficient interaction, resulting in an overall
positive enhancement to the overall state and quality of the services linked to the individual
travel components.”
Above definition emphasizes that:
It is assumed to be less efficient and less close in the absence of an appropriate process.
Integration refers to both intermodal and intra-modal issues.
Includes wider integration with other transport modes (e.g. walking, cycling and private
cars) and other non-transport services such as town planning and environmental and
social policies

3
Integration refers to the speedy, convenient and economical connection of services
provided by public transport systems in order to make up complete journeys for
passengers from their origins to the final destinations.
3.2.1 The objectives of integration in public transport
Planned public transport system to capable to provide best services as possible
Planned to facilitate the transfer between different public transport modes in order to
provide seamless services for passengers.
To provide a seamless service using two or more modes in order to achieve a high level
of modal share by attracting more passengers, especially car users.
Increase the ridership of public transport systems in competition with private cars.
Inferences
Integration is a key factor in enhancement and improvement of urban public transport
systems.
Integration measures and activities are involved with all aspects of public transport
systems at the stages of planning, management and operation.
Integration is not a definite status and should be improved continuously within different
public transport modes and also between public transport and other transport modes.
Integration can be implemented and achieved in different levels. These levels can be from
a minimum form of integration at the operational levels, like integrated information
and/or fare.
The higher level of integration is achieved by extending its border beyond the public
transport systems by involving other modes of transport and other policies, like land use
planning, social and environmental policies.
Successfully implementation of integration requires the commitment of all associated
organization and authorities. A common policy framework can be an effective instrument
to advance coordination and cooperation between these public/private bodies.
3.3 A Mechanism for Organizing Last-Mile Service Using Non-Dedicated
Fleet(Cheng,Nguyen,Lau 2012)
Unprecedented pace of urbanization and rising income levels have fueled the
growth of car ownership in almost all newly formed megacities. Such growth has congested
the limited road space and significantly affected the quality of life in these megacities.
Convincing residents to give up their cars and use public transport is the most effective way
in reducing congestion; however, even with sufficient public transport capacity, the lack of
last-mile (from the transport
hub to the destination) travel services is the major deterrent for the adoption of public
transport. Due to the dynamic nature of such travel demands, fixed-size fleets will not be a
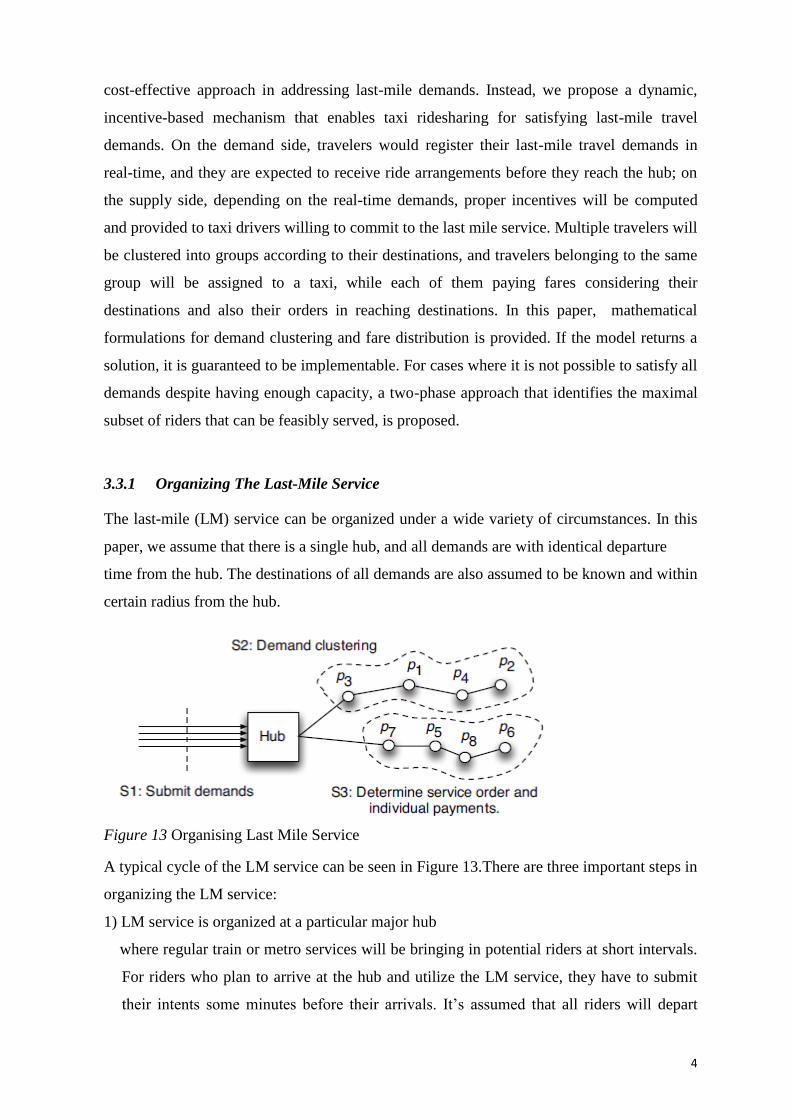
4
cost-effective approach in addressing last-mile demands. Instead, we propose a dynamic,
incentive-based mechanism that enables taxi ridesharing for satisfying last-mile travel
demands. On the demand side, travelers would register their last-mile travel demands in
real-time, and they are expected to receive ride arrangements before they reach the hub; on
the supply side, depending on the real-time demands, proper incentives will be computed
and provided to taxi drivers willing to commit to the last mile service. Multiple travelers will
be clustered into groups according to their destinations, and travelers belonging to the same
group will be assigned to a taxi, while each of them paying fares considering their
destinations and also their orders in reaching destinations. In this paper, mathematical
formulations for demand clustering and fare distribution is provided. If the model returns a
solution, it is guaranteed to be implementable. For cases where it is not possible to satisfy all
demands despite having enough capacity, a two-phase approach that identifies the maximal
subset of riders that can be feasibly served, is proposed.
3.3.1 Organizing The Last-Mile Service
The last-mile (LM) service can be organized under a wide variety of circumstances. In this
paper, we assume that there is a single hub, and all demands are with identical departure
time from the hub. The destinations of all demands are also assumed to be known and within
certain radius from the hub.
Figure 13 Organising Last Mile Service
A typical cycle of the LM service can be seen in Figure 13.There are three important steps in
organizing the LM service:
1) LM service is organized at a particular major hub
where regular train or metro services will be bringing in potential riders at short intervals.
For riders who plan to arrive at the hub and utilize the LM service, they have to submit
their intents some minutes before their arrivals. It’s assumed that all riders will depart

5
immediately for the LM service when they reach the hub, and they will provide the exact
coordinates of their destinations.
2) After receiving all destinations at the cut-off time, the central controller should optimally
assign all riders to appropriate clusters, where each cluster is to be served by a
participating driver.
3) The order of service and the payment to be made by each rider will be decided as we
finalize the cluster assignment.
Based on above descriptions, there are two critical problems that need to be repeatedly
solved:
1) Demand clustering: In which demands are clustered into groups to be served by different
vehicles.
2) Service sequencing and pricing: In which the service order and the associated price for
riders in every cluster is determined.
These two problems are closely connected since the planned route and the prices
associated with a cluster are highly dependent on the assigned riders.
3.4 CHALLENGES AND INTEGRATION OF MUMBAI’S FEEDER ROUTES
Among its peers, BEST is known to be proficient in operating feeder routes to connect to
suburban railway stations (BEST 2014). The city however faces difficulty due to the lack of
physical integration of its feeder and mass transit system. The suburban station areas are
highly crowded due to many reasons including the number of commuters accessing the
station and the vendors that operate in these areas. In addition, station access lanes are often
narrow and have low capacity. In the case of feeder buses, these factors restrict the ability of
a bus to turnaround or to stop for a long period of time. The physical integration of the mass
transit station and feeder bus stops is needed to provide a more comprehensive public
transport network.
Of the 7 million journeys made by rail every day, 1.5 to 2 million journeys access stations
by a BEST bus (LEA Associates 2008). These numbers indicate the significance of this
system in the colossal movement of people within the Mumbai Metropolitan Region
(MMR). BEST capitalizes on the three railway lines’ zones of influence by providing the
following feeder services
BEST operates feeder routes to suburban railway stations. Given are details of Mumbai’s
feeder operations and financial statistics. The agency defines its feeder routes, as routes
connecting to railway stations, within 10 km. More than 50 percent of all routes are feeder
routes. While most feeder routes are within 10 kms, due to the lack of space, BEST is
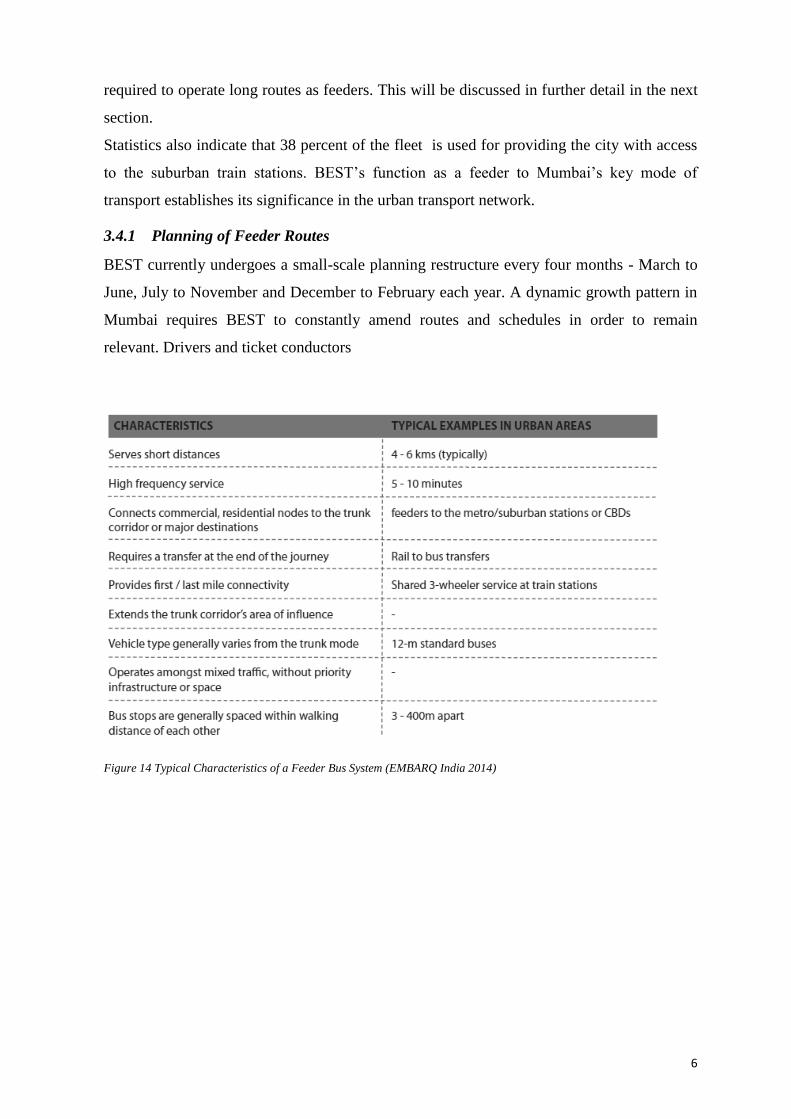
6
required to operate long routes as feeders. This will be discussed in further detail in the next
section.
Statistics also indicate that 38 percent of the fleet is used for providing the city with access
to the suburban train stations. BEST’s function as a feeder to Mumbai’s key mode of
transport establishes its significance in the urban transport network.
3.4.1 Planning of Feeder Routes
BEST currently undergoes a small-scale planning restructure every four months - March to
June, July to November and December to February each year. A dynamic growth pattern in
Mumbai requires BEST to constantly amend routes and schedules in order to remain
relevant. Drivers and ticket conductors
Figure 14 Typical Characteristics of a Feeder Bus System (EMBARQ India 2014)

7
Figure 15 Five types of Integration (EMBARQ India 2014)
There are three main types of feeder systems that are currently operational in
Mumbai. The lessons learned from these examples provide the basis for designing a good
feeder bus system for other Indian cities.
3.4.1.1 NEIGHBOURHOOD COLLECTOR ROUTES
Local neighborhood collector routes provide first and last-mile connectivity to
suburban railway stations. Buses collect commuters from housing colonies and connect
them to the local train station, where they connect to other parts of the city. For example,
Routes 343, 344, and 346 are neighbourhood collector routes that operate between Goregaon
Station and the residential areas of Aarey Colony. The operator faces three primary
challenges in designing Neighborhood Collector routes:
High level of Congestion
Poor Integration between Transport and Land-Use
Poor Physical Integration between Bus and Rail:
3.4.1.2 LONG FEEDER ROUTES
Long feeder routes are generally a combination of several routes that are merged
together due to certain constraints. This results in trunk-like route lengths and operational
inefficiencies. According to BEST, an ideal feeder route length ranges from 5 to 7 kms;
however in the recent past, lengths have grown past 8 kms. The length results in three
primary operational challenges – very high cycle times, high operating kilometers, and
reduced service reliability. Buses can take up to 45 minutes to enter and exit a station area
and drastically increase the cycle time. In this regard, the connection to multiple stations
makes this route unreliable and highly vulnerable to congestion. Service reliability of a
route is a key characteristic that influences ridership.
8
3.4.1.3 CENTRAL BUSINESS DISTRICT (CBD) PEAK-HOUR FEEDER ROUTES
The third category of feeder services caters to the heavy movement of commuters
within the South Mumbai CBD area. The CBD is comprised of several smaller districts –
Ballard Estate, Fort, Nariman Point, Colaba, and Churchgate. During peak hours, these
services are operated in a waiting time. There is also a good level of physical integration at
the 2 stations, with the provision of sufficient space for boarding / alighting and bus
turnaround. The integration allows for safe dispersal of commuters from the two stations.
There are, however, several operational challenges that the BEST is attempting to address:
• 50% (or more) overlap in route structures adds to difficulty in managing and scheduling
routes and adds to complexity from the user’s perspective as well.
• Resources to maintain high-frequency are not always financially viable.
• A uni-directional flow of people during peak hours means that buses operate at full or
overloaded capacity in one way and absolute zero load in the reverse direction.
3.5 Report On Rent-A-Bike Program Of Delhi Metro
The Delhi Metro Rail Corporation (DMRC) launched the first software-
based ‘Public Bicycle Sharing scheme (PBS)’ which would allow people to take cycles on
rent from a residential area and travel to the nearest metro station. Under the scheme,
commuters will be able to take cycles on rent from a residential area and travel to the nearest
metro station and then again rent a cycle from a departing metro station to reach the nearby
localities. To make this experience more convenient, automation software has also been put
in place as per which, commuters will be able to use cycles at multiple destinations with the
help of a rechargeable smart card. Updates about the travel along with details of the charges
will be sent to the users via sms and e-mail.
DMRC has been operating a cycle rental service at the Vishwavidhyalaya Metro
station successfully for the last six years in association with an organization called
‘Greenolution’. Now, this new facility, oriented towards providing last mile connectivity as
well as eco-friendly travel options, has been started in a fresh tie up with the same
organization and has opened new bicycle rental shelters at Neb Sarai, Hauz Khas,
Akshardham and Saket Metro station.
A study was conducted at Vishwavidhyalaya and saket metro station to review the cycle
rental facility during morning peak hour. The cycle rental facility was not as successful as it
was supposed to be. No cycle was rented during the peak morning hour. The whole cycle
stand remained deserted. Reasons can be:
1. No proper infrastructure is in place like separate lanes , bicycle parking etc
2. Proper awareness is lacking.
3. Lack of proper planning like less number of stations for a large area. So cycle rented
has to be returned at same station.
4. Climate of India is not suitable for bicycle riders.

9
5. Registration seems to be a problem at many stations as smart card facility is not
available at all stations.
Figure 16CYCLE STAND AT VISHWAVIDHYALAYA METRO
Figure 17 AT VISHWAVIDHYALAYA METRO

10
4 SELECTION OF STUDY AREA – DELHI & FIVE METRO STATIONS
4.1 Ground reality of Delhi
Delhi the capital city of India, has picked up huge investments to boost and augment
its transport network and expand its rapid transit scheme. A reflection on whether the
transport network and its rapid transit scheme is commensurate with surging vehicular
growth reveals, an interesting dichotomy. On one hand, the road space as percentage of total
land area in Delhi is 21% (Sahai and Bishop, 2010), much higher compared to cities like
Tokyo (13%), Hong Kong (12%) and Bangkok (11%); as such, continued and aggressive
expansion of road network is likely to be highly unsustainable. On the other hand, the road
space availability has halved from 12 kms/1000vehicles in 1990-91 to about 6 kms/1000
vehicles in 2005-06, leading to heavy congestion on most city roads and increasing levels of
vehicular pollution. This is a resultant of shifting trend towards private motorised modes of
travel. On some major arterial roads, cars occupy as much as 70% of the road space carrying
merely 20% of the total trips. The modal share of public transport (including bus and metro
trips) in the city has gone down from 60% to 45.5% between the period 2000-01 and 2007-
08 (RITES, 2008), despite introduction of BRT corridors and an expanding network of
metro rail, because of the lack of first/ last mile connectivity to the public transport i.e.
metro and bus stations. Yet, even as Delhi is investing in rail and bus lines, “last mile
connectivity” – uniting people from their places to transport hubs are remains an area of
neglect, off course, some small/trail initiatives are took place to provide least mile
connectivity by providing feeder bus services, rental cycles and bikes etc. from some metro
stations but those are not satisfactory and leads to unsuccessful stories. This lack of last-mile
connectivity has created a state of matters to the poor (LIG and EWS), women, etc. who rely
most on mass transport, are the very people that are causing the most difficult time reaching
safe, sustainable, affordable transport options.
A certain percentage of the demand for least mile connectivity is met through para-transit
modes such as auto rickshaws, Cycle rickshaws, Battery rickshaws, minivan etc. while auto
rickshaws are convenient, quite often, they are expensive in the city, sometimes costing
more than fifty percent of the entire price of the journey; carry individual passengers,
thereby adding to the load on the road space; and operate in an unorganized way. Cycle
rickshaws serve as important feeder systems, but are useable only in certain places.
In November 2013, the Rapid Metro, India’s first entirely privately funded mass transport
venture, began operations in Gurgaon. It sought to address the issue of last-mile connectivity
by connecting commuters from the nearby Delhi Metro to six key places within Gurgaon,
including the commercial hub “Cyber City”. However, this being a private venture, it does
not meet the needs of all residents.
In this alarming situation, it is imperative that a rapid paradigm shift is taken on in
order to move people away from private vehicles towards the role of public transit. The aim
of achieving this paradigm shift is to bid more attractive alternatives to the utilization of
personal modes – low cost, comfortable, non- motorized transport, pleasurable walking
experiences and very easily accessible and comfortable mass transportation with easy,
convenient and comfortable intermodal transfers for last mile connectivity.
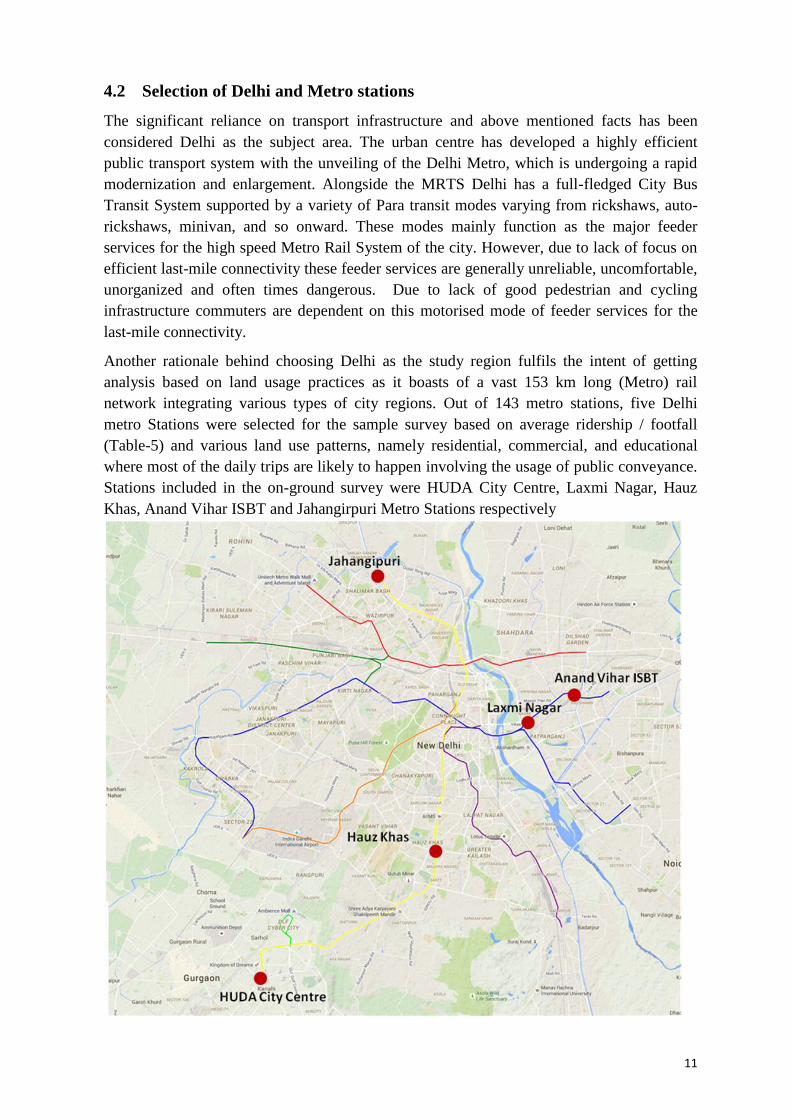
11
4.2 Selection of Delhi and Metro stations
The significant reliance on transport infrastructure and above mentioned facts has been
considered Delhi as the subject area. The urban centre has developed a highly efficient
public transport system with the unveiling of the Delhi Metro, which is undergoing a rapid
modernization and enlargement. Alongside the MRTS Delhi has a full-fledged City Bus
Transit System supported by a variety of Para transit modes varying from rickshaws, auto-
rickshaws, minivan, and so onward. These modes mainly function as the major feeder
services for the high speed Metro Rail System of the city. However, due to lack of focus on
efficient last-mile connectivity these feeder services are generally unreliable, uncomfortable,
unorganized and often times dangerous. Due to lack of good pedestrian and cycling
infrastructure commuters are dependent on this motorised mode of feeder services for the
last-mile connectivity.
Another rationale behind choosing Delhi as the study region fulfils the intent of getting
analysis based on land usage practices as it boasts of a vast 153 km long (Metro) rail
network integrating various types of city regions. Out of 143 metro stations, five Delhi
metro Stations were selected for the sample survey based on average ridership / footfall
(Table-5) and various land use patterns, namely residential, commercial, and educational
where most of the daily trips are likely to happen involving the usage of public conveyance.
Stations included in the on-ground survey were HUDA City Centre, Laxmi Nagar, Hauz
Khas, Anand Vihar ISBT and Jahangirpuri Metro Stations respectively
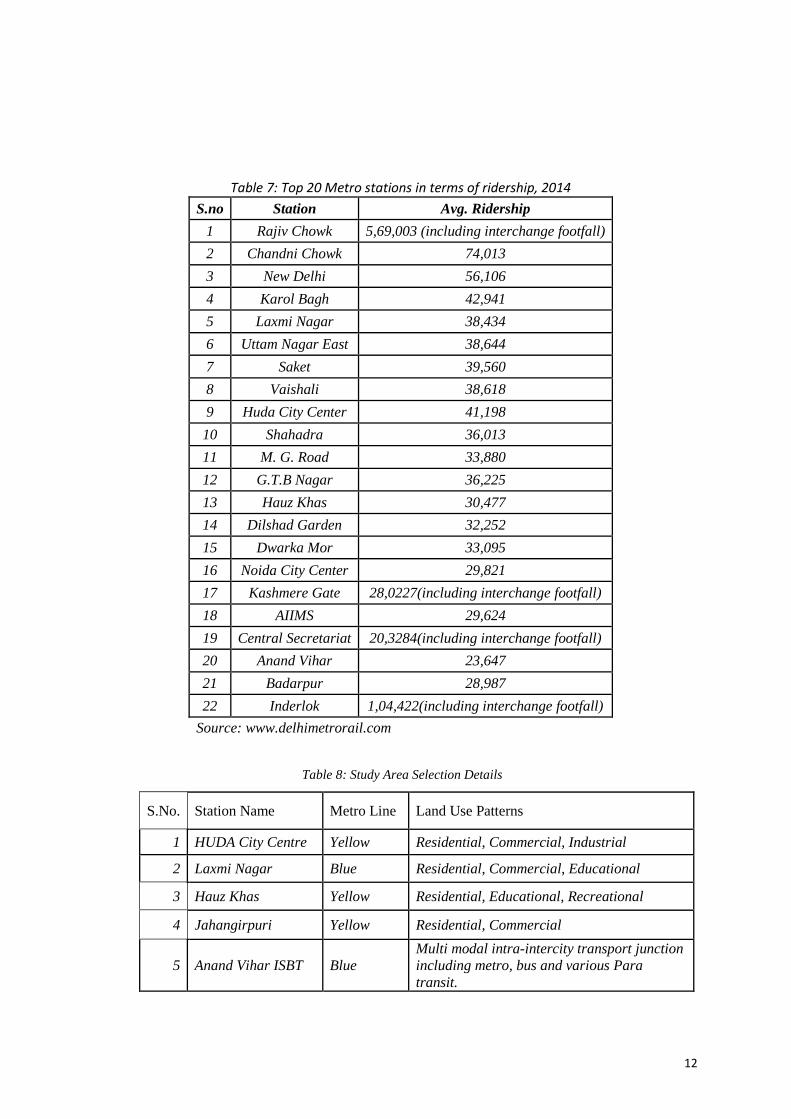
12
Table 7: Top 20 Metro stations in terms of ridership, 2014
S.no Station Avg. Ridership
1 Rajiv Chowk 5,69,003 (including interchange footfall)
2 Chandni Chowk 74,013
3 New Delhi 56,106
4 Karol Bagh 42,941
5 Laxmi Nagar 38,434
6 Uttam Nagar East 38,644
7 Saket 39,560
8 Vaishali 38,618
9 Huda City Center 41,198
10 Shahadra 36,013
11 M. G. Road 33,880
12 G.T.B Nagar 36,225
13 Hauz Khas 30,477
14 Dilshad Garden 32,252
15 Dwarka Mor 33,095
16 Noida City Center 29,821
17 Kashmere Gate 28,0227(including interchange footfall)
18 AIIMS 29,624
19 Central Secretariat 20,3284(including interchange footfall)
20 Anand Vihar 23,647
21 Badarpur 28,987
22 Inderlok 1,04,422(including interchange footfall)
Source: www.delhimetrorail.com
Table 8: Study Area Selection Details
S.No. Station Name Metro Line Land Use Patterns
1 HUDA City Centre Yellow Residential, Commercial, Industrial
2 Laxmi Nagar Blue Residential, Commercial, Educational
3 Hauz Khas Yellow Residential, Educational, Recreational
4 Jahangirpuri Yellow Residential, Commercial
5 Anand Vihar ISBT Blue
Multi modal intra-intercity transport junction
including metro, bus and various Para
transit.

13
5 Analysis and Findings
5.1 Survey Technique
For this study a sample size of 460 in total is chosen, which includes commuter and non-
commuter (including IPT Operators and Private Vehicle Users) categories. Primary survey
was conducted consisting of a pre- designed questionnaire survey consisting of objectives,
multiple choice and open ended questions. The was conducted at 5 metro stations namely
Huda City Centre, Jahangirpuri, Anand Vihar ISBT, Hauz Khas, and Laxmi Nagar. The
Station wise sample size in peak and off-peak, with commuters and non-commuters are
detailed in Table: 9.
Table 9: Sample Size
S.
No. Station Name
Commuter Non-Commuter
Peak Off-Peak IPT Private users (Control group)
1 Huda City Centre 35 35 5 12
2 Jahangirpuri 35 38 7 14
3 Anand Vihar
ISBT 35 36 10 15
4 Hauz Khas 33 30 10 7
5 Laxmi Nagar 45 30 13 13
Total 185 169 45 61
Source: Primary Survey, 2015
At each of the chosen station, the survey was carried out between peak (800hr to 1100 &
500hr to 800hr) and non-peak (100hr to 500hr) hours. The sample size consists of commuter
and non-commuter (Private Vehicle Users) categories to infer the issues of last-mile
connectivity from both perspectives, additionally, 10 quaternaries were also convened at
each station to capture the view of IPT operators. The survey aimed at targeting 500 samples
out of which 460 were found to be productive for the study. Categorically for commuter and
non-commuter categories sample size of 350 and 150 was targeted respectively. Three
distinctive sets of questionnaires each for commuter and non-commuter (including IPT
Operators and Private Vehicle Users) categories were utilized for collection of sample
survey data. Questionnaires included objectives, multiple choice and open ended questions
aimed at understanding the aspect of comfort, time, space, cost, incurred in the LMC as a
ratio of the total journey for public transportation system users and operators; user
preferences and alternatives available, for LMC; and in the end, whether lack of efficient
LMC options is a decisive element in the commuter’s choice of secret modes and how it
effects the overall efficiency of a public transit organization. The survey targeted at two
main components: ‘Origin to Public Transport’ (O-PT), and ‘Public Transport to
Destination’ (PT-D). The analysis also lets in the types of modes opted for LMC, perceived
problems and user features. Some questions included in the survey on problems faced and
suggestions were deliberately left open-ended in order to make the real perception of the
commuters.
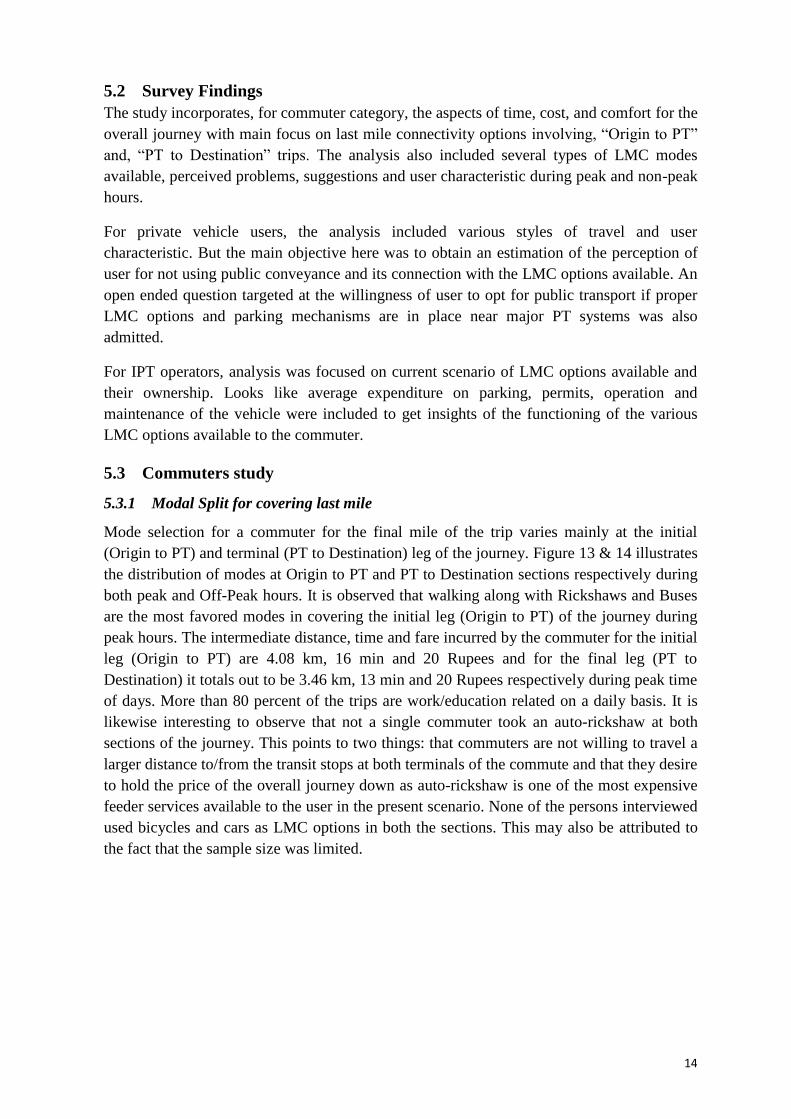
14
5.2 Survey Findings
The study incorporates, for commuter category, the aspects of time, cost, and comfort for the
overall journey with main focus on last mile connectivity options involving, “Origin to PT”
and, “PT to Destination” trips. The analysis also included several types of LMC modes
available, perceived problems, suggestions and user characteristic during peak and non-peak
hours.
For private vehicle users, the analysis included various styles of travel and user
characteristic. But the main objective here was to obtain an estimation of the perception of
user for not using public conveyance and its connection with the LMC options available. An
open ended question targeted at the willingness of user to opt for public transport if proper
LMC options and parking mechanisms are in place near major PT systems was also
admitted.
For IPT operators, analysis was focused on current scenario of LMC options available and
their ownership. Looks like average expenditure on parking, permits, operation and
maintenance of the vehicle were included to get insights of the functioning of the various
LMC options available to the commuter.
5.3 Commuters study
5.3.1 Modal Split for covering last mile
Mode selection for a commuter for the final mile of the trip varies mainly at the initial
(Origin to PT) and terminal (PT to Destination) leg of the journey. Figure 13 & 14 illustrates
the distribution of modes at Origin to PT and PT to Destination sections respectively during
both peak and Off-Peak hours. It is observed that walking along with Rickshaws and Buses
are the most favored modes in covering the initial leg (Origin to PT) of the journey during
peak hours. The intermediate distance, time and fare incurred by the commuter for the initial
leg (Origin to PT) are 4.08 km, 16 min and 20 Rupees and for the final leg (PT to
Destination) it totals out to be 3.46 km, 13 min and 20 Rupees respectively during peak time
of days. More than 80 percent of the trips are work/education related on a daily basis. It is
likewise interesting to observe that not a single commuter took an auto-rickshaw at both
sections of the journey. This points to two things: that commuters are not willing to travel a
larger distance to/from the transit stops at both terminals of the commute and that they desire
to hold the price of the overall journey down as auto-rickshaw is one of the most expensive
feeder services available to the user in the present scenario. None of the persons interviewed
used bicycles and cars as LMC options in both the sections. This may also be attributed to
the fact that the sample size was limited.

15
Figure 18: Modal Split during Peak Hours
Figure 19: Modal Split during off-Peak Hours
5.3.2 Distance, Time and cost incurred in last mile
Access distance to Public transportation An average distance from origin to public transportation and public transportation to
destination is important aspect in last mile connectivity. The Distance factor affects the
transportation system of city/town. The average distance from origin to public transportation
of selected metro stations in time of peak and off – peak and mode wise average distance are
detailed out in fig.15 and 16.
Figure 20: Average Distance to Public transportation in peak and off- peak

16
Figure 21: commuters Mode wise Average Distance to Public Transport
Inference: The average distance from origin to public transportation in peak hours is 4 Km which
is 0.5 km less than the less compared to off-peak hours which is 4.5 Km. Because many
of public transportation (PT) commuters (refer figure:) are using for public
transportation in the peak hour means these are traveling for the purpose of Work,
Education, Shopping, etc. these are giving more preference to nearest public
transportation facilities compared to off- peak commuters.
Come to commuter’s mode wise average distance to public transportation, the average
distance of bus mode is higher than the others, which is about 8 Km, due to some of the
commuters are coming from outside the city and taking metros specially at Anand
Vihar, Huda City Centre, and Jahangirpuri. Followed by Auto & Bike 5 Km, Car 3Km,
due to the maximum distance from origin (Home/ Working place) to existence metro
station is about around 5Km radius across Delhi as per the surveys. Rickshaw & E-
Rickshaw are functioning as feeder to metro stations for 2 Km catchment areas. The
commuters who prefer to walk 1 km to use metro (Public transportation).
Travel time to reach public transportation
The average time spent and cost incurred in extending the last mile reflect a lot close to the
quality and availability of last mile connectivity services. The details of average travel time
taking for commuters to reach Public Transportation in peak and off peak hours and mode wise
average travel taking to reach metro station (Public transportation) are detailed out in Graph.1, 2
and 3.
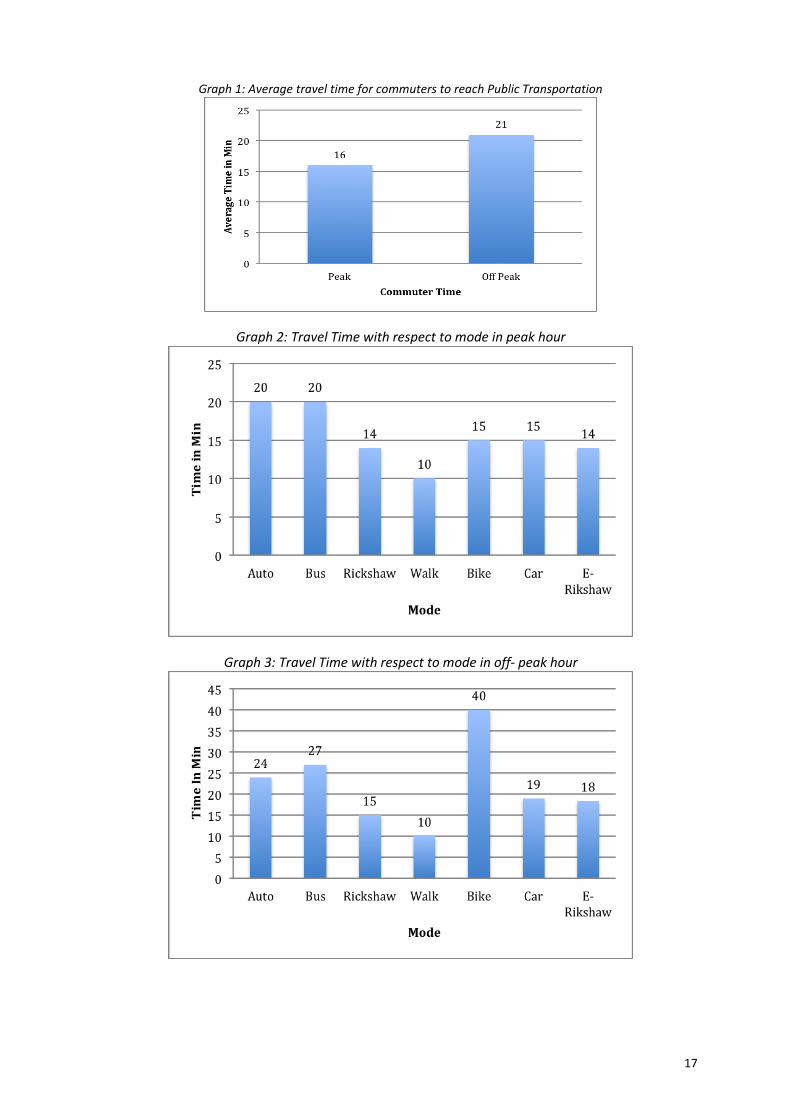
17
Graph 1: Average travel time for commuters to reach Public Transportation
Graph 2: Travel Time with respect to mode in peak hour
Graph 3: Travel Time with respect to mode in off- peak hour
18
Inference An Average travel time taking from origin to reach Metro station (public transportation) in
off-Peak hour is 21 minutes which is about 5 min higher than the peak hour- 16 minutes, due
to the lack of availability and frequency of feeder services to the metro station it enhances
the waiting time of commuters for feeder service (refer graph.)
The mode wise are indicates that the average time spent by the commuter to reach public
transportation (Metro) is vary during peak and off peak hours. Despite walking being the
dominant style in the final leg (PT to Destination) of the journey the mean time is less than
the initial leg (Origin to PT) indicating that commuters prefer to spend less time in the final
leg of their journey. But it is seen that the average cost incurred in the last mile does not vary
significantly and comes out to be Rs.20 approximately.
5.3.3 Perceived Problems
Most of the commuters cited problems relating to over-crowding during peak
hours, low frequency of metro services and too long walking distances for addressing the
last mile connectivity options of their journey. High prices of last mile connectivity often
times more than half of the total journey expenditure and poor pedestrian infrastructure
further adds up to the complications for the commuters. Approximately 49% commuters
wait 10 min for LMC options during peak hour and 30% during off-peak hours. Women and
elderly regarded current last mile connectivity options as inconvenient, unsafe and
overcrowded.
Inference
People avoid the public transport citing many reasons mainly comfort , journey time and waiting
time. PT tend to get overcrowded during peak hours which makes it uncomfortable and difficult for
the commuters to reach their destinations on time, leading to their switching over to privately owned
vehicle. Moreover journey time and waiting time are also main reasons for the neglect as PT tend to
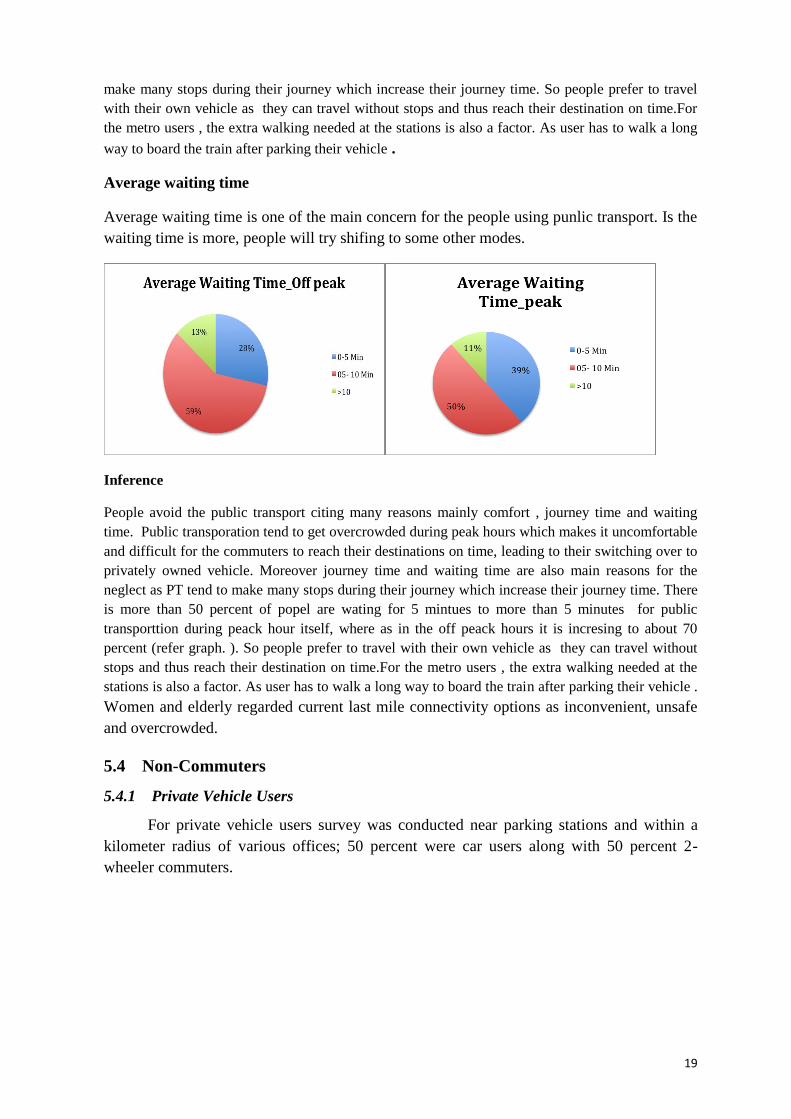
19
make many stops during their journey which increase their journey time. So people prefer to travel
with their own vehicle as they can travel without stops and thus reach their destination on time.For
the metro users , the extra walking needed at the stations is also a factor. As user has to walk a long
way to board the train after parking their vehicle .
Average waiting time
Average waiting time is one of the main concern for the people using punlic transport. Is the
waiting time is more, people will try shifing to some other modes.
Inference
People avoid the public transport citing many reasons mainly comfort , journey time and waiting
time. Public transporation tend to get overcrowded during peak hours which makes it uncomfortable
and difficult for the commuters to reach their destinations on time, leading to their switching over to
privately owned vehicle. Moreover journey time and waiting time are also main reasons for the
neglect as PT tend to make many stops during their journey which increase their journey time. There
is more than 50 percent of popel are wating for 5 mintues to more than 5 minutes for public
transporttion during peack hour itself, where as in the off peack hours it is incresing to about 70
percent (refer graph. ). So people prefer to travel with their own vehicle as they can travel without
stops and thus reach their destination on time.For the metro users , the extra walking needed at the
stations is also a factor. As user has to walk a long way to board the train after parking their vehicle .
Women and elderly regarded current last mile connectivity options as inconvenient, unsafe
and overcrowded.
5.4 Non-Commuters
5.4.1 Private Vehicle Users
For private vehicle users survey was conducted near parking stations and within a
kilometer radius of various offices; 50 percent were car users along with 50 percent 2-
wheeler commuters.

20
Figure 22 TYPE OF VEHICLE
Distance, Time and cost incurred in last mile
Travel Distance
An average distance from origin to Destination is about 18 km. The distance of
private travels are most similar from classified three categories are less than 10 Km, between
10 to 20 and more than 20 km which are 25 percent, 37 percent, and 38 percent respectively,
which is reflecting that the private vehicle users are mostly depending and desiring to use
their own vehicle due to the several reasons, mainly more journey time, uncomfortable, long
and extra walking time, safety and security etc. refer graph?
Travel time
An average time taking to reach destination from the origin for the private travelers
is about 42 minutes. The least time for travelers is 7 to 10 min and maximum travel time is
60 minutes. Nearly 40 percent of the private travelers are traveling daily for maximum travel
time in this survey which ids 60 minutes (1hr) to reach their destination. See graph
Figure 23 TRAVEL DISTANCE Figure 24 TRAVEL TIME
Travel cost and monthly income of Private
Just an average travel cost only Rs.3000 per month for the private travelers. The highest
travel cost is Rs.10,000 per month and minimum is about Rs. 500 per month. About 70
percent private travelers are spending more than Rs.1500 per month. These values are
giving idea and representing those expensive travel fares of Delhi scenario.
When the travel cost is compared to monthly income of private vehicle users nearly 50
percent of the people are having below Rs. 20,000 per month, which means these are

21
spending more than 15 percent of their spending their monthly income on travel only.
Followed by 30 percent are by people who are earning more than Rs.40, 000 and between
Rs. 20,000 to Rs. 40,000 per month
Figure 25 TRAVEL COST Figure 26 MONTHLY INCOME
Trip purpose and frequency
The trip purpose of the private vehicle users is 100 percent Work / Education / Shopping / other
work related trips. Almost 83% trips are on a daily basis with users mostly comprising of
high and middle-income groups with an average monthly income of Rs.32000. Almost 60%
commuter willing to pay extra Rs.2-8 if services are improved and 58% commuters are
willing to use PT if Park & Ride facilities are available. The survey the details are shown in
Graph.4.
Figure 27 TRIP FREQUENCY Figure 28 REASON FOR NOT TAKING PUBLIC
TRANSPORT
Figure 29 VALUE OF MONEY FOR 10 MIN
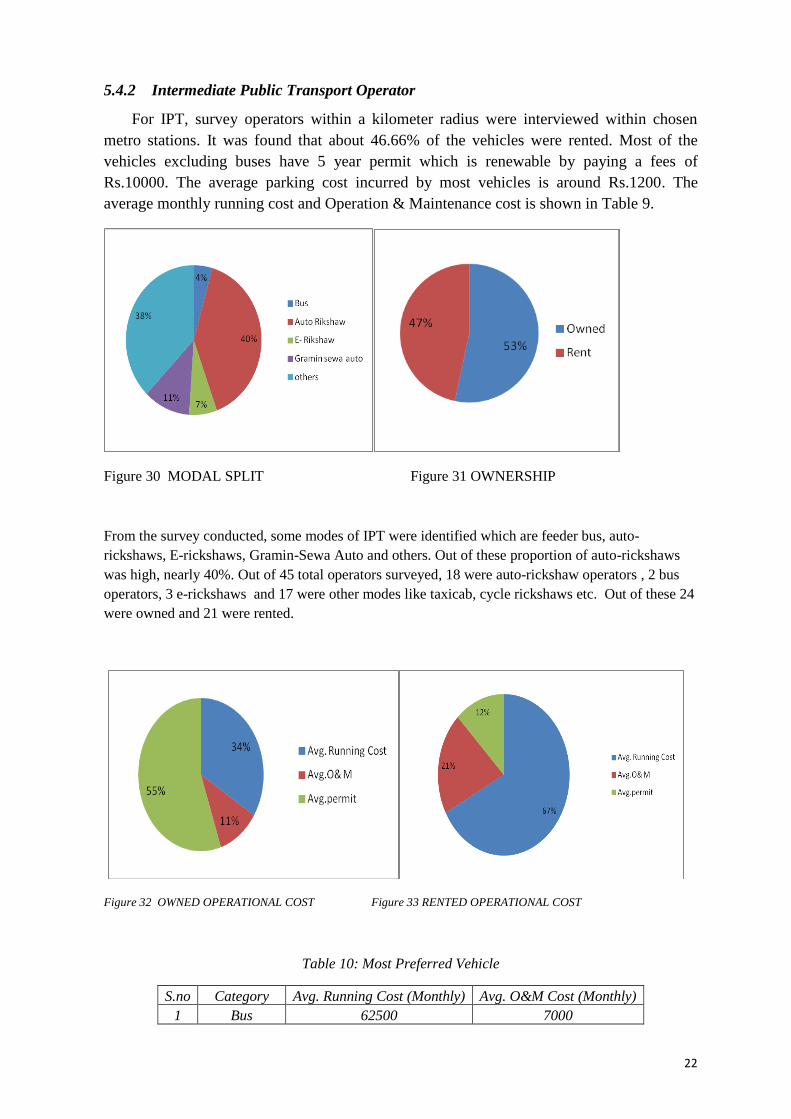
22
5.4.2 Intermediate Public Transport Operator
For IPT, survey operators within a kilometer radius were interviewed within chosen
metro stations. It was found that about 46.66% of the vehicles were rented. Most of the
vehicles excluding buses have 5 year permit which is renewable by paying a fees of
Rs.10000. The average parking cost incurred by most vehicles is around Rs.1200. The
average monthly running cost and Operation & Maintenance cost is shown in Table 9.
Figure 30 MODAL SPLIT Figure 31 OWNERSHIP
From the survey conducted, some modes of IPT were identified which are feeder bus, auto-
rickshaws, E-rickshaws, Gramin-Sewa Auto and others. Out of these proportion of auto-rickshaws
was high, nearly 40%. Out of 45 total operators surveyed, 18 were auto-rickshaw operators , 2 bus
operators, 3 e-rickshaws and 17 were other modes like taxicab, cycle rickshaws etc. Out of these 24
were owned and 21 were rented.
Figure 32 OWNED OPERATIONAL COST Figure 33 RENTED OPERATIONAL COST
Table 10: Most Preferred Vehicle
S.no Category Avg. Running Cost (Monthly) Avg. O&M Cost (Monthly)
1 Bus 62500 7000

23
2 Auto 6964 2309
3 E- Rickshaw 2583 533
4 Minivan 15190 1500
5 Rickshaw 1659 68
5.5 Detailed analysis of Hauz Khas metro station
Out of selected five metro stations, Hauz Khas Metro station is considered for detailed
study on last mile connectivity. Because the metro station has significance characteristics are
following:
Different land use: Institutional, Residential, Commercial, and Heritage & culture
Type of Commuters: Regular working class, corporate and central government
employees, school college and university students, residential, visitors, etc.
Age group of Commuters: Most of the commuter’s age is between 16-50, followed
greater 50 and below 16 years.
Last lime connectivity options: The Hauz Khas Metro station is one of the Metro
stations which are having both the last mile connectivity options from and to station
to and from origin and destination such as rented bicycling and Feeder bus service.
Availability of Land: the Metro station not have extra land to promote last mile
connectivity around the metro station due to the metro station is completely
surrounded by central government police residential colony, Laxman Public school,
etc.
Figure 34 At Hauz khas

24
5.5.1 Commuters analysis in Peak Hour
Access distance plays an important part in planning last mile. People living far way tend to use PT
only when it is well connected. People residing nearby take up walking, cycle, rickshaws etc and
those far away tend to use motorized modes. During peak hour people tend to use motorized as
compared to off-peak hour.
Figure 35 Average distance to public transport
Inference
Average access distance depend upon the type of land use and mode used for access travel. People
have to cover more distance to reach hauzkhas metro station as it is surrounded by central
government police residential colony and Laxman Public school which leads to the increase in
use of feeder buses and auto rickshaw.
If the access distance is less then walking and cycle rickshaws are preferred. The graph shows that if
the distance is around 1km then rickshaw and walking are prefered. If the distance is more then
motorized modes are prefered like auto-rickshaw and feeder bus. The graph shows that the average
distance for auto and bus is about 6km and 7km respectively. Buffer zones can be allotted to
different modes on the basis of their travel distance during peak and off peak hour. Most people use
motorized modes around hauz khas metro station due to surrounding land use and it location. More
than 70% people use these motorised modes
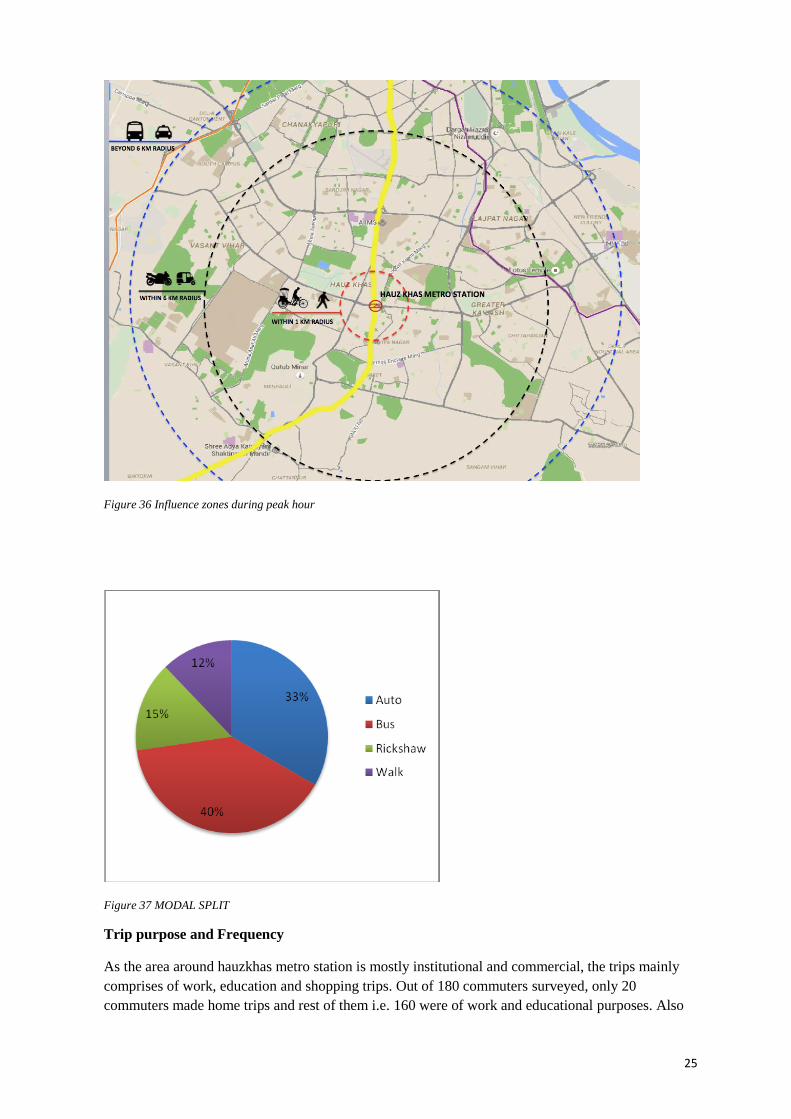
25
Figure 36 Influence zones during peak hour
Figure 37 MODAL SPLIT
Trip purpose and Frequency
As the area around hauzkhas metro station is mostly institutional and commercial, the trips mainly
comprises of work, education and shopping trips. Out of 180 commuters surveyed, only 20
commuters made home trips and rest of them i.e. 160 were of work and educational purposes. Also
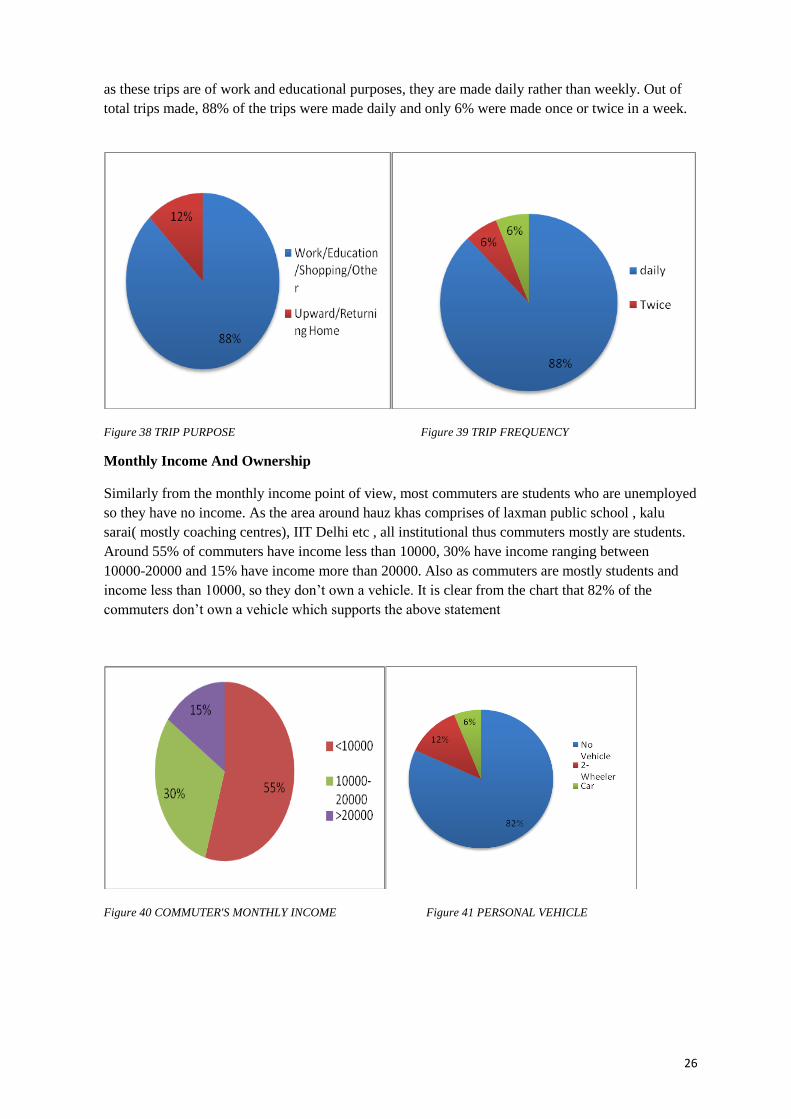
26
as these trips are of work and educational purposes, they are made daily rather than weekly. Out of
total trips made, 88% of the trips were made daily and only 6% were made once or twice in a week.
Figure 38 TRIP PURPOSE Figure 39 TRIP FREQUENCY
Monthly Income And Ownership
Similarly from the monthly income point of view, most commuters are students who are unemployed
so they have no income. As the area around hauz khas comprises of laxman public school , kalu
sarai( mostly coaching centres), IIT Delhi etc , all institutional thus commuters mostly are students.
Around 55% of commuters have income less than 10000, 30% have income ranging between
10000-20000 and 15% have income more than 20000. Also as commuters are mostly students and
income less than 10000, so they don’t own a vehicle. It is clear from the chart that 82% of the
commuters don’t own a vehicle which supports the above statement
Figure 40 COMMUTER'S MONTHLY INCOME Figure 41 PERSONAL VEHICLE

27
Rating for PT
As most the people do not own a vehicle they mostly depend on public transport for commuting.
Commuters were asked to give rating 1-4 based on their satisfaction of the public transport. Most of
them seem to be satisfied with the available facilities in the metro station with respect to journey
time, waiting time etc. Around 70% of the people seemed to be satisfied but they are concerned
about the access facilities to PT.
Figure 42 RATING ON PT
5.5.2 Commuter Analysis in off-peak hour.
Average Distance And Influence Zones
Figure 43 AVERAGE DISTANCE TO PUBLIC TRANSPORT

28
Figure 44 INFLUENCE ZONES DURING OFF-PEAK HOUR
During off-peak hour, people prefer to walk or take cycle rickshaw. This is because of less
congestion on the road and less urgency to reach the destination. Also during off-peak feeder buses
are reduced, so the number of commuters travelling by bus is reduced which has resulted in increase
in use of hired auto-rickshaws and private mode, also walking and cycling are also increased. Thus
the average distance travelled by auto rickshaws during off-peak hour is increased and that of buses
is decreased. Since during the off-peak hour congestion is less, the influence zones for NMT i.e.
walking and cycle rickshaws have increased. It is now 2km. Influence zone for buses in decreased
for the same above reason.
Figure 45 MODAL SPLIT Figure 46 TRIP PURPOSE
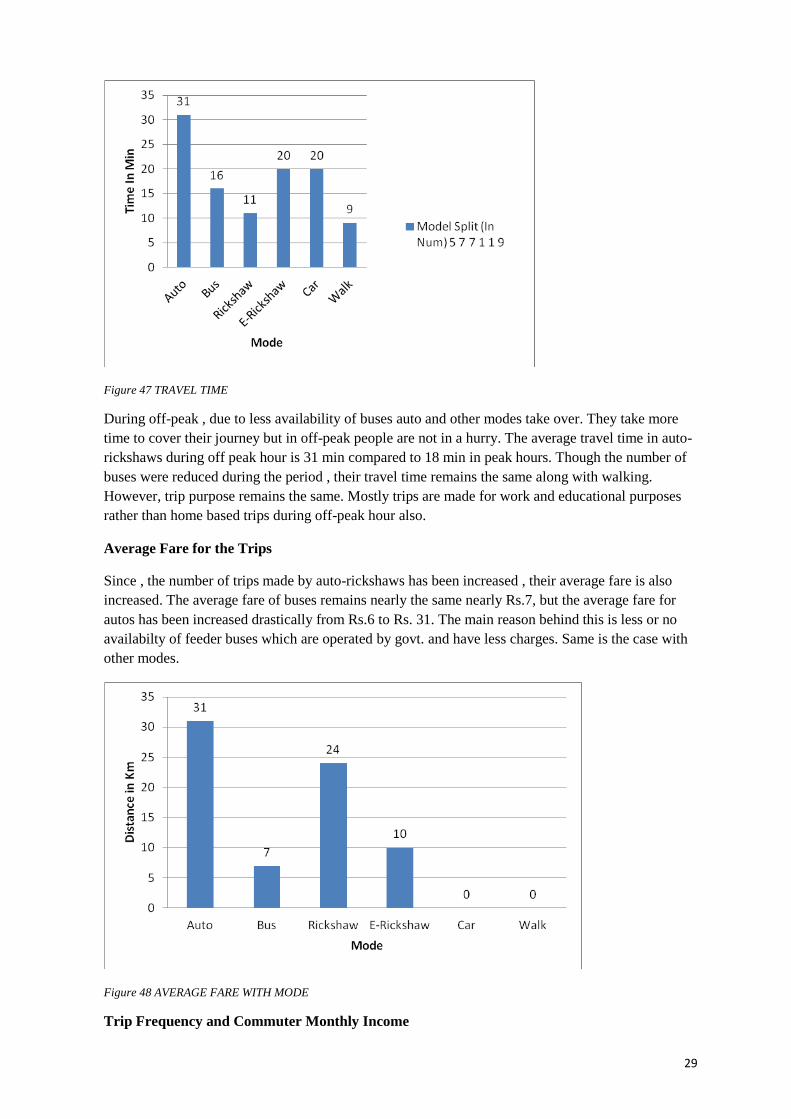
29
Figure 47 TRAVEL TIME
During off-peak , due to less availability of buses auto and other modes take over. They take more
time to cover their journey but in off-peak people are not in a hurry. The average travel time in auto-
rickshaws during off peak hour is 31 min compared to 18 min in peak hours. Though the number of
buses were reduced during the period , their travel time remains the same along with walking.
However, trip purpose remains the same. Mostly trips are made for work and educational purposes
rather than home based trips during off-peak hour also.
Average Fare for the Trips
Since , the number of trips made by auto-rickshaws has been increased , their average fare is also
increased. The average fare of buses remains nearly the same nearly Rs.7, but the average fare for
autos has been increased drastically from Rs.6 to Rs. 31. The main reason behind this is less or no
availabilty of feeder buses which are operated by govt. and have less charges. Same is the case with
other modes.
Figure 48 AVERAGE FARE WITH MODE
Trip Frequency and Commuter Monthly Income

30
Since during off-peak hours , less commuters travel to hauz khas metro station, their trip frequency is
also decreased. It has been brought down from 88% to 60%. Whereas people making trips once or
twice during this time is increased from 12% to 40%. This is due to landuse of the area which have
commercial and institutional buildings. The monthly income remains the same.
Figure 49 TRIP FREQUENCY Figure 50 COMMUTER MONTHLY INCOME RANGE
The people owning a vehicle has been increased , as number of buses are reduced. People started
prefering private vehicle which may accounted to different reasons like non availability of buses,
more travel time and fare in auto, comfort etc. The percentage of 2wheelers has also been increased.
Figure 51 PERSONAL VEHICLE Figure 52 RATING FOR PUBLIC TRANSPORT
Due to no congestion and more comfort in metro during off-peak, commuters are more satisfied with
the available services of metros. Thus the rating given by them is also increased. About 1/3 people
gave 5 out of 5 rating to metro . About 80% people are satisfied with available facilties. However the
onlty concern remained is last mile connecting modes. People have to walk or take costly auto to
reach their destination.
5.5.3 Non- Commutes: IPT Operators survey
For Intermediate Private Transport, survey operators within a kilometer radius were
interviewed within chosen metro stations. Out of all operators surveyed, 20% were bus
operators , 30% were auto-rickshaws and 50% were Gramin Sewa Auto. Apart from feeder
bus which is 100% subsidized by govt. the auto-rickshaws and gramin sewa auto are both
privately owned and rented. About 80% of the IPT are rented and 20% are owned. Since

31
these are operated by economically weaker group people, so renting is considered a better
option by most of the operators
Figure 53 MODAL SPLIT Figure 54 OWNERSHIP
For the owned vehicles the main concern is the permit for operating which takes almost half of the
total operating cost. A operator has to pay nearly Rs. 10000 for permit whereas on the rented vehicle
operators need not to be worried about it. In the rented vehicles the main concern is the average
running cost which is more than 75% of the total operational cost and more than 3 times the running
cost of owned vehicle. For rented vehicle, maintenance cost is also more along with the parking
charges.
Figure 55 OWNED OPERATIONAL COST Figure 56 RENT OPERATIONAL COST
5.5.4 Non- Commutes: Private commuter survey
For non commuters private vehicle user survey was also conducted. Mainly the survey
location was the parking stations the metro, since the vehicles are more readily available
there. They use their own vehicle to travel to the work or other activities rather than using
public transport. There was nearly an equal distribution between the 2 wheelers and car

32
users. Out of 24 users surveyed 13 were 2 wheeler and 11 were car users.
Figure 57 TYPE OF VEHICLE
Travel Distance and Travel time
The distance travelled by the private commuters varies, depending upon the destination.
However the average distance is nearly 19km. Also the average travel time depend upon the
route, peak/off-peak hour, congestion etc. They avoid the PT and take the whole journey in
the comfort of their own vehicle. So the travel time also depend upon their destination which
may differ. Mostly the private journey took more than 30 min. However the average travel
time is nearly 38 min costing them Rs.3000.
Figure 58 TRAVEL DISTANCE Figure 59 TRAVEL TIME
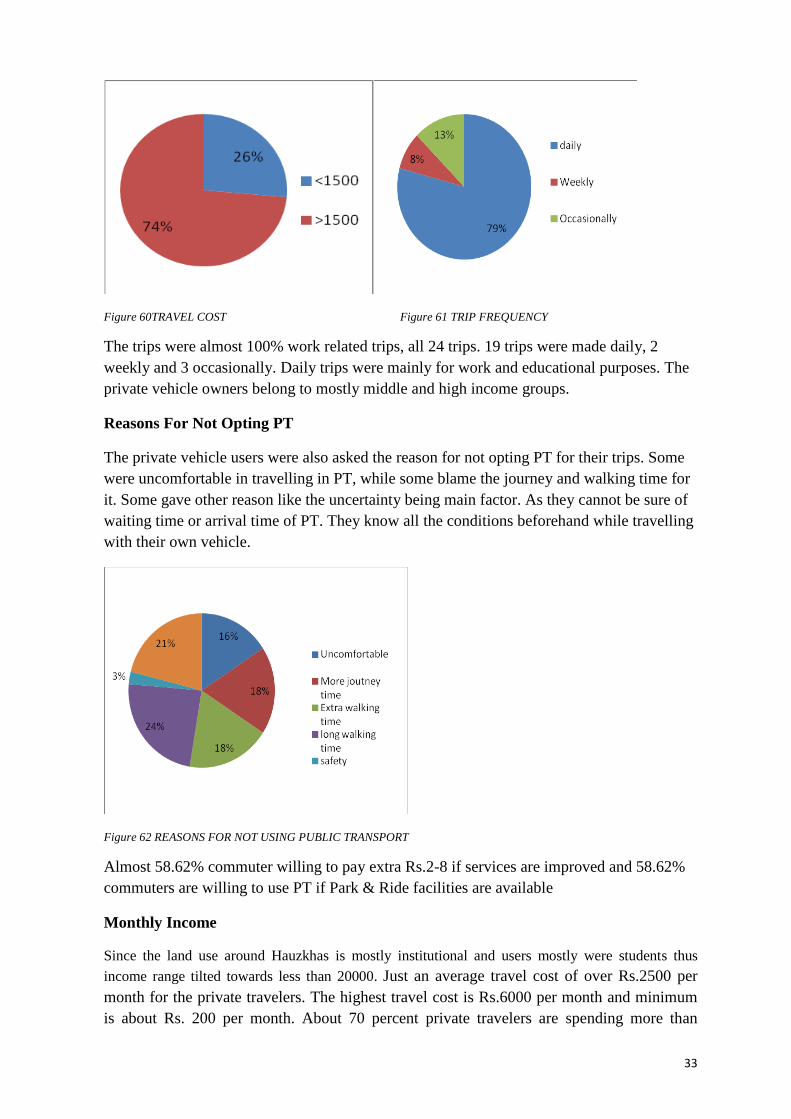
33
Figure 60TRAVEL COST Figure 61 TRIP FREQUENCY
The trips were almost 100% work related trips, all 24 trips. 19 trips were made daily, 2
weekly and 3 occasionally. Daily trips were mainly for work and educational purposes. The
private vehicle owners belong to mostly middle and high income groups.
Reasons For Not Opting PT
The private vehicle users were also asked the reason for not opting PT for their trips. Some
were uncomfortable in travelling in PT, while some blame the journey and walking time for
it. Some gave other reason like the uncertainty being main factor. As they cannot be sure of
waiting time or arrival time of PT. They know all the conditions beforehand while travelling
with their own vehicle.
Figure 62 REASONS FOR NOT USING PUBLIC TRANSPORT
Almost 58.62% commuter willing to pay extra Rs.2-8 if services are improved and 58.62%
commuters are willing to use PT if Park & Ride facilities are available
Monthly Income
Since the land use around Hauzkhas is mostly institutional and users mostly were students thus
income range tilted towards less than 20000. Just an average travel cost of over Rs.2500 per
month for the private travelers. The highest travel cost is Rs.6000 per month and minimum
is about Rs. 200 per month. About 70 percent private travelers are spending more than
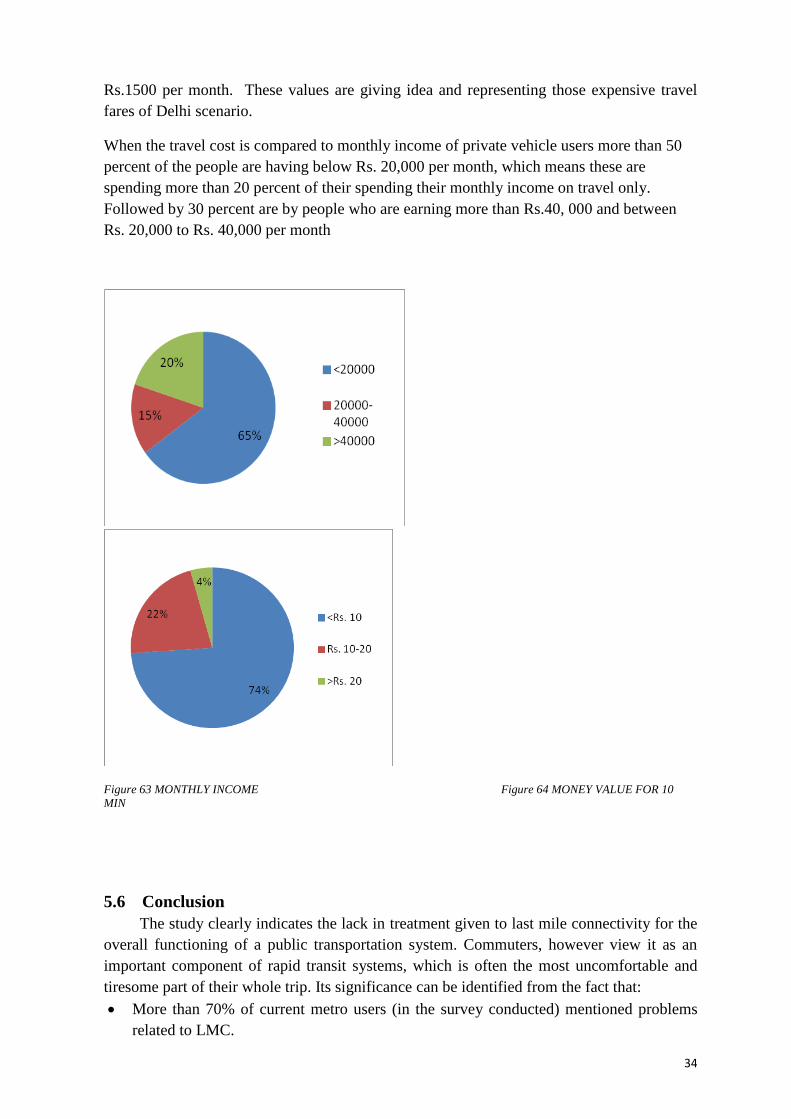
34
Rs.1500 per month. These values are giving idea and representing those expensive travel
fares of Delhi scenario.
When the travel cost is compared to monthly income of private vehicle users more than 50
percent of the people are having below Rs. 20,000 per month, which means these are
spending more than 20 percent of their spending their monthly income on travel only.
Followed by 30 percent are by people who are earning more than Rs.40, 000 and between
Rs. 20,000 to Rs. 40,000 per month
Figure 63 MONTHLY INCOME Figure 64 MONEY VALUE FOR 10
MIN
5.6 Conclusion
The study clearly indicates the lack in treatment given to last mile connectivity for the
overall functioning of a public transportation system. Commuters, however view it as an
important component of rapid transit systems, which is often the most uncomfortable and
tiresome part of their whole trip. Its significance can be identified from the fact that:
More than 70% of current metro users (in the survey conducted) mentioned problems
related to LMC.
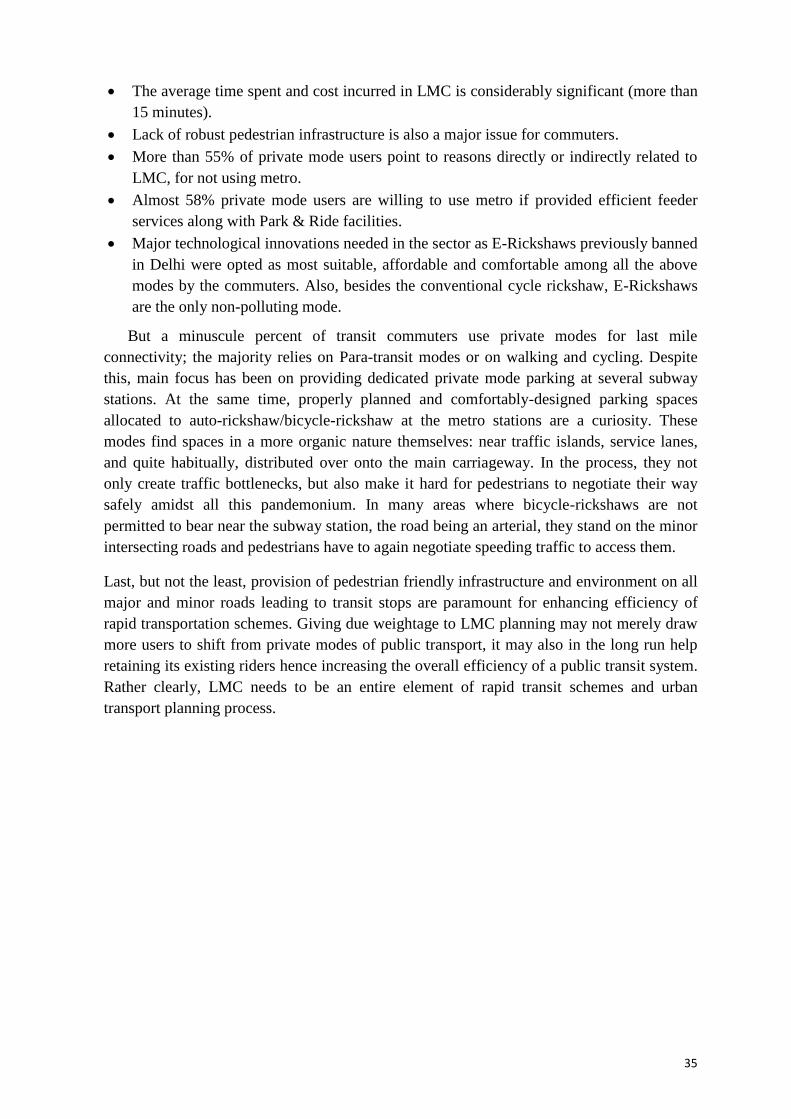
35
The average time spent and cost incurred in LMC is considerably significant (more than
15 minutes).
Lack of robust pedestrian infrastructure is also a major issue for commuters.
More than 55% of private mode users point to reasons directly or indirectly related to
LMC, for not using metro.
Almost 58% private mode users are willing to use metro if provided efficient feeder
services along with Park & Ride facilities.
Major technological innovations needed in the sector as E-Rickshaws previously banned
in Delhi were opted as most suitable, affordable and comfortable among all the above
modes by the commuters. Also, besides the conventional cycle rickshaw, E-Rickshaws
are the only non-polluting mode.
But a minuscule percent of transit commuters use private modes for last mile
connectivity; the majority relies on Para-transit modes or on walking and cycling. Despite
this, main focus has been on providing dedicated private mode parking at several subway
stations. At the same time, properly planned and comfortably-designed parking spaces
allocated to auto-rickshaw/bicycle-rickshaw at the metro stations are a curiosity. These
modes find spaces in a more organic nature themselves: near traffic islands, service lanes,
and quite habitually, distributed over onto the main carriageway. In the process, they not
only create traffic bottlenecks, but also make it hard for pedestrians to negotiate their way
safely amidst all this pandemonium. In many areas where bicycle-rickshaws are not
permitted to bear near the subway station, the road being an arterial, they stand on the minor
intersecting roads and pedestrians have to again negotiate speeding traffic to access them.
Last, but not the least, provision of pedestrian friendly infrastructure and environment on all
major and minor roads leading to transit stops are paramount for enhancing efficiency of
rapid transportation schemes. Giving due weightage to LMC planning may not merely draw
more users to shift from private modes of public transport, it may also in the long run help
retaining its existing riders hence increasing the overall efficiency of a public transit system.
Rather clearly, LMC needs to be an entire element of rapid transit schemes and urban
transport planning process.

36
6 RECOMMENDATIONS
6.1 Long Term Recommendations
Founding of a Unified Metropolitan Transport Authority with responsibilities for
land-use planning and transport investment with the charge of securing Transit
Oriented Development.
Re-balancing of investment in line with good words of the National Urban Transport
Policy towards public transportation, walking, and cycling and away from road
capacity enhancement schemes in urban regions.
Conception of an NMT Centre of Excellence, part of the Urban Metropolitan
Transport Authority (UMTA) mooted for Delhi and tooled with adequate support to
invest in cycle and walking infrastructure.
Standards of design to accord with those of the Pedestrian Design Guidelines set by
the United Traffic and Transportation Centre (UTTIPEC) in Delhi and forthcoming
Indian Cycle Design Guidelines based on Dutch CROW Cycle Design Manuals.
A significant thrust towards greater road safety, including the development of
objectives for the NMT Centre of Excellence and targets for the Traffic Police to cut
road casualties while increasing cycling and walking mode share.
Local bodies to be consulted on measures to improve road safety in their arena and to
be involved in small-scale adequately resourced local transport (walking/
cycling/public transport access) audits, improvement, and road safety schemes.
First appearance of demand management schemes to promote usage of public
transport, walking and cycling such as road pricing, stricter parking control, and
taking out subsidies on fuel and parking.
6.2 Short Term Recommendations
To facilitate multimodality of the type needed to boost public transit usage, a number of
different kinds of integration are needed:
Integration with land-use planning Making public transit links first and then developing high-density, mixed land use
areas around them, thereby reducing the need to move around, particularly by private
vehicles.
Opting for Transit-Oriented Development so that providing different services around
stations can be economically viable
Integration within and between different modes of conveyance
Physical Integration: Facilitating direct, easy, convenient, and safe approach to public
transport (providing secure, direct road crossings, tree-shaded paths, refreshments, cycle
and rickshaw parking, differently-able pavements and access levels).
Fare Integration: Enabling the public transit user to pay only once for a journey
involving different modes of transport.
Path Integration: Facilitating logical interchange points where passengers are able to
change from one vehicle or style to another conveniently and safely.

37
Data Integration: Enabling a ‘one-stop-shop’ for public transit users, bicyclists, and
pedestrians to clear data on whatever journey they wish to transmit using these styles.
Institutional Integration: Ensuring that different public transit providers see themselves
as part of a network and offer connections to other types of transit, walking, and cycling
for seamless connectivity.
Service (timetabling): Reduce waiting times through synchronizing time tables of
complementary modes.
Recommendations for a better walking environment for pedestrians
Insertion of a suitable methodology and plan to alter streets in business with the
Pedestrian Design Guide- lines
Safety buffer for pedestrians..
Better quality street furniture.
Tree shading.
Spaces for hawkers to provide road users with refreshments,
Spots to congregate, and require a breath away from traffic.
Walking infrastructure like sidewalk, crosswalk skywalk, subway etc.
Recommendations for a better cycling environment
Infrastructure should be developed. Separate cycle lanes should be provided
Smart card facilities should be provided at all stations.
Intermediate stations should be provided at major city centre so that cycle need not to
be returned at the same stations
Organizing cycle rally and creating awareness will attract many youth.
Provide showers and lockers at offices to those who cycle to work.
Proper incentives can be given to people who use cycle to work.
Government can declare Sunday as a bicycle compulsory day.
Recommendations for a feeder buses
Provide feeder buses for the 5km radius around metro.
Increasing the number of buses during off-peak hour.
Currently feeder buses are not operating on all routes, so government should at least
provide at major routes
Recommendations for a better infrastructure for roads
Establish signage boards and marking to reach metro stations
Provide curbs and ramps at all crossing with gentle crossings
Clear and safe crossing
Adequate lighting during night.
Station Area planning (SAP)
A station area is more than just an area adjacent to a transit node. It is a place of connectivity where
different modes of transportation – from walking to riding transit – come together seamlessly and
where there is a concentration of working, living, shopping and playing (Metrolinx 2011). More than
its adjacency to a mass transit station defines a well functioning station area. A station area is
described by the ease and number of connections it offers its users and the multiple activities that
occur here. Station area plans must take into account transportation and circulation issues,
38
urban design and place making, and the public infrastructure that make for great
neighborhoods and high quality transit-oriented Development.
References Bhat, Aparna. 'The Political Economy of Auto-Rickshaw Fare-Setting in Mumbai'. SSRN
Journal n. page. Web.
EMBARQ India, Bus Karo 2.0: Case Studies from India. World Resources Institute, 2011.
Print.
C. Xie, H. L. Gong and F. H. Wang, "A Solution for the Last Mile Problem of the Beijing
Rapid Transit Network: Local shuttle bus system", 18th International Conference on
Geoinformatics, pp.l-6, 2010
Gupta, Agarwal(2008) “Role Of Cycle Rickshaws As A Potential Feeder Mode To Delhi
Metro” 23rd ARRB Conference – Research Partnering with Practitioners, Adelaide
Australia
Bus Karo 2.0 – Case Studies from India Embarq-India
Los Angeles County Metropolitan Transportation Authority-Metro, First Last Mile Strategic
Plan: Path Planning Guidelines. 2013. Web. 16 Jan. 2015.
Mani, Akshay, Madhav Pai, and Rishi Aggarwal. 'Sustainable Urban Transport in India:
Role of the Auto-Rickshaw Sector'. Web. 16 Jan. 2015.
WWF-India, The Alternative Urban Futures Report Urbanisation & Sustainability in India:
An Interdependent Agenda. 2008. Print.

39
7 ANNEXURES
7.1 Annexure 1: Questionnaire for Origin-Destination Ground
Survey
COMMUTER SURVEY
1. Commuter Details Name Phone Number
2. Survey Timings
DD MM YYYY hh mm AM/PM
Date / Time / / : -
3. Commuter Location
Metro City Bus Inter State Bus Inter City Train Auto Rickshaw
4. Name of Location
5. Trip Information for the journey from Origin/Home/Work to Public Transport
Origin
Distance from Origin to Public Transport (Km)
Mode
Travel Time (Min)
Fare (Rs)
6. Trip Information for the journey from Public Transport to Destination/Home/Work
Destination
Distance from
Public Transport to
Destination (Km)
Mode Travel Time (Min)
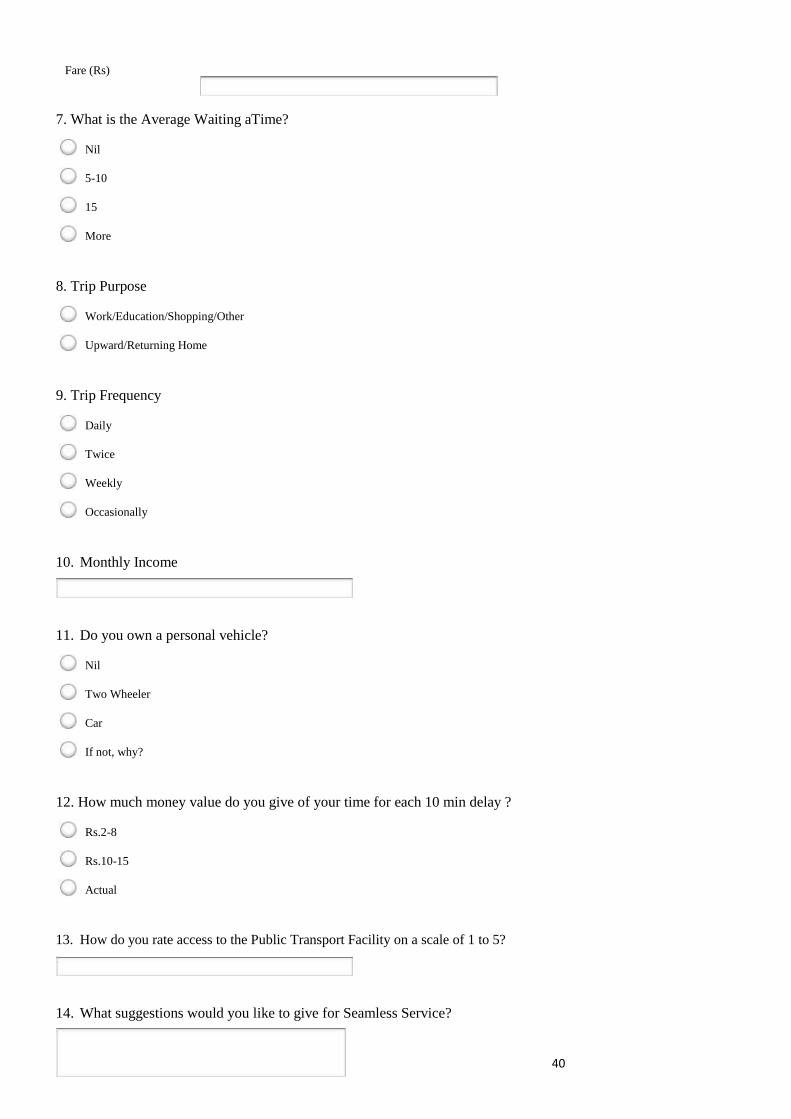
40
Fare (Rs)
7. What is the Average Waiting aTime?
Nil
5-10
15
More
8. Trip Purpose
Work/Education/Shopping/Other
Upward/Returning Home
9. Trip Frequency
Daily
Twice
Weekly
Occasionally
10. Monthly Income 11. Do you own a personal vehicle?
Nil
Two Wheeler
Car
If not, why?
12. How much money value do you give of your time for each 10 min delay ?
Rs.2-8
Rs.10-15
Actual
13. How do you rate access to the Public Transport Facility on a scale of 1 to 5?
14. What suggestions would you like to give for Seamless Service?
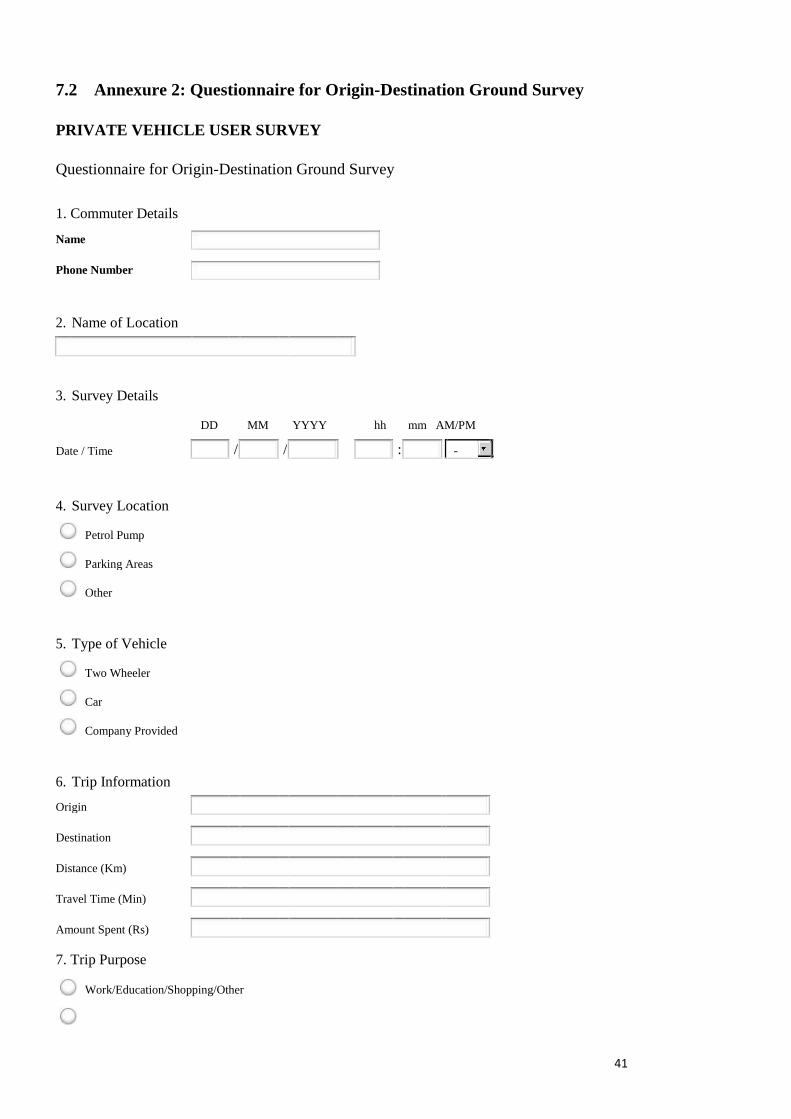
41
7.2 Annexure 2: Questionnaire for Origin-Destination Ground Survey
PRIVATE VEHICLE USER SURVEY
Questionnaire for Origin-Destination Ground Survey 1. Commuter Details Name Phone Number
2. Name of Location
3. Survey Details
DD MM YYYY hh mm AM/PM
Date / Time
/
/
:
-
4. Survey Location
Petrol Pump
Parking Areas
Other
5. Type of Vehicle
Two Wheeler
Car
Company Provided
6. Trip Information
Origin
Destination
Distance (Km)
Travel Time (Min)
Amount Spent (Rs)
7. Trip Purpose
Work/Education/Shopping/Other
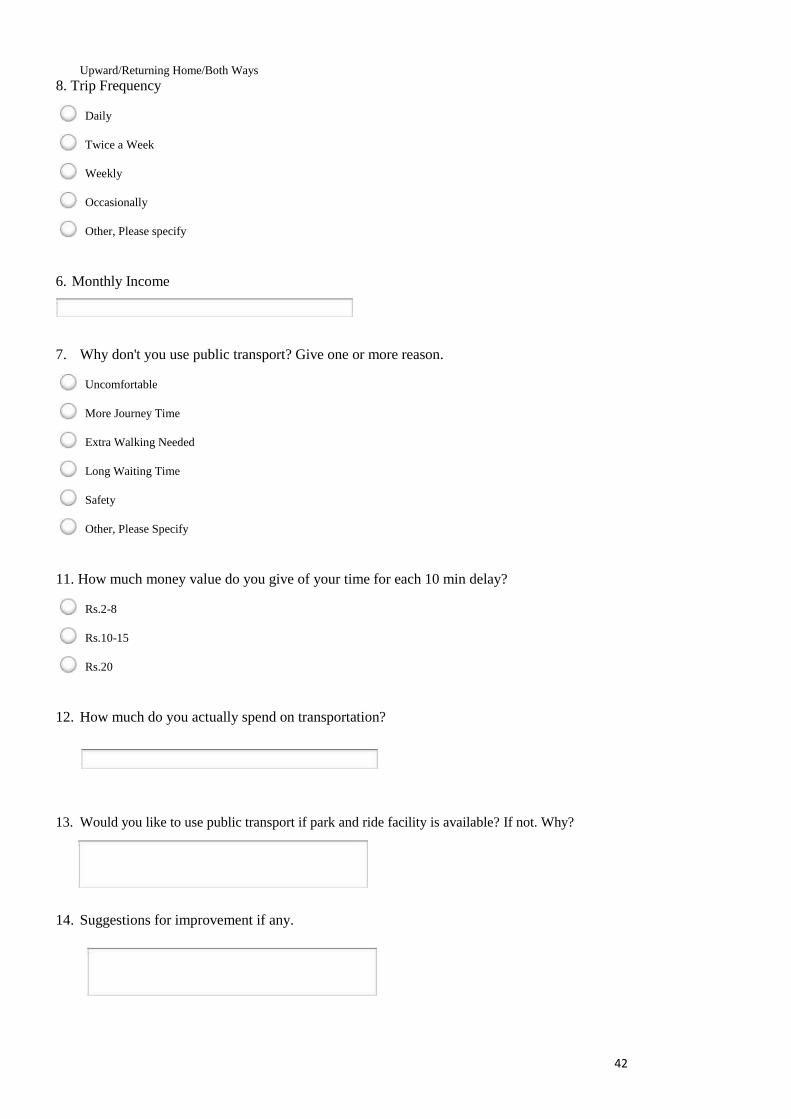
42
Upward/Returning Home/Both Ways 8. Trip Frequency
Daily
Twice a Week
Weekly
Occasionally
Other, Please specify
6. Monthly Income 7. Why don't you use public transport? Give one or more reason.
Uncomfortable
More Journey Time
Extra Walking Needed
Long Waiting Time
Safety
Other, Please Specify
11. How much money value do you give of your time for each 10 min delay?
Rs.2-8
Rs.10-15
Rs.20
12. How much do you actually spend on transportation? 13. Would you like to use public transport if park and ride facility is available? If not. Why?
14. Suggestions for improvement if any.

43
7.3 Annexure 3: Questionnaire for Origin-Destination Ground
Survey
IPT OPERATOR SURVEY INTERMEDIATE PUBLIC TRANSPORT OPERATOR 1. Operator Details Name Phone Number
2. Type of vehicle
Bus
Auto Rickshaw
E-Rickshaw
Mini Van Other (please specify) 3 Area of Operation and Corresponding Charges (Flat/Variable) 4 Do you get any subsidy from the government? 5 Whether the vehicle is owned or rented? If Rented, how much do
you pay? If Rented, who is
responsible for O&M?
6. Cost of operation of vehicle Running Cost
Operation & Maintenance Parking Permit

42
7. What suggestions do you have for improving intermediate public transport

42
7.4 Annexure 4: Survey Data Analysis
i) COMMUTER SURVEY
Field Criteria Frequency Percent Remarks
1. Modal Split for Origin to PT(Peak Hours)
Auto 35 20
Bus 48 27 Rickshaw 43 25 Private(2W+Car ) 2 1 Walk 35 20 E-Rickshaw 13 7
2. Modal Split PT to Destination (Peak Hours)
Auto 27 16
Bus 21 12 Rickshaw 39 22 Private(2W+Car ) 3 2 Walk 78 45 E-Rickshaw 5 3
3. Modal Split for Origin to PT(Off-Peak Hours)
Auto 39 25
Bus 40 25 Rickshaw 26 16 Private(2W+Car ) 7 4 Walk 38 24 E-Rickshaw 10 6
4. Modal Split PT to Destination (Off-Peak Hours)
Auto 43 27
Bus 25 16 Rickshaw 16 10 Private(2W+Car ) 4 2 Walk 69 43 E-Rickshaw 4 2
5. Average Waiting Time(Peak Hours) in Minutes
0 68 37.77
5-10 88 48.88 15 20 11.11 More 4 2.22
6. Average Waiting Time(Off-Peak Hours) in Minutes
0 43 17.68
5-10 89 30.48 15 20 9.14 More 13 5.48
7. Trip Purpose Work/Education 320 92.7 Upward/ Onward 25 7.3
8. Trip Frequency Daily 254 80.55 Twice 33 6.66 Weekly 43 11.11 Occasionally 15 1.66
9. Money Value For Each !0 min Delay (in Rupees)
2-8 179 48.33
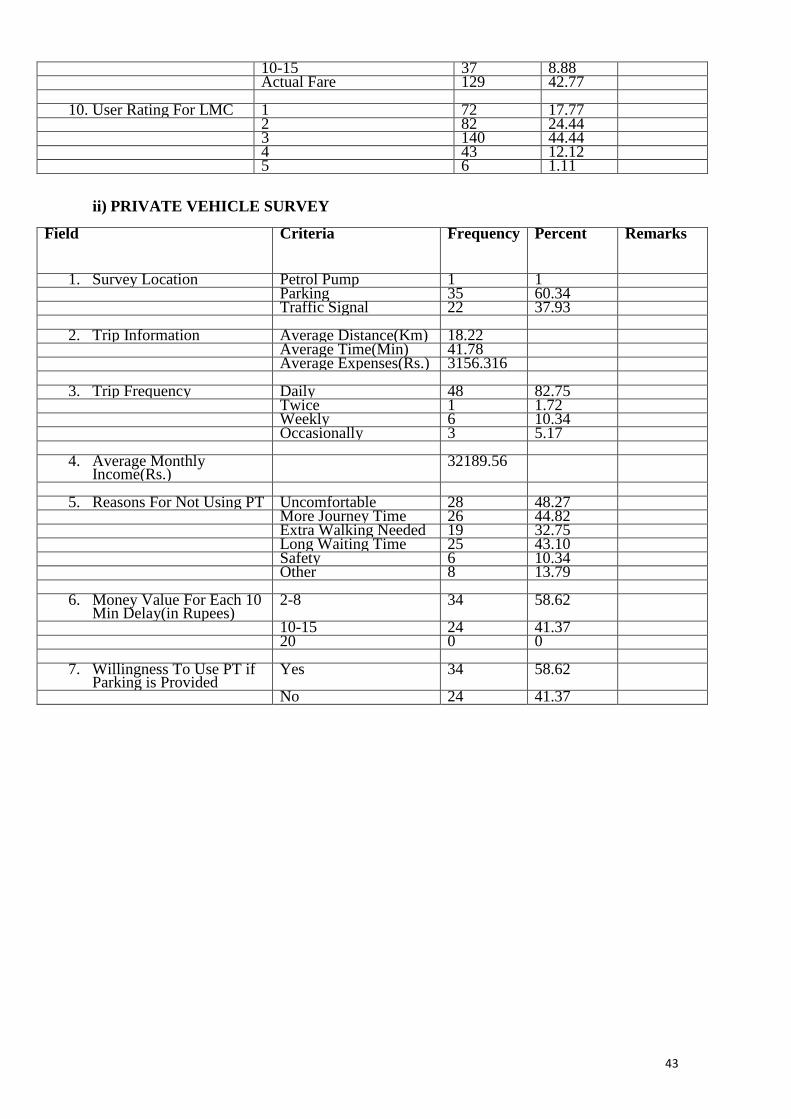
43
10-15 37 8.88 Actual Fare 129 42.77
10. User Rating For LMC 1 72 17.77 2 82 24.44 3 140 44.44 4 43 12.12 5 6 1.11
ii) PRIVATE VEHICLE SURVEY
Field Criteria Frequency Percent Remarks
1. Survey Location Petrol Pump 1 1 Parking 35 60.34 Traffic Signal 22 37.93
2. Trip Information Average Distance(Km) 18.22 Average Time(Min) 41.78 Average Expenses(Rs.) 3156.316
3. Trip Frequency Daily 48 82.75 Twice 1 1.72 Weekly 6 10.34 Occasionally 3 5.17
4. Average Monthly Income(Rs.)
32189.56
5. Reasons For Not Using PT Uncomfortable 28 48.27
More Journey Time 26 44.82 Extra Walking Needed 19 32.75 Long Waiting Time 25 43.10 Safety 6 10.34 Other 8 13.79
6. Money Value For Each 10 Min Delay(in Rupees)
2-8 34 58.62
10-15 24 41.37 20 0 0
7. Willingness To Use PT if Parking is Provided
Yes 34 58.62
No 24 41.37

44
iii) INTERMEDIATE PUBLIC TRANSPORT USER
Field Criteria Frequency Percent Remarks
1. Type of Vehicle Bus 2 4.447 Auto 18 40 E-Rickshaw 3 6.66 Minivan 5 11.11 Cycle Rickshaw 17 37.77
2. Any Subsidy from Government?
Yes 0 0
No 45 100
3. Vehicle Owned or Rented?
Yes 24 53.33
No 21 46.66
4. Average Cost Of Operation of Vehicle(in Rupees)
Bus 62500
Auto 6963.88 E-Rickshaw 2583.3 Mini Van 15190 Cycle Rickshaw 1659.41
5. Average O&M Cost of Vehicle(in Rupees)
Bus 7000
Auto 2309.44 E-Rickshaw 533.33 Mini Van 1400 Cycle Rickshaw 68.18
Related Documents