1 Sensitivity of fit indices to detect misspecifications of growth shape in latent growth modeling Walter L. Leite University of Florida Laura M. Stapleton University of Maryland, Baltimore County E-mail of first author: [email protected]

Welcome message from author
This document is posted to help you gain knowledge. Please leave a comment to let me know what you think about it! Share it to your friends and learn new things together.
Transcript

1
Sensitivity of fit indices to detect misspecifications of growth
shape in latent growth modeling
Walter L. LeiteUniversity of FloridaLaura M. Stapleton
University of Maryland, Baltimore County
E-mail of first author: [email protected]

2
Linear model forLinear population growth
11
1
Level Linear Shape
1
0 1 2 3
Observationsat time 1
Observationsat time 2
Observationsat time 3
Observationsat time 4
Observationsat time 5
4
1
1 2 3 4 5
-10
-50
510
15
times
obse
rvat
ions

3
Nonlinear model for Nonlinear population growth
1
1 1
Level Linear Shape
1
01 2 3
Observationsat time 1
Observationsat time 2
Observationsat time 3
Observationsat time 4
Observationsat time 5
4
1
Linear Shape
-2-2
-1 1 -1
1 2 3 4 5
-10
-50
510
15
times
obse
rvat
ions

4
Linear model forNonlinear Population Growth
1 2 3 4 5
-10
-50
510
15
times
obse
rvat
ions
11
1
Level Linear Shape
1
0 1 2 3
Observationsat time 1
Observationsat time 2
Observationsat time 3
Observationsat time 4
Observationsat time 5
4
1
Would fit indices indicate that the linear model Would fit indices indicate that the linear model should be rejected?should be rejected?

5
How sensitive are fit indices to model misspecifications??
1. Omission of factor covariance: Hu and Bentler (1998) have found that TLI, CFI, MFI, IFI, RNI, Gamma and RMSEA are moderately sensitive and SRMR is the most sensitive.
2. Omission of cross-loading: Hu and Bentler(1998) have found that TLI, CFI, MFI, IFI, RNI, Gamma and RMSEA are very sensitive and SRMR is slightly less sensitive.
• Fan and Sivo (2005) have found that the sensitivity of fit indices does not depend on type of misspecification but depends on severity of misspecification.
How sensitive are fit indices to misspecifications of growth shape?

6
Research Questions of this Study
• Are fit indices sensitive to misspecifications of growth shape?1. Does the sensitivity of fit indices depend
on:a) Type of misspecification?b) The power to reject the null model?c) Sample size?d) Number of measurement occasions?
2. Does the Type I error rate allowed by fit indices with LGM depend on:a) The power to reject the null model?b) Sample size?c) Number of measurement occasions?

7
Method: Monte Carlo Simulation
• Conditions manipulated:1. Population growth shape:
a) Population with mixture of linear and nonlinear growth:
b) Population with piecewise growth:

8
Method: Monte Carlo Simulation2. Power to reject the null model:Obtained using Satorra and Saris (1985) method:
a) Slight misspecification – power = 0.4b) Moderate misspecification – power = 0.7c) Strong misspecification – power = 0.9
3. Misspecification: linear null model, correctly specified null model.
4. Sample size: 100, 200, 500, 1000, 20005. Number of measurement occasions: 5 and 6
Shape 1 Shape 2Nonlinear Population Growth
Piecewise Population Growth
5 times 0 1 2 3 4 -2 -1 1 -1 -26 times 0 1 2 3 4 5 -2 -1 1 1 -1 -2
5 times 0 1 2 2 2 0 0 0 1 26 times 0 1 2 3 3 3 0 0 0 0 1 2

9
Data Generation and analysis
• R function used to choose population values for the mean and variances of the level, first shape factor and second shape factor so that power to reject null model was either 0.4, 0.7 or 0.9.
• 60 fully-crossed conditions, 1000 datasets simulated per condition.
• Fit indices investigated:CFI, TLI, IFI, RMSEA, SRMR and MFI
• MPLUS 3.11 used to analyze data with two model specifications:
1. Analysis of covariance structure only.2. Analysis of mean and covariance structure.

10
Analysis of Simulation Results
• Results obtained for each fit index:1. Power to reject the misspecified
model Proportion of fit indices that would lead to rejection of the misspecified model.
2. Type I error rates Proportion of fit indices that would lead to rejection of a correctly specified model.
Criteria used for model rejection:TLI, IFI, CFI ≥ 0.95, MFI ≥ 0.9, RMSEA ≤ 0.06, SRMR ≤ 0.08

11
Analysis of Simulation Results
• For covariance structure models, results were obtained for all fit indices.
• For mean and structure models, results were obtained only for RMSEA, SRMR and MFI. Why? Because the calculation of the CFI, TLI and IFI depend on the chi-square of the baseline model. However, the baseline model imposed by MPLUS fits means perfectly.
• ANOVA was used to estimate the effects of misspecification, severity, number of measurements, growth shape, and sample size on the fit indices.
Only effects with partial η2 ≥ 0.05 were considered practically significant.

12
ANOVA Results (partial η2 ) for Covariance Structure Models
Conditions CFI TLI IFISpecification (A) 0.792 0.721 0.726Severity (B) 0.372 0.321 0.327Number of times (C) - 0.125 0.072Growth shape (D) - - -Sample size (E) - - -A X B 0.088 0.318 0.324A X C - 0.126 0.071B X D 0.079 0.06 -A X B X D 0.07 0.059 0.06
Conditions MFI RMSEA SRMRSpecification (A) 0.760 0.879 0.828Severity (B) 0.325 0.215 0.325Number of times (C) - 0.108 0.187Growth shape (D) - - -Sample size (E) - - 0.244A X B 0.324 0.213 0.308A X C - - 0.277C X D - - 0.098A X C X D - - 0.087

13
Power to reject null hypothesis with the CFI, TLI and IFI for Covariance
Structure Models
Severity Times Shape CFI TLI IFISlight 5 Nonlinear 0.12 0.43 0.12
Piecewise 0.08 0.30 0.086 Nonlinear 0.00 0.01 0.00
Piecewise 0.04 0.08 0.04Moderate 5 Nonlinear 0.58 0.88 0.58
Piecewise 0.48 0.85 0.476 Nonlinear 0.40 0.71 0.39
Piecewise 0.12 0.34 0.12Strong 5 Nonlinear 0.97 0.99 0.97
Piecewise 0.87 0.96 0.876 Nonlinear 0.90 0.95 0.89
Piecewise 0.50 0.82 0.49

14
Power to reject null hypothesis with the RMSEA, SRMR and MFI for Covariance
Structure ModelsSeverity Times Shape MFI RMSEA SRMRSlight 5 Nonlinear 0.01 0.95 0.47
Piecewise 0.01 0.94 0.496 Nonlinear 0.01 0.88 0.01
Piecewise 0.01 0.90 0.25Moderate 5 Nonlinear 0.06 0.99 0.88
Piecewise 0.06 0.99 0.956 Nonlinear 0.07 0.97 0.16
Piecewise 0.07 0.98 0.83Strong 5 Nonlinear 0.49 1.00 0.99
Piecewise 0.40 1.00 0.996 Nonlinear 0.43 0.99 0.37
Piecewise 0.47 0.99 0.98

15
Type I error rates with covariance structure models
2χSample CFI TLI IFI100 6.3% 0.4% 5.4% 2.3%200 5.8% 0.0% 0.6% 0.2%500 5.0% 0.0% 0.0% 0.0%1000 5.4% 0.0% 0.0% 0.0%2000 5.1% 0.0% 0.0% 0.0%
Sample MFI RMSEA SRMR100 0.0% 29.8% 3.5%200 0.0% 18.3% .1%500 0.0% 4.0% 0.0%1000 0.0% .4% 0.0%2000 0.0% 0.0% 0.0%

16
ANOVA results (partial η2) for mean and covariance structure models
Condition MFI RMSEA SRMRSpecification (A) 0.746 0.791 0.801Severity (B) 0.297 0.193 0.147Number of times (C) - 0.077 0.190Growth shape (D) - - 0.297Sample size (E) - - 0.397A X B 0.298 0.194 0.144A X C - 0.06 0.297A X D - - 0.173

17
Power to reject null hypothesis with the RMSEA, SRMR and MFI for
Mean and Covariance Structure Models
Severity Times Shape MFI RMSEA SRMRSlight 5 Nonlinear 0.01 0.92 0.06
Piecewise 0.01 0.93 0.266 Nonlinear 0.02 0.85 0.01
Piecewise 0.02 0.84 0.13Moderate 5 Nonlinear 0.07 0.98 0.48
Piecewise 0.06 0.98 0.886 Nonlinear 0.08 0.96 0.03
Piecewise 0.08 0.96 0.23Strong 5 Nonlinear 0.44 1.00 0.21
Piecewise 0.41 1.00 0.986 Nonlinear 0.44 0.99 0.05
Piecewise 0.42 0.99 0.19

18
Type I error rates with mean and covariance structure models
2χSample MFI RMSEA SRMR100 7.5% 0.1% 29.5% 1.3%200 11.3% 0.0% 23.6% 0.0%500 11.1% 0.0% 10.3% 0.0%1000 11.0% 0.0% 7.4% 0.0%2000 11.1% 0.0% 6.6% 0.0%
19
Discussion
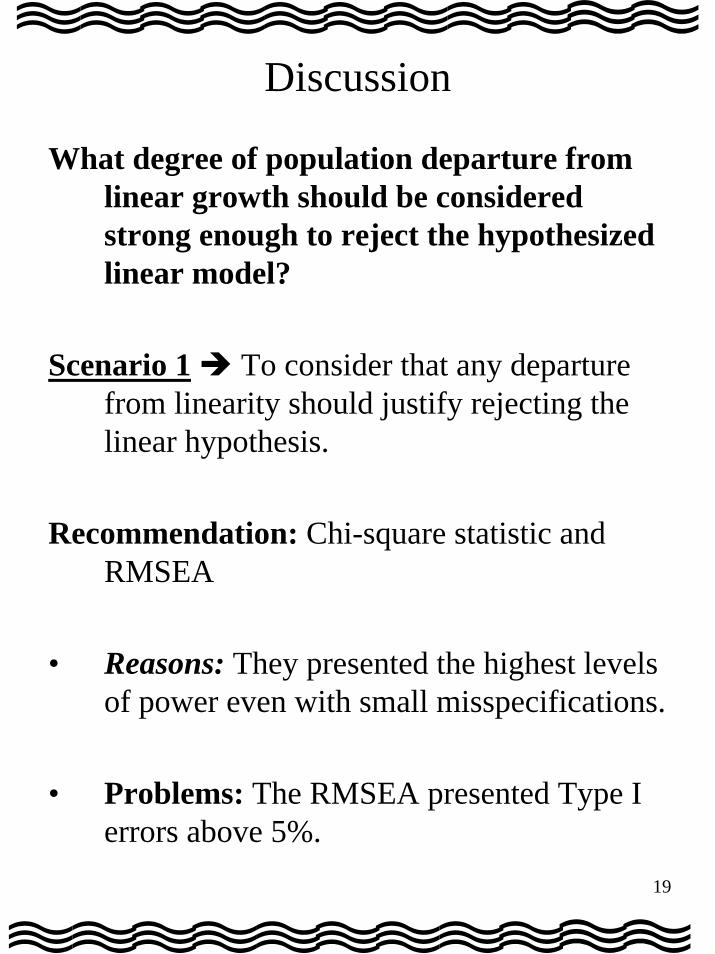
What degree of population departure from linear growth should be considered strong enough to reject the hypothesized linear model?
Scenario 1 To consider that any departure from linearity should justify rejecting the linear hypothesis.
Recommendation: Chi-square statistic and RMSEA
• Reasons: They presented the highest levels of power even with small misspecifications.
• Problems: The RMSEA presented Type I errors above 5%.

20
Discussion
Scenario 2 To consider that only moderate and strong growth shape misspecification should justify rejecting the linear hypothesis.
Recommendation: TLI
• Reasons: It allowed power levels of 0.8 or higher for most conditions under moderate and strong misspecification.
• Problems: Although the SRMR provided adequate levels of power with piecewise models, it provided very low power with Nonlinear models. Furthermore, the SRMR was found to depend on sample size and number of measurement times.

21
Discussion
Scenario 3 To consider that only strong growth shape misspecification should justify rejecting the linear hypothesis.
Recommendation: CFI and IFI
• Reasons: They provided power levels higher than 0.8 with most conditions with strong misspecification, but showed low power levels with slight and moderate misspecification.
• Problems: Marsh and Grayson (2005) found that the IFI is positively biased for misspecified models and it penalizes model parsimony and rewards complexity. The MFI did not provide adequate power in any of the conditions included in this study.

22
Conclusions
• There are no set guidelines of what amount of misspecification of the population growth shape should be considered “practically significant.
• Because of the different sensitivity of the RMSEA, TLI and CFI to misspecifications of growth shape, the researcher can use these fit indices simultaneously to inform the decision about the linear growth hypothesis:
RMSEA ≥ 0.06, TLI, CFI ≥ 0.95 Slight shape misspecification
RMSEA ≥ 0.06, TLI ≤ 0.95 , CFI ≥ 0.95 Moderate shape misspecification
RMSEA ≥ 0.06, TLI ≤ 0.95 , CFI ≤ 0.95 Strong shape misspecification
Related Documents