Semiautomated geologic mapping using self-organizing maps and airborne geophysics in the Brazilian Amazon Cleyton de Carvalho Carneiro 1 , Stephen James Fraser 2 , Alvaro Penteado Crósta 1 , Adalene Moreira Silva 3 , and Carlos Eduardo de Mesquita Barros 4 ABSTRACT A self-organizing map (SOM) approach has been used to provide an integrated spatial analysis and classification of airborne geophysical data collected over the Brazilian Ama- zon. Magnetic and gamma ray spectrometric data were used to extract geophysical signatures related to the spatial distri- bution of rock types and to produce a geologic map over the prospective Anapu-Tuerê region. Particular emphasis was given to discriminating and identifying rock types, and the processes related to gold mineralization, which are known to occur in the Anapu-Tuerê region. SOM was able to identify and map distinctive geophysical signatures re- lated to the various geologic units identified on the published geologic map. Furthermore, SOM was able to identify and enhance very subtle signatures derived jointly from the mag- netic and gamma ray spectrometric data that could be related to geologic processes present in the area. These results de- monstrate the effectiveness of using SOM as a tool for geo- physical data analysis and for semiautomated mapping in regions such as the Amazon. INTRODUCTION The analysis of large multivariate data sets can be improved by the use of computational tools, such as clustering and classification techniques (Pires and Harthill, 1989; Bohan-Carter, 1994; Weng, 2010). These computer-assisted methods provide the robust quan- titative means to identify similar signatures within groups of samples, or pixels found in large, multilayered coregistered spatial data sets, that otherwise would be difficult to detect. There are several studies on the application of unsupervised clas- sification to geophysical data sets for geologic mapping (Harris, 1989; Pires, 1990; Graham and Bonham-Carter, 1993; Cainzos, 2002). These studies provide important contributions to the way that geologic information can be extracted from large geophysical data sets and used for geologic mapping in an efficient, semiautomated manner. However, these authors also pointed out that, in some cases, the sensitivity of the clustering algorithm was not sufficient to identify geologically significant, yet subtle, color variations in the ternary radioelement map (Harris, 1989). The self-organizing map (SOM) method is a tool for the analysis and visualization of high-dimensional data, based on principles of vector quantization (Kohonen, 2001). It belongs to a class of unsupervised classifiers that are trained by competitive learning (Kohonen, 1982, 2001). SOM has been proven particularly efficient for the visualization of similarities and clustering in a high-dimen- sional space. Fraser and Dickson (2007) state that SOM can be con- sidered an exploratory data analysis tool, and the method can be used to perform broad categories of operations, such as prediction or estimation, clustering, classification, pattern recognition, and/or noise reduction. SOM is an unsupervised method; therefore, no prior knowledge is required regarding the nature or number of groupings within the data set. SOM also can be applied to catego- rical and continuous variables. All of these advantages make SOM an ideal first technique for the analysis of complex and disparate geoscientific data. Research has demonstrated many contributions of SOM analyses on geologic, mining, and exploration data sets (Fraser et al., 2006; Bierlein et al., 2008). SOM also has been applied as a classification tool of remote sensing imagery (e.g., Merényi, 1998; Ji, 2000; Manuscript received by the Editor 11 August 2011; revised manuscript received 2 February 2012; published online 19 June 2012. 1 University of Campinas, Geosciences Institute, Department of Geology and Natural Resources, Campinas, SP, Brazil. E-mail: [email protected]; [email protected]. 2 Commonwealth Scientific and Industrial Research Organization (CSIRO), Minerals Down Under Flagship, Kenmore, QLD, Australia. E-mail: [email protected]. 3 University of Brasília (UNB), Geoscience Institute, Laboratory of Applied Geophysics, Brasília, DF, Brazil. E-mail: [email protected]. 4 Federal University of Paraná (UFPR), Geology Department, Curitiba, PR, Brazil. E-mail: [email protected]. © 2012 Society of Exploration Geophysicists. All rights reserved. K17 GEOPHYSICS, VOL. 77, NO. 4 (JULY-AUGUST 2012); P. K17–K24, 4 FIGS., 3 TABLES. 10.1190/GEO2011-0302.1

Welcome message from author
This document is posted to help you gain knowledge. Please leave a comment to let me know what you think about it! Share it to your friends and learn new things together.
Transcript
Semiautomated geologic mapping using self-organizingmaps and airborne geophysics in the Brazilian Amazon
Cleyton de Carvalho Carneiro1, Stephen James Fraser2, Alvaro Penteado Crósta1, AdaleneMoreira Silva3, and Carlos Eduardo de Mesquita Barros4
ABSTRACT
A self-organizing map (SOM) approach has been used toprovide an integrated spatial analysis and classification ofairborne geophysical data collected over the Brazilian Ama-zon. Magnetic and gamma ray spectrometric data were usedto extract geophysical signatures related to the spatial distri-bution of rock types and to produce a geologic map over theprospective Anapu-Tuerê region. Particular emphasis wasgiven to discriminating and identifying rock types, andthe processes related to gold mineralization, which areknown to occur in the Anapu-Tuerê region. SOM was ableto identify and map distinctive geophysical signatures re-lated to the various geologic units identified on the publishedgeologic map. Furthermore, SOM was able to identify andenhance very subtle signatures derived jointly from the mag-netic and gamma ray spectrometric data that could be relatedto geologic processes present in the area. These results de-monstrate the effectiveness of using SOM as a tool for geo-physical data analysis and for semiautomated mapping inregions such as the Amazon.
INTRODUCTION
The analysis of large multivariate data sets can be improved bythe use of computational tools, such as clustering and classificationtechniques (Pires and Harthill, 1989; Bohan-Carter, 1994; Weng,2010). These computer-assisted methods provide the robust quan-titative means to identify similar signatures within groups of
samples, or pixels found in large, multilayered coregistered spatialdata sets, that otherwise would be difficult to detect.There are several studies on the application of unsupervised clas-
sification to geophysical data sets for geologic mapping (Harris,1989; Pires, 1990; Graham and Bonham-Carter, 1993; Cainzos,2002). These studies provide important contributions to the way thatgeologic information can be extracted from large geophysical datasets and used for geologic mapping in an efficient, semiautomatedmanner. However, these authors also pointed out that, in somecases, the sensitivity of the clustering algorithm was not sufficientto identify geologically significant, yet subtle, color variations in theternary radioelement map (Harris, 1989).The self-organizing map (SOM) method is a tool for the analysis
and visualization of high-dimensional data, based on principles ofvector quantization (Kohonen, 2001). It belongs to a class ofunsupervised classifiers that are trained by competitive learning(Kohonen, 1982, 2001). SOM has been proven particularly efficientfor the visualization of similarities and clustering in a high-dimen-sional space. Fraser and Dickson (2007) state that SOM can be con-sidered an exploratory data analysis tool, and the method can beused to perform broad categories of operations, such as predictionor estimation, clustering, classification, pattern recognition, and/ornoise reduction. SOM is an unsupervised method; therefore, noprior knowledge is required regarding the nature or number ofgroupings within the data set. SOM also can be applied to catego-rical and continuous variables. All of these advantages make SOMan ideal first technique for the analysis of complex and disparategeoscientific data.Research has demonstrated many contributions of SOM analyses
on geologic, mining, and exploration data sets (Fraser et al., 2006;Bierlein et al., 2008). SOM also has been applied as a classificationtool of remote sensing imagery (e.g., Merényi, 1998; Ji, 2000;
Manuscript received by the Editor 11 August 2011; revised manuscript received 2 February 2012; published online 19 June 2012.1University of Campinas, Geosciences Institute, Department of Geology and Natural Resources, Campinas, SP, Brazil. E-mail: [email protected];
[email protected] Scientific and Industrial Research Organization (CSIRO), Minerals Down Under Flagship, Kenmore, QLD, Australia.
E-mail: [email protected] of Brasília (UNB), Geoscience Institute, Laboratory of Applied Geophysics, Brasília, DF, Brazil. E-mail: [email protected] University of Paraná (UFPR), Geology Department, Curitiba, PR, Brazil. E-mail: [email protected].
© 2012 Society of Exploration Geophysicists. All rights reserved.
K17
GEOPHYSICS, VOL. 77, NO. 4 (JULY-AUGUST 2012); P. K17–K24, 4 FIGS., 3 TABLES.10.1190/GEO2011-0302.1
Gonçalves et al., 2008; Bedini, 2009; Li and Eastman, 2010).However, little work has been done on the use of SOM to analyzeairborne geophysical data sets.Constraints for geologic mapping in the Amazon region include
extensive weathering combined with a dense vegetation cover. Inaddition, access to outcrops often is hampered by the lack of roadsin this region.The Anapu-Tuerê area is located in the central east region of Pará
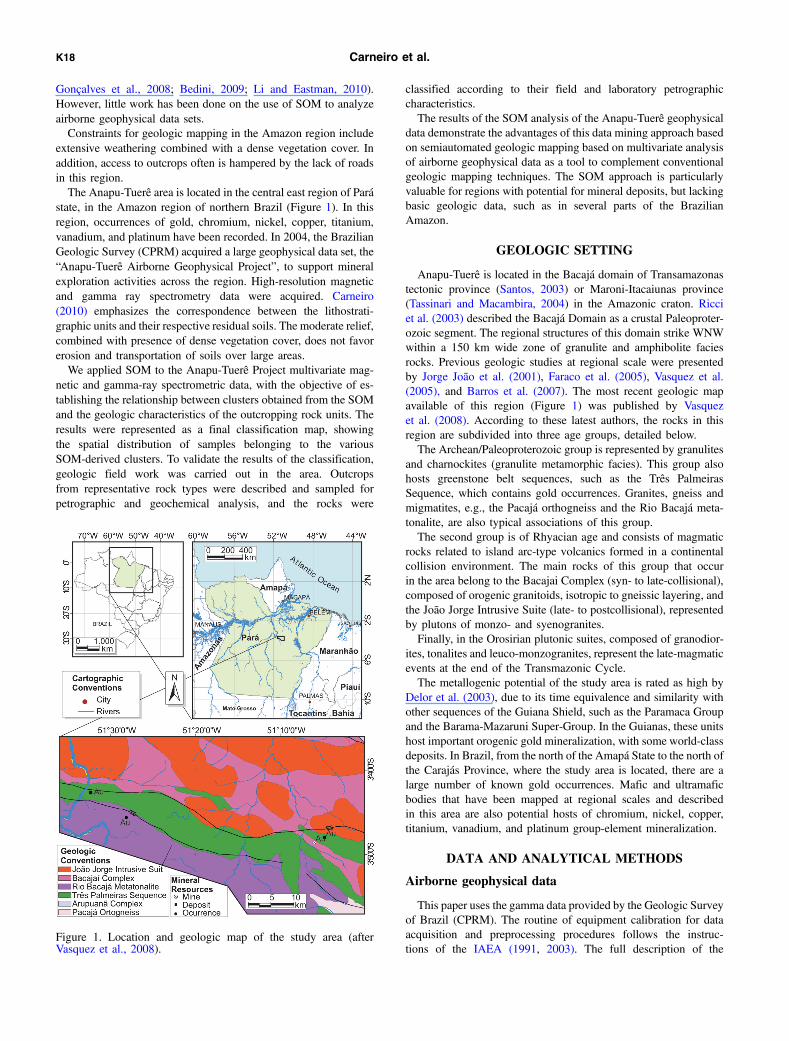
state, in the Amazon region of northern Brazil (Figure 1). In thisregion, occurrences of gold, chromium, nickel, copper, titanium,vanadium, and platinum have been recorded. In 2004, the BrazilianGeologic Survey (CPRM) acquired a large geophysical data set, the“Anapu-Tuerê Airborne Geophysical Project”, to support mineralexploration activities across the region. High-resolution magneticand gamma ray spectrometry data were acquired. Carneiro(2010) emphasizes the correspondence between the lithostrati-graphic units and their respective residual soils. The moderate relief,combined with presence of dense vegetation cover, does not favorerosion and transportation of soils over large areas.We applied SOM to the Anapu-Tuerê Project multivariate mag-
netic and gamma-ray spectrometric data, with the objective of es-tablishing the relationship between clusters obtained from the SOMand the geologic characteristics of the outcropping rock units. Theresults were represented as a final classification map, showingthe spatial distribution of samples belonging to the variousSOM-derived clusters. To validate the results of the classification,geologic field work was carried out in the area. Outcropsfrom representative rock types were described and sampled forpetrographic and geochemical analysis, and the rocks were
classified according to their field and laboratory petrographiccharacteristics.The results of the SOM analysis of the Anapu-Tuerê geophysical
data demonstrate the advantages of this data mining approach basedon semiautomated geologic mapping based on multivariate analysisof airborne geophysical data as a tool to complement conventionalgeologic mapping techniques. The SOM approach is particularlyvaluable for regions with potential for mineral deposits, but lackingbasic geologic data, such as in several parts of the BrazilianAmazon.
GEOLOGIC SETTING
Anapu-Tuerê is located in the Bacajá domain of Transamazonastectonic province (Santos, 2003) or Maroni-Itacaiunas province(Tassinari and Macambira, 2004) in the Amazonic craton. Ricciet al. (2003) described the Bacajá Domain as a crustal Paleoproter-ozoic segment. The regional structures of this domain strike WNWwithin a 150 km wide zone of granulite and amphibolite faciesrocks. Previous geologic studies at regional scale were presentedby Jorge João et al. (2001), Faraco et al. (2005), Vasquez et al.(2005), and Barros et al. (2007). The most recent geologic mapavailable of this region (Figure 1) was published by Vasquezet al. (2008). According to these latest authors, the rocks in thisregion are subdivided into three age groups, detailed below.The Archean/Paleoproterozoic group is represented by granulites
and charnockites (granulite metamorphic facies). This group alsohosts greenstone belt sequences, such as the Três PalmeirasSequence, which contains gold occurrences. Granites, gneiss andmigmatites, e.g., the Pacajá orthogneiss and the Rio Bacajá meta-tonalite, are also typical associations of this group.The second group is of Rhyacian age and consists of magmatic
rocks related to island arc-type volcanics formed in a continentalcollision environment. The main rocks of this group that occurin the area belong to the Bacajai Complex (syn- to late-collisional),composed of orogenic granitoids, isotropic to gneissic layering, andthe João Jorge Intrusive Suite (late- to postcollisional), representedby plutons of monzo- and syenogranites.Finally, in the Orosirian plutonic suites, composed of granodior-
ites, tonalites and leuco-monzogranites, represent the late-magmaticevents at the end of the Transmazonic Cycle.The metallogenic potential of the study area is rated as high by
Delor et al. (2003), due to its time equivalence and similarity withother sequences of the Guiana Shield, such as the Paramaca Groupand the Barama-Mazaruni Super-Group. In the Guianas, these unitshost important orogenic gold mineralization, with some world-classdeposits. In Brazil, from the north of the Amapá State to the north ofthe Carajás Province, where the study area is located, there are alarge number of known gold occurrences. Mafic and ultramaficbodies that have been mapped at regional scales and describedin this area are also potential hosts of chromium, nickel, copper,titanium, vanadium, and platinum group-element mineralization.
DATA AND ANALYTICAL METHODS
Airborne geophysical data
This paper uses the gamma data provided by the Geologic Surveyof Brazil (CPRM). The routine of equipment calibration for dataacquisition and preprocessing procedures follows the instruc-tions of the IAEA (1991, 2003). The full description of the
Figure 1. Location and geologic map of the study area (afterVasquez et al., 2008).
K18 Carneiro et al.
calibration on the acquisition and initial processing is presented inCPRM (2004).Acquisition of the airborne geophysical data was part of the Ana-
pu-Tuerê Project (Table 1) carried out between August and October,2004. The geophysical survey covered an area of 24; 735 km2, con-sisting of 53,331 km of line profiles. These profiles were placed in310 lines of production and 30 control lines.
Geophysical data preprocessing
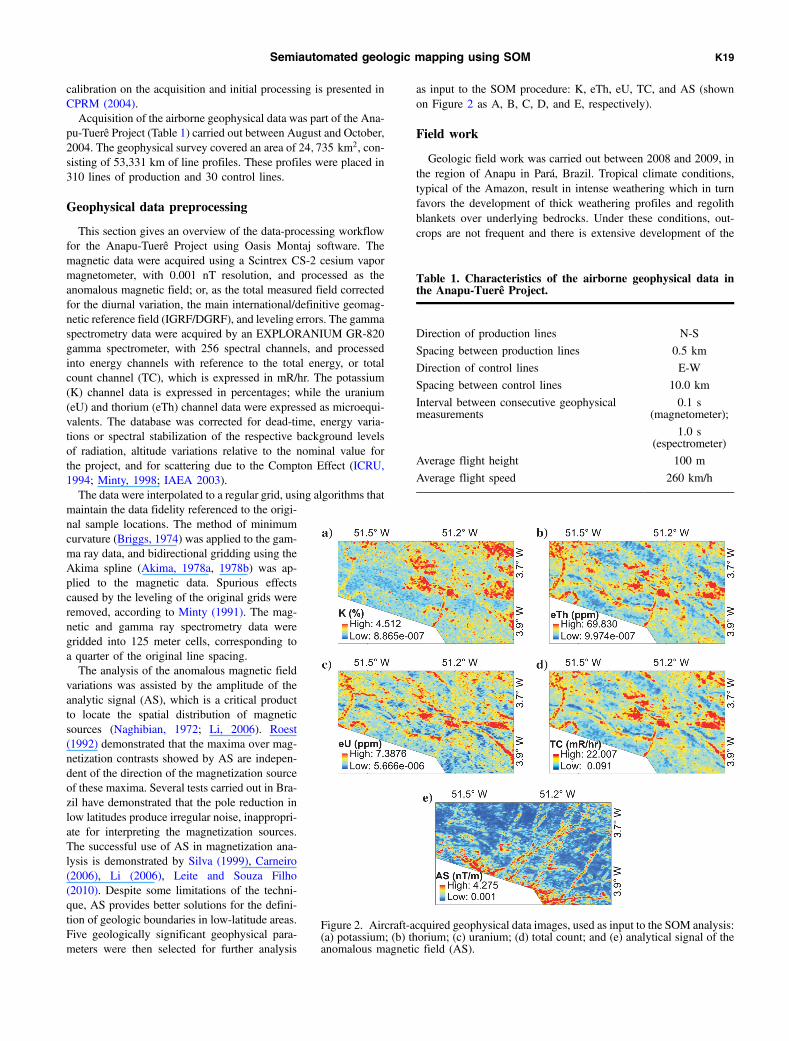
This section gives an overview of the data-processing workflowfor the Anapu-Tuerê Project using Oasis Montaj software. Themagnetic data were acquired using a Scintrex CS-2 cesium vapormagnetometer, with 0.001 nT resolution, and processed as theanomalous magnetic field; or, as the total measured field correctedfor the diurnal variation, the main international/definitive geomag-netic reference field (IGRF/DGRF), and leveling errors. The gammaspectrometry data were acquired by an EXPLORANIUM GR-820gamma spectrometer, with 256 spectral channels, and processedinto energy channels with reference to the total energy, or totalcount channel (TC), which is expressed in mR/hr. The potassium(K) channel data is expressed in percentages; while the uranium(eU) and thorium (eTh) channel data were expressed as microequi-valents. The database was corrected for dead-time, energy varia-tions or spectral stabilization of the respective background levelsof radiation, altitude variations relative to the nominal value forthe project, and for scattering due to the Compton Effect (ICRU,1994; Minty, 1998; IAEA 2003).The data were interpolated to a regular grid, using algorithms that
maintain the data fidelity referenced to the origi-nal sample locations. The method of minimumcurvature (Briggs, 1974) was applied to the gam-ma ray data, and bidirectional gridding using theAkima spline (Akima, 1978a, 1978b) was ap-plied to the magnetic data. Spurious effectscaused by the leveling of the original grids wereremoved, according to Minty (1991). The mag-netic and gamma ray spectrometry data weregridded into 125 meter cells, corresponding toa quarter of the original line spacing.The analysis of the anomalous magnetic field
variations was assisted by the amplitude of theanalytic signal (AS), which is a critical productto locate the spatial distribution of magneticsources (Naghibian, 1972; Li, 2006). Roest(1992) demonstrated that the maxima over mag-netization contrasts showed by AS are indepen-dent of the direction of the magnetization sourceof these maxima. Several tests carried out in Bra-zil have demonstrated that the pole reduction inlow latitudes produce irregular noise, inappropri-ate for interpreting the magnetization sources.The successful use of AS in magnetization ana-lysis is demonstrated by Silva (1999), Carneiro(2006), Li (2006), Leite and Souza Filho(2010). Despite some limitations of the techni-que, AS provides better solutions for the defini-tion of geologic boundaries in low-latitude areas.Five geologically significant geophysical para-meters were then selected for further analysis
as input to the SOM procedure: K, eTh, eU, TC, and AS (shownon Figure 2 as A, B, C, D, and E, respectively).
Field work
Geologic field work was carried out between 2008 and 2009, inthe region of Anapu in Pará, Brazil. Tropical climate conditions,typical of the Amazon, result in intense weathering which in turnfavors the development of thick weathering profiles and regolithblankets over underlying bedrocks. Under these conditions, out-crops are not frequent and there is extensive development of the
Table 1. Characteristics of the airborne geophysical data inthe Anapu-Tuerê Project.
Direction of production lines N-S
Spacing between production lines 0.5 km
Direction of control lines E-W
Spacing between control lines 10.0 km
Interval between consecutive geophysicalmeasurements
0.1 s(magnetometer);
1.0 s(espectrometer)
Average flight height 100 m
Average flight speed 260 km/h
Figure 2. Aircraft-acquired geophysical data images, used as input to the SOM analysis:(a) potassium; (b) thorium; (c) uranium; (d) total count; and (e) analytical signal of theanomalous magnetic field (AS).
Semiautomated geologic mapping using SOM K19

Amazonian rainforest. There are some roads which cross the prin-cipal trends of rocks, and these provide access to outcrops.To establish lithologic variations across the region, several trans-
ects were completed using the existing network of dirt roads or-iented north-south, used by local farmers. Some 89 outcropswere located and described, and hand samples were collected forfurther petrographic description and geochemical analysis.
SOM analysis
We employed the SOM implementation developed by Common-wealth Scientific and Industrial Research Organization (CSIRO)SiroSOM, as a data segmentation and domaining tool to find pat-terns and associations within and among the various input data.In an SOM analysis, each sample is treated as an n-dimensional
(nD) vector in a data space defined by its variables (Fraser andDickson, 2007). Next, a number of “artificial seed-vectors” aremodified to represent the distribution and structure of the originalinput data using measures of vector similarity. The number of seed-vectors equates to the size of the SOM chosen for the analysis. Oncetrained, these seed-vectors are known as “best matching units”(BMUs); and it is these BMUs or seed-vectors that are projectedonto the enveloping hypersurface and transformed to produce theSOM representation of the data. Once computed, the map can bevisualized in many ways. This study has used three types ofmap visualization: (1) the “unified distance matrix” (U-Matrix);(2) “component plots”; and (3) a K-means clustering of theBMU vector-values.The U-matrix visualization (Ultsch, 1993; Ultsch and Vetter,
1994) shows the relative similarity, in terms of Euclidean distance,between adjacent BMU vectors, represented as nodes on the map.Thus, each BMU in the U-Matrix contains the measurement of fea-ture vector similarity between adjacent neuron units. Alternativenodes without values (dummy) are added to this matrix. Thosenodes are shown using a color-temperature scale, with blue (cooler)indicating similarity or closeness between adjacent nodes, and yel-lows, oranges, and reds (warmer) indicating increasing dissimilar-ity, or distance. The size of hexagonal nodes in a U-Matrix changesaccording to the number of input samples represented for therespective BMU.The “component plot” visualization is the value of a particular
node’s input variable, or component, displayed on that node onthe map. Again, a color-temperature scale was used to representthe relative value of the component from blue (low) to red (high)across the range of input values.Each node or BMU on the map is, in fact, a minicluster of input
samples; however, it often is instructive to cluster the node values togain an appreciation and insight as to how the nodes group them-selves as part of larger populations. Hence, the SOM nodes (values)are commonly clustered using a K-means clustering based on a pre-determined number of classes defined by a Davies-Bouldin (DB)analysis (Davies and Bouldin, 1979). This analysis can be usedas a guide to the data classification, or to compare different distri-butions of data among classes. The DB analysis was applied to themeasurement of similarities among the nodes of the SOM. Thus, thelowest value of this analysis was used as the optimal value to definethe total number of clusters.The five geophysical input variables represent a formidable set of
exploration data, capable of mapping a range of different geologic
characteristics. The total number of cells (N) is 136,913 for eachvariable.After ensuring that all data sets were coregistered onto a grid with
a common geographic origin and cell size, the five input variablevalues for each cell were exported, using the centroid value for thatcell. These values were used as input to the SOM analysis. The re-maining information, e.g., location and cell size, was used to assignthe a posteriori cell classification provided by the trained SOM.The following SOM setup and processing parameters were cho-
sen for this study. The data space was randomly initiated or seeded;a hexagonal lattice was chosen for display; and the surface of a tor-oidal hypervolume was used for the BMU projection. After someexperimentation, a map size of 46 rows × 40 columns was chosenas appropriate for this exploratory study. The map size is in accor-dance with the heuristic rule (Vesanto et al., 2000; Park et al., 2006;Céréghino and Park, 2009) and uses the expression “5�sqrtðNÞ”,where N corresponds to the total number of cells or samples in eachvariable. DB analysis suggested seven as the optimal number to usein the clustering classification. This number was used in the SOM,which resulted in seven clusters as the final SOM output data.To visualize the spatial distribution of the SOM output data, the
cluster output values were gridded using the “nearest neighbor” re-sampling procedure for discrete data.
Statistical parameters
The statistical parameters shown in Table 2 were calculated for allvariables of the original data set for comparison with the SOM-de-rived cluster results. A broad classification was obtained based onthe median value for each input variable and this was computed tofind the “reference values” (Table 2). The variables’ reference va-lues were divided into three classes: (1) high values; (2) mediumvalues; and (3) low values.
RESULTS
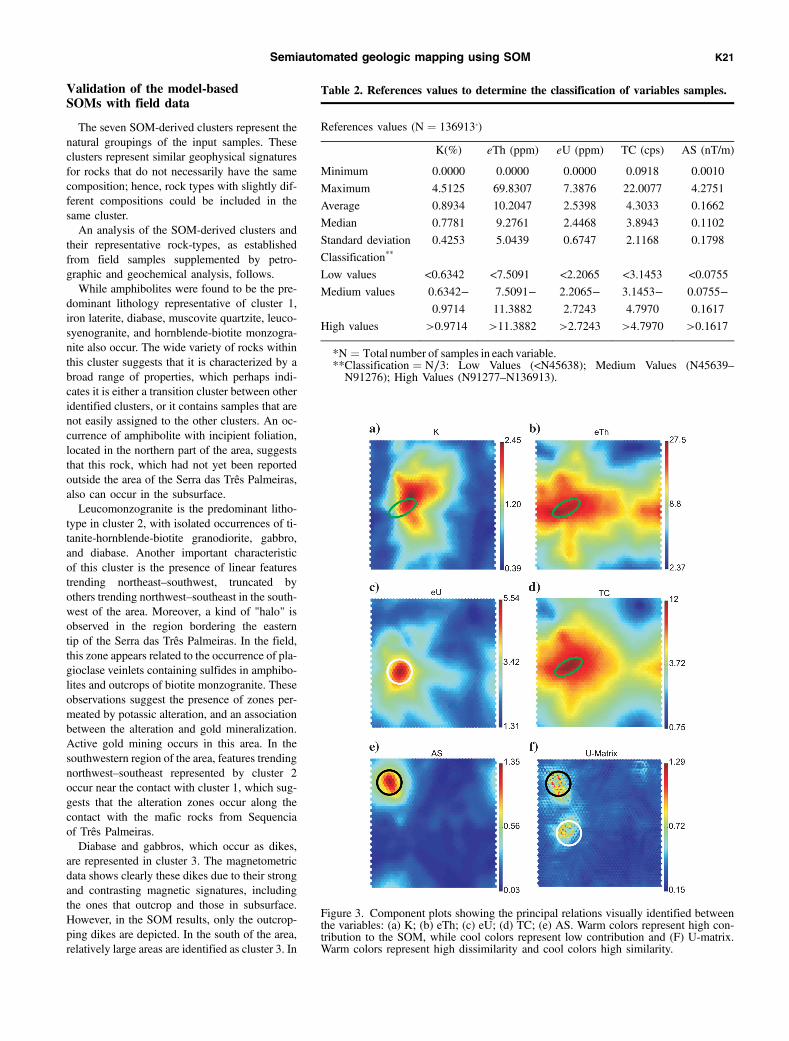
The resulting SOM-derived component plots are shown onFigure 3a–3e; and the U-matrix resulting from this analysis isshown on Figures 3f and 4a. The component plots show the con-tribution of each variable on each node on the map; it is possible toobserve the relationships between the responses of the various com-ponents. Some of these relationships can be described as (1) theelliptical display of high values in K, eTh, and TC — green ellipseon Figure 3a, 3b and 3d; (2) high eU values showing the high con-tribution for U-matrix — white circle on Figure 3c and 3f; (3) highvalues coinciding in another specific area in AS and U-matrix(black circle on Figure 3e and 3f). The U-matrix shows two areaswith high dissimilarity, which coincide with elevated contributionsof eU and AS. High similarity in U-matrix is related to mediumcontributions of K, eTh, eU, and TC.In a next step, a Davies-Bouldin analysis (Davies and Bouldin,
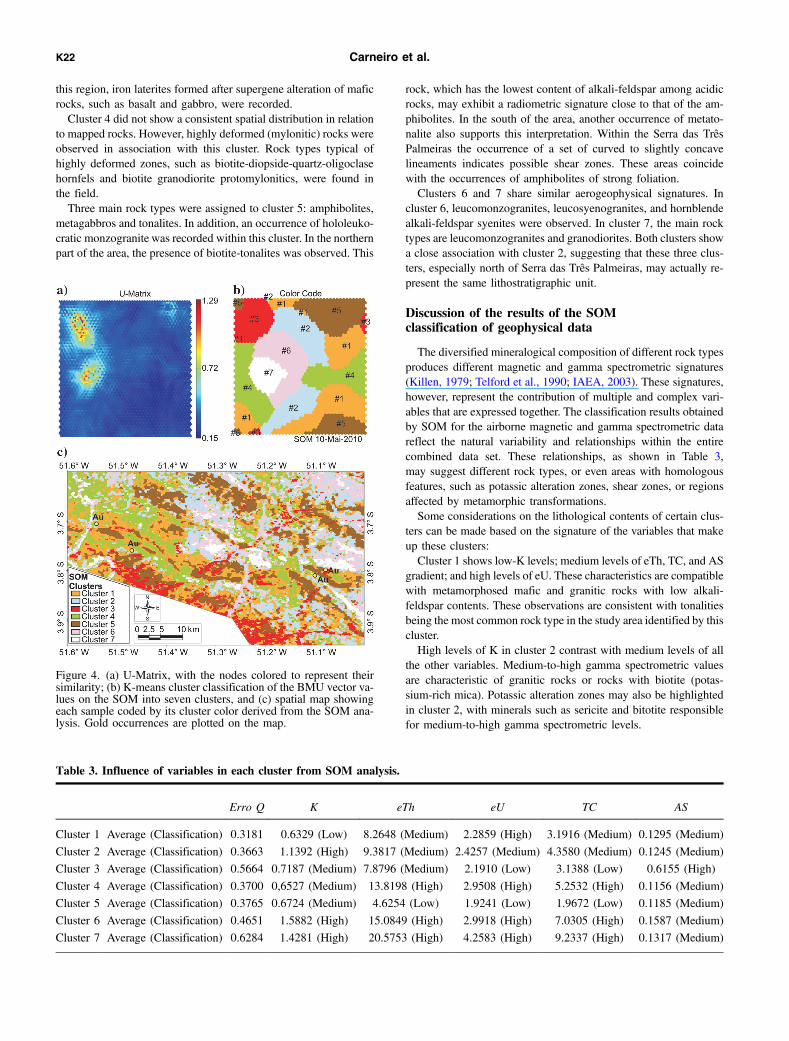
1979) was applied to find an optimum number of clusters within theSOM node vectors. Based on the results, the optimum number ofK-means clusters calculated for the node vectors was set as seven(Figure 4b). Figure 4c shows the spatial distribution of input sam-ples assigned to each SOM-derived cluster, colored by their as-signed cluster color on Figure 4b.The reference values derived from the total data set (Table 2)
were used to classify each SOM-derived cluster’s component con-tribution, as shown in Table 3.
K20 Carneiro et al.
Validation of the model-basedSOMs with field data
The seven SOM-derived clusters represent thenatural groupings of the input samples. Theseclusters represent similar geophysical signaturesfor rocks that do not necessarily have the samecomposition; hence, rock types with slightly dif-ferent compositions could be included in thesame cluster.An analysis of the SOM-derived clusters and
their representative rock-types, as establishedfrom field samples supplemented by petro-graphic and geochemical analysis, follows.While amphibolites were found to be the pre-
dominant lithology representative of cluster 1,iron laterite, diabase, muscovite quartzite, leuco-syenogranite, and hornblende-biotite monzogra-nite also occur. The wide variety of rocks withinthis cluster suggests that it is characterized by abroad range of properties, which perhaps indi-cates it is either a transition cluster between otheridentified clusters, or it contains samples that arenot easily assigned to the other clusters. An oc-currence of amphibolite with incipient foliation,located in the northern part of the area, suggeststhat this rock, which had not yet been reportedoutside the area of the Serra das Três Palmeiras,also can occur in the subsurface.Leucomonzogranite is the predominant litho-
type in cluster 2, with isolated occurrences of ti-tanite-hornblende-biotite granodiorite, gabbro,and diabase. Another important characteristicof this cluster is the presence of linear featurestrending northeast–southwest, truncated byothers trending northwest–southeast in the south-west of the area. Moreover, a kind of "halo" isobserved in the region bordering the easterntip of the Serra das Três Palmeiras. In the field,this zone appears related to the occurrence of pla-gioclase veinlets containing sulfides in amphibo-lites and outcrops of biotite monzogranite. Theseobservations suggest the presence of zones per-meated by potassic alteration, and an associationbetween the alteration and gold mineralization.Active gold mining occurs in this area. In thesouthwestern region of the area, features trendingnorthwest–southeast represented by cluster 2occur near the contact with cluster 1, which sug-gests that the alteration zones occur along thecontact with the mafic rocks from Sequenciaof Três Palmeiras.Diabase and gabbros, which occur as dikes,
are represented in cluster 3. The magnetometricdata shows clearly these dikes due to their strongand contrasting magnetic signatures, includingthe ones that outcrop and those in subsurface.However, in the SOM results, only the outcrop-ping dikes are depicted. In the south of the area,relatively large areas are identified as cluster 3. In
Table 2. References values to determine the classification of variables samples.
References values (N ¼ 136913*)
K(%) eTh (ppm) eU (ppm) TC (cps) AS (nT/m)
Minimum 0.0000 0.0000 0.0000 0.0918 0.0010
Maximum 4.5125 69.8307 7.3876 22.0077 4.2751
Average 0.8934 10.2047 2.5398 4.3033 0.1662
Median 0.7781 9.2761 2.4468 3.8943 0.1102
Standard deviation 0.4253 5.0439 0.6747 2.1168 0.1798
Classification**
Low values <0.6342 <7.5091 <2.2065 <3.1453 <0.0755
Medium values 0.6342− 7.5091− 2.2065− 3.1453− 0.0755−0.9714 11.3882 2.7243 4.7970 0.1617
High values >0.9714 >11.3882 >2.7243 >4.7970 >0.1617
*N ¼ Total number of samples in each variable.**Classification ¼ N∕3: Low Values (<N45638); Medium Values (N45639–N91276); High Values (N91277–N136913).
Figure 3. Component plots showing the principal relations visually identified betweenthe variables: (a) K; (b) eTh; (c) eU; (d) TC; (e) AS. Warm colors represent high con-tribution to the SOM, while cool colors represent low contribution and (F) U-matrix.Warm colors represent high dissimilarity and cool colors high similarity.
Semiautomated geologic mapping using SOM K21
this region, iron laterites formed after supergene alteration of maficrocks, such as basalt and gabbro, were recorded.Cluster 4 did not show a consistent spatial distribution in relation
to mapped rocks. However, highly deformed (mylonitic) rocks wereobserved in association with this cluster. Rock types typical ofhighly deformed zones, such as biotite-diopside-quartz-oligoclasehornfels and biotite granodiorite protomylonitics, were found inthe field.Three main rock types were assigned to cluster 5: amphibolites,
metagabbros and tonalites. In addition, an occurrence of hololeuko-cratic monzogranite was recorded within this cluster. In the northernpart of the area, the presence of biotite-tonalites was observed. This
rock, which has the lowest content of alkali-feldspar among acidicrocks, may exhibit a radiometric signature close to that of the am-phibolites. In the south of the area, another occurrence of metato-nalite also supports this interpretation. Within the Serra das TrêsPalmeiras the occurrence of a set of curved to slightly concavelineaments indicates possible shear zones. These areas coincidewith the occurrences of amphibolites of strong foliation.Clusters 6 and 7 share similar aerogeophysical signatures. In
cluster 6, leucomonzogranites, leucosyenogranites, and hornblendealkali-feldspar syenites were observed. In cluster 7, the main rocktypes are leucomonzogranites and granodiorites. Both clusters showa close association with cluster 2, suggesting that these three clus-ters, especially north of Serra das Três Palmeiras, may actually re-present the same lithostratigraphic unit.
Discussion of the results of the SOMclassification of geophysical data
The diversified mineralogical composition of different rock typesproduces different magnetic and gamma spectrometric signatures(Killen, 1979; Telford et al., 1990; IAEA, 2003). These signatures,however, represent the contribution of multiple and complex vari-ables that are expressed together. The classification results obtainedby SOM for the airborne magnetic and gamma spectrometric datareflect the natural variability and relationships within the entirecombined data set. These relationships, as shown in Table 3,may suggest different rock types, or even areas with homologousfeatures, such as potassic alteration zones, shear zones, or regionsaffected by metamorphic transformations.Some considerations on the lithological contents of certain clus-
ters can be made based on the signature of the variables that makeup these clusters:Cluster 1 shows low-K levels; medium levels of eTh, TC, and AS
gradient; and high levels of eU. These characteristics are compatiblewith metamorphosed mafic and granitic rocks with low alkali-feldspar contents. These observations are consistent with tonalitiesbeing the most common rock type in the study area identified by thiscluster.High levels of K in cluster 2 contrast with medium levels of all
the other variables. Medium-to-high gamma spectrometric valuesare characteristic of granitic rocks or rocks with biotite (potas-sium-rich mica). Potassic alteration zones may also be highlightedin cluster 2, with minerals such as sericite and bitotite responsiblefor medium-to-high gamma spectrometric levels.
Figure 4. (a) U-Matrix, with the nodes colored to represent theirsimilarity; (b) K-means cluster classification of the BMU vector va-lues on the SOM into seven clusters, and (c) spatial map showingeach sample coded by its cluster color derived from the SOM ana-lysis. Gold occurrences are plotted on the map.
Table 3. Influence of variables in each cluster from SOM analysis.
Erro Q K eTh eU TC AS
Cluster 1 Average (Classification) 0.3181 0.6329 (Low) 8.2648 (Medium) 2.2859 (High) 3.1916 (Medium) 0.1295 (Medium)
Cluster 2 Average (Classification) 0.3663 1.1392 (High) 9.3817 (Medium) 2.4257 (Medium) 4.3580 (Medium) 0.1245 (Medium)
Cluster 3 Average (Classification) 0.5664 0.7187 (Medium) 7.8796 (Medium) 2.1910 (Low) 3.1388 (Low) 0.6155 (High)
Cluster 4 Average (Classification) 0.3700 0,6527 (Medium) 13.8198 (High) 2.9508 (High) 5.2532 (High) 0.1156 (Medium)
Cluster 5 Average (Classification) 0.3765 0.6724 (Medium) 4.6254 (Low) 1.9241 (Low) 1.9672 (Low) 0.1185 (Medium)
Cluster 6 Average (Classification) 0.4651 1.5882 (High) 15.0849 (High) 2.9918 (High) 7.0305 (High) 0.1587 (Medium)
Cluster 7 Average (Classification) 0.6284 1.4281 (High) 20.5753 (High) 4.2583 (High) 9.2337 (High) 0.1317 (Medium)
K22 Carneiro et al.
Cluster 3, which exhibits medium levels of K and eTh, low levelsof eU and TC, and high magnetic gradient in AS, appears morefrequently in the southern part of the area, in the form of elongatedsegments with structures trending from northeast–southwest toeast–west. We relate this cluster to mafic rocks whose magneticcontribution is high, while the gamma relative abundance levelsare medium-to-low. They represent the diabase dikes that occurin the area.The main characteristics of cluster 4 are medium K levels; med-
ium AS magnetic gradients; and high eTh, eU, and TC. These char-acteristics suggest a diversified lithologic composition. The mainrelationship of this signature is with rocks resulting from supergenealteration, such as laterites. Subvolcanic rocks may also be sug-gested by this signature.The characteristics of cluster 5 consist of medium levels of K and
AS, and low levels of eTh, eU, and TC. These characteristics can berelated to rocks with low alkali-feldspar content and moderate mag-netic susceptibility. Accordingly, tonalite and granodiorite occur inthe areas of this cluster and may be associated with this signature.Clusters 6 and 7 exhibit similar signatures, consisting of high
gamma spectrometric levels and medium AS-magnetic gradients(Table 3). Although similar, these two clusters have been differen-tiated by the SOM classifier due to the higher averages of Th and Ushown by cluster 7 in comparison with cluster 6. In both clusters,these characteristics may be associated with alkaline rocks, espe-cially syenites, syenogranites, monzogranite, or granodiorites.
CONCLUSIONS
The integrated analysis and spatial display of multivariate datasets are fundamental steps toward understanding geologic pro-cesses. The results obtained from this SOM analysis of the Ana-pu-Tuerê airborne geophysical data produced seven clusters,which were related to different rocks and petrogenetic history.The relationships obtained from the SOM analysis can be used to
improve geologic mapping and to assist in understanding the originof known mineral occurrences. By locating areas with signaturessimilar to known occurrences, areas with similar mineral potentialmaybe identified. The addition of other variables, such as electro-magnetic or digital elevation model data, could be used to poten-tially further distinguish or differentiate these rocks and assist in ourunderstanding of them. Field work is an essential component to as-sist in understanding the SOM responses and to validate their inter-pretation.In this study, SOMhas proven to be an effective tool tomapvarious
populations with similar characteristics from airborne geophysicaldata sets. The magnetic and gamma ray spectrometric data that wehave analyzed contain subtle relationships, which allow us to detectand extract geologic information. Correlations between the differentgeophysical data sets could be observed on the SOM results.
ACKNOWLEDGMENTS
The authors would like to thank: the University of Campinas(UNICAMP/Brazil) where the initial project was planned; the Stateof São Paulo Research Foundation (FAPESP/Brazil), for granting aPh.D. scholarship (Process 05/59368-0) to the first author; the Na-tional Counsel of Technological and Scientific Development(CNPq/Brazil), for research grant 478792/2007-7; the Programof National Institutes of Science and Technology (MCT/CNPq/FNDCT/CAPES/. FAPESPA — INCT of Geosciences of the
Amazonia — Geociam, Brazil); the Geologic Survey of Brazil(CPRM/Brazil), especially Maria Laura Azevedo and AlexandreLago, for provision of the airborne geophysical data set and somefield data; Australia’s Commonwealth Scientific and Industrial Re-search Organization’s Division of Exploration and Mining (CSIRO/EM), located at the Queensland Centre for Advanced Technologies,in Brisbane, for the facilities to execute the SOM analysis; the Uni-versity of Brasilia for support regarding the geophysical data pro-cessing; the Federal University of Paraná for petrographic analyses;and to Helen Field and Jane Hodgkinson for discussions andcontributions.
REFERENCES
Akima, H., 1978a, A method of bivariate interpolation and smooth surfacefitting for irregularly distributed data points: ACM Transactions onMathematical Software, 4, 148–159, http://doi.acm.org/10.1145/355780.355786, accessed 02 February 2009.
Akima, H., 1978b, Algorithm 526: Bivariate interpolation and smooth sur-face fitting for irregularly distributed data points [E1]: ACM Transactionson Mathematical Software, 4, 160–164, http://doi.acm.org/10.1145/355780.355787, accessed 02 February 2009.
Barros, C. E. de M., M. J. B. Macambira, M. C. da C. Santos, D. C. C. Silva,L. C. M. Palmeira, and M. M. Souza, 2007, Estruturas sinmagmáticas eidade de zircão de granitos (evaporação de Pb) paleoproterozóicos daparte leste do domínio Bacajá, Província Maroni-Itacaiúnas: Revista Bra-sileira de Geociências, 37, 293–304.
Bedini, E., 2009, Mapping lithology of the Sarfartoq carbonatite complex,southern West Greenland, using HyMap imaging spectrometer data:Remote Sensing of Environment, 113, 1208–1219, doi: 10.1016/j.rse.2009.02.007.
Bierlein, F. P., S. J. Fraser, W. M. Brown, and T. Lees, 2008, Advancedmethodologies for the analysis of databases of mineral deposits and majorfaults: Australian Journal of Earth Sciences, 55, 79–99.
Bonham-Carter, G. F, 1994, Geographic information systems for geoscien-tists, computer methods in the geosciences: Elsevier.
Briggs, I. C., 1974, Machine contouring using minimum curvature: Geophy-sics, 39, 39–48, doi: 10.1190/1.1440410.
Cainzos, R. L. P., E. M. Pascholati, and C. R. Souza Filho, 2002, Utilizaçãoda classificação não-supervisionada na integração e interpretação de da-dos geofísicos em Cuba centro-oriental: Revista Brasileira de Geofísica,20, 151–161.
Carneiro, C. C., 2010, Modelagem espacial de dados aerogeofísicos e inter-pretação de imagens SAR aplicados ao mapeamento geológico e metalo-genético da região central do Domínio Bacajá, Estado do Pará: Ph.D.Thesis, Institute of Geosciences, University of Campinas.
Carneiro, C. C., A. P. Crósta, A. M. Silva, and R. V. L. Pinheiro, 2006, Fusãode imagens altimétricas e aeromagnetométricas como ferramenta deinterpretação geológica, exemplo da província mineral de Carajás(PA): Revista Brasileira de Geofísica, 24, 261–271.
Céréghino, R., and Y.-S. Park, 2009, Review of the self-organizing map(SOM) approach in water resources: Commentary Environmental Mod-elling & Software, 24, 945–947.
CPRM — Serviço Geológico do Brasil, 2004, Programa geologia do brasil(PGB): Projeto aerogeofísico Anapu-Tuerê. Relatório final do levanta-mento e processamento dos dados magnetométricos e gamaespectromé-tricos: LASA Engenharia e Prospecções S/A, 4–47.
Davies, D. L., and D. W. Bouldin, 1979, A cluster separation measure: IEEETransactions on Pattern Analysis and Machine Intelligence, PAMI-1,224–227, doi: 10.1109/TPAMI.1979.4766909.
Delor, C., D. Lahondére, E. Egal, J. M. Lafon, A. Cocherie, C. Guerrot, P.Rossi, C. Truffert, H. Théveniaut, D. Phillips, and V. G. Avelar, 2003,Transamazonian crustal growth and reworking as revealed by the1:500,000-scale geological map of French Guiana, Géologie de la France,2nd ed., 5–57.
Faraco, M. T. L., A. G. Vale, J. O. Santos, R. Luzardo, A. L. Ferreira, M.Oliveira, and P. A. C. Marinho, 2005, Levantamento geológico da regiãoao norte da província Carajás: Contribuições à Geologia da Amazônia, 4,32–43.
Fraser, S. J., and B. L. Dickson, 2007, A newmethod for data integration andintegrated data interpretation: Self-organising maps: 5th Decennial Inter-national Conference on Mineral Exploration, Expanded Abstracts, 907–910.
Fraser, S. J., P. A. Mikula, M F. Lee, B. L. Dickson, and E. Kinnersly, 2006,Data mining data — Ordered vector quantization and examples of itsapplication to mine geotechnical data sets, in: S. Dominy, ed., 6th
Semiautomated geologic mapping using SOM K23
International Mining Geology Conference: AusIMM Publication Seriesno. 6/2006, 259–268.
Gonçalves, M. L., M. L. A. Netto, J. A. F. Costa, and J. Zullo Junior, 2008,An unsupervised method of classifying remotely sensed images using Ko-honen self-organizing maps and agglomerative hierarchical clusteringmethods: International Journal of Remote Sensing, 29, 3171–3207,doi: 10.1080/01431160701442146.
Graham, D. F., and G. F. Bonham-Carter, 1993, Airborne radiometric data:A tool for reconnaissance geological mapping using a GIS: Photogram-metric Engineering & Remote Sensing, 59, 1243–1249.
Harris, J. R, 1989, Clustering of gamma ray spectrometer data using a com-puter image analysis system, in F. P. Agterberg, and G. F. Bonham-Carter,eds., Statistical application in the earth sciences: Geological Survey ofCanada, Paper 89-9, 19–31.
ICRU, 1994, Gamma ray spectrometry in the environment, ICRU Report 53:International Commission on Radiation Units and Measurements, Bethes-da, USA.
International Atomic Energy Agency, 1991, Airborne gamma ray spectro-meter surveying, Technical Reports Series, 323, IAEA.
International Atomic Energy Agency, 2003, Guidelines for radioelementmapping using gamma ray spectrometry data: Technical Report 1363,IAEA.
Ji, C. Y., 2000, Land-use classification of remotely sensed data usingkohonen self organizing feature map neural networks: PhotogrammetricEngineering and Remote Sensing, 66, 1451–1460.
Jorge João, X. S., A. G. Vale, and T. A. M. Lobato, 2001, Folha Altamira(PA) SA.22-Y-D. Escala 1:250.000. Geologia regional, in Programalevantamentos geológicos básicos do Brasil: CPRM/DIEDIG/DEPAT,03–27.
Killeen, P. G., 1979, Gamma ray spectrometric methods in uranium explora-tion — Application and interpretation, in P. J. Hood, ed., Geophysics andgeochemistry in the search for metallic ores: Geological Survey of CanadaEconomic Geology Report, 31, 163–230.
Kohonen, T., 1982, Self-organized formation of topologically correct featuremaps: Biological Cybernetics, 43, 59–69, doi: 10.1007/BF00337288.
Kohonen, T., 2001, Self-organizing maps: Springer.Leite, E. P., and C. R. de Souza-Filho, 2010, Mapas auto-organizáveis
aplicados ao mapeamento do potencial mineral na região de serra leste,província mineral de Carajás, Pará: Revista Brasileira de Geofísica, 28,397–409.
Li, X., 2006, Understanding 3D analytic signal amplitude: Geophysics, 71,no. 2, L13–L16 , doi: 10.1190/1.2184367.
Li, Z., and J. R. Eastman, 2010, Commitment and typicality measures for theself-organizing map: International Journal of Remote Sensing, 31, 4265–4280, doi: 10.1080/01431160903246725.
Merényi, E., 1998, Self-organizing ANNs for planetary surface compositionresearch: 6th European Symposium on Artificial Neural Networks —ESANN’98, Proceedings, 197–202.
Minty, B. R. S., 1991, Simple micro-levelling for aeromagnetic data:Exploration Geophysics, 22, 591–592, doi: 10.1071/EG991591.
Minty, B. R. S., 1998, Multichannel models for the estimation of radon back-ground in airborne gamma ray spectrometry: Geophysics, 63, 1986–1996,doi: 10.1190/1.1444492.
Naghibian, M. N., 1972, The analytic signal of two-dimensional magneticbodies with polygonal cross-section: Its properties and use for automatedanomaly interpretation: Geophysics, 37, 507–517, doi: 10.1190/1.1440276.
Park, Y.-S., J. Tison, S. Lek, J.-L. Giraudel, M. Coste, and F. Delmas, 2006,Application of a self-organizing map to select representative species inmultivariate analysis: A case study determining diatom distribution pat-terns across France: Ecological Informatics, 1, 247–257, doi: 10.1016/j.ecoinf.2006.03.005.
Pires, A. C. B., 1990, Statistical characterization of greenstone sequencesusing magnetic and gamma-ray spectrometric data, Guarinos-Pilar deGoiás, Brazil: Revista Brasileira de Geociências, 20, 293–298.
Pires, A. C. B., and N. Harthill, 1989, Statistical analysis of airbornegamma-ray mapping purposes: Crixás-Itapaci area, Brazil: Geophysics,54, 10–15, doi: 10.1190/1.1442592.
Ricci, P. S. F., E. J. S. Costa, C. A. S. Faria, and J. R. Oliveira, 2003, Thereanalyzed Carajás Block is interposed between the Bacajá (the crustalreworking “lost link” now being predicted) and Rio Maria Archean Ter-ranes — Guaporé craton: in VIII Simpósio de Geologia da Amazônia,CD-ROM.
Roest, W. R., J. Verhoef, and M. Pilkington, 1992, Magnetic interpretationusing the 3D analytic signal: Geophysics, 57, 116–125, doi: 10.1190/1.1443174.
Santos, J. O. S., 2003, Geotectônica dos escudos das Guianas e Brasil Cen-tral, in L. A. Bizzi, C. Schobbenhaus, R. M. Vidotti, and J. H. Gonçalves,eds., Geologia, tectônica e recursos minerais do Brasil: Texto, mapas &SIG: CPRM — Serviço Geológico do Brasil, 169–226.
Silva, A. M, 1999, Integração de dados geológicos e geofísicos utilizando-seuma nova técnica para seleção de alvos para exploração mineral, aplicadaao greenstone belt Rio das Velhas, quadrilátero ferrífero: Ph.D. thesis,Institute of Geosciences, University of Brasília.
Tassinari, C. C. G., and M. J. B. Macambira, 2004, A evolução tectônica docráton amazônico, inV.Mantesso-Neto, A. Bartorelli, C. Dal Ré Carneiro,and B. B. Brito-Neves, eds., Geologia do continente Sul-Americano:Evolução da obra de Fernando Flávio Marques de Almeida, Beca,471–485.
Telford, W. M., L. P. Geldart, and R. E. Sheriff, 1990, Applied geophysics:Cambridge University Press.
Ultsch, A., 1993, U-matrix: A tool to visualize clusters in high dimensionaldata: University of Marburg, Department of Computer Science, TechnicalReport, 36, 12.
Ultsch, A., and C. Vetter, 1994, Self-organising feature maps versus statis-tical clustering a benchmark: Technical Report No. 9, Dept. of Mathe-matics and Computer Science, University of Marburg, Germany.
Vasquez, M. L., M. J. B. Macambira, and M. A. Galarza, 2005, Granitóidestransamazônicos da região Iriri-Xingu, estado do Pará: Novos dados geo-lógicos e geocronológicos, inA. Horbe, and W. Souza, eds., Contribuiçıesà geologia da Amazônia, 4, 16–31.
Vasquez, M. L., L. T. Rosa-Costa, C. M. G. Silva, P. S. F. Ricci, J. P. O. deBarbosa, E. L. Klein, E. C. S. Lopes, E. M. B. Macambira, C. L. Chaves,J. M. A. Carvalho, J. G. F. Oliveira, G. C. Anjos, and H. R. Silva, 2008,Unidades litoestratigráficas, in M. L. Vasquez, and L. T. Rosa-Costa,2008, geologia e recursos minerais do estado do Pará: Sistema de info-mações geográficas — SIG: Texto explicativo dos mapas geológico etectônico e de recursos minerais do estado do Pará. Scale 1:1.000.000:CPRM — Serviço Geológico do Brasil, 149–160.
Vesanto, J., J. Himberg, E. Alhoniemi, and J. Parhankangas, 2000, SOMtoolbox for Matlab 5: Technical Report A57. Neural Networks ResearchCentre, Helsinki University of Technology, Helsinki, Finland.
Weng, Q., 2010, Remote sensing and GIS integration: Theories, methods,and applications: McGraw-Hill.
K24 Carneiro et al.
Related Documents