Whole-Brain Atrophy in Multiple Sclerosis Measured by Automated versus Semiautomated MR Imaging Segmentation Jitendra Sharma, Michael P. Sanfilipo, Ralph H. B.Benedict, Bianca Weinstock-Guttman, Frederick E. Munschauer III, and Rohit Bakshi BACKGROUND AND PURPOSE: Semiautomated and automated methods are used to mea- sure whole-brain atrophy in multiple sclerosis (MS), but their comparative reliability, sensi- tivity, and validity are unknown. METHODS: Brain parenchymal fraction (BPF) was measured in patients with MS (n 52) and healthy control subjects (n 17) by four methods: semiautomated or automated segmen- tation and 2D or 3D pulse sequences. Linear measures of atrophy, whole-brain lesion volumes, and clinical data were used to explore validity. RESULTS: The 2D automated method yielded unreliable segmentation and was discarded. The three other BPF methods produced data that were highly intercorrelated and indistin- guishable by analysis of variance. In the MS group, semiautomated (2D: 0.84 0.04, P < .001; 3D: 0.84 0.05, P .04) and automated 3D (0.83 0.05, P .002) BPFs were lower than controls (semiautomated 2D: 0.88 0.02; 3D: 0.88 0.03; automated 3D: 0.88 0.03). In the MS group, the semiautomated (r .79 to .82) and automated 3D (r .81) BPFs inversely correlated with third ventricular width and showed similarly robust correlations with the bicaudate ratio (all r .74). The semiautomated and automated BPFs showed similar, moderate correlations with T1 hypointense and FLAIR hyperintense lesion volume, physical disability (Expanded Disability Status Scale) score, and disease duration and similar differ- ences between secondary progressive and relapsing-remitting patients. The intraobserver, interobserver, and test-retest reliability was somewhat higher for the automated than for the semiautomated methods. CONCLUSION: These automated and semiautomated measures of whole-brain atrophy provided similar and nearly interchangeable data regarding MS. They discriminated MS from healthy individuals and showed similar relationships to established disease variables. Brain atrophy measurements are emerging as sensi- tive surrogate markers for therapeutic trials in multi- ple sclerosis (MS) (1). There is a growing body of evidence indicating that the MS disease process ex- tends beyond overt multifocal white matter lesions shown by MR imaging to include disease in normal- appearing white (1, 2) and gray matter (3–5). The destructive nature has been revealed by the demon- stration of axonal loss, Wallerian degeneration, and macroscopic brain and spinal cord atrophy occurring during early stages of MS (1, 6 –20). Recent studies have shown that brain atrophy progresses significantly on an annual basis (1, 11–18) and bears a close rela- tionship to clinical impairment (1, 11, 18 –28). Thus, there has been increasing interest in developing methods for quantifying regional and whole-brain at- rophy in MS (1, 28). Various measurement tech- niques have been used to measure whole-brain atro- phy, including both automated and semiautomated algorithms (12, 13, 25, 26, 28 –32), relying on either gross or normalized brain volume assessment. Auto- mated methods have the potential advantage of effi- ciency and reproducibility (28), whereas semiauto- mated methods may lead to increased accuracy because of operator input (31). To date, little work has been done to compare different data acquisition sequences and analysis pro- Received June 20, 2003; accepted after revision December 18. From the Buffalo Neuroimaging Analysis Center (J.S., M.P.S., R.H.B.B, R.B), the Jacobs Neurologic Institute (J.S., R.H.B.B., B.W.-G., F.E.M.III, R.B), Departments of Psychiatry and Psychol- ogy (R.H.B.B.) and Neurology (R.H.B.B., B.W.-G., F.E.M.III, R.B.), and Physicians Imaging Centers (F.E.M.III, R.B.), Univer- sity at Buffalo, State University of New York, Buffalo, NY. Address correspondence to Rohit Bakshi, MD, Center for Neu- rological Imaging, Brigham & Women’s Hospital, Harvard Medical School, 221 Longwood Avenue, RF396, Boston, MA 02115. © American Society of Neuroradiology AJNR Am J Neuroradiol 25:985–996, June/July 2004 985

Welcome message from author
This document is posted to help you gain knowledge. Please leave a comment to let me know what you think about it! Share it to your friends and learn new things together.
Transcript
Whole-Brain Atrophy in Multiple SclerosisMeasured by Automated versus Semiautomated
MR Imaging Segmentation
Jitendra Sharma, Michael P. Sanfilipo, Ralph H. B.Benedict, Bianca Weinstock-Guttman,Frederick E. Munschauer III, and Rohit Bakshi
BACKGROUND AND PURPOSE: Semiautomated and automated methods are used to mea-sure whole-brain atrophy in multiple sclerosis (MS), but their comparative reliability, sensi-tivity, and validity are unknown.
METHODS: Brain parenchymal fraction (BPF) was measured in patients with MS (n � 52)and healthy control subjects (n � 17) by four methods: semiautomated or automated segmen-tation and 2D or 3D pulse sequences. Linear measures of atrophy, whole-brain lesion volumes,and clinical data were used to explore validity.
RESULTS: The 2D automated method yielded unreliable segmentation and was discarded.The three other BPF methods produced data that were highly intercorrelated and indistin-guishable by analysis of variance. In the MS group, semiautomated (2D: 0.84 � 0.04, P < .001;3D: 0.84 � 0.05, P � .04) and automated 3D (0.83 � 0.05, P � .002) BPFs were lower thancontrols (semiautomated 2D: 0.88 � 0.02; 3D: 0.88 � 0.03; automated 3D: 0.88 � 0.03). In theMS group, the semiautomated (r � �.79 to �.82) and automated 3D (r � �.81) BPFs inverselycorrelated with third ventricular width and showed similarly robust correlations with thebicaudate ratio (all r � �.74). The semiautomated and automated BPFs showed similar,moderate correlations with T1 hypointense and FLAIR hyperintense lesion volume, physicaldisability (Expanded Disability Status Scale) score, and disease duration and similar differ-ences between secondary progressive and relapsing-remitting patients. The intraobserver,interobserver, and test-retest reliability was somewhat higher for the automated than for thesemiautomated methods.
CONCLUSION: These automated and semiautomated measures of whole-brain atrophyprovided similar and nearly interchangeable data regarding MS. They discriminated MS fromhealthy individuals and showed similar relationships to established disease variables.
Brain atrophy measurements are emerging as sensi-tive surrogate markers for therapeutic trials in multi-ple sclerosis (MS) (1). There is a growing body ofevidence indicating that the MS disease process ex-tends beyond overt multifocal white matter lesionsshown by MR imaging to include disease in normal-appearing white (1, 2) and gray matter (3–5). Thedestructive nature has been revealed by the demon-
stration of axonal loss, Wallerian degeneration, andmacroscopic brain and spinal cord atrophy occurringduring early stages of MS (1, 6–20). Recent studieshave shown that brain atrophy progresses significantlyon an annual basis (1, 11–18) and bears a close rela-tionship to clinical impairment (1, 11, 18–28). Thus,there has been increasing interest in developingmethods for quantifying regional and whole-brain at-rophy in MS (1, 28). Various measurement tech-niques have been used to measure whole-brain atro-phy, including both automated and semiautomatedalgorithms (12, 13, 25, 26, 28–32), relying on eithergross or normalized brain volume assessment. Auto-mated methods have the potential advantage of effi-ciency and reproducibility (28), whereas semiauto-mated methods may lead to increased accuracybecause of operator input (31).
To date, little work has been done to comparedifferent data acquisition sequences and analysis pro-
Received June 20, 2003; accepted after revision December 18.From the Buffalo Neuroimaging Analysis Center (J.S., M.P.S.,
R.H.B.B, R.B), the Jacobs Neurologic Institute (J.S., R.H.B.B.,B.W.-G., F.E.M.III, R.B), Departments of Psychiatry and Psychol-ogy (R.H.B.B.) and Neurology (R.H.B.B., B.W.-G., F.E.M.III,R.B.), and Physicians Imaging Centers (F.E.M.III, R.B.), Univer-sity at Buffalo, State University of New York, Buffalo, NY.
Address correspondence to Rohit Bakshi, MD, Center for Neu-rological Imaging, Brigham & Women’s Hospital, Harvard MedicalSchool, 221 Longwood Avenue, RF396, Boston, MA 02115.
© American Society of Neuroradiology
AJNR Am J Neuroradiol 25:985–996, June/July 2004
985
cedures for measuring brain atrophy and to deter-mine their relative precision, sensitivity, and repro-ducibility. Two published studies recently comparedseveral automated and semiautomated methods andshowed that cerebral atrophy measurements are af-fected by both segmentation algorithm and pulse se-quence (26, 32). Another study comparing automatedand semiautomated methods was reported in prelim-inary form, showing that semiautomated methods aremore accurate than automated methods and are thus,perhaps, more valid because of the operator interac-tion assuring quality control throughout the algorithm(31). The goal of our study was to compare twosoftware procedures used with two pulse sequencesfor their reproducibility and ability to detect whole-brain atrophy in patients with MS versus that inhealthy controls. We also explored their validity asdefined as the correlation between whole-brain atro-phy and clinical measures of disease burden, linearmeasures of atrophy, and whole-brain MR imaginglesion assessments. The purpose of this study is toassess a few key methodologic issues underlying theassessment of whole-brain atrophy in MS to assist inthe planning of clinical trials. This study should alsobe helpful in comparing studies in which differentmethodologies were used to measure whole-brain at-rophy and in assessing the generalizability of anysingle study.
Methods
SubjectsWe performed a cross-sectional study of 52 consecutively
referred clinically confirmed patients with MS (38 women and14 men) and 17 healthy controls (12 women and five men). Thediagnosis of all patients was confirmed at a university-affiliatedMS clinic. None of the patients with MS had other majorclinical illnesses, were younger than 20 or older than 60 years,had used corticosteroids within 4 weeks preceding MR imag-ing, or had a history of substance abuse. Forty-three patientshad relapsing-remitting MS, and nine had a secondary progres-sive clinical MS disease course. Physical disability was assessedby a single experienced neurologist (B.W.G.) blinded to theMR imaging findings by using the Expanded Disability StatusScale (EDSS; 33) within 1 week of MR imaging. EDSS scoresin the MS group ranged from 1.0 to 8.0 (mean � SD, 3.46 �1.90). The duration of MS ranged from 1 to 43 years (11.58 �8.7 years). Healthy volunteers recruited from the local commu-nity and hospital staff served as controls. Mean age of the MSgroup was 42.81 � 8.5 (range, 23–61 years) and that of thecontrol group was 35.94 � 8.9 (range, 20–53 years). Analysis ofvariance (ANOVA) showed a significant difference betweenage of MS patients and that of healthy controls (P � .006).Therefore, all comparisons in this study were adjusted for agein the statistical analysis.
MR ImagingMR Imaging Acquisition. Each subject underwent MR imag-
ing performed by using the same protocol at a tertiary-careuniversity facility (1.5-T Gyroscan ACS-NT; Phillips, Best, theNetherlands). Axial images of the brain were obtained, includ-ing 2D conventional spin-echo T1-weighted (TR/TE, 400/10),fast spin-echo T2-weighted (3000/120), and fast fluid-attenu-ated inversion recovery (FLAIR) images (TR/TE/TI, 8000/120/2200). The FLAIR imaging protocol has been presented in
detail elsewhere (34). For all 2D axial sequences, matrix sizewas 192 � 256, number of signal averages was 2, number ofsections was 24, field of view was 24 cm, and section thicknesswas 5 mm with no intersection gaps. All axial images wereobtained in the canthomeatal plane by using internal land-marks. Coronal images of the whole brain were acquired witha high-spatial-resolution 3D gradient-echo technique (TR/TE,24/7; flip angle, 30°; acquisition matrix, 256 � 256; sections, 70;section thickness, 2.5 mm; no section gap; field of view, 25 cm;and signals averaged, one), which resulted in a voxel size of 1.0mm � 1.0 mm � 2.5 mm. Each component of MR imaginganalysis was performed as detailed below by using a computer-assisted approach on a Sun Ultra 10 workstation (Sun Micro-systems, Santa Clara, CA) by trained technicians (J.S., M.P.S.)who were unaware of clinical information.
MR Imaging Lesion Analysis. For analysis of hyperintenselesions on T2-weighted images, we used FLAIR findings, whichhave shown higher sensitivity and lower interobserver variabil-ity than do fast spin-echo T2-weighted images in the detectionof areas of T2 prolongation in MS (35, 36). Our method ofquantifying the whole-brain hyperintense lesion load has beenrecently detailed and validated (25). A masking and threshold-ing technique was used (Java Image software, version 1.0,Xinapse Systems, Northants, UK. All FLAIR axial sectionsfrom the midpoint of the cerebellum to the vertex were ana-lyzed. Extracranial tissue was first removed by using a maskingtool that involves an automated contour-tracing tool designedto isolate the brain contour. A second part of the maskingprocedure involves manually removing nonlesional extra-axialhyperintensities from within the brain surface contour, primar-ily the result of FLAIR artifacts in the CSF (34). A thresholdwas then applied to separate hyperintense lesions from those ofnonlesional tissue. This constant threshold is reliable in sepa-rating the brain parenchyma and CSF for a given pulse se-quence across subjects, despite the lack of performing signalintensity inhomogeneity correction; however, the thresholdneeds to be determined uniquely for different pulse sequencesor different imaging platforms. The software then automati-cally calculates the whole-brain lesion load by multiplying le-sion area by section thickness. Analysis of hypointense lesionson T1-weighted images, by using the methods described else-where (22, 25, 37), was performed by a single trained observer(J.S.) who was unaware of clinical details. In brief, this wasperformed by using a semiautomated edge finding and localthresholding technique (Java Image, version 1.0). Hypointen-sities on T1-weighted images were defined as lesions in thebrain parenchyma that were of detectably lower signal intensitythan those in white matter and were also at least partiallyhyperintense on FLAIR images. Whole-brain T1 hypointenselesion volume was then calculated automatically by the soft-ware program as the sum of the areas of all lesions multipliedby the section thickness.
MR Imaging Linear Atrophy Measures. To assess centralatrophy, third ventricular width was measured from FLAIRimages by using a method detailed elsewhere (14, 21, 37). Alinear region of interest was drawn through the long axis of thethird ventricle, parallel to the interhemispheric fissure in thesection wherein the third ventricle was most visible. The widthwas measured by drawing a second linear region of interestperpendicular to the first at its midpoint, and recording itslength. The bicaudate ratio, a marker of subcortical atrophy,was derived from FLAIR images, as detailed elsewhere (22).This is the ratio of the intercaudate distance to the brain widthalong the same line. The Java Image software was also used forthese analyses.
Whole-Brain Atrophy MR Imaging Analysis. We used a nor-malized measure, the brain parenchymal fraction (BPF), de-fined as the ratio of brain parenchymal volume (tissue com-partment) to the total brain volume within the surface contour(total intracranial volume). This was assessed by two segmen-
986 SHARMA AJNR: 25, June/July 2004
tation techniques—semiautomated and automated—as de-scribed below.
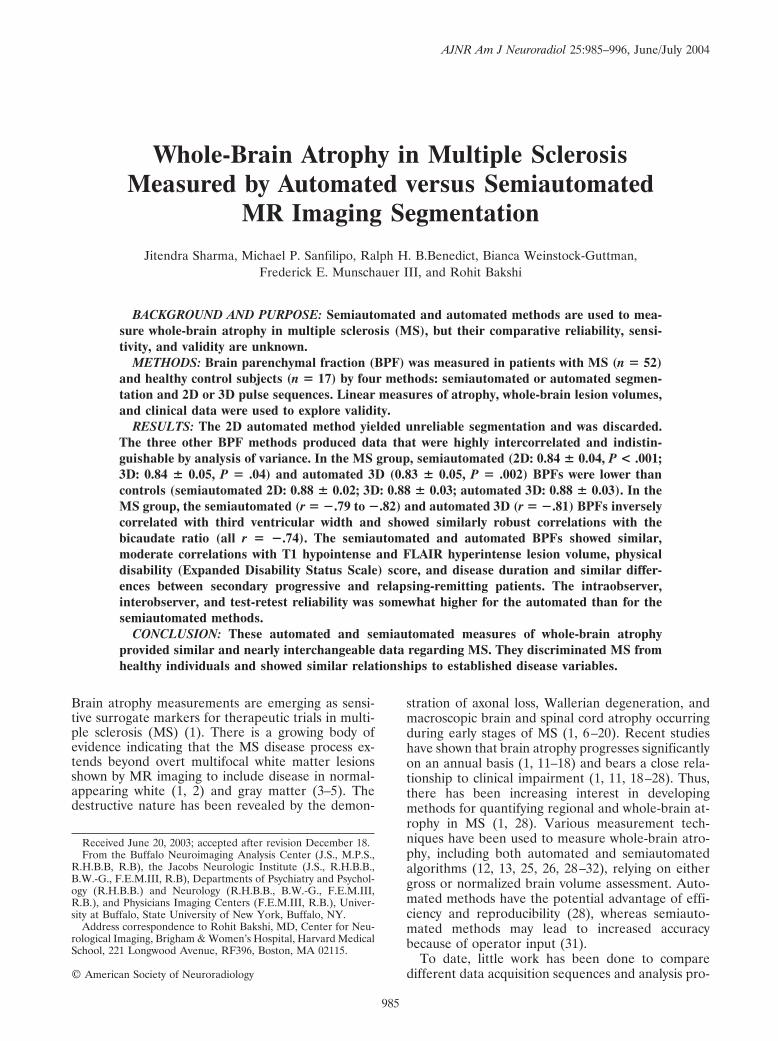
Semiautomated Whole-Brain Atrophy Measurement. Asshown in Figures 1 and 2, this BPF approach was based on asemiautomated computer-assisted technique by using maskingand thresholding (Java Image, version 1.0), as detailed else-where (25). This was based on a previously described auto-mated method (12) but was adapted to a semiautomated tech-nique. We performed the semiautomated whole-brain atrophymeasurement twice, on both the axial 2D T1-weighted andcoronal 3D T1-weighted acquisitions. For the axial data set, allsections from the inferior cerebellum (where the vermis is firstvisible) to the top of the brain (up to the vertex) were analyzed.For the coronal data set, all the sections covering the brainwere included; the inferior aspect of the brain was defined asthe inferior extent of the cerebellar tonsils. These choices ofsections and anatomic boundaries were designed to developconsistency in the brain volume sampled among subjects. Thesemiautomated method involved three major steps: 1) drawingthe region of interest representing the external contour of thebrain surface; 2) masking and removal of artifacts; and 3)segmentation of parenchyma from CSF. The extracranial tissue(eg, skull, orbits, skin, soft tissue) was removed from eachsection by using a semiautomated edge-finding tool included inthe Java Image software package (Figs 1 and 2). The result wasa single region of interest that included only the brain and CSF
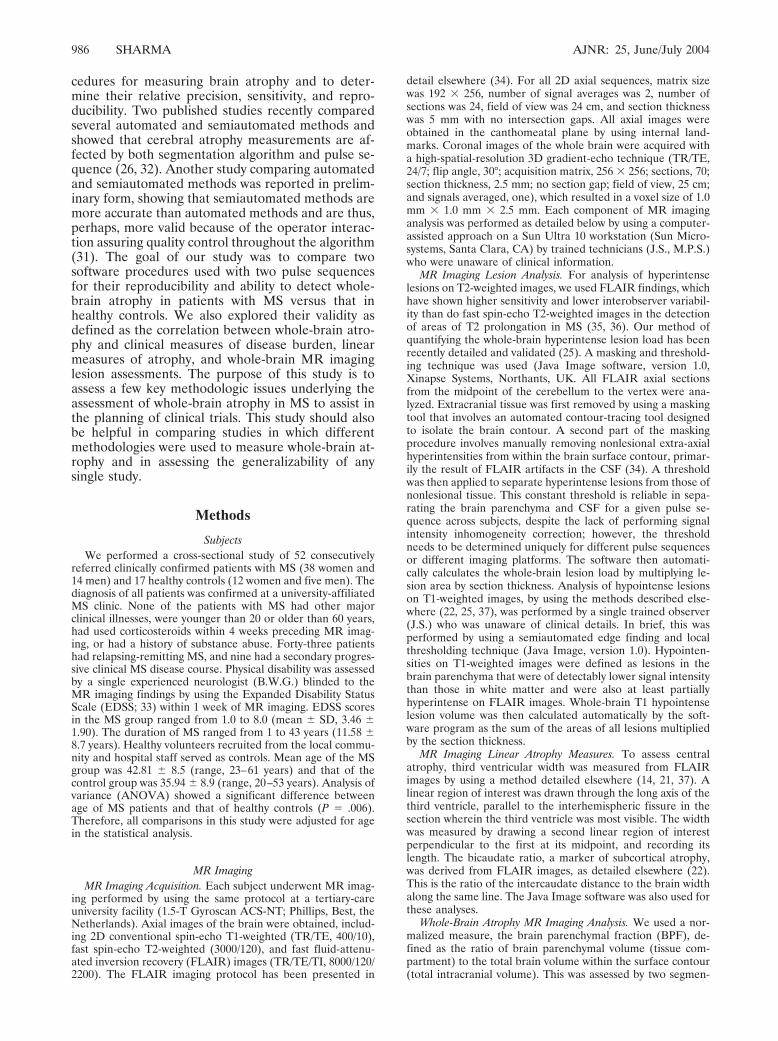
surrounded by a smoothly contoured brain surface. Manualcorrection was required when edge finding alone either in-cluded unnecessary tissue, excluded measurable parenchyma,or excluded subarachnoid space overlying the parenchyma.Artifacts present in the ventricles and the choroid plexus weremanually added to the CSF compartment by setting the mask-ing value to the CSF pixel value. CSF within the brain volumewas then separated from the parenchyma by intensity thresh-olding (Figs 1 and 2). The thresholding step first required theplacement of a 6 � 6-mm square region of interest in normal-appearing white matter on the axial 2D (Fig 2) or coronal 3Dsection wherein the full lateral ventricles were most visible. Themean pixel value was obtained for this region of interest andthen was multiplied by 0.6 for the 2D and 0.5 for the 3Dsections to define a constant threshold level. The determina-tion of the optimal threshold thus depended on the pulsesequence and required development time through trial anderror to separate the brain volume most effectively into datasets consisting of parenchyma and CSF pixels. The softwareprogram determined compartmental volumes by multiplyingthe total area of pixels by section thickness. Total operator-analysis time to determine the BPF by this semiautomatedapproach, including all masking and thresholding steps, wasapproximately 30 minutes per subject for the 2D sequences and90 minutes for the 3D sequence because of the higher numberof sections. With software improvements made after the com-
FIG 1. Semiautomated method of obtaining BPF. A, Raw T1-weighted 2D spin-echo noncontrast axial sequence. B, After masking(removal) of extracranial tissue. The segmented image (C) results from separation of the parenchyma (black) and CSF (white) into twocompartments. The image surrounded by the white square (C) is used to identify normal-appearing white matter for the thresholdingtechnique (see Methods). Adapted from Bermel et al (25).
FIG 2. Semiautomated method of obtaining BPF. T1-weighted spin-echo 2D representative section from a patient with MS beforemasking (A), after masking the outer brain contour (B), and after thresholding (C). Panel B shows the region of interest in thenormal-appearing white matter used for threshold determination. Adapted from Bermel et al (25).
AJNR: 25, June/July 2004 WHOLE-BRAIN ATROPHY IN MULTIPLE SCLEROSIS 987
pletion of the current study, however, the operator time hasbeen reduced to 15 minutes (2D) and 45 minutes (3D). We didnot perform signal intensity inhomogeneity correction in thismethod because, in a preliminary study, BPFs obtained fromour semiautomated technique on raw (uncorrected) imageswere similar to those obtained from another semiautomatedtechnique on inhomogeneity-corrected images (31). We specif-ically addressed the use of 24 sections with the 2D methodinstead of 28 sections that would have covered more of thebrain. To evaluate this issue, we used the semiautomatedmethod to measure BPF on 10 randomly chosen patients withMS by both the 24-section and 28-section data sets. The BPFmeasured by both techniques were similar, with a mean coef-ficient of variation (COV; SD/mean �100%) of 0.4% (range,0.2–0.5%).
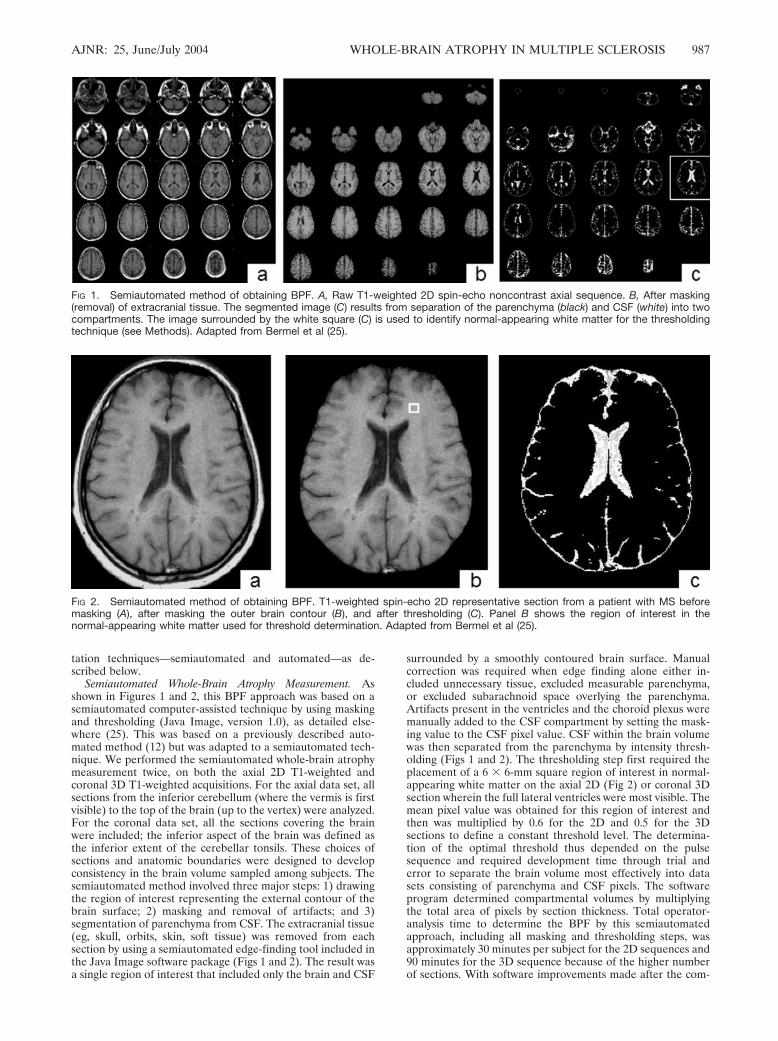
Automated Whole-Brain Atrophy Measurement. BPF was de-termined by using SPM99 (Wellcome Department of CognitiveNeurology, Institute of Neurology, Queen Square, London)(38, 39) to align images in the same 3D orientation, correct formagnetic field inhomogeneity, and segment brain tissue intogray, white, and CSF compartments (Fig 3). This method ofdetermining BPF was based on a previously published method(8). As for the semiautomated method, we performed theautomated BPF measurement twice, on both the 2D T1-weighted axial and 3D T1-weighted coronal acquisitions. Whenaligning images, the origin was placed on the anterior commis-sure and the x-axis of the origin was centered to pass throughthe posterior commissure in the midsagittal plane. Brain im-ages were aligned by matching the interhemispheric fissure tothe origin’s x- and y-axis in the anteroposterior and superior-inferior planes. The inferior and superior border of the brainwas automatically selected by the brain mask. It included brainfrom the lower border of inferior cerebellum to the vertex.Realigned scans were masked to remove extracranial tissue (eg,skull, orbit, outer meningeal tissue) and were segmented intoseparate gray matter, white matter, and CSF images by usinginhomogeneity correction (maximum level), which has beenshown to improve brain image segmentation reproducibility(30). Final whole-brain volume measurements for each tissuecompartment were based on the segmented, masked imagesfrom native brain images (Fig 3). The automated BPF per-formed on the 2D image resulted in poor segmentation, mostlikely because of the pulse-sequence limitations and large sec-tion thickness. Gross segmentation errors were common, suchas the misclassification of CSF areas into the parenchymalcompartment (data not shown). Thus, we dropped the auto-mated 2D BPF from statistical analysis in this study.
Reliability and Variability of MR Imaging Assessments. Vari-ability as an estimate of reliability and reproducibility was
expressed as COVs. For the various BPF methods, intraob-server and interobserver reliability was determined from sixsubjects of the present study (three MS; three controls). Toassess test-retest (scan-rescan) variability and stability of theBPF methods, two healthy volunteers (a 26-year-old man and a36-year-old woman) underwent the MR imaging protocol twice(1 week apart). The intraobserver, interobserver, and test-retest COVs were 0.31%, 0.34%, and 0.41%, respectively, forthe semiautomated 2D, 0.03%, 1.0%, 1.1%, respectively, forthe semiautomated 3D, and 0.06%, 0.10%, and 0.10%, respec-tively, for the 3D automated BPF methods. The intraobserverand interobserver variability in the automated BPF techniquewas accounted for by differences in identification of the ante-rior commissure–posterior commissure line—the only step inthe algorithm requiring operator input. As previously detailed,the intraobserver and interobserver COV were 1.7% and 4.5%for total T1 hypointense parenchymal lesion volume, 1.2% and3.1% for total T2 hyperintense parenchymal lesion volume,5.2% and 7% for third ventricular width, and 2.3% and 4.2%for bicaudate ratio (22, 25, 37).
Effect of Lesion Misclassification. Hypointense lesions due toMS can potentially contaminate whole-brain atrophy assess-ments on spin-echo or gradient-echo T1-weighted images be-cause of misclassification of these lesions as CSF instead of asparenchyma (8, 38). We tested whether lesions affected BPFmeasurement in a subset of 10 patients from the MS group whohad the highest T1-hypointense lesion burden. For the 2Dsemiautomated method, BPF was 0.803 � 0.040 before and0.804 � 0.039 after correction of lesion misclassification (meanBPF change, 0.08%; COV, 0.06%). For the 3D automatedmethod, BPF was 0.813 � 0.041 before and 0.814 � 0.041 aftercorrection of lesion misclassification (mean BPF change,0.19%; COV, 0.14%). Thus, the degree of contamination cre-ated by lesion misclassification was negligible for both meth-ods, leading to a difference that was similar to or less than thatseen because of scan-rescan effects.
Statistical AnalysisAs noted above, there were MS versus normal differences in
age, and BPFs were correlated with age (P � .001). Therefore,all analyses used to compare the relative relationships betweenindependent and dependent variables controlled for the effectsof age. Group comparisons were made by repeat-measuresanalysis of covariance controlling for age. Correlations wereperformed by using the Spearman rank correlation test forordinal data and the Pearson test for continuous variables.Partial correlations were performed, where necessary, to adjustfor age. Because of the number of statistical tests performed, a
FIG 3. Automated method of obtainingBPF by using SPM-99 (see Methods). AT1-weighted 3D section showed thesource image (A) and the resulting imageafter masking and segmentation into pa-renchyma or CSF (B).
988 SHARMA AJNR: 25, June/July 2004
P value � .01 was considered to be statistically significant wheninterpreting statistical tests.
ResultsThe 2D automated method yielded unreliable seg-
mentation and thus the data were discarded (seeMethods). ANOVA comparing the three methodswithin the MS group and within controls did notreveal any significant difference. BPF values obtainedby the three reliable methods in patients with MS andcontrols are shown in Table 1 and Figures 4 and 5.Two semiautomated BPFs (2D and 3D) were highlyintercorrelated in the MS group (r � 0.90, P � .001),and the 2D semiautomated (r � 0.87, P � .001) and3D semiautomated (r � 0.91, P � .001) BPFs werehighly intercorrelated with the 3D automated BPF(Fig 4). Thus, for these three methods, the BPFs inthe MS group were remarkably similar regardless ofpulse sequence or segmentation algorithm. In con-trols, the range of values was restricted, and thusintercorrelations were highly positive but less robust;the semiautomated 2D BPF was intercorrelated withsemiautomated 3D BPF (r � 0.81, P � .001), and thesemiautomated 2D (r � 0.83, P � .001) and 3D (r �0.76, P � .001) BPFs correlated with automated 3DBPF (Fig 4).
All three of the BPF methods were similarly sensi-tive in demonstrating whole-brain atrophy in the MSas compared with the control group. Analysis of co-variance adjusted for age showed that the semiauto-mated (2D: 0.84 � 0.04, range 0.71–0.91, P � .001;3D: 0.84 � 0.05, 0.72–0.92, P � .04) and automated3D (0.83 � 0.05, range 0.71–0.92, P � .002) BPFswere lower in the MS group than in healthy controls(semiautomated 2D: 0.88 � 0.02, range 0.83–0.90;3D: 0.88 � 0.03, range 0.83–0.93; automated 3D:0.88 � 0.03, range 0.80–0.91) (Table 1, Fig 5), con-sistent with whole-brain atrophy in the MS group.The three BPFs showed a similar and higher degreeof atrophy in secondary progressive (semiautomatedBPFs: 2D: 0.81 � 0.04, P � .04; 3D: 0.80 � 0.03, P �.03; automated 3D: 0.80 � 0.04, P � .09) versusrelapsing-remitting patients with MS (semiautomatedBPF: 2D: 0.85 � 0.04; 3D: 0.85 � 0.04; automated3D: 0.84 � 0.05) (Table 1, Fig 5), with the differencesapproaching significance.
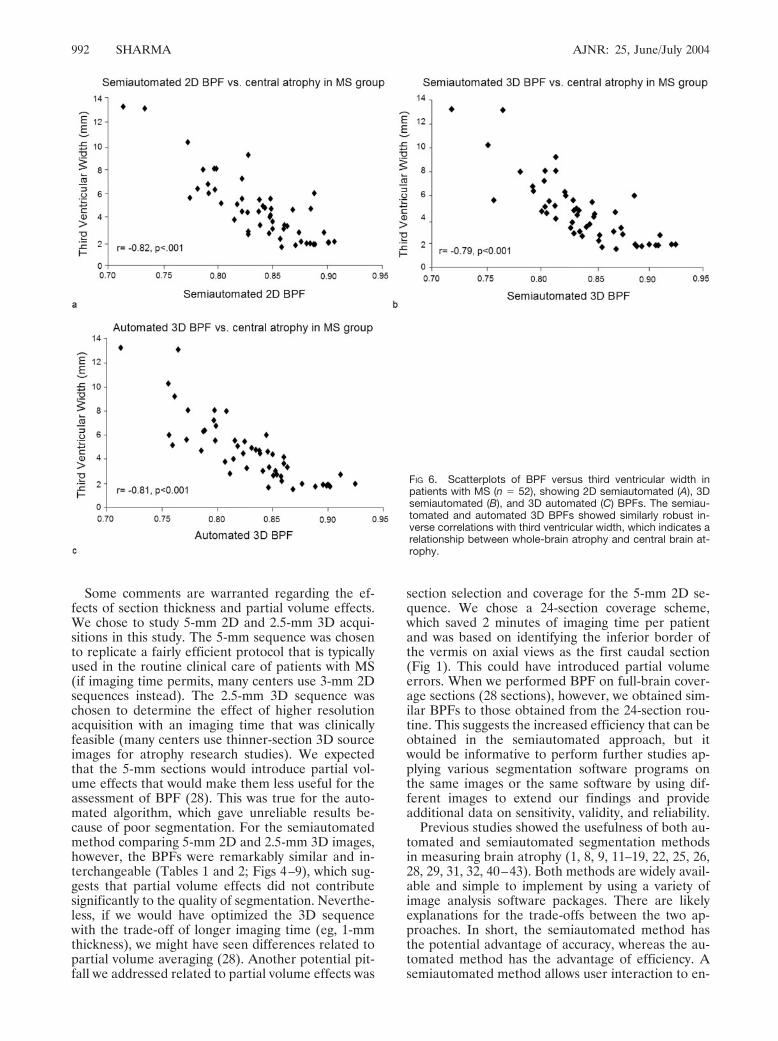
In the MS group, the semiautomated (2D: r � �82,P � .001; 3D: r � �.79, P � .001) and automated 3D
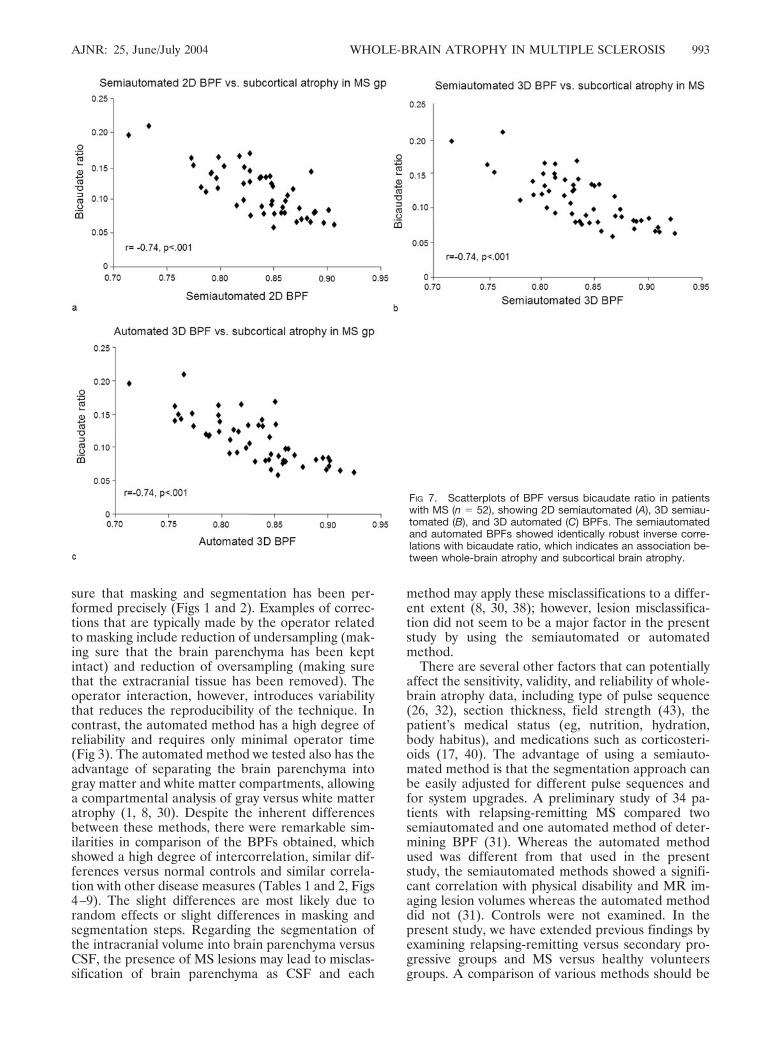
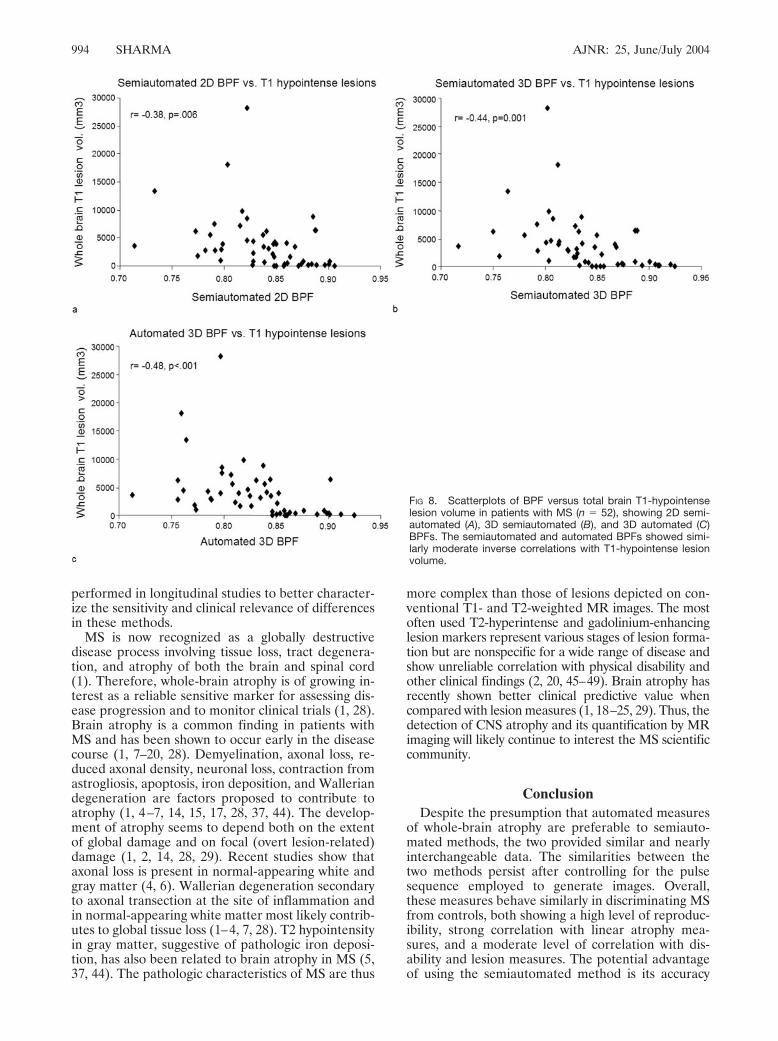
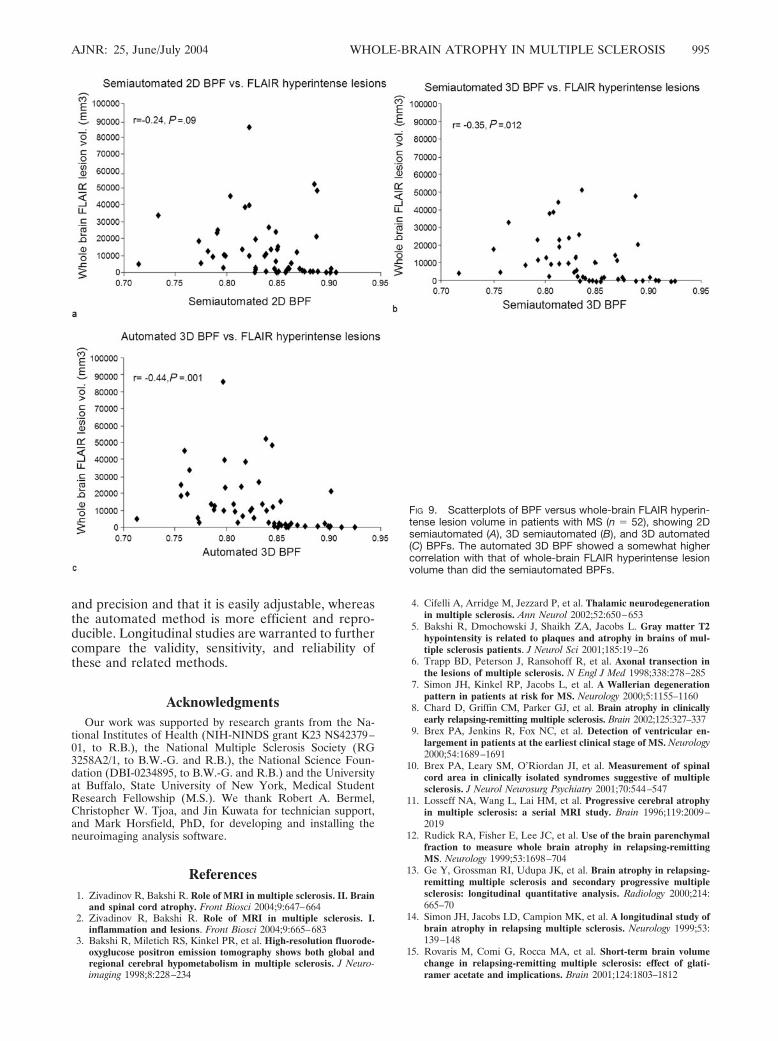
(r � �.81, P � .001) BPFs showed strikingly similarrobust inverse correlations with third ventricularwidth (Table 2, Fig 6), which indicates a relationshipbetween whole-brain atrophy and central brain atro-phy. Similarly, semiautomated (2D: r � �.74, P �.001; 3D: r � �.74, P � .001) and automated (3D: r ��.74, P � .001) BPFs showed identical robust inversecorrelations with bicaudate ratio (Table 2, Fig 7),which indicates an association between whole-brainatrophy and subcortical brain atrophy. The semiauto-mated (2D: r � �.38, P � .006; 3D: r � �.44, P �.001) and automated (3D: r � .48, P � .001) BPFsshowed similar moderate inverse correlations withwhole-brain T1 hypointense lesion volume (Table 2;Fig 8). The automated 3D BPF (r � �.44, P � .001)showed a somewhat higher correlation with totalbrain FLAIR hyperintense lesion volume than did thesemiautomated BPFs (2D: r � �.24, P � .09; 3D: r ��.35, P � .01) (Table 2; Fig 9). The semiautomated(2D: r � �.44, P �. 001; 3D: r � �.47, P � .001) andautomated 3D (r � �.33, P � .008) BPFs showedsimilarly moderate inverse correlations with physicaldisability (EDSS score; Table 2). The semiautomated(2D: r � -.50, P � .001; 3D: r � �.39, P � .002) andautomated 3D (r � �.53, P � .001) BPFs showedsimilar moderate inverse correlations with diseaseduration (Table 2).
DiscussionIn the present study, we compared two segmenta-
tion algorithms (semiautomated versus automated)and two pulse sequences (T1-weighted 5-mm conven-tional spin-echo 2D and T1-weighted 2.5-mm gradi-ent echo 3D) for the measurement of normalizedwhole-brain atrophy in MS. Both approaches wereperformed by using commercially available softwarepackages. To use whole-brain atrophy as a surrogatemarker for disease progression and for assessing ef-fects of therapies, it is desirable that segmentationtechniques have validity, accuracy, reproducibility,and sensitivity. It has been presumed that automatedmeasurement of whole-brain atrophy is preferred be-cause of inherent efficiency and reproducibility (28).Semiautomated measurements, however, have theadvantage of operator interaction to ensure accuracyof the masking and segmentation steps (25, 31). Ourstudy indicates that there are many similarities amongthe methods. Both semiautomated and automated
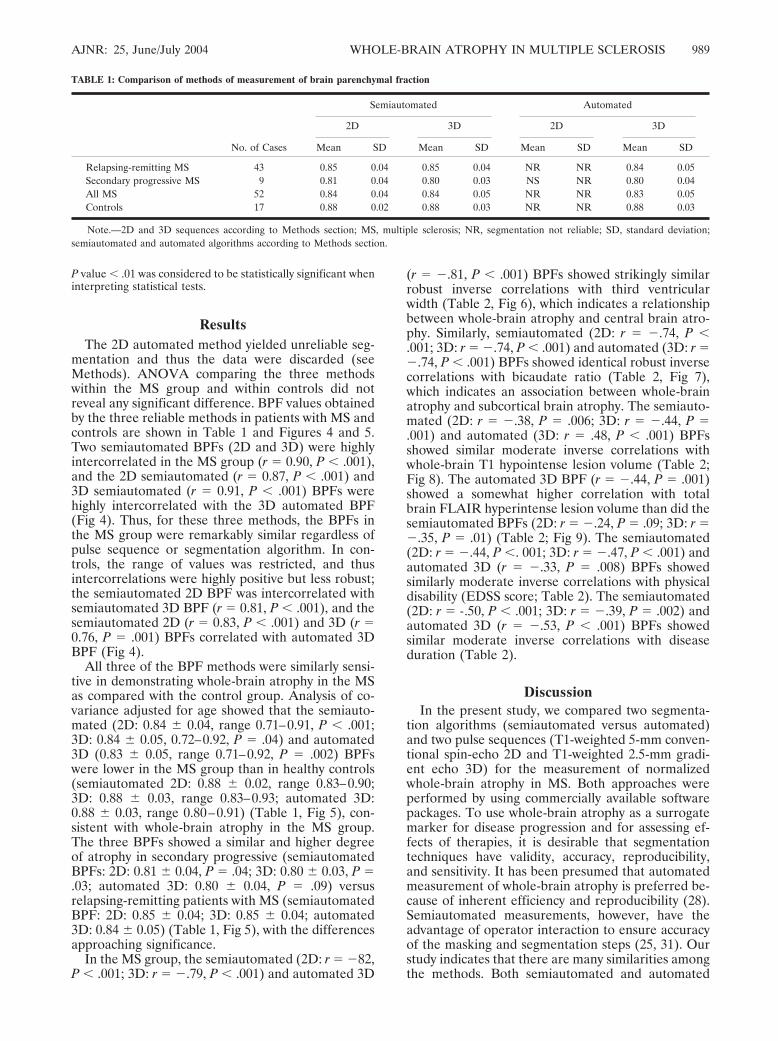
TABLE 1: Comparison of methods of measurement of brain parenchymal fraction
No. of Cases
Semiautomated Automated
2D 3D 2D 3D
Mean SD Mean SD Mean SD Mean SD
Relapsing-remitting MS 43 0.85 0.04 0.85 0.04 NR NR 0.84 0.05Secondary progressive MS 9 0.81 0.04 0.80 0.03 NS NR 0.80 0.04All MS 52 0.84 0.04 0.84 0.05 NR NR 0.83 0.05Controls 17 0.88 0.02 0.88 0.03 NR NR 0.88 0.03
Note.—2D and 3D sequences according to Methods section; MS, multiple sclerosis; NR, segmentation not reliable; SD, standard deviation;semiautomated and automated algorithms according to Methods section.
AJNR: 25, June/July 2004 WHOLE-BRAIN ATROPHY IN MULTIPLE SCLEROSIS 989
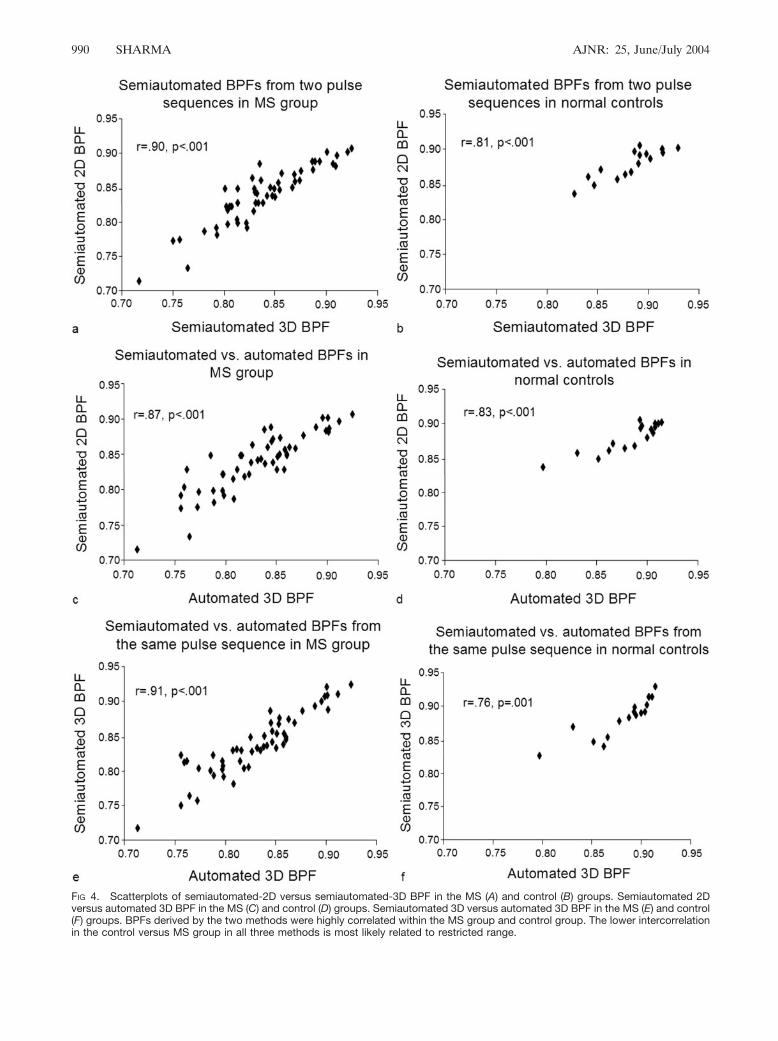
FIG 4. Scatterplots of semiautomated-2D versus semiautomated-3D BPF in the MS (A) and control (B) groups. Semiautomated 2Dversus automated 3D BPF in the MS (C) and control (D) groups. Semiautomated 3D versus automated 3D BPF in the MS (E) and control(F) groups. BPFs derived by the two methods were highly correlated within the MS group and control group. The lower intercorrelationin the control versus MS group in all three methods is most likely related to restricted range.
990 SHARMA AJNR: 25, June/July 2004
techniques showed a high rate of reproducibility andappear to have a similar degree of validity as esti-mated by their relationship to established clinical andMR imaging disease markers (Tables 1 and 2; Figs 4and 5). Both methods were able to detect whole-brainatrophy in MS versus healthy controls (Table 1; Fig5). Both methods showed a similar degree of validityas estimated against linear measures of brain atrophysuch as third ventricular width (Table 2; Fig 6) andbicaudate ratio (Table 2; Fig 7). Both methods showeda similar correlation with total brain T1 hypointense andFLAIR hyperintense lesion volumes (Table 2; Figs 8and 9). The two atrophy methods, however, were notcompletely interchangeable in terms of correlation withother MR imaging and clinical measures (Tables 1 and
2; Figs 5–9). The slight differences are most likely due torandom effects or differences in masking and segmen-tation steps. Such small variations are not likely to be ofclinical relevance.
In terms of BPFs performed on two different pulsesequences (2D spin-echo and 3D gradient echo),semiautomated BPFs showed similar and inter-changeable results in terms of the data obtained andcorrelation with MR imaging and clinical variables(Tables 1 and 2, Figs 4–9). In terms of BPFs per-formed on the same pulse sequence but differentsegmentation procedures, the semiautomated BPFgenerated data remarkably similar to the automatedBPF including comparable estimates of validity byusing the 3D image series (Tables 1 and 2; Figs 4–9).
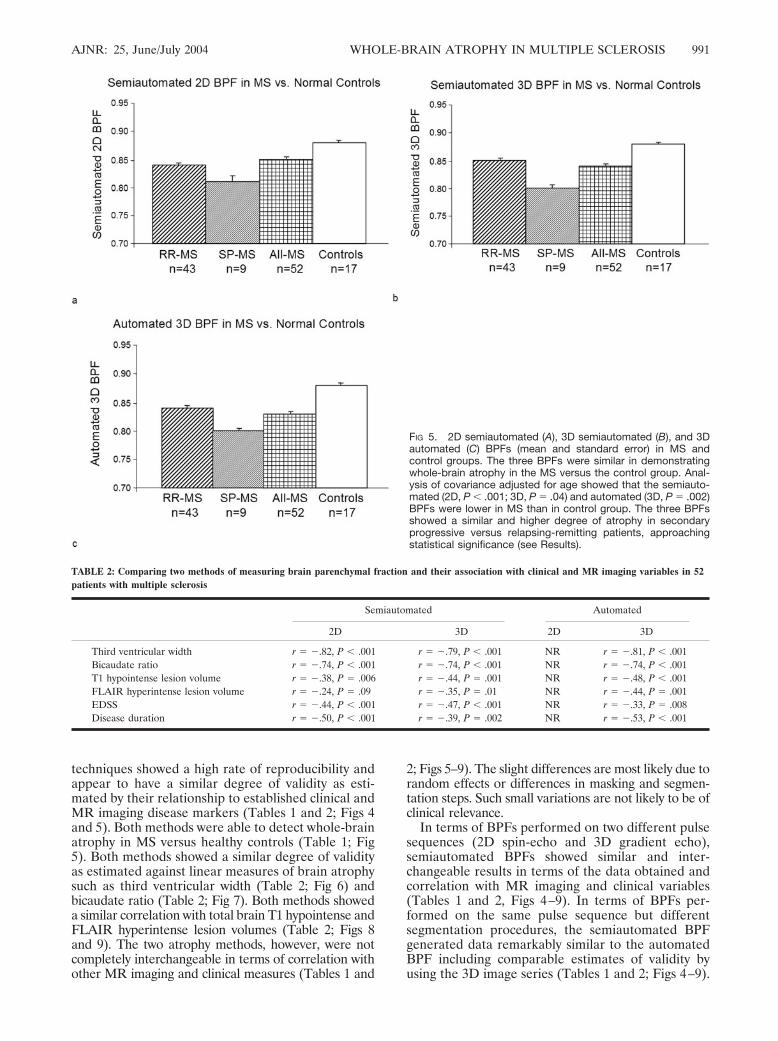
FIG 5. 2D semiautomated (A), 3D semiautomated (B), and 3Dautomated (C) BPFs (mean and standard error) in MS andcontrol groups. The three BPFs were similar in demonstratingwhole-brain atrophy in the MS versus the control group. Anal-ysis of covariance adjusted for age showed that the semiauto-mated (2D, P � .001; 3D, P � .04) and automated (3D, P � .002)BPFs were lower in MS than in control group. The three BPFsshowed a similar and higher degree of atrophy in secondaryprogressive versus relapsing-remitting patients, approachingstatistical significance (see Results).
TABLE 2: Comparing two methods of measuring brain parenchymal fraction and their association with clinical and MR imaging variables in 52patients with multiple sclerosis
Semiautomated Automated
2D 3D 2D 3D
Third ventricular width r � �.82, P � .001 r � �.79, P � .001 NR r � �.81, P � .001Bicaudate ratio r � �.74, P � .001 r � �.74, P � .001 NR r � �.74, P � .001T1 hypointense lesion volume r � �.38, P � .006 r � �.44, P � .001 NR r � �.48, P � .001FLAIR hyperintense lesion volume r � �.24, P � .09 r � �.35, P � .01 NR r � �.44, P � .001EDSS r � �.44, P � .001 r � �.47, P � .001 NR r � �.33, P � .008Disease duration r � �.50, P � .001 r � �.39, P � .002 NR r � �.53, P � .001
AJNR: 25, June/July 2004 WHOLE-BRAIN ATROPHY IN MULTIPLE SCLEROSIS 991
Some comments are warranted regarding the ef-fects of section thickness and partial volume effects.We chose to study 5-mm 2D and 2.5-mm 3D acqui-sitions in this study. The 5-mm sequence was chosento replicate a fairly efficient protocol that is typicallyused in the routine clinical care of patients with MS(if imaging time permits, many centers use 3-mm 2Dsequences instead). The 2.5-mm 3D sequence waschosen to determine the effect of higher resolutionacquisition with an imaging time that was clinicallyfeasible (many centers use thinner-section 3D sourceimages for atrophy research studies). We expectedthat the 5-mm sections would introduce partial vol-ume effects that would make them less useful for theassessment of BPF (28). This was true for the auto-mated algorithm, which gave unreliable results be-cause of poor segmentation. For the semiautomatedmethod comparing 5-mm 2D and 2.5-mm 3D images,however, the BPFs were remarkably similar and in-terchangeable (Tables 1 and 2; Figs 4–9), which sug-gests that partial volume effects did not contributesignificantly to the quality of segmentation. Neverthe-less, if we would have optimized the 3D sequencewith the trade-off of longer imaging time (eg, 1-mmthickness), we might have seen differences related topartial volume averaging (28). Another potential pit-fall we addressed related to partial volume effects was
section selection and coverage for the 5-mm 2D se-quence. We chose a 24-section coverage scheme,which saved 2 minutes of imaging time per patientand was based on identifying the inferior border ofthe vermis on axial views as the first caudal section(Fig 1). This could have introduced partial volumeerrors. When we performed BPF on full-brain cover-age sections (28 sections), however, we obtained sim-ilar BPFs to those obtained from the 24-section rou-tine. This suggests the increased efficiency that can beobtained in the semiautomated approach, but itwould be informative to perform further studies ap-plying various segmentation software programs onthe same images or the same software by using dif-ferent images to extend our findings and provideadditional data on sensitivity, validity, and reliability.
Previous studies showed the usefulness of both au-tomated and semiautomated segmentation methodsin measuring brain atrophy (1, 8, 9, 11–19, 22, 25, 26,28, 29, 31, 32, 40–43). Both methods are widely avail-able and simple to implement by using a variety ofimage analysis software packages. There are likelyexplanations for the trade-offs between the two ap-proaches. In short, the semiautomated method hasthe potential advantage of accuracy, whereas the au-tomated method has the advantage of efficiency. Asemiautomated method allows user interaction to en-
FIG 6. Scatterplots of BPF versus third ventricular width inpatients with MS (n � 52), showing 2D semiautomated (A), 3Dsemiautomated (B), and 3D automated (C) BPFs. The semiau-tomated and automated 3D BPFs showed similarly robust in-verse correlations with third ventricular width, which indicates arelationship between whole-brain atrophy and central brain at-rophy.
992 SHARMA AJNR: 25, June/July 2004
sure that masking and segmentation has been per-formed precisely (Figs 1 and 2). Examples of correc-tions that are typically made by the operator relatedto masking include reduction of undersampling (mak-ing sure that the brain parenchyma has been keptintact) and reduction of oversampling (making surethat the extracranial tissue has been removed). Theoperator interaction, however, introduces variabilitythat reduces the reproducibility of the technique. Incontrast, the automated method has a high degree ofreliability and requires only minimal operator time(Fig 3). The automated method we tested also has theadvantage of separating the brain parenchyma intogray matter and white matter compartments, allowinga compartmental analysis of gray versus white matteratrophy (1, 8, 30). Despite the inherent differencesbetween these methods, there were remarkable sim-ilarities in comparison of the BPFs obtained, whichshowed a high degree of intercorrelation, similar dif-ferences versus normal controls and similar correla-tion with other disease measures (Tables 1 and 2, Figs4–9). The slight differences are most likely due torandom effects or slight differences in masking andsegmentation steps. Regarding the segmentation ofthe intracranial volume into brain parenchyma versusCSF, the presence of MS lesions may lead to misclas-sification of brain parenchyma as CSF and each
method may apply these misclassifications to a differ-ent extent (8, 30, 38); however, lesion misclassifica-tion did not seem to be a major factor in the presentstudy by using the semiautomated or automatedmethod.
There are several other factors that can potentiallyaffect the sensitivity, validity, and reliability of whole-brain atrophy data, including type of pulse sequence(26, 32), section thickness, field strength (43), thepatient’s medical status (eg, nutrition, hydration,body habitus), and medications such as corticosteri-oids (17, 40). The advantage of using a semiauto-mated method is that the segmentation approach canbe easily adjusted for different pulse sequences andfor system upgrades. A preliminary study of 34 pa-tients with relapsing-remitting MS compared twosemiautomated and one automated method of deter-mining BPF (31). Whereas the automated methodused was different from that used in the presentstudy, the semiautomated methods showed a signifi-cant correlation with physical disability and MR im-aging lesion volumes whereas the automated methoddid not (31). Controls were not examined. In thepresent study, we have extended previous findings byexamining relapsing-remitting versus secondary pro-gressive groups and MS versus healthy volunteersgroups. A comparison of various methods should be
FIG 7. Scatterplots of BPF versus bicaudate ratio in patientswith MS (n � 52), showing 2D semiautomated (A), 3D semiau-tomated (B), and 3D automated (C) BPFs. The semiautomatedand automated BPFs showed identically robust inverse corre-lations with bicaudate ratio, which indicates an association be-tween whole-brain atrophy and subcortical brain atrophy.
AJNR: 25, June/July 2004 WHOLE-BRAIN ATROPHY IN MULTIPLE SCLEROSIS 993
performed in longitudinal studies to better character-ize the sensitivity and clinical relevance of differencesin these methods.
MS is now recognized as a globally destructivedisease process involving tissue loss, tract degenera-tion, and atrophy of both the brain and spinal cord(1). Therefore, whole-brain atrophy is of growing in-terest as a reliable sensitive marker for assessing dis-ease progression and to monitor clinical trials (1, 28).Brain atrophy is a common finding in patients withMS and has been shown to occur early in the diseasecourse (1, 7–20, 28). Demyelination, axonal loss, re-duced axonal density, neuronal loss, contraction fromastrogliosis, apoptosis, iron deposition, and Walleriandegeneration are factors proposed to contribute toatrophy (1, 4–7, 14, 15, 17, 28, 37, 44). The develop-ment of atrophy seems to depend both on the extentof global damage and on focal (overt lesion-related)damage (1, 2, 14, 28, 29). Recent studies show thataxonal loss is present in normal-appearing white andgray matter (4, 6). Wallerian degeneration secondaryto axonal transection at the site of inflammation andin normal-appearing white matter most likely contrib-utes to global tissue loss (1–4, 7, 28). T2 hypointensityin gray matter, suggestive of pathologic iron deposi-tion, has also been related to brain atrophy in MS (5,37, 44). The pathologic characteristics of MS are thus
more complex than those of lesions depicted on con-ventional T1- and T2-weighted MR images. The mostoften used T2-hyperintense and gadolinium-enhancinglesion markers represent various stages of lesion forma-tion but are nonspecific for a wide range of disease andshow unreliable correlation with physical disability andother clinical findings (2, 20, 45–49). Brain atrophy hasrecently shown better clinical predictive value whencompared with lesion measures (1, 18–25, 29). Thus, thedetection of CNS atrophy and its quantification by MRimaging will likely continue to interest the MS scientificcommunity.
ConclusionDespite the presumption that automated measures
of whole-brain atrophy are preferable to semiauto-mated methods, the two provided similar and nearlyinterchangeable data. The similarities between thetwo methods persist after controlling for the pulsesequence employed to generate images. Overall,these measures behave similarly in discriminating MSfrom controls, both showing a high level of reproduc-ibility, strong correlation with linear atrophy mea-sures, and a moderate level of correlation with dis-ability and lesion measures. The potential advantageof using the semiautomated method is its accuracy
FIG 8. Scatterplots of BPF versus total brain T1-hypointenselesion volume in patients with MS (n � 52), showing 2D semi-automated (A), 3D semiautomated (B), and 3D automated (C)BPFs. The semiautomated and automated BPFs showed simi-larly moderate inverse correlations with T1-hypointense lesionvolume.
994 SHARMA AJNR: 25, June/July 2004
and precision and that it is easily adjustable, whereasthe automated method is more efficient and repro-ducible. Longitudinal studies are warranted to furthercompare the validity, sensitivity, and reliability ofthese and related methods.
AcknowledgmentsOur work was supported by research grants from the Na-
tional Institutes of Health (NIH-NINDS grant K23 NS42379–01, to R.B.), the National Multiple Sclerosis Society (RG3258A2/1, to B.W.-G. and R.B.), the National Science Foun-dation (DBI-0234895, to B.W.-G. and R.B.) and the Universityat Buffalo, State University of New York, Medical StudentResearch Fellowship (M.S.). We thank Robert A. Bermel,Christopher W. Tjoa, and Jin Kuwata for technician support,and Mark Horsfield, PhD, for developing and installing theneuroimaging analysis software.
References1. Zivadinov R, Bakshi R. Role of MRI in multiple sclerosis. II. Brain
and spinal cord atrophy. Front Biosci 2004;9:647–6642. Zivadinov R, Bakshi R. Role of MRI in multiple sclerosis. I.
inflammation and lesions. Front Biosci 2004;9:665–6833. Bakshi R, Miletich RS, Kinkel PR, et al. High-resolution fluorode-
oxyglucose positron emission tomography shows both global andregional cerebral hypometabolism in multiple sclerosis. J Neuro-imaging 1998;8:228–234
4. Cifelli A, Arridge M, Jezzard P, et al. Thalamic neurodegenerationin multiple sclerosis. Ann Neurol 2002;52:650–653
5. Bakshi R, Dmochowski J, Shaikh ZA, Jacobs L. Gray matter T2hypointensity is related to plaques and atrophy in brains of mul-tiple sclerosis patients. J Neurol Sci 2001;185:19–26
6. Trapp BD, Peterson J, Ransohoff R, et al. Axonal transection inthe lesions of multiple sclerosis. N Engl J Med 1998;338:278–285
7. Simon JH, Kinkel RP, Jacobs L, et al. A Wallerian degenerationpattern in patients at risk for MS. Neurology 2000;5:1155–1160
8. Chard D, Griffin CM, Parker GJ, et al. Brain atrophy in clinicallyearly relapsing-remitting multiple sclerosis. Brain 2002;125:327–337
9. Brex PA, Jenkins R, Fox NC, et al. Detection of ventricular en-largement in patients at the earliest clinical stage of MS. Neurology2000;54:1689–1691
10. Brex PA, Leary SM, O’Riordan JI, et al. Measurement of spinalcord area in clinically isolated syndromes suggestive of multiplesclerosis. J Neurol Neurosurg Psychiatry 2001;70:544–547
11. Losseff NA, Wang L, Lai HM, et al. Progressive cerebral atrophyin multiple sclerosis: a serial MRI study. Brain 1996;119:2009–2019
12. Rudick RA, Fisher E, Lee JC, et al. Use of the brain parenchymalfraction to measure whole brain atrophy in relapsing-remittingMS. Neurology 1999;53:1698–704
13. Ge Y, Grossman RI, Udupa JK, et al. Brain atrophy in relapsing-remitting multiple sclerosis and secondary progressive multiplesclerosis: longitudinal quantitative analysis. Radiology 2000;214:665–70
14. Simon JH, Jacobs LD, Campion MK, et al. A longitudinal study ofbrain atrophy in relapsing multiple sclerosis. Neurology 1999;53:139–148
15. Rovaris M, Comi G, Rocca MA, et al. Short-term brain volumechange in relapsing-remitting multiple sclerosis: effect of glati-ramer acetate and implications. Brain 2001;124:1803–1812
FIG 9. Scatterplots of BPF versus whole-brain FLAIR hyperin-tense lesion volume in patients with MS (n � 52), showing 2Dsemiautomated (A), 3D semiautomated (B), and 3D automated(C) BPFs. The automated 3D BPF showed a somewhat highercorrelation with that of whole-brain FLAIR hyperintense lesionvolume than did the semiautomated BPFs.
AJNR: 25, June/July 2004 WHOLE-BRAIN ATROPHY IN MULTIPLE SCLEROSIS 995
16. Filippi M, Rovaris M, Iannucci G, et al. Whole brain volumechanges in patients with progressive MS treated with cladribine.Neurology 2000;55:1714–1717
17. Zivadinov R, Rudick RA, De Masi R, et al. Effects of IV methyl-prednisolone on brain atrophy in relapsing-remitting MS. Neurol-ogy 2001;57:1239–1247
18. Zivadinov R, Sepcic J, Nasuelli D, et al. A longitudinal study ofbrain atrophy and cognitive disturbances in the early phase ofrelapsing-remitting multiple sclerosis. J Neurol Neurosurg Psychia-try 2001;70:773–780
19. Fisher E, Rudick RA, Simon JH, et al. Eight-year follow-up studyof brain atrophy in patients with MS. Neurology 2002;59:1412–1420
20. Bakshi R, Benedict RH, Bermel RA, Jacobs L. Regional brainatrophy is associated with physical disability in multiple sclerosis:semiquantitative magnetic resonance imaging and clinical find-ings. J Neuroimaging 2001;11:129–136
21. Benedict RHB, Weinstock-Guttman B, Fishman I, et al. Predictionof neuropsychological impairment in multiple sclerosis: compari-son of conventional magnetic resonance imaging measures of at-rophy and lesion burden. Arch Neurol 2004;61:226–230
22. Bermel R, Bakshi R, Tjoa C, et al. Bicaudate ratio as an MRImarker of brain atrophy in multiple sclerosis. Arch Neurol 2002;59:275–280
23. Janardhan V, Bakshi R. Quality of life and its relationship to brainlesions and atrophy on magnetic resonance images in 60 patientswith multiple sclerosis. Arch Neurol 2000;57:1485–1491
24. Bakshi R, Czarnecki D, Shaikh ZA, et al. Brain MRI lesions andatrophy are related to depression in multiple sclerosis. Neuroreport2000;11:1153–1158
25. Bermel RA, Sharma J, Tjoa CW, et al. A semiautomated measureof whole-brain atrophy in multiple sclerosis. J Neurol Sci 2003;208:57–65
26. Leigh R, Ostuni J, Pham D, et al. Estimating cerebral atrophy inmultiple sclerosis patients from various MR pulse sequences. MultScler 2002;8:420–429
27. Zorzon M, de Masi R, Nasuelli D, et al. Depression and anxiety inmultiple sclerosis: a clinical and MRI study in 95 subjects. J Neurol2001;248:416–421
28. Miller DH, Barkhof F, Frank JA, et al. Measurement of atrophy inmultiple sclerosis: pathological basis, methodological aspects andclinical relevance. Brain 2002;125:1676–1695
29. Kalkers NF, Vrenken H, Uitdehaag BMJ, et al. Brain atrophy inmultiple sclerosis: impact of lesions and damage of whole braintissue. Mult Scler 2002;8:410–414
30. Chard DT, Parker GJ, Griffin CM, et al. The reproducibility andsensitivity of brain tissue volume measurements derived from anSPM-based segmentation methodology. J Magn Reson Imaging2002;15:259–267
31. Zivadinov R, Bakshi R, Grop A, et al. A comparison of differentquantitative MRI techniques to measure whole brain atrophy inrelapsing-remitting multiple sclerosis. Mult Scler 2002;8:s99
32. Horsfield MA, Rovaris M, Rocca MA, et al. Whole brain atrophyin multiple sclerosis measured by two segmentation processes fromvarious MRI sequences. J Neurol Sci 2003;216:169–177
33. Kurtzke JF. Rating neurologic impairment in multiple sclerosis: anexpanded disability status scale (EDSS). Neurology 1983;33:1444–1452
34. Bakshi R, Caruthers SD, Janardhan V, Wasay M. IntraventricularCSF pulsation artifact on fast fluid-attenuated inversion-recoveryMR images: analysis of 100 consecutive normal studies. AJNR Am JNeuroradiol 2000;21:503–508
35. Bakshi R, Ariyaratana S, Benedict RHB, Jacobs L. Fluid-attenu-ated inversion recovery magnetic resonance imaging detects corti-cal and juxtacortical multiple sclerosis lesions. Arch Neurol 2001;58:742–748
36. Bastianello S, Bozzao A, Paolillo A, et al. Fast spin-echo and fastfluid-attenuated inversion-recovery versus conventional spin-echosequences for MR quantification of multiple sclerosis lesions.AJNR Am J Neuroradiol 1997;18:699–704
37. Bakshi R, Benedict RHB, Bermel RA, et al. T2 hypointensity in thedeep gray matter of patients with multiple sclerosis: a quantitativemagnetic resonance imaging study. Arch Neurol 2002;59:62–68
38. Sanfilipo MP, Benedict RHB, Zivadinov R, Bakshi R. Correctionfor intracranial volume in analysis of whole brain volume in mul-tiple sclerosis: the proportion vs. residual method. Neuroimage (inpress)
39. Ashburner J, Friston K. Voxel-based morphometry: the methods.Neuroimage 2000;11:805–821
40. Hoogervorst EL, Polman CH, Barkhof F. Cerebral volume changesin multiple sclerosis patients treated with high-dose intravenousmethylprednisolone. Mult Scler 2002;8:415–419
41. Hohol MJ, Guttmann CR, Orav J, et al. Serial neuropsychologicalassessment and magnetic resonance imaging analysis in multiplesclerosis. Arch Neurol 1997;54:1018–1025
42. Pelletier D, Nelson SJ, Oh J, et al. MRI lesion volume heterogeneityin primary progressive MS in relation with axonal damage andbrain atrophy. J Neurol Neurosurg Psychiatry 2003;74:950–952
43. Gasperini C, Rovaris M, Sormani MP, et al. Intra-observer, inter-observer and inter-scanner variations in brain MRI volume mea-surements in multiple sclerosis. Mult Scler 2001;7:27–31
44. Bakshi R, Puli SR. Tjoa CW, et al. Gray matter T2 hypointensity inmultiple sclerosis: a 2-year longitudinal clinical–MRI study of 79patients. Neurology 2002;58:A154
45. Simon JH. Contrast-enhanced MR imaging in the evaluation oftreatment response and prediction of outcome in multiple sclero-sis. J Magn Reson Imaging 1997;7:29–37
46. Katz D. Taubenberger JK, Cannella B, et al. Correlation betweenmagnetic resonance imaging findings and lesion development inchronic, active multiple sclerosis. Ann Neurol 1993;34:661–669
47. Barnes D, Munro PM, Youl BD, et al. The longstanding MS lesion:a quantitative MRI and electron microscopic study. Brain 1991;114:1271–1280
48. Barkhof F. MRI in multiple sclerosis: correlation with expandeddisability status scale (EDSS). Mult Scler 1999;5:283–286
49. Bakshi R, Miletich RS, Henschel K, et al. Fatigue in multiplesclerosis: cross sectional correlation with brain MRI findings in 71patients. Neurology 1999;53:1151–1153
996 SHARMA AJNR: 25, June/July 2004
Related Documents


![Evaluation of a Tetrazolium-based Semiautomated ... · (CANCER RESEARCH 47, 936-942, February 15, 1987] Evaluation of a Tetrazolium-based Semiautomated Colorimetrie Assay: Assessment](https://static.cupdf.com/doc/110x72/5f5765572ff1b503ec225aa6/evaluation-of-a-tetrazolium-based-semiautomated-cancer-research-47-936-942.jpg)


