Semantic annotation of soccer videos: automatic highlights identification J€ urgen Assfalg, * Marco Bertini, Carlo Colombo, Alberto Del Bimbo, and Walter Nunziati Dipartimento di Sistemi e Informatica, Via S. Marta 3, Firenze 50139, Italy Received 1 September 2002; accepted 1 June 2003 Abstract Automatic semantic annotation of video streams allows both to extract significant clips for production logging and to index video streams for posterity logging. Automatic annotation for production logging is particularly demanding, as it is applied to non-edited video streams and must rely only on visual information. Moreover, annotation must be computed in quasi real- time. In this paper, we present a system that performs automatic annotation of the principal highlights in soccer video, suited for both production and posterity logging. The knowledge of the soccer domain is encoded into a set of finite state machines, each of which models a spe- cific highlight. Highlight detection exploits visual cues that are estimated from the video stream, and particularly, ball motion, the currently framed playfield zone, playersÕ positions and colors of playersÕ uniforms. The highlight models are checked against the current observations, using a model checking algorithm. The system has been developed within the EU ASSAVID project. Ó 2003 Elsevier Inc. All rights reserved. Keywords: Semantic annotation; Sports videos; Highlights detection 1. Introduction Video annotation and retrieval by content are motivated by the huge amount of video daily produced both by broadcasters and individual film shooters. In particu- * Corresponding author. E-mail addresses: [email protected]fi.it (J. Assfalg), [email protected]fi.it (M. Bertini), colombo@dsi. unifi.it (C. Colombo), [email protected]fi.it (A. Del Bimbo), [email protected]fi.it (W. Nunziati). 1077-3142/$ - see front matter Ó 2003 Elsevier Inc. All rights reserved. doi:10.1016/j.cviu.2003.06.004 Computer Vision and Image Understanding xxx (2003) xxx–xxx www.elsevier.com/locate/cviu ARTICLE IN PRESS

Welcome message from author
This document is posted to help you gain knowledge. Please leave a comment to let me know what you think about it! Share it to your friends and learn new things together.
Transcript
ARTICLE IN PRESS
Computer Vision and Image Understanding xxx (2003) xxx–xxx
www.elsevier.com/locate/cviu
Semantic annotation of soccer videos:automatic highlights identification
J€uurgen Assfalg,* Marco Bertini, Carlo Colombo,Alberto Del Bimbo, and Walter Nunziati
Dipartimento di Sistemi e Informatica, Via S. Marta 3, Firenze 50139, Italy
Received 1 September 2002; accepted 1 June 2003
Abstract
Automatic semantic annotation of video streams allows both to extract significant clips for
production logging and to index video streams for posterity logging. Automatic annotation for
production logging is particularly demanding, as it is applied to non-edited video streams and
must rely only on visual information. Moreover, annotation must be computed in quasi real-
time. In this paper, we present a system that performs automatic annotation of the principal
highlights in soccer video, suited for both production and posterity logging. The knowledge
of the soccer domain is encoded into a set of finite state machines, each of which models a spe-
cific highlight. Highlight detection exploits visual cues that are estimated from the video stream,
and particularly, ball motion, the currently framed playfield zone, players� positions and colors
of players� uniforms. The highlight models are checked against the current observations, using a
model checking algorithm. The system has been developed within the EU ASSAVID project.
� 2003 Elsevier Inc. All rights reserved.
Keywords: Semantic annotation; Sports videos; Highlights detection
1. Introduction
Video annotation and retrieval by content are motivated by the huge amount of
video daily produced both by broadcasters and individual film shooters. In particu-
* Corresponding author.
E-mail addresses: [email protected] (J. Assfalg), [email protected] (M. Bertini), colombo@dsi.
unifi.it (C. Colombo), [email protected] (A. Del Bimbo), [email protected] (W. Nunziati).
1077-3142/$ - see front matter � 2003 Elsevier Inc. All rights reserved.
doi:10.1016/j.cviu.2003.06.004
2 J. Assfalg et al. / Computer Vision and Image Understanding xxx (2003) xxx–xxx
ARTICLE IN PRESS
lar, broadcasters are strongly interested in tools that enable to log the most relevant
shots of a video stream with annotations that may support effectively the task of ed-
iting TV programmes. Annotations should include the description of the most rele-
vant highlights and other in-depth information. Making the annotation as much as
possible automatic is one of the best ways to improve the production quality and toface a competitive market. To this end, broadcasters employ two distinct logging ap-
proaches. In production logging, which is carried out live or shortly after the event,
the assistant producer selects manually the relevant shots to be included into the pro-
gramme of the day. In posterity logging, the video material is catalogued for later re-
use. In this case, librarians typically prepare a detailed textual annotation of each
video tape after a careful inspection of its content. As a result of that, annotations
strongly depend on which of the two logging approaches is followed. In particular,
production logging typically deals with raw video—captions and effects like replaysthat are useful for automatic annotation are added later during the editing phase,
and speech and audio are available only occasionally. On the other hand, in posterity
logging, automatic annotation can use speech and audio as well as captions and ed-
iting effects to extract semantic information from the video stream. Besides, while in
production logging the annotation must be performed on-line to meet the nearly re-
al-time requirements of as live 1 programme production, in posterity logging the an-
notation can be performed off-line.
Although there is an extensive literature on the subject of automatic video anno-tation for video archiving, this distinction and its implications have never been con-
sidered. Proposals have been concerned with solutions of general applicability,
addressing detection of syntactic features like editing effects and keyframes
[1,10,12,16,28] as well as with solutions for the extraction of video semantics, specif-
ically tailored to particular application domains [5,6,9,17,19,25].
In the specific case of sports videos, automatic semantic annotation requires that
the most relevant highlights are identified. Sports highlights represent atomic entities
at the semantic level. They have a limited temporal extension and a relatively simplestructure, that can be modelled as the spatio-temporal concatenation of specific
events. The challenge in sports highlight detection is therefore tied with the choice
of appropriate representation models and the selection of meaningful cues that
can be extracted from the video stream. Typical facts of tennis have been modelled
and detected in [22]. Detection and description of the athletes� running behavior is
discussed in [7]. Rule-based modelling of complex basketball plays is presented in
[27]. In [21], shots of basketball game are classified into one of three categories. De-
veloping on this classification, basket events are detected when the shot sequence dis-plays certain visual patterns. Bayes networks have been used in [15] to model and
classify American football plays; however, trajectories of players and ball are entered
manually, and are not automatically extracted from the video stream. In [3] auto-
matic video annotation at an intermediate semantic level is presented: based on vi-
sual features, frames are classified respectively as ‘‘crowd,’’ ‘‘player,’’ or ‘‘playfield.’’
1 A programme is said to be broadcast as live if it is broadcast with a very limited delay—i.e., a few
hours—from its recording.
J. Assfalg et al. / Computer Vision and Image Understanding xxx (2003) xxx–xxx 3
ARTICLE IN PRESS
Annotation of soccer videos has been addressed by a large number of researchers.
In [26], Yow et al. used mosaic images for the visualization of complete actions: play-
ers and the ball are superimposed on the background image of the playfield so that the
development of the game is shown. Choi et al. [8] addressed the problem of detection
and tracking of ball and players in the video sequence. The metric position of theplayers on the playfield was estimated using an approximation of the perspective pla-
nar transformation from the image points to the playfield model. The EU-ADMIRE
project [24] has addressed modelling of semantic events in sport videos using a hier-
archical rule-based approach; highlights are detected and annotated, based on low-in-
termediate level features extracted manually from the video stream. MPEG motion
vectors were used in [18] to detect highlights. In particular, it was exploited the fact
that fast camera motion is observed in correspondence of typical soccer highlights,
such as shot on goal or free kick. In [13], the playfield was divided into several distinctzones: the zone is identified using patterns of the playfield lines which appear in the
image. The ball position is also used to perform detection of shot on goal and corner
kick highlights. Tovinkere and Qian proposed a hierarchical E-R framework for
modelling the domain knowledge [23]. This scheme is suited for both team plays
and individual actions, and uses a set of nested rules to check whether a particular
event takes place; the model includes 3D data on the position of players and ball that
are obtained from microwave sensors or multiple video cameras. Recognition of rel-
evant soccer highlights (free kicks, corner kicks, and penalty kicks) was presented in[2]: Hidden Markov Models encoding players� distribution and camera motion were
used to discriminate between the three highlights. The major weakness of the ap-
proach is in the difficulty to obtain training sets that are representative of the typical
occurrences of some highlight, and, due to this, the possibility of modelling highlights
that may occur with many different patterns. More recently, in [11], Ekin et al. per-
formed highlight detection in soccer video using both shot sequence analysis and shot
visual cues. In particular, they assume that the presence of highlights can be inferred
from the occurrence of one or several slow motion shots and from the presence ofshots where the referee and/or the goal box is framed. The method only works on ed-
ited programmes and is therefore suited only for posterity logging annotation.
In the following we present automatic detection of the principal highlights in soc-
cer, based on the estimation of a few visual cues. We partition the playfield into dif-
ferent zones with slight overlapping and use the motion of the main camera as a cue
for the evolution of the play. Each highlight is modelled with a Finite State Machine
(FSM), where key events, defined in terms of the estimated cues, determine the tran-
sition from one state to the following. The highlight models are checked against thecurrent observations, using a model checking algorithm. Fig. 1 provides an overview
of the highlight detection engine, and of the data that are fed into the two subsystems
for visual cue extraction and model checking. The system supports the detection of
all the principal soccer highlights and is suited for both production and posterity log-
ging. The work was developed within the EU-ASSAVID (Automatic Segmentation
and Semantic Annotation of sports VIDeo) project, that aimed to provide a fully au-
tomated system for annotation of sports video footage. Domain experts were in-
volved in the definition and modelling of the most relevant soccer highlights.

Fig. 1. Overview of principles of operation of the highlight detection engine.
4 J. Assfalg et al. / Computer Vision and Image Understanding xxx (2003) xxx–xxx
ARTICLE IN PRESS
The paper is organized as follows: in Section 2, we discuss the solution adopted
for modelling highlights. Then, we provide details on the extraction of intermedi-
ate-level cues from the video stream (Section 3) and on model checking (Section
4). We report on experimental results in Section 5. Conclusions and future work
are discussed in Section 6.
2. Highlight models and visual cues
In our approach, we model highlights using finite state machines: each highlight is
described by a directed graph Gh ¼ hSh; Ehi, where Sh is the set of nodes representing
the states and Eh is the set of edges representing the events. Events indicate transi-
tions from one state to the other: they capture the relevant steps in the progression
of the play. An event is triggered whenever a change occurs in the observed cues. The
spatio-temporal analysis of the play is performed only at frames that have been pre-viously classified as ‘‘playfield’’ frames [3].
As a concrete example, we consider the case of the shot on goal highlight. Its de-
scription provided by a domain expert is as follows:
The player that has the ball gets closer to the opponent�s goal box. He then kicks the ball
towards the goal post. Eventually, the ball is either blocked by the goalkeeper, or ends into
the net, or goes beyond the field end line. Alternatively, the ball gets far from the goal box.
The knowledge model obtained from this description is shown in Fig. 2. It models
the temporal evolution of a specific set of observable cues that characterizes the shot
on goal highlight. The ball motion—its acceleration after the player�s kick, its decel-eration and stop when it is blocked by the goalkeeper, its direction—and the zone of
the playfield where the ball is played, are used as visual cues. They are estimated using,
respectively, the camera motion and the playfield zone framed by the camera as dis-cussed in more detail in the following section. As shown in Fig. 3a, changes in camera
motion occur when the ball is kicked or stopped. The playfield region can be extracted
from the frames of the sequence as shown in Fig. 3c for keyframes of Fig. 3b.
More generally, state transitions are determined by the following cues, that are
directly estimated from image data: motion of the ball, currently framed playfield
zone, position of the players on the playfield, color of players� uniforms. Table 1
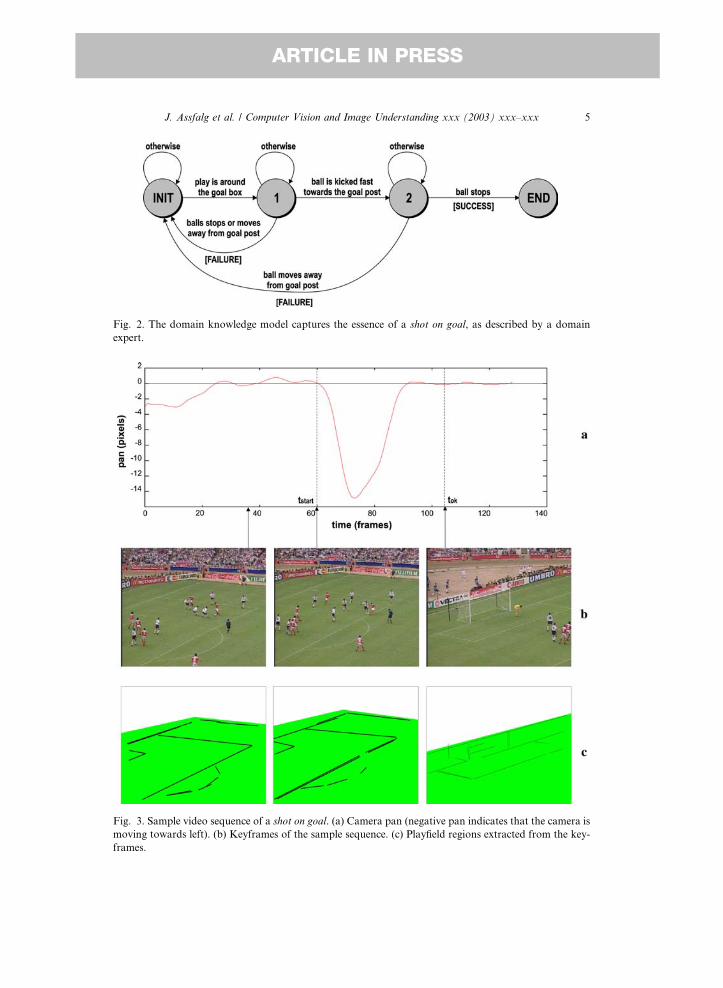
Fig. 3. Sample video sequence of a shot on goal. (a) Camera pan (negative pan indicates that the camera is
moving towards left). (b) Keyframes of the sample sequence. (c) Playfield regions extracted from the key-
frames.
Fig. 2. The domain knowledge model captures the essence of a shot on goal, as described by a domain
expert.
J. Assfalg et al. / Computer Vision and Image Understanding xxx (2003) xxx–xxx 5
ARTICLE IN PRESS
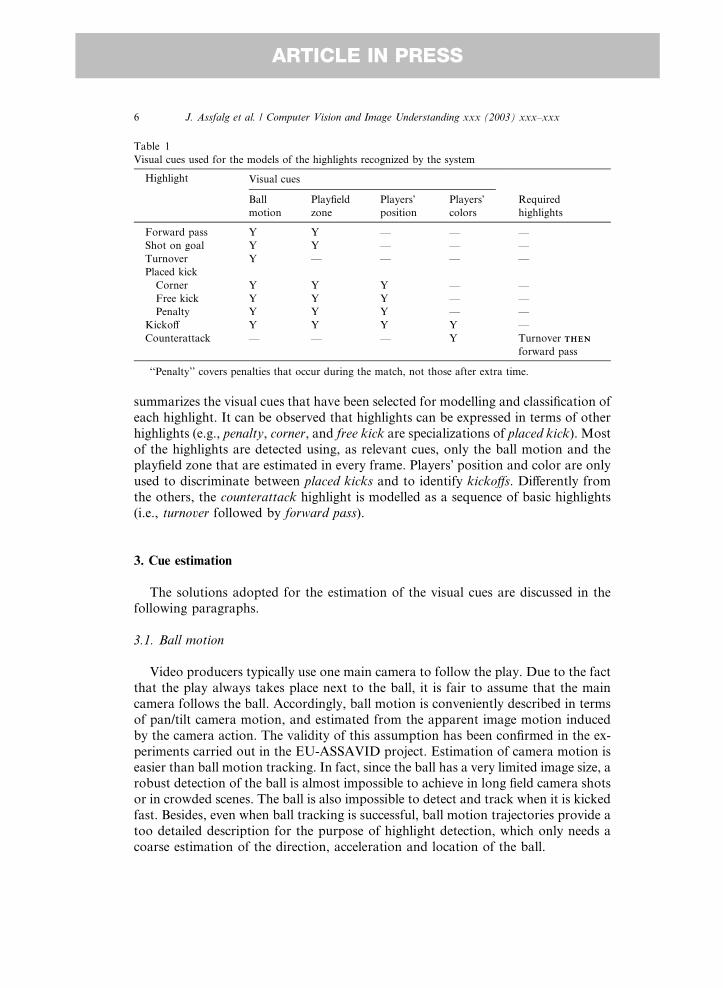
Table 1
Visual cues used for the models of the highlights recognized by the system
Highlight Visual cues
Ball
motion
Playfield
zone
Players�position
Players�colors
Required
highlights
Forward pass Y Y — — —
Shot on goal Y Y — — —
Turnover Y — — — —
Placed kick
Corner Y Y Y — —
Free kick Y Y Y — —
Penalty Y Y Y — —
Kickoff Y Y Y Y —
Counterattack — — — Y Turnover THENTHEN
forward pass
‘‘Penalty’’ covers penalties that occur during the match, not those after extra time.
6 J. Assfalg et al. / Computer Vision and Image Understanding xxx (2003) xxx–xxx
ARTICLE IN PRESS
summarizes the visual cues that have been selected for modelling and classification of
each highlight. It can be observed that highlights can be expressed in terms of other
highlights (e.g., penalty, corner, and free kick are specializations of placed kick). Most
of the highlights are detected using, as relevant cues, only the ball motion and the
playfield zone that are estimated in every frame. Players� position and color are only
used to discriminate between placed kicks and to identify kickoffs. Differently from
the others, the counterattack highlight is modelled as a sequence of basic highlights
(i.e., turnover followed by forward pass).
3. Cue estimation
The solutions adopted for the estimation of the visual cues are discussed in the
following paragraphs.
3.1. Ball motion
Video producers typically use one main camera to follow the play. Due to the fact
that the play always takes place next to the ball, it is fair to assume that the main
camera follows the ball. Accordingly, ball motion is conveniently described in terms
of pan/tilt camera motion, and estimated from the apparent image motion induced
by the camera action. The validity of this assumption has been confirmed in the ex-
periments carried out in the EU-ASSAVID project. Estimation of camera motion is
easier than ball motion tracking. In fact, since the ball has a very limited image size, arobust detection of the ball is almost impossible to achieve in long field camera shots
or in crowded scenes. The ball is also impossible to detect and track when it is kicked
fast. Besides, even when ball tracking is successful, ball motion trajectories provide a
too detailed description for the purpose of highlight detection, which only needs a
coarse estimation of the direction, acceleration and location of the ball.
J. Assfalg et al. / Computer Vision and Image Understanding xxx (2003) xxx–xxx 7
ARTICLE IN PRESS
As in soccer videos the camera is typically in a fixed position, a 3-parameter image
motion estimation algorithm capturing horizontal and vertical translations and iso-
tropic scaling is sufficient to get a reasonable estimate of camera pan, tilt and zoom.
The image motion estimation algorithm is an adaptation to the soccer domain of the
algorithm reported in [4], that is based on corner tracking. As it works with a selectednumber of salient image locations, the algorithm can cope with large displacements
due to fast camera motion. The algorithm employs deterministic sample consensus to
perform a statistical motion grouping. This is particularly effective to cluster multiple
independent image motions, and is therefore suitable for the specific case of soccer to
separate camera motion from the motion of individual players.
3.2. Playfield zones
Given a ‘‘playfield’’ frame, the region of the image that represents the playfield
can be roughly identified from grass color information, based on color histogram
analysis. The playfield image region is then refined through a processing chain com-
posed of K-fill, flood fill and morphological operators (erosion and dilation). A vec-
tor representation of the playfield region outline is produced.
The playfield image region is processed in order to extract an edge map which is
used to obtain line segments. To this end, we rely on a growing algorithm, which
produces a vector representation of the segments [20]. The playfield lines (the whitelines in the playfield) are then obtained by joining together white segments that are
close and collinear.
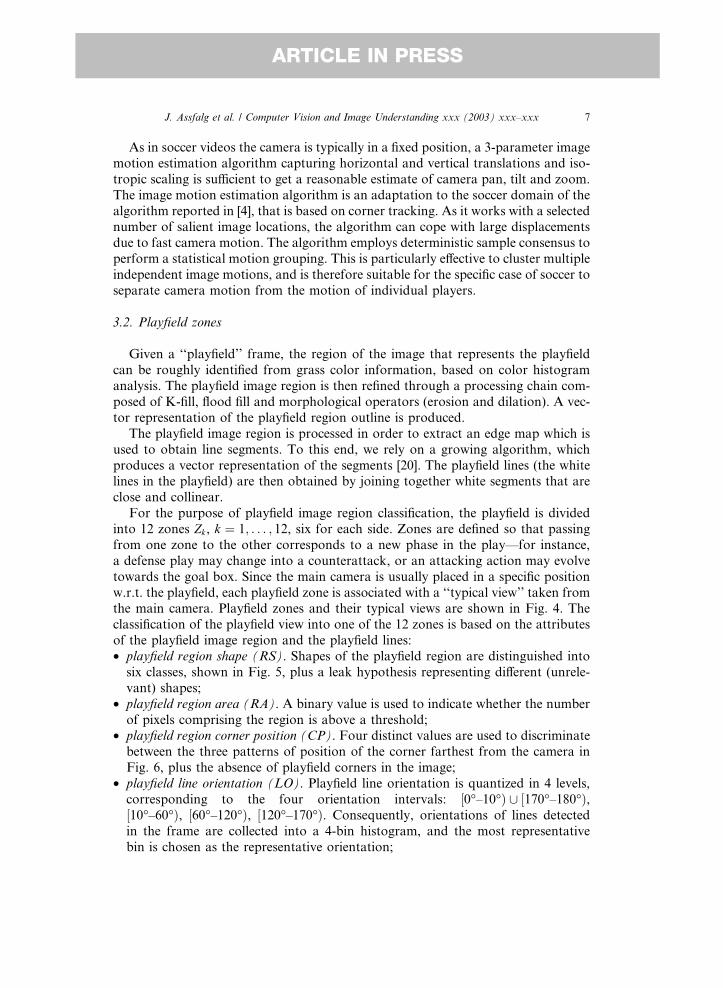
For the purpose of playfield image region classification, the playfield is divided
into 12 zones Zk, k ¼ 1; . . . ; 12, six for each side. Zones are defined so that passing
from one zone to the other corresponds to a new phase in the play—for instance,
a defense play may change into a counterattack, or an attacking action may evolve
towards the goal box. Since the main camera is usually placed in a specific position
w.r.t. the playfield, each playfield zone is associated with a ‘‘typical view’’ taken fromthe main camera. Playfield zones and their typical views are shown in Fig. 4. The
classification of the playfield view into one of the 12 zones is based on the attributes
of the playfield image region and the playfield lines:
• playfield region shape (RS). Shapes of the playfield region are distinguished into
six classes, shown in Fig. 5, plus a leak hypothesis representing different (unrele-
vant) shapes;
• playfield region area (RA). A binary value is used to indicate whether the number
of pixels comprising the region is above a threshold;• playfield region corner position (CP). Four distinct values are used to discriminate
between the three patterns of position of the corner farthest from the camera in
Fig. 6, plus the absence of playfield corners in the image;
• playfield line orientation (LO). Playfield line orientation is quantized in 4 levels,
corresponding to the four orientation intervals: ½0�–10�Þ [ ½170�–180�Þ,½10�–60�Þ, ½60�–120�Þ, ½120�–170�Þ. Consequently, orientations of lines detected
in the frame are collected into a 4-bin histogram, and the most representative
bin is chosen as the representative orientation;
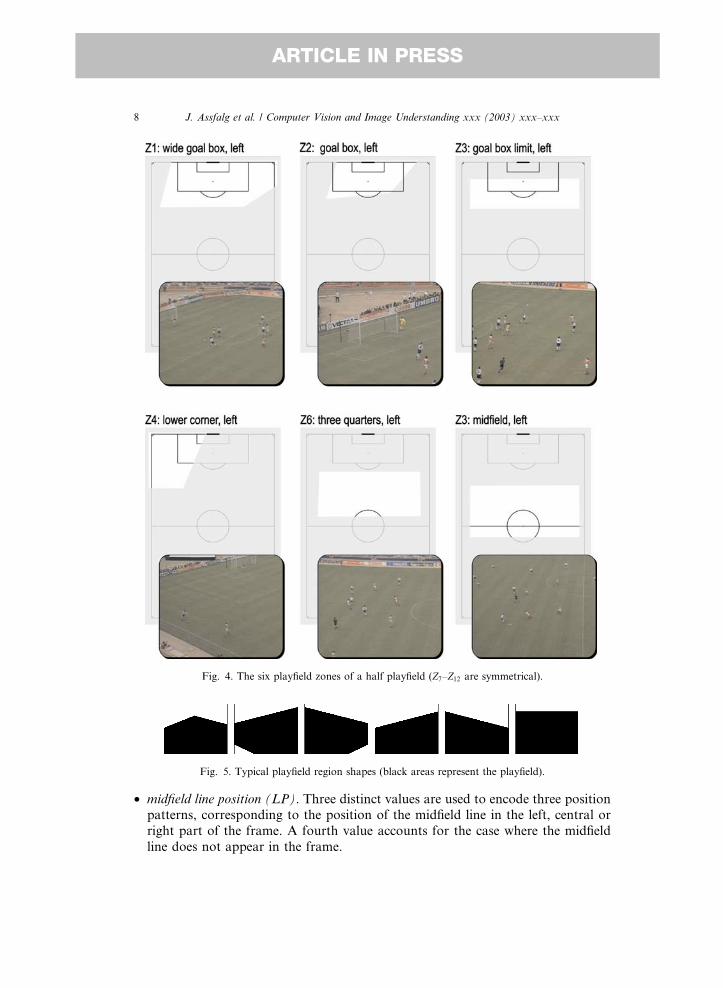
Fig. 5. Typical playfield region shapes (black areas represent the playfield).
Fig. 4. The six playfield zones of a half playfield (Z7–Z12 are symmetrical).
8 J. Assfalg et al. / Computer Vision and Image Understanding xxx (2003) xxx–xxx
ARTICLE IN PRESS
• midfield line position (LP). Three distinct values are used to encode three positionpatterns, corresponding to the position of the midfield line in the left, central or
right part of the frame. A fourth value accounts for the case where the midfield
line does not appear in the frame.
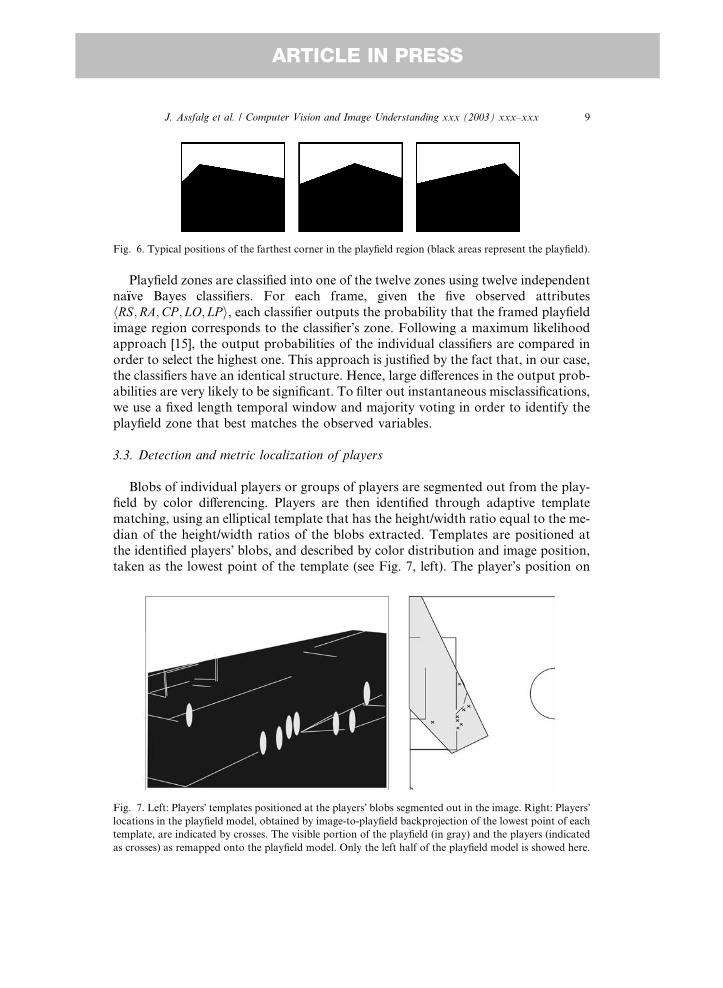
Fig. 6. Typical positions of the farthest corner in the playfield region (black areas represent the playfield).
J. Assfalg et al. / Computer Vision and Image Understanding xxx (2003) xxx–xxx 9
ARTICLE IN PRESS
Playfield zones are classified into one of the twelve zones using twelve independent
na€ııve Bayes classifiers. For each frame, given the five observed attributes
hRS;RA;CP ; LO; LP i, each classifier outputs the probability that the framed playfield
image region corresponds to the classifier�s zone. Following a maximum likelihood
approach [15], the output probabilities of the individual classifiers are compared in
order to select the highest one. This approach is justified by the fact that, in our case,the classifiers have an identical structure. Hence, large differences in the output prob-
abilities are very likely to be significant. To filter out instantaneous misclassifications,
we use a fixed length temporal window and majority voting in order to identify the
playfield zone that best matches the observed variables.
3.3. Detection and metric localization of players
Blobs of individual players or groups of players are segmented out from the play-field by color differencing. Players are then identified through adaptive template
matching, using an elliptical template that has the height/width ratio equal to the me-
dian of the height/width ratios of the blobs extracted. Templates are positioned at
the identified players� blobs, and described by color distribution and image position,
taken as the lowest point of the template (see Fig. 7, left). The player�s position on
Fig. 7. Left: Players� templates positioned at the players� blobs segmented out in the image. Right: Players�locations in the playfield model, obtained by image-to-playfield backprojection of the lowest point of each
template, are indicated by crosses. The visible portion of the playfield (in gray) and the players (indicated
as crosses) as remapped onto the playfield model. Only the left half of the playfield model is showed here.
10 J. Assfalg et al. / Computer Vision and Image Understanding xxx (2003) xxx–xxx
ARTICLE IN PRESS
the playfield is computed from the projective transformation (estimated automati-
cally at each frame) which maps a generic imaged playfield point ½x y�T onto the real
playfield point ½X Y �T (see Fig. 7, right).
Assuming the pinhole camera projection model, the image-to-playfield transfor-
mation has the form
Fig. 8
the str
½X1 X2 X3�T ¼ H ½x y 1�T; ð1Þ
where ½X Y �T ¼ ½X1=X3 X2=X3�T and H is a 3� 3 homogeneous matrix, referred to asplanar homography, whose eight independent entries depend on both camera position
and calibration parameters [14]. To compute the position of the players on the
playfield, we must compute H. Since, according to Eq. (1), each pair of corre-
sponding points h½x y�T; ½X Y �Ti gives rise to two independent equations in the entries
of H, the planar homography can in principle be estimated given a set of four or
more image-to-playfield point correspondences. However, since we are provided
with a set of line segments as the result of image segmentation, the homography isestimated instead using four line correspondences. Indeed, if ½a b c�T such that
axþ by þ c ¼ 0 is the image of a playfield line ½A B C �T, it holds
½a b c�T ¼ K ½A B C�T; ð2Þ
with K ¼ HT. Therefore, the point transformation H is obtained from the linetransformation K.The right correspondences between image and playfield line pairs are obtained by
the following deterministic consensus algorithm:
1. Image line selection. From all the image line segments, select a four-element subset
and consider the associated line subset SIi ¼ f½al bl cl�T; l ¼ 1; . . . ; 4g;
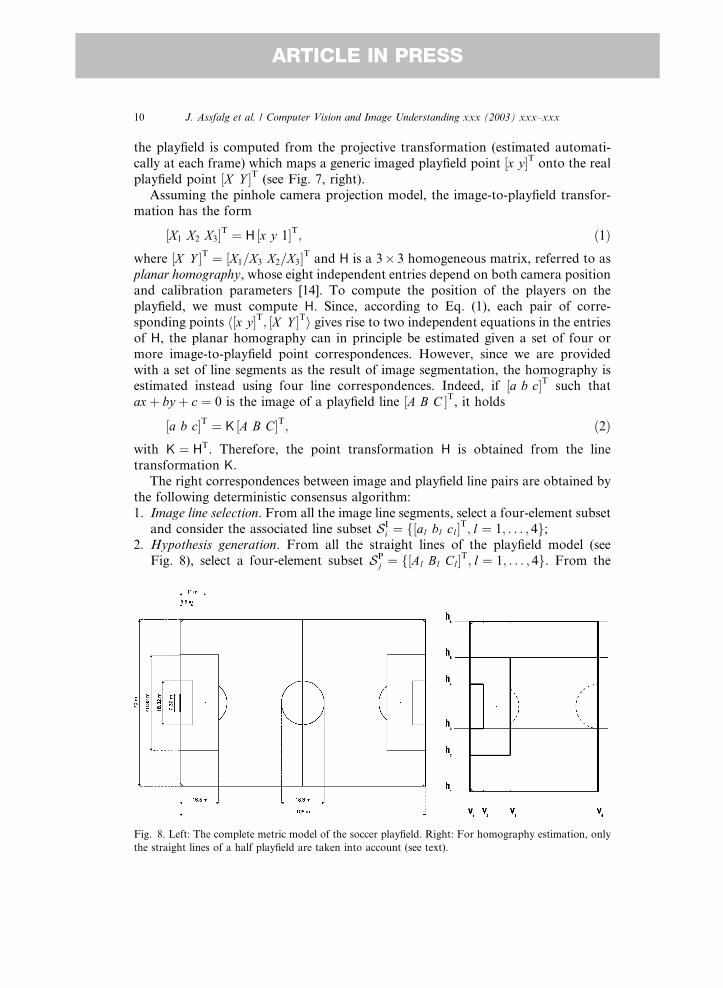
2. Hypothesis generation. From all the straight lines of the playfield model (see
Fig. 8), select a four-element subset SPj ¼ f½Al Bl Cl�T; l ¼ 1; . . . ; 4g. From the
. Left: The complete metric model of the soccer playfield. Right: For homography estimation, only
aight lines of a half playfield are taken into account (see text).
J. Assfalg et al. / Computer Vision and Image Understanding xxx (2003) xxx–xxx 11
ARTICLE IN PRESS
corresponding lines in the sets SIi and SP
j , estimate the transformation Kij satisfy-
ing Eq. (2);
3. Hypothesis validation. For all i and j, use Hij ¼ KTij in Eq. (1) to remap the end-
points fh½xka yka �T; ½xkx ykx�
Ti; k ¼ 1; . . . ; Lg of each image line segment onto the
playfield model. Then evaluate the model matching error as eij ¼P
k dijk, wheredijk measures the distance (evaluated by accumulation of line-point distances) of
each remapped line segment to the line of the playfield model closest to it. Finally,
select as a raw solution bHH the homography Hij corresponding to the minimum
model matching error;
4. Solution refinement. Use all the line correspondences with low segment-to-model
distance under remapping with bHH to obtain a refined estimate eHH via least squares.
The refinement process corresponds to a more uniform redistribution of the over-
all remapping error over the entire set of image line segments.The actual implementation of the algorithm above benefits from careful consider-
ations about model and data characteristics, aimed at reducing dramatically the
computational complexity. First of all, raw viewpoint information extracted from
playfield segmentation is used to know which half of the playfield (either the left
or the right one) is in view: this allows us to use a simplified model including only
half of the playfield lines, namely six horizontal fhm; m ¼ 1; . . . ; 6g and 4 vertical
fvn; n ¼ 1; . . . ; 4g lines (see Fig. 8, right).
Using viewpoint information and looking for dominant directions in the image linedirection histogram, we are also able to classify image lines into three groups: (a) ‘‘hor-
izontal’’ lines fmh; h ¼ 1; . . . ;Nhg, i.e., image lines with a high probability to be projec-
tions of the hm�s; (b) ‘‘vertical’’ lines fnv; v ¼ 1; . . . ;Nvg, with a high probability to be
projections of the vn�s; (c) all the remaining lines. This preliminary line grouping has a
strong impact on the computational effort during hypothesis generation, as horizontal
model lines are matched only against ‘‘horizontal’’ lines, and vertical model lines only
against ‘‘vertical’’ ones. Explicitly, given a subset SIi composed of two ‘‘horizontal’’
and two ‘‘vertical’’ image lines, the number of homography hypotheses to be generated(step 2) and verified (step 3) is Cð6; 2Þ � Cð4; 2Þ ¼ 90, where CðN ; 2Þ ¼ N ðN � 1Þ=2 is
the number of combinations without repetitions of element pairs taken from a set of
N elements. Since the number of all distinct image line subsets is CðNh; 2Þ � CðNv; 2Þ,with Nh 6 6 and Nv 6 4, the overall number of homography hypotheses is bounded
by 902. ValuesNh andNv are kept low by excluding from thematching process all short
image line segments or image line segments that are neither ‘‘horizontal’’ nor ‘‘verti-
cal.’’ These segments are likely to be due to segmentation errors (e.g., due to the pres-
ence of non-detected players) or to be part of curvilinear portions of themodel (such asthe penalty arc). Each of the playfield line subsetsSP
j ; j 2 f1; . . . ; 90g is an ordered rect-angle, i.e., a 4-tuple fhm, hm0 , vn, vn0 g, withm < m0 and n < n0. Similarly, each image line
subset SIi is an ordered quadrilateral fmh, mh0 , nv, nv0 g, h < h0 and v < v0, the right or-
dering ofmatching candidates being explicitly inferred from the relative position of the
corresponding line segments in the image. The ordering concept is crucial to eliminate
the twofold specular ambiguity arising frommatching unordered element pairs. In our
case, the ambiguity would manifest in left/right and up/down uncertainty in the clas-
sification of ‘‘vertical’’ and ‘‘horizontal’’ image lines, respectively. The deterministic
12 J. Assfalg et al. / Computer Vision and Image Understanding xxx (2003) xxx–xxx
ARTICLE IN PRESS
consensus algorithm is based on a basic assumption, i.e., that the best possible homog-
raphy corresponds to a minimum of model matching error. This assumption is not ob-
vious, since there are two distinct sources of mismatch between a remapped image
segment and amodel line: (i) a wrong homography is being tested, i.e., the image quad-
rilateral is not the projection of the playfield rectangle at hand; (ii) the image segmentdoes not correspond to any image line (e.g., it is part of the center circle). Thus, the
matching strategy implicitly assumes that thematching errors of the first type are dom-
inant, on the average, over the matching errors of the second type: this fact has been
verified experimentally with an extensive test set.
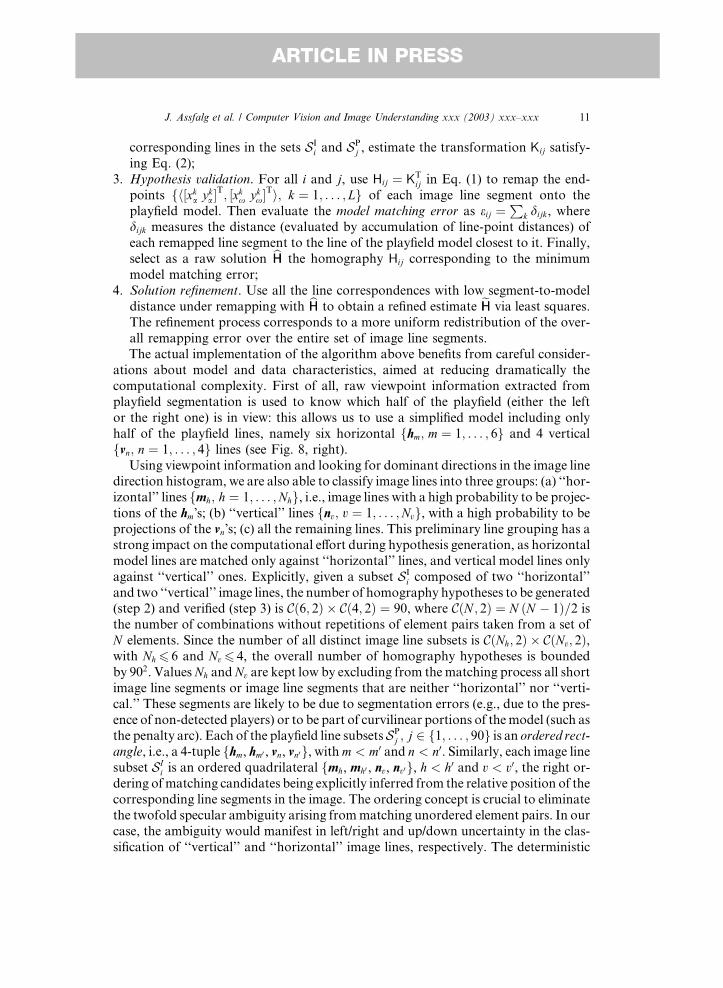
Metric localization of players is used to detect the placed kicks (corner, penalty,
free kick) nearby the goal box. Since different types of placed kicks exhibit different
players� deployments, the distribution of the players� positions in specific regions of
the goal box and its surroundings provides useful information in order to recognizethe type of placed kick. Fig. 9 shows the region of the goal box and its surroundings
Fig. 9. (a) The goal box region and its surroundings. (b) Typical normalized distributions of players
(along the x axis) for penalty (top), free kick (middle) and corner (bottom).
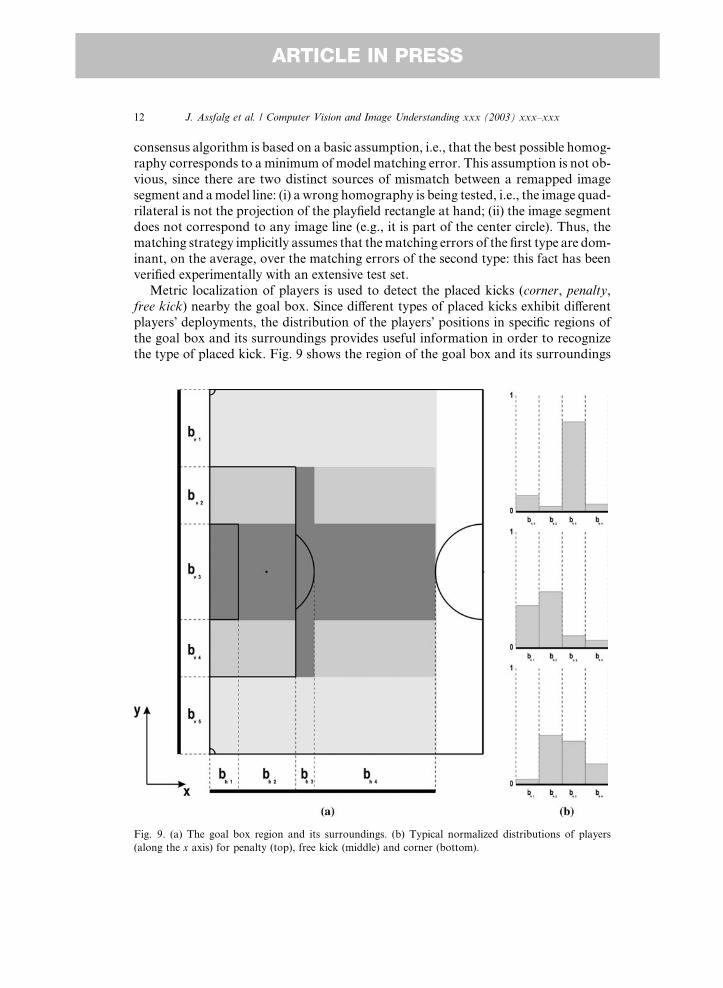
Fig. 10. Example of kickoff detection: bounding boxes of the players� clusters and midfield line.
J. Assfalg et al. / Computer Vision and Image Understanding xxx (2003) xxx–xxx 13
ARTICLE IN PRESS
(a), and typical players� position distributions for penalty, free kick and corner (b).Dark areas are the most relevant for the discrimination between the three types of
placed kicks. Models for placed kicks exploit a cue describing players� deployment.
The cue is obtained through Bayesian classifiers, whose inputs are occupation mea-
sures for each area.
Players� position is useful also for the detection of kickoffs. In fact, kickoffs are
characterized by two groups of still players, each of a different team, separated by
the midfield line. In this case, homography estimation and backprojection onto
the playfield model can be avoided, since the separation between sets of points bya straight line in the plane is invariant to perspective projection. It is therefore suf-
ficient to cluster players� blobs based on their colors, and check whether the clusters�bounding boxes are almost completely separated by the midfield line, directly in the
image (Fig. 10).
4. Model checking
For the implementation of the highlight models in the classification engine,
knowledge models are turned into operational models. Fig. 11 shows the operational
models for all the soccer highlights addressed. Cues are combined through logic and
relational operators to describe events on the edges of the graphs. Symbols used in
the state transition expressions are explained in the legend.
The operational models are used to perform model checking. The estimated mea-
sures of the required visual cues are checked against each model in parallel. To re-
duce the computational costs associated with the extraction of the image featuresof each cue, only the cues that are needed to perform state transitions at each state
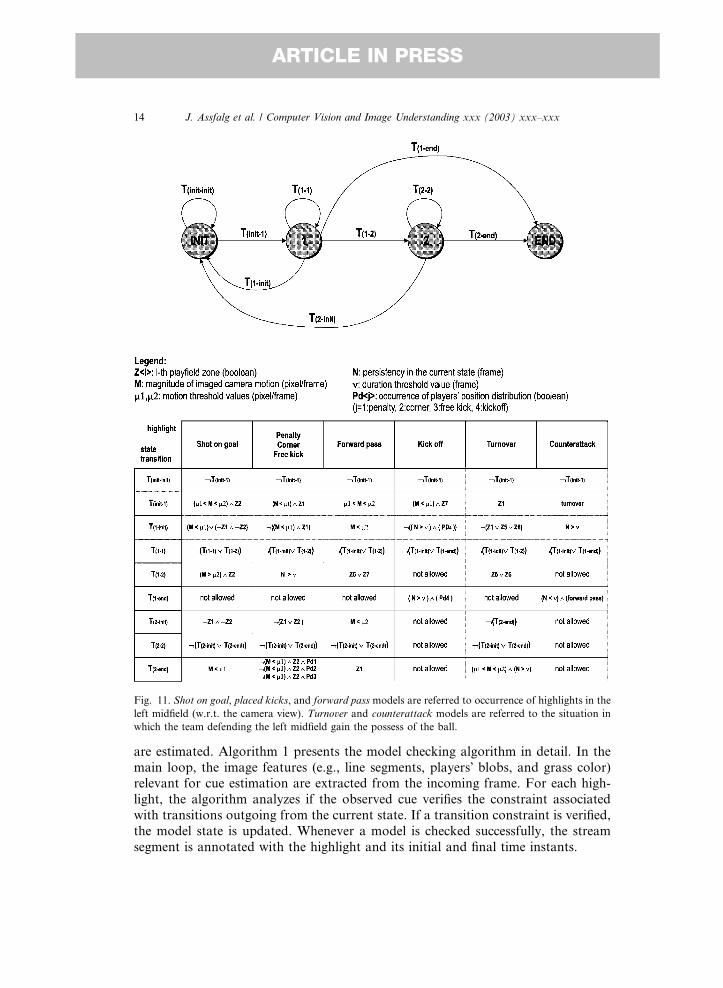
Fig. 11. Shot on goal, placed kicks, and forward pass models are referred to occurrence of highlights in the
left midfield (w.r.t. the camera view). Turnover and counterattack models are referred to the situation in
which the team defending the left midfield gain the possess of the ball.
14 J. Assfalg et al. / Computer Vision and Image Understanding xxx (2003) xxx–xxx
ARTICLE IN PRESS
are estimated. Algorithm 1 presents the model checking algorithm in detail. In the
main loop, the image features (e.g., line segments, players� blobs, and grass color)relevant for cue estimation are extracted from the incoming frame. For each high-
light, the algorithm analyzes if the observed cue verifies the constraint associated
with transitions outgoing from the current state. If a transition constraint is verified,
the model state is updated. Whenever a model is checked successfully, the stream
segment is annotated with the highlight and its initial and final time instants.
J. Assfalg et al. / Computer Vision and Image Understanding xxx (2003) xxx–xxx 15
ARTICLE IN PRESS
To reduce the computational requirements, at each frame, only the features that
are required to check the transitions of the current states of the active highlight mod-
els are extracted. A reference counter ref counter½f � tracks the number of models for
which the current state requires the extraction of feature f , and is updated at each
state transition ehi;j. Variables Fdec and Finc contain, respectively, features that areno longer needed and features that are required by the model when entering the
new state shj .
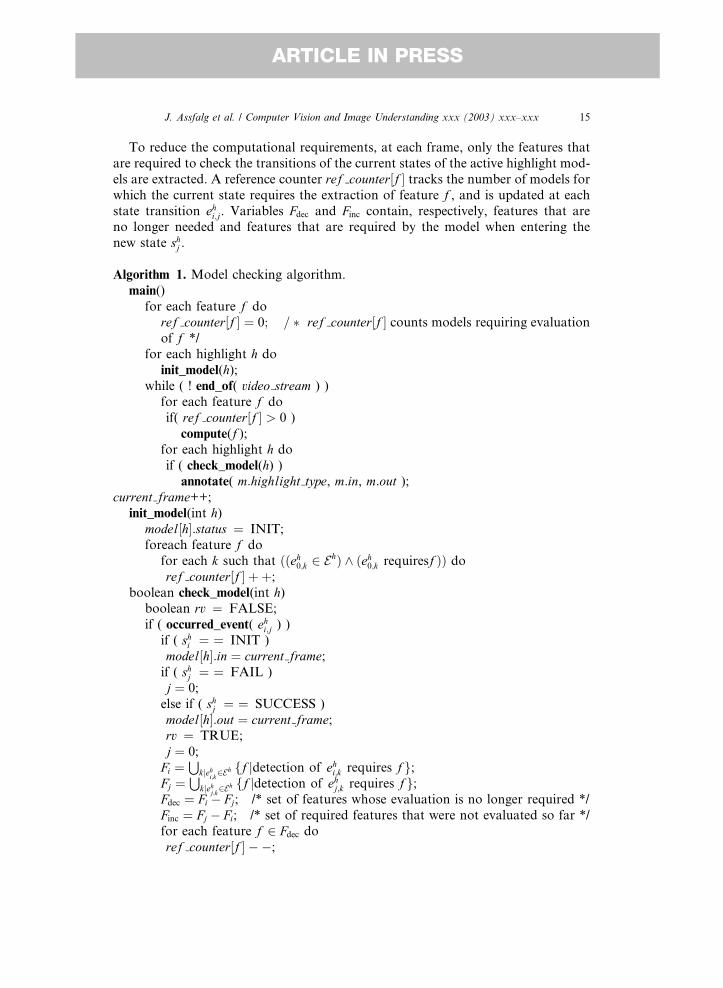
Algorithm 1. Model checking algorithm.
main()
for each feature f do
ref counter½f � ¼ 0; = � ref counter½f � counts models requiring evaluation
of f */for each highlight h do
init_model(h);while ( ! end_of( video stream ) )
for each feature f do
if( ref counter½f � > 0 )
compute(f );for each highlight h do
if ( check_model(h) )annotate( m:highlight type, m:in, m:out );
current frame++;init_model(int h)
model½h�:status ¼ INIT;
foreach feature f do
for each k such that ððeh0;k 2 EhÞ ^ ðeh0;k requiresf ÞÞ doref counter½f � þ þ;
boolean check_model(int h)boolean rv ¼ FALSE;
if ( occurred_event( ehi;j ) )if ( shi ¼ ¼ INIT )
model½h�:in ¼ current frame;if ( shj ¼ ¼ FAIL )
j ¼ 0;
else if ( shj ¼ ¼ SUCCESS )
model½h�:out ¼ current frame;rv ¼ TRUE;
j ¼ 0;
Fi ¼S
kjehi;k2Eh ff jdetection of ehi;k requires f g;
Fj ¼S
kjehj;k2Eh ff jdetection of ehj;k requires f g;
Fdec ¼ Fi � Fj; /* set of features whose evaluation is no longer required */
Finc ¼ Fj � Fi; /* set of required features that were not evaluated so far */
for each feature f 2 Fdec doref counter½f � � �;
16 J. Assfalg et al. / Computer Vision and Image Understanding xxx (2003) xxx–xxx
ARTICLE IN PRESS
for each feature f 2 Finc doref counter½f � þ þ;
model½h�.status ¼ shj ;return rv;
5. Experimental results
Solutions and algorithms presented in the previous sections effectively support
production logging, in that they allow highlight classification in quasi real-time. In
the following, we present experimental results of highlight detection and discuss
computational costs of the proposed solutions.
5.1. Highlights detection
Experiments have been carried out with videos of soccer games provided by BBC
Sports Library and recorded off-air from other broadcasters. Videos were acquired
from Digital Video (DV) tapes, recorded at full PAL resolution and 25 fps. The over-
all test set includes over 100 sequences with typical soccer highlights, of duration
from 15 s to 1.5min. The relative frequency of the different types of highlights reflects
that of a typical soccer game. Table 2 shows correct, missed, and false detection forthe principal soccer highlights. It can be noticed that, for most of the highlights, cor-
rect detection is over 90%.
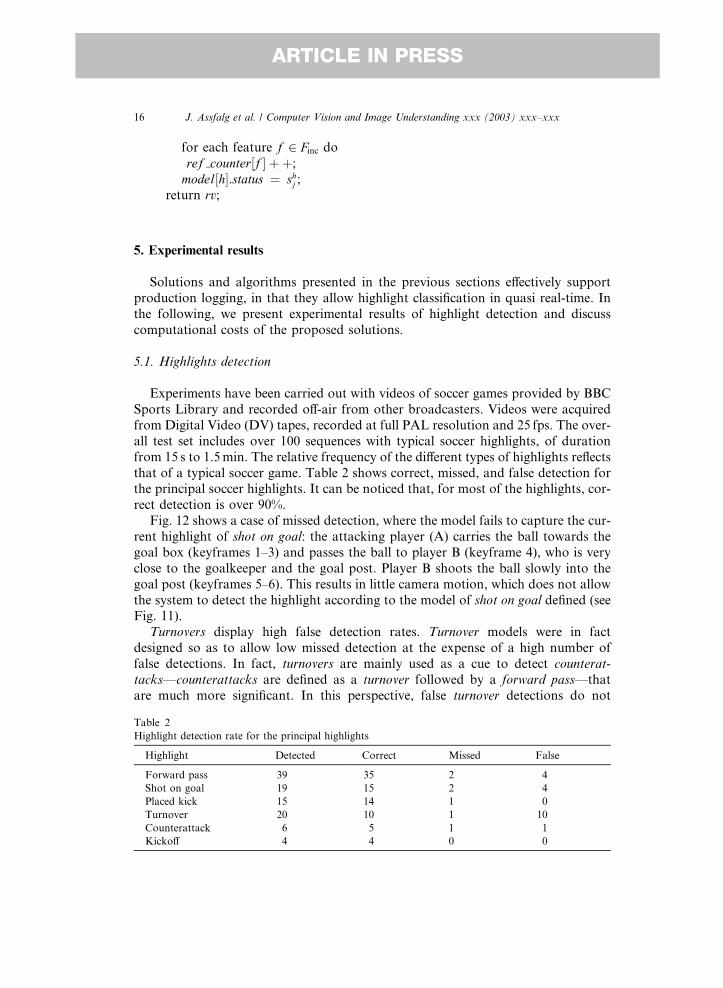
Fig. 12 shows a case of missed detection, where the model fails to capture the cur-
rent highlight of shot on goal: the attacking player (A) carries the ball towards the
goal box (keyframes 1–3) and passes the ball to player B (keyframe 4), who is very
close to the goalkeeper and the goal post. Player B shoots the ball slowly into the
goal post (keyframes 5–6). This results in little camera motion, which does not allow
the system to detect the highlight according to the model of shot on goal defined (seeFig. 11).
Turnovers display high false detection rates. Turnover models were in fact
designed so as to allow low missed detection at the expense of a high number of
false detections. In fact, turnovers are mainly used as a cue to detect counterat-tacks—counterattacks are defined as a turnover followed by a forward pass—that
are much more significant. In this perspective, false turnover detections do not
Table 2
Highlight detection rate for the principal highlights
Highlight Detected Correct Missed False
Forward pass 39 35 2 4
Shot on goal 19 15 2 4
Placed kick 15 14 1 0
Turnover 20 10 1 10
Counterattack 6 5 1 1
Kickoff 4 4 0 0
Fig. 12. Case of missed detection of a shot on goal (keyframes).
J. Assfalg et al. / Computer Vision and Image Understanding xxx (2003) xxx–xxx 17
ARTICLE IN PRESS
represent a serious problem, as they can be discarded later when checking for the for-ward pass.
Table 3 reports results for a second experiment focussing on identification of dif-
ferent types of placed kicks. The test set included video sequences with 60 placed
kicks, 20 for each one of the three classes (penalty, corner, free kick). It can be no-
ticed that correct detection is in all cases over 95%. This high detection rate is mainly
due to the good precision attained in the evaluation of the players� position using the
planar homography.Fig. 13 shows a video sequence and the on-line detection of its principal highlights
(shot on goal, placed kick, forward pass, and turnover). A dot inside a circular button
indicates that a highlight is hypothesized; if the hypothesis is confirmed, i.e., the
highlight is detected, ap
mark is displayed inside the button. Conversely, if the hy-
pothesis is rejected, an � mark is displayed.
5.2. Computational costs: case study
According to the model-driven strategy described in Section 4 for model checking,
at each frame, for a given highlight, only the cues that are required to trigger any
transition from the current state are actually estimated. Therefore, for a given high-
light h, the corresponding computational cost per frame is
Table 3
Highlight detection rate for placed kicks
Detected Correct Missed False
Penalty 18 17 0 1
Corner 19 18 1 1
Free kick 18 17 1 1
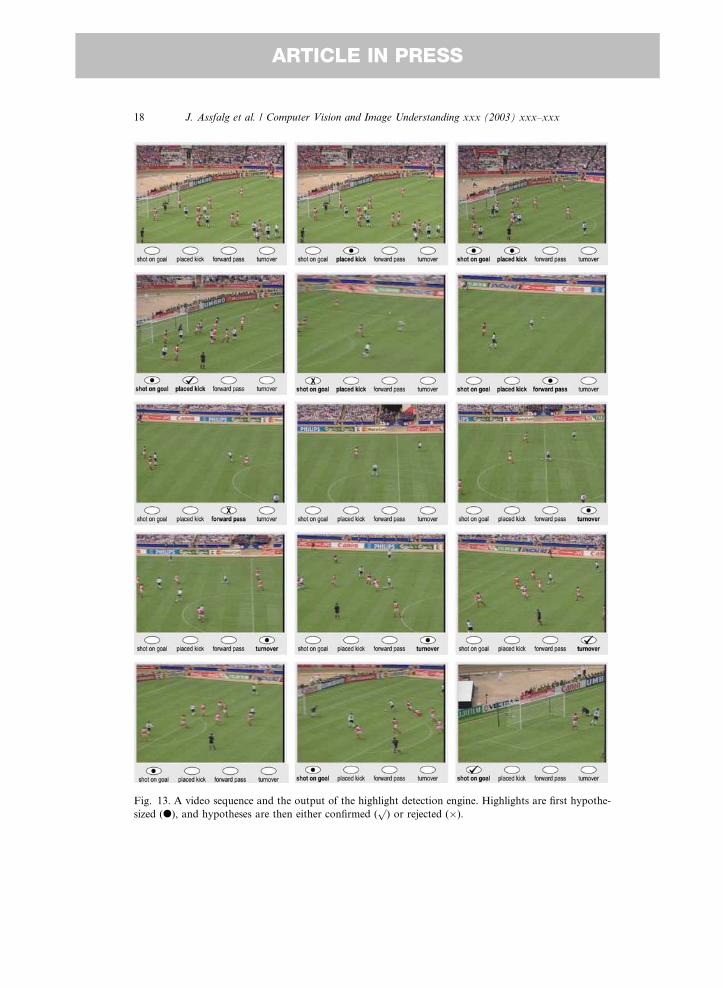
Fig. 13. A video sequence and the output of the highlight detection engine. Highlights are first hypothe-
sized (d), and hypotheses are then either confirmed (p) or rejected (�).
18 J. Assfalg et al. / Computer Vision and Image Understanding xxx (2003) xxx–xxx
ARTICLE IN PRESS
Table 4
Required cues, computational costs and estimated state probabilities for each state of the placed kickmod-
el
State Required cues CðsÞ P ðsÞ
0 Playfield zone, ball motion 2c 0.783
1 Playfield zone, ball motion 2c 0.150
2 Playfield zone, ball motion, players� positions 3c 0.065
3 — 0 0.002
J. Assfalg et al. / Computer Vision and Image Understanding xxx (2003) xxx–xxx 19
ARTICLE IN PRESS
Ch ¼XShs¼1
CðsÞ � PðsÞ; ð3Þ
where Sh is the total number of states for the highlight model, CðsÞ is the compu-tational cost for the estimation of all cues required at state s, and P ðsÞ is the prob-
ability of state s. It follows that the computational cost for a sequence of N frames is
N � Ch. Model-driven cue evaluation has a significant computational advantage over
a brute-force approach where all cues are estimated at each frame regardless of their
actual relevance for the current state. In fact, the computational cost of brute-force
model checking is in any case equal to maxs CðsÞ.Table 4 shows the cues required, the computational costs and the probabilities for
each state of a placed kick highlight. It is assumed that all cues have the same com-putational cost c. As shown in Fig. 11, the model of a placed kick requires the esti-
mation of two cues at states 0 (INIT) and 1, three cues at state 2, and 0 cues at state 3
(END). State probabilities have been inferred experimentally from the test set by
evaluating the relative frequencies of model states during the model checking phase.
According to Eq. (3), the overall cost per frame for the placed kick using the model-
driven strategy is therefore equal to 2c� 0:783þ 2c� 0:150þ 3c� 0:065 ¼ 2:061c.The corresponding cost for the brute-force strategy is 3c, with a performance degra-
dation of about 30%. The computational gain obtained with the proposed model-dri-ven strategy proves useful for both production and posterity logging, in that it yields
a smaller annotation delay and therefore allows video footage to be available for re-
use within short time. Our prototype runs on a single processor PC (P4 2Ghz,
512Mb ram, SCSI disks). Evaluation of the computational cost c in terms of process-
ing time per frame, yields an average of about 0.06 s/frame. For a video sequence of a
placed kick of 5 s, the required processing time is therefore about 15.5 s. This reflects
the average performance of the system, for which the processing rate is about 1/3 the
real time frame rate (i.e., 3 s of processing for each second of video). The systemmeets the ‘‘as live’’ requirement for annotation mentioned in Section 1.
6. Conclusions
In this paper, we have presented a novel approach for automatic semantic anno-
tation of soccer video. The annotation engine detects the principal highlights of soc-
cer by checking a limited number of observed visual cues against highlight models,
20 J. Assfalg et al. / Computer Vision and Image Understanding xxx (2003) xxx–xxx
ARTICLE IN PRESS
that are defined as finite state machines. The solution proposed is suitable for both
production logging and posterity logging. In both cases, objective annotations pro-
vided by the system can be complemented by subjective remarks (e.g., a ‘‘nice goal’’)
provided by humans.
Results that have been presented show that all the principal highlights of soccerare detected with great accuracy. With respect to previous work on soccer highlights
detection, the improvements provided by this solution are both in the number of sig-
nificant highlights detected by the system, and in the higher accuracy achieved.
Moreover, the use of FSM models instead of learning-based approaches has the ad-
vantage of avoiding erroneous classifications due to incomplete training sets. In that
we use FSM models to describe highlights and visual cues combinations to define
transitions from one state to the other of the FSMs the approach can be in principle
extended to other domains, provided that visual cues specific of these domains areappropriately selected so as to reflect meaningful changes of phases in the play.
With edited streams, as usually available for posterity logging, highlight models
can be enhanced by including new cues—like voice comments, crowd cheering, re-
play and text captions—with the goal of enriching the annotation and improving
the accuracy of model checking. Research on the semantic annotation of edited soc-
cer streams for posterity logging is presently under development.
Acknowledgments
Part of this research was developed in the framework of the ASSAVID project
funded by the European Commission under grant IST-1999-13082 (http://vip-
lab.dsi.unifi.it/ASSAVID). The project aimed at the development of tools
for the automatic segmentation and semantic annotation of sports video, exploiting
visual, audio and speech cues. Partners of the project are SONY BPE (UK), ACS
SpA (I), BBC R&D (UK), Institut Dalle Molle d�Intelligence Artificielle Perceptive(CH), University of Surrey (UK), and University of Florence.
References
[1] P. Aigrain, P. Joly, The automatic real-time analysis of film editing and transition effects and its
applications, Comput. Graph. 18 (1) (1994) 93–103.
[2] J. Assfalg, M. Bertini, A. Del Bimbo, W. Nunziati, P. Pala, Soccer highlights detection and
recognition using HMMs, in: Proc. Internat. Conf. on Multimedia and Expo (ICME2002) 2002, pp.
825-828.
[3] J. Assfalg, M. Bertini, C. Colombo, A. Del Bimbo, Semantic annotation of sports videos, IEEE
Multimedia 9 (2) (2002) 52–60.
[4] G. Baldi, C. Colombo, A. Del Bimbo, A compact and retrieval-oriented video representation using
mosaics, in: Proc. 3rd Internat. Conf. on Visual Information Systems VISual99, Springer Lecture
Notes on Computer Science, Amsterdam, The Netherlands, June 1999, pp. 171–178.
[5] M. Bertini, A. Del Bimbo, P. Pala, Content-based indexing and retrieval of TV news, Pattern
Recognition Lett. 22 (5) (2001) 503–516.
[6] D. Chen, K. Shearer, H. Bourlard, Video OCR for Sport Video Annotation and Retrieval, in: Proc.
8th IEEE Internat. Conf. on Mechatronics and Machine Vision in Practice, 2001.

J. Assfalg et al. / Computer Vision and Image Understanding xxx (2003) xxx–xxx 21
ARTICLE IN PRESS
[7] F. Cheng, W.J. Christmas, J, Kittler, Detection and description of Human Running Behaviour in
Sports Video Multimedia Database, in: Proc. ICIAP, 2001.
[8] S. Choi, Y. Seo, H. Kim, K.-S. Hong, Where are the ball and players?: Soccer Game Analysis with
Color-based Tracking and Image Mosaick, in: Proc. Internat. Conf. Image Analysis and Processing
(ICIAP�97), Springer Lecture Notes on Computer Science, 1997.
[9] C. Colombo, A. Del Bimbo, P. Pala, Semantics in visual information retrieval, IEEE MultiMedia 6
(3) (1999) 38–53.
[10] N. Dimitrova, T. McGee, H. Elenbaas, J. Martino, Video content management in consumer devices,
IEEE Trans. Knowledge Data Eng. 10 (6) (2001) 995–998.
[11] A. Ekin, A. Murat Tekalp, R. Mehrotra, Automatic Soccer Video Analysis and Summarization,
IEEE Trans. Image Process. 12 (7) (2003) 796–807.
[12] U. Gargi, R. Kasturi, S.H. Strayer, Performance characterization of video-shot-change detection
methods, IEEE Trans. Circuits Syst. Video Technol. 10 (1) (2000).
[13] Y. Gong, L.T. Sin, C.H. Chuan, H. Zhang, M. Sakauchi, Automatic Parsing of TV Soccer Programs,
in: Proc. Internat. Conf. on Multimedia Computing and Systems (ICMCS�95), Washington, DC, May
15–18, 1995.
[14] R. Hartley, A. Zisserman, Multiple View Geometry in Computer Vision, Cambridge University Press,
Cambridge, 2000.
[15] S.S. Intille, A.F. Bobick, Recognizing planned, multi-person action, Comput. Vis. Image Understand.
(1077–3142) 81 (3) (2001) 414–445.
[16] M. Irani, P. Anandan, J. Bergen, R. Kumar, S. Hsu, Mosaic Representations of video sequences and
their applications, Signal Process.: Image Commun. 8 (4) (1996) (special issue on Image and Video
Semantics: Processing, Analysis, and Application).
[17] J. Kittler, K. Messer, W.J. Christmas, B. Levienaise-Obadia, D. Koubaroulis, Generation of semantic
cues for sports video annotation, in: Proc. ICIP 2001.
[18] R. Leonardi, P. Migliorati, Semantic indexing of multimedia documents, IEEE MultiMedia 9 (2)
(2002) 44–51.
[19] R. Lienhart, Indexing and retrieval of digital video sequences based on automatic text recognition, in:
Proc. 4th ACM Internat. Multimedia Conf., 1996.
[20] R.C. Nelson, Finding line segments by stick growing, IEEE Trans. PAMI 16 (5) (1994) 519–523.
[21] S. Nepal, U. Srinivasan, G. Reynolds, Automatic detection of �Goal� segments in basketball videos,
Proc. ACM Multimedia (2001) 261–269.
[22] G. Sudhir, J.C.M. Lee, A.K. Jain, Automatic classification of Tennis video for high-level content-
based retrieval, in: Proc. Internat. Workshop on Content-Based Access of Image and Video
Databases CAIVD�98, 1998, pp. 81–90.[23] V. Tovinkere, R.J. Qian, Detecting semantic events in Soccer Games: towards a complete solution, in:
Proc. Internat. Conf. on Multimedia and Expo ICME 2001, pp. 1040–1043.
[24] A. Woudstra, D.D. Velthausz, H.J.G. de Poot, F. Moelaert El-Hadidy, W. Jonker, M.A.W.
Houtsma, R.G. Heller, J.N.H. Heemskerk, Modeling and retrieving Audiovisual Information—A
Soccer Video Retrieval System, in: Proc. 4th Internat. Workshop on Multimedia Information Systems
(MIS�98), Springer Lecture Notes on Computer Science, vol. 1508, Istanbul, Turkey, September 1998,
pp. 161–173.
[25] M.M. Yeung, B.L. Yeo, Time-constrained clustering for segmentation of Video into Story Units, in:
Proc. Internat. Conf. on Pattern Recognition ICPR�96, 1996, pp. 375–380.[26] D. Yow, B.-L. Yeo, M.Yeung, B. Liu, Analysis and presentation of Soccer highlights from digital
video, in: Proc. 2nd Asian Conf. on Computer Vision (ACCV�95), 1995.[27] W. Zhou, A. Vellaikal, and C.C.J. Kuo, Rule-based video classification system for basketball video
indexing, in: Proc. ACM Multimedia 2000 Workshop, 2000, pp. 213–216.
[28] H.J. Zhang, A. Kankanhalli, S.W. Smoliar, Automatic partitioning of video, Multimedia Syst. 1 (1)
(1993) 10–28.
Related Documents