Seizure prediction with spectral power of EEG using cost-sensitive support vector machines *Yun Park, *Lan Luo, *Keshab K. Parhi, and yTheoden Netoff Departments of *Electrical Engineering and yBiomedical Engineering, University of Minnesota, Minneapolis, Minnesota, U.S.A. SUMMARY Purpose: We propose a patient-specific algorithm for sei- zure prediction using multiple features of spectral power from electroencephalogram (EEG) and support vector machine (SVM) classification. Methods: The proposed patient-specific algorithm con- sists of preprocessing, feature extraction, SVM classifica- tion, and postprocessing. Preprocessing removes artifacts of intracranial EEG recordings and they are further pre- processed in bipolar and/or time-differential methods. Features of spectral power of raw, or bipolar and/or time- differential intracranial EEG (iEEG) recordings in nine bands are extracted from a sliding 20-s–long and half- overlapped window. Nine bands are selected based on standard EEG frequency bands, but the wide gamma bands are split into four. Cost-sensitive SVMs are used for classification of preictal and interictal samples, and double cross- validation is used to achieve in-sample optimization and out-of-sample testing. We postprocess SVM classification outputs using the Kalman Filter and it removes sporadic and isolated false alarms. The algorithm has been tested on iEEG of 18 patients of 20 available in the Freiburg EEG database who had three or more seizure events. To inves- tigate the discriminability of the features between preictal and interictal, we use the Kernel Fisher Discriminant anal- ysis. Key findings: The proposed patient-specific algorithm for seizure prediction has achieved high sensitivity of 97.5% with total 80 seizure events and a low false alarm rate of 0.27 per hour and total false prediction times of 13.0% over a total of 433.2 interictal hours by bipolar prepro- cessing (92.5% sensitivity, a false positive rate of 0.20 per hour, and false prediction times of 9.5% by time- differential preprocessing). This high prediction rate demonstrates that seizures can be predicted by the patient-specific approach using linear features of spectral power and nonlinear classifiers. Bipolar and/or time- differential preprocessing significantly improves sensitiv- ity and specificity. Spectral powers in high gamma bands are the most discriminating features between preictal and interictal. Significance: High sensitivity and specificity are achieved by nonlinear classification of linear features of spectral power. Power changes in certain frequency bands already demonstrated their possibilities for seizure prediction indicators, but we have demonstrated that combining those spectral power features and classifying them in a multivariate approach led to much higher prediction rates. Employing only linear features is advantageous, especially when it comes to an implantable device, because they can be computed rapidly with low power consumption. KEY WORDS: Epilepsy, Seizure, Prediction, Detection, Electroencephalogram. Recently, there has been great progress in seizure sup- pression methods. Deep brain stimulation therapy has been demonstrated to abate seizures in clinical trials (Fisher et al., 2010). More experimental approaches have been used to suppress seizures by optically uncaging inhibitory neuro- transmitters (Yang et al., 2009) or by focal cooling of the cortex (Rothman et al., 2005). The efficacy of these meth- ods may be improved by a closed-loop therapy, where a seizure prediction device monitors and triggers the seizure abatement. However, no seizure prediction algorithm has yet been developed that has sufficient sensitivity and speci- ficity and can be implemented in an implantable device (Mormann et al., 2007). Seizure prediction using electroencephalogram (EEG) with high sensitivity and specificity has been elusive, despite numerous claims that a proposed algorithm or mea- sure has provided significant predictive power. For exam- ple, nonlinear measures taken from chaos theory and applied to intracranial EEG (iEEG) demonstrated promising predictive power (Martinerie et al., 1998). However, when compared to linear features, the nonlinear features were not significantly better (Mormann et al., 2005) and their Accepted April 26, 2011; Early View publication June 21, 2011. Address correspondence to Theoden Netoff, Ph. D, University of Minne- sota Biomedical Engineering, 6-122 NHH, 312 Church St SE, Minneapolis, MN 55455, U.S.A. E-mail: [email protected] Wiley Periodicals, Inc. ª 2011 International League Against Epilepsy Epilepsia, 52(10):1761–1770, 2011 doi: 10.1111/j.1528-1167.2011.03138.x FULL-LENGTH ORIGINAL RESEARCH 1761

Welcome message from author
This document is posted to help you gain knowledge. Please leave a comment to let me know what you think about it! Share it to your friends and learn new things together.
Transcript
Seizure prediction with spectral power of EEG using
cost-sensitive support vector machines*Yun Park, *Lan Luo, *Keshab K. Parhi, and yTheoden Netoff
Departments of *Electrical Engineering and yBiomedical Engineering, University of Minnesota, Minneapolis, Minnesota, U.S.A.
SUMMARY
Purpose: We propose a patient-specific algorithm for sei-
zure prediction using multiple features of spectral power
from electroencephalogram (EEG) and support vector
machine (SVM) classification.
Methods: The proposed patient-specific algorithm con-
sists of preprocessing, feature extraction, SVM classifica-
tion, and postprocessing. Preprocessing removes artifacts
of intracranial EEG recordings and they are further pre-
processed in bipolar and/or time-differential methods.
Features of spectral power of raw, or bipolar and/or time-
differential intracranial EEG (iEEG) recordings in nine
bands are extracted from a sliding 20-s–long and half-
overlapped window. Nine bands are selected based on
standard EEG frequency bands, but the wide gamma
bands are split into four. Cost-sensitive SVMs are used for
classification of preictal and interictal samples, and double
cross-
validation is used to achieve in-sample optimization and
out-of-sample testing. We postprocess SVM classification
outputs using the Kalman Filter and it removes sporadic
and isolated false alarms. The algorithm has been tested
on iEEG of 18 patients of 20 available in the Freiburg EEG
database who had three or more seizure events. To inves-
tigate the discriminability of the features between preictal
and interictal, we use the Kernel Fisher Discriminant anal-
ysis.
Key findings: The proposed patient-specific algorithm for
seizure prediction has achieved high sensitivity of 97.5%
with total 80 seizure events and a low false alarm rate of
0.27 per hour and total false prediction times of 13.0%
over a total of 433.2 interictal hours by bipolar prepro-
cessing (92.5% sensitivity, a false positive rate of 0.20
per hour, and false prediction times of 9.5% by time-
differential preprocessing). This high prediction rate
demonstrates that seizures can be predicted by the
patient-specific approach using linear features of spectral
power and nonlinear classifiers. Bipolar and/or time-
differential preprocessing significantly improves sensitiv-
ity and specificity. Spectral powers in high gamma bands
are the most discriminating features between preictal
and interictal.
Significance: High sensitivity and specificity are achieved
by nonlinear classification of linear features of spectral
power. Power changes in certain frequency bands already
demonstrated their possibilities for seizure prediction
indicators, but we have demonstrated that combining
those spectral power features and classifying them in a
multivariate approach led to much higher prediction
rates. Employing only linear features is advantageous,
especially when it comes to an implantable device,
because they can be computed rapidly with low power
consumption.
KEY WORDS: Epilepsy, Seizure, Prediction, Detection,
Electroencephalogram.
Recently, there has been great progress in seizure sup-pression methods. Deep brain stimulation therapy has beendemonstrated to abate seizures in clinical trials (Fisheret al., 2010). More experimental approaches have been usedto suppress seizures by optically uncaging inhibitory neuro-transmitters (Yang et al., 2009) or by focal cooling of thecortex (Rothman et al., 2005). The efficacy of these meth-ods may be improved by a closed-loop therapy, where a
seizure prediction device monitors and triggers the seizureabatement. However, no seizure prediction algorithm hasyet been developed that has sufficient sensitivity and speci-ficity and can be implemented in an implantable device(Mormann et al., 2007).
Seizure prediction using electroencephalogram (EEG)with high sensitivity and specificity has been elusive,despite numerous claims that a proposed algorithm or mea-sure has provided significant predictive power. For exam-ple, nonlinear measures taken from chaos theory andapplied to intracranial EEG (iEEG) demonstrated promisingpredictive power (Martinerie et al., 1998). However, whencompared to linear features, the nonlinear features werenot significantly better (Mormann et al., 2005) and their
Accepted April 26, 2011; Early View publication June 21, 2011.Address correspondence to Theoden Netoff, Ph. D, University of Minne-
sota Biomedical Engineering, 6-122 NHH, 312 Church St SE, Minneapolis,MN 55455, U.S.A. E-mail: [email protected]
Wiley Periodicals, Inc.ª 2011 International League Against Epilepsy
Epilepsia, 52(10):1761–1770, 2011doi: 10.1111/j.1528-1167.2011.03138.x
FULL-LENGTH ORIGINAL RESEARCH
1761

computational intensiveness made them prohibitive to becalculated in real-time. Furthermore, promising nonlinearfeatures were not predictive at all when tested on long timeseries (Harrison et al., 2005).
Seizure prediction based on EEG/iEEG is complicated bytwo factors. The first is that preictal and interictal EEG/iEEG patterns across patients vary substantially. There maybe no single generic algorithm that can be applied to allpatients and can achieve high sensitivity and specificity(Osorio et al., 1998; Shoeb et al., 2009). The second is thatEEG/iEEG is highly complex and varies over time, and nosingle measure of EEG/iEEG has yet been predictive on itsown (Mormann et al., 2005, 2007; Feldwisch-Drentrupet al., 2010). Therefore, we hypothesize that a patient-spe-cific classification method based on multiple featuresextracted from EEG/iEEG will achieve high sensitivity andspecificity.
Our patient-specific approach to seizure prediction isbased on binary classification of iEEG using a machinelearning algorithm. A machine learning algorithm classifiessamples of iEEG as either preictal (immediately prior to a
seizure) or interictal (between seizures) based on theirmultivariate features (see Fig. 1). When an epoch of iEEG isclassified as preictal, the device can trigger an alarm or a sei-zure prevention device. In our study, the algorithm is trainedby providing it with iEEG labeled by a clinician as preictaland interictal, and tested in iEEG data that have not beentouched in training. We hypothesize that machine learningapproaches will work well for seizure prediction in patientswho have stereotypical recurrent seizures.
Of the available classifiers we have chosen support vectormachines (SVMs) (Vapnik, 2000; Cherkassky & Mulier,2007). The SVM is a margin-based classifier that mapsinput data onto a high-dimensional space and classifiesthem with a linear approximation (see Fig. S1). The SVM isconsidered the most powerful and favorable classifier in thestatistical learning community (Alpaydin, 2004; Bishop,2006; Cherkassky & Mulier, 2007). We use a cost-sensitiveSVM (CSVM) that has an option of different misclassifica-tion costs for different groups, because preictal data arescarcer than the interictal data and more important toidentify.
In many previous studies the optimization of the classifieris done with the ‘‘test set,’’ which may result in an unin-tended influence of the test data on the classifier thus highersensitivity and specificity than those that may actually beexperienced in real-world conditions (Mormann et al.,2007). To provide more actual estimates of sensitivity andspecificity, the test data must not influence the training ofthe algorithm. Therefore, we employ a double cross-valida-tion method, where data are divided into a training set and atest set, and the training set is further subdivided into a learn-ing set and a validation set (Friedman, 1994; Cherkassky &Mulier, 2007). The SVM-classification model is trained onlearning and validation datasets and tested on a dataset thatis not touched in training. Because the test dataset is leftcompletely out of training, the results with this experimentaldesign can more accurately reflect the expected predictionrate in real-world conditions.
Our ultimate goal is to develop algorithms and archi-tectures for an implantable device that can reliably provideseizure prediction with sufficient time to trigger anantiepileptic therapy. The specific task in this study is toinvestigate the feasibility of a patient-specific classificationapproach with the CSVM to distinguish between preictaland interictal iEEG using only linear features. Linear fea-tures are advantageous for an implantable device, where sei-zure prediction must be done in real time with constraints ofpower consumption. The algorithm has been tested on datafrom the Freiburg EEG database, which has been madeavailable for comparing the results of different algorithmson the same datasets. Sensitivity and false positive rates arereported for 18 patients selected from the database. Patientswho had fewer than three seizures (the minimum necessaryfor double cross-validation) or had no available interictalrecordings were excluded from this study.
Figure 1.
Electrode positions and iEEG recorded on them with a seizure
event. (A) Three electrodes placed near focal (red, close to the
seizure origination) and the other three near afocal (blue, away
from focal areas). The figures are provided along with Patient
17’s iEEG in the Freiburg database. (B) iEEG with a seizure
event. Ictal (seizure, indicated by solid red box) is immediately
preceded by a window we define as ‘‘preictal’’ (indicated by
dashed blue box). Windows at least an hour prior to or after a
seizure are defined as ‘‘interictal’’ (indicated by dotted green
box) and are assumed to represent ordinary iEEG activity.
Epilepsia ILAE
1762
Y. Park et al.
Epilepsia, 52(10):1761–1770, 2011doi: 10.1111/j.1528-1167.2011.03138.x

Methods
The proposed algorithm consists of preprocessing,feature extraction, SVM classification using double cross-validation, and postprocessing (see Fig. 2). Each compo-nent of the proposed algorithm is discussed in detail in itscorresponding subsection below.
Patient databaseWe have trained and tested our algorithm on the Freiburg
EEG database (https://epilepsy.uni-freiburg.de/freiburg-seizure-prediction-project/eeg-database), which is availableto any lab by request. This database contains electrocortico-gram (ECoG) or iEEG from 21 patients with medicallyintractable focal epilepsy. We have chosen 18 of the avail-able datasets of 20 patients, who have three or more seizures(the minimum number for double cross-validation). Each20-s–long window of iEEG has been categorized as ictal(containing a seizure), interictal (at least 1 h preceding orpostceding a seizure), preictal (in 30 min preceding a sei-zure onset), or artifact. Half an hour of iEEG recordings pre-ceding preictal and an hour of those postceding seizureoffset are excluded in training. The Freiburg database con-tains six of iEEG recordings from grid, strip, or depth-elec-trodes, three near the seizure focus (focal) and the otherthree distal to the focus (afocal). Seizure onset times andartifacts were identified by certified epileptologists. Thedata were collected at 256 Hz (Patient 12’s interictalat 512 Hz) sampling rate with 16 bit analog-to-digitalconverters.
Preprocessing: removing artifacts of iEEG recordingsiEEG data are subject to artifacts, such as line noise,
electrical noise, and movement artifacts. Many of theseartifacts may distort original iEEG and affect the furtherprocess of training and testing. Therefore, iEEG record-ings with artifacts are removed from further analysis. Arti-facts in the Freiburg iEEG recordings were marked byepileptologists, and the information about the artifacts is
provided along with the datasets. We have removed win-dows containing those artifacts, and the proportion of theremoved artifact windows to the overall recordings is neg-ligible (approximately 10 min in aggregate). Power linehums at 50 and 100 Hz have been removed by excludingspectral power in the bands of 47–53 and 97–103 Hzwhen the features are extracted.
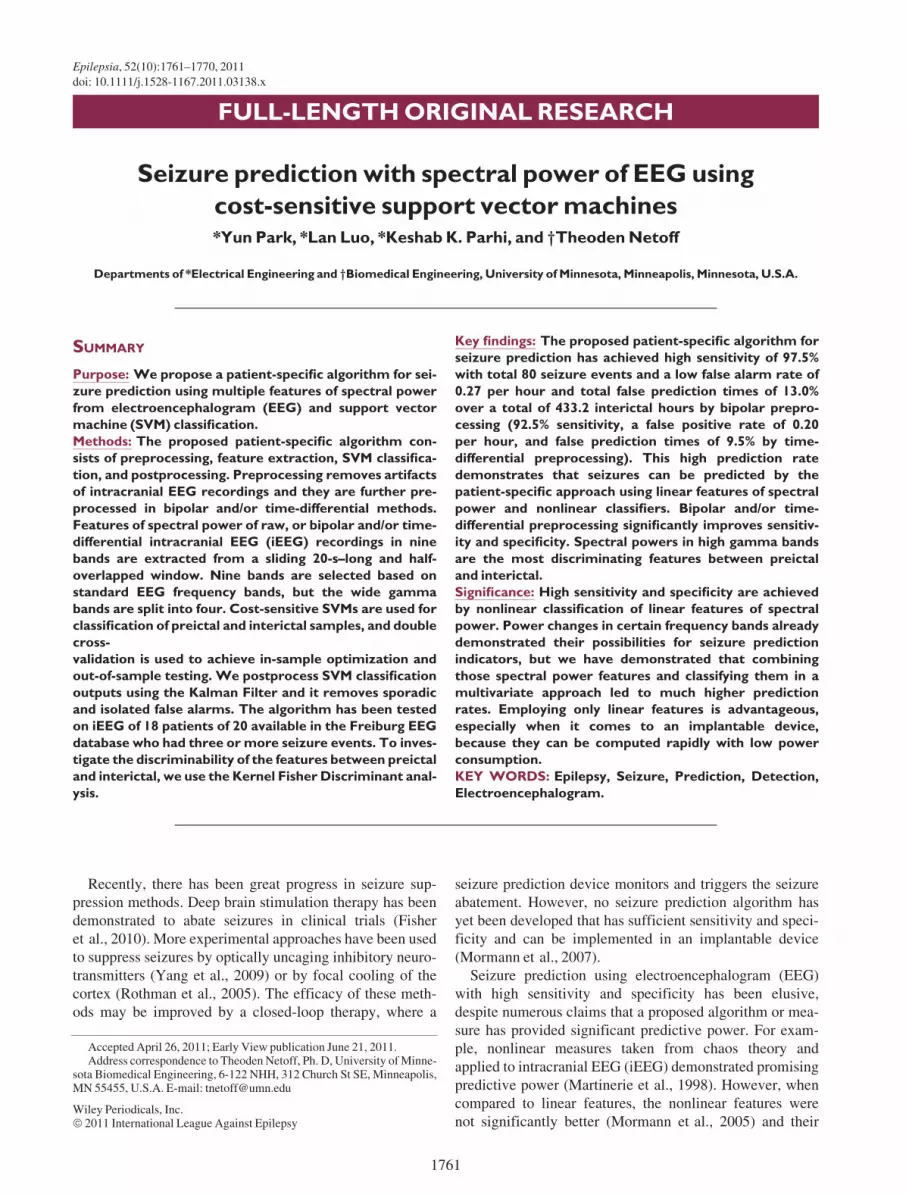
In addition, bipolar and/or time-differential methods havebeen used to remove or reduce the effect of other types ofartifacts in iEEG (see Fig. 3). The bipolar (or space-differ-ential) measurement provides common-mode rejection toreduce line noise and movement artifacts that are commonto all the electrodes. The bipolar recording method is com-monly used in the analysis of EEG and provides better spa-tial resolution than that of ordinary reference recordings(Nunez & Srinivasan, 2006). In our study, bipolar electroderecordings are made preferentially between channels withinfocal or afocal and only between the two groups if they arephysical neighbors. This results in 4–6 bipolar recordingsfor each patient.
In general, raw iEEG shows much more power in low fre-quency bands than in high frequency bands, making it diffi-cult to compare power across the bands. We normalize thepower in each band by measuring its contribution to the totalpower, but the normalized power is dominated by smallchanges in power in low frequency bands. Therefore, theproportion of high frequency power in the total power isinfluenced by low frequency power. The time-differentialmethod (an approximate derivative in signals, d½n� ¼x½n� � x½n� 1�) provides a way to reduce that undesiredeffect by flattening the spectrum, making power in the highfrequency bands similar to that in low frequency bands. Thetime-differential processing is also known as the Hjorthmobility parameter (Hjorth, 1970).
Feature extractionWe have calculated spectral power in nine bands in a
20-s–long window of iEEG and used it as a feature set in thisstudy. We adopted the moving window analysis (Mormann
Figure 2.
Outline of the proposed seizure prediction algorithm.
Epilepsia ILAE
1763
Seizure Prediction with Spectral Power of EEG
Epilepsia, 52(10):1761–1770, 2011doi: 10.1111/j.1528-1167.2011.03138.x
et al., 2007) with a half overlap and it provides a predictionof a seizure every 10 s based on the analysis of 5,120 timepoints. Spectral bands are selected based on standard iEEGfrequency bands, but the wide gamma band is split into fourbands (Netoff et al., 2009; Park et al., 2010): delta (0.5–4 Hz), theta (4–8 Hz), alpha (8–13 Hz), beta (13–30 Hz),four gamma bands (30–47, 53–75, 75–97, and 103–128 Hz,excluding power line hums), and their total. Power in eachof the above bands is divided by the total power and the lastfeature included is the total power (Litt & Echauz, 2002).iEEG data from each of the six electrodes are broken into20-s windows that half-overlap the previous one, and ninespectral features are extracted from each window. A total of54 features are extracted from every 10 s of raw or time-differential iEEG (36–48 features from bipolar or bipolar/time-differential). Because we have four ways to preprocessiEEG, we will compare seizure prediction based on each ofthe four preprocessing methods: raw, bipolar, time-differen-tial, and bipolar/time-differential.
SVM classification using double cross-validationOur classification task is to distinguish between two
groups of iEEG data features: preictal and interictal. In ouralgorithm, the binary classification is performed in twosteps: SVM classification with the 20-s window and post-
processing using the Kalman filter (postprocessing will beexplained in the next subsection in detail). The goal of SVMclassification is establishing and testing a mapping x fi ythat is from iEEG spectral features to either a preictal orinterictal label. The mapping is established using labeledtraining sets and tested to classify test sets that may haveprobability distribution similar to that of the training sets(see Data S1 for details).
Cost-sensitive SVMs (CSVMs) are used to handle theimbalance in number of preictal and interictal samples.Seizure events are relatively rare: There is approxi-mately one preictal sample for every 10 interictal sam-ples. Furthermore, we consider it more important toclassify many preictal samples correctly than to have afew false positives. CSVMs allow us to set misclassifi-cation penalties of the preictal data higher than that ofinterictal data.
We have optimized CVSMs over two model parameters:the cost C that is a trade-off between the classificationmargin and misclassified or nonseparable samples and thecost-factor R between false positives (FPs, the number ofinterictal samples classified as preictal) and false negatives(FNs, the number of preictal samples classified as interic-tal). The optimal pair of C and R is selected when theaverage rate across the fivefold cross-validation is a
Figure 3.
Preictal and interictal iEEG and their power spectral density (PSD) that are processed in a (A) raw, (B) bipolar (or space-differential),
(C) time-differential, or (D) bipolar/time-differential method. Patient 17’s recordings are used. Top and middle panels: preictal and in-
terictal iEEG time-traces that are processed in one of the four methods. Bottom panel: PSD of the signals in the top and middle panels.
Epilepsia ILAE
1764
Y. Park et al.
Epilepsia, 52(10):1761–1770, 2011doi: 10.1111/j.1528-1167.2011.03138.x
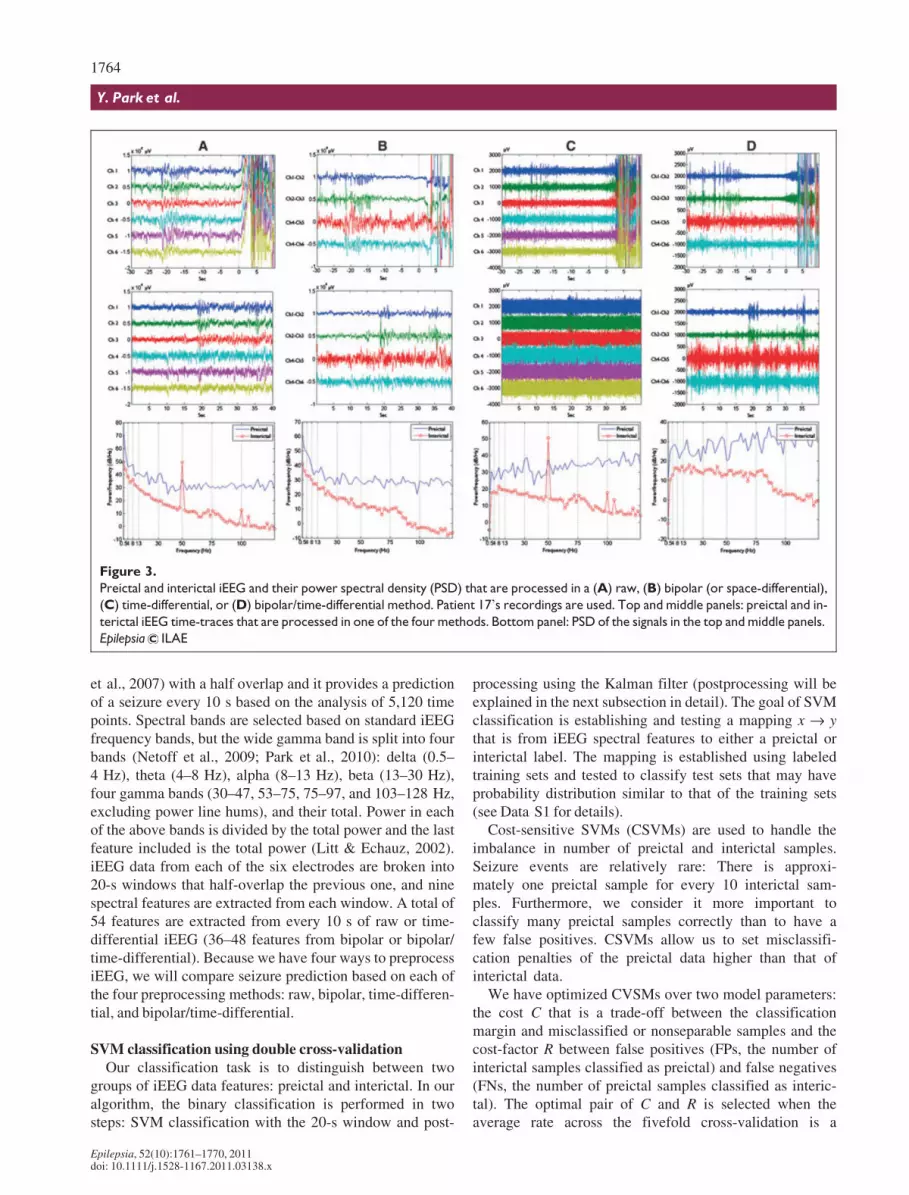
maximum (See Fig. 4). We use an Fb measurement todetermine the optimal pair in highly unbalanced datasets:
Fb ¼ ð1þb2Þ�TPð1þb2Þ�TPþb2�FNþFP (Van Rijsbergen, 1979; Li et al.,
2008), where TP is the number of true positives (the numberof preictal windows classified correctly). We have selectedb = 2 to weight the significance of FNs more than FPs. Weused the SVM-Light (Schçlkopf et al., 1999) with the radialbasis function kernel for classification.
We desire that SVM classification accuracy on the testdata represents the actual accuracy in practice. Many previ-ous studies trained and tested their prediction models on thesame datasets (Mormann et al., 2007), resulting in overlyoptimistic prediction rates; their models are not free from
the over-fitting problem. Those prediction models, whichmay be excessively fit to their datasets, may result in highsensitivity and specificity in their data, but could notachieve those high rates in real conditions. To achieve lessunbiased prediction rate, we use double cross-validation(Friedman, 1994; Cherkassky & Mulier, 2007) that ensuresin-sample optimization and out-of-sample testing.
To further illustrate how we have performed doublecross-validation, we will provide more details. If a patienthas N seizures and I-hour–long interictal recordings, weseparate the interictal datasets into N blocks (folds), each ofthem approximately containing continuous I
N
� �-hour inte-
rictal recordings and pairing with each of 30-min preictaldatasets. It is noted that interictal datasets are separated intodifferent folds when they have a break in recordings. Werandomly choose one preictal and interictal fold and reserveit for testing and use the other (N)1) folds for training:N-fold cross-validation. To establish an optimal SVM clas-sifier in training, we perform fivefold cross-validation. Werandomly select 80% in the training set (the whole trainingset consists of (N)1) folds of preictal and interictal) andestablish an SVM model in the learning stage, and validatethe model on the remaining 20% of the training set to checkif the model is well-fit (neither over-fit nor under-fit). Oncethe SVM model is trained, the prediction rate is evaluatedby testing the model on the fold that was reserved for test-ing. This process is then repeated N times and the averageprediction rate is reported.
Postprocessing: removing isolated false positivesOnce a test set is SVM classified, we have observed that
FPs and FNs tend to be sporadic and isolated in time as com-pared to TPs and TNs (true negatives, the number of interic-tal windows classified correctly) (Netoff et al., 2009;Park et al., 2010). To eliminate these isolated FPs and FNs,we postprocess the SVM classification output using theKalman filter (Simon, 2006; Chisci et al., 2010).
Figure 4.
Grid search with log2Cost and log2Ratio. This grid search
intends to find what pair of the parameters leads to the greatest
F2 averaged over all the validation sets. The dataset used in this
figure is the first training set (containing the second to fifth pre-
ictal events) in Patient 17’s bipolar iEEG. This example shows
that the greatest F2 = 0.9897 is obtained where C = 212 and
R = 22.
Epilepsia ILAE
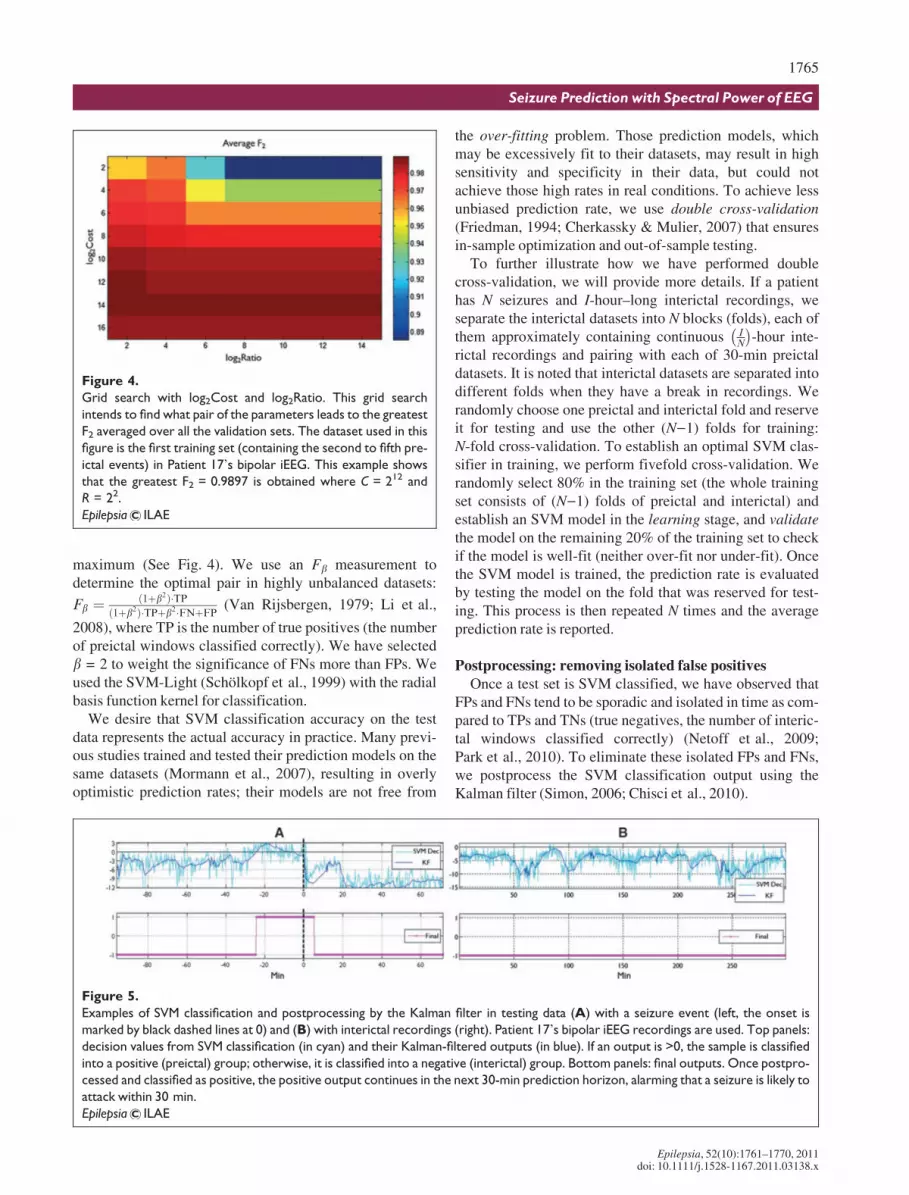
Figure 5.
Examples of SVM classification and postprocessing by the Kalman filter in testing data (A) with a seizure event (left, the onset is
marked by black dashed lines at 0) and (B) with interictal recordings (right). Patient 17’s bipolar iEEG recordings are used. Top panels:
decision values from SVM classification (in cyan) and their Kalman-filtered outputs (in blue). If an output is >0, the sample is classified
into a positive (preictal) group; otherwise, it is classified into a negative (interictal) group. Bottom panels: final outputs. Once postpro-
cessed and classified as positive, the positive output continues in the next 30-min prediction horizon, alarming that a seizure is likely to
attack within 30 min.
Epilepsia ILAE
1765
Seizure Prediction with Spectral Power of EEG
Epilepsia, 52(10):1761–1770, 2011doi: 10.1111/j.1528-1167.2011.03138.x

The Kalman filter is a statistical method that can produceestimates that tend to be close to the true values of measure-ments (Simon, 2006). We use the second-order discrete-time Kalman filter to reduce undesired fluctuations of theSVM classification outputs (see Data S2 for details andFig. 5). If the Kalman filter produces a positive, then wepredict that a seizure will occur within the next 30 min. Ifno seizure occurs within 30 min, it is considered a falsepositive. We choose 30 min as our prediction horizon,because we have defined preictal data as 30 min prior to aseizure in training.
KFD analysis: finding top predictive feature setsTo determine which iEEG spectral power features are
key to seizure prediction, we have used the Kernel FisherDiscriminant (KFD) analysis (Mika et al., 1999; Cherkas-sky & Mulier, 2007). We have measured the discrimina-bility of the spectral power features between preictal andinterictal using the F criterion (Mika et al., 1999; Cherkass-ky & Mulier, 2007). Frequency bands in this analysis werenot distinguished within focal or afocal electrodes. BecauseKFD analysis requires a balanced number of samples fromeach group, F values have been calculated on many randomselections of interictal samples and averaged. Statistical Pat-tern Recognition Toolbox for Matlab (http://cmp.felk.c-vut.cz/cmp/software/stprtool/) has been used for KFDanalysis.
Results
We have tested our patient-specific binary classificationalgorithm for seizure prediction on iEEG of 18 patients with
80 seizure events and 433.2 h of interictal recordings in theFreiburg EEG database. To evaluate the algorithm we havemeasured sensitivity, the false alarm rate per hour, and thepercentage of interictal recordings incorrectly classified asFPs. Sensitivity TP
TPþFN
� �measures the proportion of the
preictal events in a patient classified correctly by our algo-rithm. The false alarm rate per hour and the percentage ofinterictal data that is incorrectly classified as FPs demon-strate how many false alarms the proposed algorithm wouldgenerate.
Summary results for all the patients and all the four pre-processing methods are shown in Table 1. As a baseline,prediction using spectral power features calculated fromraw iEEG had total sensitivity of 93.8% (classifies 75 preic-tal events correctly of 80) and 0.29 false positives per hour(125 false alarm events in 433.2 h of interictal recordings),resulting in a false prediction alarm for a total of 59.2 hacross all patients. Bipolar preprocessing produced a highersensitivity of 97.5% (78 of 80) and also an improvement onthe false positive rate of 0.27 per hour (118 false alarmevents in 433.2 interictal hours). Time-differential prepro-cessing led to a significant improvement on the false posi-tive rate of 0.20 per hour (86 false alarm events in 433.2 h),but did not improve sensitivity (a sensitivity of 92.5%, 74 of80). Prediction based on the combined two preprocessingmethods (bipolar/time-differential) demonstrated someimprovement on the false positive rate to 0.23 per hour (100false alarm events in 433.2 interictal hours) but did notimprove sensitivity (93.8%, 75 of 80).
We have additionally tested other postprocessing strate-gies, including the 4-of-7 analysis (Netoff et al., 2009; Parket al., 2010) and 9-tap medial filtering, and the Kalman
Table 1. Results from seizure prediction analysis by the proposed algorithm
Pat.
No.
No.
of Sz
Interictal
hours
Raw Bipolar Time-differential Bipolar/time-differential
Sen% FP/h FP% p-value Sen% FP/h FP% p-value Sen% FP/h FP% p-value Sen% FP/h FP% p-value
1 4 23.9 100 0.00 0.00 0.000 100 0.08 4.16 0.000 100 0.00 0.00 0.000 100 0.00 0.00 0.000
3 5 23.9 100 0.08 2.69 0.000 100 0.00 0.00 0.000 100 0.00 0.00 0.000 100 0.00 0.00 0.000
4 5 23.9 100 0.00 0.00 0.000 100 0.04 2.08 0.000 100 0.00 0.00 0.000 100 0.00 0.00 0.000
5 5 23.9 100 1.17 58.02 0.090 100 0.79 39.02 0.018 100 0.84 40.26 0.020 100 0.67 29.62 0.006
6 3 23.8 100 0.08 4.18 0.001 100 0.04 2.09 0.000 100 0.00 0.00 0.000 100 0.00 0.00 0.000
7 3 24.5 100 0.00 0.00 0.000 100 0.04 2.03 0.000 100 0.00 0.00 0.000 100 0.04 2.03 0.000
9 5 23.9 100 0.08 4.17 0.000 100 0.34 15.58 0.001 100 0.04 2.08 0.000 100 0.25 10.74 0.000
10 5 24.4 100 0.08 4.08 0.000 100 0.20 10.19 0.000 100 0.00 0.00 0.000 100 0.25 12.08 0.000
11 4 24.0 75 0.08 4.15 0.003 75 0.17 8.30 0.009 75 0.00 0.00 0.001 75 0.04 2.08 0.002
12 4 24.7 100 0.08 4.02 0.000 100 0.04 2.01 0.000 100 0.00 0.00 0.000 100 0.00 0.00 0.000
14 4 22.6 75 0.84 39.76 0.208 100 0.22 10.99 0.001 75 0.66 31.29 0.123 50 0.44 20.29 0.222
15 4 23.7 100 0.13 6.28 0.000 100 0.38 18.85 0.004 100 0.04 2.09 0.000 100 0.17 8.38 0.001
16 5 23.9 80 0.58 25.37 0.032 100 0.42 19.99 0.002 80 0.42 18.92 0.015 100 0.38 17.89 0.001
17 5 24.0 100 0.12 6.22 0.000 100 0.00 0.00 0.000 100 0.00 0.00 0.000 100 0.04 2.07 0.000
18 5 24.8 100 0.04 2.00 0.000 100 0.16 8.02 0.000 100 0.00 0.00 0.000 100 0.04 2.00 0.000
19 4 24.3 75 1.07 51.42 0.359 75 0.90 42.89 0.243 75 1.15 55.41 0.419 75 0.90 42.62 0.240
20 5 24.8 80 0.52 24.25 0.028 100 0.68 30.36 0.007 60 0.40 19.04 0.081 80 0.85 38.22 0.102
21 5 23.9 100 0.25 10.98 0.000 100 0.38 17.34 0.001 100 0.04 2.08 0.000 100 0.08 4.17 0.000
Total 80 433.2 93.8 0.29 13.67 97.5 0.27 13.01 92.5 0.20 9.45 93.8 0.23 10.69
1766
Y. Park et al.
Epilepsia, 52(10):1761–1770, 2011doi: 10.1111/j.1528-1167.2011.03138.x

filter produced the best performance among them (4-of-7analysis resulted in 95% sensitivity and 0.41 FP/h, and 9-tapmedian filtering did in 95% sensitivity and 0.34 FP/h).
We have tested our results against the null hypothesis thatour results could be attributed to chance (Andrzejak et al.,2003, 2009; Snyder et al., 2008). We have estimated theone-sided p-values that demonstrate how superior the sensi-tivity of our algorithm is to chance (Snyder et al., 2008):
p ¼ 1�Pn�1
k¼0Nk
� �Skncð1� SncÞN�k, for n
N � Snc, where a
proposed predictor correctly identifies n of N preictal eventsand Snc is the sensitivity of the corresponding chance predic-tor. Prediction rates using bipolar preprocessing are signifi-cantly better than chance in 18 patients (Patient 19excluded) at a significance cutoff of a = 0.05 (Moore &McCabe, 2005) (See Table 1).
Two of our proposed preprocessing methods significantlyenhanced the prediction rate: Bipolar preprocessingimproved sensitivity and time-differential preprocessingreduced the false positive rate. Prediction by the bipolar pre-processing correctly predicted seizures in 16 patients of 18with 100% sensitivity using a 30-min prediction window,and furthermore it missed only two seizures total (one fromeach of Patients 11 and 19). Time-differential preprocessingproduced a significant improvement in the false positiverate. It led to a significant decrease in false alarm events to86 from 125 in 433.2 interictal hours. Furthermore, wecould perfectly predict all the preictal events generating nofalse alarms at all, by time-differential preprocessing, innine patients (a total of 218.1 interictal hours), and generat-ing only one false alarm in each of three of the other patients(in a total of 71.5 interictal hours in Patients 9, 15, and 21).
To investigate which features the SVM may be using forprediction, we have used the KFD analysis and havemeasured the discriminability (the F criterion) of raw or
time-differential features between preictal and interictal.Discriminability of the raw features had an average F crite-rion of 4.58 · 10)3 over the 13 patients for whom preictaland interictal were classified well (see Table 2). Of those 13patients, four of the patients’ top discriminating featureswere in the gamma frequency band. Discriminability of thetime-differential features was much higher (19.6 · 10)3).Remarkably, gamma frequency bands were the mostdiscriminating in eight patients, indicating that the time-differential preprocessing may reveal spectral changes moreindicative of a preictal event.
Discussion
High sensitivity of 97.5% and the low false positivetrigger rate of 0.27 per hour in bipolar iEEG in 18 patientsdemonstrate that seizures may be predicted using thepatient-specific approach of SVM classification of spectralpower features. We expect this patient-specific methodol-ogy to be more successful for some patients than others;patients with repeatable and stereotypical seizures are theeasiest to predict with this algorithm. By contrast, ourmachine learning approach may not succeed in patientswhose seizures evolve rapidly over time or in patients whoexpress several different types of seizures.
Our results may be compared directly to several otherstudies that have tested prediction algorithms using thesame Freiburg EEG database (Aschenbrenner-Scheibeet al., 2003; Winterhalder et al., 2003; Maiwald et al.,2004; Mormann et al., 2007). We demonstrate high sensi-tivity and specificity for this database yet reported. Further-more, we have used in-sample optimization and assessedthe results with out-of-sample testing (a test set is neverinvolved in training) through the use of double cross-valida-tion experimental design. Although some studies may pres-ent higher sensitivity and/or specificity than ours (Mormannet al., 2007), their algorithms were trained and tested on theexact same datasets; therefore, the results are not directlycomparable.
Another seizure prediction algorithm has been introducedrecently using autoregressive coefficients and SVM classifi-cation and demonstrated a high prediction rate (Chisci et al.,2010); our algorithm is the first to be tested using doublecross-validation, in that all the datasets were resampled andtested and using the prediction horizon as defined by theInternational Seizure Prediction Workshop (IWSP4, http://www.iwsp4.org/). The standard of the IWSP4 for predictionhorizon is that once a seizure prediction has been issued it isrequired to be left on for the entire duration of the predictionhorizon.
An important feature of our algorithm is that it analyzeslinear features with a nonlinear classifier. With respect toimplementing it in an implantable device, the use of linearfeatures is attractive because they can be calculated rapidlyand with low power consumption when compared to non-
Table 2. Top two discriminating raw or time-
differential features
Pat. No
Top two features (F/103)
Raw Time-differential
1 b (4.58) c1 (3.34) c4 (12.25) c4 (10.39)
3 c1 (3.01) a (2.26) c4 (4.88) h (3.80)
4 b (6.22) c1 (5.85) h (25.85) c3 (24.32)
6 d (6.40) c1 (5.02) h (7.59) c2 (5.98)
7 c2 (10.00) c3 (8.68) c2 (87.28) c3 (57.05)
9 d (1.55) h (1.54) c4 (8.37) c4 (5.96)
10 b (2.04) b (1.90) d (2.43) h (1.84)
11 h (2.80) c1 (2.29) c4 (6.35) c4 (5.66)
12 h (11.47) a (8.19) c2 (80.60) c3 (42.39)
15 c1 (4.20) b (2.67) c1 (6.38) c2 (3.74)
17 h (2.28) c1 (2.18) h (7.06) c1 (2.52)
18 c1 (1.34) c4 (1.30) c4 (2.97) c4 (2.89)
21 d (3.64) a (3.64) a (2.41) d (2.40)
Ave 4.58 3.76 19.57 13.00
The underline indicates the spectral bands in afocal electrodes.
1767
Seizure Prediction with Spectral Power of EEG
Epilepsia, 52(10):1761–1770, 2011doi: 10.1111/j.1528-1167.2011.03138.x
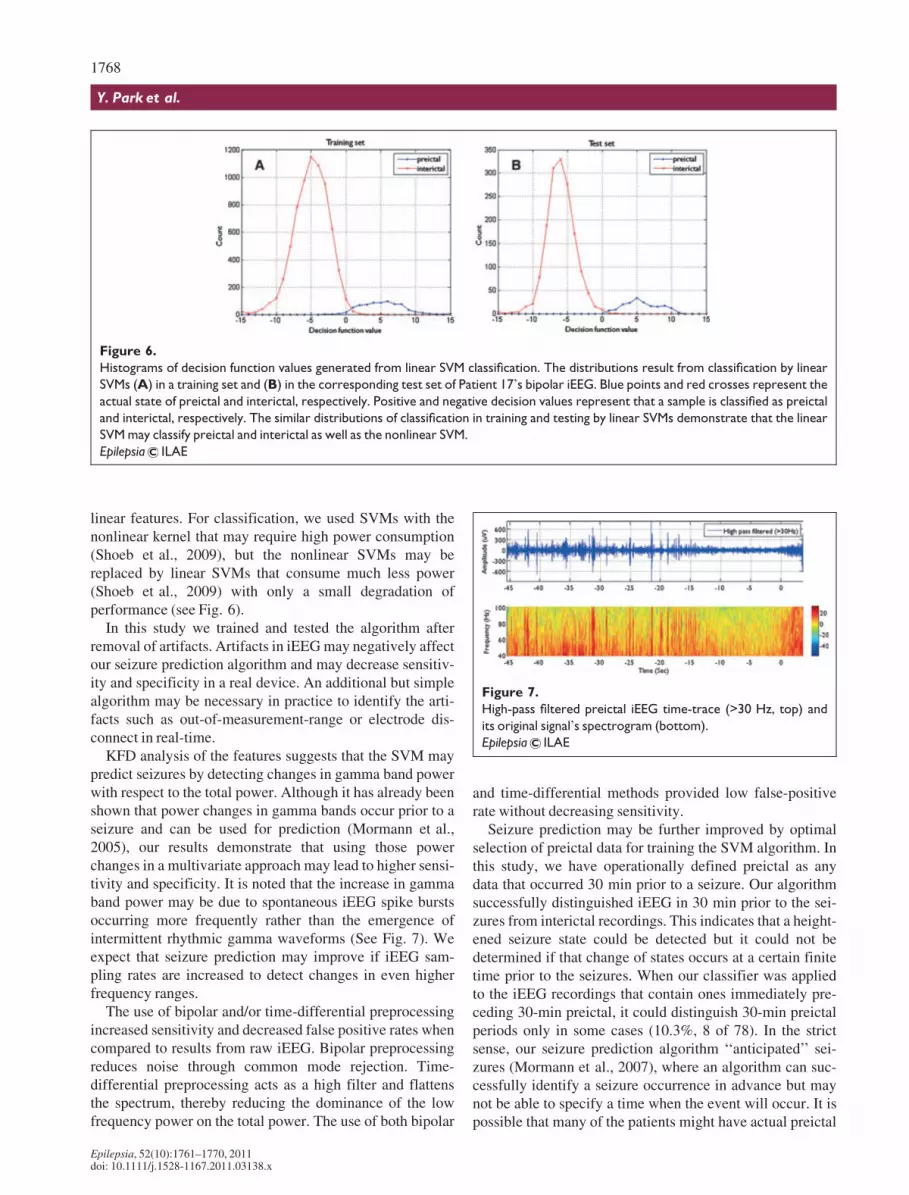
linear features. For classification, we used SVMs with thenonlinear kernel that may require high power consumption(Shoeb et al., 2009), but the nonlinear SVMs may bereplaced by linear SVMs that consume much less power(Shoeb et al., 2009) with only a small degradation ofperformance (see Fig. 6).
In this study we trained and tested the algorithm afterremoval of artifacts. Artifacts in iEEG may negatively affectour seizure prediction algorithm and may decrease sensitiv-ity and specificity in a real device. An additional but simplealgorithm may be necessary in practice to identify the arti-facts such as out-of-measurement-range or electrode dis-connect in real-time.
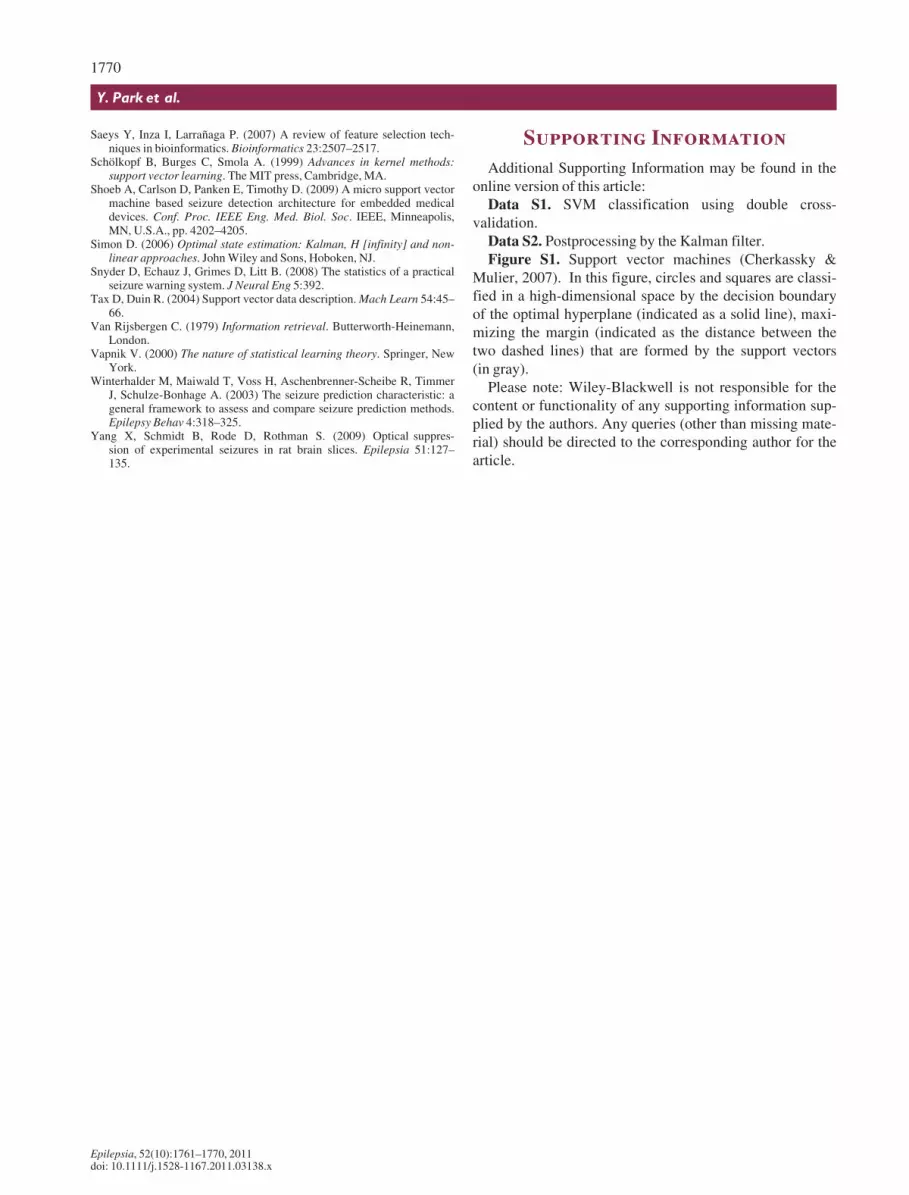
KFD analysis of the features suggests that the SVM maypredict seizures by detecting changes in gamma band powerwith respect to the total power. Although it has already beenshown that power changes in gamma bands occur prior to aseizure and can be used for prediction (Mormann et al.,2005), our results demonstrate that using those powerchanges in a multivariate approach may lead to higher sensi-tivity and specificity. It is noted that the increase in gammaband power may be due to spontaneous iEEG spike burstsoccurring more frequently rather than the emergence ofintermittent rhythmic gamma waveforms (See Fig. 7). Weexpect that seizure prediction may improve if iEEG sam-pling rates are increased to detect changes in even higherfrequency ranges.
The use of bipolar and/or time-differential preprocessingincreased sensitivity and decreased false positive rates whencompared to results from raw iEEG. Bipolar preprocessingreduces noise through common mode rejection. Time-differential preprocessing acts as a high filter and flattensthe spectrum, thereby reducing the dominance of the lowfrequency power on the total power. The use of both bipolar
and time-differential methods provided low false-positiverate without decreasing sensitivity.
Seizure prediction may be further improved by optimalselection of preictal data for training the SVM algorithm. Inthis study, we have operationally defined preictal as anydata that occurred 30 min prior to a seizure. Our algorithmsuccessfully distinguished iEEG in 30 min prior to the sei-zures from interictal recordings. This indicates that a height-ened seizure state could be detected but it could not bedetermined if that change of states occurs at a certain finitetime prior to the seizures. When our classifier was appliedto the iEEG recordings that contain ones immediately pre-ceding 30-min preictal, it could distinguish 30-min preictalperiods only in some cases (10.3%, 8 of 78). In the strictsense, our seizure prediction algorithm ‘‘anticipated’’ sei-zures (Mormann et al., 2007), where an algorithm can suc-cessfully identify a seizure occurrence in advance but maynot be able to specify a time when the event will occur. It ispossible that many of the patients might have actual preictal
Figure 6.
Histograms of decision function values generated from linear SVM classification. The distributions result from classification by linear
SVMs (A) in a training set and (B) in the corresponding test set of Patient 17’s bipolar iEEG. Blue points and red crosses represent the
actual state of preictal and interictal, respectively. Positive and negative decision values represent that a sample is classified as preictal
and interictal, respectively. The similar distributions of classification in training and testing by linear SVMs demonstrate that the linear
SVM may classify preictal and interictal as well as the nonlinear SVM.
Epilepsia ILAE
Figure 7.
High-pass filtered preictal iEEG time-trace (>30 Hz, top) and
its original signal’s spectrogram (bottom).
Epilepsia ILAE
1768
Y. Park et al.
Epilepsia, 52(10):1761–1770, 2011doi: 10.1111/j.1528-1167.2011.03138.x

periods longer than 30 min or that seizure states mightchange prior to the onset of the recordings. Better predictionmay be achieved by selecting correct preictal periods foreach patient. It is noted that interictal iEEG recordings inthe Freiburg database were separated from seizure eventsgenerally by several days and therefore it cannot be ruledout that our classifier might only be detecting changes in theiEEG due to withdrawal of antiepileptic drugs.
Prediction may be also improved by adding and testingmore features, including other univariate features such asautoregressive coefficients (Chisci et al., 2010) or bivari-ate features such as cross-correlation or wavelet syn-chrony (Mirowski et al., 2009). Selecting discriminatingfeatures may also enhance the classification rate (Guyon& Elisseeff, 2003; Saeys et al., 2007) and furthermoreimprove power consumption when it comes to a realdevice. To reduce false positive time, a criterion may beestablished to turn off (false) alarms, as new windows ofdata are analyzed: for example, a Kalman-filtered outputis marked as an (false) alarm but it goes off immediately.Under this criterion, which may be against the IWSP4’sstandard, we could have achieved a total of 24.8 h falsepositives (5.72%) in 433.2 h bipolar interictal recordings.Support Vector Data Description that is modified one-class SVM with cost-sensitive learning may providehigher sensitivity and specificity in seizure prediction thancost-sensitive SVMs (Tax & Duin, 2004). Lastly, estab-lishing a continuous variable that indicates the likelihoodof an impending seizure in the near future can be an alter-native approach to seizure prediction.
Acknowledgments
This work is supported by the Interdisciplinary Doctoral Fellowshipaward from the Graduate School of the University of Minnesota and by agrant from the Institute of Engineering and Medicine at the University ofMinnesota. Computational power is supported by the Minnesota Supercom-puting Institute, and graphics and computations are done with Matlab andLinux Shell scripting. The authors thank Dr. Vladimir Cherkassky in theDepartment of Electrical Engineering at the University of Minnesota for hisexpert advice on SVM classification and double cross-validation. Theauthors are also grateful for the reviewers’ constructive comments that ledto significant improvements in the article.
Disclosures
Yun Park, Lan Luo, Keshab K. Parhi, and Theoden Netoff have no con-flicts of interest to report. We confirm that we have read the Journal’s posi-tion on issues involved in ethical publication and affirm that this report isconsistent with those guidelines.
References
Alpaydin E. (2004) Introduction to machine learning. The MIT Press,Cambridge.
Andrzejak R, Mormann F, Kreuz T, Rieke C, Kraskov A, Elger C, LehnertzK. (2003) Testing the null hypothesis of the nonexistence of a presei-zure state. Phys Rev E Stat Nonlin Soft Matter Phys 67:10901.
Andrzejak R, Chicharro D, Elger C, Mormann F. (2009) Seizure prediction:any better than chance? Clin Neurophysiol 120:1465–1478.
Aschenbrenner-Scheibe R, Maiwald T, Winterhalder M, Voss H,Timmer J, Schulze-Bonhage A. (2003) How well can epilepticseizures be predicted? An evaluation of a nonlinear method. Brain126:2616.
Bishop C. (2006) Pattern recognition and machine learning. Springer,New York.
Cherkassky V, Mulier F. (2007) Learning from data: concepts, theory, andmethods. Wiley-Interscience, Hoboken.
Chisci L, Mavino A, Perferi G, Sciandrone M, Anile C, Colicchio G,Fuggetta F. (2010) Real-time epileptic seizure prediction using ARmodels and support vector machines. IEEE Trans Biomed Eng57:1124–1132.
Feldwisch-Drentrup H, Schelter B, Jachan M, Nawrath J, Timmer J,Schulze-Bonhage A. (2010) Joining the benefits: combining epilepticseizure prediction methods. Epilepsia 51:1598–1606.
Fisher R, Salanova V, Witt T, Worth R, Henry T, Gross R, Oommen K,Osorio I, Nazzaro J, Labar D. (2010) Electrical stimulation of the ante-rior nucleus of thalamus for treatment of refractory epilepsy. Epilepsia51:899–908.
Friedman JH. (1994) An overview of predictive learning and functionapproximation. In Cherkassky V, Friedman JH, Wechsler H (Eds) Fromstatistics to neural networks: Theory and pattern recognition applica-tions (NATO ASI Series/Computer and Systems Sciences). Springer,Berlin, pp. 1–61.
Guyon I, Elisseeff A. (2003) An introduction to variable and feature selec-tion. JMLR 3:1157–1182.
Harrison M, Osorio I, Frei M, Asuri S, Lai Y. (2005) Correlation dimensionand integral do not predict epileptic seizures. Chaos 15:033106.
Hjorth B. (1970) EEG analysis based on time domain properties. Electroen-cephalogr Clin Neurophysiol 29:306.
Li X, Wang Y, Acero A. (2008) Learning query intent from regularizedclick graphs. Proc. ACM Int. Conf. Inf. Knowl. Manag. ACM Press,Singapore, pp. 339–346.
Litt B, Echauz J. (2002) Prediction of epileptic seizures. Lancet Neurol1:22–30.
Maiwald T, Winterhalder M, Aschenbrenner-Scheibe R, Voss H, Schulze-Bonhage A, Timmer J. (2004) Comparison of three nonlinear seizureprediction methods by means of the seizure prediction characteristic.Physica D 194:357–368.
Martinerie J, Adam C, Le Van Quyen M, Baulac M, Clemenceau S, RenaultB, Varela F. (1998) Epileptic seizures can be anticipated by non-linearanalysis. Nat Med 4:1173–1176.
Mika S, Ratsch G, Weston J, Scholkopf B, Muller K. (1999) Fisher discri-minant analysis with kernels. Neural networks for signal processing IX.IEEE, Madison, WI, U.S.A., pp. 41–48.
Mirowski P, Madhavan D, LeCun Y, Kuzniecky R. (2009) Classification ofpatterns of EEG synchronization for seizure prediction. Clin Neuro-physiol 120:1927–1940.
Moore D, McCabe G. (2005) Introduction to the practice of statistics. W.H.Freeman, New York.
Mormann F, Kreuz T, Rieke C, Andrzejak R, Kraskov A, David P, Elger C,Lehnertz K. (2005) On the predictability of epileptic seizures. Clin Neu-rophysiol 116:569–587.
Mormann F, Andrzejak R, Elger C, Lehnertz K. (2007) Seizure prediction:the long and winding road. Brain 130:314.
Netoff T, Park Y, Parhi K. (2009) Seizure prediction using cost-sensitivesupport vector machine. Conf. Proc. IEEE Eng. Med. Biol. Soc. IEEE,Minneapolis, MN, U.S.A., pp. 3322–3325.
Nunez P, Srinivasan R. (2006) Electric fields of the brain: the neurophysicsof EEG. Oxford University Press, New York.
Osorio I, Frei M, Wilkinson S. (1998) Real-time automated detection andquantitative analysis of seizures and short-term prediction of clinicalonset. Epilepsia 39:615–627.
Park Y, Neoff T, Parhi K. (2010) Seizure prediction with spectral power oftime/space-differential EEG signals using cost-sensitive support vectormachine. Proc. IEEE Int. Conf. Acoust. Speech Signal Process. IEEE,Dallas, TX, U.S.A., pp. 5450–5453.
Rothman S, Smyth M, Yang X, Peterson G. (2005) Focal cooling for epi-lepsy: an alternative therapy that might actually work. Epilepsy Behav7:214–221.
1769
Seizure Prediction with Spectral Power of EEG
Epilepsia, 52(10):1761–1770, 2011doi: 10.1111/j.1528-1167.2011.03138.x
Saeys Y, Inza I, LarraÇaga P. (2007) A review of feature selection tech-niques in bioinformatics. Bioinformatics 23:2507–2517.
Schçlkopf B, Burges C, Smola A. (1999) Advances in kernel methods:support vector learning. The MIT press, Cambridge, MA.
Shoeb A, Carlson D, Panken E, Timothy D. (2009) A micro support vectormachine based seizure detection architecture for embedded medicaldevices. Conf. Proc. IEEE Eng. Med. Biol. Soc. IEEE, Minneapolis,MN, U.S.A., pp. 4202–4205.
Simon D. (2006) Optimal state estimation: Kalman, H [infinity] and non-linear approaches. John Wiley and Sons, Hoboken, NJ.
Snyder D, Echauz J, Grimes D, Litt B. (2008) The statistics of a practicalseizure warning system. J Neural Eng 5:392.
Tax D, Duin R. (2004) Support vector data description. Mach Learn 54:45–66.
Van Rijsbergen C. (1979) Information retrieval. Butterworth-Heinemann,London.
Vapnik V. (2000) The nature of statistical learning theory. Springer, NewYork.
Winterhalder M, Maiwald T, Voss H, Aschenbrenner-Scheibe R, TimmerJ, Schulze-Bonhage A. (2003) The seizure prediction characteristic: ageneral framework to assess and compare seizure prediction methods.Epilepsy Behav 4:318–325.
Yang X, Schmidt B, Rode D, Rothman S. (2009) Optical suppres-sion of experimental seizures in rat brain slices. Epilepsia 51:127–135.
Supporting Information
Additional Supporting Information may be found in theonline version of this article:
Data S1. SVM classification using double cross-validation.
Data S2. Postprocessing by the Kalman filter.Figure S1. Support vector machines (Cherkassky &
Mulier, 2007). In this figure, circles and squares are classi-fied in a high-dimensional space by the decision boundaryof the optimal hyperplane (indicated as a solid line), maxi-mizing the margin (indicated as the distance between thetwo dashed lines) that are formed by the support vectors(in gray).
Please note: Wiley-Blackwell is not responsible for thecontent or functionality of any supporting information sup-plied by the authors. Any queries (other than missing mate-rial) should be directed to the corresponding author for thearticle.
1770
Y. Park et al.
Epilepsia, 52(10):1761–1770, 2011doi: 10.1111/j.1528-1167.2011.03138.x
Related Documents