Research Article Automatic Epileptic Seizure Detection Using Scalp EEG and Advanced Artificial Intelligence Techniques Paul Fergus, 1 David Hignett, 1 Abir Hussain, 1 Dhiya Al-Jumeily, 1 and Khaled Abdel-Aziz 2 1 Applied Computing Research Group, Liverpool John Moores University, Byrom Street, Liverpool L3 3AF, UK 2 e Walton Centre NHS Foundation Trust, Lower Lane, Fazakerley, Liverpool L9 7LJ, UK Correspondence should be addressed to Paul Fergus; [email protected] Received 21 July 2014; Revised 9 December 2014; Accepted 23 December 2014 Academic Editor: Stefan Rampp Copyright © 2015 Paul Fergus et al. is is an open access article distributed under the Creative Commons Attribution License, which permits unrestricted use, distribution, and reproduction in any medium, provided the original work is properly cited. e epilepsies are a heterogeneous group of neurological disorders and syndromes characterised by recurrent, involuntary, paroxysmal seizure activity, which is oſten associated with a clinicoelectrical correlate on the electroencephalogram. e diagnosis of epilepsy is usually made by a neurologist but can be difficult to be made in the early stages. Supporting paraclinical evidence obtained from magnetic resonance imaging and electroencephalography may enable clinicians to make a diagnosis of epilepsy and investigate treatment earlier. However, electroencephalogram capture and interpretation are time consuming and can be expensive due to the need for trained specialists to perform the interpretation. Automated detection of correlates of seizure activity may be a solution. In this paper, we present a supervised machine learning approach that classifies seizure and nonseizure records using an open dataset containing 342 records. Our results show an improvement on existing studies by as much as 10% in most cases with a sensitivity of 93%, specificity of 94%, and area under the curve of 98% with a 6% global error using a k-class nearest neighbour classifier. We propose that such an approach could have clinical applications in the investigation of patients with suspected seizure disorders. 1. Introduction e epilepsies are a heterogeneous group of neurological dis- orders and syndromes characterised by recurrent, involun- tary, paroxysmal seizure activity, which is typically associated with a clinicoelectrical correlate on the electroencephalo- gram (EEG). e diagnosis of epilepsy can be made, follow- ing two or more unprovoked seizures (http://www.who .int/).However, in the absence of a reliable witness account, diagnosis in the early stages of the disease can be challenging, which may delay initiation of treatment. Where there is clinical uncertainty, paraclinical evidence from the EEG can allow earlier diagnosis and treatment. However, EEG capture and interpretation are time consuming and costly because interpretation can currently only be performed by specialist clinicians, trained in EEG interpretation. is has led to a recent interest in automated seizure detection [1]. Although seizure semiology oſten gives clinical clues as to whether seizures are focal or generalised in onset and which lobe of the brain the seizure originated from, it is oſten more challenging to determine whether the seizure originated in the leſt or right hemisphere, in particular, in the case of temporal and occipital lobe epilepsies. In such cases or where there is clinical uncertainty, it is impossible to know, before performing the test, on which EEG channels seizure activity will be detected. is poses a problem when trying to generalise the detection of seizures across multiple subjects. Recent work on automated seizure detection from EEG recordings has focused on patient-specific predictors, where a classifier is trained and tested on the same person [2–5]. In this paper, the focus is on using EEG classification to generalise detection across all brain regions, in multiple subjects without a priori knowledge of the seizure focus. e structure, of the remainder, of this paper is as follows. Section 2 describes the principles of preprocessing EEG data. Section 3 describes how features are extracted from EEG signals. Section 4 discusses machine learning and its use in seizure and nonseizure classification, while Section 5 presents the approach taken in this paper for whole-brain seizure Hindawi Publishing Corporation BioMed Research International Volume 2015, Article ID 986736, 17 pages http://dx.doi.org/10.1155/2015/986736

Welcome message from author
This document is posted to help you gain knowledge. Please leave a comment to let me know what you think about it! Share it to your friends and learn new things together.
Transcript

Research ArticleAutomatic Epileptic Seizure Detection Using Scalp EEG andAdvanced Artificial Intelligence Techniques
Paul Fergus1 David Hignett1 Abir Hussain1 Dhiya Al-Jumeily1 and Khaled Abdel-Aziz2
1Applied Computing Research Group Liverpool John Moores University Byrom Street Liverpool L3 3AF UK2The Walton Centre NHS Foundation Trust Lower Lane Fazakerley Liverpool L9 7LJ UK
Correspondence should be addressed to Paul Fergus pfergusljmuacuk
Received 21 July 2014 Revised 9 December 2014 Accepted 23 December 2014
Academic Editor Stefan Rampp
Copyright copy 2015 Paul Fergus et al This is an open access article distributed under the Creative Commons Attribution Licensewhich permits unrestricted use distribution and reproduction in any medium provided the original work is properly cited
The epilepsies are a heterogeneous group of neurological disorders and syndromes characterised by recurrent involuntaryparoxysmal seizure activity which is often associated with a clinicoelectrical correlate on the electroencephalogramThe diagnosisof epilepsy is usually made by a neurologist but can be difficult to be made in the early stages Supporting paraclinical evidenceobtained frommagnetic resonance imaging and electroencephalography may enable clinicians to make a diagnosis of epilepsy andinvestigate treatment earlier However electroencephalogram capture and interpretation are time consuming and can be expensivedue to the need for trained specialists to perform the interpretation Automated detection of correlates of seizure activity may be asolution In this paper we present a supervised machine learning approach that classifies seizure and nonseizure records using anopen dataset containing 342 records Our results show an improvement on existing studies by as much as 10 in most cases witha sensitivity of 93 specificity of 94 and area under the curve of 98 with a 6 global error using a k-class nearest neighbourclassifier We propose that such an approach could have clinical applications in the investigation of patients with suspected seizuredisorders
1 Introduction
The epilepsies are a heterogeneous group of neurological dis-orders and syndromes characterised by recurrent involun-tary paroxysmal seizure activity which is typically associatedwith a clinicoelectrical correlate on the electroencephalo-gram (EEG) The diagnosis of epilepsy can be made follow-ing two or more unprovoked seizures (httpwwwwhoint) However in the absence of a reliable witness accountdiagnosis in the early stages of the disease can be challengingwhich may delay initiation of treatment Where there isclinical uncertainty paraclinical evidence from the EEG canallow earlier diagnosis and treatment However EEG captureand interpretation are time consuming and costly becauseinterpretation can currently only be performed by specialistclinicians trained in EEG interpretation This has led to arecent interest in automated seizure detection [1]
Although seizure semiology often gives clinical clues asto whether seizures are focal or generalised in onset andwhich lobe of the brain the seizure originated from it is
often more challenging to determine whether the seizureoriginated in the left or right hemisphere in particular inthe case of temporal and occipital lobe epilepsies In suchcases or where there is clinical uncertainty it is impossibleto know before performing the test on which EEG channelsseizure activity will be detected This poses a problem whentrying to generalise the detection of seizures across multiplesubjects Recent work on automated seizure detection fromEEG recordings has focused on patient-specific predictorswhere a classifier is trained and tested on the same person[2ndash5] In this paper the focus is on using EEG classificationto generalise detection across all brain regions in multiplesubjects without a priori knowledge of the seizure focus
The structure of the remainder of this paper is as followsSection 2 describes the principles of preprocessing EEG dataSection 3 describes how features are extracted from EEGsignals Section 4 discusses machine learning and its use inseizure and nonseizure classification while Section 5 presentsthe approach taken in this paper for whole-brain seizure
Hindawi Publishing CorporationBioMed Research InternationalVolume 2015 Article ID 986736 17 pageshttpdxdoiorg1011552015986736
2 BioMed Research International
detection Section 6 describes the evaluation Section 7 dis-cusses the results and conclusions are presented in Section 8
2 Preprocessing ofElectroencephalography Data
Electroencephalography is the term given to the techniqueof recording electrical activity resulting from ionic currentflows generated by neurons in the brain [6] Its main clinicalapplication is in the evaluation of patients with suspectedepilepsy
Before analysis or classification occurs EEG signals intheir raw form need preprocessing Preprocessing oftenincludes filtering and artefact removal as recordings can con-tain unwanted noise mixed with the actual EEG energybrainwavesignal Artefacts can originate from various sourcessuch as the subject equipment or the environment andconsist of ocular artefacts such as eye blinks movementof the EEG sensors and electromyogenic artefacts causedby muscle movement Artefacts are normally removed byeliminating certain frequencies from the EEG signal usinghigh-pass low-pass band-pass and notch filters [7]
One of the most common filters used in previous studiesis a notch filter [8] A notch filter removes any part of thesignal that is at a specific frequency Power line artefactsreside between 50 and 60Hz and are removed when EEGfrequencies above 60Hz are used [9 10] However there hasbeen little justification for the use of higher frequencies [11 12]because most brain activity occurs between 3 and 29Hz Insupport of this Libenson [6] argues that EEG instrumentsrarely exceed 30ndash40Hz and signals from cortically implantedelectrodes rarely exceed 50Hz due to electrical noise andother artefacts such as muscle movement For these reasonsBlanco et al [13] use an upper cut-off frequency of 40Hz and[14] use an upper range of 35Hz whereas Greene et al [15]filter out frequencies above 34Hz stating that the frequencyrange 2ndash20Hz provides the best discrimination betweenseizure and nonseizureevents In other studies Wang et al[16] use a frequency range between 8 and 32Hz and in [17]frequencies above 30Hz are filtered whereas Yuan et al [18]split signals into different frequency bands using bandpassfilters for theta (120579 4 le 119891 le 8Hz) alpha (120572 8 le 119891 le 12Hz)and beta (120573 12 le 119891 le 25Hz) to ensure that only specificphysiological data is considered
At the lower end of the frequency spectrum the mostcommon cut-off filter value is around 05Hz [19ndash22] In [6]the author argues that there is no cerebral activity below05Hz and what little there is cannot be reliably observed inconventional EEG recordings In fact the majority of signalsbelow 05Hz usually represent motion or other electricalactivity
3 Feature Extraction fromElectroencephalography Signals
The collection of raw EEG signals is always temporal How-ever for analysis and feature extraction purposes translationinto other domains is possible and often required These
include frequency representations via Fourier transform[19ndash22] and wavelet transform [22ndash27] The advantage offrequency-related parameters is that they are less susceptibleto signal quality variations due to electrode placement or thephysical characteristics of subjects [28] In order to calculatethese parameters a transform from the time domain isrequired that is using a Fourier transform of the signalIn several of the studies reviewed power spectral density(PSD) is used in order to obtain frequency parameters PeakFrequency is one of the features considered in many studiesIt describes the frequency of the highest peak in the PSDDuring a seizure EEG signals tend to contain a major cycliccomponent which shows itself as a dominant peak in thefrequency domain [29] Peak Frequency has been used alongwith other features to achieve high classification accuracyIn one example Aarabi et al used Peak Frequency alongwith sample entropyand other amplitude features to detectepileptic seizures and achieved a sensitivityof 987 and afalse detection rateof 027 per hour [30]
While Tzallas et al found that Peak Frequency along with15 other features provided accuracies between 7811 and8618 when classifying transient events in EEG recordings[31] in [15] it was found thatPeak Frequency only achieved anaccuracy of 5406A possible explanation for low accuraciescould be that the frequency of peaks tends to decay over timeIf the window that the Peak Frequency is extracted from istoo large this decaying of the peak could explain why someauthors have experienced less accuracy when using only thePeak Frequency to detect seizures [32]
Wang and Lyu [33] found that median frequency dis-played significant differences between seizure and nonseizurepatients By segmenting the EEG signal into five separatefrequency bands for delta (120575 05 le 119891 le 4Hz) theta (1205794 le 119891 le 8Hz) alpha (120572 8 le 119891 le 12Hz) beta (120573 12 le 119891 le25Hz) and gamma (120574 25 le 119891) it was possible to predict79 of 83 seizures with a sensitivity value of 952 In otherworks Paivinen et al [34] used linear and nonlinear featuresfor detecting seizures and found that a combination of the twoachieved the best results
Root mean square (RMS) has been considered a usefulfeature for distinguishing between seizures and nonseizureevents RMSmeasures the magnitude of the varying quantityand is a good signal strength estimator in EEG frequencybands [35 36] In a study onneonatal seizure detection [15] 21features for seizure classification were compared which sawRMS achieve an overall accuracy of 7771 outperformingthe other features studied However the figure was reportedlylower than that in another study [37] where RMS was usedin conjunction with other features rather than as a singlefeature
Entropy has been used as a measure of the complexity oruncertainty of an EEG signal where the more chaotic thesignal is the higher the entropy is [15 29] There are twokinds of entropy estimators spectral entropies which use theamplitude of the power spectrum and signal entropies whichuse the time series directly [38] Many authors agree thatduring a seizure the brain activity is more predictable thanduring a normal nonseizure phase and this is reflected bya sudden drop in the entropy value [15 30 39ndash41] In [38]
BioMed Research International 3
four entropy measures were used Shannon spectral entropyRenyirsquos entropy Kolmogorov-Sinai entropy and approximateentropy and over 90 classification accuracy was achievedWavelet entropy sample entropy and spectral entropy werecompared in [42] in which accuracies between 79 and998 were reported In another similar study using onlyapproximate entropy accuracies of 100 were achieved [43]Several other studies produced comparatively high overallaccuracies [44ndash46] While [47] found that entropy featuresgave much lower classification accuracies between 545 and763 it was not clear why accuracies were low Howeverone possible reason is the lack of data preprocessing If EEGartefacts are not removed from seizure phases this couldmake the seizure signal appear to be more complex and givethe EEG signal a look more akin to anonseizure phase
Energy is a measure of the EEG signal strength Ratherthan looking at the energy of the whole EEG signal theenergy distribution across frequency bands has been used inseizure detection [48] The study found that delta and thetafrequency bands saw a much larger distribution of energyduring a seizure compared to normal EEG whereas thealpha beta and gamma frequency bands saw a lower energydistribution during a seizure Using the energy distributionper frequency band as a feature achieved an overall accuracyof 94 In [47] the results show that using energy as a featureproduced classification accuracies between 92 and 9981In a similar study energy was also used along with entropyand standard deviation [49]They were evaluated in isolationand combined together with the best feature being energywith an overall accuracy of 912
Correlation dimension has been investigated as a cor-relation measure in several studies which is a nonlinearunivariate widely used to measure fractal dimension Fractaldimension measures the complexity of the EEG signal inother words the regularity and divergence of the signal [5051] In [52] correlation dimension and five other featuresfor seizure prediction of focal neocortical epilepsy producedreasonably good results with 902 for sensitivity and 97for specificity However when looking specifically at thecorrelation dimension they found conflicting results wherecorrelation dimension dropped in 449 of seizures andincreased in the preictal phase in 449 of seizures Theyalso found that there were stronger dimension changes inthe remote channels compared with those near seizure onsetIt should be noted that the data preprocessing was minimalas the method for calculating the correlation dimensionstolerates a certain amount of noise In addition as theirstudy is concerned with identifying the preictal state with theintention of predicting seizures it differs from the currentwork which is only interested in detecting the seizure retro-spectively by classifying blocks of data as seizure or non-seizure
In [53] correlation dimension and the largest Lyapunovexponent were studied to determine their ability to detectseizures The study showed that neither measure on its ownwas useful for the task but did work better when they wereused togetherThey also noted that correlation dimensionwasonly useful when applied to the frequency subbands (deltatheta alpha beta and gamma) and not on the entire 0ndash60Hz
frequency spectrum that was used in the study The authorsconcluded that changes in dynamics are not spread out acrossthe entire spectrum but are limited to certain frequencybands In a comparative study [38] explored the use ofcorrelation dimension along with Hurst exponent largestLyapunov exponent and entropy to distinguish seizuresfrom normal EEG The results report an overall accuracy of90 [54] Meanwhile [55] questions the use of correlationdimension and argues that it only reflects the change invariance and that there was little justification for its use overthe simpler linear measure of variance
Skewness is a third-order statisticalmoment and kurtosisis the fourth [34] Along with the first- and second-ordermoments mean and variance respectively the four statisticalmoments provide information on the amplitude distributionof a time series Specifically skewness and kurtosis give anindication of the shape of the distribution [56] Khan et aluse skewness and kurtosis along with normalised coefficientof variation for seizure detection in paediatric patientsTheymanaged to detect all 55 seizures from a subset of 10 patientsachieving 100 sensitivity with a false detection rate of 11 perhour Paivinen et al examined spectral skewness and spectralkurtosis and found a high correlation between skewness andkurtosis In their study they rejected kurtosis arguing that itis of a higher order and thus more sensitive to noise Theyconcluded that a combination of linear and nonlinear featureswas best suited to seizure detection
4 Seizure Detection and Classification
The first results in seizure detection and classification dateback to 1979 [57] Gotman et al investigated the automaticrecognition of interictal epileptic activity in prolonged EEGrecordings using a spike and sharp wave recognition method[57ndash59] This work lead to the investigation of functionalmagnetic resonance imaging (fMRI) and the correlationbetween cerebral hemodynamic changes and epileptic seizureevents visible in EEG [60] In 2013 stereoelectroencephalog-raphy (sEEG) using high frequency activities in the waveletdomain was proposed [61] While the detection sensitivitywas high (86) and the specificity was acceptable (047h)the detection delay is long (mean delay 162 s)
Since 1979 computer algorithms and visualisation tech-niques have played a central role in the analysis of EEGdatasets However today there is significant interest in classi-fication algorithms The most common classifier used to dis-tinguish between seizure and nonseizure events has been thesupport vectormachine (SVM)Using theChildrenrsquosHospitalBoston-Massachusetts Institute of Technology (CHB-MIT)database and a patient-specific prediction methodology thestudy in [62] used a SVM classifier on EEG recordings from24 subjects The results show that a classification accuracyof 96 and 96 for sensitivity were produced with a false-positive rate of 008 per hour While the results are encourag-ing the approach is personalised to the individual In otherwords the approach cannot be generalised across more thanone patient In a similar study five patient records fromthe CHB-MIT dataset containing a total of 65 seizures were
4 BioMed Research International
evaluated using a linear discriminant analysis classifier [63]The results show that 836was achieved for sensitivity 100for specificity with an overall accuracy of 918 There aretwo main issues with this study The first is that the classifieris much more sensitive to nonseizures than seizures failingto detect a seizure is more problematic than failing to detecta nonseizure Second the focus of the study is personalisedto the individual and is incapable of being generalised acrossa wider population Nasehi and Pourghassem [64] used thesame CHB-MIT dataset with a particle swarm optimisationneural network (PSONN) which produced 98 for sensitivityand a false-positive rate of 0125 per hour This approach ismuch more sensitive to seizures than many of the studiesreviewed in this paper Yet again the approach is personspecific rather than generalised across a wider population
In [43] 100 seizure segments and 100 nonseizure seg-ments were used to train a SVM classifier The results showthat 100 was obtained for sensitivity specificity and overallaccuracy Meanwhile Nicolaou and Georgiou [65] carriedout a similar study using the BONN dataset [43] and an SVMclassifier with 9438 for sensitivity 9323 for specificityand an overall accuracy of 861 In a similar study Ubeyli[66] who also used the BONN dataset [43] and an SVMclassifier produced 9925 for sensitivity 100 for specificityand 993 for overall accuracy Extending this study Ubeylievaluated seven different classifiers with the SVM provingthe best-performing classifier with similar results producedto those in the original study [67] The worst performingclassifier was the multilayer perceptron neural networkwhich achieved 9048 for sensitivity 9745 for specificityand 9048 for overall accuracy
Acharya et al focused on using entropies for EEGseizure detection and seven different classifiers [68]The best-performing classifier was the Fuzzy Sugeno Classifier whichachieved 994 for sensitivity 100 for specificity and 981for overall accuracy The worst performing classifier was theNaıve Bayes Classifier which achieved 944 for sensitivity978 for specificity and 881 for accuracy In [69] thedecision tree classifier was used and achieved an averagesensitivity of 9924 specificity of 9876 and accuracy of9902
The FRE (httpsepilepsyuni-freiburgde) dataset hasfeatured in several studies which contains EEG data from anumber of patients similar to the CHB-MIT database How-ever it only has six channels three close to the focus of theseizure and three further away Using the FRE dataset Yuanet al presented a patient-specific seizure detection systemand an extrememachine-learning algorithm to train a neuralnetwork [70] Twenty-one seizure records were used to trainthe classifier and 65 for testing The results show that thesystem achieved an average of 9192 for sensitivity 9489for specificity and 949 for overall accuracy Using the samedataset Williamson et al [71] used a SVM to classify EEGrecordings from 18 of the 21 patients in the datasetThe resultsshow an average sensitivity of 908 and a false-positiverate of 0094 per hour Park et al [72] adopted a similarconfiguration and classifier and achieved 975 for sensitivityand a false-positive rate of 027 per hour While Patnaik andManyam [73] used a feed-forward back propagation artificial
neural network on the 21 subjects from the FRE dataset clas-sification was performed on a patient-specific basis and theresults per patient ranged from 9832 to 9982 for speci-ficity and between 8773 and 938 for sensitivity
Patel et al [74] proposed a low power real-time classifi-cation algorithm for detecting seizures in ambulatory EEGThe study compared linear discriminant analysis (LDA)quadratic discriminant analysis (QDA) Mahalanobis dis-criminant analysis (MDA) and SVM classifiers on 13 subjectsfrom the FRE dataset The results show that the LDA gavethe best results when trained and tested on a single patientwith 942 for sensitivity 779 for specificity and 877 foroverall accuracy When generalised across all subjects theresults show 909 for sensitivity 595 for specificity and765 for overall accuracy
In a similar study Acir andGuzelis used SVM classifier todetect epileptic spikes [75] The dataset used to evaluate theirmethodology was from the Neurology Department of DokuzEylul University Hospital Izmir Turkey and consisted of 25patients with one EEG record each 18 used for training and7 for testing Their approach achieved 903 for sensitivity881 for specificity and a 95 false detection rate Whilean SVM classifier was considered to discriminate betweenpreictal and nonpreictal states in [76] the authors used a22 linear univariate feature space extracted from six EEGrecordings for each of the 10 patients from the Europeandatabase on epilepsyTheir approach could detect 34 of the 46seizures achieving a sensitivity of 739 and a false predictionrate of 015hour
5 Generalisation of EpilepticSeizure Detection
Despite the advances within the last twenty years in theEEGseizure detection and prediction field generalised detec-tion approaches remain relatively poor This is especiallytrue when compared to patient-specific studies as discussedGiven this poor success itmay be easier to utilise an empiricalbackward looking ldquodata miningrdquo or ldquobrute forcerdquo approachThis is opposed to a forward-looking conceptual modelapproach in order to find features that best describe epilepsy
The aim of most studies in EEG detection has been todetect patient-specific focal seizures rather than predictinggeneral seizures across a much bigger population As Shoeb[5] explains a seizure EEG pattern is specific to a particularpatient The main reason for this is that focal seizures canoccur in any part of the brain and therefore can onlybe detected in the EEG on specific channels A classifiertrained on a patient who experiences focal seizures in theoccipital lobes for example would be trained on featuresfrom channels including electrodes O O1 and O2 as thesewould be the channels from the area of the seizure andtherefore best at detecting the seizureHowever these trainedclassifiers achieve low sensitivity if they are tested on a patientwho experiences focal seizures in the frontal lobes as thechannels around the focus of the seizure have not been usedto train the classifiers
BioMed Research International 5
In order to improve on earlier studies using the CHB-MIT dataset we aimed to discriminate between seizure andnonseizure EEGs across a group of 22 subjects with seizuresoccurring in different brain regions
51 Methodology The CHB-MIT dataset is a publicly avail-able database fromphysionetorg that contains 686 scalp EEGrecordings from 22 patients treated at the Childrenrsquos Hospitalin Boston The subjects had anticonvulsant medicationswithdrawn and EEG recordings were taken for up to severaldays after
Twenty-three sets of EEG recordings from 22 patients (5males 17 females) aged between 15 and 22 years (mean SD)are contained within the dataset (one patient has two sets ofEEG recordings 15 years apart)
Most of the recordings are one hour long although thosebelonging to case 10 are two hours long and those belongingto cases 4 6 7 9 and 23 are four hours long Records thatcontain at least one seizure are classed as seizure records andthose that contain no seizures as nonseizure records Of the686 records 198 records contain seizures
Although the description supplied with the dataset statesthat recordings were captured using the international 10ndash20 system of EEG electrode positions and nomenclature itwas found that 17 of the files that contained seizures haddifferent channel montages to the rest of the seizure filesTherefore these 17 records have been excluded from thisstudy leaving 181 seizure files A further 10 records wereremoved from the dataset due to a large number of not anumber (NaN) elements The remaining 171 seizure recordscontain the length of the recording (in seconds) in the firstcolumn followed by the 23 EEG channels in columns 2ndash24Table 1 shows the subject information as well as the numberof seizures used in the study
The final dataset used in this study was constructedfrom 60-second data blocks comprising the ictal period(seizure) which were extracted from 171 seizure files and 171data blocks were randomly extracted from nonseizure filesThe classifiers were then trained on all patient records andtherefore classification is generalised across all subjects usingfeatures from channels that capture the EEG in all parts of thebrain
511 Data Preprocessing In the CHB-MIT database eachrecord was sampled at 256Hz with 16-bit resolution Signalswere recorded simultaneously through twenty-three differentchannels (FP1-F7 F7-T7 T7-P7 P7-O1 FP1-F3 F3-C3 C3-P3P3-O1 FZ-CZ CZ-PZ FP2-F4 F4-C4 C4-P4 P4-O2 FP2-F8F8-T8 T8-P8 P8-O2 P7-T7 T7FT9 FT9-FT10 FT10-T8 andT8-P8) via 19 electrodes and a ground attached to the surfaceof the scalp A number of records contained dashes (missingdata) in the original data no explanation is given to why thedata contains dashes However possible reasons could be thatthere were errors in the recording phase or the occurrenceof physiological symptoms such as sweat interference withthe electrodes or body movement Each zero was foundand replaced with a 256-point window (50 on either sideof the zero) and was replaced with the mean value Other
Table 1 Seizure information for each case
Case Number of seizures Gender Age1 7 F 112 3 M 113 7 F 144 4 M 225 5 F 76 10 F 157 3 F 1458 5 M 359 4 F 1010 7 M 311 3 F 1212 27 F 213 10 F 314 8 F 915 20 M 1616 8 F 717 3 F 1218 6 F 1819 3 F 1920 8 F 621 4 F 1322 3 F 923 7 F 624 16 Unknown Unknown
data removed from the segments include electrocardiograph(ECG) signals and vagal nerve stimulus (VNS)
A bandpass filter was applied to each of the 543 EEGsegments to extract the EEG data in each of the frequencybands Second order Butterworth filters were used as theyoffer good transition band characteristics at low coefficientorders thus they can be implemented efficiently [2] Thisresults in four columns of additional data delta (120575 05 le 119891 le4Hz) theta (120579 4 le 119891 le 8Hz) alpha (120572 8 le 119891 le 12Hz)and beta (120573 12 le 119891 le 25Hz) In other words each segmentcontains 115 columns of data for each of the original channeldata
512 Feature Definition Several features based on our find-ings in the literature are utilised in this study and are formallydescribed Each feature is ranked based on its discriminativecapabilities using feature-ranking algorithms and principlecomponent analysis
The frequency domain features were extracted from thetime-series signal using PSD In this study PSD is defined asthe Fourier transform of the autocorrelation sequence of thetimes series The Fourier transform119883(119891) of the signal 119909(119905) isdefined as
119883(119891) = int
+infin
minusinfin
119909 (119905) 119890minus1198952120587119891119905
119889119905 minusinfin lt 119891 lt +infin (1)
6 BioMed Research International
where 119883(119891) contains the information for the signal and119909(119905) is obtained from 119883(119891) using the inverse of the Fouriertransformation
119909 (119905) = int
+infin
minusinfin
119883(119891) 1198901198952120587119891119905
119889119905 minusinfin lt 119891 lt +infin (2)
Peak Frequency is one of the features considered in manystudies to have good discriminative capabilities and describesthe frequency of the highest peak in the PSD Peak Frequencyis formally described as
119891max = arg(119891119904
119873
119873minus1max119894=0
119875 (119894)) (3)
where 119891119904and119873 describe the sample frequency and the num-
ber of samples respectively Conversely median frequency isused to estimate the typical frequency present in the signaland is regarded in the literature as a useful feature in EEGresearch Median frequency is defined as
119891med = 119894119898119891119904
119873
119894=119894119898
sum
119894=0
119875 (119894) =
119894=119873minus1
sum
119894=119894119898
119875 (119894) (4)
The median frequency is defined as the midpoint in the fre-quency power spectrum where the sum of the points on eachside is equal RMS is also used in this study as a signal strengthestimator in EEG frequency bands It provides a measure ofthe magnitude of the varying quantity and is defined as
RMS = radic 1119873
119873minus1
sum
119894=0
119909 (119894)2
(5)
where a signal represented by a time-series 119909(119905) can be cal-culated as the root of the mean of the squares for all samplesin the signal Measuring the complexity of the signal isregarded as an important feature which can be calculatedusing sample entropy In other words sample entropy calcu-lates the uncertainty of an EEG signal It is described as
sampEmp =119873
sum
119894=1
(119883119894lowast log (1198832
119894)) (6)
where 119873 is the length of the time series and 119883119894is the 119894th
sample of the EEG signal Signal energy is also an importantfeature and is useful for measuring the EEG signal strengthin different frequency bands It is defined as the sum of thesquared magnitude of the samples
119864 =
119873
sum
119896=1
1199092
119896 (7)
The correlation dimension feature is a useful measure of theregularity and divergence of a signal that is its complexity Itis proportional to the probability of the distance between twopoints on a trajectory being less than some 119903
119862dim = lim119903rarrinfin
log (119862 (119903))log (119903)
(8)
where
119862 (119903) = lim119872rarrinfin
1
1198722
119872
sum
119894=1
119872
sum
119895=119894+1
120579 (119903 minus1003816100381610038161003816119910 (119894) minus 119910 (119895)
1003816100381610038161003816)
120579 (119903 minus 11003816100381610038161003816119910 (119894) minus 119910 (119895)
1003816100381610038161003816) = 1 (119903 minus 1003816100381610038161003816119910 (119894) minus 119910 (119895)
1003816100381610038161003816) ge 0
0 (119903 minus 1003816100381610038161003816119910 (119894) minus 119910 (119895)1003816100381610038161003816) le 0
(9)
Skewness and kurtosis are useful for providing informationon the amplitude distribution of a time series In otherwords they indicate the shape of the distribution Skewnessis defined as
119904 =119864 (119883 minus 120583)
3
1205903 (10)
where 119864(119909) is the expected value of some variable 119909 120583 is themean and 120590 is the standard deviation of the signal Kurtosisis defined as
119896 =119864 (119909 minus 120583)
4
1205904 (11)
513 Feature Selection The literature reports that medianfrequency sample entropy and root mean square have themost potential to discriminate between seizure and non-seizure records To validate these findings the discriminantcapabilities of each feature are determined using severalmeasures statistical significance principal component anal-ysis(PCA) [77] linear discriminant analysis independentsearch (LDAi) [77] linear discriminant analysis forwardsearch(LDAf) [77] linear discriminant analysis backwardsearch(LDAb) [77] and gram-Schmidt (GS) analysis [78]Using these measures the top 20 uncorrelated features wereextracted from all regions of the EEG scalp readings (region-by-region feature extraction is considered later in the paper)
The uncorrelated feature sets were used with severalclassification algorithms to determine which set of featuresproduced the highest area under the curve (AUC) Table 2shows that the best results obtained were from the lineardiscriminant analysis backward search technique with anAUC of 91 This was followed closely by statistical 119901 and119902-values with AUC values of 90 and 89 respectively
Using PCA we extracted the top five uncorrelated fea-tures from each of the five regions covered by the EEG scalpelectrodes using the linear discriminant backward searchtechnique (because it produced the highest AUC value of91) This ensures that each region is represented withoutthe bias from all other regions and allows classifiers to detectfocal seizures in different parts of the brain The channels aregrouped by region as shown in Table 3
The top five features per region were selected based ontheir rank determined by the linear discriminant backwardsearch technique creating five feature sets containing fivefeatures each These are combined to produce a set of 25features as shown in Table 4
Figure 1 shows that several RMS and median frequencyfeatures fromdifferent channels and frequency bands appearalong the principal component This is consistent with thefindings in [33ndash36]
BioMed Research International 7
Table 2 Results for Feature Selection techniques
AUCs for Feature Selection techniquesAUCknn AUCknn AUCsvn AUCknn AUCtreec AUCknn AUCloglc AUCknn AUCSVN
119875 119902 PC1 PC2 PC1 amp 2 LDAi LDAf LDAb GS90 89 83 88 87 86 88 91 88
Sensitivities for Feature Selection techniquesSENSknn SENSknn SENSsvn SENSknn SENStreec SENSknn SENSloglc SENSknn SENSloglc
119901 119902 PC1 PC2 PC1 amp 2 LDAi LDAf LDAb GS83 84 53 86 80 78 76 84 76
Specificities for Feature Selection techniquesSPECknn SPECknn SPECsvn SPECknn SPECtreec SPECknn SPECloglc SPECknn SPECloglc
119901 119902 PC1 PC2 PC1 amp 2 LDAi LDAf LDAb GS83 82 90 81 79 80 85 85 86
Table 3 List of channels for the five scalp regions
Region Channels1 FP1-F7 F7-T7 FP1-F3 F3-C3 T7-FT92 FP2-F4 F4-C4 FP2-F8 F8-T8 T8-FT103 T7-P7 P7-O7 C3-P3 P3-O14 C4-P4 P4-O2 T8-P8 P8-O25 FZ-CZ CZ-PZ FT9-FT10
Table 4 Top five features for the five scalp regions
Feature set Description Features
1 Top 5 featuresfrom region 1
RMS CH2 05ndash30HzSample entropy CH2 05ndash4HzRMS CH2 4ndash8HzRMS CH2 05ndash4HzSample entropy CH1 05ndash4Hz
2 Top 5 featuresfrom region 2
RMS CH16 05ndash30HzRMS CH16 05ndash4HzRMS CH12 12ndash30HzRMS CH16 12ndash30HzRMS CH16 4ndash8Hz
3 Top 5 featuresfrom region 3
RMS CH3 05ndash30HzRMS CH3 05ndash4HzRMS CH4 4ndash8HzMed Freq CH3 05ndash4HzRMS CH4 05ndash30Hz
4 Top 5 featuresfrom region 4
RMS CH18 4ndash8HzRMS CH18 05ndash30HzRMS CH17 05ndash30HzRMS CH17 05ndash4HzRMS CH18 05ndash4Hz
5 Top 5 featuresfrom region 5
RMS CH21 05ndash30HzRMS CH21 4ndash8HzRMS CH21 12ndash30HzRMS CH21 8ndash12HzRMS CH21 05ndash4Hz
In summary PCA makes a very strong case for the use ofroot mean square on different channels and frequency bands
CH2 05ndash30 RMS
CH2 05ndash4 Samp En
CH2 4ndash8 RMS
CH2 05ndash4 RMS
CH1 05ndash4 SampEn
CH16 05ndash30 RMS
CH16 05ndash4 RMSCH12 12ndash30 RMS
CH16 12ndash30 RMSCH16 4ndash8 RMS
CH3 05ndash30 RMS
CH3 05ndash4 RMSCH4 4ndash8 RMS
CH3 05ndash4 MFreq
CH4 05ndash30 RMS
CH18 4ndash8 RMS
CH18 05ndash30 RMSCH17 05ndash30 RMS
CH17 05ndash4 RMSCH18 05ndash4 RMS
CH21 05ndash30 RMS
CH21 4ndash8 RMS
CH21 12ndash30 RMSCH21 8ndash12 RMS
CH21 05ndash4 RMS
minus06 minus04 minus02 0 02 04 06
Principle component one
Prin
cipl
e com
pone
nt tw
o
minus06
minus04
minus02
0
02
04
06
Figure 1 PCA for RMS feature discrimination
The features extracted using the generalised and region-by-region approach will be used to evaluate the capabilities ofseveral classifiers considered in this study
514 SyntheticMinorityOversampling Thenumber of obser-vations in this study is relatively low and it would be use-ful to compare an oversampled dataset with the original data-set In order to address this issue it is necessary to resamplethe CHB-MIT dataset In this study the classes are balancedHowever resampling is used to generate additional observa-tions for both seizure and nonseizure records
Several studies have shown that the synthetic minorityoversampling technique (SMOTE) has effectively solved theclass skew problem [79ndash84] In this study SMOTE has beenutilised to oversample both the seizure and nonseizure classesin order to generate new synthetic records (observations)along line segments joining the k-classnearest neighboursThis forces the decision tree region of the minority class tobecome more general and ensures that the classifier createslarger and less specific decision regions rather than smallerspecific regions In [85] the authors indicated that this
8 BioMed Research International
Table 5 Summary of classifiers considered in this study
Classifiers Features Validation Sample sizesDensity-based Variance Holdout cross-validation
Original (171seizures171nonseizures)
Linear discriminant classifier (LDC)Quadratic discriminant classifier (QDC) Root mean squares 119896-fold cross-validationUncorrelated normal density classifier (UDC)Linear and polynomial-based Skewness
SensitivityspecificityPolynomial classifier (POLYC) KurtosisLogistic classifier (LOGLC) Peak frequency
SMOTE (342seizures342nonseizures)
Nonlinear-basedMedian frequency Receiver operator curve119870-class nearest neighbour classifier (KNNC)
Decision tree classifier (TREEC)Parzen classifier (PARZENC) Sample entropy Area under the curveSupport vector classifier (SVC)
approach is an accepted technique for solving the problemrelated to unbalanced datasets and in this study the validityof this technique to increase the number of observations forboth seizure and nonseizure classes is evaluated
515 Classification Following an analysis of the literaturethe study in this paper adopts simple yet powerful algorithmsas shown in Table 5
These include the linear discriminant classifier (LDC)quadratic discriminant classifier (QDC) uncorrelated nor-mal density-based classifier (UDC) polynomial classifier(POLYC) logistic classifier (LOGLC) k-class nearest neigh-bour (KNNC) decision tree (TREEC) Parzen classifier(PARZENC) and the support vector machine (SVC) [86]The linear quadratic and uncorrelated normal density-basedclassifiers are all density-based classifiersTheLDC is particu-larly useful when two classes are not normally distributed andwhere monotonic transformations of posterior probabilitieshelp to generate discriminant functions The QDC assumesthat the classes are normally distributed with class specificcovariance matrices thus allowing a set of optimal discrim-inant functions to be obtained The UDC works in a similarway to the QDC classifier using computation of a quadraticclassifier between the classes by assuming normal densitieswith uncorrelated features The QDC takes decisions byassuming different normal distributions of data that lead toquadratic decision boundaries
6 Evaluation
This section presents the classification results for seizure andnonseizure records using the CHB-MIT database A featureset is extracted from the raw signal frequency bands delta(120575 05 le 119891 le 4Hz) theta (120579 4 le 119891 le 8Hz) alpha (1205728 le 119891 le 12Hz) and beta (120573 12 le 119891 le 25Hz) are used withan 80 holdout technique and k-fold cross-validation Theinitial evaluation provides a base line for comparison againstall subsequent evaluations considered in this section
Table 6 Classifier performance results for top 20 uncorrelatedfeatures
Classifier Sensitivity Specificity AUCLDC 70 83 54QDC 65 92 62UDC 39 95 65POLYC 70 83 83LOGLC 79 86 89KNNC 84 85 91TREEC 78 80 86PARZENC 61 86 54SVC 79 86 88
61 Results Using Top Twenty Uncorrelated Features RankedUsing LDA Backward Search Feature Selection In this evalu-ation the top twenty uncorrelated features are extracted fromeach of the frequency bands within each of the EEG channelsand used to train and test nine classifiers The performancefor each classifier is evaluated using the sensitivity specificitymean error standard deviation and AUC values with 100simulations that use randomly selected training and testingsets
611 Classifier Performance The first evaluation uses all theseizure and nonseizure blocks from all subjects in the CHB-MIT dataset (171 seizures and 171 nonseizures) Table 6 showsthe mean averages obtained over 100 simulations for thesensitivity specificity and AUC
As shown in Table 6 the sensitivities (seizure) in thisinitial test are lower for all classifiersThis is interesting giventhat the number of seizureand nonseizure blocks is equalOne possible reason for this is that the ictal length acrossthe 171 records was 60 seconds However in the CHB-MITrecords ictal periods ranged between 6 and 752 seconds It ispossible that some ictal blocks resemble nonseizure recordsresulting inmisclassification (particularly blocks that containshorter runs of ictal data) Table 7 compares the holdout
BioMed Research International 9
Table 7 Cross-validation results for top 20 uncorrelated features
Classifiers 80 holdout 100 repetitions Cross-validation 5-fold 1 repetition Cross-validation 5-fold 100 repetitionsMean error SD Mean error Mean error SD
LDC 02386 00506 02427 02398 00107QDC 02179 00434 02164 02171 00064UDC 03299 00431 03304 03310 00035POLYC 02388 00507 02544 02385 00107LOGLC 01771 00489 01813 01734 00085KNNC 01527 00401 01696 01674 00148TREEC 02071 00510 01959 02003 00157PARZENC 02651 00493 02544 02640 00100SVC 01752 00416 01608 01728 00072
0 01 02 03 04 05 06 07 08 09 10
02
04
06
08
1
False negative (FNs)
False
pos
itive
s (FP
s)
Bayes-normal-1Bayes-normal-2Bayes-normal-UPolynomial classifierLogistic
3-NNTREECPARZENCSVM
Figure 2 Received operator curve for top 20 uncorrelated features
results with the k-fold cross-validation technique using 5-foldand one and 100 iterations respectivelyThe results show thatall techniques are able to achieve a classification error lowerthan the base-rate error of 50 (ie 171342)
Despite a reasonably low error rate using the hold-out technique the k-fold cross-validation results slightlyimproved the error rates for some classifiers However theseresults were not statistically significant
612 Model Selection The receiver operator characteristic(ROC) curve shows the cut-off values for the false-negativeand false-positive rates Figure 2 indicates that several of theclassifiers performed reasonably well The AUC values inTable 3 support these findings with good accuracy values forthe LOGLC and KNNC classifiers
62 Results Using Top Five Uncorrelated Features RankedUsing LDA Backward Search Feature Selection from Five Head
Table 8 Classifier performance results from top five uncorrelatedfeatures from five head regions
Classifier Sensitivity Specificity AUCLDC 78 88 55QDC 84 86 60UDC 51 91 70POLYC 78 88 89LOGLC 82 84 90KNNC 88 88 93TREEC 82 81 89PARZENC 81 93 61SVC 85 86 90
Regions In the second evaluation the top five uncorrelatedfeatures extracted from five main regions across the headwere used to determine whether the detection of seizurescould be improved Again the performance for each classifierwas evaluated using the sensitivity specificity mean errorstandard deviation and AUC values with 100 simulationsand randomly selected training and testing sets for eachsimulation
621 Classifier Performance As shown in Table 8 the sensi-tivities (seizure) for most of the algorithms improved includ-ing the specificities values The AUC results also showedimprovements for several of the classifiers with 93 achievedby the KNNC classifier This is encouraging given that sensi-tivities are more important in this research than specificitiesFrom the previous results we found a 4 increase in sensi-tivities a 3 increase in specificities and a 2 increase inthe performance of the KNNC classifier with other classifiersimproving with similar increases
Again the results in Table 9 show that the global meanerror has decreased by 3 using the holdout technique Thek-fold technique was able to decrease the global error by6 compared with the previous evaluation suggesting thatusing a region-by-region approach improves discriminationbetween seizureand nonseizureevents
Overall the mean errors produced using all of the vali-dation techniques are significantly lower than the expectederror which is 171342 that is 50
10 BioMed Research International
Table 9 Cross-validation results from top five uncorrelated features from five regions
Classifiers 80 holdout 100 repetitions Cross-validation 5-fold 1 repetition Cross-validation 5-fold 100 repetitionsMean error SD Mean error Mean error SD
LDC 01690 00419 01696 01675 00120QDC 01493 00449 01462 01509 00088UDC 02926 00440 02836 02940 00037POLYC 01690 00419 01871 01709 00091LOGLC 01734 00413 01696 01648 00120KNNC 01203 00339 00936 01135 00101TREEC 01835 00460 01988 01784 00202PARZENC 01328 00433 01316 01325 00146SVC 01460 00378 01316 01411 00101
0 01 02 03 04 05 06 07 08 09 10
02
04
06
08
1
False negatives (FNs)
False
pos
itive
s (FP
s)
Bayes-normal-1Bayes-normal-2Bayes-normal-UPolynomial classifierLogistic
3-NN
SVM
TREECPARZENC
Figure 3 Received operator curve for top five uncorrelated featuresfrom five head regions
622 Model Selection Again the ROC curve shows thecut-off values for the false-negative and false-positive ratesFigure 3 indicates that the performance of several classifiersimproved The AUC values in Table 8 support these findingswith the KNNC classifier showing a 2 increase in perfor-mance
63 Results Using Top Twenty Uncorrelated Features RankedUsing LDA Backward Search Feature Selection and Oversam-pledUsing SMOTE To test whether a larger number of obser-vations can improve on the previous set of results the 171seizure and 171 nonseizure records were oversampled usingthe SMOTE technique The SMOTE algorithm generatessynthetic samples to increase the overall size of the dataset(in this case it doubles the number of seizureand nonseizure
Table 10 Classifier performance results for top 20 uncorrelatedfeatures using SMOTE
Classifier Sensitivity Specificity AUCLDC 72 84 54QDC 64 94 64UDC 38 95 66POLYC 72 84 85LOGLC 82 88 92KNNC 90 91 96TREEC 87 88 92PARZENC 75 92 57SVC 82 89 91
records) As with the first evaluation the top 20 uncorrelatedfeatures were used with oversampling to determine whetherthe overall detection rate could be improved
631 Classifier Performance Table 10 indicates that thesensitivities and specificities for some of the algorithmsimproved Furthermore the AUC results showed improve-ments with the KNNC classifier achieving 96 The resultsalso show that the AUC values for several other algorithmsincreased From the previous set of results (region-by-region) we found a 2 increase in sensitivities 3 increasein specificities and 3 increase in the performance of theKNNC classifier
The results in Table 11 show that the global mean errorhas not improved on the previous evaluation However thek-fold technique was able to decrease the global error by 4compared with the previous evaluation indicating that usinga larger number of observations improves the discriminationbetween seizureand nonseizurerecords
The results show that using the 80 holdout methodseveral classifiers produced better results Overall the globalmean errors were significantly lower than the expected errorwhich is 342684 that is 50
632 Model Selection The ROC curve again shows thecut-off values for the false-negative and false-positive ratesFigure 4 shows an improvement on the previous set of results
BioMed Research International 11
Table 11 Cross-validation results for top 20 uncorrelated features using SMOTE
Classifiers 80 holdout 100 repetitions Cross-validation 5-fold 1 repetition Cross-validation 5-fold 100 repetitionsMean error SD Mean error Mean error SD
LDC 02174 00328 02237 02158 00073QDC 02062 00286 02003 02037 00055UDC 03322 00297 03333 03314 00020POLYC 02174 00328 02266 02148 00056LOGLC 01498 00285 01477 01469 00048KNNC 00959 00232 00599 00614 00074TREEC 01234 00295 01360 01227 00115PARZENC 01620 00420 01462 01589 00130SVC 01428 00292 01418 01412 00055
0 01 02 03 04 05 06 07 08 09 10
02
04
06
08
1
False negatives (FNs)
False
pos
itive
s (FP
s)
Bayes-normal-1Bayes-normal-2Bayes-normal-UPolynomial classifierLogistic
3-NN
SVM
TREECPARZENC
Figure 4 Received operator curve for top 20 uncorrelated featuresusing SMOTE
64 Results Using Top Five Uncorrelated Features RankedUsing LDA Backward Search Feature Selection from FiveRegions and Oversampled Using SMOTE In the final evalu-ation the top five uncorrelated features extracted from fivemain regions across the head were used with oversamplingto determine whether the overall detection rate could beimproved
641 Classifier Performance Table 12 indicates that the sensi-tivities and specificities for the algorithms improved Inaddition the AUC results showed a 2 increase on the previ-ous evaluation with the KNNC achieving 98 accuracy Theresults show that the AUC values for several other classifiersincreased From the previous set of results we found a 3increase in sensitivities 3 increase in specificities and a 2increase in performance for the KNNC classifier
Table 12 Classifier performance results for top five uncorrelatedfeatures ranked using LDA backward search feature selection fromfive regions and oversampled using SMOTE
Classifier Sensitivity Specificity AUCLDC 82 90 56QDC 87 92 63UDC 52 91 70POLYC 82 90 92LOGLC 88 87 94KNNC 93 94 98TREEC 90 90 94PARZENC 96 98 82SVC 90 89 93
The results in Table 13 show that the global mean errorhas decreased by 3 using the holdout technique The k-fold technique was able to decrease the global error by afurther 3 compared with the previous evaluation Thisindicates that using a region-by-region approach and alarger dataset is better at discriminating between seizureandnonseizureevents
The final set of results shows that using the 80 holdoutmethod several classifiers produced better results The bestresult was obtained in the final evaluation by the KNNCclassifier with 93 for sensitivity 94 for specificity 98 forAUC and 6 global error
642Model Selection TheROCcurve in this final evaluationis illustrated in Figure 5 and it shows a clear improvementwhen compared with the previous set of evaluations
7 Discussion
The study has focused on discriminating between seizureand nonseizure EEG records across a group of 24 subjectsin contrast to earlier studies that have focused on seizuredetection in single individuals The classifiers were trainedusing all 24 patients allowing classification to be generalisedacross the whole population contained in the CHB-MITdatabase To achieve this features from all the channels thatcapture the EEGwere used In the initial classification results
12 BioMed Research International
Table 13 Cross-validation results for top five uncorrelated features ranked using LDA backward search feature selection from five regionsand oversampled using SMOTE
Classifiers 80 holdout 100 repetitions Cross-validation 5-fold 1 repetition Cross-validation 5-fold 100 repetitionsMean error SD Mean error Mean error SD
LDC 01359 00291 01374 01308 00044QDC 01060 00267 01023 01082 00043UDC 02835 00304 02851 02881 00025POLYC 01359 00291 01301 01337 00049LOGLC 01260 00262 01213 01182 00072KNNC 00661 00198 00278 00311 00049TREEC 00974 00319 01082 00969 00117PARZENC 00321 00170 00336 00341 00054SVC 01072 00255 01067 01034 00063
0 01 02 03 04 05 06 07 08 09 10
02
04
06
08
1
False negatives (FNs)
False
pos
itive
s (FP
s)
Bayes-normal-1Bayes-normal-2Bayes-normal-UPolynomial classifierLogistic
3-NN
SVM
TREECPARZENC
Figure 5 Received operator curve for top five uncorrelated featuresranked using LDA backward search feature selection from fiveregions and oversampled using SMOTE
using the top 20 uncorrelated features from the whole brainwere extracted from 805 possible features using the lineardiscriminant analysis backward search technique to rankfeatures (this technique was adopted because it produced thebiggest AUC value 91 during the feature-ranking phase)This approach achieved reasonably good results using theKNNC classifier with 84 for sensitivity 85 for specificityand 91 for the AUC with a global error of 15
Interestingly the features used in this initial evaluationinvolved channels from the eight lobes of the brain but notthe channels spreading across the centre of the scalp (F3-C3 C3-P3 FZ-CZ CZ-PZ F4-C4 and C4-P4) This impliedthat rather than having generalised seizures across the wholebrain a majority of focal seizures occurred in each of the
lobes Unlike previous studies that used the BONN dataset[43] which only contains one channel or the FRE datasetthat contains six channels and identifies focal and extra focalchannels the CHB-MIT database used in this study contains23 channels with no information on the seizure type orlocation
Using the top five uncorrelated features from EEG chan-nels specific to the five main regions of the head improvedthe sensitivities and specificities while producing high AUCvalues The best classification algorithm was the KNNC clas-sifier which achieved 88 for sensitivity 88 for specificityand an AUC value of 93 with a 12 global error This wasfollowed closely by the SVC classifier which achieved 85 forsensitivity 86 for specificity and an AUC value of 90 witha 14 global error
The SMOTE technique was used to increase the numberof seizureand nonseizure records and again to determinewhether the previous results could be improved The top 20uncorrelated features from the whole brain were used Thisimproved the sensitivity specificity and the AUC resultsThebest classification algorithm was the KNNC classifier whichachieved 90 for sensitivity 91 for specificity and an AUCvalue of 96 with 9 global error We found that using theSMOTE technique and five uncorrelated features from EEGchannels specific to the fivemain regions of the head providedfurther improved sensitivity specificity andAUC resultsThebest classification algorithm was again the KNNC classifierwhich achieved 93 for sensitivity 94 for specificity andan AUC value of 98 with 6 global error
Comparing our results with other studies we find thatShoeb [62] produced a better sensitivity value (96) thanthose reported in this study However their approach utiliseda SVM classifier trained and tested on an individual patientand was not concerned with the generalisation of seizuresacross a bigger population group Consequently the 93 sen-sitivity value produced in this paper appears to be extremelygood given that our classifiers were trained and tested on datafrom 24 different patients not just on one In a similar studyNasehi and Pourghassem [64] used a neural network andreported a sensitivity value of 98 which again is higher thanthe results reported in this study However as with the work
BioMed Research International 13
Table 14 Seizure detection studies and classification results
Author Year Dataset Classifier Patients Sensitivity () Specificity () Accuracy () FPRhAarabi et al [11] 2006 AMI BPNN 6 9100 9500 9300 117
Acharya et al [68] 2012 BONNPNN SVMC45 BCFSC KNN
GMM
10 944ndash994 911ndash100 881ndash959 mdash
Bao et al [87] 2008 BONN PNN 10 mdash mdash 71ndash968 mdashChandaka et al [88] 2009 BONN SVM 10 9200 100 9596 mdashKannathal et al [38] 2005 BONN ANFIS 10 9149 9302 922 mdashKumar et al [42] 2010 BONN EN RBNN 10 mdash mdash 945 mdashKumari and Jose [89] 2011 BONN SVM 5 10000 100 100 0Acharya et al [44] 2012 BONN SVM 10 9438 9323 809ndash861 mdashPolat and Gunes [90] 2007 BONN DTC 10 9940 9931 9872 mdashPolat and Gunes [69] 2008 BONN C45 10 9949 9912 9932 mdashSong and Lio [91] 2010 BONN BPNN ELM 10 9726 9877 9567 mdashSrinivasan et al [43] 2007 BONN PNN EN mdash mdash 100Subasi [92] 2007 BONN MPNN ME 10 9500 94 945 mdashSubasi and Gursoy [93] 2010 BONN SVM 99-100 985ndash100 9875ndash100 mdashUbeyli [66] 2008 BONN SVM 10 9925 100 993 mdash
Ubeyli [67] 2009 BONNPNN SVMMPNN
CNN MEMME RNN
10 9920 9978 992 mdash
Yuan et al [46] 2011 BONN SVM BPNNELM 10 9250 96 96 mdash
Zheng et al [94] 2012 BXH SVM 7 4423 mdash mdash 16ndash109Khan et al [63] 2012 CHBMIT LDA 5 8360 100 918Nasehi and Pourghassem [64] 2013 CHBMIT IPSONN 23 9800 mdash mdash 0125Shoeb [62] 2009 CHBMIT SVM 24 9600 mdash mdash 008Acir and Guzelis [75] 2004 DEU SVM 7 9030 mdash mdashRasekhi et al [76] 2013 EUR SVM 10 7390 mdash mdash 015Park et al [72] 2011 FRE SVM 18 925ndash975 mdash mdash 02ndash029
Patel et al [74] 2009 FRE SVM LDAQDA MDA 21 909ndash942 595ndash779 765ndash877 mdash
Patnaik and Manyam [73] 2008 FRE BPNN 21 9129 9919 mdash mdashWilliamson et al [71] 2011 FRE SVM 21 9080 mdash mdash 0094Yuan et al [18] 2012 FRE ELM 21 9385 9489 949 035Bao et al [87] 2008 JPH PNN 12 mdash mdash 9407 mdashSaab and Gotman [10] 2005 MON BC 7600 mdash mdash 034Grewal and Gotman [95] 2005 MON2 BC 16 8940 mdash mdash 022DrsquoAlessandro et al [96] 2005 PEN amp BON PNN 2 10000 mdash mdash 11Sorensen et al [97] 2010 RIG SVM 6 778ndash100 mdash mdash 016ndash531Acharya et al [68] 2012 SGR amp BONN PNN SVM 21 + 10 mdash mdash 999 mdashBuhimschi et al [22] 1998 Unknown PNN 4 6250 9047 mdash 02775Subasi [17] 2006 Unknown DFNN 5 9310 928 931 mdash
of Shoeb the classifiers were trained and tested on specificpatients
In comparison with other studies that adopted a similarapproach to our study our approach produced better overallresults For instance in [63] Khan et al report an 836specificity value while Patel et al [74] report 94 for sensitiv-ity 779 for specificity and 877 for overall accuracy Yuanet al [18] report 9172 for sensitivity 9489 for specificityand 949 for accuracyWhile Aarabi et al [11] Acharya et al[44] Kannathal et al [38] and Patnaik and Manyam [73] all
reported similar results The results found in this paper canbe compared in more detail with the papers listed in Table 14
Our study produced better results than similar studiesreported in the literatureWhere this is not the case a patient-specific seizure detector was used and is therefore noncom-parable
This work has potential future clinical applications in theinvestigation of patients with suspected seizure disorders andmay be useful in the assessment of patients with nonepilep-tic attack disorder (NEAD) Introducing automated seizure
14 BioMed Research International
detection technologies could help increase capacity withinhealthcare systems such as the UK National Health Service(NHS) which currently suffers from a chronic shortage oftrained clinical neurophysiologists to interpret EEGs [98]Tele-EEG reporting has previously been suggested as asolution but this carries increased costs and there remainconcerns over data security [99] Automated seizure detec-tion may therefore be a viable solution following furtherwork aimed at further improving accuracy
8 Conclusions and Future Work
Epilepsy is one of the most common neurological conditionsand one of the least understoodThe seizures that characteriseepilepsy are frequently unannounced and affect a suffererrsquosquality of life as well as increasing the risk of injury and insome cases death A strong body of evidence has suggestedthat these epileptic seizures can be predicted by analysis ofEEG recordings
Within a supervised-learning paradigm this paper util-ises EEG signals to classify seizure and nonseizure recordsMost of the previous work in this area has focused on detect-ing seizures using data from individual patients In this paperhowever the focus has been to generalise seizure detectionacross a group of subjects from the CHB-MIT database
A rigorous methodical approach to data preprocessingwas undertaken and features were extracted from the rawEEG signals using several feature-ranking techniques Inthe first evaluation the top twenty uncorrelated featuresextracted from each of the frequency bands within the EEGchannels were used to train nine classifiers AUC values ashigh as 91 were achieved with sensitivity and specificity ashigh as 85 when using the KNNC classifier In the secondevaluation the top five uncorrelated features were extractedfrom five main regions across the head and again were usedto train nine classifiers This approach improved the AUCsensitivities and specificities for several of the classifiers Thehighest result achieved with the KNNC classifier was 93for the AUC 88 for sensitivity and 88 for specificity Thiswas closely followed by the SVC classifier where theAUCwas90 sensitivity was 85 and specificity was 86
There were concerns that the number of observations inthe CHB-MIT database was small To test whether a largerdataset containing synthetic data would yield better resultsthe original CHB-MIT dataset was oversampled using theSMOTE technique to double the size of both 37 classes(342 seizures and 342 nonseizures) The same evaluationswere performed again using the oversampled dataset and thetop 20 uncorrelated sets of features including the top fiveuncorrelated features from the five main regions of the brainThis technique improved the results with an AUC of 96a sensitivity of 80 and a specificity of 91 for the KNNCclassifier when using the 20 uncorrelated features Howeverthe best results were when the top five uncorrelated featuresfrom the five main regions were used on the oversampleddataset with an AUC value of 98 a sensitivity of 93 aspecificity of 94 and a global error of 6
Future work will include the use of regression analysisusing a larger number of observationsThiswould help to pre-dict the early signs of a seizure not just when the seizure hap-pens Another direction of research will include the evalua-tion of different parameter adjustment settings In addi-tion more advanced classification algorithms and tech-niques will be considered including advanced artificial neu-ral network architectures such as higher order and spikingneural networks The investigation and comparison of fea-tures such as fractal dimension and cepstrum analysis auto-correlation zero crossing and correlation dimension havealso not been performed
More importantly continuous long-term EEG recordingsof several hours for one subject (rather than 60-secondblocks) will be investigated in future work This will includethe detection of different types of seizure activity and howwell classifiers can differentiate between them
Overall the study demonstrates that classification algo-rithms provide an interesting line of enquiry when separatingseizure and nonseizure records
Conflict of Interests
The authors declare that there is no conflict of interestsregarding the publication of this paper
References
[1] R Hopfengartner B S Kasper W Graf et al ldquoAutomaticseizure detection in long-term scalp EEG using an adaptivethresholding technique a validation study for clinical routinerdquoClinical Neurophysiology vol 125 no 7 pp 1346ndash1352 2014
[2] T Maiwald M Winterhalder R Aschenbrenner-Scheibe HU Voss A Schulze-Bonhage and J Timmer ldquoComparisonof three nonlinear seizure prediction methods by means ofthe seizure prediction characteristicrdquo Physica D NonlinearPhenomena vol 194 no 3-4 pp 357ndash368 2004
[3] P R Carney S Myers and J D Geyer ldquoSeizure predictionmethodsrdquo Epilepsy and Behavior vol 22 pp S94ndashS101 2011
[4] F Mormann R G Andrzejak C E Elger and K LehnertzldquoSeizure prediction the long and winding roadrdquo Brain vol 130no 2 pp 314ndash333 2007
[5] A H Shoeb Application of machine learning to epileptic seizureonset detection and treatment [PhD thesis] MIT Division ofHealth Sciences and Technology Harvard University 2009
[6] M Libenson Practical Approach to ElectroencephalographySaunders 2009
[7] E C Ifeachor and B W Jervis Digital Signal Processing APractical Approach Prentice Hall New York NY USA 2002
[8] J van Zaen M M Murray R A Meuli and J-M VesinldquoAdaptive filtering methods for identifying cross-frequencycouplings in human EEGrdquo PLoS ONE vol 8 no 4 Article IDe60513 2013
[9] P LeVan E Urrestarazu and J Gotman ldquoA system for auto-matic artifact removal in ictal scalp EEG based on independentcomponent analysis and Bayesian classificationrdquo Clinical Neu-rophysiology vol 117 no 4 pp 912ndash927 2006
[10] M E Saab and J Gotman ldquoA system to detect the onset ofepileptic seizures in scalp EEGrdquo Clinical Neurophysiology vol116 no 2 pp 427ndash442 2005
BioMed Research International 15
[11] AAarabi FWallois andRGrebe ldquoAutomated neonatal seizuredetection a multistage classification system through featureselection based on relevance and redundancy analysisrdquo ClinicalNeurophysiology vol 117 no 2 pp 328ndash340 2006
[12] M E Saab and J Gotman ldquoA system to detect the onset ofepileptic seizures in scalp EEGrdquo Clinical Neurophysiology vol116 no 2 pp 427ndash442 2005
[13] S Blanco S Kochen O A Rosso and P Salgado ldquoApplyingtime-frequency analysis to seizure EEG activityrdquo IEEE Engineer-ing in Medicine and Biology Magazine vol 16 no 1 pp 64ndash711997
[14] D Flanagan R Agarwal Y HWang and J Gotman ldquoImprove-ment in the performance of automated spike detection usingdipole source features for artefact rejectionrdquoClinical Neurophys-iology vol 114 no 1 pp 38ndash49 2003
[15] B R Greene S Faul W P Marnane G Lightbody IKorotchikova and G B Boylan ldquoA comparison of quantitativeEEG features for neonatal seizure detectionrdquo Clinical Neuro-physiology vol 119 no 6 pp 1248ndash1261 2008
[16] C-M Wang C-M Zhang J-Z Zou and J Zhang ldquoPerfor-mance evaluation for epileptic electroencephalogram (EEG)detection by using NeymanndashPearson criteria and a supportvector machinerdquo Physica A Statistical Mechanics and its Appli-cations vol 391 no 4 pp 1602ndash1609 2012
[17] A Subasi ldquoAutomatic detection of epileptic seizure usingdynamic fuzzy neural networksrdquo Expert Systems with Applica-tions vol 31 no 2 pp 320ndash328 2006
[18] Q Yuan W Zhou Y Liu and J Wang ldquoEpileptic seizuredetection with linear and nonlinear featuresrdquo Epilepsy andBehavior vol 24 no 4 pp 415ndash421 2012
[19] B Moslem B Karlsson M O Diab M Khalil and C MarqueldquoClassification performance of the frequency-related parame-ters derived from uterine EMG signalsrdquo in Proceedings of theInternational Conference of the IEEE Engineering in Medicineand Biology Society pp 3371ndash3374 Boston Mass USA 2011
[20] W L Maner and R E Garfield ldquoIdentification of human termand preterm labor using artificial neural networks on uterineelectromyography datardquo Annals of Biomedical Engineering vol35 no 3 pp 465ndash473 2007
[21] MHassan J Terrien CMarque and B Karlsson ldquoComparisonbetween approximate entropy correntropy and time reversibil-ity application to uterine electromyogram signalsrdquo MedicalEngineering and Physics vol 33 no 8 pp 980ndash986 2011
[22] C Buhimschi M B Boyle G R Saade and R E GarfieldldquoUterine activity during pregnancy and labor assessed bysimultaneous recordings from themyometrium and abdominalsurface in the ratrdquo American Journal of Obstetrics and Gynecol-ogy vol 178 no 4 pp 811ndash822 1998
[23] H Leman C Marque and J Gondry ldquoUse of the electro-hysterogram signal for characterization of contractions duringpregnancyrdquo IEEE Transactions on Biomedical Engineering vol46 no 10 pp 1222ndash1229 1999
[24] C K Marque J Terrien S Rihana and G Germain ldquoPretermlabour detection by use of a biophysical marker the uterineelectrical activityrdquo BMC Pregnancy and Childbirth vol 7 sup-plement 1 article S5 2007
[25] M O Diab A El-Merhie N El-Halabi and L Khoder ldquoClassi-fication of uterine EMG signals using supervised classificationmethodrdquo Biomedical Science and Engineering vol 3 no 9 pp837ndash842 2010
[26] P Carre H Leman C Fernandez and C Marque ldquoDenoisingof the uterine EHGby an undecimatedwavelet transformrdquo IEEE
Transactions on Biomedical Engineering vol 45 no 9 pp 1104ndash1113 1998
[27] W L Maner L B MacKay G R Saade and R E GarfieldldquoCharacterization of abdominally acquired uterine electricalsignals in humans using a non-linear analyticmethodrdquoMedicalamp Biological Engineering amp Computing vol 44 no 1-2 pp 117ndash123 2006
[28] W L Maner R E Garfield H Maul G Olson and G SaadeldquoPredicting term and preterm delivery with transabdominaluterine electromyographyrdquo Obstetrics and Gynecology vol 101no 6 pp 1254ndash1260 2003
[29] S Sanei and J A Chambers EEG Signal Processing Wiley 2007[30] A Aarabi R Fazel-Rezai and Y Aghakhani ldquoA fuzzy rule-
based system for epileptic seizure detection in intracranialEEGrdquo Clinical Neurophysiology vol 120 no 9 pp 1648ndash16572009
[31] A T Tzallas P S Karvelis C D Katsis D I Fotiadis SGiannopoulos and S Konitsiotis ldquoA method for classificationof transient events in EEG recordings application to EpilepsyDiagnosisrdquo Methods of Information in Medicine vol 45 no 6pp 610ndash621 2006
[32] T Cecchin R Ranta L Koessler O Caspary H Vespignaniand L Maillard ldquoSeizure lateralization in scalp EEG usingHjorth parametersrdquo Clinical Neurophysiology vol 121 no 3 pp290ndash300 2010
[33] N Wang and M R Lyu ldquoExploration of instantaneous ampli-tude and frequency features for epileptic seizure predictionrdquoin Proceedings of the 12th IEEE International Conference onBioInformatics and BioEngineering (BIBE rsquo12) pp 292ndash297November 2012
[34] N Paivinen S Lammi A Pitkanen J Nissinen M Penttonenand T Gronfors ldquoEpileptic seizure detection a nonlinearviewpointrdquo Computer Methods and Programs in Biomedicinevol 79 no 2 pp 151ndash159 2005
[35] A A Abdul-Latif I Cosic D K Kimar and B Polus ldquoPowerchanges of EEG signals associated with muscle fatigue the rootmean square analysis of EEG bandsrdquo in Proceedings of IEEEIntelligent Sensors Sensor Networks and Information ProcessingConference (ISSNIP rsquo04) pp 531ndash534 2004
[36] K Patel C-P Chua S Faul and C J Bleakley ldquoLow powerreal-time seizure detection for ambulatory EEGrdquo in Proceedingsof the 3rd International Conference on Pervasive ComputingTechnologies for Healthcare (PCTHealth rsquo09) April 2009
[37] L M Patnaik and O K Manyam ldquoEpileptic EEG detectionusing neural networks and post-classificationrdquoComputerMeth-ods and Programs in Biomedicine vol 91 no 2 pp 100ndash1092008
[38] N Kannathal M L Choo U R Acharya and P K SadasivanldquoEntropies for detection of epilepsy in EEGrdquoComputerMethodsand Programs in Biomedicine vol 80 no 3 pp 187ndash194 2005
[39] L Diambra J C B de Figueiredo and C P Malta ldquoEpilepticactivity recognition in EEG recordingrdquo Physica A StatisticalMechanics and its Applications vol 273 no 3-4 pp 495ndash5051999
[40] K M Kelly D S Shiau R T Kern et al ldquoAssessment of ascalp EEG-based automated seizure detection systemrdquo ClinicalNeurophysiology vol 121 no 11 pp 1832ndash1843 2010
[41] L D Iasemidis ldquoEpileptic seizure prediction and controlrdquo IEEETransactions on Biomedical Engineering vol 50 no 5 pp 549ndash558 2003
16 BioMed Research International
[42] S P Kumar N Sriraam P G Benakop and B C JinagaldquoEntropies based detection of epileptic seizures with artificialneural network classifiersrdquo Expert Systems with Applicationsvol 37 no 4 pp 3284ndash3291 2010
[43] V Srinivasan C Eswaran and N Sriraam ldquoApproximateentropy-based epileptic EEG detection using artificial neuralnetworksrdquo IEEE Transactions on Information Technology inBiomedicine vol 11 no 3 pp 288ndash295 2007
[44] U R Acharya F Molinari S V Sree S Chattopadhyay K HNg and J S Suri ldquoAutomated diagnosis of epileptic EEG usingentropiesrdquo Biomedical Signal Processing and Control vol 7 no4 pp 401ndash408 2012
[45] H Ocak ldquoAutomatic detection of epileptic seizures in EEGusing discrete wavelet transform and approximate entropyrdquoExpert Systems with Applications vol 36 no 2 pp 2027ndash20362009
[46] Q YuanWZhou S Li andDCai ldquoEpileptic EEG classificationbased on extreme learning machine and nonlinear featuresrdquoEpilepsy Research vol 96 no 1-2 pp 29ndash38 2011
[47] T Gandhi B K Panigrahi and S Anand ldquoA comparative studyof wavelet families for EEG signal classificationrdquo Neurocomput-ing vol 74 no 17 pp 3051ndash3057 2011
[48] I Omerhodzic S Avdakovic A Nuhanovic and K DizdarevicldquoEnergy distribution of EEG signals EEG signal wavelet-neuralnetwork classifierrdquo World Academy of Science Engineering andTechnology vol 37 pp 1240ndash1245 2010
[49] R Panda P S Khobragade P D Jambhule S N Jengthe PR Pal and T K Ghandhi ldquoClassification of EEG signal usingwavelet transform and support vector machine for epilepticseizure dictionrdquo in Proceedings of the International Conferenceon Systems in Medicine and Biology pp 405ndash408 KharagpurIndia December 2010
[50] B Litt and J Echauz ldquoPrediction of epileptic seizuresrdquo TheLancet Neurology vol 1 no 1 pp 22ndash30 2002
[51] U R Acharya S V Sree G Swapna R J Martis and J S SurildquoAutomated EEG analysis of epilepsy a reviewrdquo Knowledge-Based Systems vol 45 pp 147ndash165 2013
[52] A Aarabi and B He ldquoA rule-based seizure prediction methodfor focal neocortical epilepsyrdquoClinical Neurophysiology vol 123no 6 pp 1111ndash1122 2012
[53] H Adeli S Ghosh-Dastidar and N Dadmehr ldquoA wavelet-chaos methodology for analysis of EEGs and EEG subbands todetect seizure and epilepsyrdquo IEEE Transactions on BiomedicalEngineering vol 54 no 2 pp 205ndash211 2007
[54] N Kannathal U R Acharya C M Lim and P K SadasivanldquoCharacterization of EEGmdasha comparative studyrdquo ComputerMethods and Programs in Biomedicine vol 80 no 1 pp 17ndash232005
[55] P E McSharry L A Smith and L Tarassenko ldquoPredictionof epileptic seizures are nonlinear methods relevantrdquo NatureMedicine vol 9 pp 241ndash242 2003
[56] A Aarabi R Fazel-Rezai and Y Aghakhani ldquoEEG seizureprediction measures and challengesrdquo in Proceedings of theAnnual International Conference of the IEEE in Engineeringin Medicine and Biology Society (EMBC rsquo09) pp 1864ndash1867Minneapolis Minn USA September 2009
[57] J Gotman J R Ives and P Gloor ldquoAutomatic recognitionof inter-ictal epileptic activity in prolonged EEG recordingsrdquoElectroencephalography and Clinical Neurophysiology vol 46no 5 pp 510ndash520 1979
[58] D J Koffler and J Gotman ldquoAutomatic detection of spike-and-wave bursts in ambulatory EEG recordingsrdquo Electroencephalog-raphy and Clinical Neurophysiology vol 61 no 2 pp 165ndash1801985
[59] J Gotman ldquoAutomatic detection of seizures and spikesrdquo Journalof Clinical Neurophysiology vol 16 no 2 pp 130ndash140 1999
[60] R Lopes J M Lina F Fahoum and J Gotman ldquoDetectionof epileptic activity in fMRI without recording the EEGrdquoNeuroImage vol 60 no 3 pp 1867ndash1879 2012
[61] L Ayoubian H Lacoma and J Gotman ldquoAutomatic seizuredetection in SEEG using high frequency activities in waveletdomainrdquoMedical Engineering amp Physics vol 35 no 3 pp 319ndash328 2013
[62] A H Shoeb Application of machine learning to epileptic seizureonset detection and treatment [PhD thesis] MassachusettsInstitute of Technology Cambridge Mass USA 2009
[63] Y U Khan N Rafiuddin and O Farooq ldquoAutomated seizuredetection in scalp EEG using multiple wavelet scalesrdquo inProceedings of the IEEE International Conference on SignalProcessing Computing and Control (ISPCC rsquo12) pp 1ndash5 IEEEWaknaghat India March 2012
[64] S Nasehi and H Pourghassem ldquoPatient-specific epilepticseizure onset detection algorithmbased on spectral features andIPSONN classifierrdquo in Proceedings of the 3rd International Con-ference on Communication Systems and Network Technologies(CSNT rsquo13) pp 186ndash190 IEEE Gwalior India April 2013
[65] N Nicolaou and J Georgiou ldquoDetection of epileptic elec-troencephalogram based on Permutation Entropy and SupportVector Machinesrdquo Expert Systems with Applications vol 39 no1 pp 202ndash209 2012
[66] E D Ubeyli ldquoAnalysis of EEG signals by combining eigenvectormethods andmulticlass support vectormachinesrdquoComputers inBiology and Medicine vol 38 no 1 pp 14ndash22 2008
[67] E D Ubeyli ldquoDecision support systems for time-varyingbiomedical signals EEG signals classificationrdquo Expert Systemswith Applications vol 36 no 2 pp 2275ndash2284 2009
[68] U R Acharya F Molinari S V Sree S Chattopadhyay K-HNg and J S Suri ldquoAutomated diagnosis of epileptic EEG usingentropiesrdquo Biomedical Signal Processing and Control vol 7 no4 pp 401ndash408 2012
[69] K Polat and S Gunes ldquoA novel data reductionmethod distancebased data reduction and its application to classification ofepileptiform EEG signalsrdquo Applied Mathematics and Computa-tion vol 200 no 1 pp 10ndash27 2008
[70] Q Yuan W Zhou Y Liu and J Wang ldquoEpileptic seizure detec-tion with linear and nonlinear featuresrdquo Epilepsy amp Behaviorvol 24 no 4 pp 415ndash421 2012
[71] J R Williamson D W Bliss and D W Browne ldquoEpilepticseizure prediction using the spatiotemporal correlation struc-ture of intracranial EEGrdquo in Proceedings of the IEEE Interna-tional Conference on Acoustics Speech and Signal Processing(ICASSP rsquo11) pp 665ndash668 IEEE Prague Czech Republic May2011
[72] Y Park L Luo K K Parhi and T Netoff ldquoSeizure predictionwith spectral power of EEG using cost-sensitive support vectormachinesrdquo Epilepsia vol 52 no 10 pp 1761ndash1770 2011
[73] L M Patnaik and O K Manyam ldquoEpileptic EEG detectionusing neural networks and post-classificationrdquoComputerMeth-ods and Programs in Biomedicine vol 91 no 2 pp 100ndash1092008
BioMed Research International 17
[74] K Patel C-P Chua S Faul and C J Bleakley ldquoLow powerreal-time seizure detection for ambulatory EEGrdquo in Proceedingsof the 3rd International Conference on Pervasive ComputingTechnologies for Healthcare pp 1ndash7 April 2009
[75] N Acir and C Guzelis ldquoAutomatic spike detection in EEGby a two-stage procedure based on support vector machinesrdquoComputers in Biology and Medicine vol 34 no 7 pp 561ndash5752004
[76] J Rasekhi M R K Mollaei M Bandarabadi C A Teixeiraand A Dourado ldquoPreprocessing effects of 22 linear univariatefeatures on the performance of seizure prediction methodsrdquoJournal of Neuroscience Methods vol 217 no 1-2 pp 9ndash16 2013
[77] A R Webb and K D Copsey Statistical Pattern RecognitionWiley 2011
[78] M R Bremner Lattice Basis Reduction An Introduction to theLLL Algorithm and Its Applications Chapman amp Hall Pure andApplied Mathematics CRC Press 2011
[79] LM Taft R S Evans C R Shyu et al ldquoCountering imbalanceddatasets to improve adverse drug event predictive models inlabor and deliveryrdquo Journal of Biomedical Informatics vol 42no 2 pp 356ndash364 2009
[80] T Sun R Zhang J Wang X Li and X Guo ldquoComputer-aideddiagnosis for early-stage lung cancer based on longitudinal andbalanced datardquo PLoS ONE vol 8 no 5 Article ID e63559 2013
[81] W-J Lin and J J Chen ldquoClass-imbalanced classifiers for high-dimensional datardquo Briefings in Bioinformatics vol 14 no 1 pp13ndash26 2013
[82] J Nahar T Imam K S Tickle A B M S Ali and Y-PP Chen ldquoComputational intelligence for microarray data andbiomedical image analysis for the early diagnosis of breastcancerrdquo Expert Systems with Applications vol 39 no 16 pp12371ndash12377 2012
[83] R Blagus and L Lusa ldquoSMOTE for high-dimensional class-imbalanced datardquo BMC Bioinformatics vol 14 article 106 2013
[84] Y Wang M Simon P Bonde et al ldquoPrognosis of rightventricular failure in patients with left ventricular assist devicebased on decision tree with SMOTErdquo IEEE Transactions onInformation Technology in Biomedicine vol 16 no 3 pp 383ndash390 2012
[85] N V Chawla K W Bowyer L O Hall and W P KegelmeyerldquoSMOTE synthetic minority over-sampling techniquerdquo Journalof Artificial Intelligence Research vol 16 no 1 pp 321ndash357 2002
[86] F van der Heijden R PW Duin D de Ridder and DM J TaxClassification Parameter Estimation and State Estimation JohnWiley amp Sons 2005
[87] F S Bao D Y-C Lie and Y Zhang ldquoA new approach toautomated epileptic diagnosis using EEG and probabilisticneural networkrdquo in Proceedings of the 20th IEEE InternationalConference on Tools with Artificial Intelligence (ICTAI rsquo08) vol2 pp 482ndash486 IEEE November 2008
[88] S Chandaka A Chatterjee and S Munshi ldquoCross-correlationaided support vectormachine classifier for classification of EEGsignalsrdquo Expert Systems with Applications vol 36 no 2 pp1329ndash1336 2009
[89] R S S Kumari and J P Jose ldquoSeizure detection in EEGusing time frequency analysis and SVMrdquo in Proceedings of theInternational Conference on Emerging Trends in Electrical andComputer Technology (ICETECT rsquo11) pp 626ndash630 IEEEMarch2011
[90] K Polat and S Gunes ldquoClassification of epileptiformEEGusinga hybrid system based on decision tree classifier and fast Fourier
transformrdquo Applied Mathematics and Computation vol 187 no2 pp 1017ndash1026 2007
[91] Y Song and P Lio ldquoA new approach for epileptic seizuredetection sample entropy based feature extraction and extremelearning machinerdquo Journal of Biomedical Science and Engineer-ing vol 3 no 6 pp 556ndash567 2010
[92] A Subasi ldquoEEG signal classification using wavelet featureextraction and a mixture of expert modelrdquo Expert Systems withApplications vol 32 no 4 pp 1084ndash1093 2007
[93] A Subasi and M I Gursoy ldquoEEG signal classification usingPCA ICA LDA and support vector machinesrdquo Expert Systemswith Applications vol 37 no 12 pp 8659ndash8666 2010
[94] Z G Zheng L Yu Y Feng et al ldquoSeizure prediction modelbased on method of common spatial patterns and supportvector machinerdquo in Proceedings of the IEEE International Con-ference on Information Science and Technology (ICIST rsquo12) pp29ndash34 March 2012
[95] S Grewal and J Gotman ldquoAn automatic warning system forepileptic seizures recorded on intracerebral EEGsrdquo ClinicalNeurophysiology vol 116 no 10 pp 2460ndash2472 2005
[96] M DrsquoAlessandro G Vachtsevanos R Esteller et al ldquoA multi-feature and multi-channel univariate selection process forseizure predictionrdquo Clinical Neurophysiology vol 116 no 3 pp506ndash516 2005
[97] T L Sorensen U L Olsen I Conradsen et al ldquoAutomaticepileptic seizure onset detection using matching pursuit a casestudyrdquo in International Conference on Engineering in Medicineand Biology Society pp 3277ndash3280 2010
[98] S Coates A Clarke G Davison andV Patterson ldquoTele-EEG inthe UK a report of over 1000 patientsrdquo Journal of Telemedicineand Telecare vol 18 no 5 pp 243ndash246 2012
[99] N Lasierra A Alesanco C Campos E Caudevilla J Fernan-dez and J Garcia ldquoExperience of a real-time tele-EEG servicerdquoin Proceedings of the Annual International Conference of theIEEE Engineering in Medicine and Biology Society (EMBC rsquo09)pp 5211ndash5214 September 2009
Submit your manuscripts athttpwwwhindawicom
Neurology Research International
Hindawi Publishing Corporationhttpwwwhindawicom Volume 2014
Alzheimerrsquos DiseaseHindawi Publishing Corporationhttpwwwhindawicom Volume 2014
International Journal of
ScientificaHindawi Publishing Corporationhttpwwwhindawicom Volume 2014
Hindawi Publishing Corporationhttpwwwhindawicom Volume 2014
BioMed Research International
Hindawi Publishing Corporationhttpwwwhindawicom Volume 2014
Research and TreatmentSchizophrenia
The Scientific World JournalHindawi Publishing Corporation httpwwwhindawicom Volume 2014
Hindawi Publishing Corporationhttpwwwhindawicom Volume 2014
Neural Plasticity
Hindawi Publishing Corporationhttpwwwhindawicom Volume 2014
Parkinsonrsquos Disease
Hindawi Publishing Corporationhttpwwwhindawicom Volume 2014
Research and TreatmentAutism
Sleep DisordersHindawi Publishing Corporationhttpwwwhindawicom Volume 2014
Hindawi Publishing Corporationhttpwwwhindawicom Volume 2014
Neuroscience Journal
Epilepsy Research and TreatmentHindawi Publishing Corporationhttpwwwhindawicom Volume 2014
Hindawi Publishing Corporationhttpwwwhindawicom Volume 2014
Psychiatry Journal
Hindawi Publishing Corporationhttpwwwhindawicom Volume 2014
Computational and Mathematical Methods in Medicine
Depression Research and TreatmentHindawi Publishing Corporationhttpwwwhindawicom Volume 2014
Hindawi Publishing Corporationhttpwwwhindawicom Volume 2014
Brain ScienceInternational Journal of
StrokeResearch and TreatmentHindawi Publishing Corporationhttpwwwhindawicom Volume 2014
Neurodegenerative Diseases
Hindawi Publishing Corporationhttpwwwhindawicom Volume 2014
Journal of
Cardiovascular Psychiatry and NeurologyHindawi Publishing Corporationhttpwwwhindawicom Volume 2014
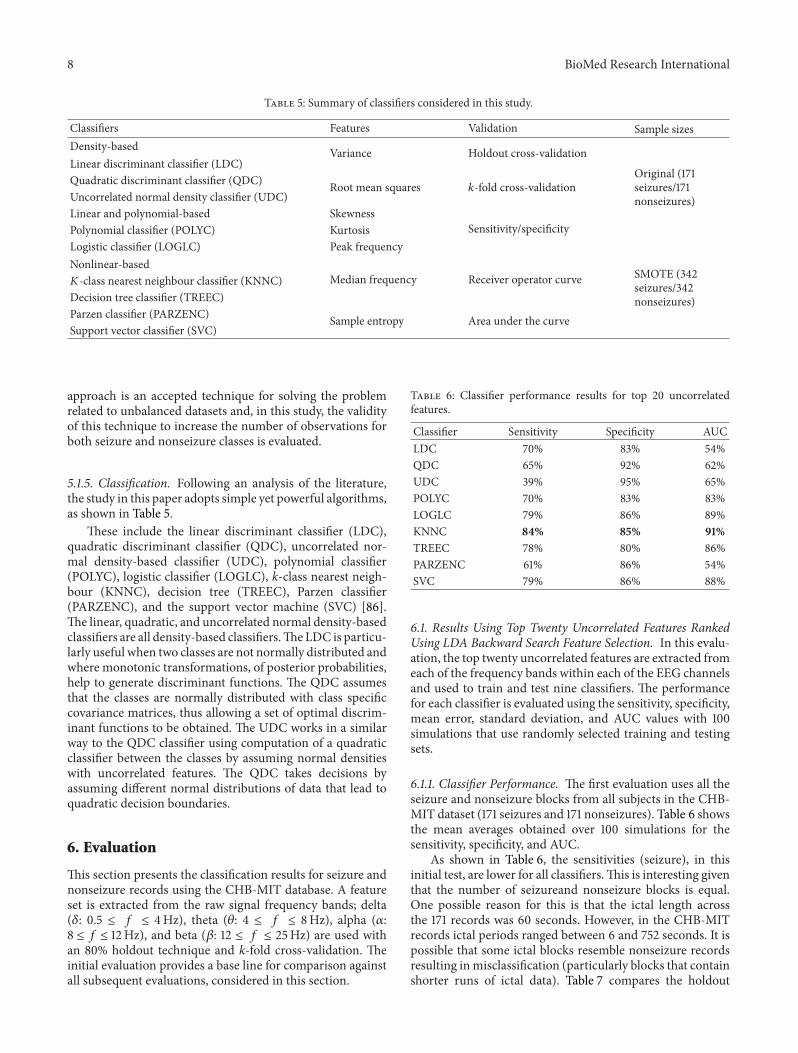
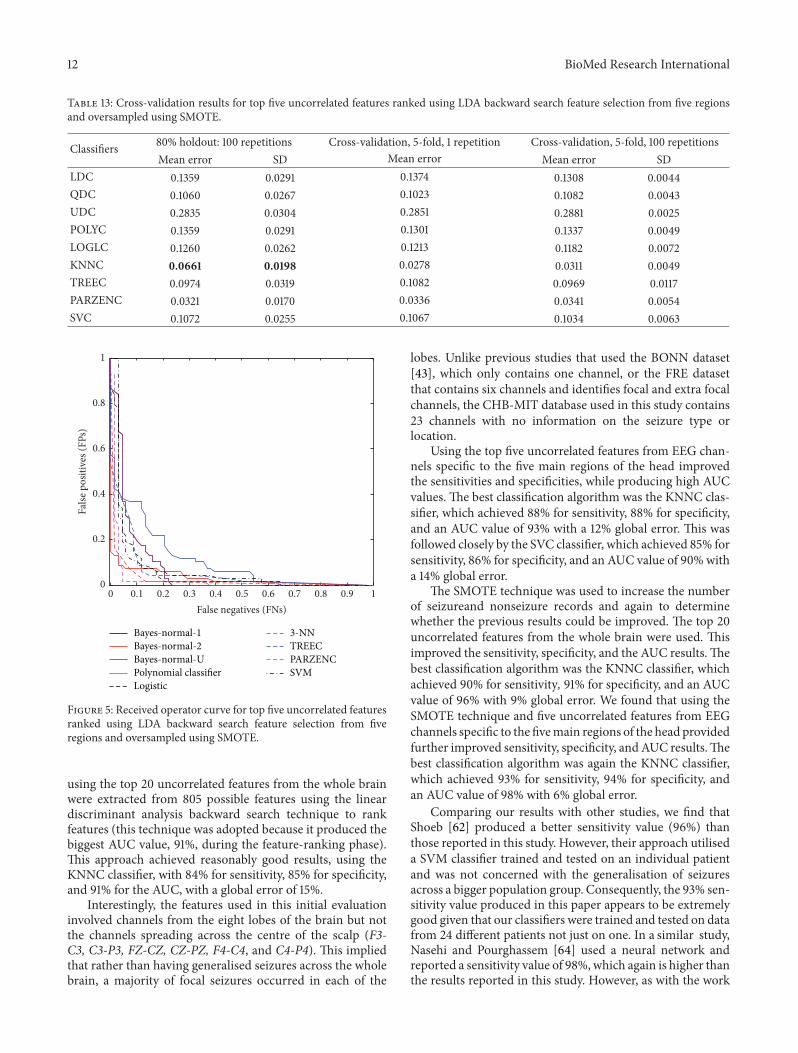
Related Documents