Seismic Design according to Eurocode 8 and AzDTN 2.3-1 code: Case study of multistorey building in Baku Master degree in Civil Engineering – Building Construction Amir Alasgarov Leiria, October of 2020

Welcome message from author
This document is posted to help you gain knowledge. Please leave a comment to let me know what you think about it! Share it to your friends and learn new things together.
Transcript
Seismic Design according to Eurocode 8 and
AzDTN 2.3-1 code: Case study of multistorey
building in Baku
Master degree in Civil Engineering – Building Construction
Amir Alasgarov
Leiria, October of 2020
Seismic Design according to Eurocode 8 and
AzDTN 2.3-1 code: Case study of multistorey
building in Baku
Master degree in Civil Engineering – Building Construction
Amir Alasgarov
Dissertation report under the supervision of Professor Joao Paulo Veludo Vieira Pereira,
Professor Hugo Filipe Pinheiro Rodrigues and Professor Khalid Mehemmed Oglu.
Leiria, October of 2020

iii
Originality and Copyright
This project report is original, made only for this purpose, and all authors whose studies and
publications were used to complete it are duly acknowledged.
Partial reproduction of this document is authorized, provided that the Author is explicitly
mentioned, as well as the study cycle, i.e., Master degree in Civil Engineering, 2018/2020
academic year, of the School of Technology and Management of the Polytechnic Institute of
Leiria, and the date of the public presentation of this work.

iv
Dedication
To my mom.
v
Acknowledgments
First and for most I must give many thanks to Professor Joao Veludo, who trained me as an
engineer and made a huge contribution to my future. The experience that Professor Veludo
gave me is of great value, and always found time for my doubts and questions. Professor
Joao Veludo always showed the highest level of support in any field and guided me along
the true path. I am infinitely grateful to the professor and appreciate the effort that he put
into my thesis.
Also, I am grateful for Professor Hugo Rodrigues who made a timely contribution to the
work, and shared his great experience with us.
I am grateful for the Head of Civil Engineering department, Professor Azar Akhmadov from
Baku Engineering University, because of his experience shared with me at the beginning of
my journey, which created a strong foundation for to build on.
Finally, I am thankful to the whole department of Civil Engineering of the Polytechnic
Institute of Leiria, whose doors were always open for me.
vi
Abstract
Detailed and entire research in the comparison of seismic behaviour of reinforced concrete
structures under European seismic code and Azerbaijan seismic code are not yet provided.
However, there are big interests from the Azerbaijan Republic to involve European codes as
state construction norms in Azerbaijan. Because of this, comparison has been made to help
Azerbaijan move to European Standards.
The following aspects were taken into account in order to make a comparison of seismic
codes: design states, structural types, ground conditions, important classes, seismic zones,
horizontal elastic response spectrum, base shear force and distribution of the horizontal
seismic forces. Chapter 4 compares results of the case study in Chapter 3. To make a seismic
analysis, the existing constructed structure was taken into account to apply seismic codes of
Europe and Azerbaijan. The Robot Structural Analysis software was used for modelling
structure and analysing it behaviour and results.
The several aspects of both seismic codes are quite similar, such as design limit states,
seismic zones, but the most similar aspect observed in the research is that of the
characteristics of ground types. The almost 80% of difference in base shear force is observed
for studied building. Also, studies show that Azerbaijan code is much more conservative in
terms of shape of elastic response spectrum in poor soil conditions than European seismic
code.
Basically, overall results of research show that Azerbaijan Construction Norms, in terms of
seismic design, are much more conservative in all aspects comparing with European codes.
The main reason for this is the high seismicity of number of regions of Azerbaijan. Also, to
consider is the cost of construction materials in Azerbaijan is way less that the cost in Europe.
Keywords: seismic design, seismic analysis, reinforced concrete structure, elastic response
spectrum, seismic combinations, ground types.
vii
Contents
Originality and Copyright ................................................................................................. iii
Dedication ............................................................................................................................ iv
Acknowledgments ................................................................................................................ v
Abstract ............................................................................................................................... vi
Contents .............................................................................................................................. vii
List of Figures ...................................................................................................................... x
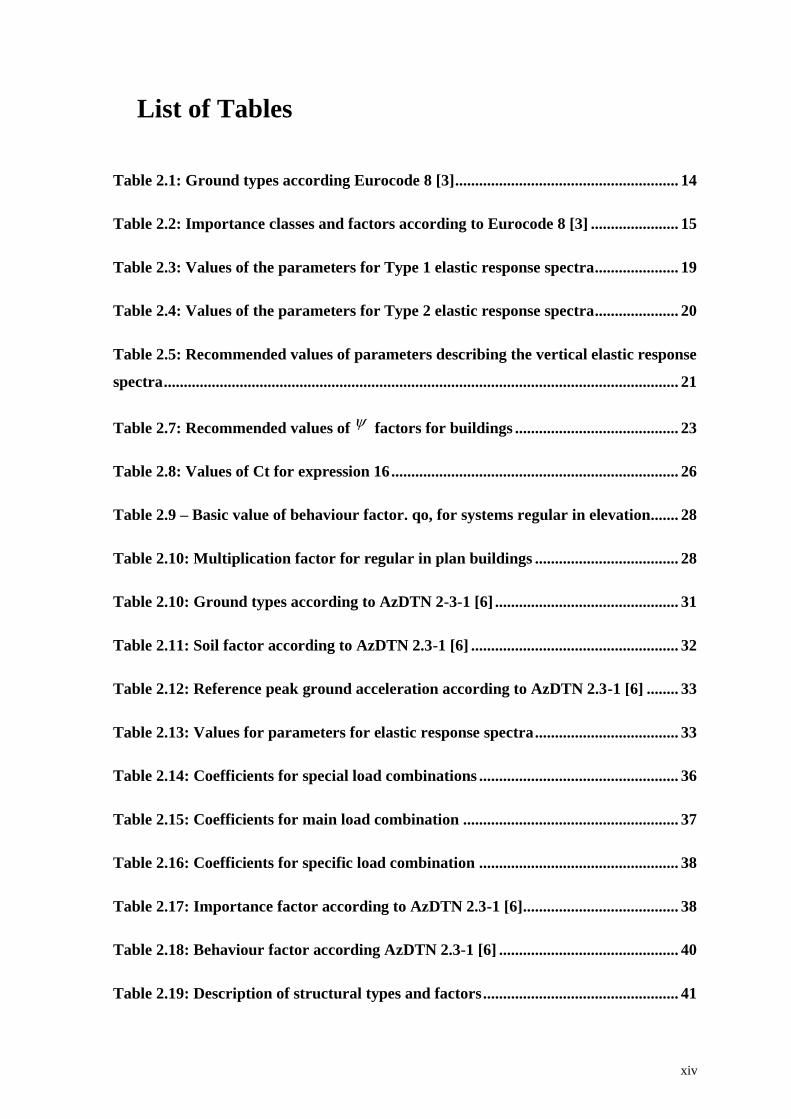
List of Tables ..................................................................................................................... xiv
List of Abbreviations and Acronyms ............................................................................. xvii
Introduction ................................................................................................................. 1
1.1. Scope ......................................................................................................................... 1
1.2. Subject, Relevance and Main Goals of the Work ............................................... 10
1.3. Thesis Structure ..................................................................................................... 11
Seismic Action According to Eurocode 8 and AzDTN 2.3-1 Code ........................ 12
2.1. Introduction ........................................................................................................... 12
2.2. Seismic Analysis According to Eurocode 8 ......................................................... 12
2.2.1. Requirements and Limit States ........................................................................ 12
2.2.2. Seismic Action and Soil Parameters ................................................................ 13
2.2.3. Buildings Design Under Seimic Actions ......................................................... 21
2.2.4. Particular Factors and Rules ............................................................................ 27
2.3. Seismic analysis according to AzDTN 2.3-1 ........................................................ 29
2.3.1. Requirements and Limit States ........................................................................ 29
2.3.2. Seismic Action and Soil Parameters ................................................................ 30
2.3.3. Design Buildings under Seismic Action .......................................................... 35
2.3.4. Particular Factors and Rules ............................................................................ 40
2.4. Comparison Between Eurocode 8 and AzDTN 2.3-1 ......................................... 41
viii
2.5. Final remarks ......................................................................................................... 48
Case Study .................................................................................................................. 50
3.1. Introduction ........................................................................................................... 50
3.2. Geotechnical Investigation .................................................................................... 51
3.3. Structural System .................................................................................................. 51
3.4. Materials ................................................................................................................. 55
3.5. Loads ....................................................................................................................... 56
3.5.1. Self-weight....................................................................................................... 56
3.5.2. Permanent Loads ............................................................................................. 56
3.5.3. Variable Loads ................................................................................................. 57
3.5.4. Earth Load ....................................................................................................... 57
3.6. Combinations ......................................................................................................... 60
3.6.1. EN 1990 ........................................................................................................... 61
3.6.2. AzDTN 2.1-1 ................................................................................................... 62
3.6.3. Horizontal Components of Seismic Action ..................................................... 63
3.7. Structural Model.................................................................................................... 64
3.8. Frequencies and Mode Shapes ............................................................................. 68
Analysis and Interpretation of Results .................................................................... 71
4.1. Introduction ........................................................................................................... 71
4.2. Base Shear .............................................................................................................. 72
4.3. Displacements and Drifts ...................................................................................... 73
4.4. Forces in Structural Members.............................................................................. 78
Conclusions and Future works ................................................................................. 89
5.1. Summary of Conclusions ...................................................................................... 89
5.2. Future Developments ............................................................................................ 90

ix
Bibliographic References .................................................................................................. 91
Appendices ......................................................................................................................... 96
Appendix A ......................................................................................................................... 97
Appendix B ......................................................................................................................... 99
Appendix C ....................................................................................................................... 101
Appendix D ....................................................................................................................... 105
Appendix E ....................................................................................................................... 108
x
List of Figures
Figure 1.1: Global seismic hazard map ............................................................................. 1
Figure 1.2: San Francisco earthquake of 1906. “By courtesy of Encyclopædia
Britannica, Inc., copyright 2020; used with permission.” ................................................ 2
Figure 1.3: Typical causes of damage and failure of RC structures ............................... 3
Figure 1.4: “Strong-Beam Weak-Column” failure [33] ................................................... 4
Figure 1.5: Inadequate detailing of the joints [34] ........................................................... 4
Figure 1.6: Distribution of internal forces along the height of the building .................. 5
Figure 1.7: Different types of structural irregularities .................................................... 6
Figure 1.8: Structure with ground soft storey after Al-Hoceima earthquake 24/02/2004
[34] ................................................................................................................................... 7
Figure 1.9: Example of short column failure .................................................................... 8
Figure 1.10: Solutions to reduce shear forces in “short column” issue .......................... 8
Figure 1.11: Shear failure of a column of Shinkansen bridge. 2004, Japan [40] ........... 9
Figure 1.12: Diagonal shear crack in lightly reinforced concrete pier of the Wu Shu
bridge in Taichung [39] ....................................................................................................... 9
Figure 1.13: Examples of flexural failure due to seismic action [40] ............................ 10
Figure 2.1: Seismic hazard map of Europe ..................................................................... 16
Figure 2.2 Four types of earthquake waves [29] ............................................................. 17
Figure 2.3: Basic shape of the elastic response spectrum according to EN 1998-1 [3] 19
Figure 2.4: Elastic response spectra Type 1 for five soil types (5% damping) ............ 20
Figure 2.5: Criteria for regularity of buildings with setbacks EN 1998-1 [3] .............. 22
xi
Figure 2.6: Seismic zones of Azerbaijan Republic according to AzDTN 2.3-1 ............ 32
Figure 2.7: Basic shape of the elastic response spectrum of AzDTN 2.3-1 [6] ............. 34
Figure 2.8: Elastic response spectra for ground types I to IV ....................................... 35
Figure 2.9: Criteria for regularity of buildings with setbacks AzDTN 2.3-1 [6] ......... 36
Figure 2.10: Displacement of the structure under its own vibration ............................ 40
Figure 2.11: Limit states of EN 1998-1 & AzDTN 2.3-1 ................................................ 42
Figure 2.12: Importance classes and factors of EN1998-1 & AzDTN 2.3-1 ................. 44
Figure 2.13: Elastic response spectrums for EN 1998-1 [3] & AzDTN 2.3-1 [6] for vs
800m/s ................................................................................................................................. 45
Figure 2.14: Elastic response spectrums for EN 1998-1 [3] & AzDTN 2.3-1 [6] for vs
360 – 800m/s ....................................................................................................................... 46
Figure 2.15: Elastic response spectrums for EN 1998-1 & AzDTN 2.3-1 for vs 180 –
360m/s ................................................................................................................................. 47
Figure 2.16: Elastic Response Spectrum for EN 1998-1 [3] & AzDTN 2.3-1 [6] for vs
180 m/s ................................................................................................................................ 48
Figure 3.1: Building studied ............................................................................................. 50
Figure 3.2: Structural plan of storeys 0 to 3.................................................................... 53
Figure 3.3: Scheme of retaining structure ....................................................................... 58
Figure 3.4: Diagram of Stress Imposed to Wall .............................................................. 59
Figure 3.5: Structural model (a) ....................................................................................... 65
Figure 3.6: Three fundamental vibration modes according to prescriptions of EN 1998-
1 [3] ................................................................................................................................. 69
Figure 3.7: Three fundamental vibrations modes according to prescriptions of AzDTN
2.3-1 [6] ............................................................................................................................... 70
xii
Figure 4.1: Horizontal elastic response spectrum for studied structure ...................... 72
Figure 4.2: Deformation shapes under seismic combination 1 (see Table 4.1) ............ 74
Figure 4.3: Deformation shapes under seismic combination 2 (see Table 4.1) ............ 76
Figure 4.4: Deformation shapes under seismic combination 3 (see Table 4.1) ............ 77
Figure 4.5: Deformation shapes under seismic combination 4 (see Table 4.1) ............ 78
Figure 4.6: Structural members taken to comparison ................................................... 79
Figure 4.7: Dimensions of columns analysed .................................................................. 79
Figure 4.8: Forces for corner column according AzDTN 2.3-1 [6] ............................... 80
Figure 4.9: Forces for corner column according EN 1998-1 [3] .................................... 80
Figure 4.10: Forces for edge column according AzDTN 2.3-1 [6] ................................. 81
Figure 4.11: Forces for edge column according EN 1998-1 [3] ..................................... 81
Figure 4.12: Forces for inner column according AzDTN 2.3-1 [6] ............................... 82
Figure 4.13: Forces for inner column according EN 1998-1 [3] .................................... 83
Figure 4.14: Forces for edge beam according AzDTN 2.3-1 [6] .................................... 84
Figure 4.15: Forces for edge beam according EN 1998-1 [3] ......................................... 84
Figure 4.16: Forces for inner beam according AzDTN 2.3-1 [6] ................................... 85
Figure 4.17: Forces for edge beam according EN 1998-1 [3] ......................................... 86
Figure B.0.1: Structural plan of basement storey........................................................... 99
Figure B.0.2: Structural plan of 4th and 5th storeys .................................................... 100
Figure C.0.1: Structure’s shear walls ............................................................................ 101
Figure C.0.2: Structure’s stairwell ................................................................................. 102
xiii
Figure C.0.3: Structure’s frame ..................................................................................... 103
Figure C.0.4: Structure’s elevation shaft....................................................................... 104
Figure E.0.1: Displacement shape under seismic combination 1 (see Table 4.1) for EN
1998-1 [3] .......................................................................................................................... 108
Figure E.0.2: Displacement shape under seismic combination 1 (see Table 4.1) for
AzDTN 2.3-1 [6] ............................................................................................................... 109
Figure E.0.3: Displacement shape under seismic combination 2 (Table 4.1) for EN 1998-
1 [3] ............................................................................................................................... 110
Figure E.0.4: Displacement shape under seismic combination 2 (Table 4.1) for AzDTN
2.3-1 [6] ............................................................................................................................. 111
Figure E.0.5: Displacement shape under seismic combination 3 (see Table 4.1) for EN
1998-1 [3] .......................................................................................................................... 112
Figure E.0.6: Displacement shape under seismic combination 3 (see Table 4.1) for
AzDTN 2.3-1 [6] ............................................................................................................... 113
Figure E.0.7: Displacement shape under seismic combination 4 (Table 4.1) for EN 1998-
1 [3] ............................................................................................................................... 114
Figure E.0.8: Displacement shape under seismic combination 4 (Table 4.1) for AzDTN
2.3-1 [6] ............................................................................................................................. 115
xiv
List of Tables
Table 2.1: Ground types according Eurocode 8 [3] ........................................................ 14
Table 2.2: Importance classes and factors according to Eurocode 8 [3] ...................... 15
Table 2.3: Values of the parameters for Type 1 elastic response spectra..................... 19
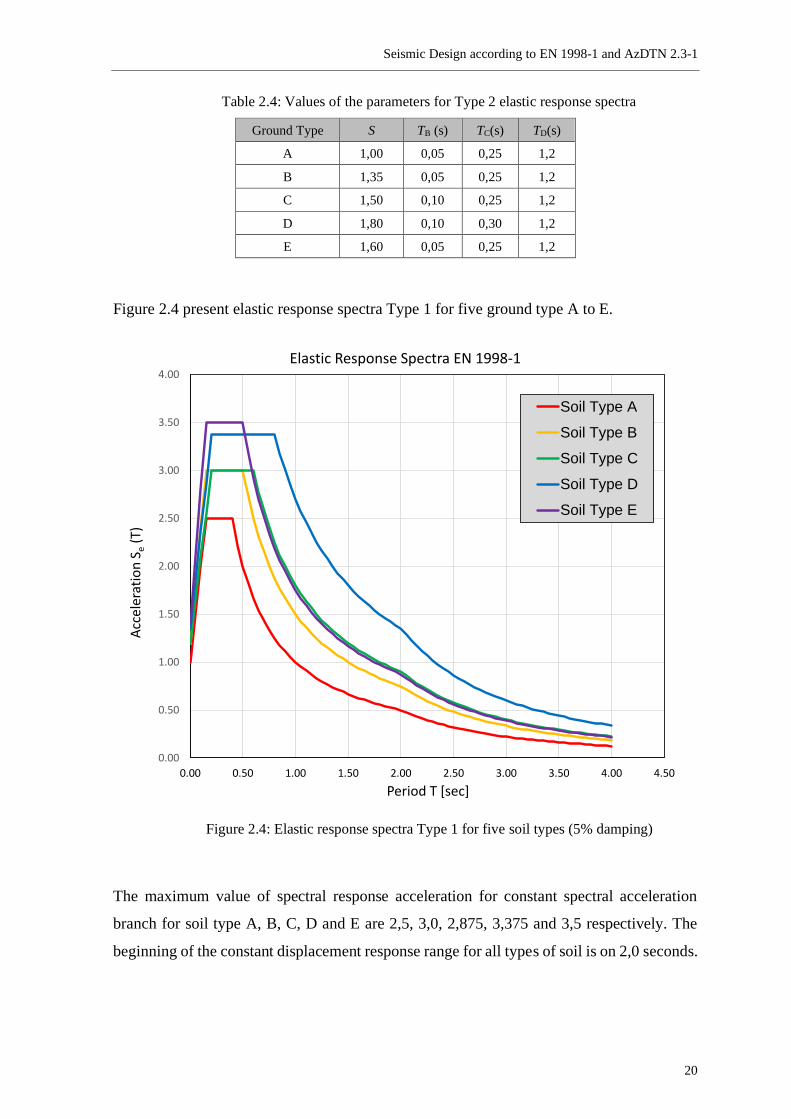
Table 2.4: Values of the parameters for Type 2 elastic response spectra..................... 20
Table 2.5: Recommended values of parameters describing the vertical elastic response
spectra ................................................................................................................................. 21
Table 2.7: Recommended values of factors for buildings ......................................... 23
Table 2.8: Values of Ct for expression 16 ........................................................................ 26
Table 2.9 – Basic value of behaviour factor. qo, for systems regular in elevation....... 28
Table 2.10: Multiplication factor for regular in plan buildings .................................... 28
Table 2.10: Ground types according to AzDTN 2-3-1 [6] .............................................. 31
Table 2.11: Soil factor according to AzDTN 2.3-1 [6] .................................................... 32
Table 2.12: Reference peak ground acceleration according to AzDTN 2.3-1 [6] ........ 33
Table 2.13: Values for parameters for elastic response spectra .................................... 33
Table 2.14: Coefficients for special load combinations .................................................. 36
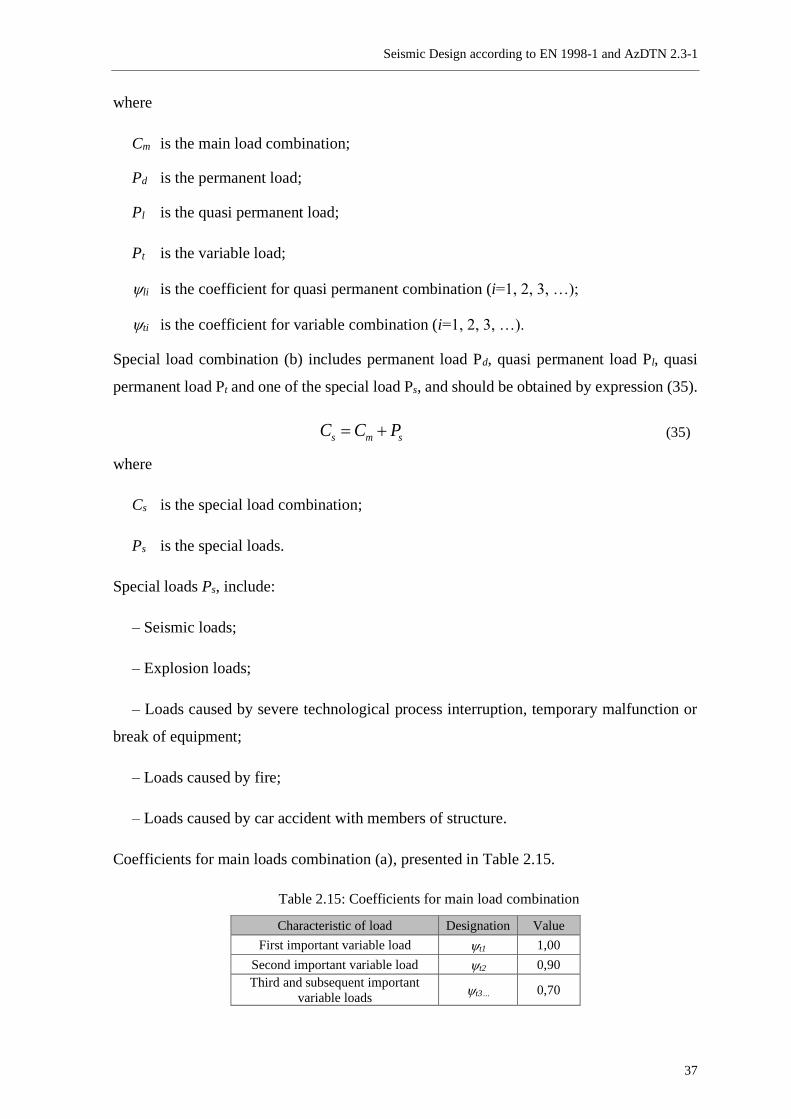
Table 2.15: Coefficients for main load combination ...................................................... 37
Table 2.16: Coefficients for specific load combination .................................................. 38
Table 2.17: Importance factor according to AzDTN 2.3-1 [6]....................................... 38
Table 2.18: Behaviour factor according AzDTN 2.3-1 [6] ............................................. 40
Table 2.19: Description of structural types and factors ................................................. 41
xv
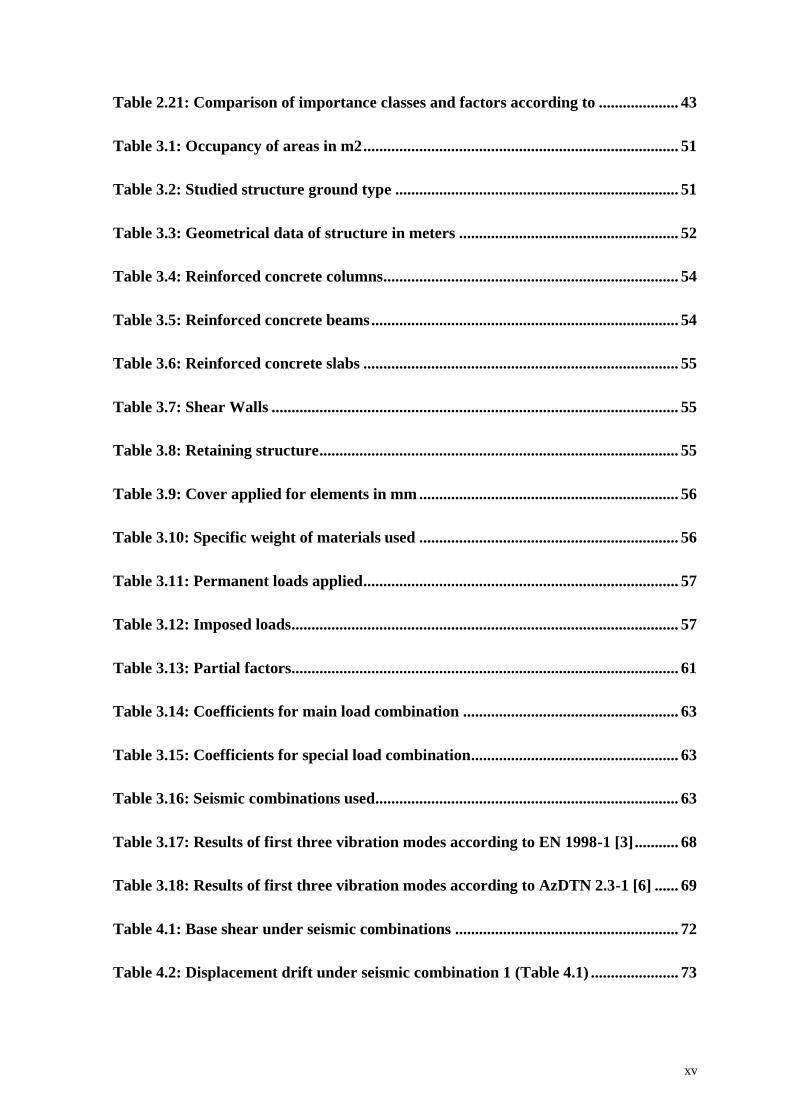
Table 2.21: Comparison of importance classes and factors according to .................... 43
Table 3.1: Occupancy of areas in m2 ............................................................................... 51
Table 3.2: Studied structure ground type ....................................................................... 51
Table 3.3: Geometrical data of structure in meters ....................................................... 52
Table 3.4: Reinforced concrete columns.......................................................................... 54
Table 3.5: Reinforced concrete beams ............................................................................. 54
Table 3.6: Reinforced concrete slabs ............................................................................... 55
Table 3.7: Shear Walls ...................................................................................................... 55
Table 3.8: Retaining structure .......................................................................................... 55
Table 3.9: Cover applied for elements in mm ................................................................. 56
Table 3.10: Specific weight of materials used ................................................................. 56
Table 3.11: Permanent loads applied ............................................................................... 57
Table 3.12: Imposed loads................................................................................................. 57
Table 3.13: Partial factors................................................................................................. 61
Table 3.14: Coefficients for main load combination ...................................................... 63
Table 3.15: Coefficients for special load combination.................................................... 63
Table 3.16: Seismic combinations used............................................................................ 63
Table 3.17: Results of first three vibration modes according to EN 1998-1 [3] ........... 68
Table 3.18: Results of first three vibration modes according to AzDTN 2.3-1 [6] ...... 69
Table 4.1: Base shear under seismic combinations ........................................................ 72
Table 4.2: Displacement drift under seismic combination 1 (Table 4.1) ...................... 73
xvi
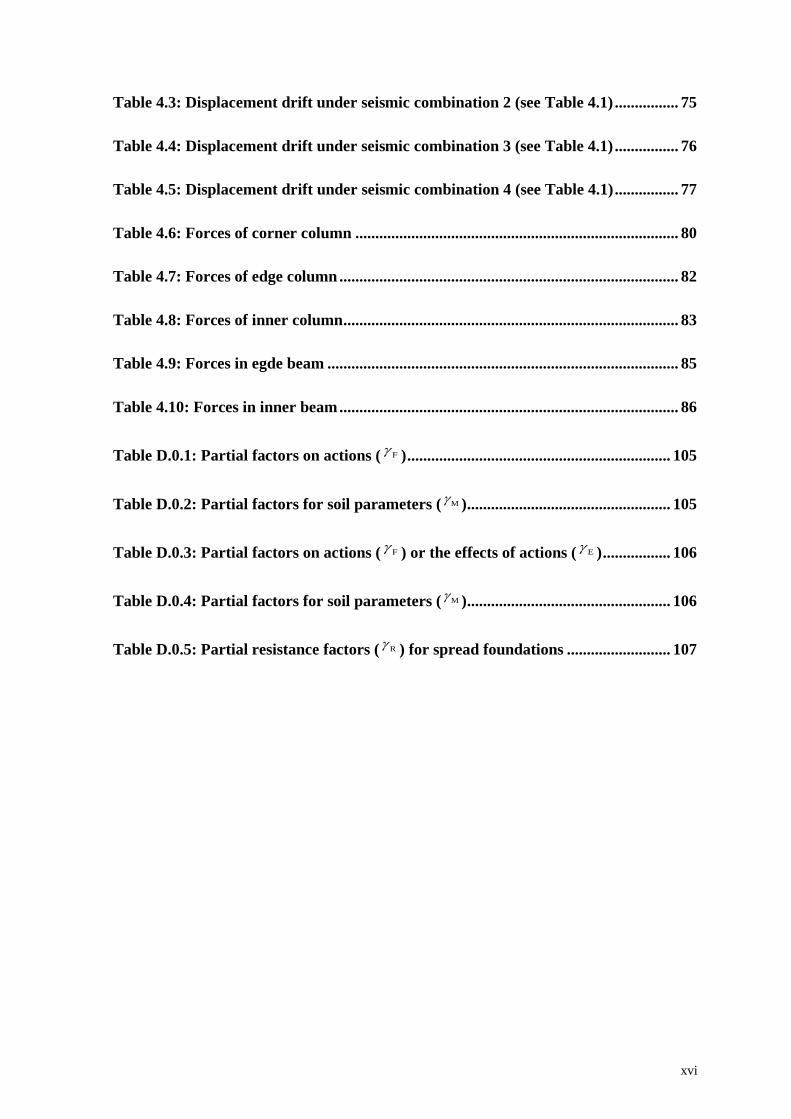
Table 4.3: Displacement drift under seismic combination 2 (see Table 4.1) ................ 75
Table 4.4: Displacement drift under seismic combination 3 (see Table 4.1) ................ 76
Table 4.5: Displacement drift under seismic combination 4 (see Table 4.1) ................ 77
Table 4.6: Forces of corner column ................................................................................. 80
Table 4.7: Forces of edge column ..................................................................................... 82
Table 4.8: Forces of inner column .................................................................................... 83
Table 4.9: Forces in egde beam ........................................................................................ 85
Table 4.10: Forces in inner beam ..................................................................................... 86
Table D.0.1: Partial factors on actions ( F ) .................................................................. 105
Table D.0.2: Partial factors for soil parameters ( M ) ................................................... 105
Table D.0.3: Partial factors on actions ( F ) or the effects of actions ( E ) ................. 106
Table D.0.4: Partial factors for soil parameters ( M ) ................................................... 106
Table D.0.5: Partial resistance factors ( R ) for spread foundations .......................... 107

xvii
List of Abbreviations and Acronyms
ULS Ultimate Limit State
SLS Serviceability Limit States
LSD Limit State Design
PGA Peak Ground Acceleration
PGV Peak Ground Velocity
PGD Peak Ground Displacement
SDOF Single Degree of Freedom
FEM Finite Element Method
NCR No-Collapse Requirement
DLR Damage Limitation Requirement
SPT Standard Penetration Test
OCR Over-consolidation Ratio
RC Reinforced Concrete
FSLS First Stage Limit State
SSLS Second Stage Limit State
CC Corner Column
IC Inner Column
EC Edge Column
EB Edge Beam
IB Inner Beam
Seismic Design according to EN 1998-1 and AzDTN 2.3-1
1
Introduction
1.1. Scope
The definition of “earthquake” according to Cambridge Dictionary [43] is “a sudden violent
movement of the earth’s surface, sometimes causing great damage”. There are more terms
which describes earthquakes such as, tremor, quake, subsurface seismic activity, temblor.
Through many years people have faced earthquakes. This has subsequently led to the
development of the ability to get along with periodic movement of the earth’s tectonic plates
and to be prepared for their occurrence.
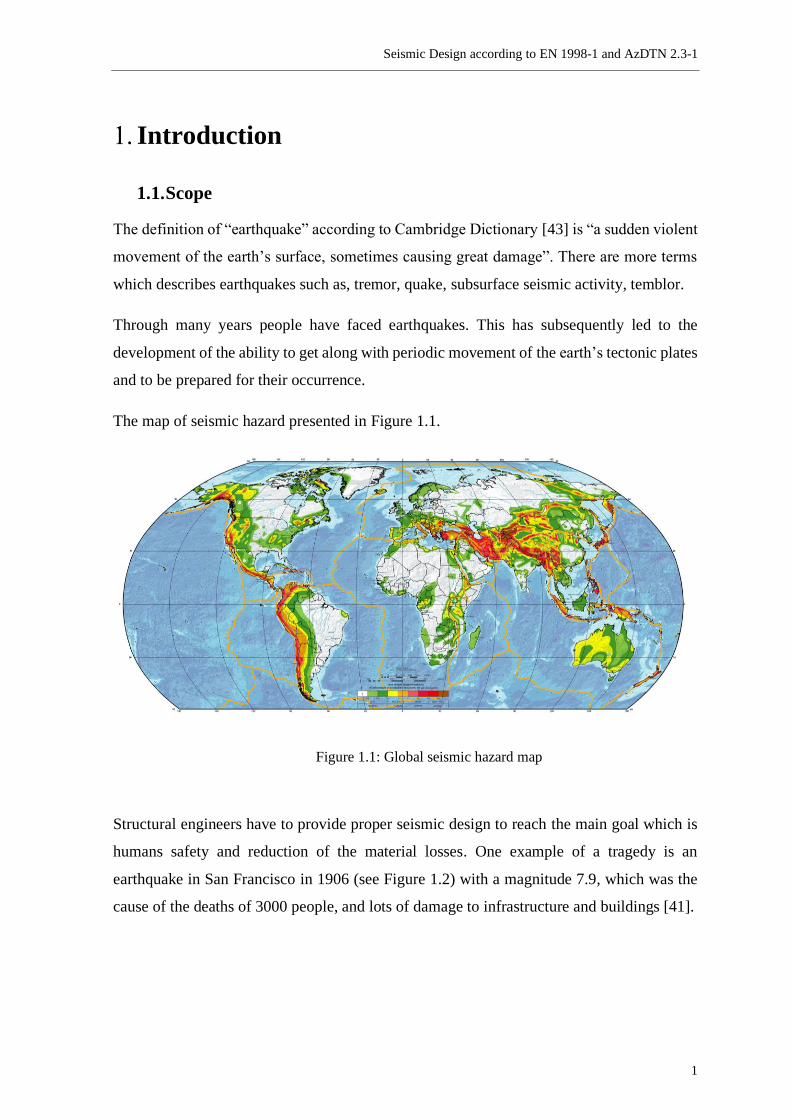
The map of seismic hazard presented in Figure 1.1.
Figure 1.1: Global seismic hazard map
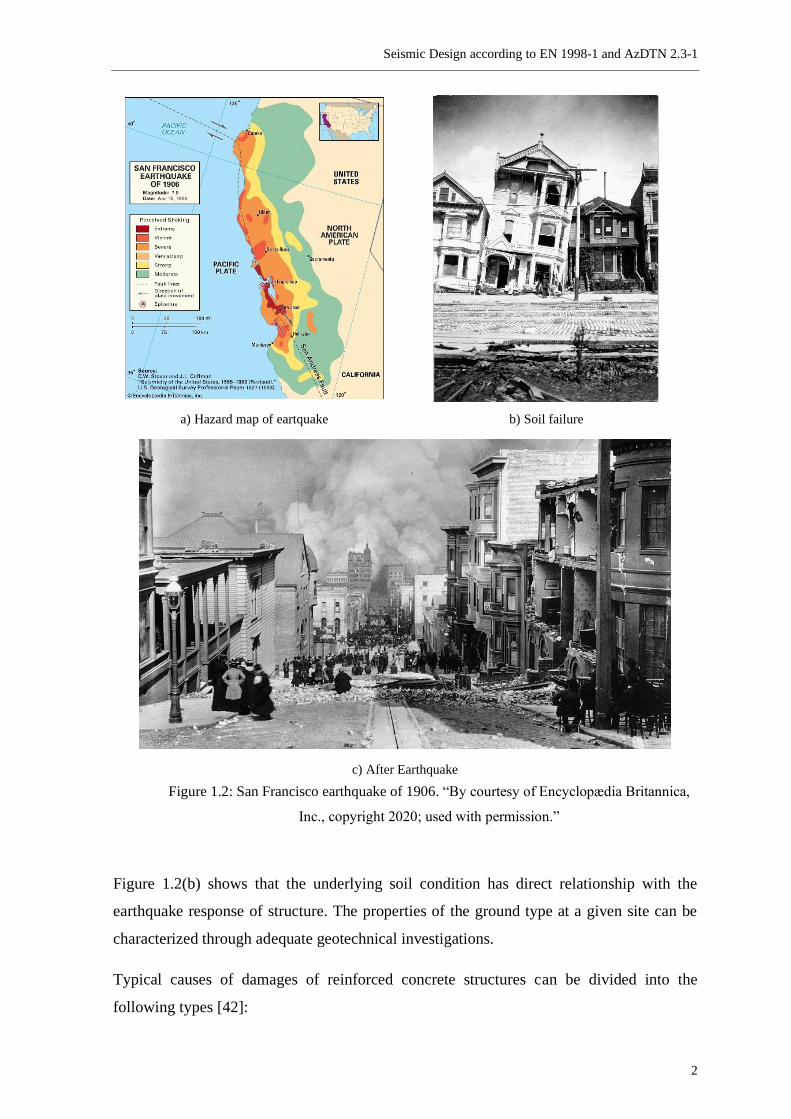
Structural engineers have to provide proper seismic design to reach the main goal which is
humans safety and reduction of the material losses. One example of a tragedy is an
earthquake in San Francisco in 1906 (see Figure 1.2) with a magnitude 7.9, which was the
cause of the deaths of 3000 people, and lots of damage to infrastructure and buildings [41].
Seismic Design according to EN 1998-1 and AzDTN 2.3-1
2
a) Hazard map of eartquake b) Soil failure
c) After Earthquake
Figure 1.2: San Francisco earthquake of 1906. “By courtesy of Encyclopædia Britannica,
Inc., copyright 2020; used with permission.”
Figure 1.2(b) shows that the underlying soil condition has direct relationship with the
earthquake response of structure. The properties of the ground type at a given site can be
characterized through adequate geotechnical investigations.
Typical causes of damages of reinforced concrete structures can be divided into the
following types [42]:
Seismic Design according to EN 1998-1 and AzDTN 2.3-1
3
– Shear and flexural failure;
– Inadequate capacity and detailing of the joints;
– Structural irregularities, in plan or in elevation, “weak-storey”, “soft-storey”;
– Short-column mechanism;
– “Strong-Beam Weak Column”.
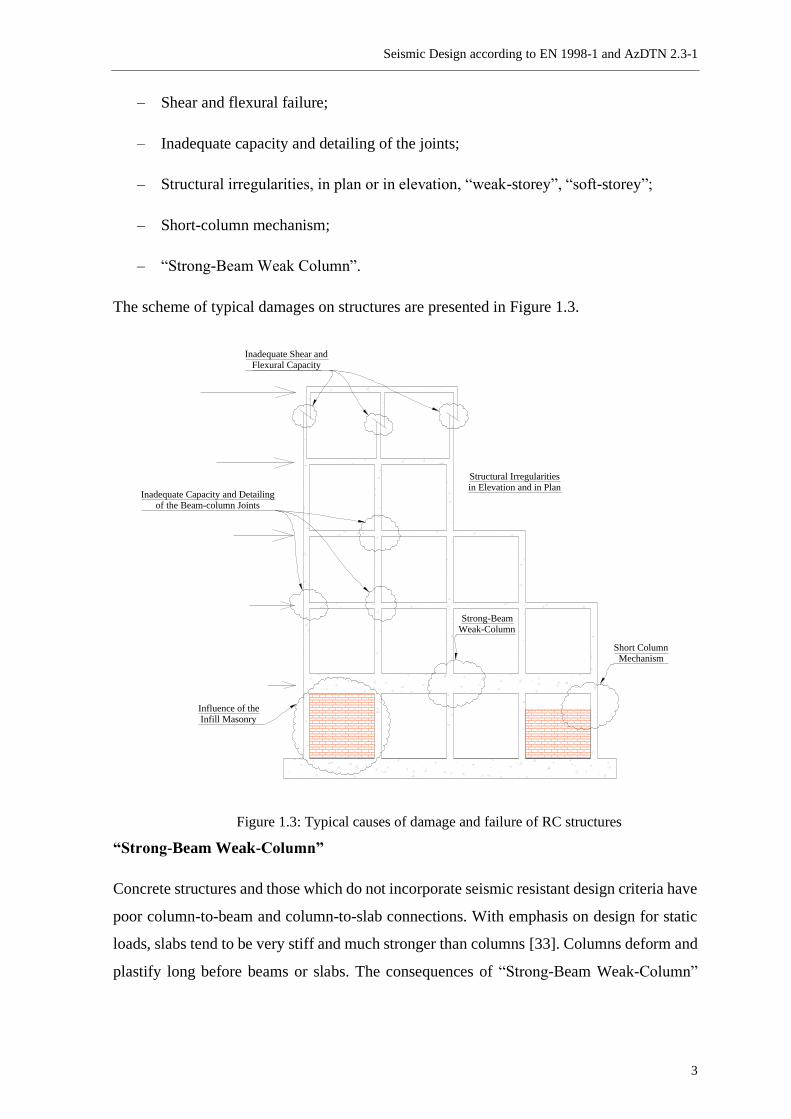
The scheme of typical damages on structures are presented in Figure 1.3.
Figure 1.3: Typical causes of damage and failure of RC structures
“Strong-Beam Weak-Column”
Concrete structures and those which do not incorporate seismic resistant design criteria have
poor column-to-beam and column-to-slab connections. With emphasis on design for static
loads, slabs tend to be very stiff and much stronger than columns [33]. Columns deform and
plastify long before beams or slabs. The consequences of “Strong-Beam Weak-Column”
Strong-BeamWeak-Column
Short ColumnMechanism
Structural Irregularitiesin Elevation and in Plan
Influence of theInfill Masonry
Inadequate Capacity and Detailingof the Beam-column Joints
Inadequate Shear andFlexural Capacity
Seismic Design according to EN 1998-1 and AzDTN 2.3-1
4
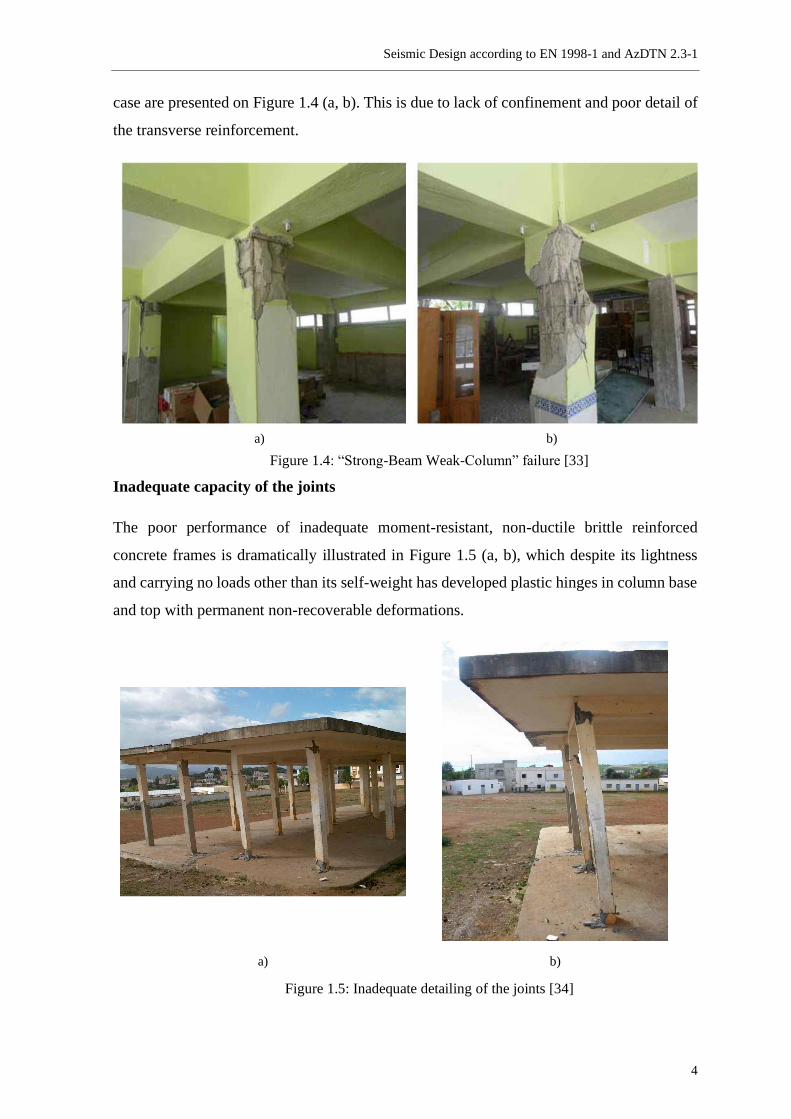
case are presented on Figure 1.4 (a, b). This is due to lack of confinement and poor detail of
the transverse reinforcement.
a) b)
Figure 1.4: “Strong-Beam Weak-Column” failure [33]
Inadequate capacity of the joints
The poor performance of inadequate moment-resistant, non-ductile brittle reinforced
concrete frames is dramatically illustrated in Figure 1.5 (a, b), which despite its lightness
and carrying no loads other than its self-weight has developed plastic hinges in column base
and top with permanent non-recoverable deformations.
a) b)
Figure 1.5: Inadequate detailing of the joints [34]
Seismic Design according to EN 1998-1 and AzDTN 2.3-1
5
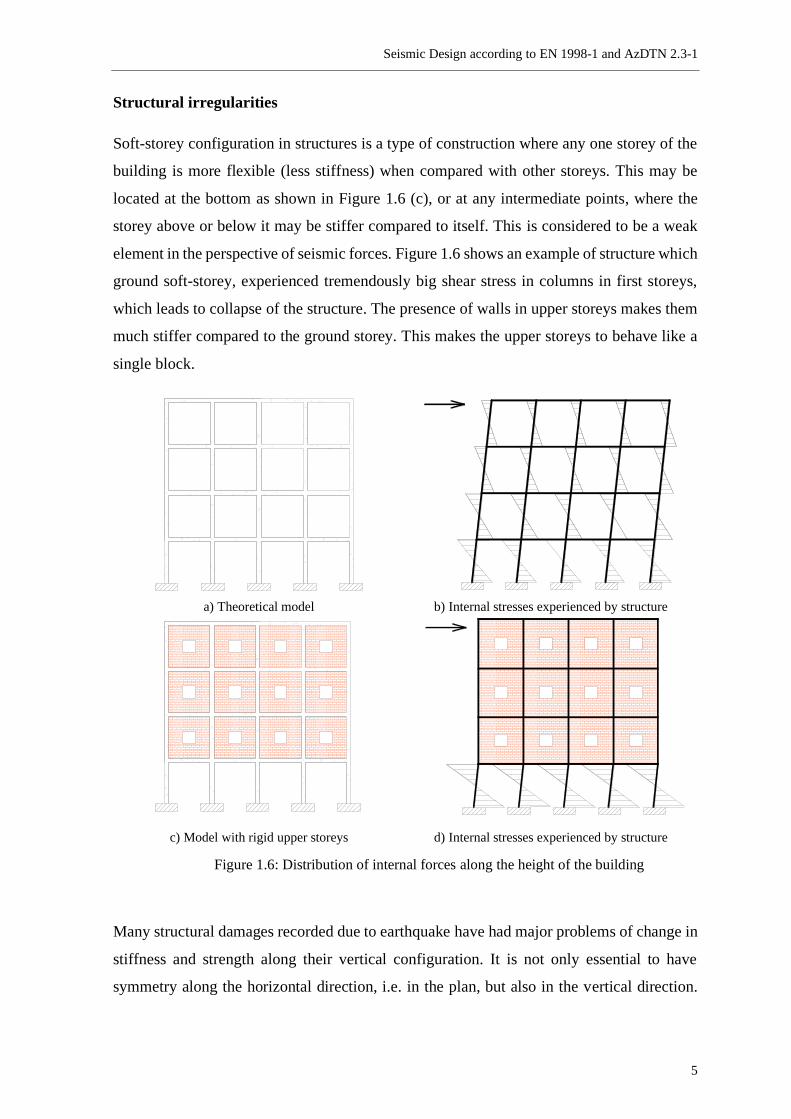
Structural irregularities
Soft-storey configuration in structures is a type of construction where any one storey of the
building is more flexible (less stiffness) when compared with other storeys. This may be
located at the bottom as shown in Figure 1.6 (c), or at any intermediate points, where the
storey above or below it may be stiffer compared to itself. This is considered to be a weak
element in the perspective of seismic forces. Figure 1.6 shows an example of structure which
ground soft-storey, experienced tremendously big shear stress in columns in first storeys,
which leads to collapse of the structure. The presence of walls in upper storeys makes them
much stiffer compared to the ground storey. This makes the upper storeys to behave like a
single block.
a) Theoretical model b) Internal stresses experienced by structure
c) Model with rigid upper storeys d) Internal stresses experienced by structure
Figure 1.6: Distribution of internal forces along the height of the building
Many structural damages recorded due to earthquake have had major problems of change in
stiffness and strength along their vertical configuration. It is not only essential to have
symmetry along the horizontal direction, i.e. in the plan, but also in the vertical direction.
Seismic Design according to EN 1998-1 and AzDTN 2.3-1
6
This is a factor that assures lateral stiffness. Abrupt changes in the vertical plan should be
avoided to the maximum.
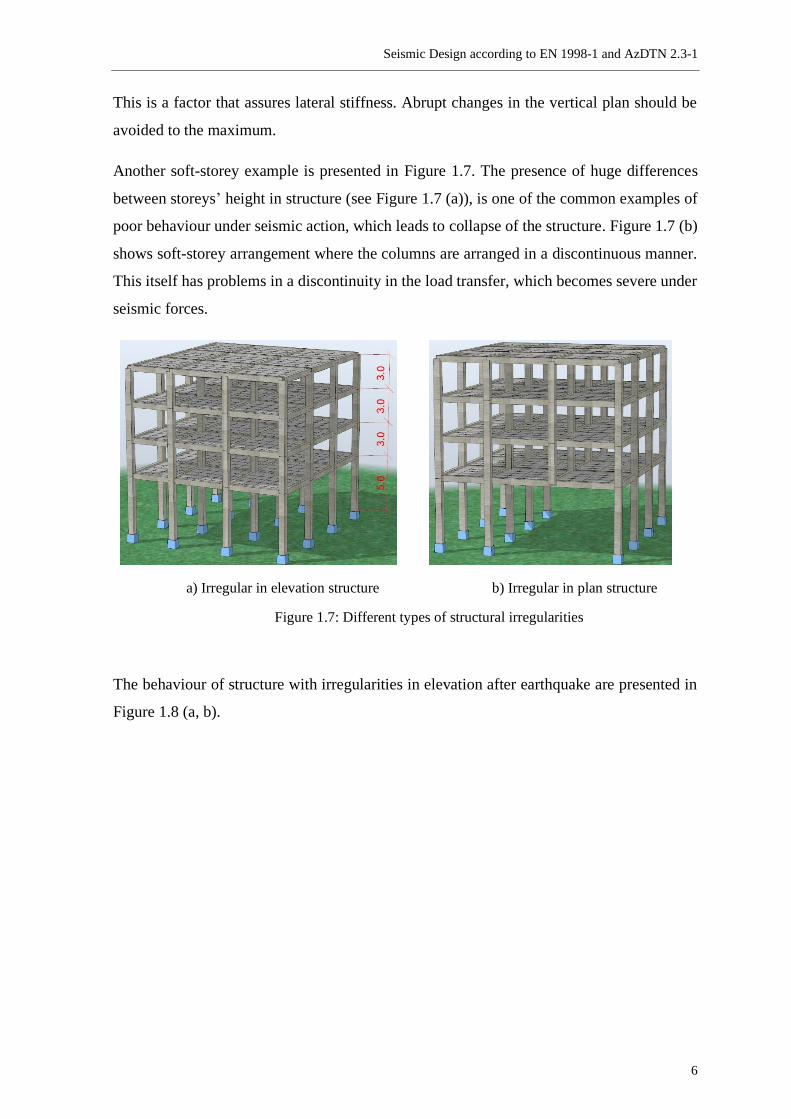
Another soft-storey example is presented in Figure 1.7. The presence of huge differences
between storeys’ height in structure (see Figure 1.7 (a)), is one of the common examples of
poor behaviour under seismic action, which leads to collapse of the structure. Figure 1.7 (b)
shows soft-storey arrangement where the columns are arranged in a discontinuous manner.
This itself has problems in a discontinuity in the load transfer, which becomes severe under
seismic forces.
a) Irregular in elevation structure b) Irregular in plan structure
Figure 1.7: Different types of structural irregularities
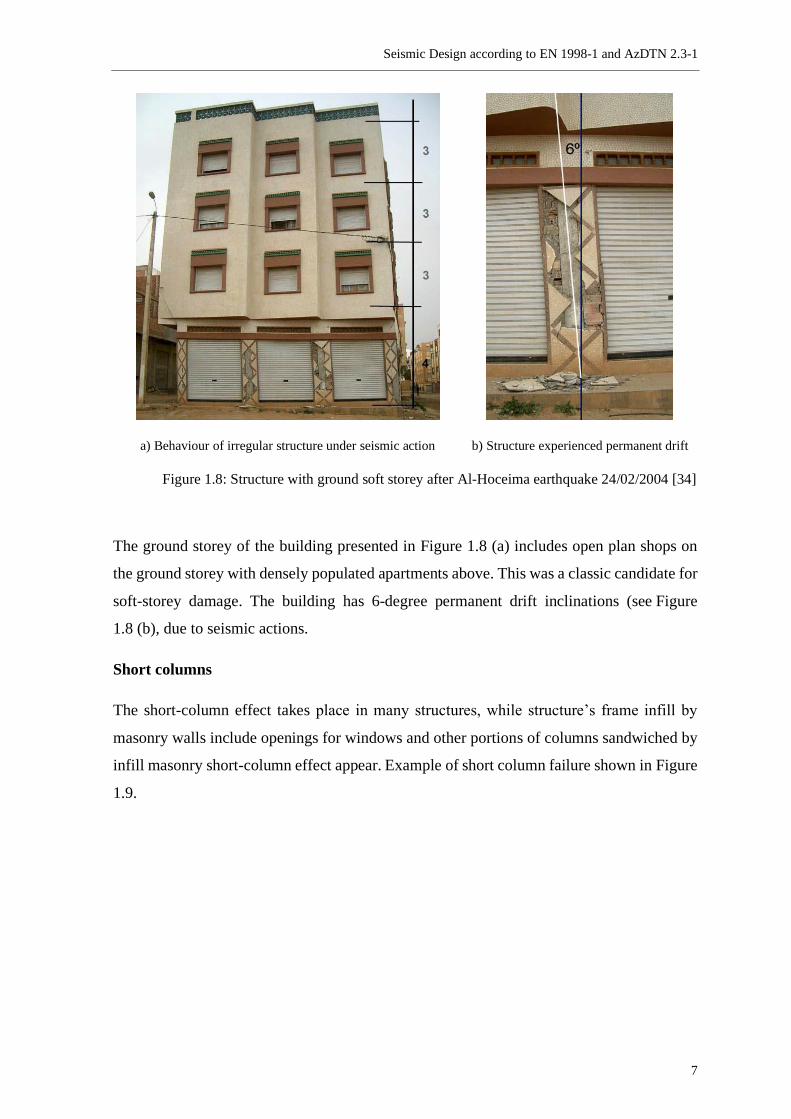
The behaviour of structure with irregularities in elevation after earthquake are presented in
Figure 1.8 (a, b).
Seismic Design according to EN 1998-1 and AzDTN 2.3-1
7
a) Behaviour of irregular structure under seismic action b) Structure experienced permanent drift
Figure 1.8: Structure with ground soft storey after Al-Hoceima earthquake 24/02/2004 [34]
The ground storey of the building presented in Figure 1.8 (a) includes open plan shops on
the ground storey with densely populated apartments above. This was a classic candidate for
soft-storey damage. The building has 6-degree permanent drift inclinations (see Figure
1.8 (b), due to seismic actions.
Short columns
The short-column effect takes place in many structures, while structure’s frame infill by
masonry walls include openings for windows and other portions of columns sandwiched by
infill masonry short-column effect appear. Example of short column failure shown in Figure
1.9.

Seismic Design according to EN 1998-1 and AzDTN 2.3-1
8
a) Al- Hocema 2004 [34] b) Adana-Ceyran 1998 [37]
Figure 1.9: Example of short column failure
One of the best ways to eliminate the short-column effect is to separate the infill wall from
the bounding structural frame with an adequate gap as presented in Figure 1.10 (a), that
would allow the column to freely bend [37], also adding infill wall segments, see Figure
1.10 (b), that would slightly reduce the opening width next to short column.
a) Gaps to reduce shear forces b) Additional infill to reduce shear forces
Figure 1.10: Solutions to reduce shear forces in “short column” issue
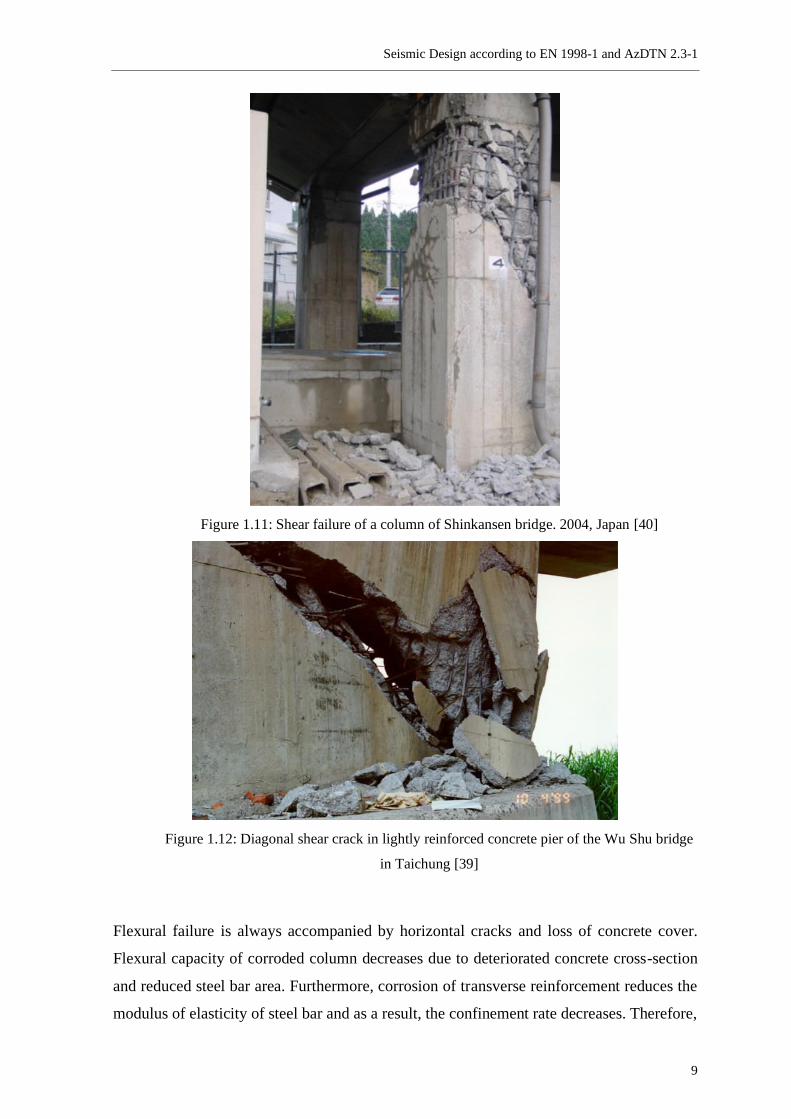
Shear and flexural failure
Due to shear forces experienced by column it can fail in any place between joints as far as
shear force is constant along the height of the column [39]. Examples of shear failure due to
lack of shear resistance is diagonal crack as shown in Figure 1.11 and Figure 1.12.
Infill wall
Gaps Infill wall
Additional infill
Seismic Design according to EN 1998-1 and AzDTN 2.3-1
9
Figure 1.11: Shear failure of a column of Shinkansen bridge. 2004, Japan [40]
Figure 1.12: Diagonal shear crack in lightly reinforced concrete pier of the Wu Shu bridge
in Taichung [39]
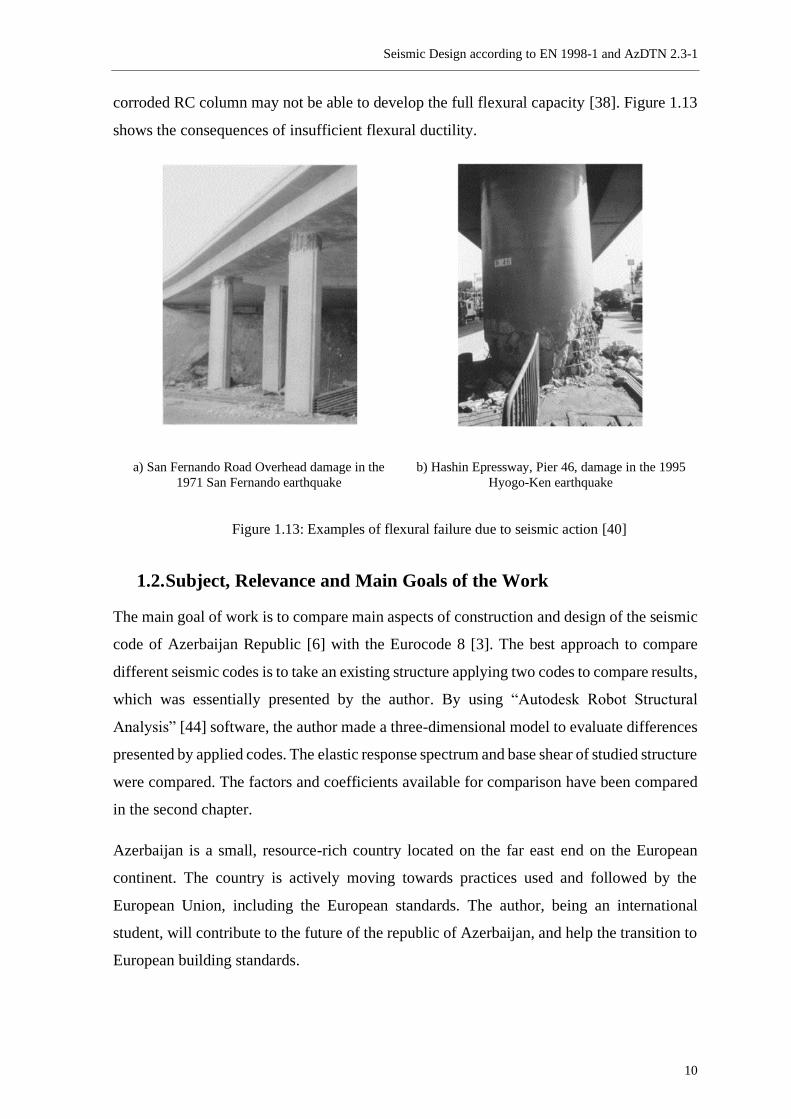
Flexural failure is always accompanied by horizontal cracks and loss of concrete cover.
Flexural capacity of corroded column decreases due to deteriorated concrete cross-section
and reduced steel bar area. Furthermore, corrosion of transverse reinforcement reduces the
modulus of elasticity of steel bar and as a result, the confinement rate decreases. Therefore,
Seismic Design according to EN 1998-1 and AzDTN 2.3-1
10
corroded RC column may not be able to develop the full flexural capacity [38]. Figure 1.13
shows the consequences of insufficient flexural ductility.
a) San Fernando Road Overhead damage in the
1971 San Fernando earthquake
b) Hashin Epressway, Pier 46, damage in the 1995
Hyogo-Ken earthquake
Figure 1.13: Examples of flexural failure due to seismic action [40]
1.2. Subject, Relevance and Main Goals of the Work
The main goal of work is to compare main aspects of construction and design of the seismic
code of Azerbaijan Republic [6] with the Eurocode 8 [3]. The best approach to compare
different seismic codes is to take an existing structure applying two codes to compare results,
which was essentially presented by the author. By using “Autodesk Robot Structural
Analysis” [44] software, the author made a three-dimensional model to evaluate differences
presented by applied codes. The elastic response spectrum and base shear of studied structure
were compared. The factors and coefficients available for comparison have been compared
in the second chapter.
Azerbaijan is a small, resource-rich country located on the far east end on the European
continent. The country is actively moving towards practices used and followed by the
European Union, including the European standards. The author, being an international
student, will contribute to the future of the republic of Azerbaijan, and help the transition to
European building standards.
Seismic Design according to EN 1998-1 and AzDTN 2.3-1
11
1.3. Thesis Structure
The first chapter of the thesis presents a brief introduction of the entire report and touches
on the importance of seismic design.
The second chapter presents the fundamental aspects of each code, in terms of seismic
design.
The third chapter presents a brief introduction to studied structure in which EN 1998-1 [3]
and AzDTN 2.3-1 [6] were applied. Also, methodology of performance is described.
The fourth chapter presents the main results and the analysis of important parameters such
as results of base shear, displacement drift, ground acceleration and analysis of some of the
structural members according to seismic codes applied.
The fifth chapter presents a conclusion and summation of work done.
The appendices A to E include additional figures and tables to clarify ideas written in the
main text. Appendices A and B show more architectural sketches of facades and structural
plans of several storeys. Appendix C shows several structural elements made in a three-
dimensional model. Appendix D shows values of partial factors used in computation of earth
load. Appendix E shows more displacement shape modes.
Seismic Design according to EN 1998-1 and AzDTN 2.3-1
12
Seismic Action According to Eurocode 8 and
AzDTN 2.3-1 Code
2.1. Introduction
In 1975, the Commission of the European Community established a set of harmonized
technical rules for the design of construction works. The first European codes were generated
in the 1980’s. The Structural Eurocode programme comprises ten standards generally
consisting of several parts. Eurocode 8 (part 1), denoted in general by EN 1998-1 [3], applies
to the design and construction of buildings and civil engineering works in seismic areas.
Eurocode 8 [3] is composed of six parts dealing with different types of construction, such as
buildings, bridges, silos, pipelines, retaining structure and chimneys. EN 1998-1 [3] is used
to design buildings in seismic regions and is subdivided into ten chapters.
AzDTN 2.3 -1 “Construction in Seismic Areas” [6], is based on Russian seismic code
SNIP II - 7 -81* “Construction in Seismic Areas”. AzDTN 2.3-1 [6] was established in 2010
and comprise one part. The SNIP II - 7 -81* loses its validity after 2010. Azerbaijan code
touches on some topics to design buildings for seismic resistance.
This chapter includes the most important rules about seismic action and seismic design
according to Eurocode 8 (EC8) [3] and AzDTN 2.3-1 [6]. In section 2.4 both seismic codes
were compared in important parameters considering seismic design.
2.2. Seismic Analysis According to Eurocode 8
2.2.1. Requirements and Limit States
The design of buildings under seismic action should obey two requirements described in
European seismic code. The first requirement asks that after seismic action aftershock
structure should be strong enough to withstand and have residual load bearing capacity to
save human lives. That requirement is named “no-collapse requirement”.
– No collapse Requirement (NCR).
The design seismic action is expressed in terms of:

Seismic Design according to EN 1998-1 and AzDTN 2.3-1
13
a) The reference seismic action associated with a reference probability of
exceedance, PNCR, in 50 years or a reference return period, TNCR.
b) The importance factor I, described hereinafter, consider reliability
differentiation.
The other, but no less important requirement of EN 1998-1 [3] is named “damage limitation
requirement” and requires that the construction and design of structure should be strong
enough to prevent occurrence of damage which leads to unreasonable expenses in relation
to the cost of construction.
– Damage Limitation Requirement (DLR).
The design seismic action is expressed in terms of:
a) The seismic action for DLR has a probability of exceedance, PDLR, in 10 years and a
return period TDLR.
b) Recommended PDLR = 10%, which corresponds to TDLR = 95 years
In order to satisfy the fundamental requirements European construction code requires that
structure meet two limit states described in EN 1990 [1], ultimate limit state, (ULS) which
concerns with safety of people and safety of the structure and serviceability limit state (SLS)
which is concerned with functioning of the structure and comfort of people.
2.2.2. Seismic Action and Soil Parameters
Three parameters are used for a quantitative definition of the soil profile, such as value of
the average shear wave velocity (vs,30), the number of blows in the standard penetration test
(NSPT) and undrained cohesive resistance (cu). The average shear wave velocity (vs.30)
computed in accordance with the following expression:
,30
1,
30s
i
i N i
vh
v=
=
(1)
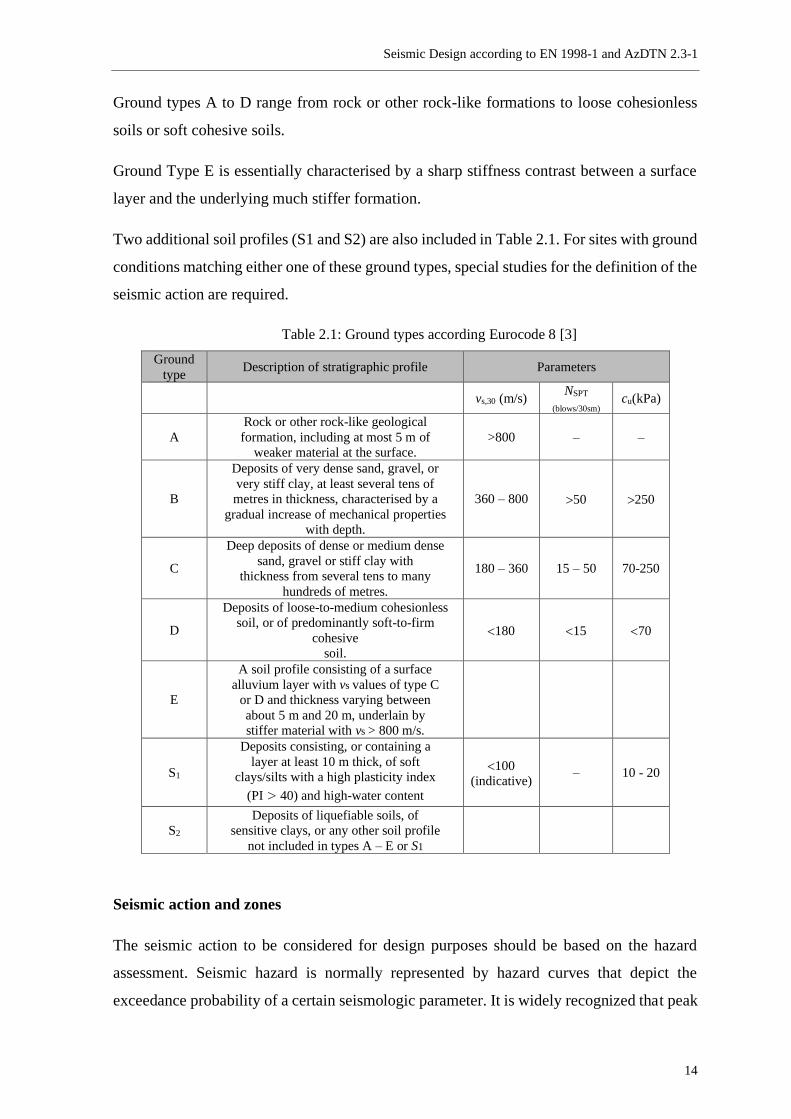
Ground types A, B, C, D, and E, described by the stratigraphic profiles and parameters given
in Table 2.1 and described hereafter, may be used to account for the influence of local ground
conditions on the seismic action. This may also be done by additionally taking into account
the influence of deep geology on the seismic action.
Seismic Design according to EN 1998-1 and AzDTN 2.3-1
14
Ground types A to D range from rock or other rock-like formations to loose cohesionless
soils or soft cohesive soils.
Ground Type E is essentially characterised by a sharp stiffness contrast between a surface
layer and the underlying much stiffer formation.
Two additional soil profiles (S1 and S2) are also included in Table 2.1. For sites with ground
conditions matching either one of these ground types, special studies for the definition of the
seismic action are required.
Table 2.1: Ground types according Eurocode 8 [3]
Ground
type Description of stratigraphic profile Parameters
vs,30 (m/s) NSPT
(blows/30sm) cu(kPa)
A
Rock or other rock-like geological
formation, including at most 5 m of
weaker material at the surface.
>800 – –
B
Deposits of very dense sand, gravel, or
very stiff clay, at least several tens of
metres in thickness, characterised by a
gradual increase of mechanical properties
with depth.
360 – 800 50 250
C
Deep deposits of dense or medium dense
sand, gravel or stiff clay with
thickness from several tens to many
hundreds of metres.
180 – 360 15 – 50 70-250
D
Deposits of loose-to-medium cohesionless
soil, or of predominantly soft-to-firm
cohesive
soil.
180 15 70
E
A soil profile consisting of a surface
alluvium layer with vs values of type C
or D and thickness varying between
about 5 m and 20 m, underlain by
stiffer material with vs > 800 m/s.
S1
Deposits consisting, or containing a
layer at least 10 m thick, of soft
clays/silts with a high plasticity index
(PI > 40) and high-water content
100
(indicative) – 10 - 20
S2
Deposits of liquefiable soils, of
sensitive clays, or any other soil profile
not included in types A – E or S1
Seismic action and zones
The seismic action to be considered for design purposes should be based on the hazard
assessment. Seismic hazard is normally represented by hazard curves that depict the
exceedance probability of a certain seismologic parameter. It is widely recognized that peak
Seismic Design according to EN 1998-1 and AzDTN 2.3-1
15
values of the ground motion parameters are not good descriptors of the severity of an
earthquake and of its possible consequences on construction. Hence the more recent trend is
to describe the seismic hazard by the values of the spectral ordinates.
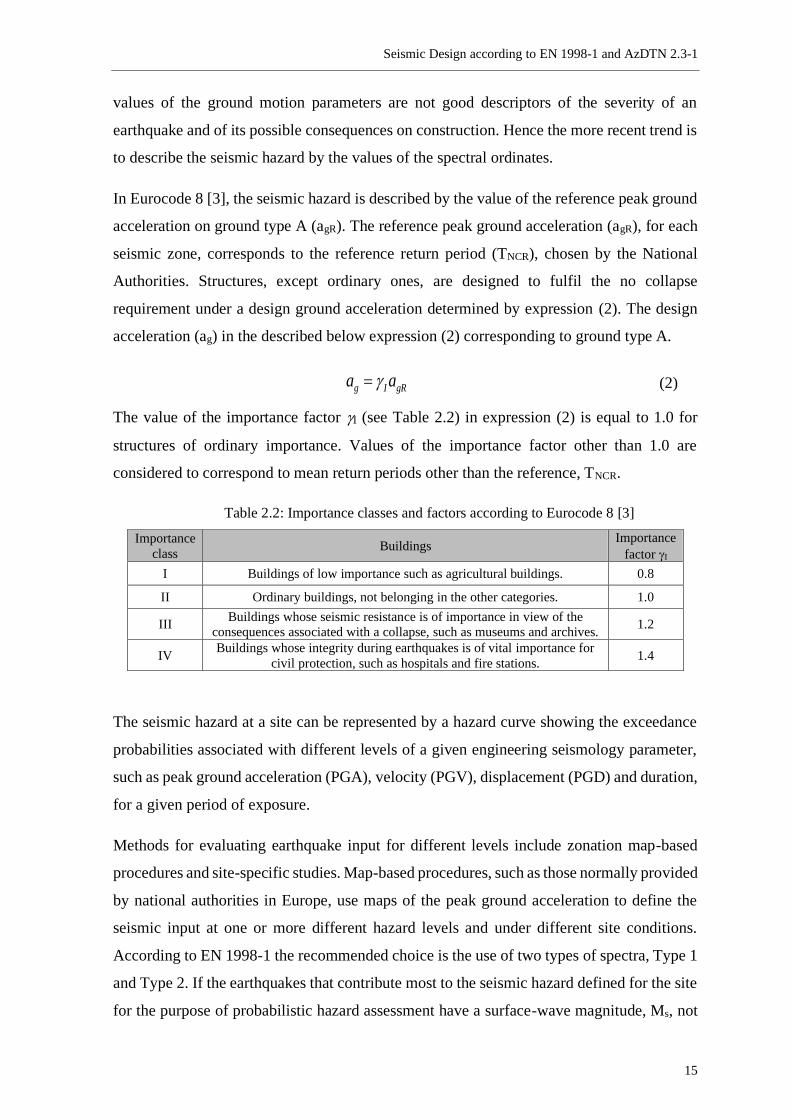
In Eurocode 8 [3], the seismic hazard is described by the value of the reference peak ground
acceleration on ground type A (agR). The reference peak ground acceleration (agR), for each
seismic zone, corresponds to the reference return period (TNCR), chosen by the National
Authorities. Structures, except ordinary ones, are designed to fulfil the no collapse
requirement under a design ground acceleration determined by expression (2). The design
acceleration (ag) in the described below expression (2) corresponding to ground type A.
g I gRa a= (2)
The value of the importance factor I (see Table 2.2) in expression (2) is equal to 1.0 for
structures of ordinary importance. Values of the importance factor other than 1.0 are
considered to correspond to mean return periods other than the reference, TNCR.
Table 2.2: Importance classes and factors according to Eurocode 8 [3]
Importance
class Buildings
Importance
factor I
I Buildings of low importance such as agricultural buildings. 0.8
II Ordinary buildings, not belonging in the other categories. 1.0
III Buildings whose seismic resistance is of importance in view of the
consequences associated with a collapse, such as museums and archives. 1.2
IV Buildings whose integrity during earthquakes is of vital importance for
civil protection, such as hospitals and fire stations. 1.4
The seismic hazard at a site can be represented by a hazard curve showing the exceedance
probabilities associated with different levels of a given engineering seismology parameter,
such as peak ground acceleration (PGA), velocity (PGV), displacement (PGD) and duration,
for a given period of exposure.
Methods for evaluating earthquake input for different levels include zonation map-based
procedures and site-specific studies. Map-based procedures, such as those normally provided
by national authorities in Europe, use maps of the peak ground acceleration to define the
seismic input at one or more different hazard levels and under different site conditions.
According to EN 1998-1 the recommended choice is the use of two types of spectra, Type 1
and Type 2. If the earthquakes that contribute most to the seismic hazard defined for the site
for the purpose of probabilistic hazard assessment have a surface-wave magnitude, Ms, not
Seismic Design according to EN 1998-1 and AzDTN 2.3-1
16
greater than 5.5 it is recommended that Type 2 spectrum is adopted, otherwise Type 1 should
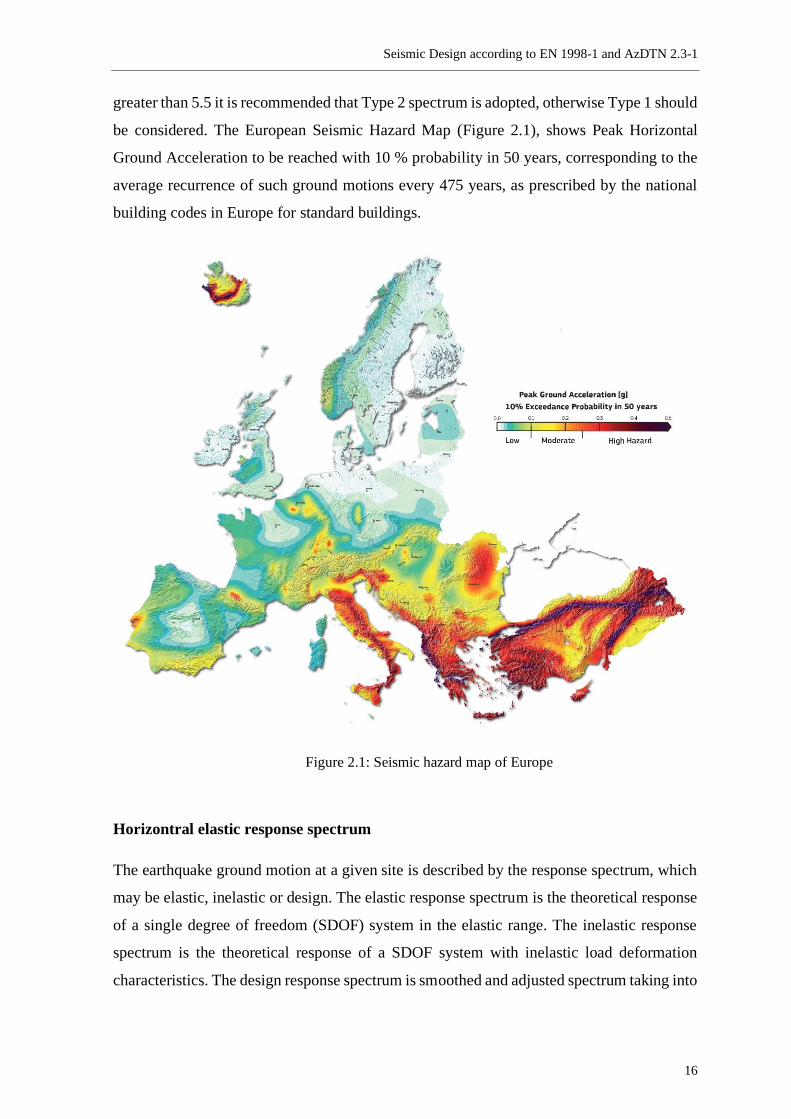
be considered. The European Seismic Hazard Map (Figure 2.1), shows Peak Horizontal
Ground Acceleration to be reached with 10 % probability in 50 years, corresponding to the
average recurrence of such ground motions every 475 years, as prescribed by the national
building codes in Europe for standard buildings.
Figure 2.1: Seismic hazard map of Europe
Horizontral elastic response spectrum
The earthquake ground motion at a given site is described by the response spectrum, which
may be elastic, inelastic or design. The elastic response spectrum is the theoretical response
of a single degree of freedom (SDOF) system in the elastic range. The inelastic response
spectrum is the theoretical response of a SDOF system with inelastic load deformation
characteristics. The design response spectrum is smoothed and adjusted spectrum taking into
Seismic Design according to EN 1998-1 and AzDTN 2.3-1
17
account non-theoretical features and requirements for safe design, which mean providing a
minimum base shear for long period structures.
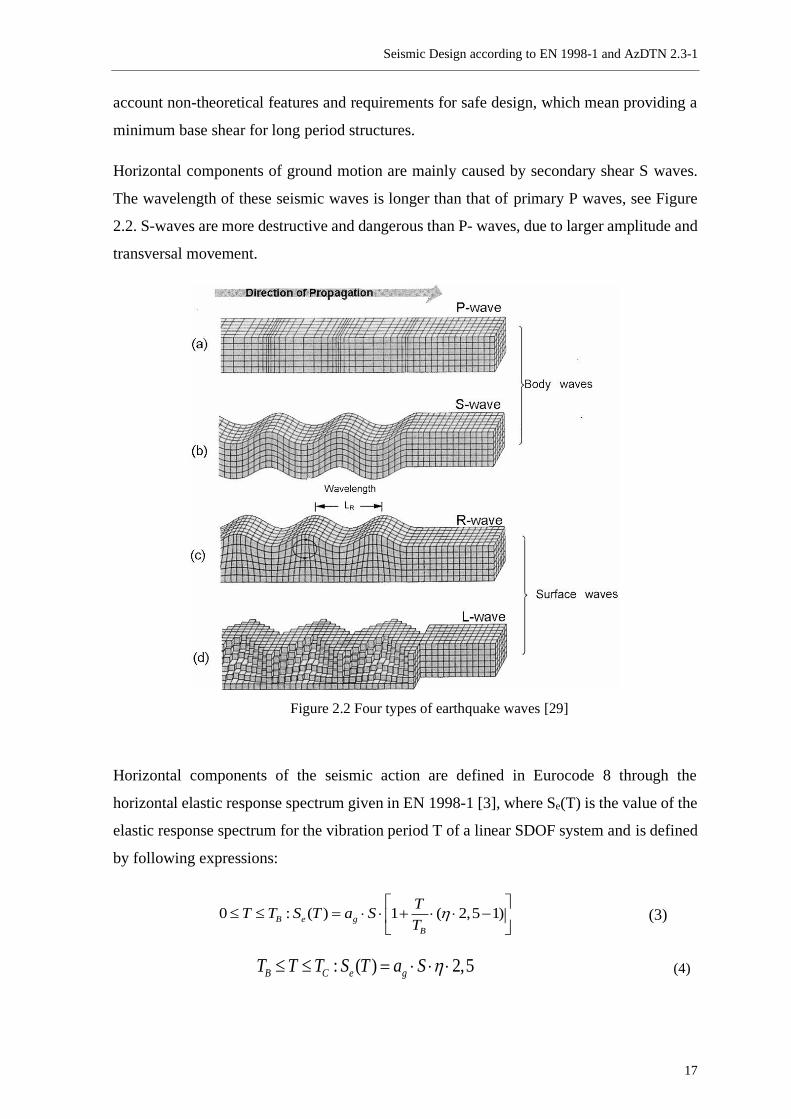
Horizontal components of ground motion are mainly caused by secondary shear S waves.
The wavelength of these seismic waves is longer than that of primary P waves, see Figure
2.2. S-waves are more destructive and dangerous than P- waves, due to larger amplitude and
transversal movement.
Figure 2.2 Four types of earthquake waves [29]
Horizontal components of the seismic action are defined in Eurocode 8 through the
horizontal elastic response spectrum given in EN 1998-1 [3], where Se(T) is the value of the
elastic response spectrum for the vibration period T of a linear SDOF system and is defined
by following expressions:
0 : ( ) 1 ( 2,5 1)B e g
B
TT T S T a S
T
= + −
(3)
: ( ) 2,5B C e gT T T S T a S = (4)
Seismic Design according to EN 1998-1 and AzDTN 2.3-1
18
2: ( ) 2,5 C D
C D e g
T TT T T S T a S
T
=
(5)
2: ( ) 2,5 C D
C D e g
T TT T T S T a S
T
=
(6)
where
Se(T) is the elastic response spectrum;
T is the vibration period of linear SDOF system;
ag is the design ground acceleration on type A ground (ag = 1agR);
TB is the lower limit of the period of the constant spectral acceleration branch;
TC is the upper limit of the period of the constant spectral acceleration branch;
TD is the value defining the beginning of the constant displacement response range of
the spectrum;
S is the soil factor;
is the damping correction factor with a reference value of = 1 for 5% viscous
damping, and determined by following expression:
10 / (5 ) 0,55 = + (7)
where is the viscous damping ratio of the structure, expressed as a percentage.
For each ground type values of TB, TC, TD and soil factor S, varies from country to county
and presented in National Annex.
There are two type of elastic response spectra, which distinguish by surface-wave magnitude
Ms. Type 1 elastic response spectra refers to surface-wave magnitude Ms, greater than 5,5,
consequently Type 2 refers to surface-wave magnitude Ms less than 5,5.
Ms is the surface wave magnitude which is a scale of earthquake based on Rayleigh surface
waves travelling in top layers.
For the five ground types A, B, C, D and E the recommended values of the parameters soil
factor (S) and vibration period on a point B (TB), C (TC) and D (TD) are given in Table 2.3.
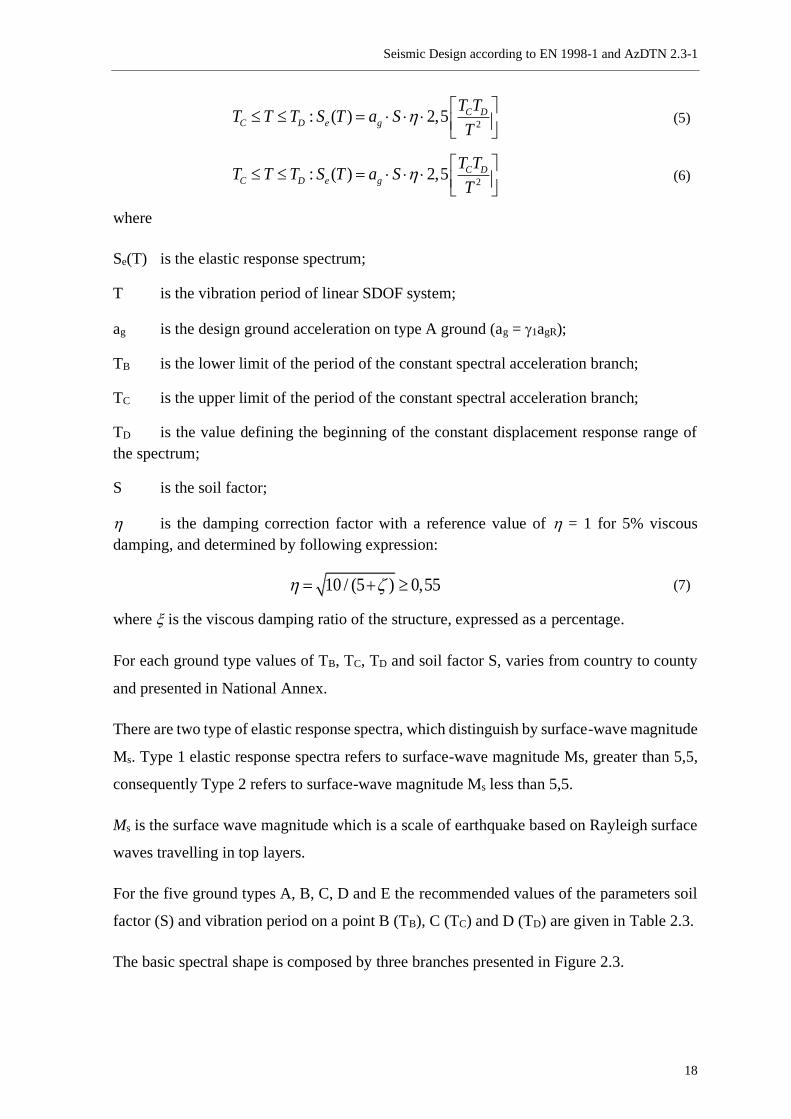
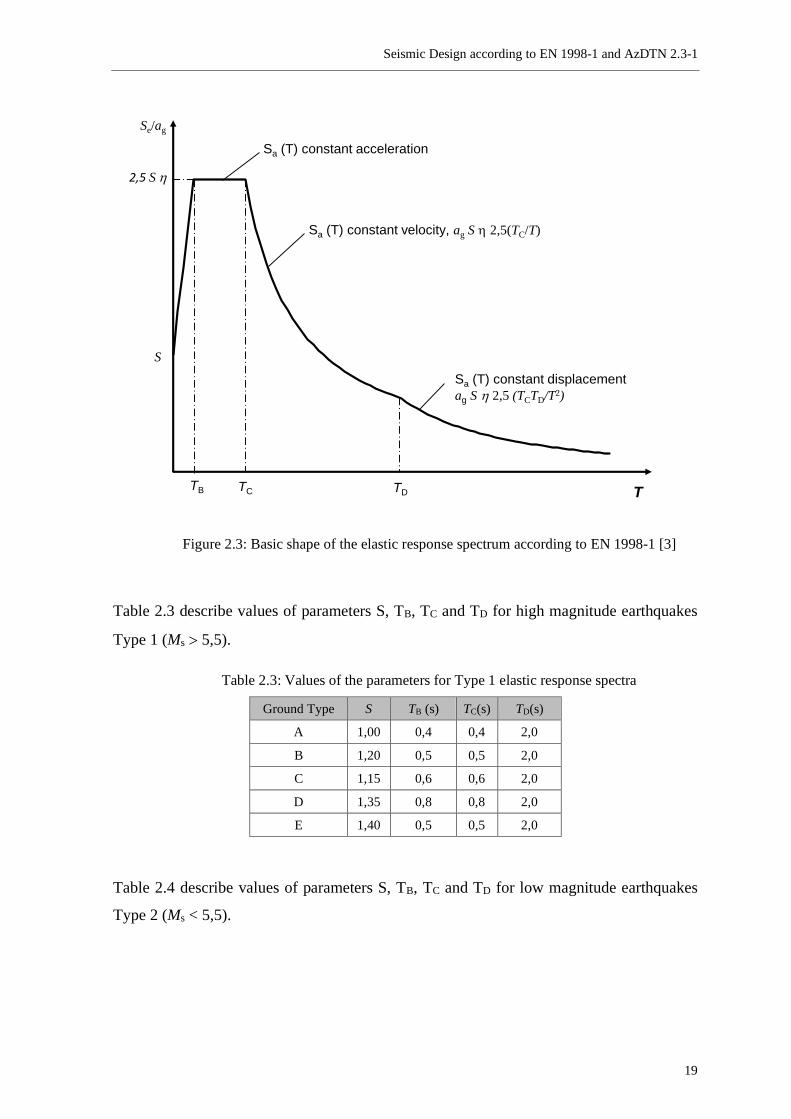
The basic spectral shape is composed by three branches presented in Figure 2.3.
Seismic Design according to EN 1998-1 and AzDTN 2.3-1
19
Figure 2.3: Basic shape of the elastic response spectrum according to EN 1998-1 [3]
Table 2.3 describe values of parameters S, TB, TC and TD for high magnitude earthquakes
Type 1 (Ms 5,5).
Table 2.3: Values of the parameters for Type 1 elastic response spectra
Ground Type S TB (s) TC(s) TD(s)
A 1,00 0,4 0,4 2,0
B 1,20 0,5 0,5 2,0
C 1,15 0,6 0,6 2,0
D 1,35 0,8 0,8 2,0
E 1,40 0,5 0,5 2,0
Table 2.4 describe values of parameters S, TB, TC and TD for low magnitude earthquakes
Type 2 (Ms < 5,5).
TB TC TD
Sa (T) constant acceleration
Sa (T) constant velocity, ag S 2,5(TC/T)
Sa (T) constant displacement
ag S 2,5 (TCTD/T2)
T
Se/ag
2,5 S
S
Seismic Design according to EN 1998-1 and AzDTN 2.3-1
20
Table 2.4: Values of the parameters for Type 2 elastic response spectra
Ground Type S TB (s) TC(s) TD(s)
A 1,00 0,05 0,25 1,2
B 1,35 0,05 0,25 1,2
C 1,50 0,10 0,25 1,2
D 1,80 0,10 0,30 1,2
E 1,60 0,05 0,25 1,2
Figure 2.4 present elastic response spectra Type 1 for five ground type A to E.
Figure 2.4: Elastic response spectra Type 1 for five soil types (5% damping)
The maximum value of spectral response acceleration for constant spectral acceleration
branch for soil type A, B, C, D and E are 2,5, 3,0, 2,875, 3,375 and 3,5 respectively. The
beginning of the constant displacement response range for all types of soil is on 2,0 seconds.
0.00
0.50
1.00
1.50
2.00
2.50
3.00
3.50
4.00
0.00 0.50 1.00 1.50 2.00 2.50 3.00 3.50 4.00 4.50
Acc
eler
atio
n S
e(T
)
Period T [sec]
Elastic Response Spectra EN 1998-1
Soil Type A
Soil Type B
Soil Type C
Soil Type D
Soil Type E
Seismic Design according to EN 1998-1 and AzDTN 2.3-1
21
Ground types S1 and S2 described in Table 2.1 require special studies for obtaining values
of soil factor S, TB, TC, TD.
The elastic acceleration response spectrum, Se(T), could be transformed to elastic
displacement response spectrum, SDe (T), by the following expression:
2
De ( ) ( )2
e
TS T S T
=
(8)
Expression (8) is suitable for vibration period not greater than 4,0 s.
Vertical elastic response spectrum
The vertical elastic response spectrum, Sve(T), expressed by following expressions (9-12).
0 : ( ) 1 ( 3,0 1)B ve vg
B
TT T S T a
T
= + −
(9)
: ( ) 3,0B C ve vgT T T S T a = (10)
: ( ) 3,0 CC D ve vg
TT T T S T a
T
=
(11)
24 : ( ) 3,0 C D
D ve vg
T TT T s S T a
T
=
(12)
In Table 2.5 presented values to determine vertical elastic response spectra.
Table 2.5: Recommended values of parameters describing
the vertical elastic response spectra
Spectrum avg/ag TB (s) TC (s) TD (s)
Type 1 0,90 0,05 0,15 1,0
Type 2 0,45 0,05 0,15 1,0
2.2.3. Buildings Design Under Seimic Actions
In order to reach more predictable behaviour of structure under seismic action, the following
principals should be applied to design of structure [3]:
– uniformity, symmetry and redundancy;
– adequate foundation;
– diaphragmatic behaviour at storey level;
Seismic Design according to EN 1998-1 and AzDTN 2.3-1
22
– bi-directional resistance and stiffness;
– torsional resistance and stiffness
– structural simplicity.
Also, buildings should be regular in elevation. To reach regularity in elevation several
conditions must be satisfied, such as:
– systems which resist to lateral load (shear walls, cores, frames) must be uninterrupted
from foundation to the last storey of building;
– mass of the individual storeys and lateral stiffness shall change gradually, and do not
present abrupt changes from foundation to the last storey of building;
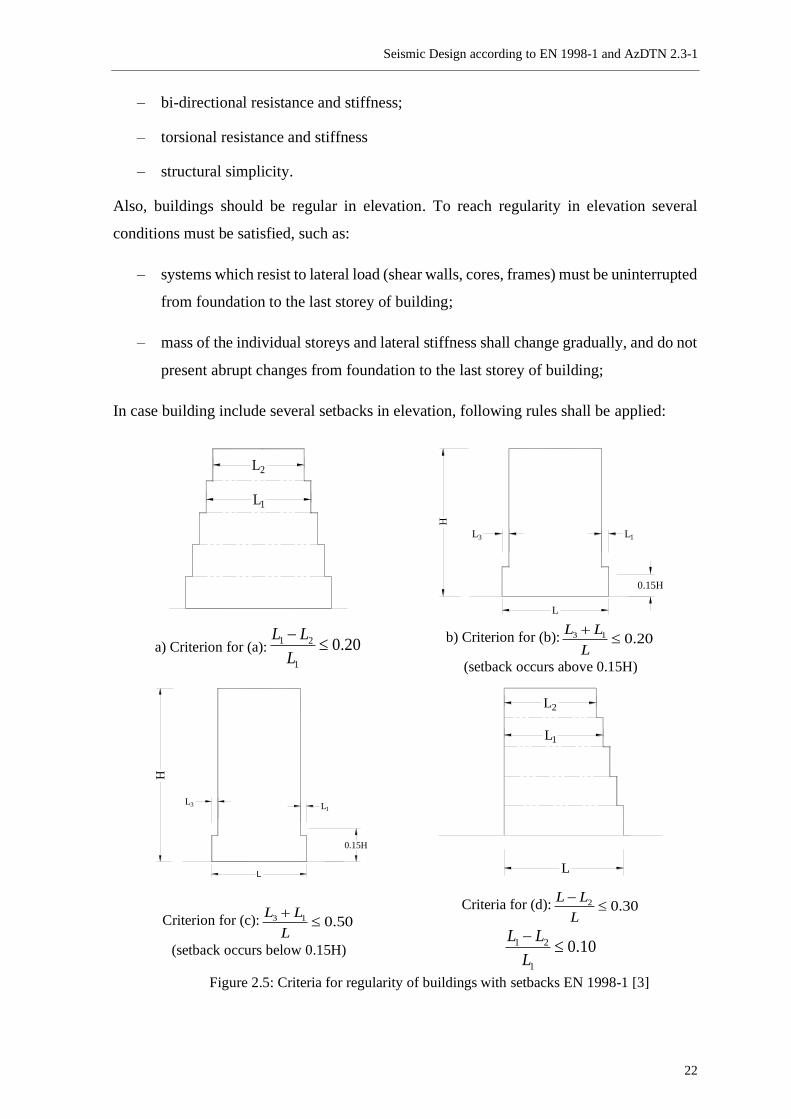
In case building include several setbacks in elevation, following rules shall be applied:
a) Criterion for (a):1 2
1
0.20L L
L
−
b) Criterion for (b): 3 1 0.20L L
L
+
(setback occurs above 0.15H)
Criterion for (c): 3 1 0.50L L
L
+
(setback occurs below 0.15H)
Criteria for (d): 2 0.30L L
L
−
1 2
1
0.10L L
L
−
Figure 2.5: Criteria for regularity of buildings with setbacks EN 1998-1 [3]
L2
L1
L3
L
H
L1
0.15H
L3
L
H
L1
0.15H
L2
L1
L
Seismic Design according to EN 1998-1 and AzDTN 2.3-1
23
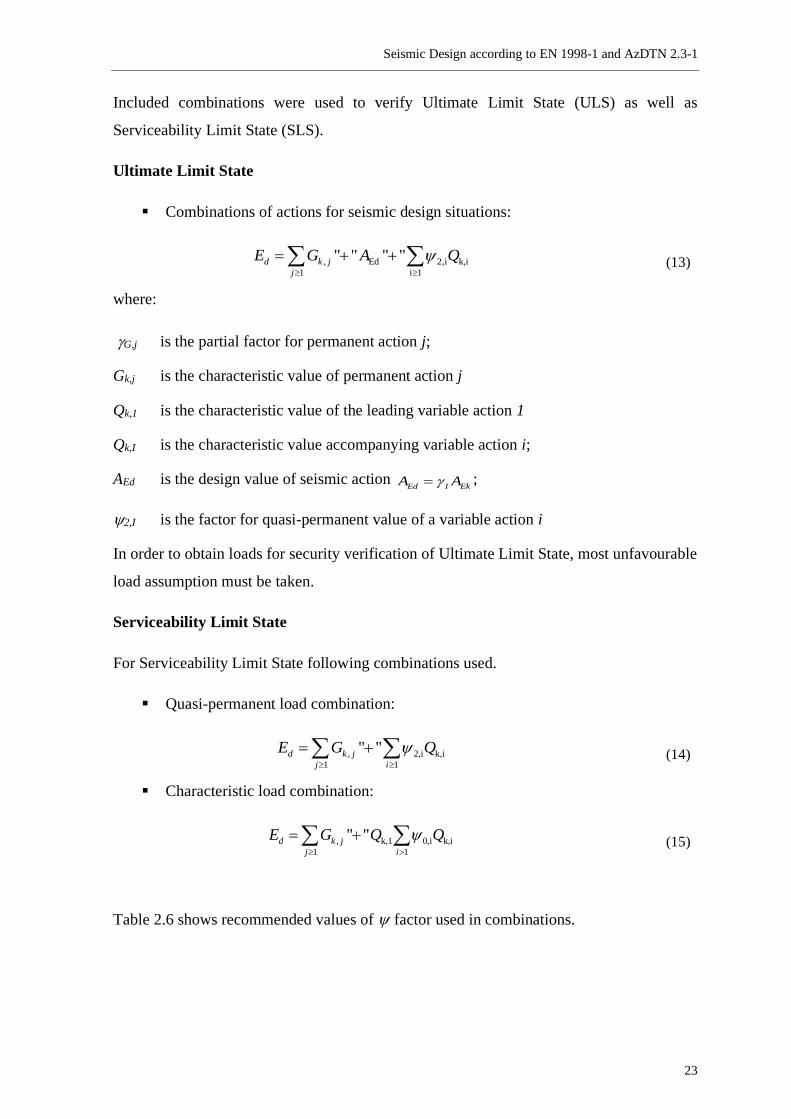
Included combinations were used to verify Ultimate Limit State (ULS) as well as
Serviceability Limit State (SLS).
Ultimate Limit State
▪ Combinations of actions for seismic design situations:
, Ed 2,i k,i
1 i 1
" " " "d k j
j
E G A Q
= + + (13)
where:
G,j is the partial factor for permanent action j;
Gk,j is the characteristic value of permanent action j
Qk,1 is the characteristic value of the leading variable action 1
Qk,I is the characteristic value accompanying variable action i;
AEd is the design value of seismic action Ed I EkA A= ;
2,I is the factor for quasi-permanent value of a variable action i
In order to obtain loads for security verification of Ultimate Limit State, most unfavourable
load assumption must be taken.
Serviceability Limit State
For Serviceability Limit State following combinations used.
▪ Quasi-permanent load combination:
, 2,i k,i
1 1
" "d k j
j i
E G Q
= + (14)
▪ Characteristic load combination:
, k,1 0,i k,i
1 1
" "d k j
j i
E G Q Q
= + (15)
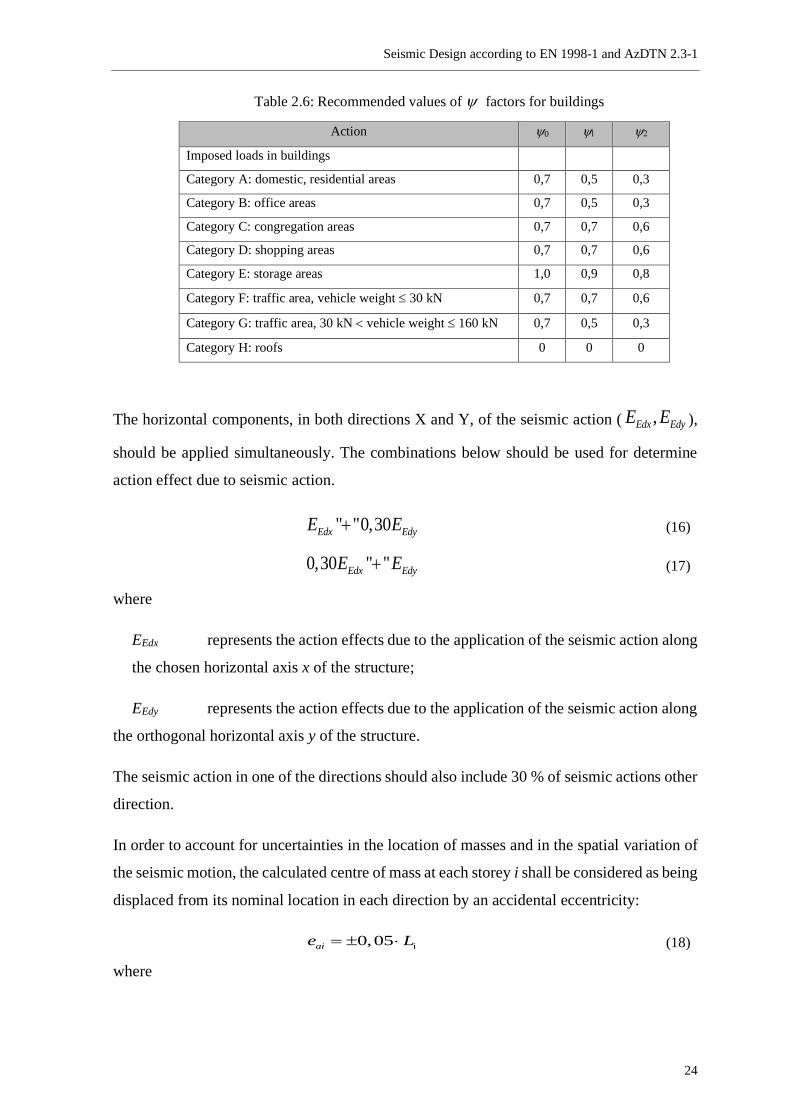
Table 2.6 shows recommended values of factor used in combinations.
Seismic Design according to EN 1998-1 and AzDTN 2.3-1
24
Table 2.6: Recommended values of factors for buildings
Action 0
Imposed loads in buildings
Category A: domestic, residential areas 0,7 0,5 0,3
Category B: office areas 0,7 0,5 0,3
Category C: congregation areas 0,7 0,7 0,6
Category D: shopping areas 0,7 0,7 0,6
Category E: storage areas 1,0 0,9 0,8
Category F: traffic area, vehicle weight 30 kN 0,7 0,7 0,6
Category G: traffic area, 30 kN vehicle weight 160 kN 0,7 0,5 0,3
Category H: roofs 0 0 0
The horizontal components, in both directions X and Y, of the seismic action ( ,Edx EdyE E ),
should be applied simultaneously. The combinations below should be used for determine
action effect due to seismic action.
" "0,30Edx EdyE E+ (16)
0,30 " "Edx EdyE E+ (17)
where
EEdx represents the action effects due to the application of the seismic action along
the chosen horizontal axis x of the structure;
EEdy represents the action effects due to the application of the seismic action along
the orthogonal horizontal axis y of the structure.
The seismic action in one of the directions should also include 30 % of seismic actions other
direction.
In order to account for uncertainties in the location of masses and in the spatial variation of
the seismic motion, the calculated centre of mass at each storey i shall be considered as being
displaced from its nominal location in each direction by an accidental eccentricity:
i0,05aie L= (18)
where
Seismic Design according to EN 1998-1 and AzDTN 2.3-1
25
eai is the accidental eccentricity of storey mass I from its nominal location, applied in
the same direction at all storeys;
Li is the storey-dimension perpendicular to the direction of the seismic action
Distribution of the horizontal seismic forces
Horizontal forces Fi, shall be applied to structure to imitate seismic action effects and
determined by following expression:
i ii b
j j
s mF F
s m
=
(19)
where
Fi is the horizontal force acting on storey i;
Fb is the seismic base shear in shear in accordance with expression 20;
si,sj are the displacement of masses mi, mj in the fundamental mode shape;
mi,mj are the storey masses.
The horizontal forces Fi, should computed by expression 21, in case horizontal displacement
increasing linearly along the height.
i ii b
j j
z mF F
z m
=
(20)
where
zi,zj are the heights of the masses mi,mj above the level of application of the seismic
action.
The horizontal forces Fi shall be linearly distributed to the whole height of structure.
Base shear
For both horizontal direction seismic base shear force Fb, shall be determined by expression
(21).
1( )b dF S T m = (21)
where
Seismic Design according to EN 1998-1 and AzDTN 2.3-1
26
Sd(T1) is the ordinate of the design spectrum at period T1;
T1 is the fundamental period of vibration of the building for lateral motion in the
direction considered;
m is the mass of the building, above the foundation or above the top of a rigid
basement.
is the correction factor, the value of which is equal to: = 0,85 if T1 2 TC
and the building has more than two storeys, or = 1,0 otherwise.
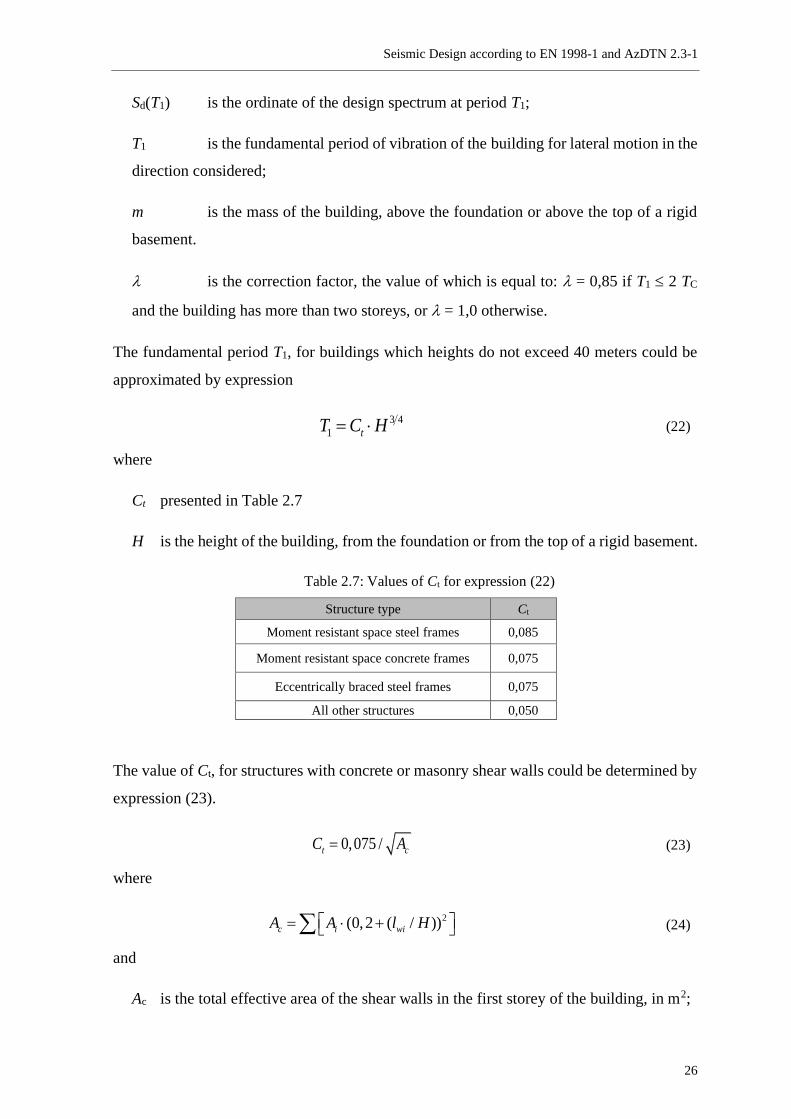
The fundamental period T1, for buildings which heights do not exceed 40 meters could be
approximated by expression
3 4
1 tT C H= (22)
where
Ct presented in Table 2.7
H is the height of the building, from the foundation or from the top of a rigid basement.
Table 2.7: Values of Ct for expression (22)
Structure type Ct
Moment resistant space steel frames 0,085
Moment resistant space concrete frames 0,075
Eccentrically braced steel frames 0,075
All other structures 0,050
The value of Ct, for structures with concrete or masonry shear walls could be determined by
expression (23).
0,075 /t cC A= (23)
where
2(0,2 ( / ))c i wiA A l H = + (24)
and
Ac is the total effective area of the shear walls in the first storey of the building, in m2;
Seismic Design according to EN 1998-1 and AzDTN 2.3-1
27
Ai is the effective cross-sectional area of shear wall i in the direction considered in the
first storey of the building, in m2;
lwi is the length of the shear wall i in the first storey in the direction parallel to the applied
forces, with the restriction that lwi/H should not exceed 0,9.
Also, fundamental period could be obtained by expression (25)
1 2T d= (25)
where
d is the lateral elastic displacement of the top of the building, due to the gravity loads
applied in the horizontal direction.
2.2.4. Particular Factors and Rules
Structural types
According to how structures respond to seismic action concrete buildings shall be classified
into several structural types, such as:
– Torsionally flexible systems
– Dual system of frames and walls
– System of large lightly reinforced walls
– Inverted pendulum systems
– Frame systems
– Wall systems either coupled or uncoupled walls.
Inverted pendulum systems and torsionally flexible systems have specific undesirable
features, for that reason values of behaviour factor q lower. The reason to reduce behaviour
factor is to keep responses closer to the elastic range.
Concrete buildings could be classified into two types of structural systems, first in one
horizontal direction and second in another horizontal direction, excluding torsionally
flexible systems.
Behaviour factor
The behaviour factor q is an approximation of the ratio of the seismic forces that the structure
would experience if its response was completely elastic with 5% viscous damping, to the
Seismic Design according to EN 1998-1 and AzDTN 2.3-1
28
seismic forces that may be used in the design, with a conventional elastic analysis model,
still ensuring a satisfactory response of the structure. The values of the behaviour factor q,
which also account for the influence of the viscous damping being different from 5%, are
given for various materials and structural system according to the relevant ductility classes.
The value of the behaviour factor q may be different in different horizontal directions of the
structure, although the ductility classification shall be the same in all directions. The
behaviour factor q, is the value which depend on structural systems and materials.
Concrete buildings may alternatively be designed for low dissipation capacity and low
ductility, and neglecting the specific provisions.
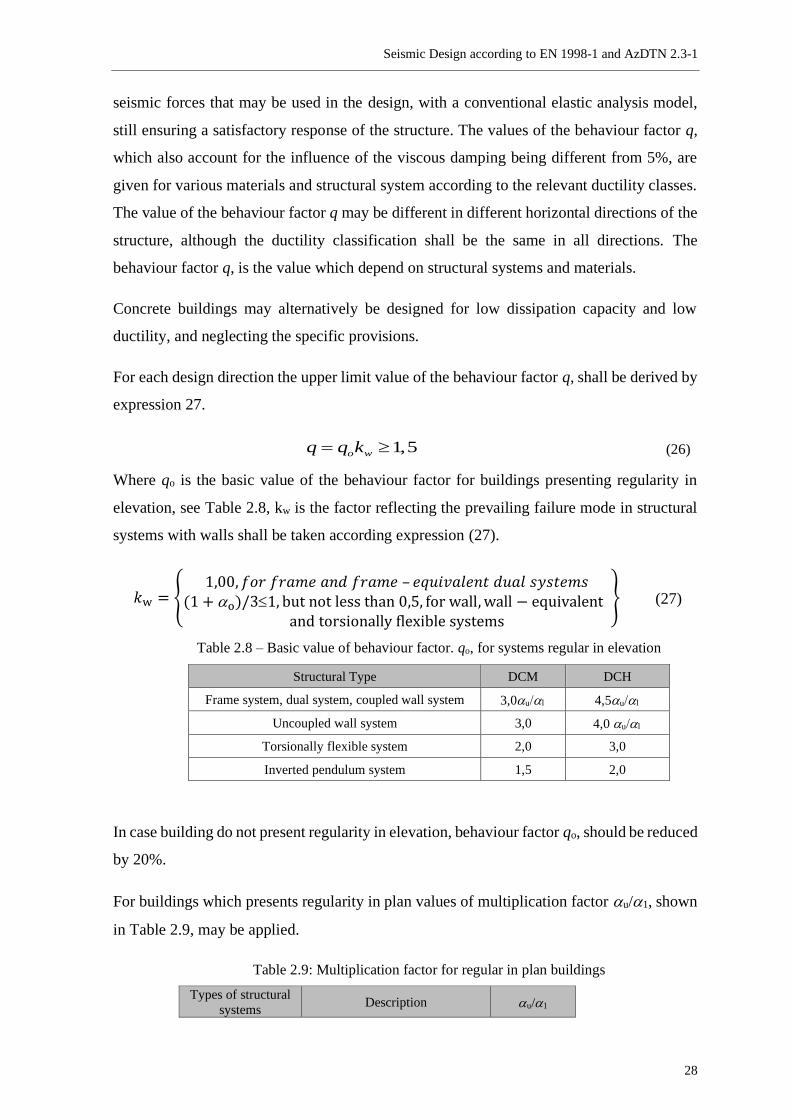
For each design direction the upper limit value of the behaviour factor q, shall be derived by
expression 27.
1,5o wq q k= (26)
Where qo is the basic value of the behaviour factor for buildings presenting regularity in
elevation, see Table 2.8, kw is the factor reflecting the prevailing failure mode in structural
systems with walls shall be taken according expression (27).
𝑘w = {1,00, 𝑓𝑜𝑟 𝑓𝑟𝑎𝑚𝑒 𝑎𝑛𝑑 𝑓𝑟𝑎𝑚𝑒 – 𝑒𝑞𝑢𝑖𝑣𝑎𝑙𝑒𝑛𝑡 𝑑𝑢𝑎𝑙 𝑠𝑦𝑠𝑡𝑒𝑚𝑠
(1 + o)/31, but not less than 0,5, for wall, wall − equivalent and torsionally flexible systems
} (27)
Table 2.8 – Basic value of behaviour factor. qo, for systems regular in elevation
Structural Type DCM DCH
Frame system, dual system, coupled wall system 3,0u 4,5u
Uncoupled wall system 3,0 4,0 u
Torsionally flexible system 2,0 3,0
Inverted pendulum system 1,5 2,0
In case building do not present regularity in elevation, behaviour factor qo, should be reduced
by 20%.
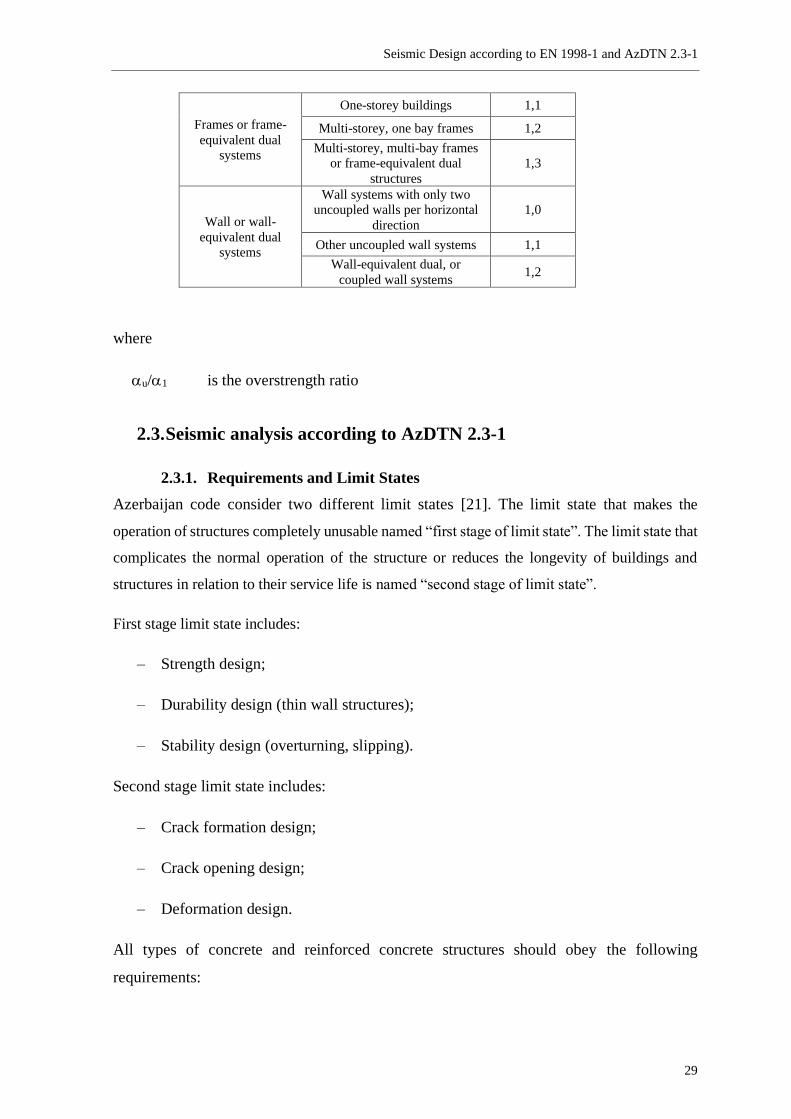
For buildings which presents regularity in plan values of multiplication factor u/1, shown
in Table 2.9, may be applied.
Table 2.9: Multiplication factor for regular in plan buildings
Types of structural
systems Description u/1
Seismic Design according to EN 1998-1 and AzDTN 2.3-1
29
Frames or frame-
equivalent dual
systems
One-storey buildings 1,1
Multi-storey, one bay frames 1,2
Multi-storey, multi-bay frames
or frame-equivalent dual
structures
1,3
Wall or wall-
equivalent dual
systems
Wall systems with only two
uncoupled walls per horizontal
direction
1,0
Other uncoupled wall systems 1,1
Wall-equivalent dual, or
coupled wall systems 1,2
where
u/1 is the overstrength ratio
2.3. Seismic analysis according to AzDTN 2.3-1
2.3.1. Requirements and Limit States
Azerbaijan code consider two different limit states [21]. The limit state that makes the
operation of structures completely unusable named “first stage of limit state”. The limit state that
complicates the normal operation of the structure or reduces the longevity of buildings and
structures in relation to their service life is named “second stage of limit state”.
First stage limit state includes:
– Strength design;
– Durability design (thin wall structures);
– Stability design (overturning, slipping).
Second stage limit state includes:
– Crack formation design;
– Crack opening design;
– Deformation design.
All types of concrete and reinforced concrete structures should obey the following
requirements:
Seismic Design according to EN 1998-1 and AzDTN 2.3-1
30
– In terms of safety requirement;
– In terms of operational suitability;
– In terms of durability;
To meet safety requirements, structures must have such initial characteristics that with a
proper degree of reliability under various design impacts in the process of construction and
operation of buildings and structures, the destruction of any nature or impairment of
usability, related to harm to life or health of citizens, property and environment have to be
excluded.
To meet operational requirements the design must have such initial characteristics that with
the appropriate degree of reliability for various design, the formation or excessive opening
of cracks do not occur, as well as excessive movement, vibrations and other damage occurred
hindering normal operation.
To meet the requirements of durability, the structure must have such initial characteristics
that within the established time, structure would satisfy the safety requirements and
serviceability, considering impacts of geometric structural characteristics and mechanical
characteristics of materials.
Azerbaijan seismic code requires the installation of engineering seismic observation stations
in order to obtain reliable information during earthquake in high level responsibility
buildings and structures as well as buildings and structures which height exceeds 75 meters
and 16 storeys.
Actions in the structures of buildings and constructions designed for construction in seismic
areas, as well as in their elements, should be determined taking into account at least three
shapes of natural vibrations, in case of the periods of the first (lowest) shape of natural
vibrations T1 are more than 0,4 second, and taking into account only the first shape, if T1 is
equal to or less than 0,4 second.
2.3.2. Seismic Action and Soil Parameters
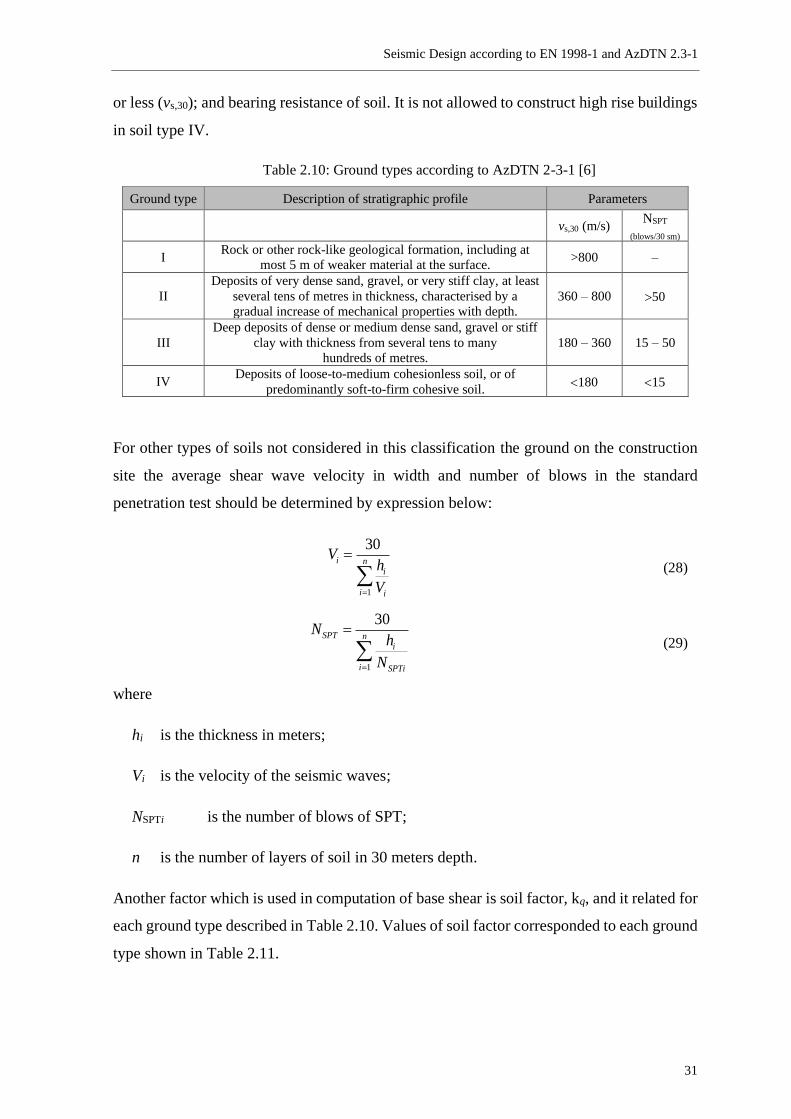
This code has four types of soil, I, II, III and IV (see Table 2.10). Based on their seismic
characteristics soil classified by: Standard Penetration Test (NSPT); average value of
propagation velocity of S waves in the upper 30 m of the soil profile at shear strain of 10–5
Seismic Design according to EN 1998-1 and AzDTN 2.3-1
31
or less (vs,30); and bearing resistance of soil. It is not allowed to construct high rise buildings
in soil type IV.
Table 2.10: Ground types according to AzDTN 2-3-1 [6]
Ground type Description of stratigraphic profile Parameters
vs,30 (m/s) NSPT
(blows/30 sm)
I Rock or other rock-like geological formation, including at
most 5 m of weaker material at the surface. >800 –
II
Deposits of very dense sand, gravel, or very stiff clay, at least
several tens of metres in thickness, characterised by a
gradual increase of mechanical properties with depth.
360 – 800 50
III
Deep deposits of dense or medium dense sand, gravel or stiff
clay with thickness from several tens to many
hundreds of metres.
180 – 360 15 – 50
IV Deposits of loose-to-medium cohesionless soil, or of
predominantly soft-to-firm cohesive soil. 180 15
For other types of soils not considered in this classification the ground on the construction
site the average shear wave velocity in width and number of blows in the standard
penetration test should be determined by expression below:
1
30i n
i
i i
Vh
V=
=
(28)
1
30SPT n
i
i SPTi
Nh
N=
=
(29)
where
hi is the thickness in meters;
Vi is the velocity of the seismic waves;
NSPTi is the number of blows of SPT;
n is the number of layers of soil in 30 meters depth.
Another factor which is used in computation of base shear is soil factor, kq, and it related for
each ground type described in Table 2.10. Values of soil factor corresponded to each ground
type shown in Table 2.11.
Seismic Design according to EN 1998-1 and AzDTN 2.3-1
32
Table 2.11: Soil factor according to AzDTN 2.3-1 [6]
Ground type Soil factor kq
I 0,7
II 1,0
III 1,3
IV 1,6
Seismic zones
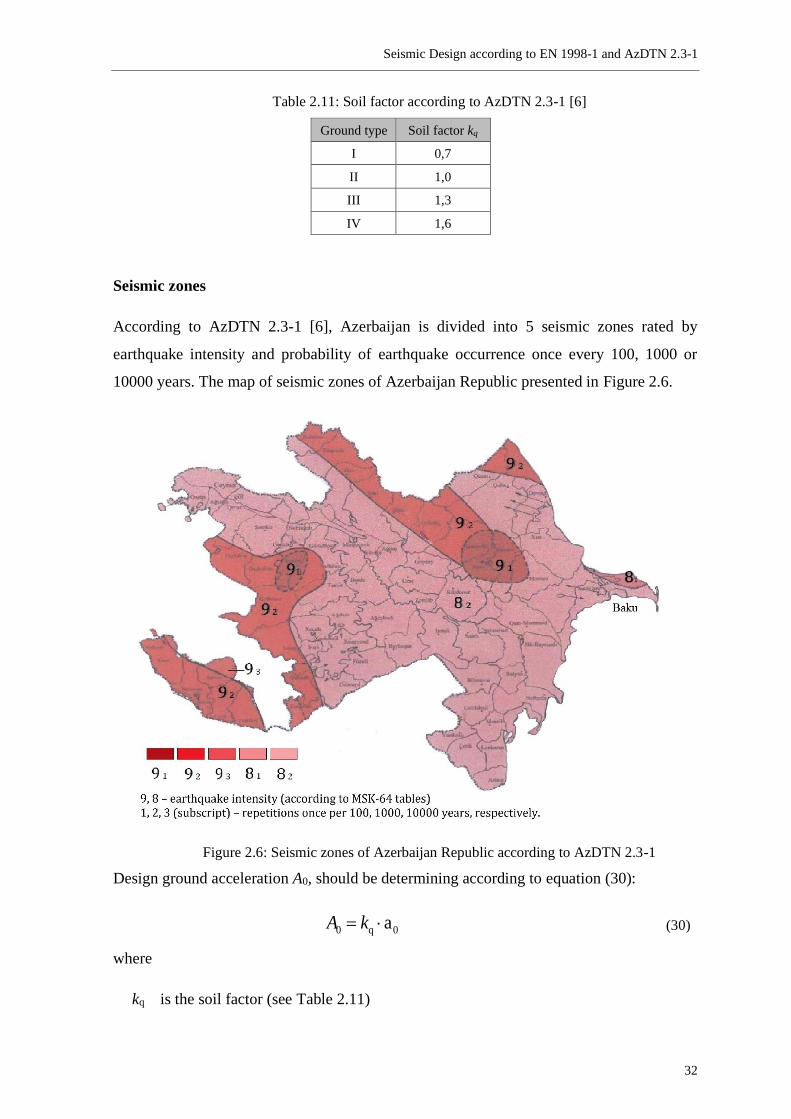
According to AzDTN 2.3-1 [6], Azerbaijan is divided into 5 seismic zones rated by
earthquake intensity and probability of earthquake occurrence once every 100, 1000 or
10000 years. The map of seismic zones of Azerbaijan Republic presented in Figure 2.6.
Figure 2.6: Seismic zones of Azerbaijan Republic according to AzDTN 2.3-1
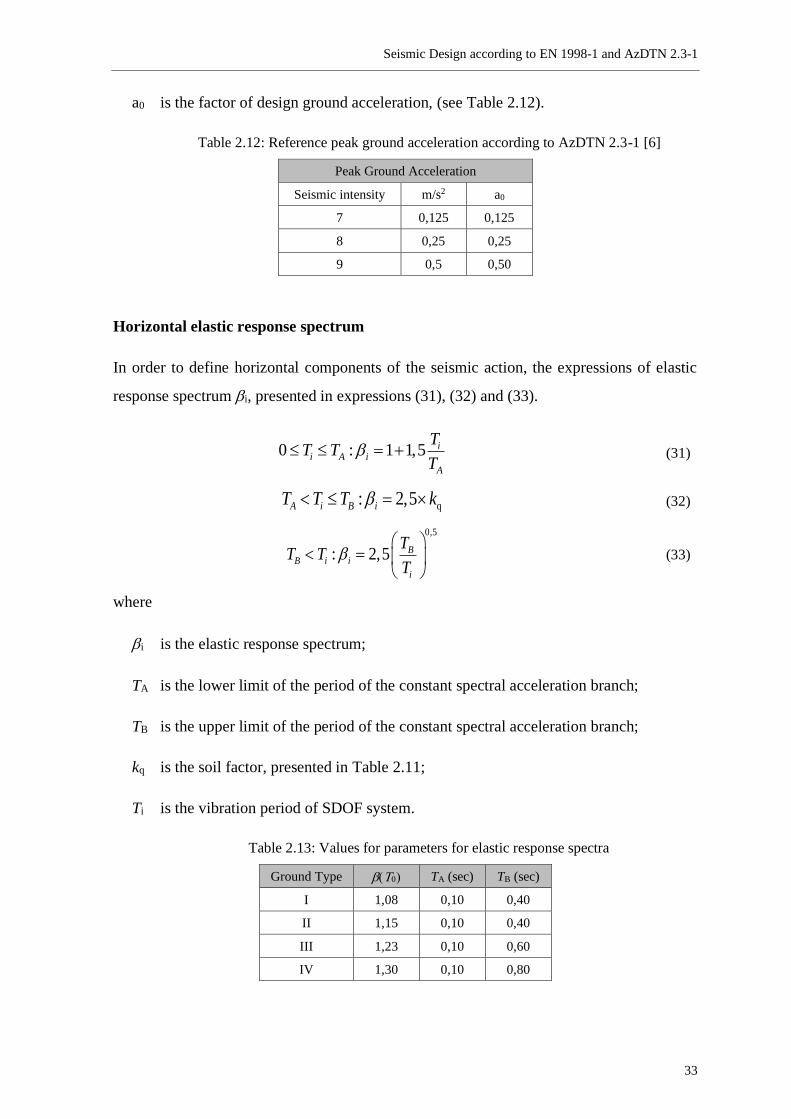
Design ground acceleration A0, should be determining according to equation (30):
0 q 0aA k= (30)
where
kq is the soil factor (see Table 2.11)
Seismic Design according to EN 1998-1 and AzDTN 2.3-1
33
a0 is the factor of design ground acceleration, (see Table 2.12).
Table 2.12: Reference peak ground acceleration according to AzDTN 2.3-1 [6]
Peak Ground Acceleration
Seismic intensity m/s2 a0
7 0,125 0,125
8 0,25 0,25
9 0,5 0,50
Horizontal elastic response spectrum
In order to define horizontal components of the seismic action, the expressions of elastic
response spectrum i, presented in expressions (31), (32) and (33).
0 : 1 1,5 ii A i
A
TT T
T = + (31)
q: 2,5A i B iT T T k = (32)
0,5
: 2,5 BB i i
i
TT T
T
=
(33)
where
i is the elastic response spectrum;
TA is the lower limit of the period of the constant spectral acceleration branch;
TB is the upper limit of the period of the constant spectral acceleration branch;
kq is the soil factor, presented in Table 2.11;
Ti is the vibration period of SDOF system.
Table 2.13: Values for parameters for elastic response spectra
Ground Type () TA (sec) TB (sec)
I 1,08 0,10 0,40
II 1,15 0,10 0,40
III 1,23 0,10 0,60
IV 1,30 0,10 0,80

Seismic Design according to EN 1998-1 and AzDTN 2.3-1
34
The value of elastic response spectrum i, should not be accepted less than 1,0 for ground
types I and II while for ground types III and IV should not be accepted less than 1,2 (see
Table 2.13).
For the four ground types I, II, III and IV (see Table 2.10) presented in Azerbaijan seismic
code the values of the elastic response factor i, corresponding to period (i) of structure and
vibration period on a point A (TA), B (TB) are given in Table 2.13.
The basic spectral shape is composed by two branches presented below in Figure 2.7.
Figure 2.7: Basic shape of the elastic response spectrum of AzDTN 2.3-1 [6]
The short period range continues from TA to TB period and represents branch of constant
spectral response acceleration.
Elastic response spectra for all ground types are presented in Figure 2.8.
Seismic Design according to EN 1998-1 and AzDTN 2.3-1
35
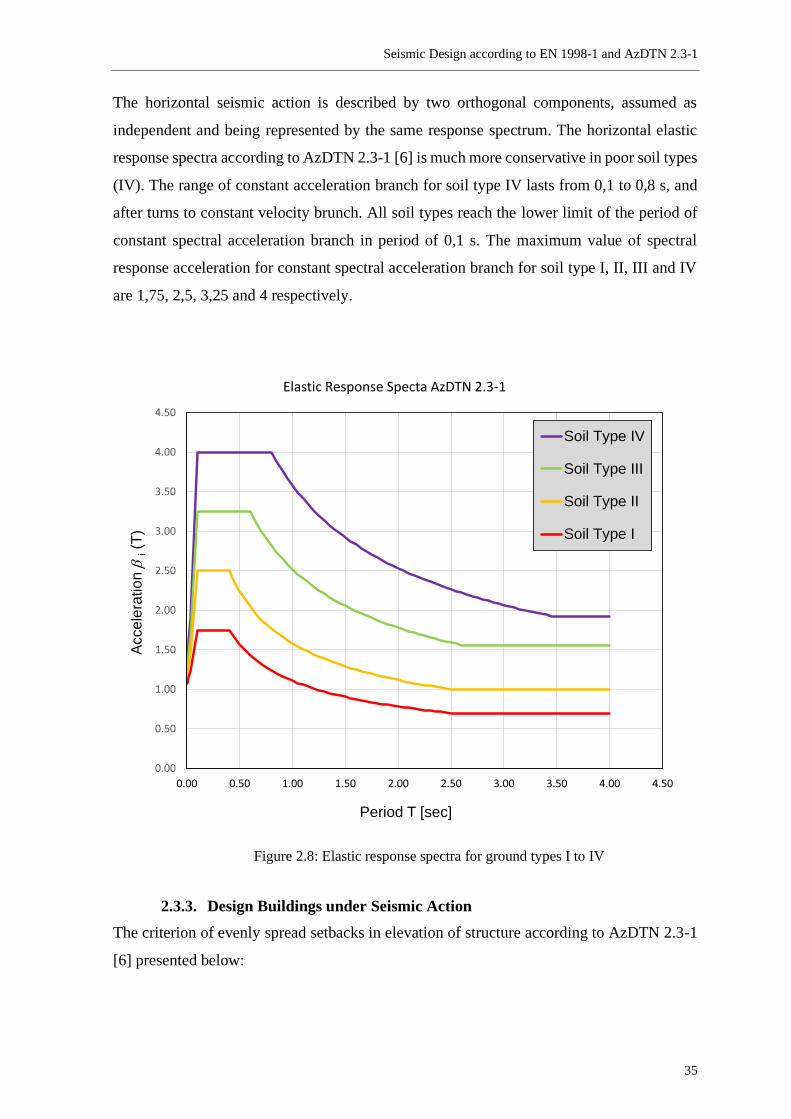
The horizontal seismic action is described by two orthogonal components, assumed as
independent and being represented by the same response spectrum. The horizontal elastic
response spectra according to AzDTN 2.3-1 [6] is much more conservative in poor soil types
(IV). The range of constant acceleration branch for soil type IV lasts from 0,1 to 0,8 s, and
after turns to constant velocity brunch. All soil types reach the lower limit of the period of
constant spectral acceleration branch in period of 0,1 s. The maximum value of spectral
response acceleration for constant spectral acceleration branch for soil type I, II, III and IV
are 1,75, 2,5, 3,25 and 4 respectively.
Figure 2.8: Elastic response spectra for ground types I to IV
2.3.3. Design Buildings under Seismic Action
The criterion of evenly spread setbacks in elevation of structure according to AzDTN 2.3-1
[6] presented below:
0.00
0.50
1.00
1.50
2.00
2.50
3.00
3.50
4.00
4.50
0.00 0.50 1.00 1.50 2.00 2.50 3.00 3.50 4.00 4.50
Accele
ration
i(T
)
Period T [sec]
Elastic Response Specta AzDTN 2.3-1
Soil Type IV
Soil Type III
Soil Type II
Soil Type I
Seismic Design according to EN 1998-1 and AzDTN 2.3-1
36
(a) Criterion: 2 1 0.50L L
L
+ (b) Criterion: 2 1 0.20
L L
L
+
2
1
0.4 0.6L
L=
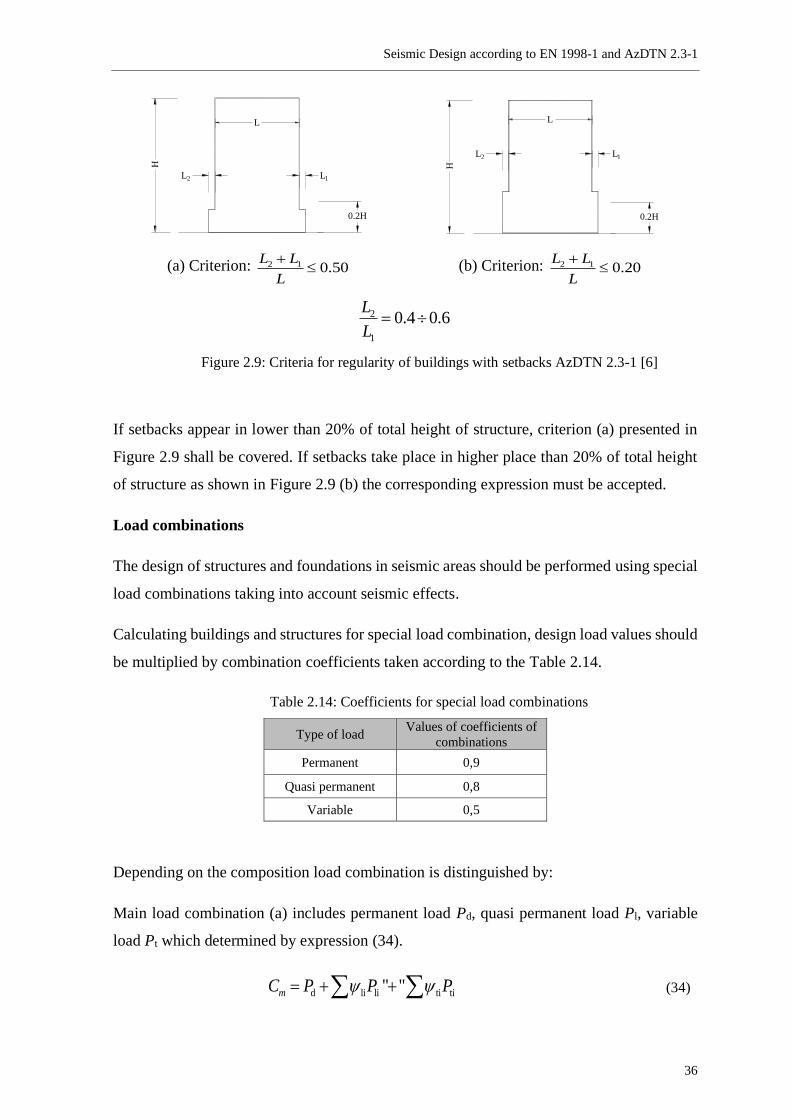
Figure 2.9: Criteria for regularity of buildings with setbacks AzDTN 2.3-1 [6]
If setbacks appear in lower than 20% of total height of structure, criterion (a) presented in
Figure 2.9 shall be covered. If setbacks take place in higher place than 20% of total height
of structure as shown in Figure 2.9 (b) the corresponding expression must be accepted.
Load combinations
The design of structures and foundations in seismic areas should be performed using special
load combinations taking into account seismic effects.
Calculating buildings and structures for special load combination, design load values should
be multiplied by combination coefficients taken according to the Table 2.14.
Table 2.14: Coefficients for special load combinations
Type of load Values of coefficients of
combinations
Permanent 0,9
Quasi permanent 0,8
Variable 0,5
Depending on the composition load combination is distinguished by:
Main load combination (a) includes permanent load Pd, quasi permanent load Pl, variable
load Pt which determined by expression (34).
d li li ti ti" "mC P P P = + + (34)
L2
H
L1
0.2H
L
L2
H
L1
0.2H
L
Seismic Design according to EN 1998-1 and AzDTN 2.3-1
37
where
Cm is the main load combination;
Pd is the permanent load;
Pl is the quasi permanent load;
Pt is the variable load;
li is the coefficient for quasi permanent combination (i=1, 2, 3, …);
ti is the coefficient for variable combination (i=1, 2, 3, …).
Special load combination (b) includes permanent load Pd, quasi permanent load Pl, quasi
permanent load Pt and one of the special load Ps, and should be obtained by expression (35).
s m sC C P= + (35)
where
Cs is the special load combination;
Ps is the special loads.
Special loads Ps, include:
– Seismic loads;
– Explosion loads;
– Loads caused by severe technological process interruption, temporary malfunction or
break of equipment;
– Loads caused by fire;
– Loads caused by car accident with members of structure.
Coefficients for main loads combination (a), presented in Table 2.15.
Table 2.15: Coefficients for main load combination
Characteristic of load Designation Value
First important variable load t1 1,00
Second important variable load t2 0,90
Third and subsequent important
variable loads t3… 0,70
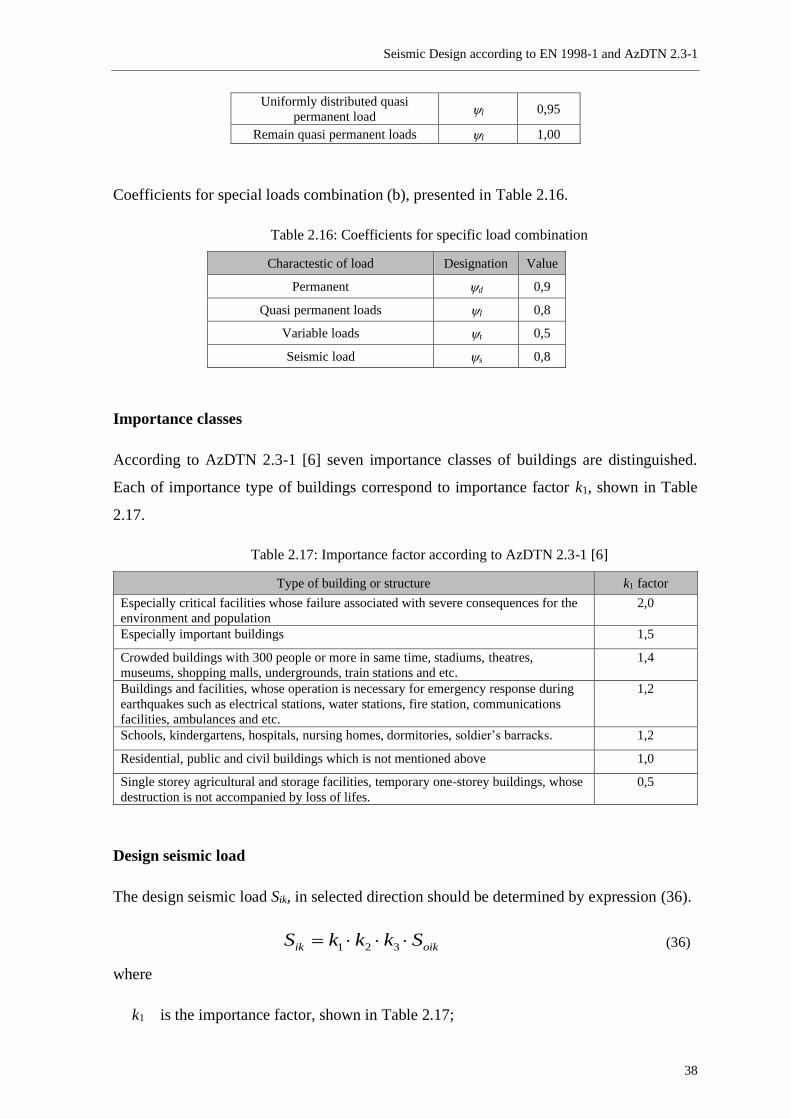
Seismic Design according to EN 1998-1 and AzDTN 2.3-1
38
Uniformly distributed quasi
permanent load l 0,95
Remain quasi permanent loads l 1,00
Coefficients for special loads combination (b), presented in Table 2.16.
Table 2.16: Coefficients for specific load combination
Charactestic of load Designation Value
Permanent d 0,9
Quasi permanent loads l 0,8
Variable loads t 0,5
Seismic load s 0,8
Importance classes
According to AzDTN 2.3-1 [6] seven importance classes of buildings are distinguished.
Each of importance type of buildings correspond to importance factor k1, shown in Table
2.17.
Table 2.17: Importance factor according to AzDTN 2.3-1 [6]
Type of building or structure k1 factor
Especially critical facilities whose failure associated with severe consequences for the
environment and population
2,0
Especially important buildings 1,5
Crowded buildings with 300 people or more in same time, stadiums, theatres,
museums, shopping malls, undergrounds, train stations and etc.
1,4
Buildings and facilities, whose operation is necessary for emergency response during
earthquakes such as electrical stations, water stations, fire station, communications
facilities, ambulances and etc.
1,2
Schools, kindergartens, hospitals, nursing homes, dormitories, soldier’s barracks. 1,2
Residential, public and civil buildings which is not mentioned above 1,0
Single storey agricultural and storage facilities, temporary one-storey buildings, whose
destruction is not accompanied by loss of lifes.
0,5
Design seismic load
The design seismic load Sik, in selected direction should be determined by expression (36).
1 2 3ik oikS k k k S= (36)
where
k1 is the importance factor, shown in Table 2.17;
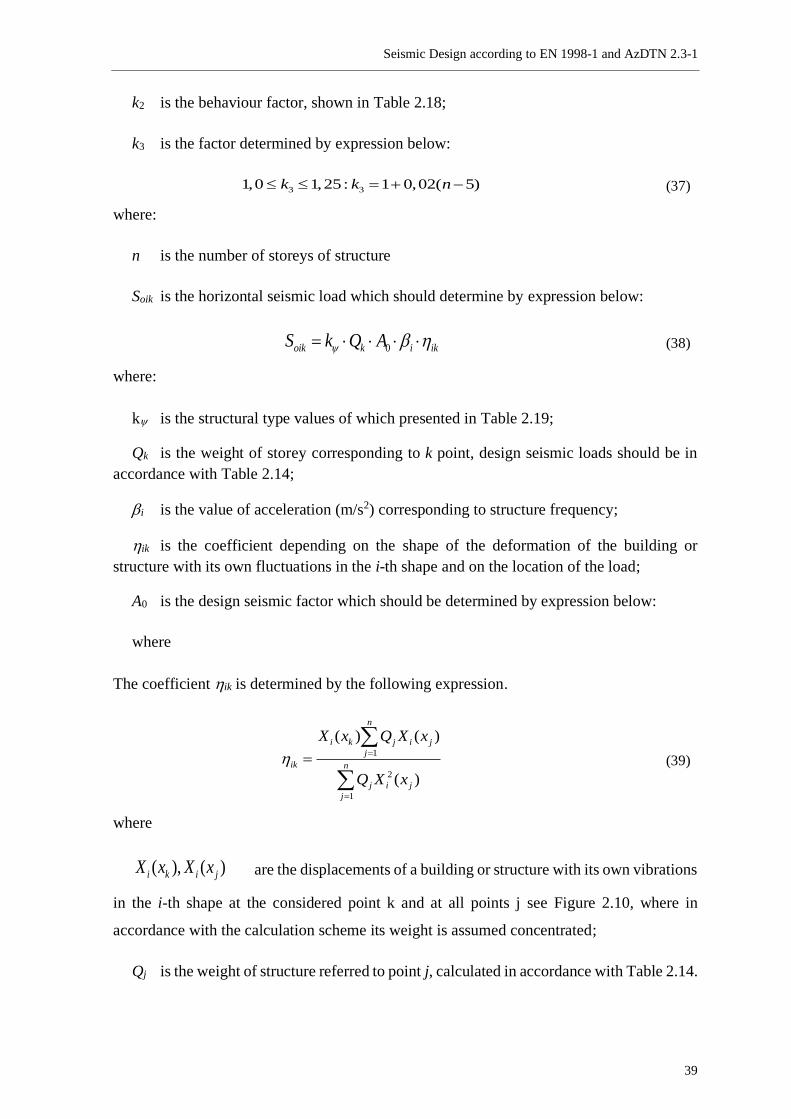
Seismic Design according to EN 1998-1 and AzDTN 2.3-1
39
k2 is the behaviour factor, shown in Table 2.18;
k3 is the factor determined by expression below:
3 31,0 1,25: 1 0,02( 5)k k n = + − (37)
where:
n is the number of storeys of structure
Soik is the horizontal seismic load which should determine by expression below:
0oik k i ikS k Q A = (38)
where:
k is the structural type values of which presented in Table 2.19;
Qk is the weight of storey corresponding to k point, design seismic loads should be in
accordance with Table 2.14;
i is the value of acceleration (m/s2) corresponding to structure frequency;
ik is the coefficient depending on the shape of the deformation of the building or
structure with its own fluctuations in the i-th shape and on the location of the load;
A0 is the design seismic factor which should be determined by expression below:
where
The coefficient ik is determined by the following expression.
1
2
1
( ) ( )
( )
n
i k j i j
j
ik n
j i j
j
X x Q X x
Q X x
=
=
=
(39)
where
( ), ( )i k i jX x X x are the displacements of a building or structure with its own vibrations
in the i-th shape at the considered point k and at all points j see Figure 2.10, where in
accordance with the calculation scheme its weight is assumed concentrated;
Qj is the weight of structure referred to point j, calculated in accordance with Table 2.14.
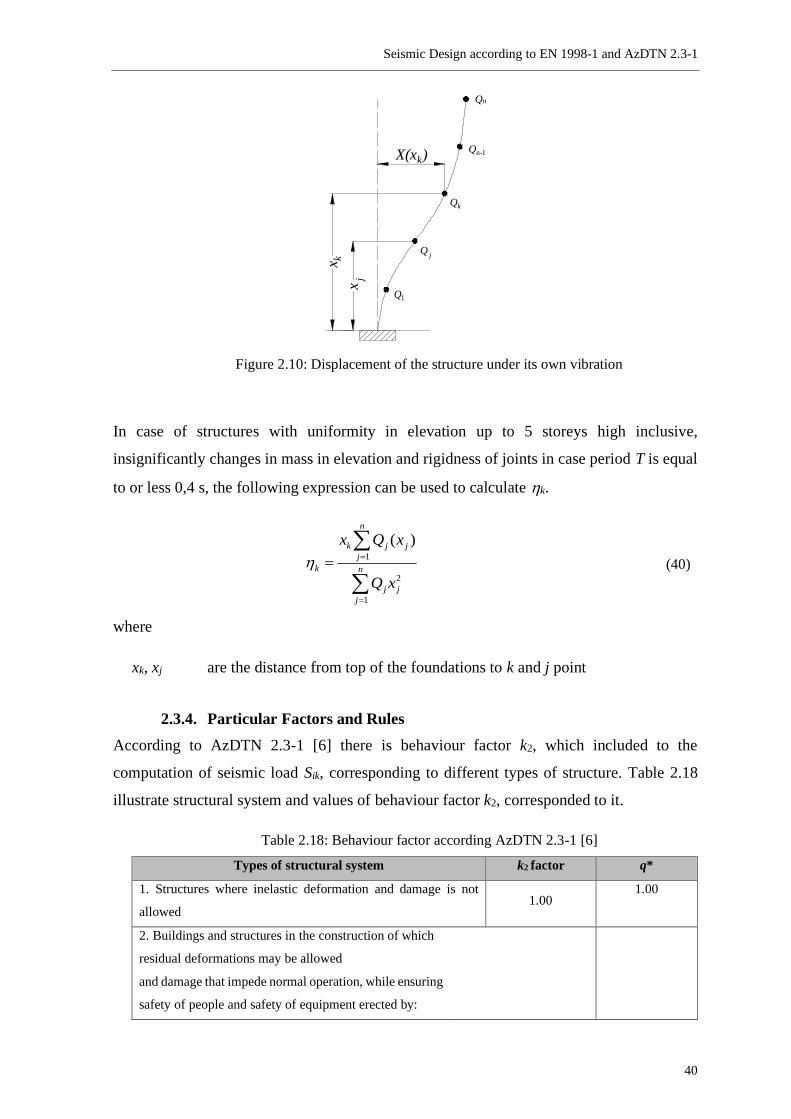
Seismic Design according to EN 1998-1 and AzDTN 2.3-1
40
Figure 2.10: Displacement of the structure under its own vibration
In case of structures with uniformity in elevation up to 5 storeys high inclusive,
insignificantly changes in mass in elevation and rigidness of joints in case period T is equal
to or less 0,4 s, the following expression can be used to calculate k.
1
2
1
( )n
k j j
j
k n
j j
j
x Q x
Q x
=
=
=
(40)
where
xk, xj are the distance from top of the foundations to k and j point
2.3.4. Particular Factors and Rules
According to AzDTN 2.3-1 [6] there is behaviour factor k2, which included to the
computation of seismic load Sik, corresponding to different types of structure. Table 2.18
illustrate structural system and values of behaviour factor k2, corresponded to it.
Table 2.18: Behaviour factor according AzDTN 2.3-1 [6]
Types of structural system k2 factor q*
1. Structures where inelastic deformation and damage is not
allowed 1.00
1.00
2. Buildings and structures in the construction of which
residual deformations may be allowed
and damage that impede normal operation, while ensuring
safety of people and safety of equipment erected by:
x k
X(xk)
Q1
Qj
Qk
Qn-1
Qn
xj
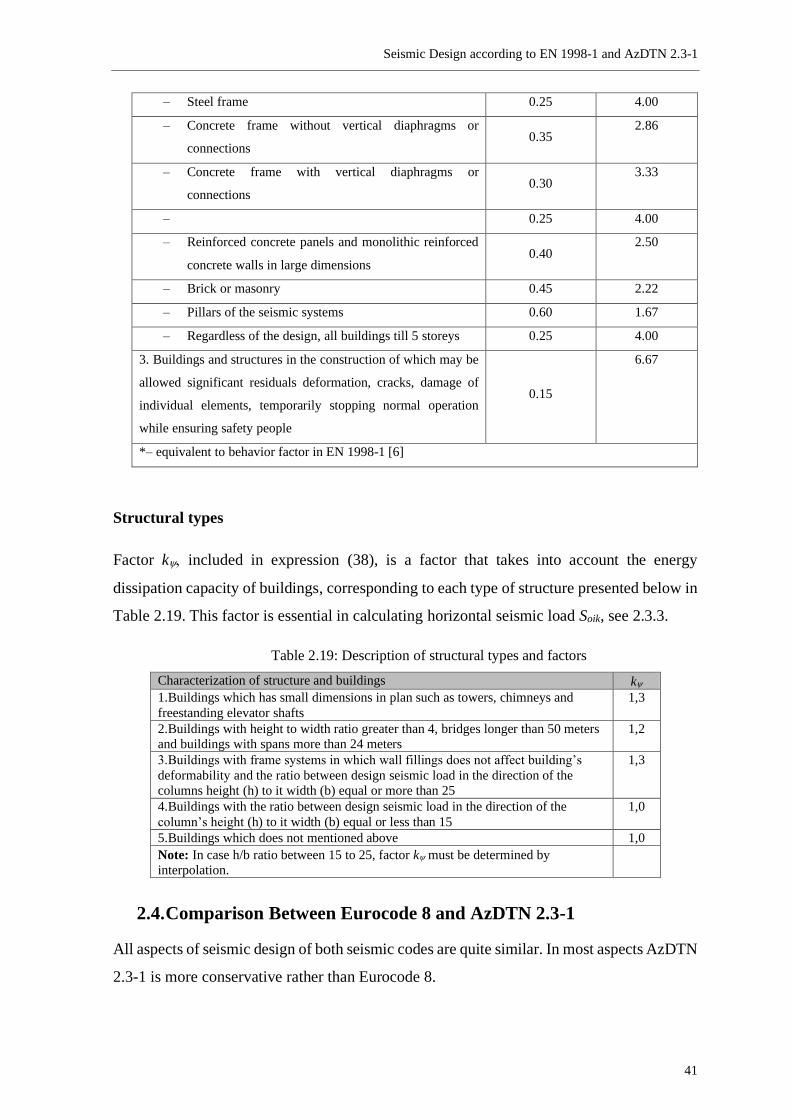
Seismic Design according to EN 1998-1 and AzDTN 2.3-1
41
– Steel frame 0.25 4.00
– Concrete frame without vertical diaphragms or
connections 0.35
2.86
– Concrete frame with vertical diaphragms or
connections 0.30
3.33
– 0.25 4.00
– Reinforced concrete panels and monolithic reinforced
concrete walls in large dimensions 0.40
2.50
– Brick or masonry 0.45 2.22
– Pillars of the seismic systems 0.60 1.67
– Regardless of the design, all buildings till 5 storeys 0.25 4.00
3. Buildings and structures in the construction of which may be
allowed significant residuals deformation, cracks, damage of
individual elements, temporarily stopping normal operation
while ensuring safety people
0.15
6.67
*– equivalent to behavior factor in EN 1998-1 [6]
Structural types
Factor k included in expression (38), is a factor that takes into account the energy
dissipation capacity of buildings, corresponding to each type of structure presented below in
Table 2.19. This factor is essential in calculating horizontal seismic load Soik, see 2.3.3.
Table 2.19: Description of structural types and factors
Characterization of structure and buildings k
1.Buildings which has small dimensions in plan such as towers, chimneys and
freestanding elevator shafts
1,3
2.Buildings with height to width ratio greater than 4, bridges longer than 50 meters
and buildings with spans more than 24 meters
1,2
3.Buildings with frame systems in which wall fillings does not affect building’s
deformability and the ratio between design seismic load in the direction of the
columns height (h) to it width (b) equal or more than 25
1,3
4.Buildings with the ratio between design seismic load in the direction of the
column’s height (h) to it width (b) equal or less than 15
1,0
5.Buildings which does not mentioned above 1,0
Note: In case h/b ratio between 15 to 25, factor k must be determined by
interpolation.
2.4. Comparison Between Eurocode 8 and AzDTN 2.3-1
All aspects of seismic design of both seismic codes are quite similar. In most aspects AzDTN
2.3-1 is more conservative rather than Eurocode 8.
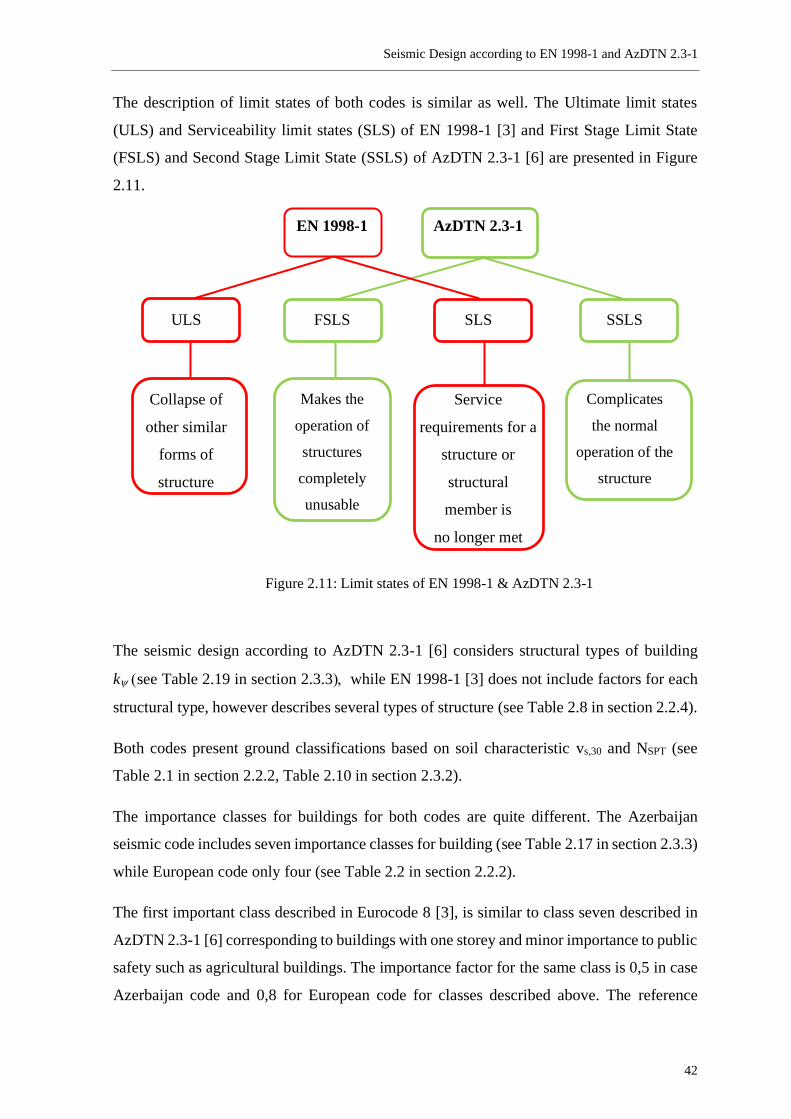
Seismic Design according to EN 1998-1 and AzDTN 2.3-1
42
The description of limit states of both codes is similar as well. The Ultimate limit states
(ULS) and Serviceability limit states (SLS) of EN 1998-1 [3] and First Stage Limit State
(FSLS) and Second Stage Limit State (SSLS) of AzDTN 2.3-1 [6] are presented in Figure
2.11.
EN 1998-1 AzDTN 2.3-1
ULS FSLS SLS SSLS
Collapse of
other similar
forms of
structure
Makes the
operation of
structures
completely
unusable
Service
requirements for a
structure or
structural
member is
no longer met
Complicates
the normal
operation of the
structure
Figure 2.11: Limit states of EN 1998-1 & AzDTN 2.3-1
The seismic design according to AzDTN 2.3-1 [6] considers structural types of building
k (see Table 2.19 in section 2.3.3) while EN 1998-1 [3] does not include factors for each
structural type, however describes several types of structure (see Table 2.8 in section 2.2.4).
Both codes present ground classifications based on soil characteristic vs,30 and NSPT (see
Table 2.1 in section 2.2.2, Table 2.10 in section 2.3.2).
The importance classes for buildings for both codes are quite different. The Azerbaijan
seismic code includes seven importance classes for building (see Table 2.17 in section 2.3.3)
while European code only four (see Table 2.2 in section 2.2.2).
The first important class described in Eurocode 8 [3], is similar to class seven described in
AzDTN 2.3-1 [6] corresponding to buildings with one storey and minor importance to public
safety such as agricultural buildings. The importance factor for the same class is 0,5 in case
Azerbaijan code and 0,8 for European code for classes described above. The reference
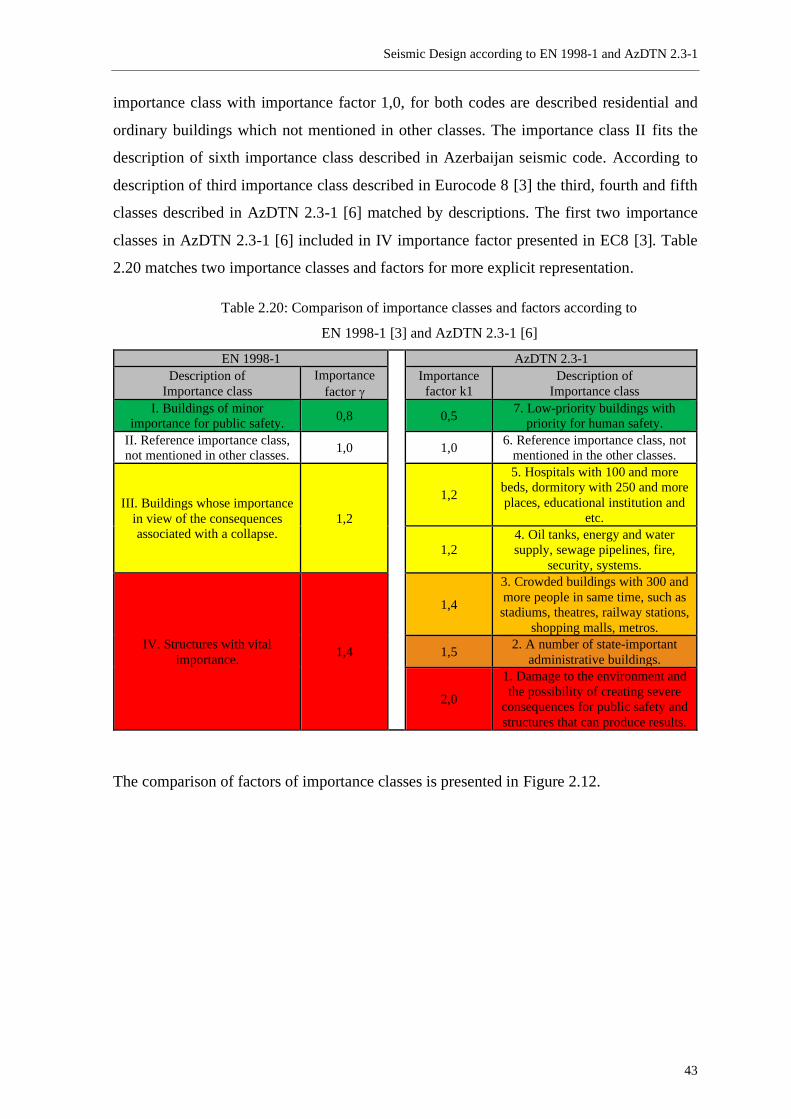
Seismic Design according to EN 1998-1 and AzDTN 2.3-1
43
importance class with importance factor 1,0, for both codes are described residential and
ordinary buildings which not mentioned in other classes. The importance class II fits the
description of sixth importance class described in Azerbaijan seismic code. According to
description of third importance class described in Eurocode 8 [3] the third, fourth and fifth
classes described in AzDTN 2.3-1 [6] matched by descriptions. The first two importance
classes in AzDTN 2.3-1 [6] included in IV importance factor presented in EC8 [3]. Table
2.20 matches two importance classes and factors for more explicit representation.
Table 2.20: Comparison of importance classes and factors according to
EN 1998-1 [3] and AzDTN 2.3-1 [6]
EN 1998-1
AzDTN 2.3-1
Description of
Importance class
Importance
factor
Importance
factor k1
Description of
Importance class
I. Buildings of minor
importance for public safety. 0,8 0,5
7. Low-priority buildings with
priority for human safety.
II. Reference importance class,
not mentioned in other classes. 1,0 1,0
6. Reference importance class, not
mentioned in the other classes.
III. Buildings whose importance
in view of the consequences
associated with a collapse.
1,2
1,2
5. Hospitals with 100 and more
beds, dormitory with 250 and more
places, educational institution and
etc.
1,2
4. Oil tanks, energy and water
supply, sewage pipelines, fire,
security, systems.
IV. Structures with vital
importance. 1,4
1,4
3. Crowded buildings with 300 and
more people in same time, such as
stadiums, theatres, railway stations,
shopping malls, metros.
1,5 2. A number of state-important
administrative buildings.
2,0
1. Damage to the environment and
the possibility of creating severe
consequences for public safety and
structures that can produce results.
The comparison of factors of importance classes is presented in Figure 2.12.
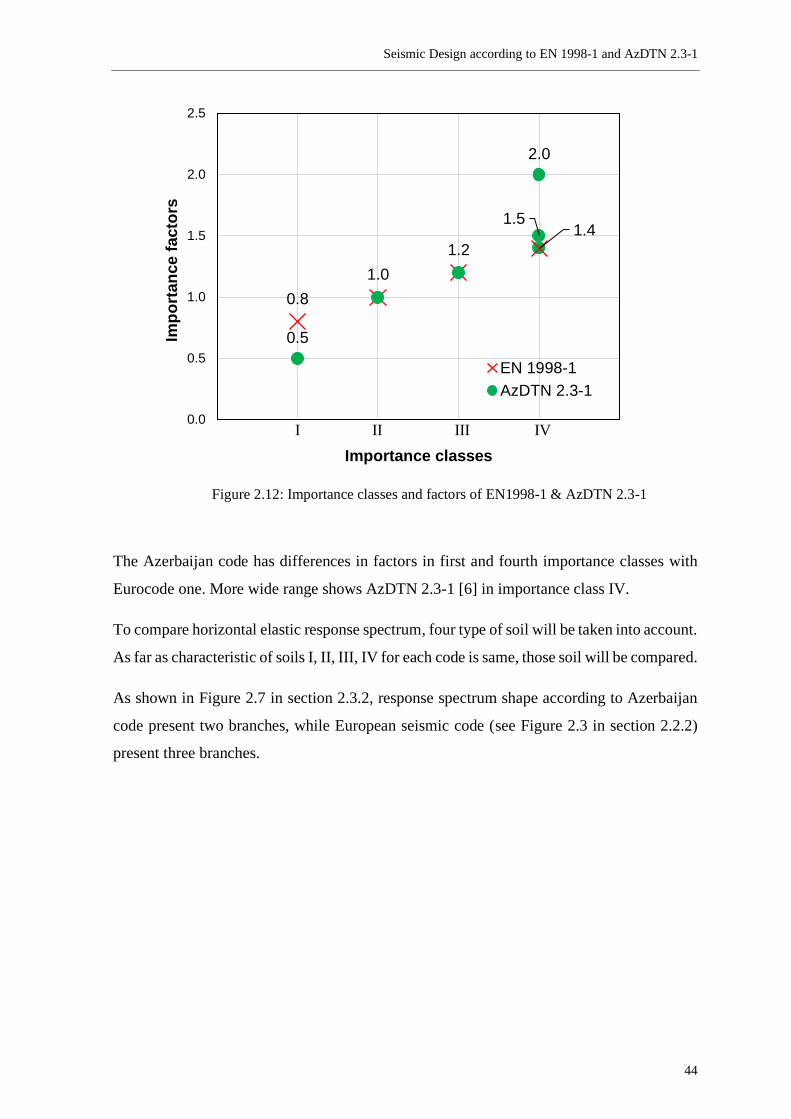
Seismic Design according to EN 1998-1 and AzDTN 2.3-1
44
Figure 2.12: Importance classes and factors of EN1998-1 & AzDTN 2.3-1
The Azerbaijan code has differences in factors in first and fourth importance classes with
Eurocode one. More wide range shows AzDTN 2.3-1 [6] in importance class IV.
To compare horizontal elastic response spectrum, four type of soil will be taken into account.
As far as characteristic of soils I, II, III, IV for each code is same, those soil will be compared.
As shown in Figure 2.7 in section 2.3.2, response spectrum shape according to Azerbaijan
code present two branches, while European seismic code (see Figure 2.3 in section 2.2.2)
present three branches.
0.8
1.0
1.2
1.4
2.0
0.5
1.5
0.0
0.5
1.0
1.5
2.0
2.5
Imp
ort
an
ce f
acto
rs
Importance classes
EN 1998-1
AzDTN 2.3-1
I II III IV
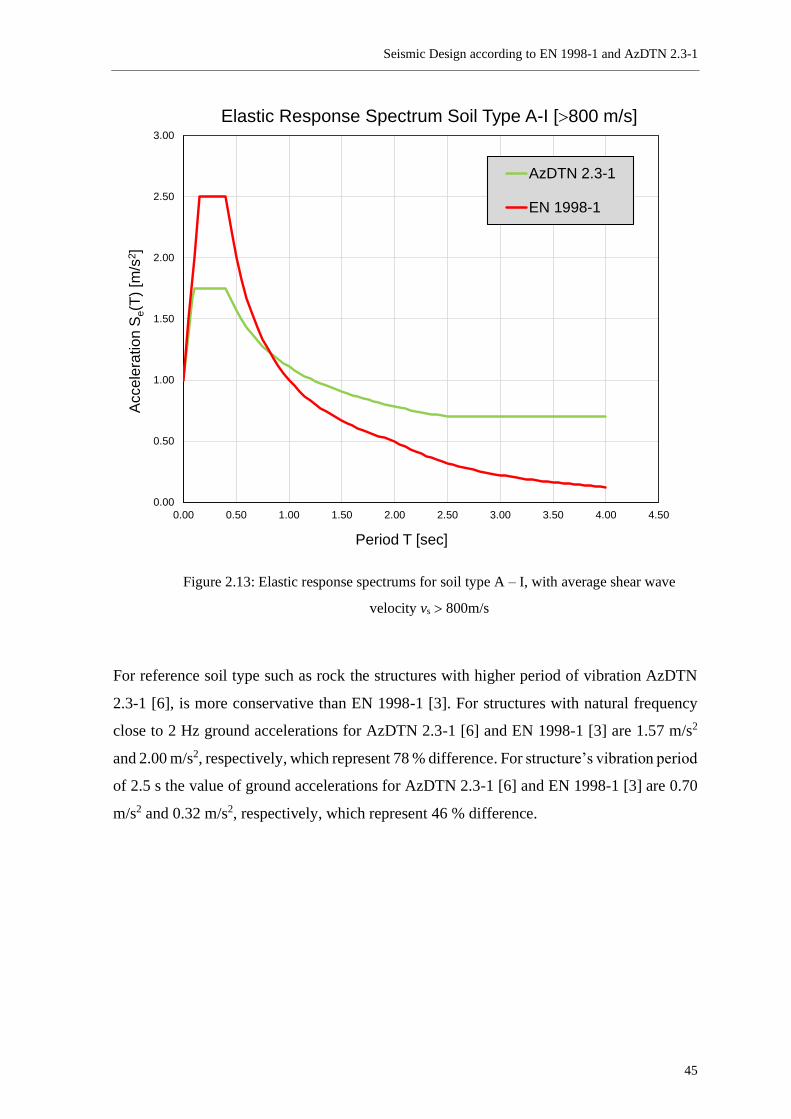
Seismic Design according to EN 1998-1 and AzDTN 2.3-1
45
Figure 2.13: Elastic response spectrums for soil type A – I, with average shear wave
velocity vs 800m/s
For reference soil type such as rock the structures with higher period of vibration AzDTN
2.3-1 [6], is more conservative than EN 1998-1 [3]. For structures with natural frequency
close to 2 Hz ground accelerations for AzDTN 2.3-1 [6] and EN 1998-1 [3] are 1.57 m/s2
and 2.00 m/s2, respectively, which represent 78 % difference. For structure’s vibration period
of 2.5 s the value of ground accelerations for AzDTN 2.3-1 [6] and EN 1998-1 [3] are 0.70
m/s2 and 0.32 m/s2, respectively, which represent 46 % difference.
0.00
0.50
1.00
1.50
2.00
2.50
3.00
0.00 0.50 1.00 1.50 2.00 2.50 3.00 3.50 4.00 4.50
Accele
ration S
e(T
) [m
/s2]
Period T [sec]
Elastic Response Spectrum Soil Type A-I [800 m/s]
AzDTN 2.3-1
EN 1998-1
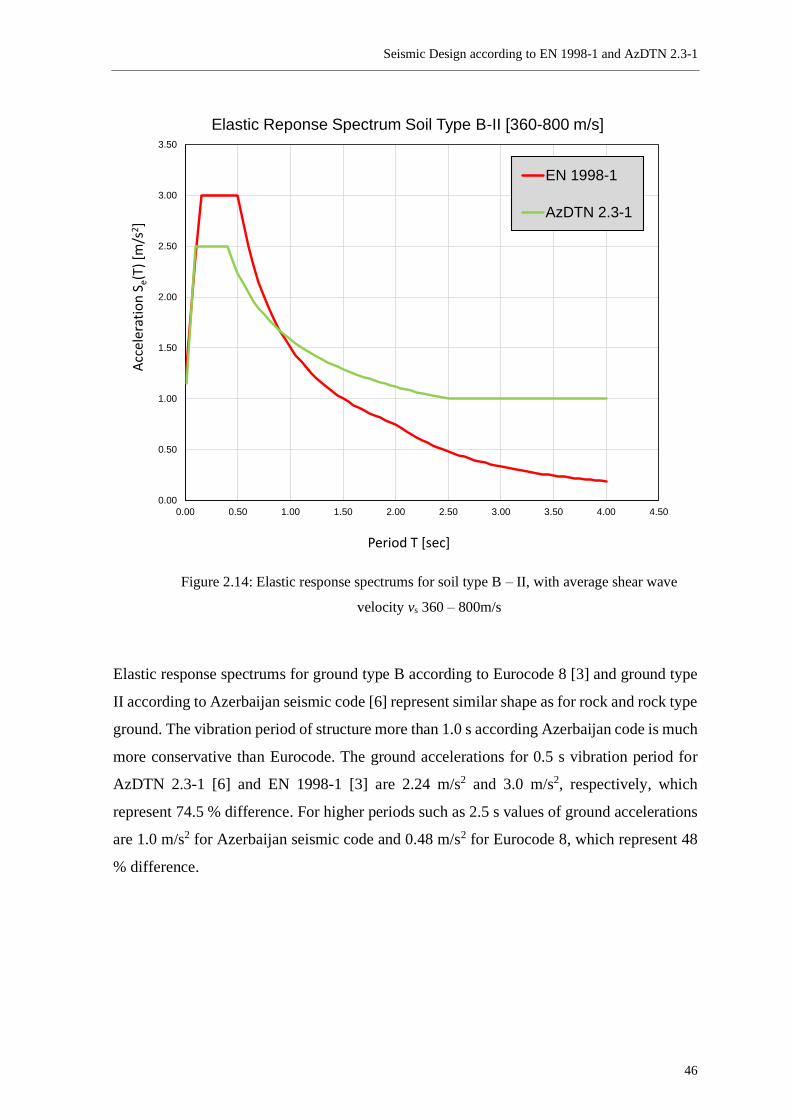
Seismic Design according to EN 1998-1 and AzDTN 2.3-1
46
Figure 2.14: Elastic response spectrums for soil type B – II, with average shear wave
velocity vs 360 – 800m/s
Elastic response spectrums for ground type B according to Eurocode 8 [3] and ground type
II according to Azerbaijan seismic code [6] represent similar shape as for rock and rock type
ground. The vibration period of structure more than 1.0 s according Azerbaijan code is much
more conservative than Eurocode. The ground accelerations for 0.5 s vibration period for
AzDTN 2.3-1 [6] and EN 1998-1 [3] are 2.24 m/s2 and 3.0 m/s2, respectively, which
represent 74.5 % difference. For higher periods such as 2.5 s values of ground accelerations
are 1.0 m/s2 for Azerbaijan seismic code and 0.48 m/s2 for Eurocode 8, which represent 48
% difference.
0.00
0.50
1.00
1.50
2.00
2.50
3.00
3.50
0.00 0.50 1.00 1.50 2.00 2.50 3.00 3.50 4.00 4.50
Acc
eler
atio
n S
e(T)
[m
/s2]
Period T [sec]
Elastic Reponse Spectrum Soil Type B-II [360-800 m/s]
EN 1998-1
AzDTN 2.3-1
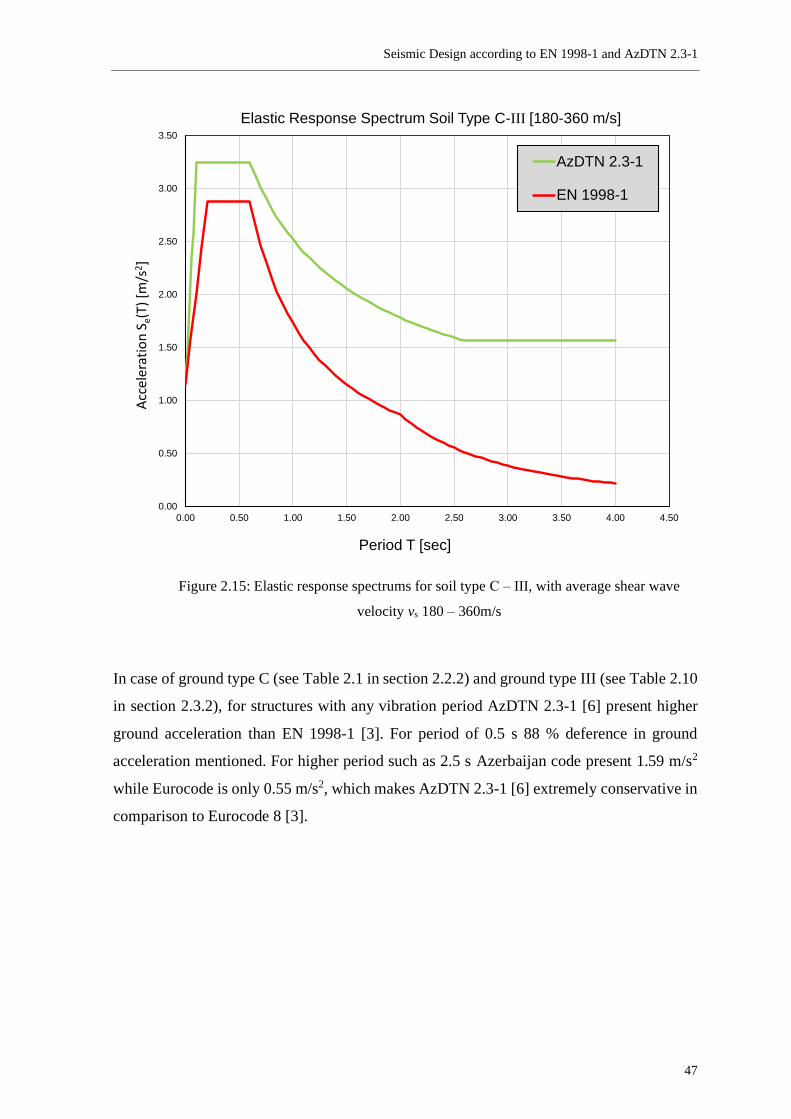
Seismic Design according to EN 1998-1 and AzDTN 2.3-1
47
Figure 2.15: Elastic response spectrums for soil type С – III, with average shear wave
velocity vs 180 – 360m/s
In case of ground type C (see Table 2.1 in section 2.2.2) and ground type III (see Table 2.10
in section 2.3.2), for structures with any vibration period AzDTN 2.3-1 [6] present higher
ground acceleration than EN 1998-1 [3]. For period of 0.5 s 88 % deference in ground
acceleration mentioned. For higher period such as 2.5 s Azerbaijan code present 1.59 m/s2
while Eurocode is only 0.55 m/s2, which makes AzDTN 2.3-1 [6] extremely conservative in
comparison to Eurocode 8 [3].
0.00
0.50
1.00
1.50
2.00
2.50
3.00
3.50
0.00 0.50 1.00 1.50 2.00 2.50 3.00 3.50 4.00 4.50
Acc
eler
atio
n S
e(T)
[m
/s2]
Period T [sec]
Elastic Response Spectrum Soil Type C-III [180-360 m/s]
AzDTN 2.3-1
EN 1998-1
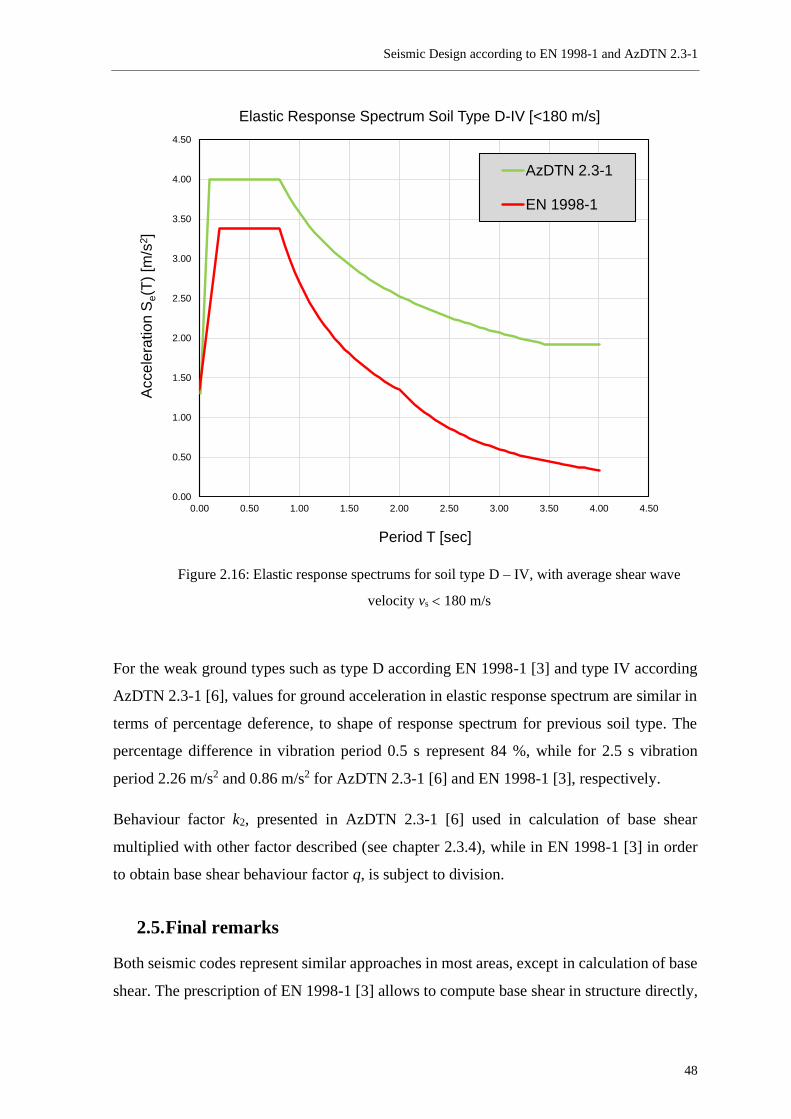
Seismic Design according to EN 1998-1 and AzDTN 2.3-1
48
Figure 2.16: Elastic response spectrums for soil type D – IV, with average shear wave
velocity vs 180 m/s
For the weak ground types such as type D according EN 1998-1 [3] and type IV according
AzDTN 2.3-1 [6], values for ground acceleration in elastic response spectrum are similar in
terms of percentage deference, to shape of response spectrum for previous soil type. The
percentage difference in vibration period 0.5 s represent 84 %, while for 2.5 s vibration
period 2.26 m/s2 and 0.86 m/s2 for AzDTN 2.3-1 [6] and EN 1998-1 [3], respectively.
Behaviour factor k2, presented in AzDTN 2.3-1 [6] used in calculation of base shear
multiplied with other factor described (see chapter 2.3.4), while in EN 1998-1 [3] in order
to obtain base shear behaviour factor q, is subject to division.
2.5. Final remarks
Both seismic codes represent similar approaches in most areas, except in calculation of base
shear. The prescription of EN 1998-1 [3] allows to compute base shear in structure directly,
0.00
0.50
1.00
1.50
2.00
2.50
3.00
3.50
4.00
4.50
0.00 0.50 1.00 1.50 2.00 2.50 3.00 3.50 4.00 4.50
Accele
ration S
e(T
) [m
/s2]
Period T [sec]
Elastic Response Spectrum Soil Type D-IV [<180 m/s]
AzDTN 2.3-1
EN 1998-1

Seismic Design according to EN 1998-1 and AzDTN 2.3-1
49
see expression (21), while prescriptions of AzDTN 2.3-1 [6] calculate seismic load applied
to each storey with further determination of base shear.
Seismic hazard maps for use with Eurocode 8 are meant to be provided by individual nations.
Values, factors, coefficients are presented in paragraph 2.3 regarding AzDTN 2.3-1 take into
account 1st and 2nd reissue of Azerbaijan Codes.
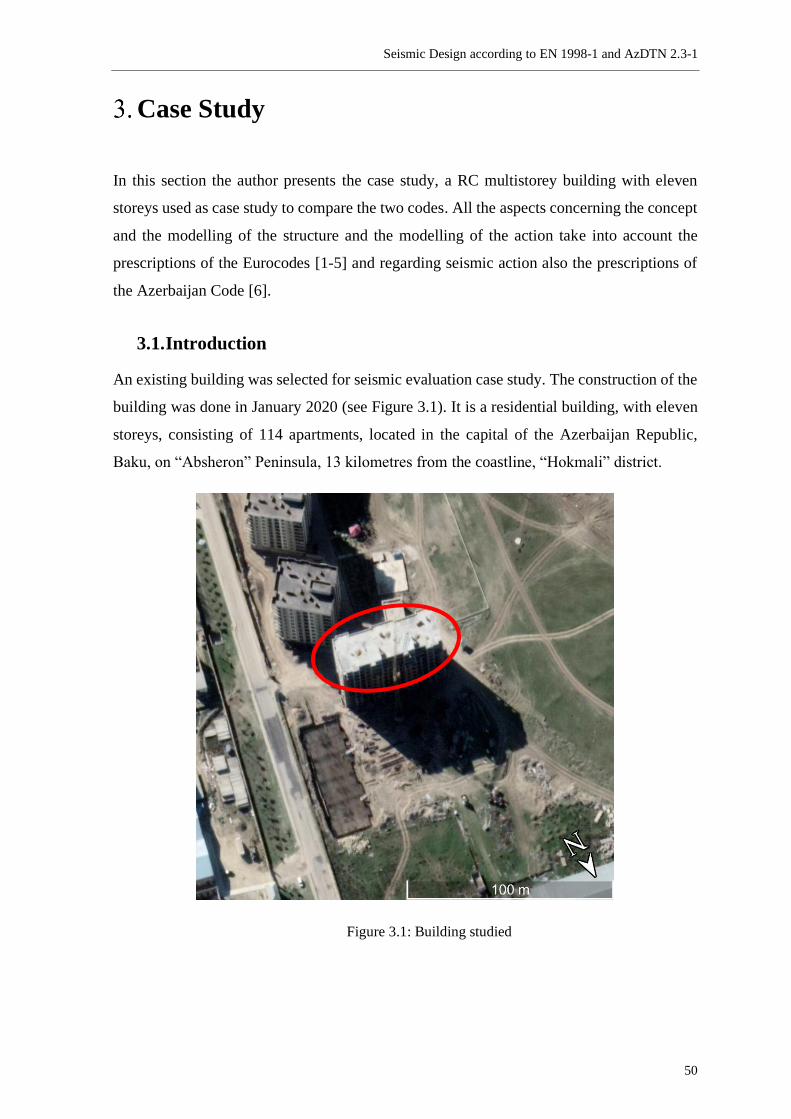
Seismic Design according to EN 1998-1 and AzDTN 2.3-1
50
Case Study
In this section the author presents the case study, a RC multistorey building with eleven
storeys used as case study to compare the two codes. All the aspects concerning the concept
and the modelling of the structure and the modelling of the action take into account the
prescriptions of the Eurocodes [1-5] and regarding seismic action also the prescriptions of
the Azerbaijan Code [6].
3.1. Introduction
An existing building was selected for seismic evaluation case study. The construction of the
building was done in January 2020 (see Figure 3.1). It is a residential building, with eleven
storeys, consisting of 114 apartments, located in the capital of the Azerbaijan Republic,
Baku, on “Absheron” Peninsula, 13 kilometres from the coastline, “Hokmali” district.
Figure 3.1: Building studied
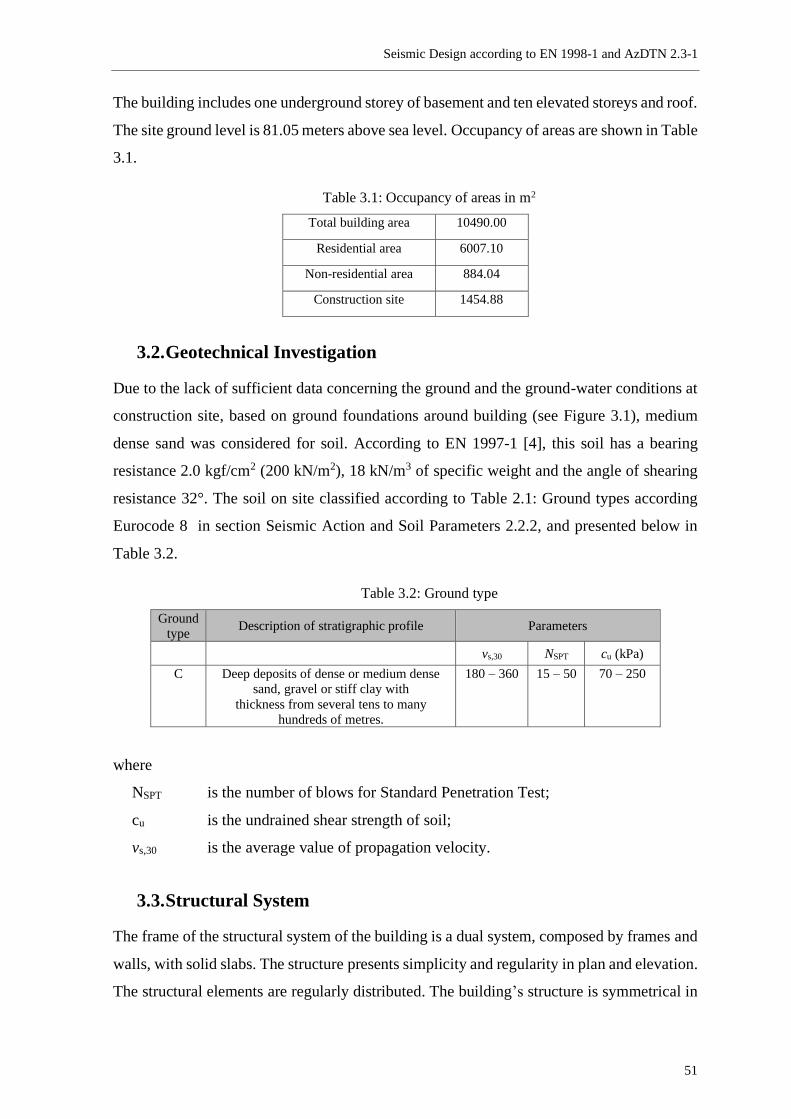
Seismic Design according to EN 1998-1 and AzDTN 2.3-1
51
The building includes one underground storey of basement and ten elevated storeys and roof.
The site ground level is 81.05 meters above sea level. Occupancy of areas are shown in Table
3.1.
Table 3.1: Occupancy of areas in m2
Total building area 10490.00
Residential area 6007.10
Non-residential area 884.04
Construction site 1454.88
3.2. Geotechnical Investigation
Due to the lack of sufficient data concerning the ground and the ground-water conditions at
construction site, based on ground foundations around building (see Figure 3.1), medium
dense sand was considered for soil. According to EN 1997-1 [4], this soil has a bearing
resistance 2.0 kgf/cm2 (200 kN/m2), 18 kN/m3 of specific weight and the angle of shearing
resistance 32°. The soil on site classified according to Table 2.1: Ground types according
Eurocode 8 in section Seismic Action and Soil Parameters 2.2.2, and presented below in
Table 3.2.
Table 3.2: Ground type
Ground
type Description of stratigraphic profile Parameters
vs,30 NSPT cu (kPa)
C Deep deposits of dense or medium dense
sand, gravel or stiff clay with
thickness from several tens to many
hundreds of metres.
180 – 360 15 – 50 70 – 250
where
NSPT is the number of blows for Standard Penetration Test;
cu is the undrained shear strength of soil;
vs,30 is the average value of propagation velocity.
3.3. Structural System
The frame of the structural system of the building is a dual system, composed by frames and
walls, with solid slabs. The structure presents simplicity and regularity in plan and elevation.
The structural elements are regularly distributed. The building’s structure is symmetrical in

Seismic Design according to EN 1998-1 and AzDTN 2.3-1
52
plan with respect to one orthogonal axis. The frame of structure includes columns, beams,
slabs and shear walls. Geometrical data of entire structure is given in Table 3.3.
Table 3.3: Geometrical data of structure in meters
Total height of structure 42.70
Height of Basement storey 3.89
Height of Apartments storeys 3.14
Total width of building 19.00
Total length of building 52.80
Architectural schemes of facades are presented in Appendix A.
Structural plans have been done by the author based on architectural sketches presented by
Azerbaijan Architecture and Construction University, Department of Reinforced Concrete
Structures. Structural elements are defined according to Eurocode 2 [5]. Due to whole
structure, columns present regularity in plans and throughout the height of building have
tended to section reducing on 0, 4, 6 and 8 storeys by 0.1 m of deep at certain columns.
Section geometry of reinforced concrete columns are presented in Table 3.4.
The structure has two types of reinforced concrete beams, with next parameters shown
hereafter in Table 3.5. The project includes two-way and one-way solid slabs as show in
Table 3.6. The structure includes several floor openings for stairwell and elevator shaft. The
structure includes few types of shear walls with different thicknesses. Beginning from the
basement until 3rd storey inclusive 0.30 m wall applied, after and until the ceiling of the 10th
storey inclusive 0.20 m shear wall applied. Openings in shear wall with 1-meter width and
2-meter height take place in the basement storey.
The list of shear walls is shown in Table 3.7. Structure includes two reinforced concrete
elevator shafts symmetrically presented on plan, with 0.20 m width, due to whole height of
structure.
For the whole structure either column or shear walls applied one uniform reinforced concrete
foundation slab with 0.80 m depth on a compacted soil. Retaining walls performed in
basement storey with 0.25-meter depth, without openings for vehicle approaching, are
presented to transfer loads to foundation slab.
The structural plan is presented in Figure 3.2.
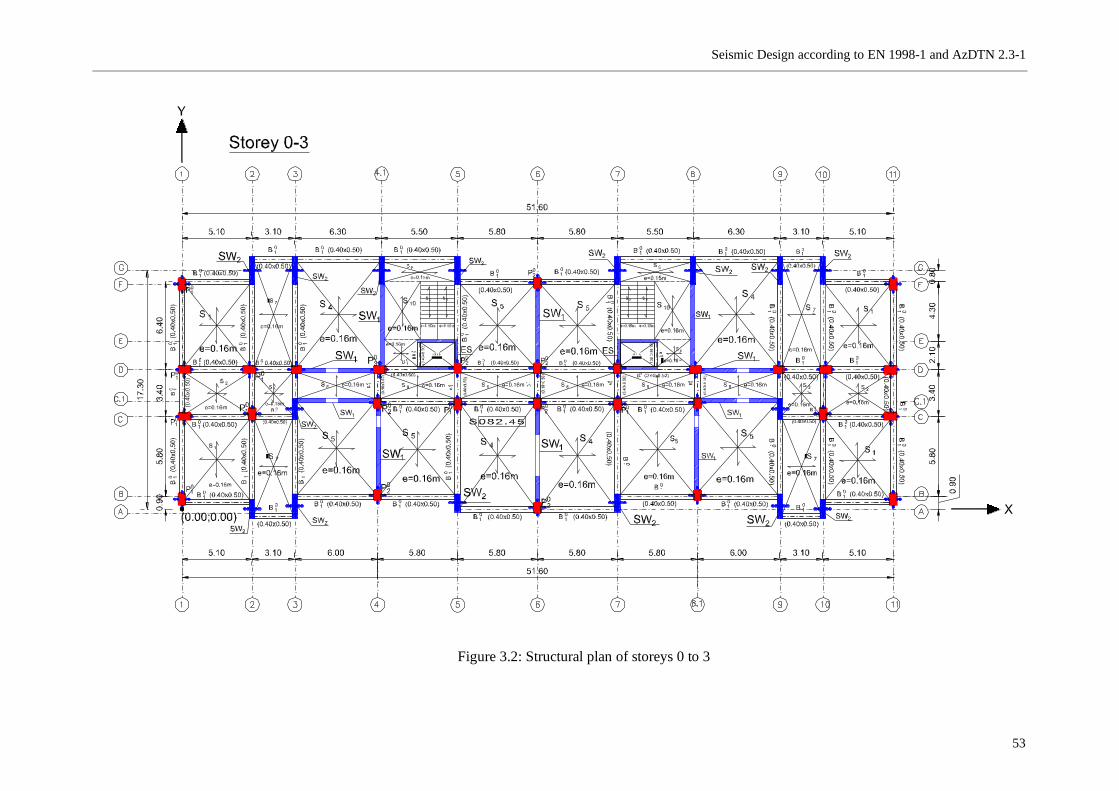
Seismic Design according to EN 1998-1 and AzDTN 2.3-1
53
Figure 3.2: Structural plan of storeys 0 to 3
Seismic Design according to EN 1998-1 and AzDTN 2.3-1
54
The building frame includes six different types of columns, see Table 3.4, according to their
cross-sectional geometry. The spans between columns in X direction is about 6 meters, while
in Y direction about 6 meters and also 3.4 meters in middle span.
Table 3.4: Reinforced concrete columns
Designation Section properties
b [m] h [m]
P1 0.50 0.80
P2 0.40 0.80
P3 0.40 0.70
P4 0.40 0.60
P5 0.40 0.50
P6 0.40 0.40
Structure has two types of beams. Cross-sectional geometry of beams presented in Table 3.5.
Most beams’ span is roughly about 6 meters long. Beams with 1.8 meters long included in
elevator shaft, see Figure 3.2.
Table 3.5: Reinforced concrete beams
Sign Section properties
b [m] h [m]
B1 0.40 0,50
B2 0.20 0,40
The reinforced concrete two-way solid slab applied to foundation with 0.80 m depth. Slabs
applied from 0 to 10th storey have 0.16 m width. Stairwell solid slab applied with 0.15 m
thickness. Table 3.6 present slabs applied to structure.
The shear walls applied symmetrically with respect to Y axis. As far as shear walls placed
asymmetrical with respect to X axis, centre of stiffness displaced from the center of mass.
The asymmetrical behaviour of structure with respect to X axis is visible in shape modes,
see section 3.8. The shear wall begins with 0.3 m width, and decrease in geometry in 4th
storey in 0.1 m. The reason of displacement of сenter of stiffness is elevation shaft located
in one-half of building, see Figure 3.2: Structural plan of storeys 0 to 3. Table 3.7 shows
shear wall applied to structure.
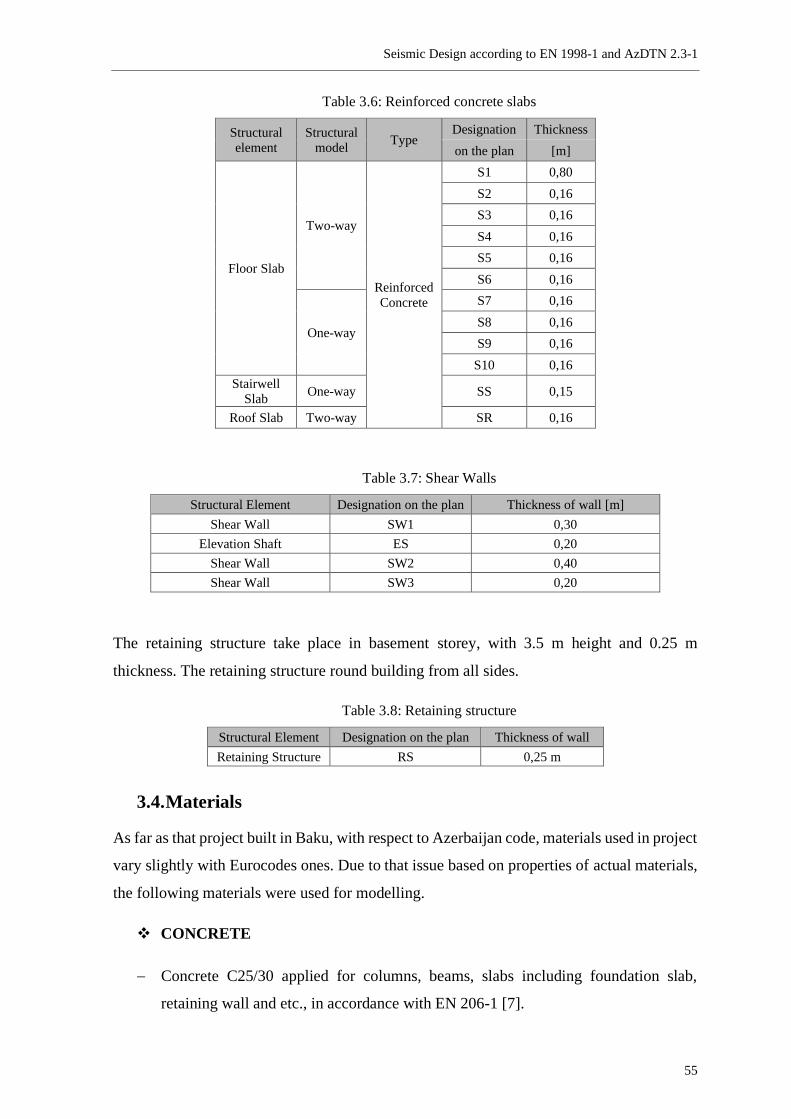
Seismic Design according to EN 1998-1 and AzDTN 2.3-1
55
Table 3.6: Reinforced concrete slabs
Structural
element
Structural
model Type
Designation Thickness
on the plan [m]
Floor Slab
Two-way
Reinforced
Concrete
S1 0,80
S2 0,16
S3 0,16
S4 0,16
S5 0,16
S6 0,16
One-way
S7 0,16
S8 0,16
S9 0,16
S10 0,16
Stairwell
Slab One-way SS 0,15
Roof Slab Two-way SR 0,16
Table 3.7: Shear Walls
Structural Element Designation on the plan Thickness of wall [m]
Shear Wall SW1 0,30
Elevation Shaft ES 0,20
Shear Wall SW2 0,40
Shear Wall SW3 0,20
The retaining structure take place in basement storey, with 3.5 m height and 0.25 m
thickness. The retaining structure round building from all sides.
Table 3.8: Retaining structure
Structural Element Designation on the plan Thickness of wall
Retaining Structure RS 0,25 m
3.4. Materials
As far as that project built in Baku, with respect to Azerbaijan code, materials used in project
vary slightly with Eurocodes ones. Due to that issue based on properties of actual materials,
the following materials were used for modelling.
❖ CONCRETE
− Concrete C25/30 applied for columns, beams, slabs including foundation slab,
retaining wall and etc., in accordance with EN 206-1 [7].
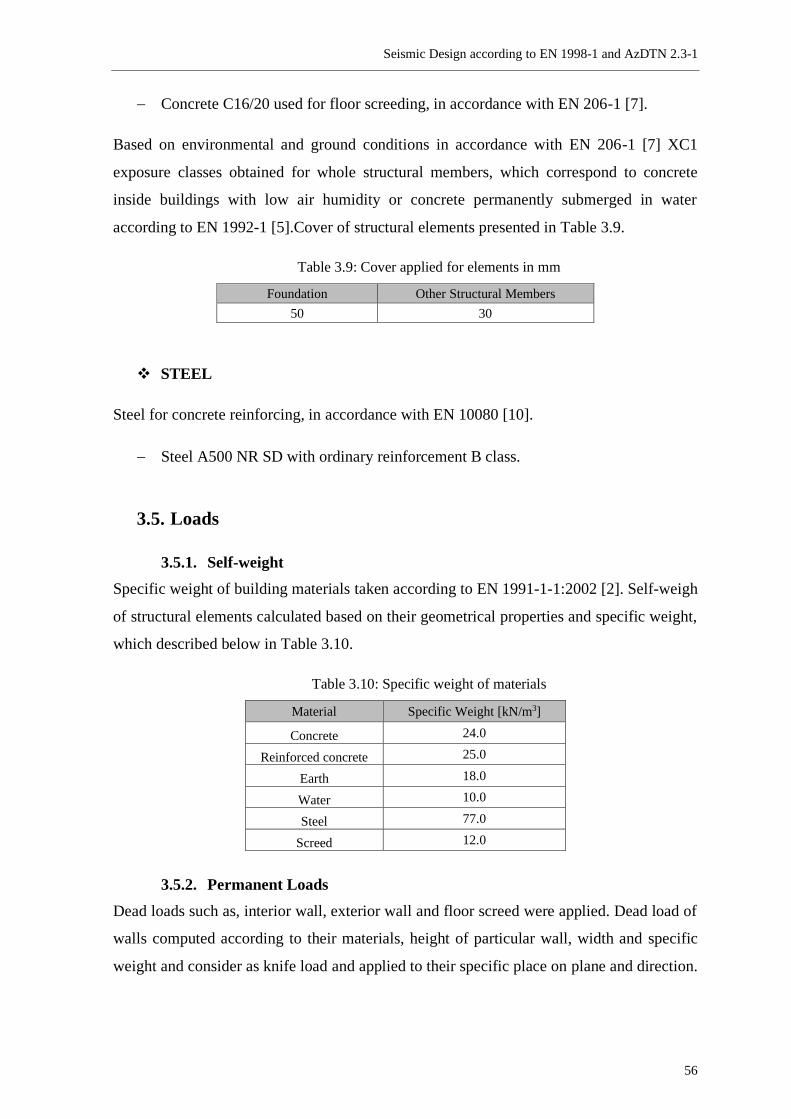
Seismic Design according to EN 1998-1 and AzDTN 2.3-1
56
− Concrete C16/20 used for floor screeding, in accordance with EN 206-1 [7].
Based on environmental and ground conditions in accordance with EN 206-1 [7] XC1
exposure classes obtained for whole structural members, which correspond to concrete
inside buildings with low air humidity or concrete permanently submerged in water
according to EN 1992-1 [5].Cover of structural elements presented in Table 3.9.
Table 3.9: Cover applied for elements in mm
Foundation Other Structural Members
50 30
❖ STEEL
Steel for concrete reinforcing, in accordance with EN 10080 [10].
− Steel A500 NR SD with ordinary reinforcement B class.
3.5. Loads
3.5.1. Self-weight
Specific weight of building materials taken according to EN 1991-1-1:2002 [2]. Self-weigh
of structural elements calculated based on their geometrical properties and specific weight,
which described below in Table 3.10.
Table 3.10: Specific weight of materials
Material Specific Weight [kN/m3]
Concrete 24.0
Reinforced concrete 25.0
Earth 18.0
Water 10.0
Steel 77.0
Screed 12.0
3.5.2. Permanent Loads
Dead loads such as, interior wall, exterior wall and floor screed were applied. Dead load of
walls computed according to their materials, height of particular wall, width and specific
weight and consider as knife load and applied to their specific place on plane and direction.
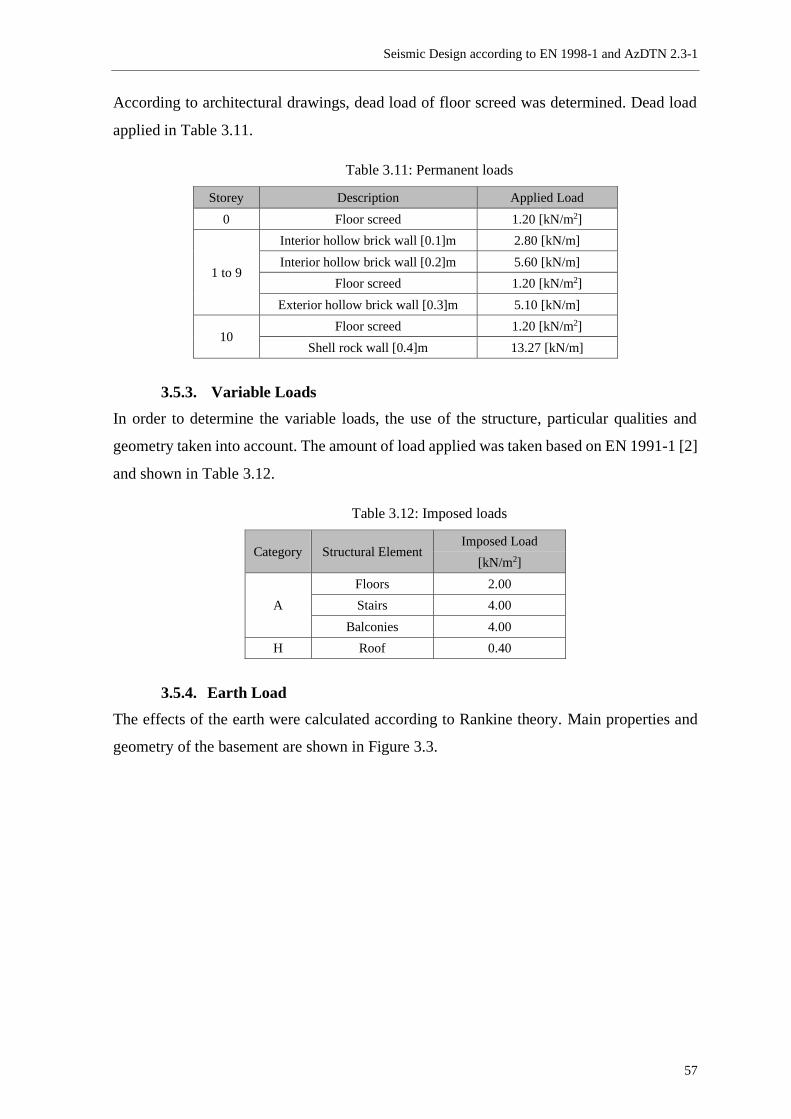
Seismic Design according to EN 1998-1 and AzDTN 2.3-1
57
According to architectural drawings, dead load of floor screed was determined. Dead load
applied in Table 3.11.
Table 3.11: Permanent loads
Storey Description Applied Load
0 Floor screed 1.20 [kN/m2]
1 to 9
Interior hollow brick wall [0.1]m 2.80 [kN/m]
Interior hollow brick wall [0.2]m 5.60 [kN/m]
Floor screed 1.20 [kN/m2]
Exterior hollow brick wall [0.3]m 5.10 [kN/m]
10 Floor screed 1.20 [kN/m2]
Shell rock wall [0.4]m 13.27 [kN/m]
3.5.3. Variable Loads
In order to determine the variable loads, the use of the structure, particular qualities and
geometry taken into account. The amount of load applied was taken based on EN 1991-1 [2]
and shown in Table 3.12.
Table 3.12: Imposed loads
Category Structural Element Imposed Load
[kN/m2]
A
Floors 2.00
Stairs 4.00
Balconies 4.00
H Roof 0.40
3.5.4. Earth Load
The effects of the earth were calculated according to Rankine theory. Main properties and
geometry of the basement are shown in Figure 3.3.
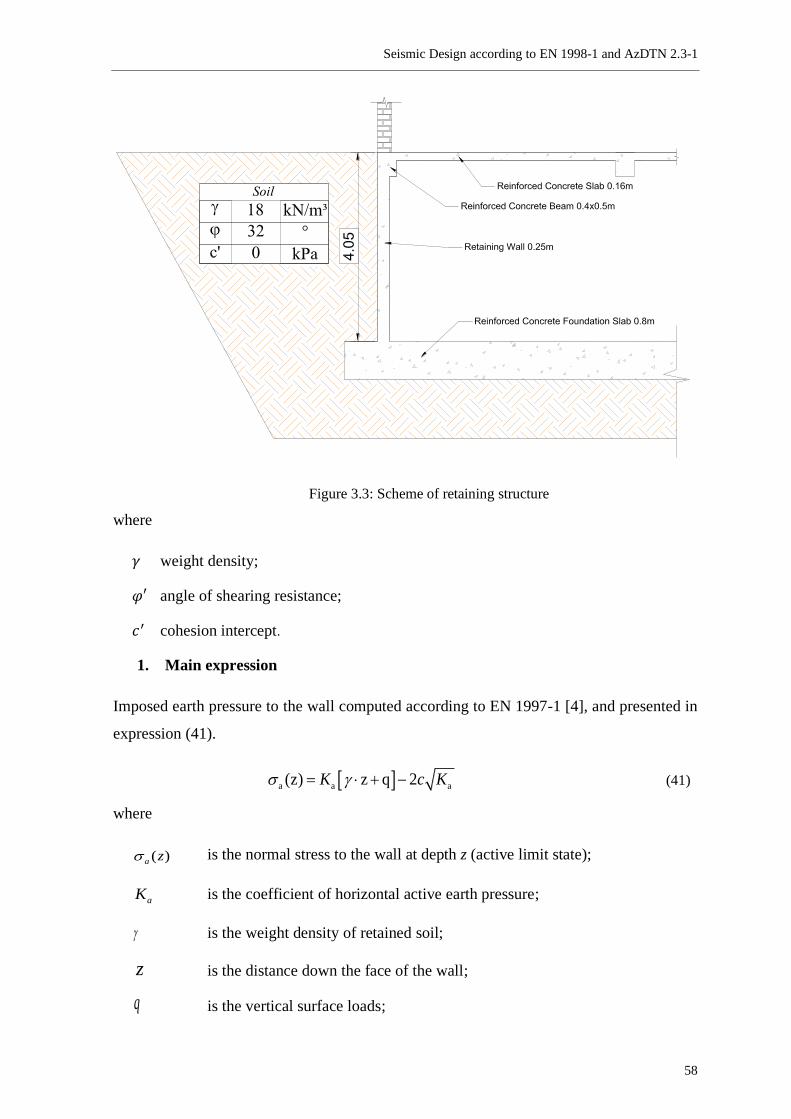
Seismic Design according to EN 1998-1 and AzDTN 2.3-1
58
Figure 3.3: Scheme of retaining structure
where
𝛾 weight density;
𝜑′ angle of shearing resistance;
𝑐′ cohesion intercept.
1. Main expression
Imposed earth pressure to the wall computed according to EN 1997-1 [4], and presented in
expression (41).
a a a(z) z q 2K c K = + − (41)
where
( )a z is the normal stress to the wall at depth z (active limit state);
aK is the coefficient of horizontal active earth pressure;
is the weight density of retained soil;
z is the distance down the face of the wall;
q is the vertical surface loads;
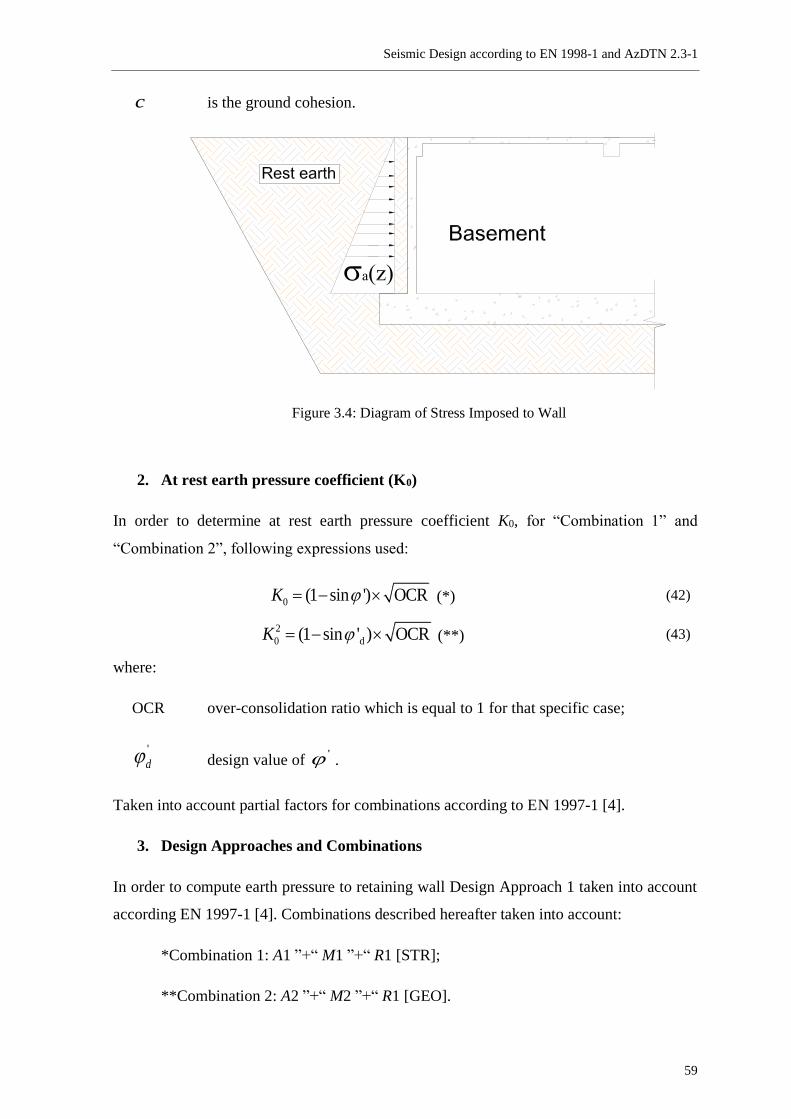
Seismic Design according to EN 1998-1 and AzDTN 2.3-1
59
c is the ground cohesion.
Figure 3.4: Diagram of Stress Imposed to Wall
2. At rest earth pressure coefficient (K0)
In order to determine at rest earth pressure coefficient K0, for “Combination 1” and
“Combination 2”, following expressions used:
0 (1 sin ') OCRK = − (*) (42)
2
0 d(1 sin ' ) OCRK = − (**) (43)
where:
OCR over-consolidation ratio which is equal to 1 for that specific case;
'
d design value of ' .
Taken into account partial factors for combinations according to EN 1997-1 [4].
3. Design Approaches and Combinations
In order to compute earth pressure to retaining wall Design Approach 1 taken into account
according EN 1997-1 [4]. Combinations described hereafter taken into account:
*Combination 1: A1 ”+“ M1 ”+“ R1 [STR];
**Combination 2: A2 ”+“ M2 ”+“ R1 [GEO].
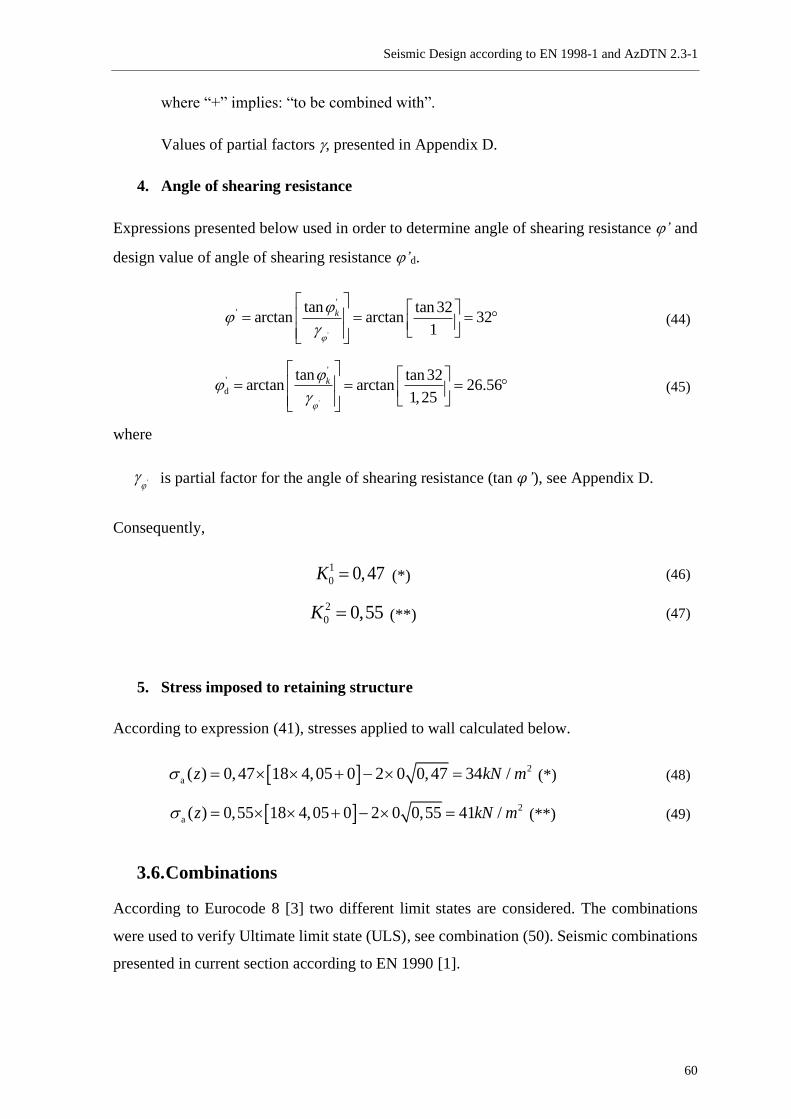
Seismic Design according to EN 1998-1 and AzDTN 2.3-1
60
where “+” implies: “to be combined with”.
Values of partial factors , presented in Appendix D.
4. Angle of shearing resistance
Expressions presented below used in order to determine angle of shearing resistance ’ and
design value of angle of shearing resistance ’d.
'
'' tan tan 32
arctan arctan 321
k
= = =
(44)
'
''
d
tan tan 32arctan arctan 26.56
1,25
k
= = =
(45)
where
' is partial factor for the angle of shearing resistance (tan 𝜑’), see Appendix D.
Consequently,
1
0 0,47K = (*) (46)
2
0 0,55K = (**) (47)
5. Stress imposed to retaining structure
According to expression (41), stresses applied to wall calculated below.
2
a ( ) 0,47 18 4,05 0 2 0 0,47 34 /z kN m = + − = (*) (48)
2
a ( ) 0,55 18 4,05 0 2 0 0,55 41 /z kN m = + − = (**) (49)
3.6. Combinations
According to Eurocode 8 [3] two different limit states are considered. The combinations
were used to verify Ultimate limit state (ULS), see combination (50). Seismic combinations
presented in current section according to EN 1990 [1].
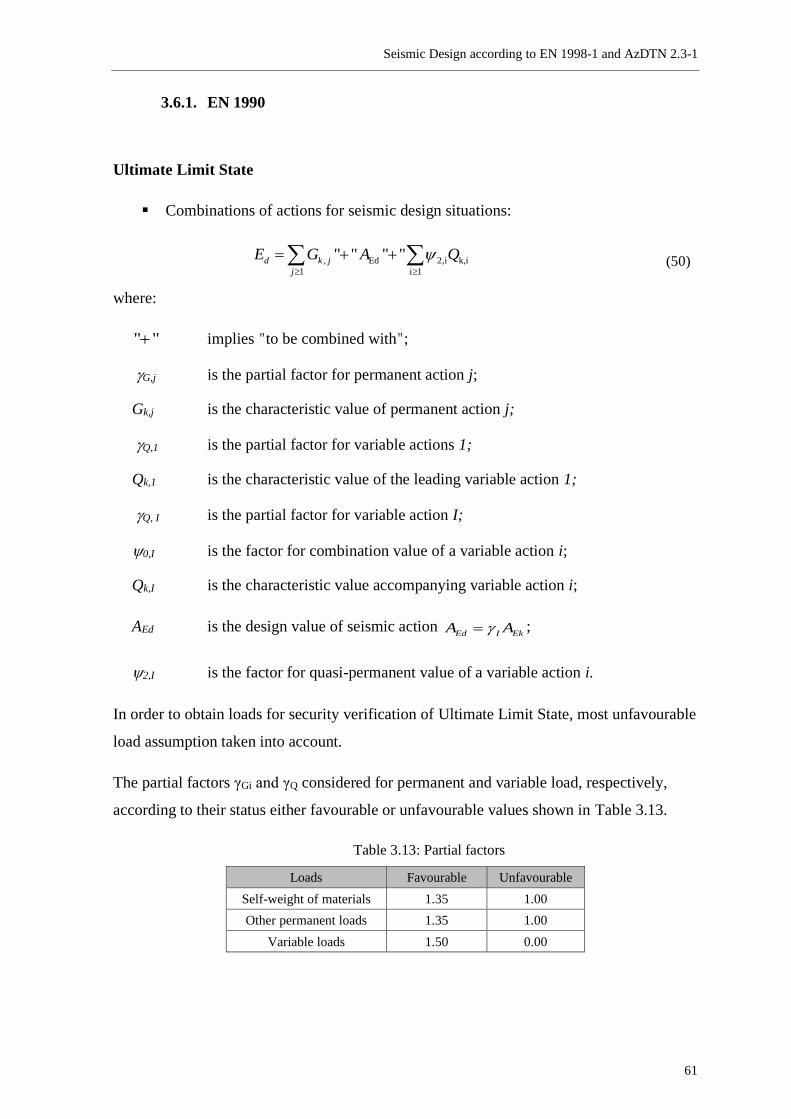
Seismic Design according to EN 1998-1 and AzDTN 2.3-1
61
3.6.1. EN 1990
Ultimate Limit State
▪ Combinations of actions for seismic design situations:
, Ed 2,i k,i
1 i 1
" " " "d k j
j
E G A Q
= + + (50)
where:
" "+ implies "to be combined with";
G,j is the partial factor for permanent action j;
Gk,j is the characteristic value of permanent action j;
Q,1 is the partial factor for variable actions 1;
Qk,1 is the characteristic value of the leading variable action 1;
Q, I is the partial factor for variable action I;
0,I is the factor for combination value of a variable action i;
Qk,I is the characteristic value accompanying variable action i;
AEd is the design value of seismic action Ed I EkA A= ;
2,I is the factor for quasi-permanent value of a variable action i.
In order to obtain loads for security verification of Ultimate Limit State, most unfavourable
load assumption taken into account.
The partial factors γGi and γQ considered for permanent and variable load, respectively,
according to their status either favourable or unfavourable values shown in Table 3.13.
Table 3.13: Partial factors
Loads Favourable Unfavourable
Self-weight of materials 1.35 1.00
Other permanent loads 1.35 1.00
Variable loads 1.50 0.00
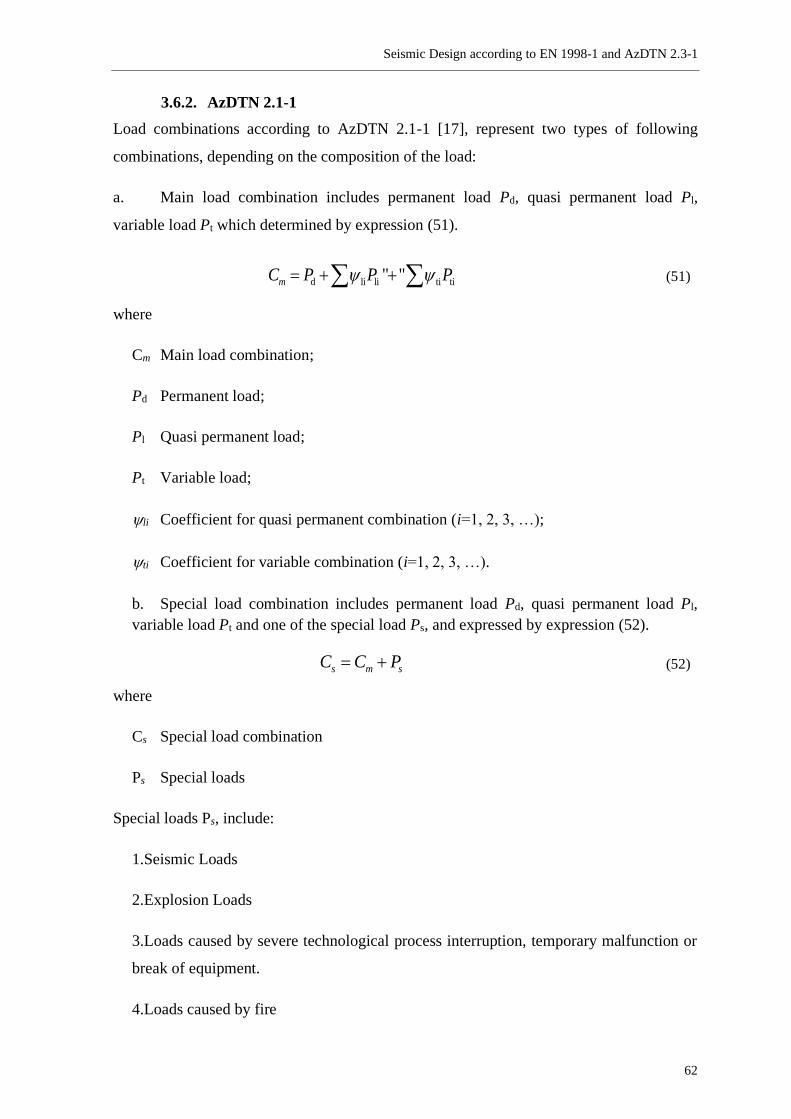
Seismic Design according to EN 1998-1 and AzDTN 2.3-1
62
3.6.2. AzDTN 2.1-1
Load combinations according to AzDTN 2.1-1 [17], represent two types of following
combinations, depending on the composition of the load:
a. Main load combination includes permanent load Pd, quasi permanent load Pl,
variable load Pt which determined by expression (51).
d li li ti ti" "mC P P P = + + (51)
where
Cm Main load combination;
Pd Permanent load;
Pl Quasi permanent load;
Pt Variable load;
li Coefficient for quasi permanent combination (i=1, 2, 3, …);
ti Coefficient for variable combination (i=1, 2, 3, …).
b. Special load combination includes permanent load Pd, quasi permanent load Pl,
variable load Pt and one of the special load Ps, and expressed by expression (52).
s m sC C P= + (52)
where
Cs Special load combination
Ps Special loads
Special loads Ps, include:
1.Seismic Loads
2.Explosion Loads
3.Loads caused by severe technological process interruption, temporary malfunction or
break of equipment.
4.Loads caused by fire
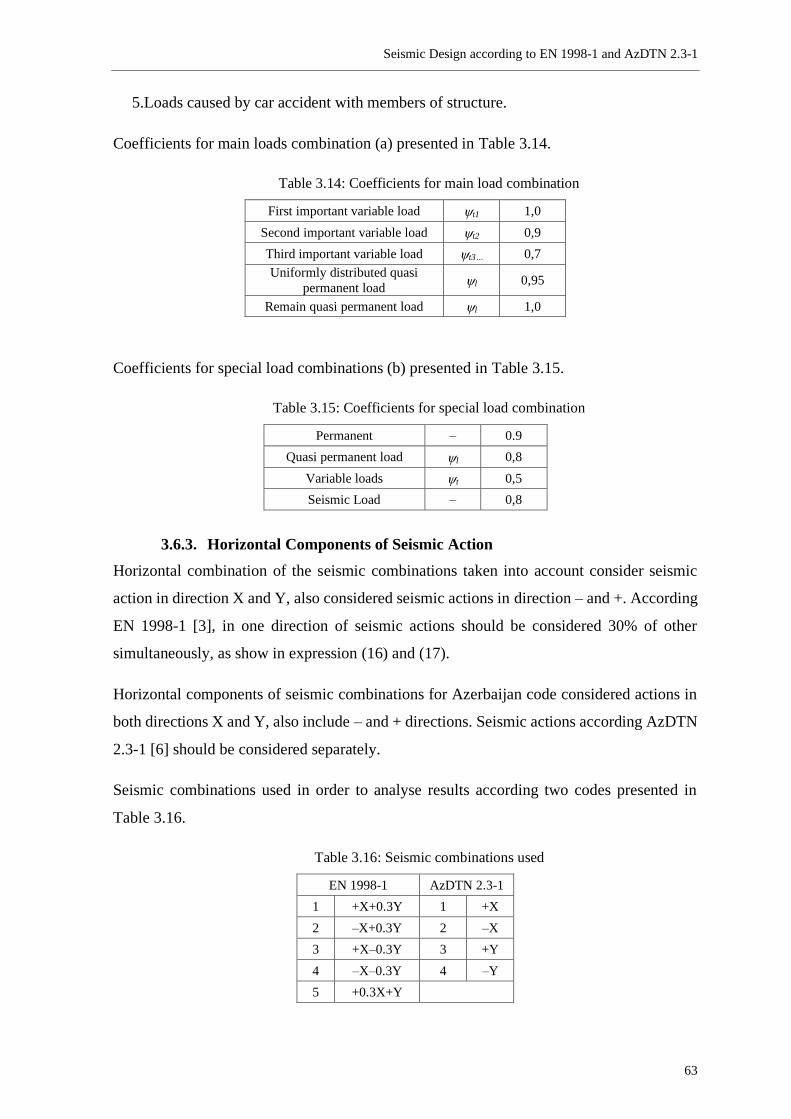
Seismic Design according to EN 1998-1 and AzDTN 2.3-1
63
5.Loads caused by car accident with members of structure.
Coefficients for main loads combination (a) presented in Table 3.14.
Table 3.14: Coefficients for main load combination
First important variable load t1 1,0
Second important variable load t2 0,9
Third important variable load t3… 0,7
Uniformly distributed quasi
permanent load l 0,95
Remain quasi permanent load l 1,0
Coefficients for special load combinations (b) presented in Table 3.15.
Table 3.15: Coefficients for special load combination
Permanent – 0.9
Quasi permanent load l 0,8
Variable loads t 0,5
Seismic Load – 0,8
3.6.3. Horizontal Components of Seismic Action
Horizontal combination of the seismic combinations taken into account consider seismic
action in direction X and Y, also considered seismic actions in direction – and +. According
EN 1998-1 [3], in one direction of seismic actions should be considered 30% of other
simultaneously, as show in expression (16) and (17).
Horizontal components of seismic combinations for Azerbaijan code considered actions in
both directions X and Y, also include – and + directions. Seismic actions according AzDTN
2.3-1 [6] should be considered separately.
Seismic combinations used in order to analyse results according two codes presented in
Table 3.16.
Table 3.16: Seismic combinations used
EN 1998-1 AzDTN 2.3-1
1 +X+0.3Y 1 +X
2 –X+0.3Y 2 –X
3 +X–0.3Y 3 +Y
4 –X–0.3Y 4 –Y
5 +0.3X+Y
Seismic Design according to EN 1998-1 and AzDTN 2.3-1
64
6 –0.3X+Y
7 +0.3X–Y
8 –0.3X–Y
3.7. Structural Model
The performance of the structure and its analysis was carried out with a numerical model
consisting of bar elements, in the case of beams and columns, and by “finite element” (FEM)
in the case of slabs and walls. The structure includes columns which section depth exceed 4
times its width and the height are three times its section depth. According to Eurocode 2 [5],
it considered as a concrete wall, and applied in model by two-dimensional plates with further
material definition, and analysed by finite element method (see Figure 3.5 ). Shear walls due
to whole height include medium size [14] openings and applied to structural model with
maximum precision
The Robot Structural Analysis [44] program was used for evaluation of studied structure. It
was considered a three-dimensional model. The model is shown in Figure 3.5. The effects
produced by actions on structural elements, considering the various scenarios of loading,
were quantified. A linear elastic behaviour of materials involved were considered and in case
of the seismic analysis, nonlinear behaviour of materials was taken into account. The
structural model fulfils all requirements of EN 1998-1 [3] and AzDTN 2.3-1 [6].
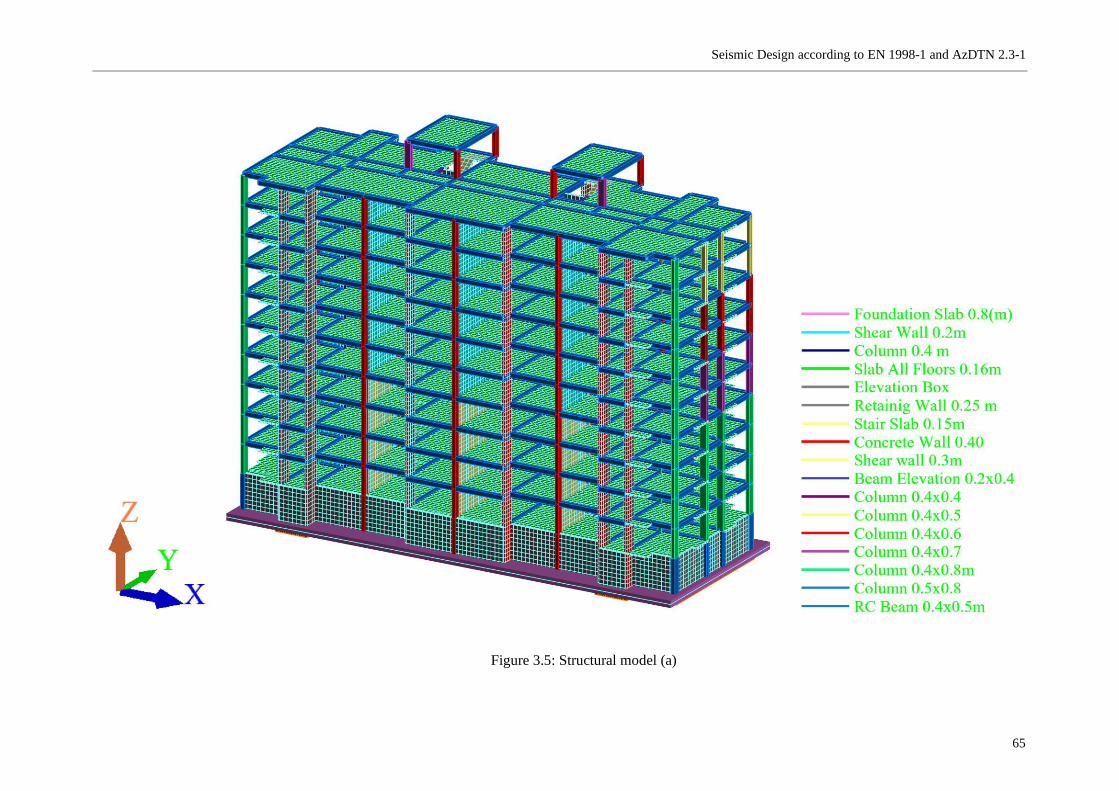
Seismic Design according to EN 1998-1 and AzDTN 2.3-1
65
Figure 3.5: Structural model (a)

Seismic Design according to EN 1998-1 and AzDTN 2.3-1
66
Structural model front view (b)
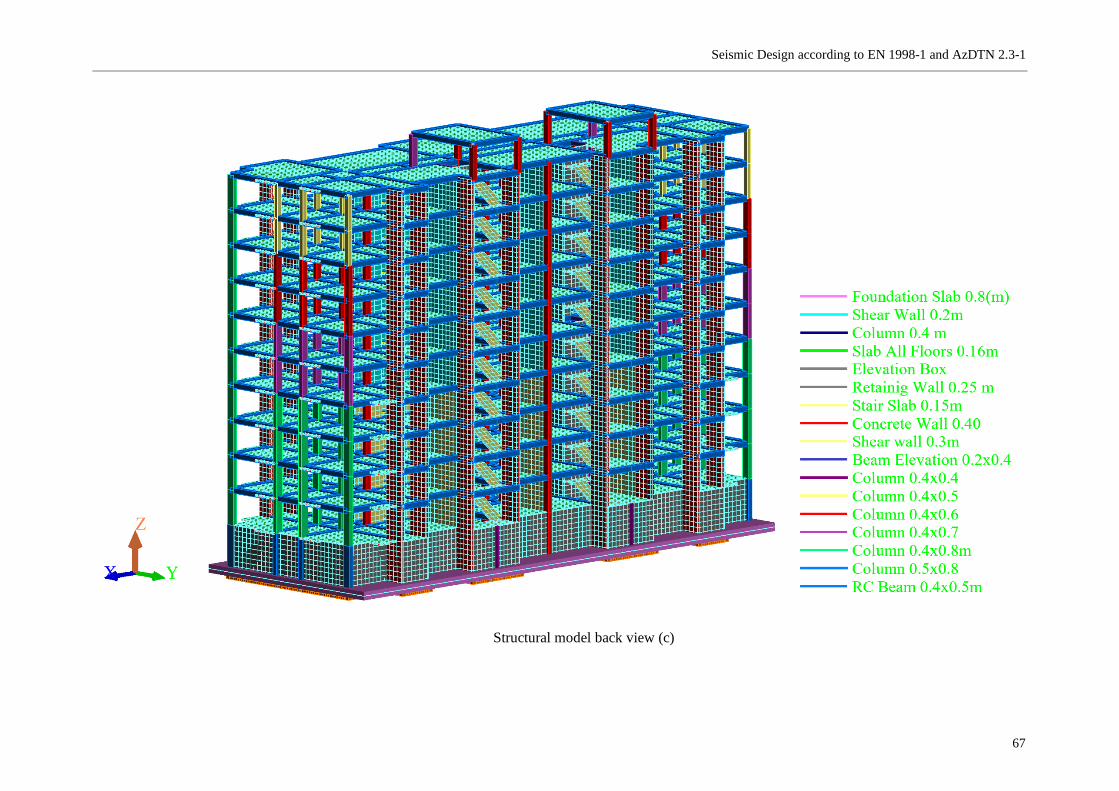
Seismic Design according to EN 1998-1 and AzDTN 2.3-1
67
Structural model back view (c)
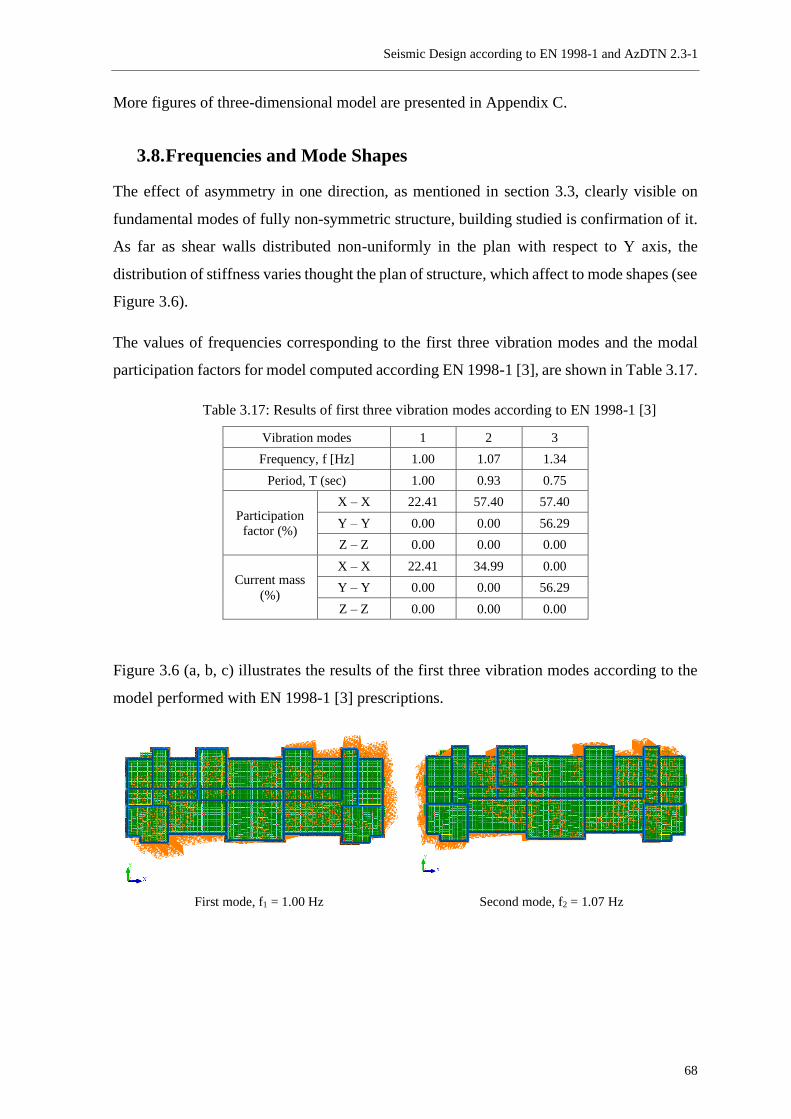
Seismic Design according to EN 1998-1 and AzDTN 2.3-1
68
More figures of three-dimensional model are presented in Appendix C.
3.8. Frequencies and Mode Shapes
The effect of asymmetry in one direction, as mentioned in section 3.3, clearly visible on
fundamental modes of fully non-symmetric structure, building studied is confirmation of it.
As far as shear walls distributed non-uniformly in the plan with respect to Y axis, the
distribution of stiffness varies thought the plan of structure, which affect to mode shapes (see
Figure 3.6).
The values of frequencies corresponding to the first three vibration modes and the modal
participation factors for model computed according EN 1998-1 [3], are shown in Table 3.17.
Table 3.17: Results of first three vibration modes according to EN 1998-1 [3]
Vibration modes 1 2 3
Frequency, f [Hz] 1.00 1.07 1.34
Period, T (sec) 1.00 0.93 0.75
Participation
factor (%)
X – X 22.41 57.40 57.40
Y – Y 0.00 0.00 56.29
Z – Z 0.00 0.00 0.00
Current mass
(%)
X – X 22.41 34.99 0.00
Y – Y 0.00 0.00 56.29
Z – Z 0.00 0.00 0.00
Figure 3.6 (a, b, c) illustrates the results of the first three vibration modes according to the
model performed with EN 1998-1 [3] prescriptions.
First mode, f1 = 1.00 Hz Second mode, f2 = 1.07 Hz
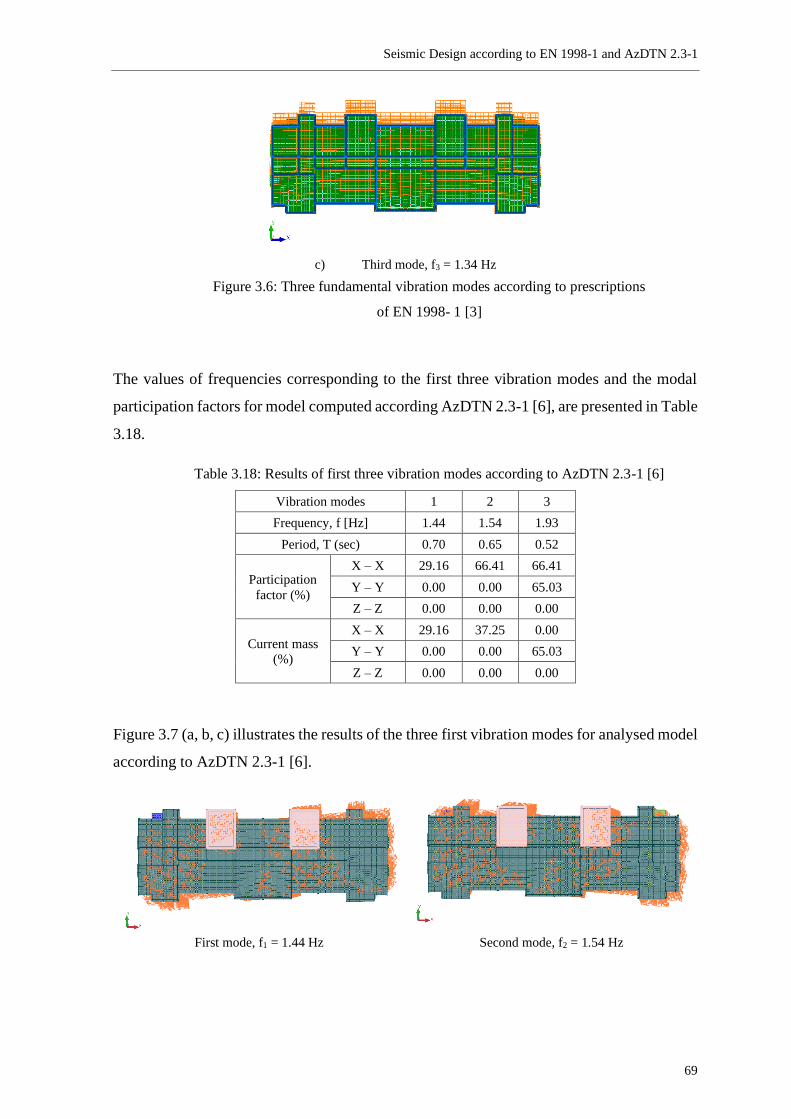
Seismic Design according to EN 1998-1 and AzDTN 2.3-1
69
c) Third mode, f3 = 1.34 Hz
Figure 3.6: Three fundamental vibration modes according to prescriptions
of EN 1998- 1 [3]
The values of frequencies corresponding to the first three vibration modes and the modal
participation factors for model computed according AzDTN 2.3-1 [6], are presented in Table
3.18.
Table 3.18: Results of first three vibration modes according to AzDTN 2.3-1 [6]
Vibration modes 1 2 3
Frequency, f [Hz] 1.44 1.54 1.93
Period, T (sec) 0.70 0.65 0.52
Participation
factor (%)
X – X 29.16 66.41 66.41
Y – Y 0.00 0.00 65.03
Z – Z 0.00 0.00 0.00
Current mass
(%)
X – X 29.16 37.25 0.00
Y – Y 0.00 0.00 65.03
Z – Z 0.00 0.00 0.00
Figure 3.7 (a, b, c) illustrates the results of the three first vibration modes for analysed model
according to AzDTN 2.3-1 [6].
First mode, f1 = 1.44 Hz Second mode, f2 = 1.54 Hz
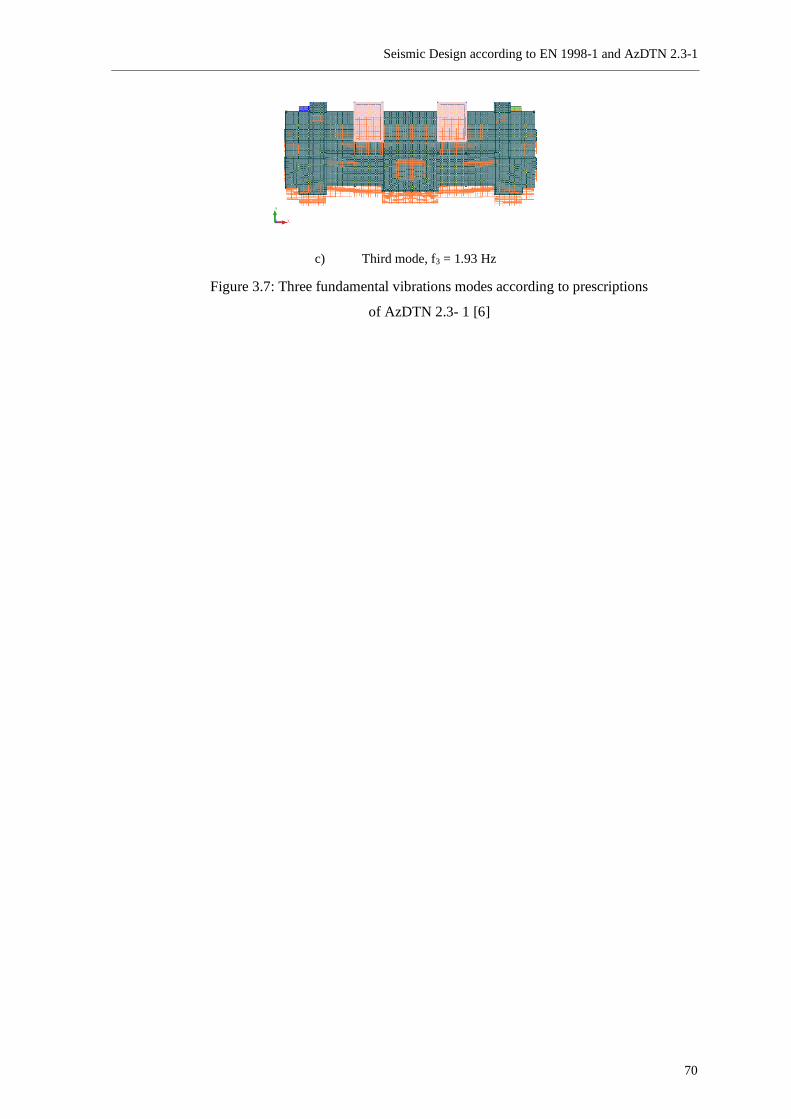
Seismic Design according to EN 1998-1 and AzDTN 2.3-1
70
c) Third mode, f3 = 1.93 Hz
Figure 3.7: Three fundamental vibrations modes according to prescriptions
of AzDTN 2.3- 1 [6]
Seismic Design according to EN 1998-1 and AzDTN 2.3-1
71
Analysis and Interpretation of Results
4.1. Introduction
According to European and Azerbaijan seismic codes the most important parameters for
seismic analysis are base shear, response of structural members on seismic load and overall
displacement drift, which are presented in this chapter. The results taken from a three-
dimensional model computed under combinations described in part 2.2.3 for EN 1998-1 [3]
and in part 2.3.3 for AzDTN 2.3-1 [6].
The following aspects will be compared:
• Base shear of structure;
• Displacement drift;
• Forces due to seismic action in several structural members.
The horizontal elastic response spectrum for both seismic codes, for assumed ground type,
are presented in Figure 4.1.
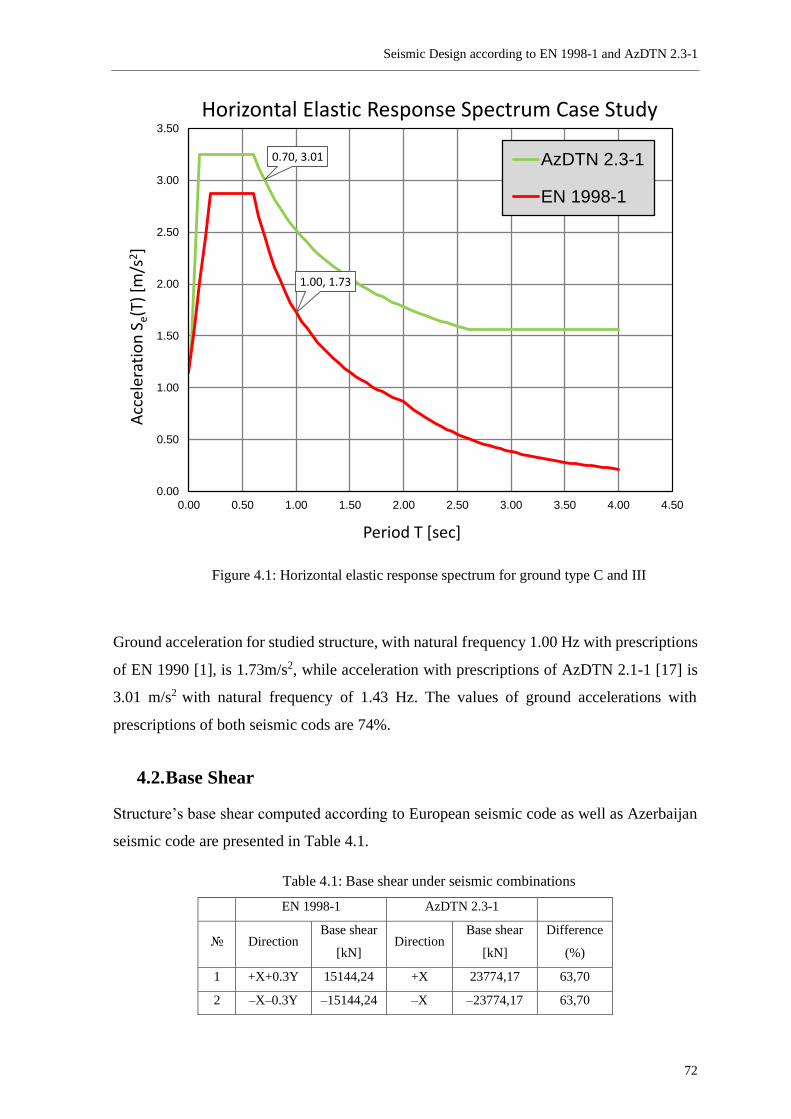
Seismic Design according to EN 1998-1 and AzDTN 2.3-1
72
Figure 4.1: Horizontal elastic response spectrum for ground type C and III
Ground acceleration for studied structure, with natural frequency 1.00 Hz with prescriptions
of EN 1990 [1], is 1.73m/s2, while acceleration with prescriptions of AzDTN 2.1-1 [17] is
3.01 m/s2 with natural frequency of 1.43 Hz. The values of ground accelerations with
prescriptions of both seismic cods are 74%.
4.2. Base Shear
Structure’s base shear computed according to European seismic code as well as Azerbaijan
seismic code are presented in Table 4.1.
Table 4.1: Base shear under seismic combinations
EN 1998-1 AzDTN 2.3-1
№ Direction Base shear
[kN] Direction
Base shear
[kN]
Difference
(%)
1 +X+0.3Y 15144,24 +X 23774,17 63,70
2 –X–0.3Y –15144,24 –X –23774,17 63,70
0.70, 3.01
1.00, 1.73
0.00
0.50
1.00
1.50
2.00
2.50
3.00
3.50
0.00 0.50 1.00 1.50 2.00 2.50 3.00 3.50 4.00 4.50
Acc
eler
atio
n S
e(T)
[m
/s2]
Period T [sec]
Horizontal Elastic Response Spectrum Case Study
AzDTN 2.3-1
EN 1998-1
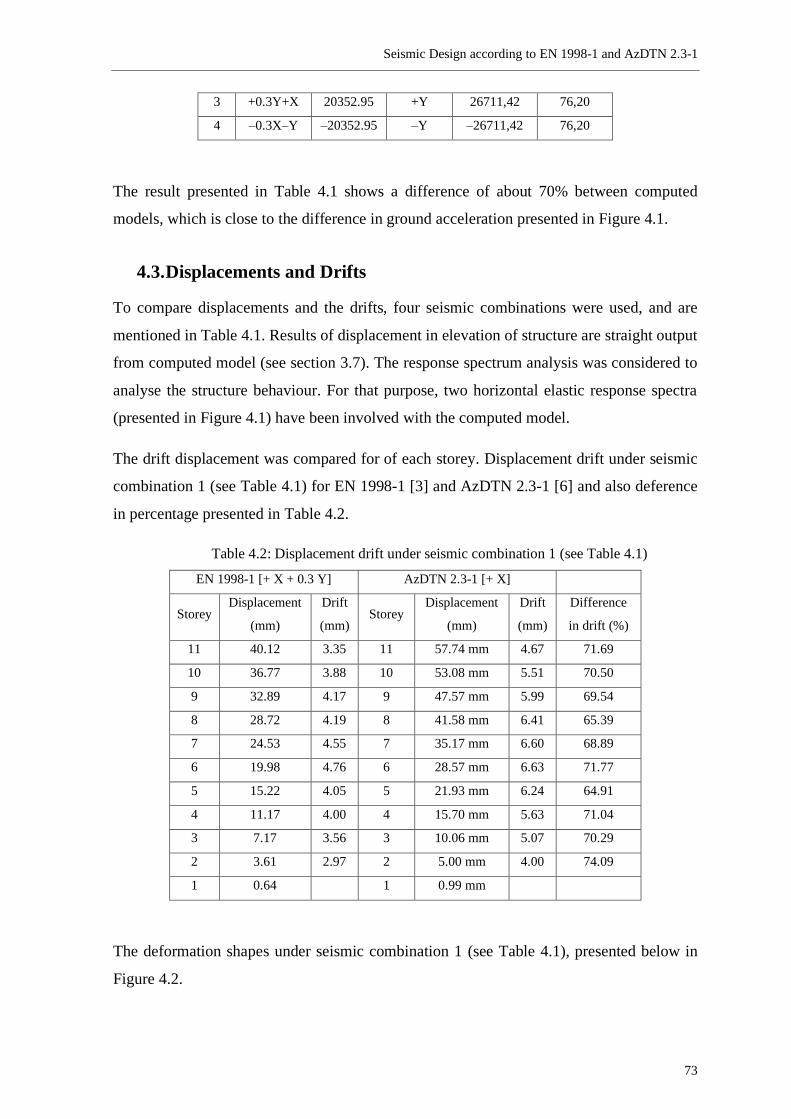
Seismic Design according to EN 1998-1 and AzDTN 2.3-1
73
3 +0.3Y+X 20352.95 +Y 26711,42 76,20
4 –0.3X–Y –20352.95 –Y –26711,42 76,20
The result presented in Table 4.1 shows a difference of about 70% between computed
models, which is close to the difference in ground acceleration presented in Figure 4.1.
4.3. Displacements and Drifts
To compare displacements and the drifts, four seismic combinations were used, and are
mentioned in Table 4.1. Results of displacement in elevation of structure are straight output
from computed model (see section 3.7). The response spectrum analysis was considered to
analyse the structure behaviour. For that purpose, two horizontal elastic response spectra
(presented in Figure 4.1) have been involved with the computed model.
The drift displacement was compared for of each storey. Displacement drift under seismic
combination 1 (see Table 4.1) for EN 1998-1 [3] and AzDTN 2.3-1 [6] and also deference
in percentage presented in Table 4.2.
Table 4.2: Displacement drift under seismic combination 1 (see Table 4.1)
EN 1998-1 [+ X + 0.3 Y] AzDTN 2.3-1 [+ X]
Storey Displacement
(mm)
Drift
(mm) Storey
Displacement
(mm)
Drift
(mm)
Difference
in drift (%)
11 40.12 3.35 11 57.74 mm 4.67 71.69
10 36.77 3.88 10 53.08 mm 5.51 70.50
9 32.89 4.17 9 47.57 mm 5.99 69.54
8 28.72 4.19 8 41.58 mm 6.41 65.39
7 24.53 4.55 7 35.17 mm 6.60 68.89
6 19.98 4.76 6 28.57 mm 6.63 71.77
5 15.22 4.05 5 21.93 mm 6.24 64.91
4 11.17 4.00 4 15.70 mm 5.63 71.04
3 7.17 3.56 3 10.06 mm 5.07 70.29
2 3.61 2.97 2 5.00 mm 4.00 74.09
1 0.64 1 0.99 mm
The deformation shapes under seismic combination 1 (see Table 4.1), presented below in
Figure 4.2.
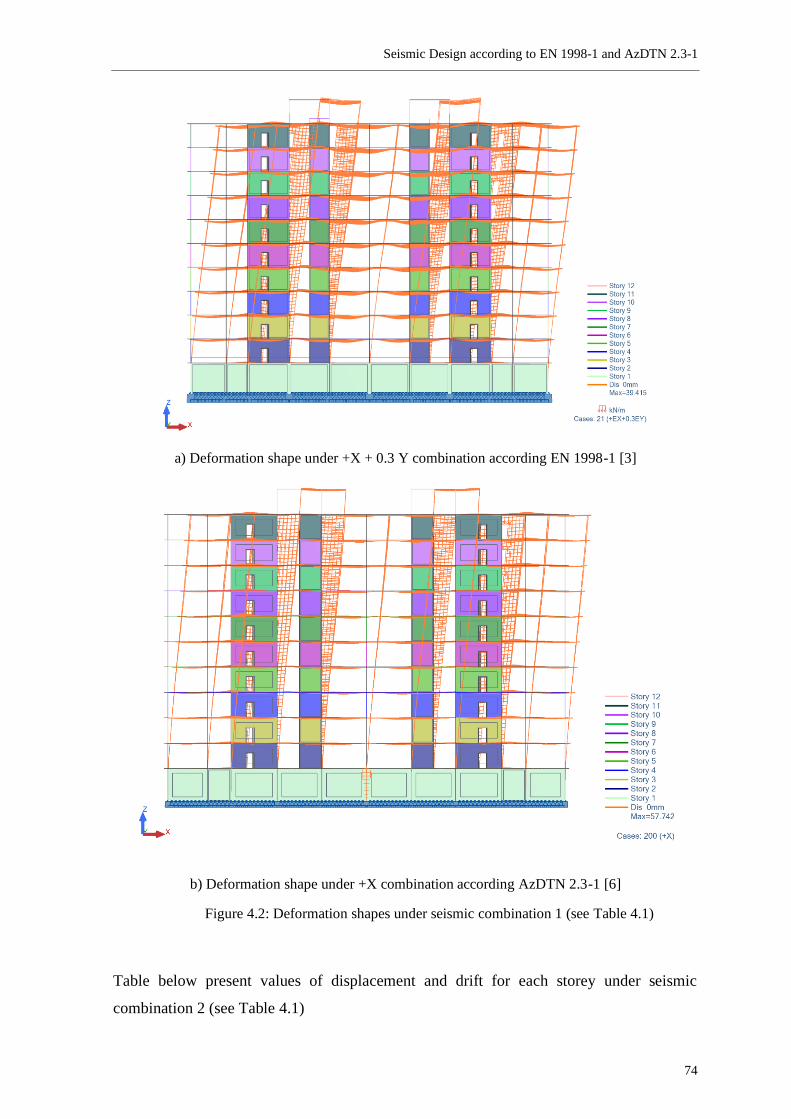
Seismic Design according to EN 1998-1 and AzDTN 2.3-1
74
a) Deformation shape under +X + 0.3 Y combination according EN 1998-1 [3]
b) Deformation shape under +X combination according AzDTN 2.3-1 [6]
Figure 4.2: Deformation shapes under seismic combination 1 (see Table 4.1)
Table below present values of displacement and drift for each storey under seismic
combination 2 (see Table 4.1)
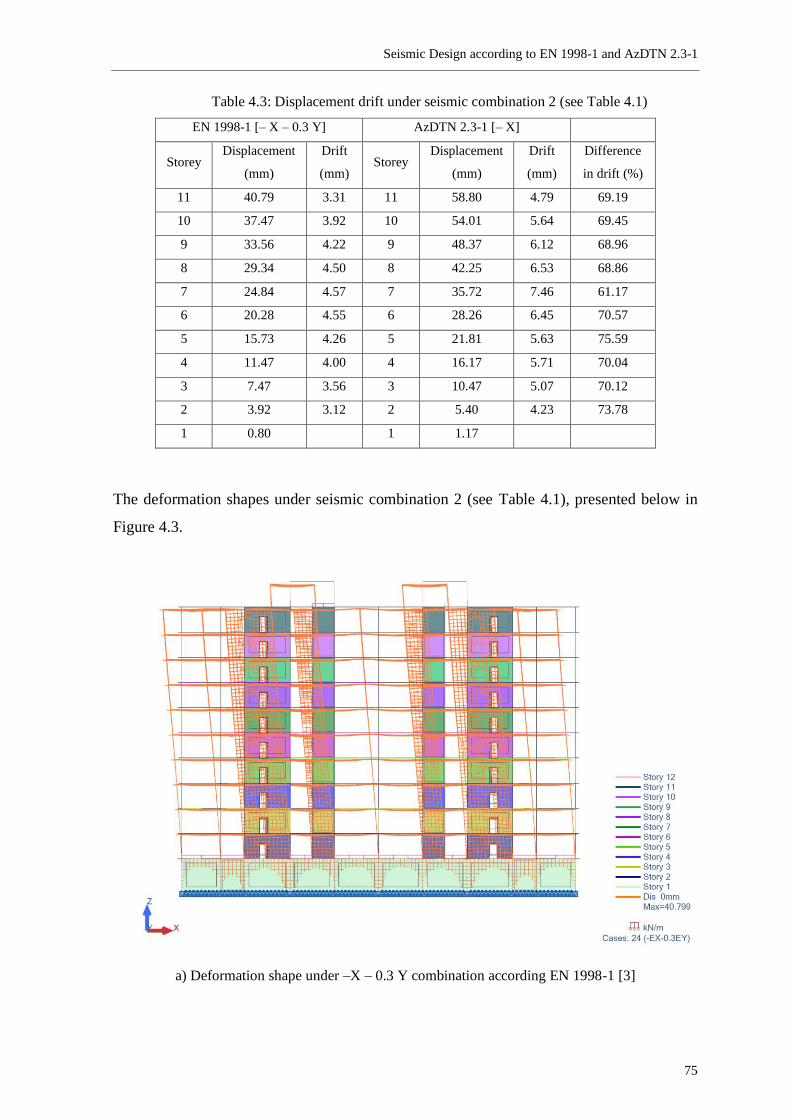
Seismic Design according to EN 1998-1 and AzDTN 2.3-1
75
Table 4.3: Displacement drift under seismic combination 2 (see Table 4.1)
EN 1998-1 [– X – 0.3 Y] AzDTN 2.3-1 [– X]
Storey Displacement
(mm)
Drift
(mm) Storey
Displacement
(mm)
Drift
(mm)
Difference
in drift (%)
11 40.79 3.31 11 58.80 4.79 69.19
10 37.47 3.92 10 54.01 5.64 69.45
9 33.56 4.22 9 48.37 6.12 68.96
8 29.34 4.50 8 42.25 6.53 68.86
7 24.84 4.57 7 35.72 7.46 61.17
6 20.28 4.55 6 28.26 6.45 70.57
5 15.73 4.26 5 21.81 5.63 75.59
4 11.47 4.00 4 16.17 5.71 70.04
3 7.47 3.56 3 10.47 5.07 70.12
2 3.92 3.12 2 5.40 4.23 73.78
1 0.80 1 1.17
The deformation shapes under seismic combination 2 (see Table 4.1), presented below in
Figure 4.3.
a) Deformation shape under –X – 0.3 Y combination according EN 1998-1 [3]
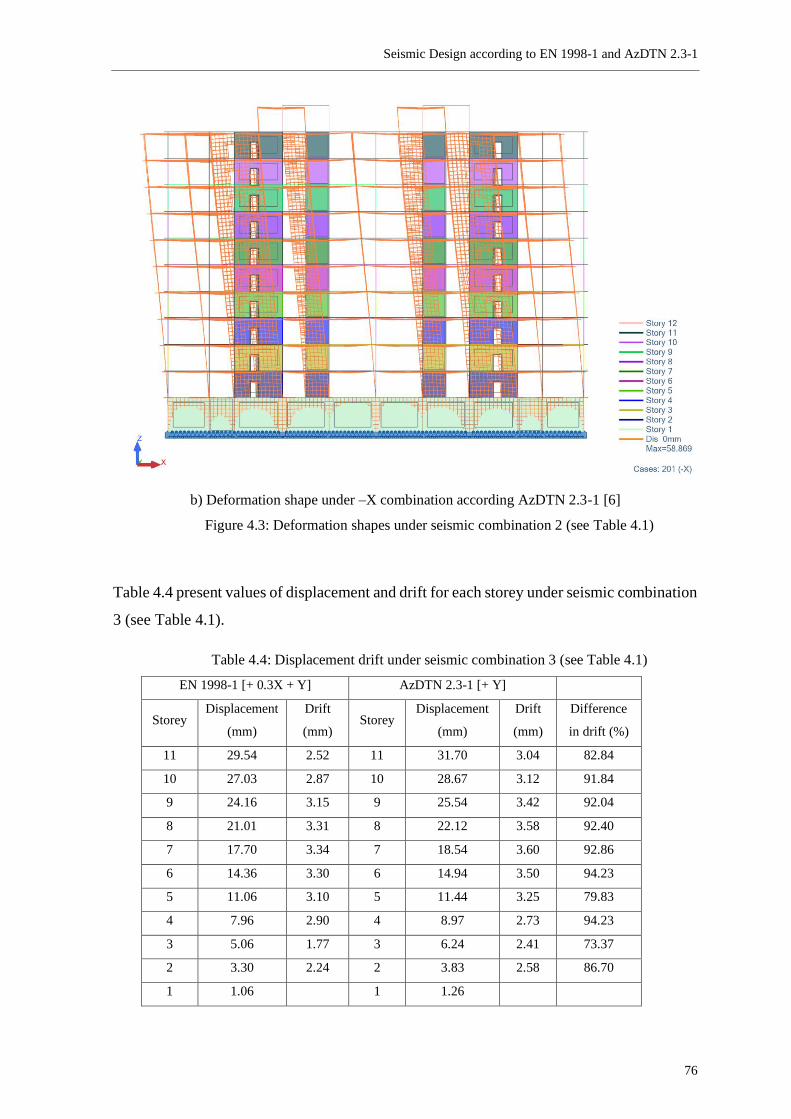
Seismic Design according to EN 1998-1 and AzDTN 2.3-1
76
b) Deformation shape under –X combination according AzDTN 2.3-1 [6]
Figure 4.3: Deformation shapes under seismic combination 2 (see Table 4.1)
Table 4.4 present values of displacement and drift for each storey under seismic combination
3 (see Table 4.1).
Table 4.4: Displacement drift under seismic combination 3 (see Table 4.1)
EN 1998-1 [+ 0.3X + Y] AzDTN 2.3-1 [+ Y]
Storey Displacement
(mm)
Drift
(mm) Storey
Displacement
(mm)
Drift
(mm)
Difference
in drift (%)
11 29.54 2.52 11 31.70 3.04 82.84
10 27.03 2.87 10 28.67 3.12 91.84
9 24.16 3.15 9 25.54 3.42 92.04
8 21.01 3.31 8 22.12 3.58 92.40
7 17.70 3.34 7 18.54 3.60 92.86
6 14.36 3.30 6 14.94 3.50 94.23
5 11.06 3.10 5 11.44 3.25 79.83
4 7.96 2.90 4 8.97 2.73 94.23
3 5.06 1.77 3 6.24 2.41 73.37
2 3.30 2.24 2 3.83 2.58 86.70
1 1.06 1 1.26
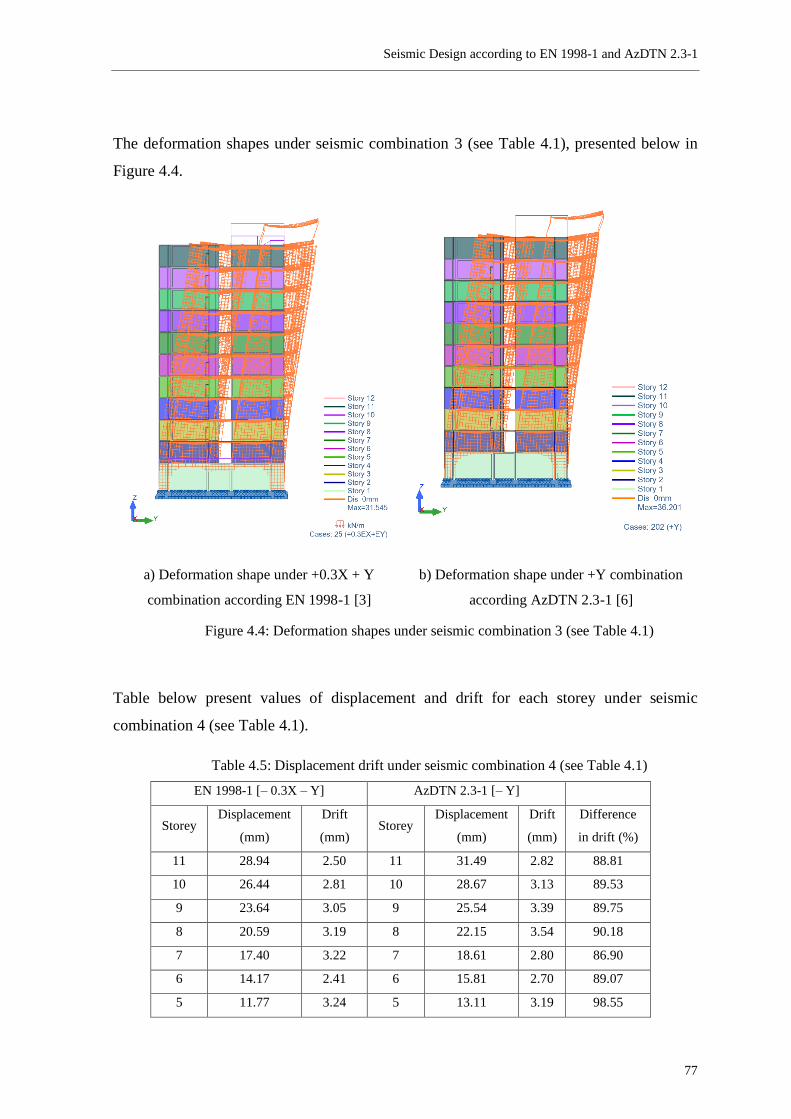
Seismic Design according to EN 1998-1 and AzDTN 2.3-1
77
The deformation shapes under seismic combination 3 (see Table 4.1), presented below in
Figure 4.4.
a) Deformation shape under +0.3X + Y
combination according EN 1998-1 [3]
b) Deformation shape under +Y combination
according AzDTN 2.3-1 [6]
Figure 4.4: Deformation shapes under seismic combination 3 (see Table 4.1)
Table below present values of displacement and drift for each storey under seismic
combination 4 (see Table 4.1).
Table 4.5: Displacement drift under seismic combination 4 (see Table 4.1)
EN 1998-1 [– 0.3X – Y] AzDTN 2.3-1 [– Y]
Storey Displacement
(mm)
Drift
(mm) Storey
Displacement
(mm)
Drift
(mm)
Difference
in drift (%)
11 28.94 2.50 11 31.49 2.82 88.81
10 26.44 2.81 10 28.67 3.13 89.53
9 23.64 3.05 9 25.54 3.39 89.75
8 20.59 3.19 8 22.15 3.54 90.18
7 17.40 3.22 7 18.61 2.80 86.90
6 14.17 2.41 6 15.81 2.70 89.07
5 11.77 3.24 5 13.11 3.19 98.55
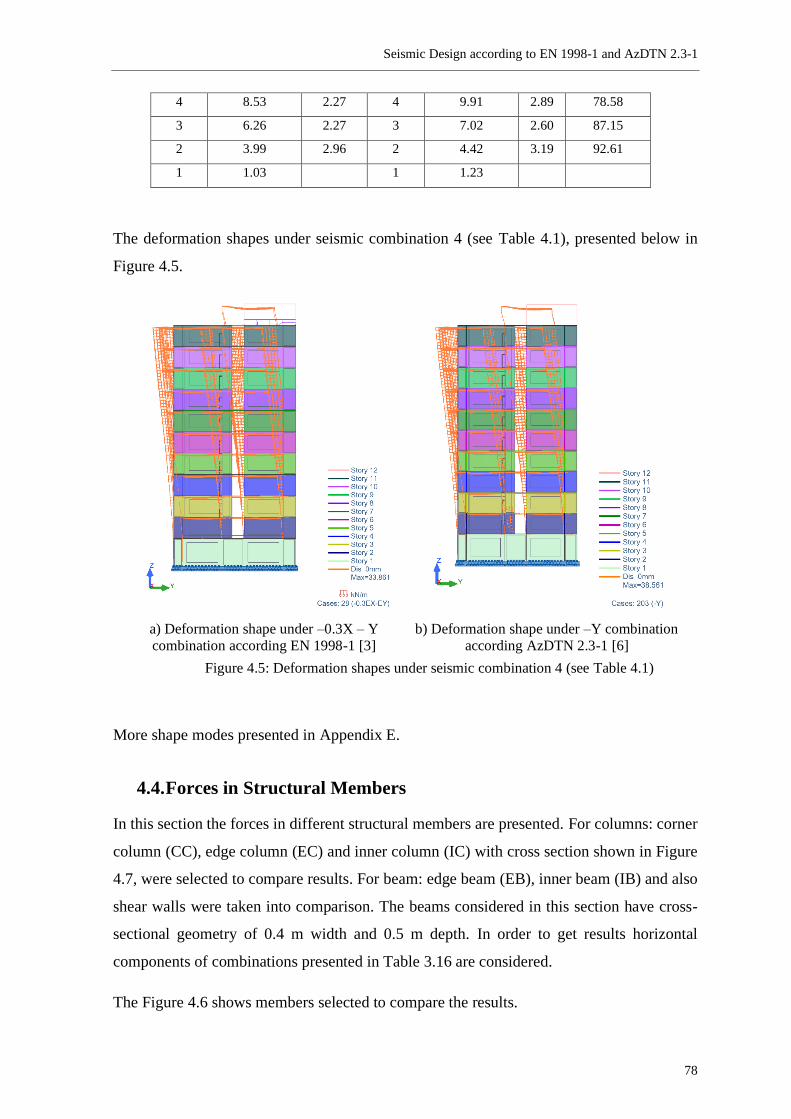
Seismic Design according to EN 1998-1 and AzDTN 2.3-1
78
4 8.53 2.27 4 9.91 2.89 78.58
3 6.26 2.27 3 7.02 2.60 87.15
2 3.99 2.96 2 4.42 3.19 92.61
1 1.03 1 1.23
The deformation shapes under seismic combination 4 (see Table 4.1), presented below in
Figure 4.5.
a) Deformation shape under –0.3X – Y
combination according EN 1998-1 [3]
b) Deformation shape under –Y combination
according AzDTN 2.3-1 [6]
Figure 4.5: Deformation shapes under seismic combination 4 (see Table 4.1)
More shape modes presented in Appendix E.
4.4. Forces in Structural Members
In this section the forces in different structural members are presented. For columns: corner
column (CC), edge column (EC) and inner column (IC) with cross section shown in Figure
4.7, were selected to compare results. For beam: edge beam (EB), inner beam (IB) and also
shear walls were taken into comparison. The beams considered in this section have cross-
sectional geometry of 0.4 m width and 0.5 m depth. In order to get results horizontal
components of combinations presented in Table 3.16 are considered.
The Figure 4.6 shows members selected to compare the results.
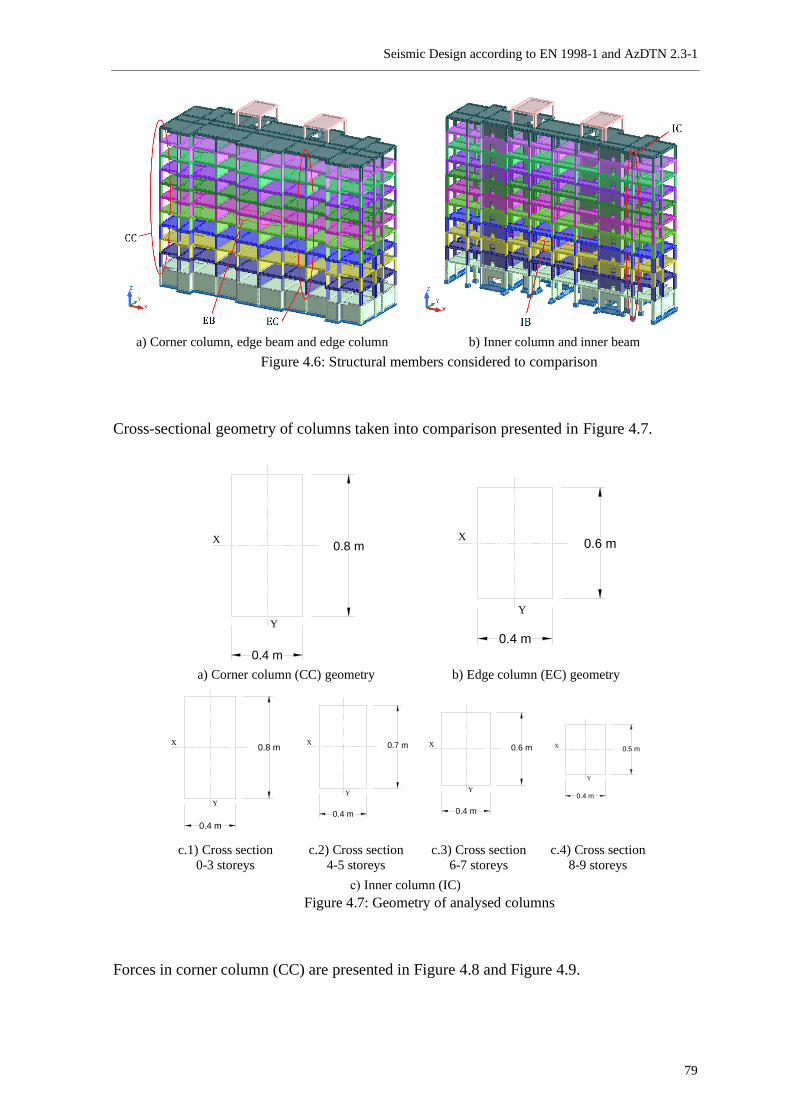
Seismic Design according to EN 1998-1 and AzDTN 2.3-1
79
a) Corner column, edge beam and edge column b) Inner column and inner beam
Figure 4.6: Structural members considered to comparison
Cross-sectional geometry of columns taken into comparison presented in Figure 4.7.
a) Corner column (CC) geometry b) Edge column (EC) geometry
c.1) Cross section
0-3 storeys
c.2) Cross section
4-5 storeys
c.3) Cross section
6-7 storeys
c.4) Cross section
8-9 storeys
с) Inner column (IC)
Figure 4.7: Geometry of analysed columns
Forces in corner column (CC) are presented in Figure 4.8 and Figure 4.9.
X
Y
0.8 m
0.4 m
0.6 m
0.4 m
X
Y
0.4 m
X
Y
0.8 m 0.7 m
0.4 m
X
Y
0.6 m
0.4 m
X
Y
0.5 m
0.4 m
X
Y
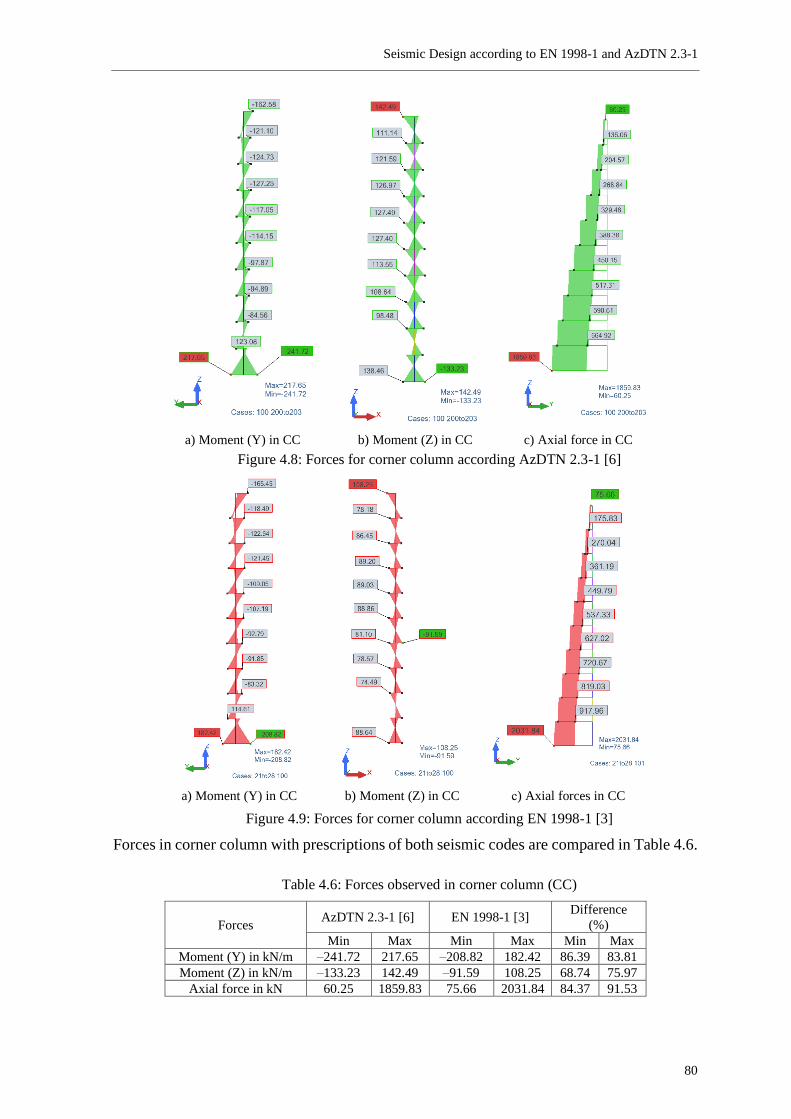
Seismic Design according to EN 1998-1 and AzDTN 2.3-1
80
a) Moment (Y) in CC b) Moment (Z) in CC c) Axial force in CC
Figure 4.8: Forces for corner column according AzDTN 2.3-1 [6]
a) Moment (Y) in CC b) Moment (Z) in CC с) Axial forces in CC
Figure 4.9: Forces for corner column according EN 1998-1 [3]
Forces in corner column with prescriptions of both seismic codes are compared in Table 4.6.
Table 4.6: Forces observed in corner column (CC)
Forces AzDTN 2.3-1 [6] EN 1998-1 [3]
Difference
(%)
Min Max Min Max Min Max
Moment (Y) in kN/m –241.72 217.65 –208.82 182.42 86.39 83.81
Moment (Z) in kN/m –133.23 142.49 –91.59 108.25 68.74 75.97
Axial force in kN 60.25 1859.83 75.66 2031.84 84.37 91.53

Seismic Design according to EN 1998-1 and AzDTN 2.3-1
81
Moments in corner column (CC) as well as axial force have an average of about 81%
difference between models computed according prescriptions of AzDTN 2.3-1 [6] and EN
1998-1 [3] (see Table 4.6), considering higher and lower value. The difference is expected
as far as base shear computed presents roughly the same value of difference.
Forces in edge column (EC) are presented in Figure 4.10 and Figure 4.11.
a) Moment (Y) in EC b) Moment (Z) in EC c) Axial force in EC
Figure 4.10: Forces for edge column according AzDTN 2.3-1 [6]
a) Moment (Y) in EC b) Moment (Z) in EC с) Axial forces in EC
Figure 4.11: Forces for edge column according EN 1998-1 [3]
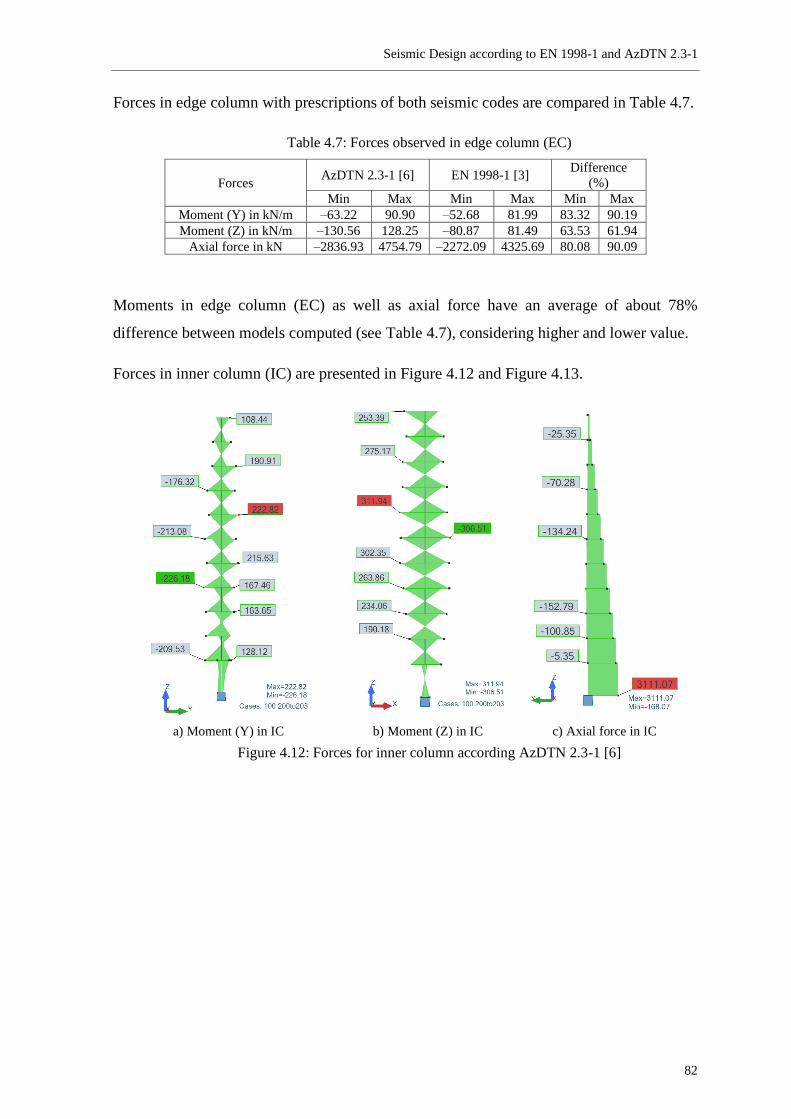
Seismic Design according to EN 1998-1 and AzDTN 2.3-1
82
Forces in edge column with prescriptions of both seismic codes are compared in Table 4.7.
Table 4.7: Forces observed in edge column (EC)
Forces AzDTN 2.3-1 [6] EN 1998-1 [3]
Difference
(%)
Min Max Min Max Min Max
Moment (Y) in kN/m –63.22 90.90 –52.68 81.99 83.32 90.19
Moment (Z) in kN/m –130.56 128.25 –80.87 81.49 63.53 61.94
Axial force in kN –2836.93 4754.79 –2272.09 4325.69 80.08 90.09
Moments in edge column (EC) as well as axial force have an average of about 78%
difference between models computed (see Table 4.7), considering higher and lower value.
Forces in inner column (IC) are presented in Figure 4.12 and Figure 4.13.
a) Moment (Y) in IC b) Moment (Z) in IC c) Axial force in IC
Figure 4.12: Forces for inner column according AzDTN 2.3-1 [6]
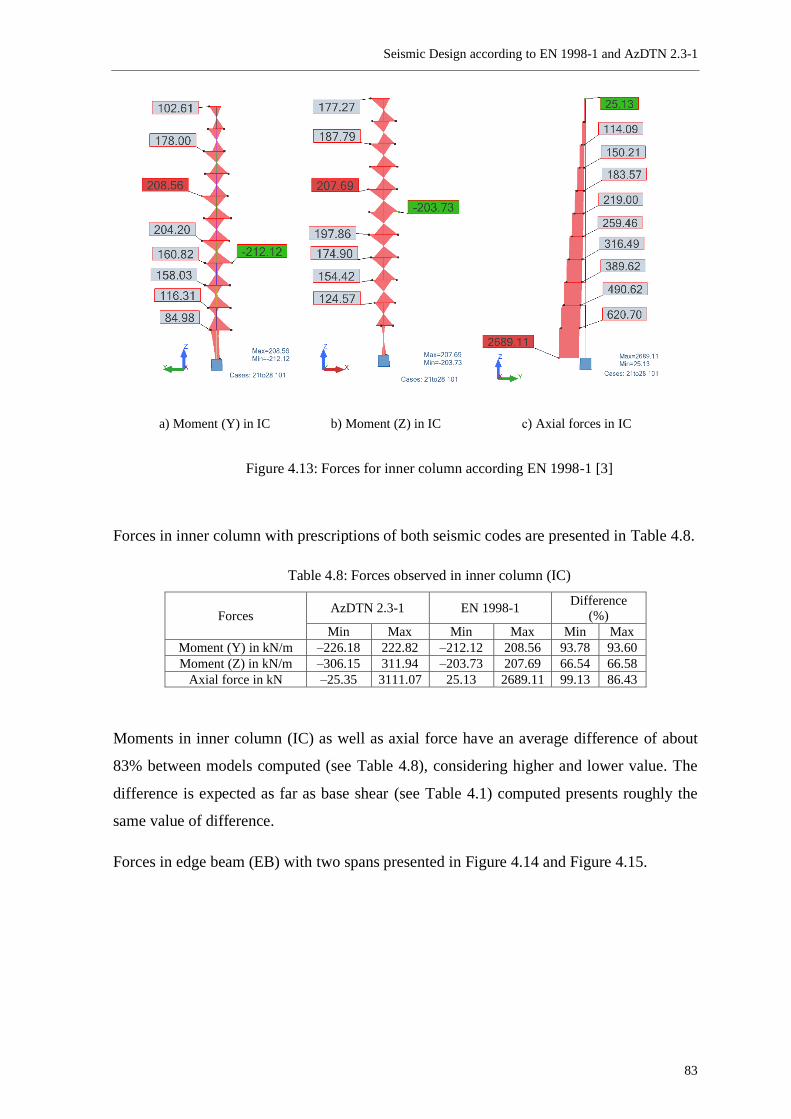
Seismic Design according to EN 1998-1 and AzDTN 2.3-1
83
a) Moment (Y) in IC b) Moment (Z) in IC с) Axial forces in IC
Figure 4.13: Forces for inner column according EN 1998-1 [3]
Forces in inner column with prescriptions of both seismic codes are presented in Table 4.8.
Table 4.8: Forces observed in inner column (IC)
Forces AzDTN 2.3-1 EN 1998-1
Difference
(%)
Min Max Min Max Min Max
Moment (Y) in kN/m –226.18 222.82 –212.12 208.56 93.78 93.60
Moment (Z) in kN/m –306.15 311.94 –203.73 207.69 66.54 66.58
Axial force in kN –25.35 3111.07 25.13 2689.11 99.13 86.43
Moments in inner column (IC) as well as axial force have an average difference of about
83% between models computed (see Table 4.8), considering higher and lower value. The
difference is expected as far as base shear (see Table 4.1) computed presents roughly the
same value of difference.
Forces in edge beam (EB) with two spans presented in Figure 4.14 and Figure 4.15.
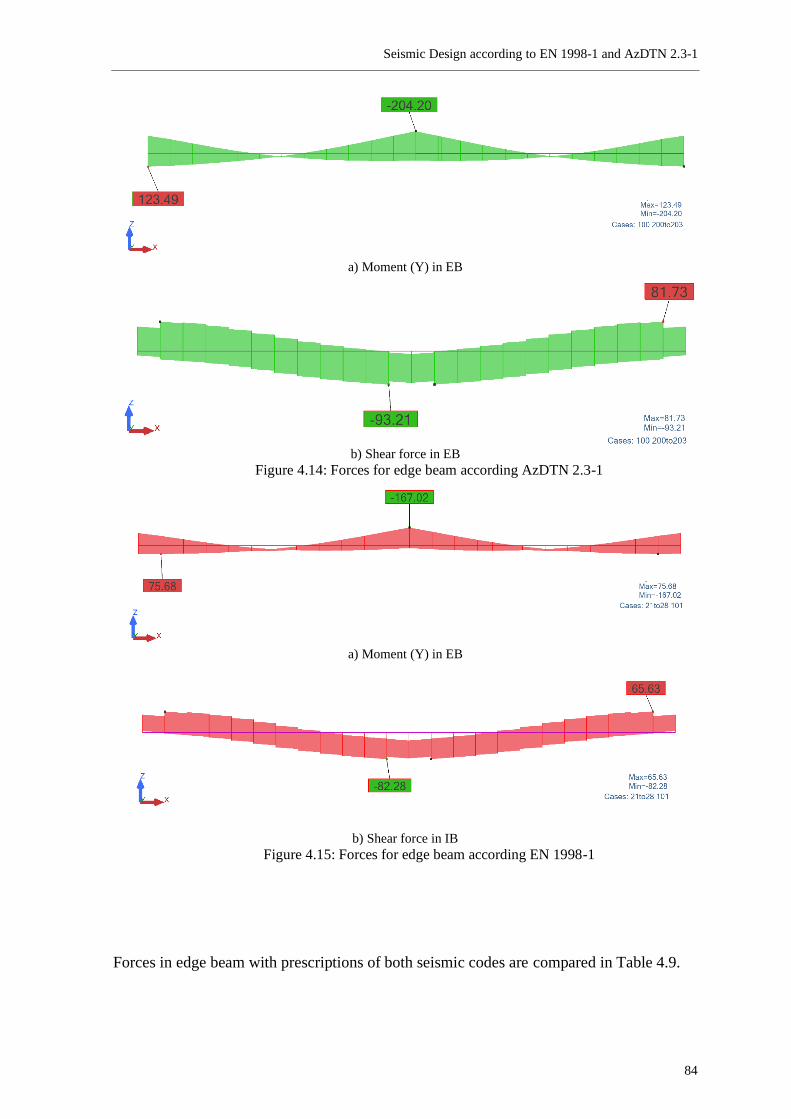
Seismic Design according to EN 1998-1 and AzDTN 2.3-1
84
a) Moment (Y) in EB
b) Shear force in EB
Figure 4.14: Forces for edge beam according AzDTN 2.3-1
a) Moment (Y) in EB
b) Shear force in IB
Figure 4.15: Forces for edge beam according EN 1998-1
Forces in edge beam with prescriptions of both seismic codes are compared in Table 4.9.
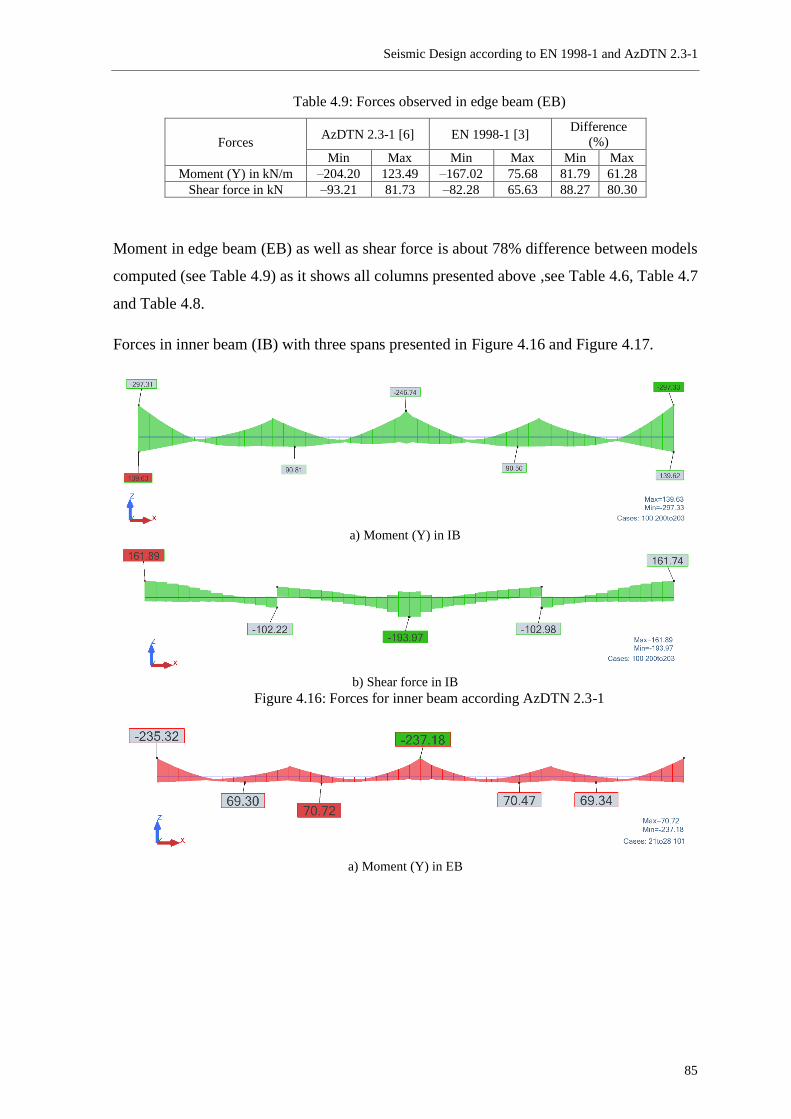
Seismic Design according to EN 1998-1 and AzDTN 2.3-1
85
Table 4.9: Forces observed in edge beam (EB)
Forces AzDTN 2.3-1 [6] EN 1998-1 [3]
Difference
(%)
Min Max Min Max Min Max
Moment (Y) in kN/m –204.20 123.49 –167.02 75.68 81.79 61.28
Shear force in kN –93.21 81.73 –82.28 65.63 88.27 80.30
Moment in edge beam (EB) as well as shear force is about 78% difference between models
computed (see Table 4.9) as it shows all columns presented above ,see Table 4.6, Table 4.7
and Table 4.8.
Forces in inner beam (IB) with three spans presented in Figure 4.16 and Figure 4.17.
a) Moment (Y) in IB
b) Shear force in IB
Figure 4.16: Forces for inner beam according AzDTN 2.3-1
a) Moment (Y) in EB
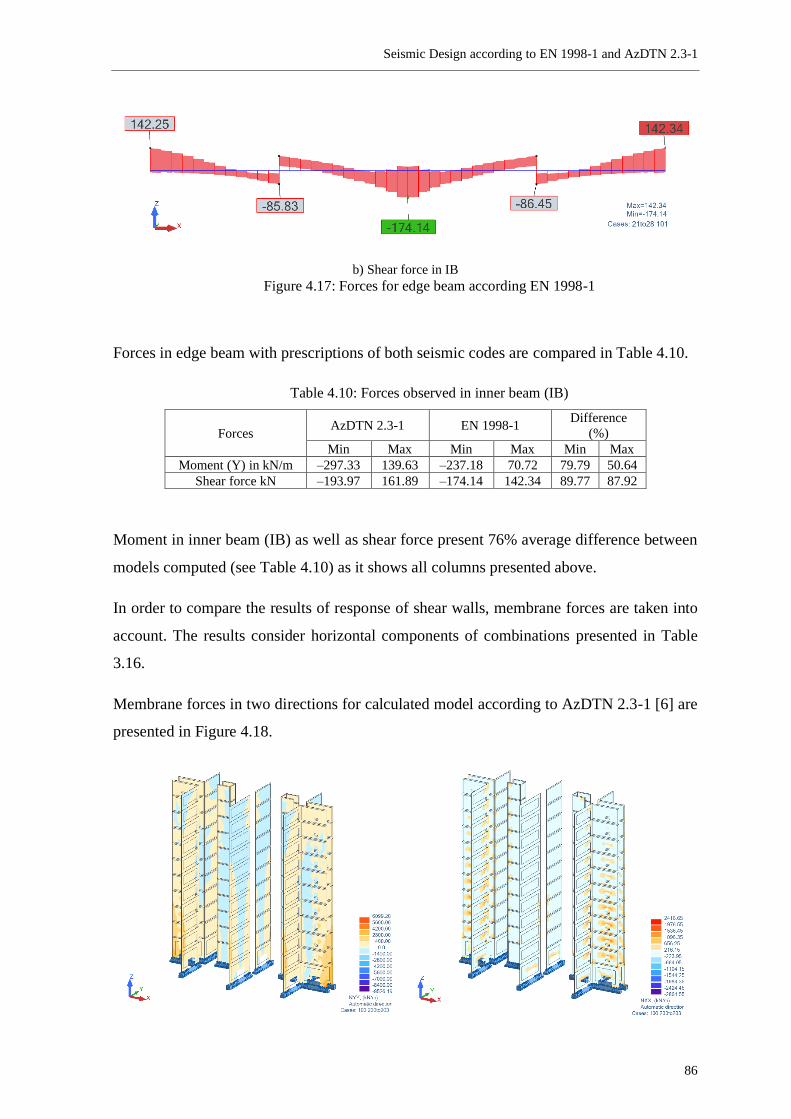
Seismic Design according to EN 1998-1 and AzDTN 2.3-1
86
b) Shear force in IB
Figure 4.17: Forces for edge beam according EN 1998-1
Forces in edge beam with prescriptions of both seismic codes are compared in Table 4.10.
Table 4.10: Forces observed in inner beam (IB)
Forces AzDTN 2.3-1 EN 1998-1
Difference
(%)
Min Max Min Max Min Max
Moment (Y) in kN/m –297.33 139.63 –237.18 70.72 79.79 50.64
Shear force kN –193.97 161.89 –174.14 142.34 89.77 87.92
Moment in inner beam (IB) as well as shear force present 76% average difference between
models computed (see Table 4.10) as it shows all columns presented above.
In order to compare the results of response of shear walls, membrane forces are taken into
account. The results consider horizontal components of combinations presented in Table
3.16.
Membrane forces in two directions for calculated model according to AzDTN 2.3-1 [6] are
presented in Figure 4.18.
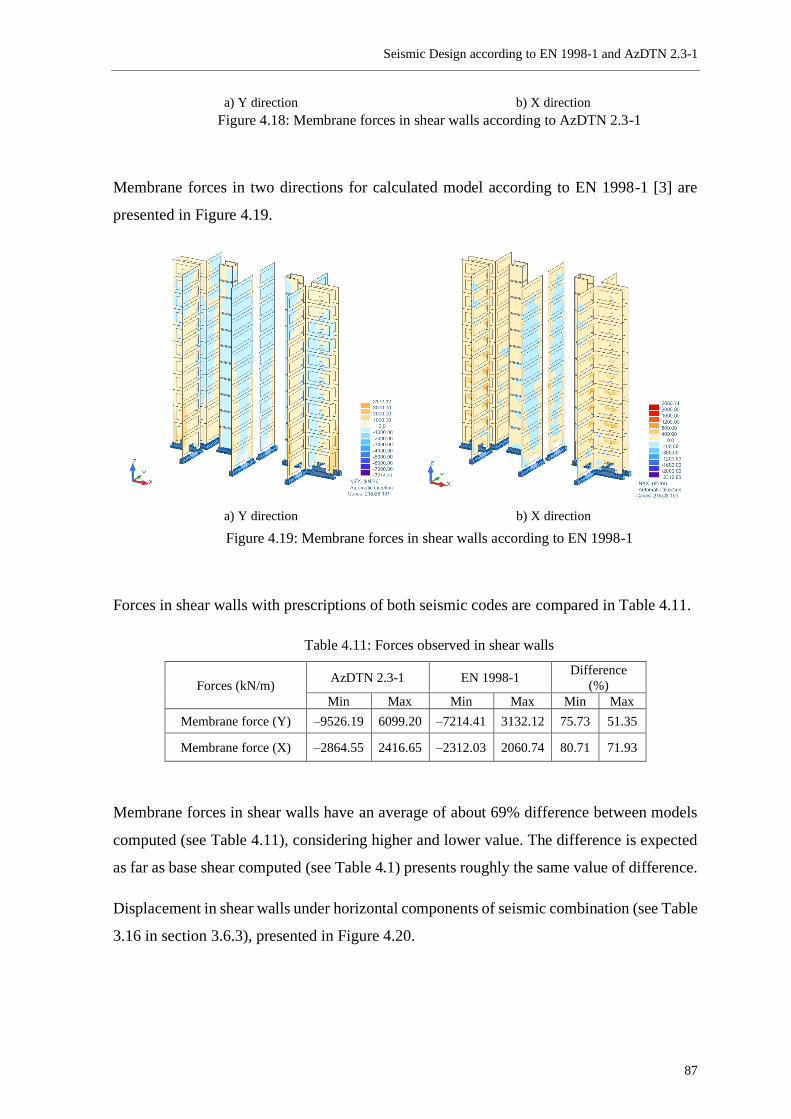
Seismic Design according to EN 1998-1 and AzDTN 2.3-1
87
a) Y direction b) X direction
Figure 4.18: Membrane forces in shear walls according to AzDTN 2.3-1
Membrane forces in two directions for calculated model according to EN 1998-1 [3] are
presented in Figure 4.19.
a) Y direction b) X direction
Figure 4.19: Membrane forces in shear walls according to EN 1998-1
Forces in shear walls with prescriptions of both seismic codes are compared in Table 4.11.
Table 4.11: Forces observed in shear walls
Forces (kN/m) AzDTN 2.3-1 EN 1998-1
Difference
(%)
Min Max Min Max Min Max
Membrane force (Y) –9526.19 6099.20 –7214.41 3132.12 75.73 51.35
Membrane force (X) –2864.55 2416.65 –2312.03 2060.74 80.71 71.93
Membrane forces in shear walls have an average of about 69% difference between models
computed (see Table 4.11), considering higher and lower value. The difference is expected
as far as base shear computed (see Table 4.1) presents roughly the same value of difference.
Displacement in shear walls under horizontal components of seismic combination (see Table
3.16 in section 3.6.3), presented in Figure 4.20.
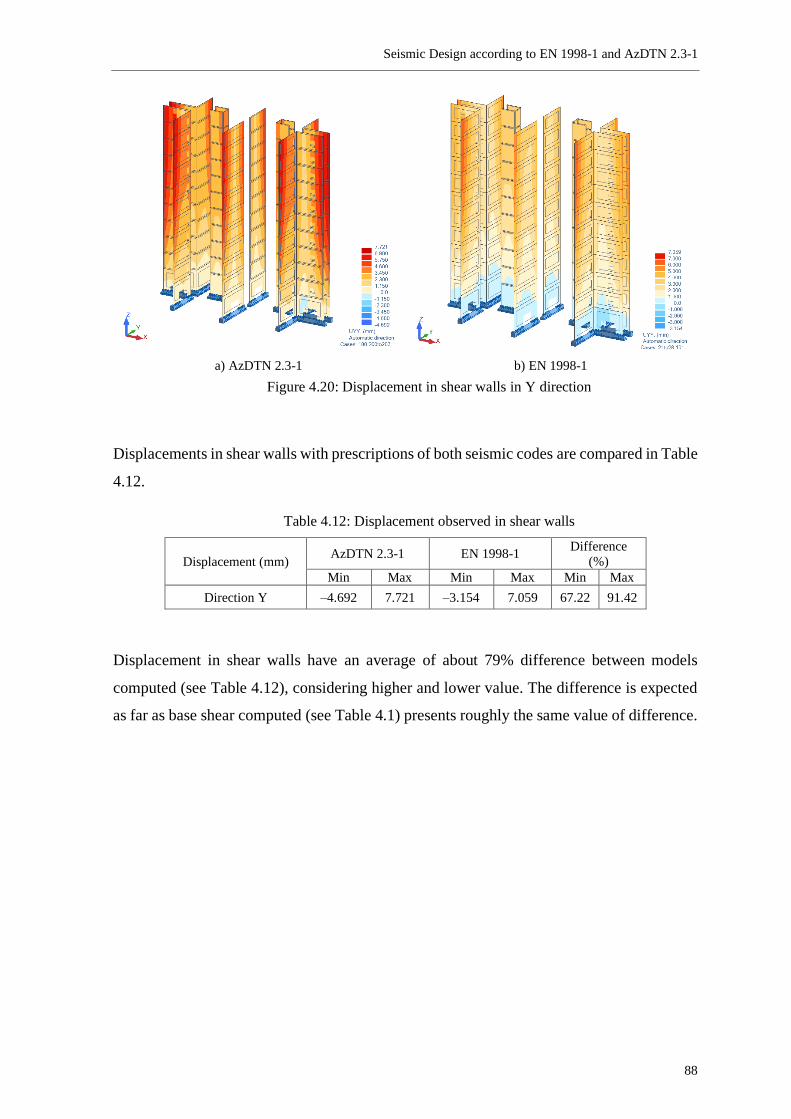
Seismic Design according to EN 1998-1 and AzDTN 2.3-1
88
a) AzDTN 2.3-1 b) EN 1998-1
Figure 4.20: Displacement in shear walls in Y direction
Displacements in shear walls with prescriptions of both seismic codes are compared in Table
4.12.
Table 4.12: Displacement observed in shear walls
Displacement (mm) AzDTN 2.3-1 EN 1998-1
Difference
(%)
Min Max Min Max Min Max
Direction Y –4.692 7.721 –3.154 7.059 67.22 91.42
Displacement in shear walls have an average of about 79% difference between models
computed (see Table 4.12), considering higher and lower value. The difference is expected
as far as base shear computed (see Table 4.1) presents roughly the same value of difference.
Seismic Design according to EN 1998-1 and AzDTN 2.3-1
89
Conclusions and Future works
In this Chapter the main conclusion will be presented based on comparison of the two codes
analysed and the results obtained with the case study chosen for this purpose.
5.1. Summary of Conclusions
As the results show, the biggest statement is that Azerbaijan seismic code presents more
conservativity in all important aspects of seismic analyses than Eurocode 8. For aspects
presented in the fourth Chapter the differences in results of the different parameters analyzed
vary between 60 to 80 %.
In terms of economy, prescriptions of EN 1998-1 are more affordable than AzDTN 2.3-1, as
far as results show, higher forces in structural members lead to using stiffer elements with
higher geometry and consequently higher construction costs.
As mentioned in the first Chapter Azerbaijan Republic is moving towards European
standards. The conclusion drawn by the author based on case study says is that the
Azerbaijan Republic could accept European Construction Standards without major changes.
One of the main differences can be related with seismic combinations, as far as AzDTN 2.3-
1 does not consider seismic action in two directions simultaneously (see Table 3.16 in
chapter 3.6.3), as it present EN 1998-1. Another, not less important issue is that EN 1998-1
considers “accidental torsional effects”, which does not exist in AzDTN 2.3-1 prescriptions.
These two aspects must be accepted by Azerbaijan Construction Standards in order to enter
to European Standards. The first steps have already been taken in 2011 in the 1st reissue of
AzDTN 2.3-1, while classification and parameters of ground type were adopted from EN
1998-1.
The structural members considered in section 4.4 show differences in forces between 70%
to 80%, which meets expectations, as far as close differences observed in horizontal elastic
response spectrum.
Seismic Design according to EN 1998-1 and AzDTN 2.3-1
90
5.2. Future Developments
In this study the author analyzes a multistorey building with eleven storeys. Based on the
conclusion of this work it will be important in the future to analyze different situations taken
into account different types of buildings.
This project could be developed further, for example:
– Comparison of buildings with different structural types, such as “frame system” or
ductile “wall system”;
– Comparison of structure with other ground types;
– Comparison of similar buildings with different behaviour factors;
– Comparison with totally asymmetric and irregular in elevation and in plan structures
(situations not allowed in the studied codes).

Seismic Design according to EN 1998-1 and AzDTN 2.3-1
91
Bibliographic References
1. EN 1990, “Eurocode 0: Basis of structural design”, European Committee for
Standardization, Brussels, 2002.
2. EN 1991-1, “Eurocode 1: Actions on structures – Part 1-1: General actions –
Densities, self-weight, imposed loads for buildings”, European Committee for
Standardization, Brussels, 2002.
3. EN 1998-1, “Eurocode 8: Design of structures for earthquake resistance - Part 1:
General rules, seismic actions and rules for buildings”, European Committee for
Standardization, Brussels, 2004.
4. EN 1997-1, “Eurocode 7: Geotechnical design – Part 1: General Rules”, European
Committee for Standardization, Brussels, 2004.
5. EN 1992-1-1, Eurocode 2: “Design of concrete structures - Part 1-1: General rules
and rules for buildings”, European Committee for Standardization, Brussels, 2004.
6. AzDTN 2.3-1, “Azerbaijan State Construction Norms, Committee on Urban
Planning and Architecture”, State of the Republic of Azerbaijan, Baku, 2010,
[AzDTN 2.3-1, Azerbaijan Dövlət Tikinti Normalari, Azərbaycan Respublikası
Dövlət Şəhərsalma və Arxitektura Komitəsi, Bakı, 2010].
7. NP EN 206-1, Portuguese Norm, Concrete Part 1: “Specification, performance,
production and conformity”, European Committee for Standardization, Brussels,
2000.
8. EN 10080, “Steel for the reinforcement of concrete”, Weldable reinforcing steel –
General, EN 10080:1995, Berlin, Germany, 2005.
9. “Failure, distress and repair of concrete structures”, Norbert Delatte, Woodhead
Publishing Limited, Cambridge, UK, 2009.
10. EN 10080, “Weldable reinforcing steel – General”, EN 10080:2005, European
Committee for Standardization, Brussels, 2005.
Seismic Design according to EN 1998-1 and AzDTN 2.3-1
92
11. Eurocode 8: “Seismic Design of Buildings Worked examples”, P.Bisch, E. Carvalho,
H.Degee, P. Fajfar, M. Fardis, P. Franchin,…G. Tsionis, Feb. (2011), Italy, 2012.
12. O. Esmaili, S. Epackachi, M. Samadzad, and S. R. Mirghaderi, “Study of Structural
RC Shear Wall System in a 56-Storey RC Tall Building,” 14th World Conf. Earthq.
Eng., 2008.
13. Designers’ Guide to EN 1998-1 and 1998-5. Eurocode 8: Design Provisions for
Earthquake Resistant Structures. 2005.
14. “Advanced Building Analysis for Seismic Design with Eurocode 8”, Koh Chan Ghee,
Choo June Shyan, November 2012, Singapore.
15. M. A. Khan, “Modern Earthquake Engineering,” in Earthquake-Resistant Structures,
2013.
16. SNiP II-7-81*, “Construction Norms and Rules”, Construction in seismic areas,
Official publication, 2007, [СНиП II-7-81*, СТРОИТЕЛЬНЫЕ НОРМЫ И
ПРАВИЛА, Строительство в сейсмических районах, Издание официальное,
2007]
17. AzDTN 2.1-1, “Loads and Actions”, Design Norms, Committee on Urban Planning
and Architecture, State of the Republic of Azerbaijan, 15 Abril, 2015, [AzDTN 2-1-
1, Yüklər və Təsirlər, Layihələndirmə Normalari, Azərbaycan Respublikası Dövlət
Şəhərsalma və Arxitektura Komitəsi, Azerbaijan Dövlət Tikinti Normalari, 15 aprel,
2015].
18. SNiP 2.01.07-85*, “Construction Norms and Rules, Loads and Actions”, General
Rules, First edition, Moscow, September 2007, [СНиП 2.01.07-85*, Строительные
нормы и правила, Нагрузки и Воздействия, Общие положения, Первая
редакция, Москва, Сентябрь 2007
19. R. W. Clough and J. Penzien, Dynamics of Structures, Third Edition. 2013.
20. “Construction in seismic areas, Azerbaijan Republic”, State town-building and
architecture committee, Baku, 2009
21. AzDTN 2.16-1, “Concrete and Reinforced Concrete Structures”, Design Norms,
Committee on Urban Planning and Architecture, 15 April 2015, [AzDTN 2.16-1,
Seismic Design according to EN 1998-1 and AzDTN 2.3-1
93
Beton ve Demir-beton Konstruksiyalar, Layihələndirmə normalari, Azərbaycan
Respublikası Dövlət Şəhərsalma və Arxitektura Komitəsi, 15 aprel, 2015].
22. “A Review of the Seismic Hazard Zonation in National Building Codes in the Contex
of Eurocode 8”, Join Research Centre, European Commisson, G. Solomos, A. Pinto,
S. Dimova, EUR 23563 EN – 2008, Italy.
23. “Overview of Seismic Loads and Application of Local Code Provisions for Tall
Buildings in Baku”, Azerbaijan, Hi Sun Choi, Thornton Tomassetti, James Sze,
Leonard Joseph, March 2014.
24. “European Seismic Hazard Map”, D. Giardini, J. Woessner, L. Danciu, Swiss
Seismological Service, ETH Zurich, August 2013.
25. EOS, Transactions, American Geophysical Union, “Mapping Europe’s Seismic
Hazard”, pages 261-262, 22 July, 2014.
26. “Global Seismic Hazard Map”, Global Seismic Hazard Assessment Program
(GSHAP), D. Giardini, G. Grunthal, K. Shedlock, P. Zhang, 1999.
27. “Dynamic of Structures”, Theory and Applications to Earthquake Engineering,
Fourth Edition, Anil K.Chopra.
28. E. M. Marino, M. Nakashima, and K. M. Mosalam, “Comparison of European and
Japanese seismic design of steel building structures,” Eng. Struct., 2005, doi:
10.1016/j.engstruct.2005.01.004.
29. R. W. Clough and J. Penzien, Dynamics of Structures, Third Edition. 2013.
30. “Structural Analysis, In theory and Practise, Alan Williams”, Ph.D., S.E., C.ENG.,
International Codes Council, USA.
31. “Seismic Evaluation of RC Framed Buildings Using Shear Failure Model”,
Avadhoot Bhosale, Master of Technology in Civil Engineering, National Institute of
Technology Rourkela Orissa – 769008, India, May 2012.
32. M. Tomaževič, “Damage as a measure for earthquake-resistant design of masonry
structures: Slovenian experience” Can. J. Civ. Eng., 2007, doi: 10.1139/L07-128.

Seismic Design according to EN 1998-1 and AzDTN 2.3-1
94
33. H. GÖKDEMİR and A. GÜNAYDIN, “INVESTIGATION OF STRONG
COLUMN – WEAK BEAM RATIO IN MULTI-STOREY STRUCTURES,”
ANADOLU Univ. J. Sci. Technol. A - Appl. Sci. Eng., 2018, doi:
10.18038/aubtda.359828.
34. “Al-Hocema Earthquake 24 02 2004”, Field Report, Patrick Murphy Corella, June
2004.
35. “Soft Storey in Buildings and its Vulnerability Towards Earthquakes”, Justin
Musopole, 24 March, 2018.
36. “The Main Reason for Great Damages of Reinforced Concrete Buildings on 12th
November 2017”, Sarpol-e Zahad Earthquake, Mohammad Ghasem Vetr, Mahdi
Saeidian, Aran Naserpour, 29 September 2018.
37. Catagay, I. H. (2005), “Failure of an industrial building during a recent earthquake
in Turkey”, Eng. Fail. Anal., 12(4), 497-507.
38. “Seismic Evaluation and Retrofit of Deteriorated Concrete Bridge Components”,
Syracuse University, Department of Civil and Environmental Engineering, Riyad S.
Aboutaha, Fares Jnaid, Sara Sotoud, Musip Tapan, Syracuse, New York, June 2013.
39. Brunsdon, D. R., Davey, R. A., Graham, C. J., Sidwell, G. K., Villamor, P., White,
R. H., and Zhao, J. X., 2000. The Chi-Chi Taiwan earthquake of 21 September 1999;
Report of the NZSEE Reconnaissance Team, Bull. N. Z. Soc. Earthquake Eng. 33
(2), June, 105–167.
40. Moehle, J.P., Eberhard, M.O. "Earthquake Damage to Bridges." Bridge Engineering
Handbook. Ed. Wai-Fah Chen and Lian Duan Boca Raton: CRC Press, 2000.
41. B. T. Aagaard et al., “Ground-motion modeling of the 1906 San Francisco
Earthquake, part II: Ground-motion estimates for the 1906 earthquake and scenario
events,” 2008, doi: 10.1785/0120060410.
42. Dynamic Analysis and Earthquake Engineering, Notebook Teaching Materials,
Department of Civil Engineering, Hugo Rodrigues, Humberto Varum.
43. C. Cambridge Dictionary, “Cambridge Dictionary,” Cambridge University Press,
2016.

Seismic Design according to EN 1998-1 and AzDTN 2.3-1
95
44. “Autodesk Robot Structural Analysis Professional 2019”, Autodesk, John Walker,
1982, USA, California.
Seismic Design according to EN 1998-1 and AzDTN 2.3-1
96
Appendices
In this Chapter the author present figures and tables which are not included to the main text.
Appendix A presents architectural drawings, which is north and east facades of the studied
building. Drawings presented by Azerbaijan Architecture and Construction University,
Department of Reinforced Concrete Structure.
Appendix B presents structural plan which drawn by the author, based on architectural
drawings provided.
Appendix C presents a numerical three-dimensional model.
Appendix D presents partial factors used to determining stresses applied to retaining
structure.
Appendix E presents displacement shapes under seismic combinations.
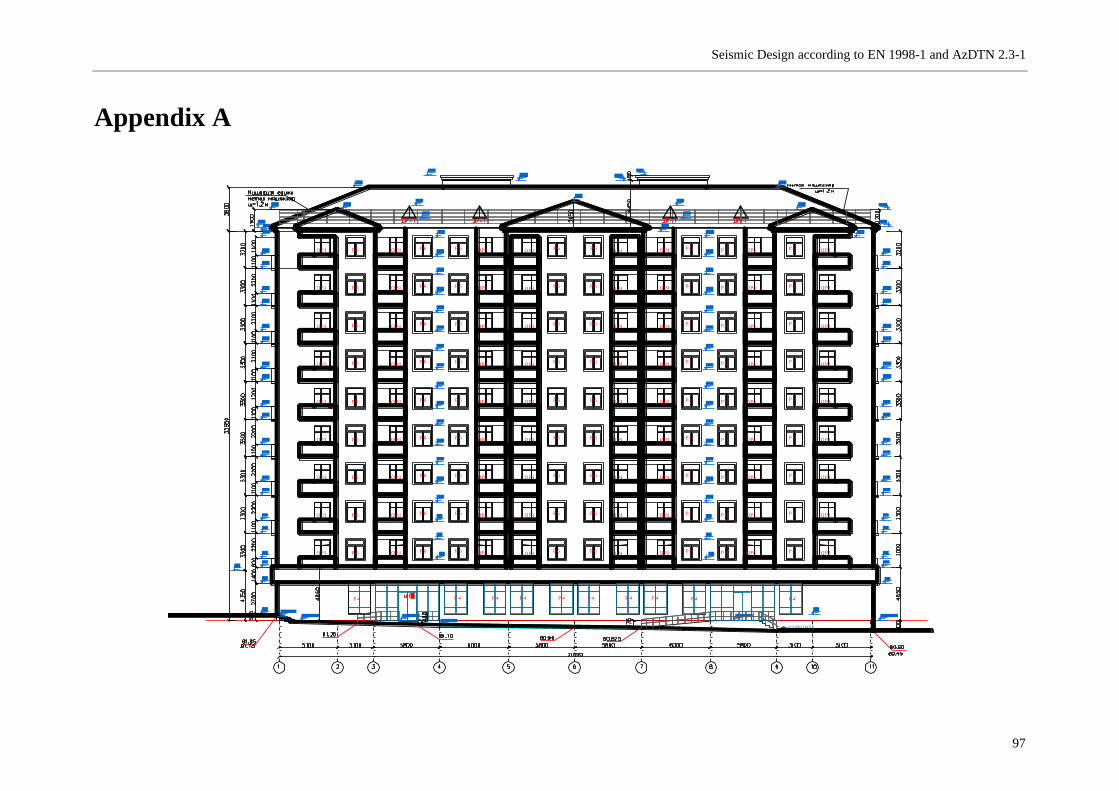
Seismic Design according to EN 1998-1 and AzDTN 2.3-1
97
Appendix A
P-6QP-1 QP-1 P-6 P-6 QP-1QP-1P-6P-6 QP-1 QP-1 P-6 P-6 QP-1 P-6QP-1
P-6QP-1 QP-1 P-6 P-6 QP-1QP-1P-6P-6 QP-1 QP-1 P-6 P-6 QP-1 P-6QP-1
P-6QP-1 QP-1 P-6 P-6 QP-1QP-1P-6P-6 QP-1 QP-1 P-6 P-6 QP-1 P-6QP-1
P-6QP-1 QP-1 P-6 P-6QP-1QP-1P-6P-6 QP-1 QP-1 P-6 P-6 QP-1 P-6QP-1
P-6QP-1 QP-1P-6 P-6
QP-1QP-1P-6P-6QP-1 QP-1
P-6 P-6QP-1
P-6QP-1
P-6QP-1 QP-1P-6 P-6
QP-1QP-1P-6P-6QP-1 QP-1
P-6 P-6QP-1
P-6QP-1
P-6QP-1 QP-1 P-6 P-6 QP-1QP-1P-6P-6 QP-1 QP-1P-6 P-6
QP-1P-6QP-1
P-6QP-1 QP-1 P-6 P-6 QP-1QP-1P-6P-6 QP-1 QP-1P-6 P-6
QP-1P-6QP-1
P-6QP-1 QP-1 P-6 P-6 QP-1QP-1P-6P-6 QP-1 QP-1P-6 P-6
QP-1P-6QP-1
P-4 P-4 P-4 P-4P-4 P-4 P-4 P-4 P-4 P-4
-0.9 0(8 0.60)
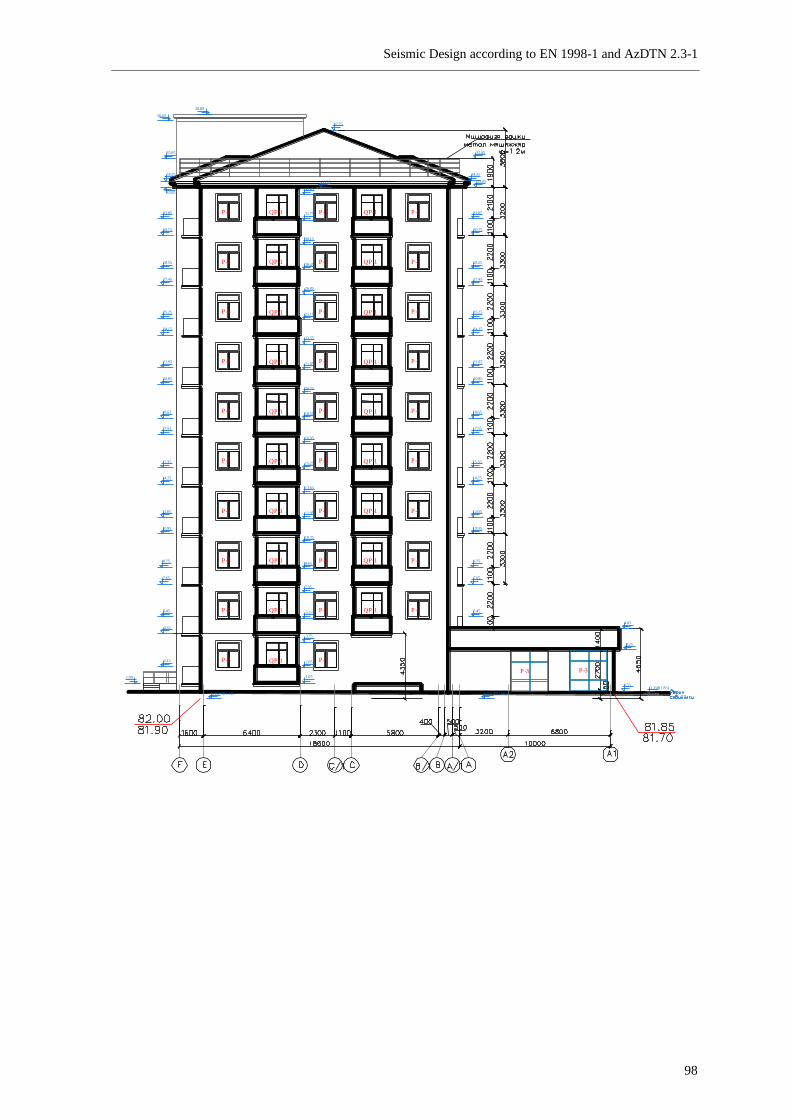
Seismic Design according to EN 1998-1 and AzDTN 2.3-1
98
37.75
P-6 QP-1 P-6
P-6 QP-1 P-6 P-6QP-1
P-6 QP-1 P-6 P-6QP-1
P-6 QP-1 P-6 P-6QP-1
P-6 QP-1 P-6 P-6QP-1
P-6 QP-1 P-6 P-6QP-1
P-6 QP-1 P-6 P-6QP-1
P-6 QP-1 P-6 P-6QP-1
P-6 QP-1 P-6 P-6QP-1
P-6 QP-1 P-6 P-6QP-1
±0.0 0(8 1.50)
35.85
38.40
38.80
33.95
34.35
2.15
4.35
31.85
30.75
28.55
27.45
25.25
24.15
21.95
20.85
18.65
17.55
15.35
12.05
10.95
8.75
5.45
7.65
14.25
1.00
±0.0 0(8 1.50)
3.25
0.55
4.65
0 .35(8 1.85)
35.85
31.85
33.95
34.35
30.75
28.55
27.45
25.25
24.15
21.95
20.85
18.65
17.55
15.35
12.05
10.95
8.75
5.45
7.65
14.25
33.45
31.75
30.15
28.45
26.85
25.15
23.55
21.85
20.25
18.55
16.95
15.25
13.65
11.95
10.35
8.65
7.05
5.35
3.75
2.05
1.05
33.95
P-3P-3
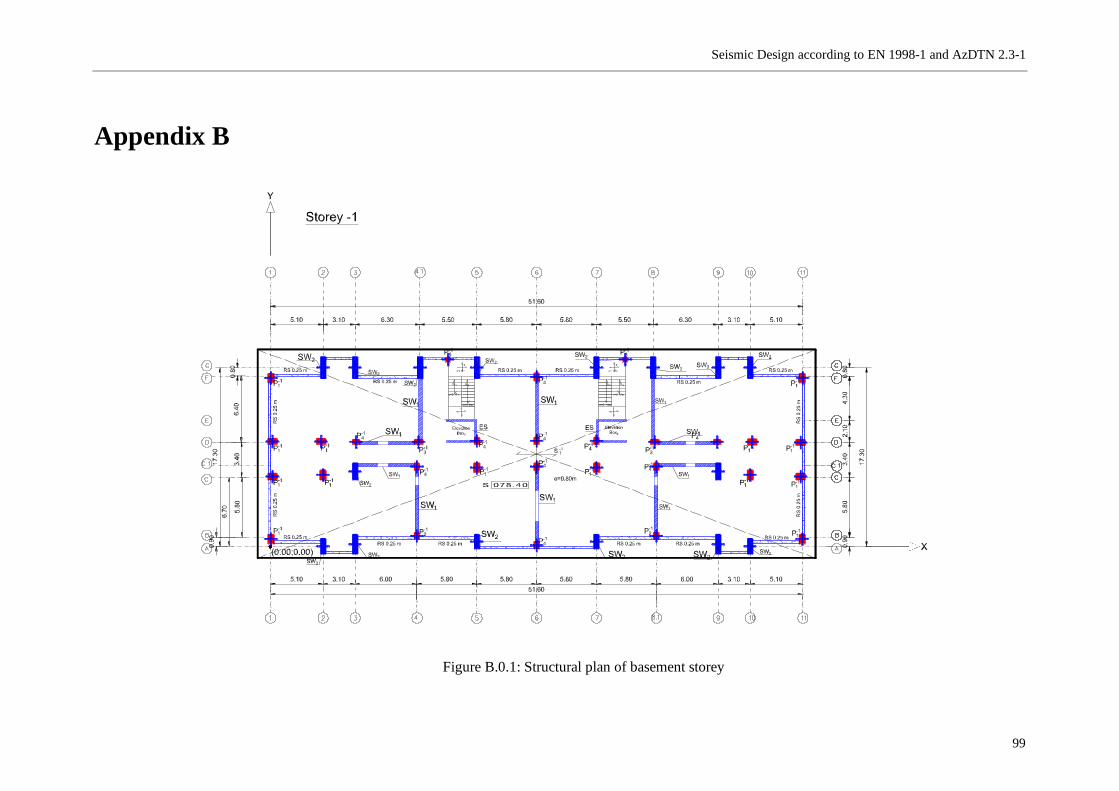
Seismic Design according to EN 1998-1 and AzDTN 2.3-1
99
Appendix B
Figure B.0.1: Structural plan of basement storey
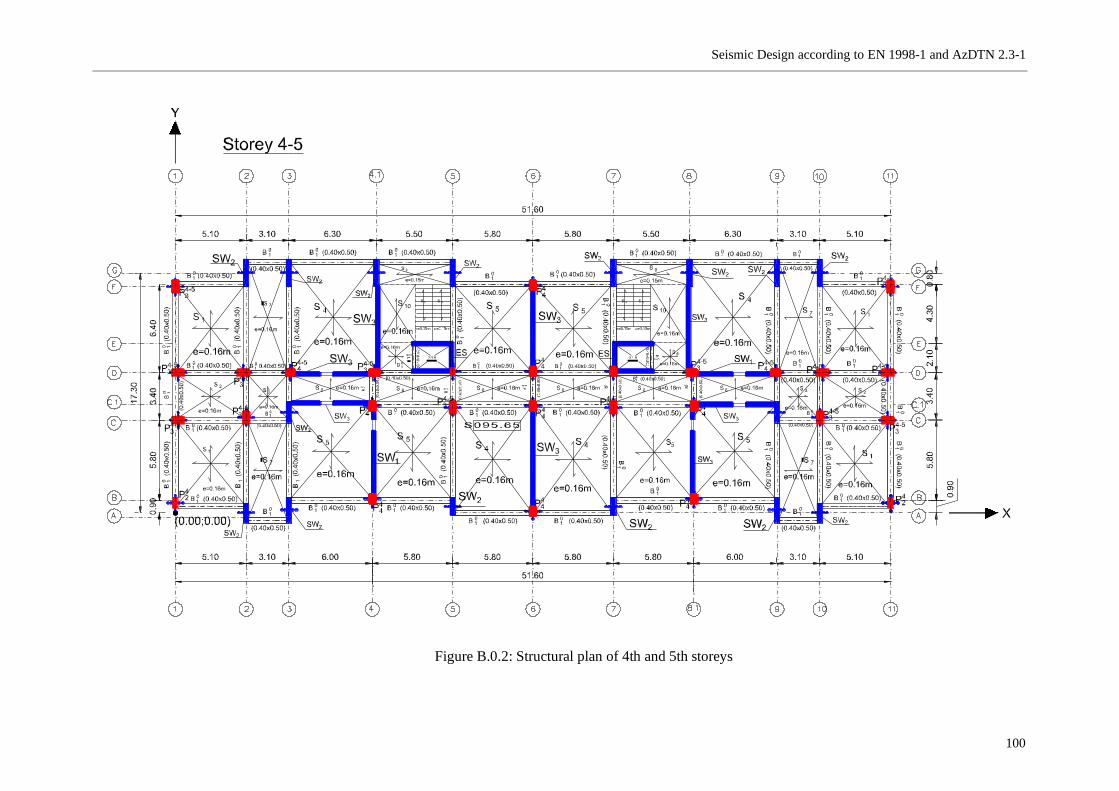
Seismic Design according to EN 1998-1 and AzDTN 2.3-1
100
Figure B.0.2: Structural plan of 4th and 5th storeys
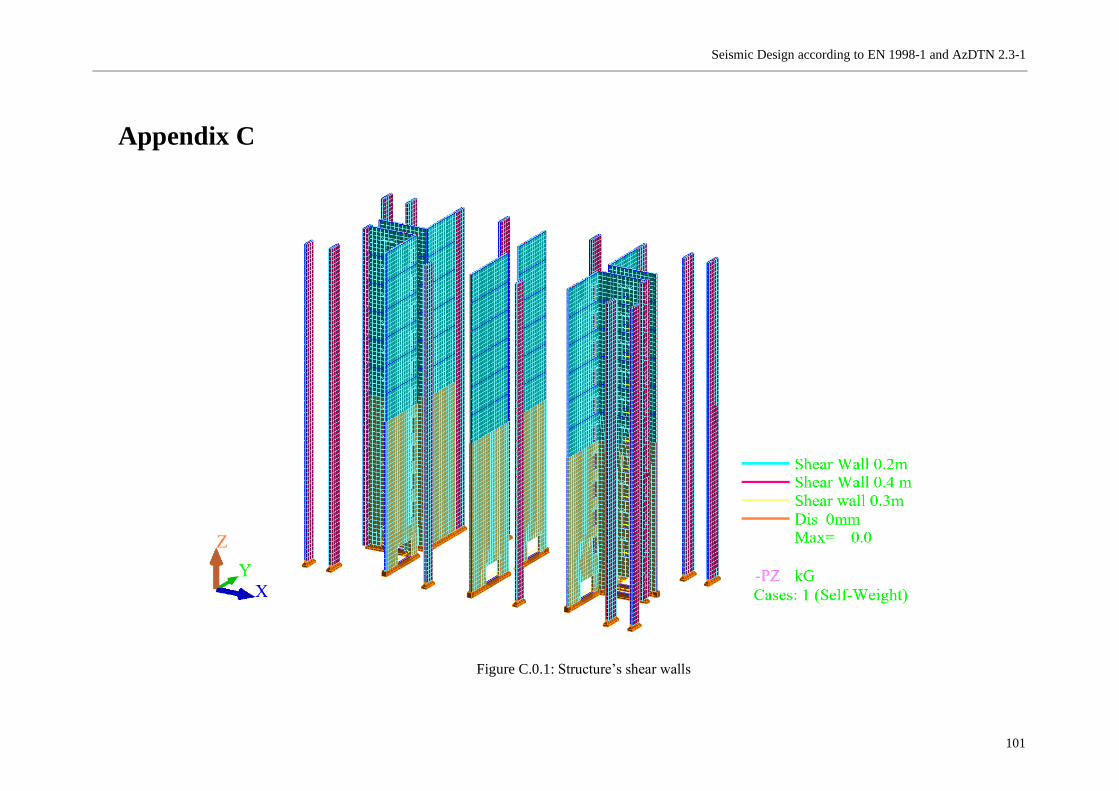
Seismic Design according to EN 1998-1 and AzDTN 2.3-1
101
Appendix C
Figure C.0.1: Structure’s shear walls
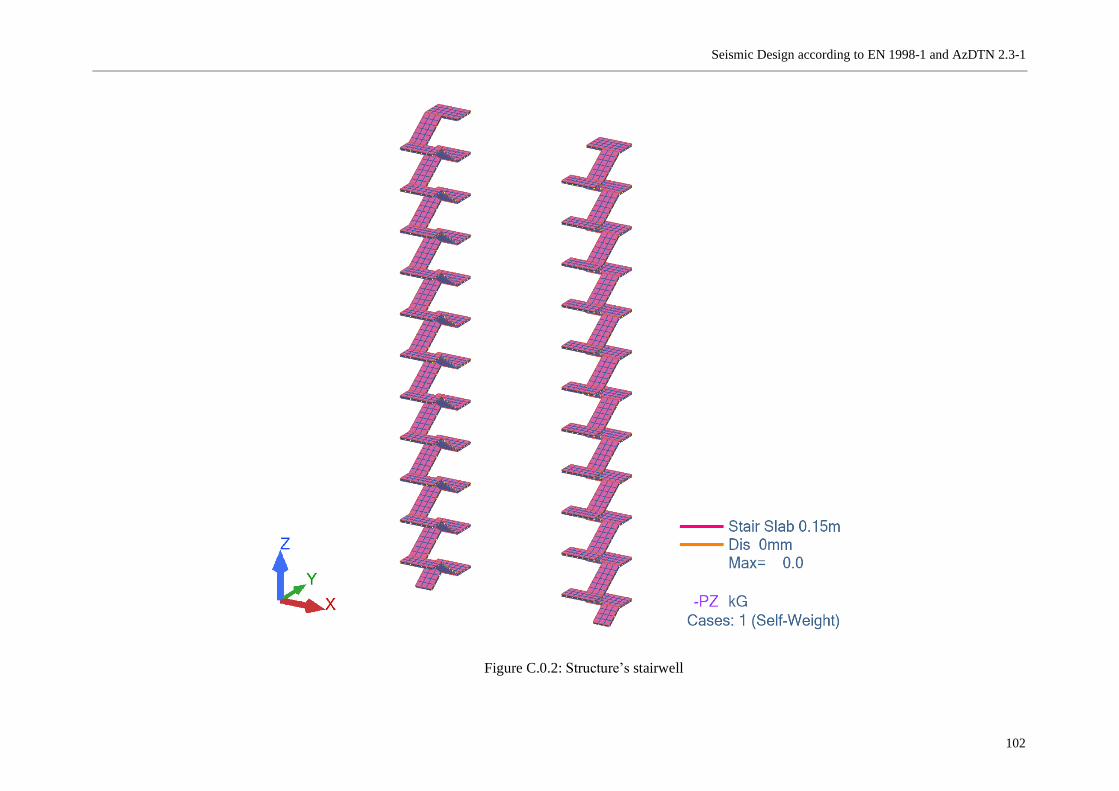
Seismic Design according to EN 1998-1 and AzDTN 2.3-1
102
Figure C.0.2: Structure’s stairwell
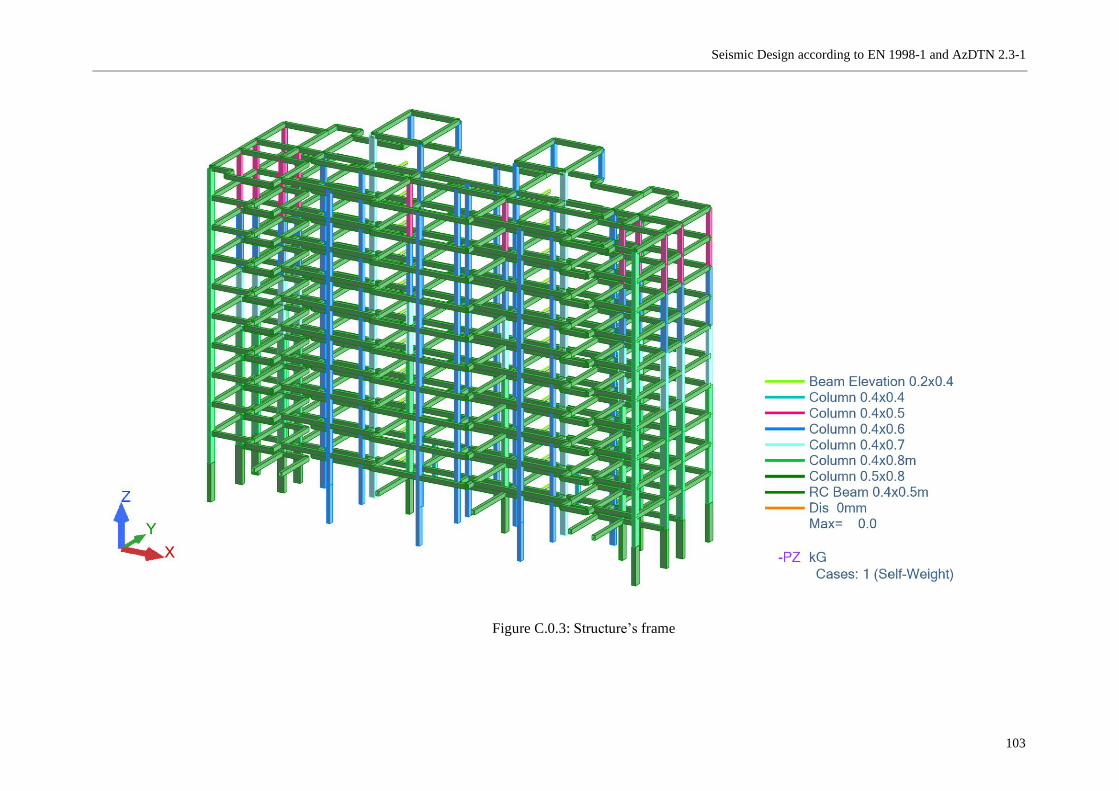
Seismic Design according to EN 1998-1 and AzDTN 2.3-1
103
Figure C.0.3: Structure’s frame
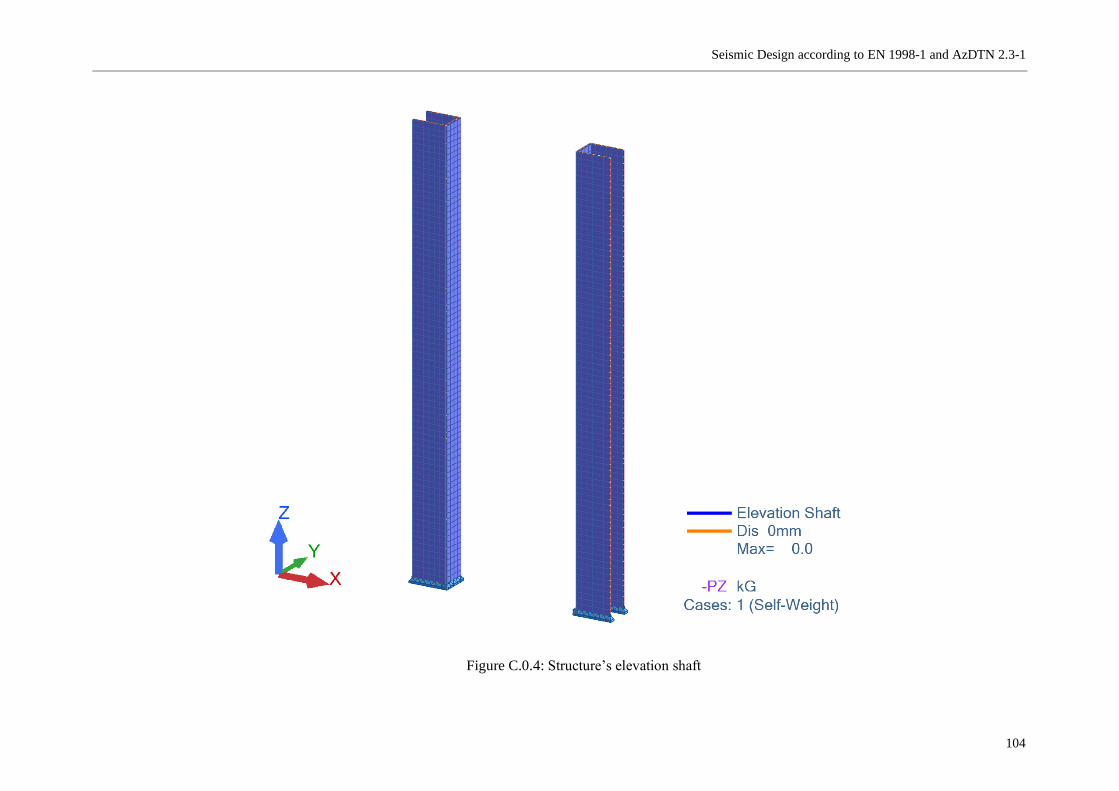
Seismic Design according to EN 1998-1 and AzDTN 2.3-1
104
Figure C.0.4: Structure’s elevation shaft
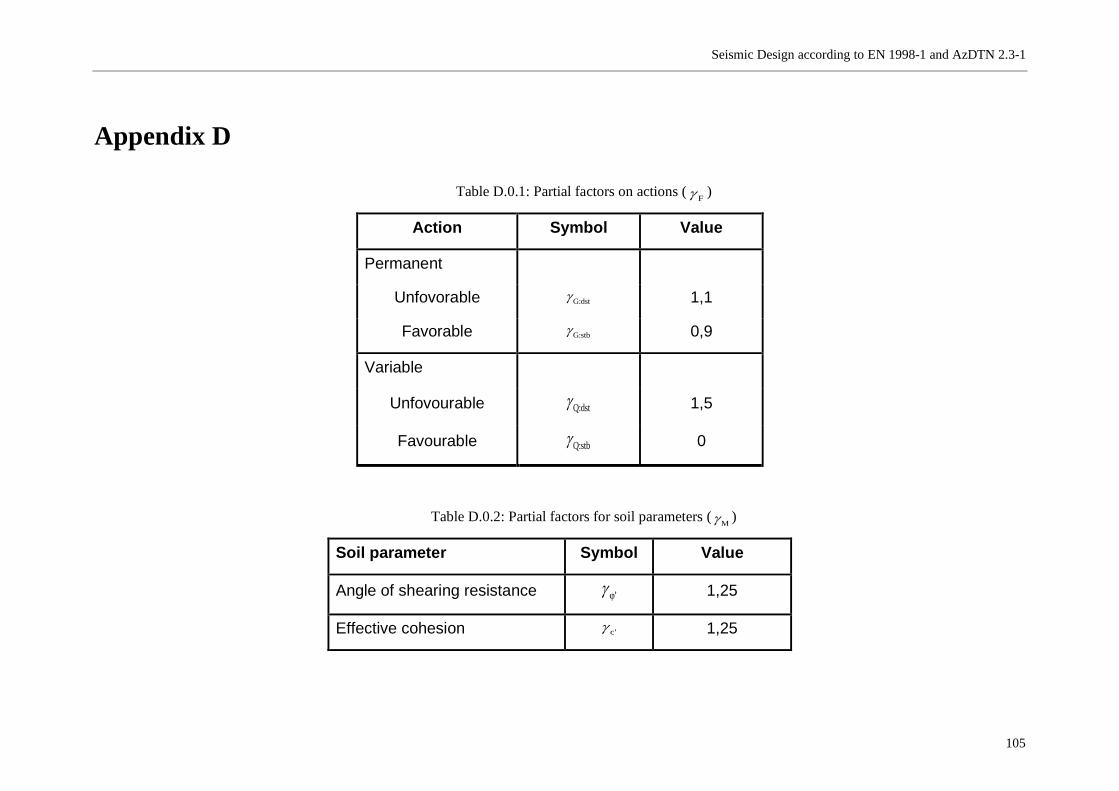
Seismic Design according to EN 1998-1 and AzDTN 2.3-1
105
Appendix D
Table D.0.1: Partial factors on actions (F )
Action Symbol Value
Permanent
Unfovorable G:dst 1,1
Favorable G:stb 0,9
Variable
Unfovourable Q:dst 1,5
Favourable Q:stb 0
Table D.0.2: Partial factors for soil parameters (M )
Soil parameter Symbol Value
Angle of shearing resistance φ' 1,25
Effective cohesion c' 1,25
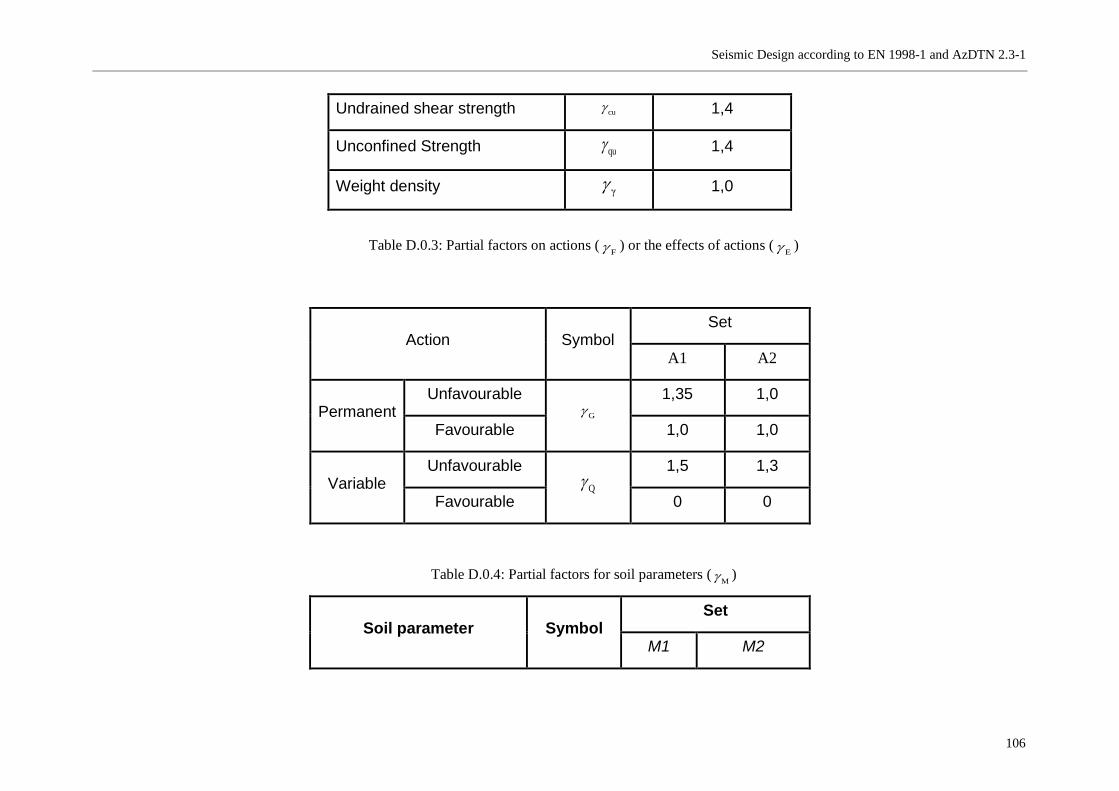
Seismic Design according to EN 1998-1 and AzDTN 2.3-1
106
Undrained shear strength cu 1,4
Unconfined Strength qu 1,4
Weight density γ 1,0
Table D.0.3: Partial factors on actions (F ) or the effects of actions (
E )
Action Symbol Set
A1 A2
Permanent Unfavourable
G 1,35 1,0
Favourable 1,0 1,0
Variable Unfavourable
Q 1,5 1,3
Favourable 0 0
Table D.0.4: Partial factors for soil parameters (M )
Soil parameter Symbol Set
M1 M2
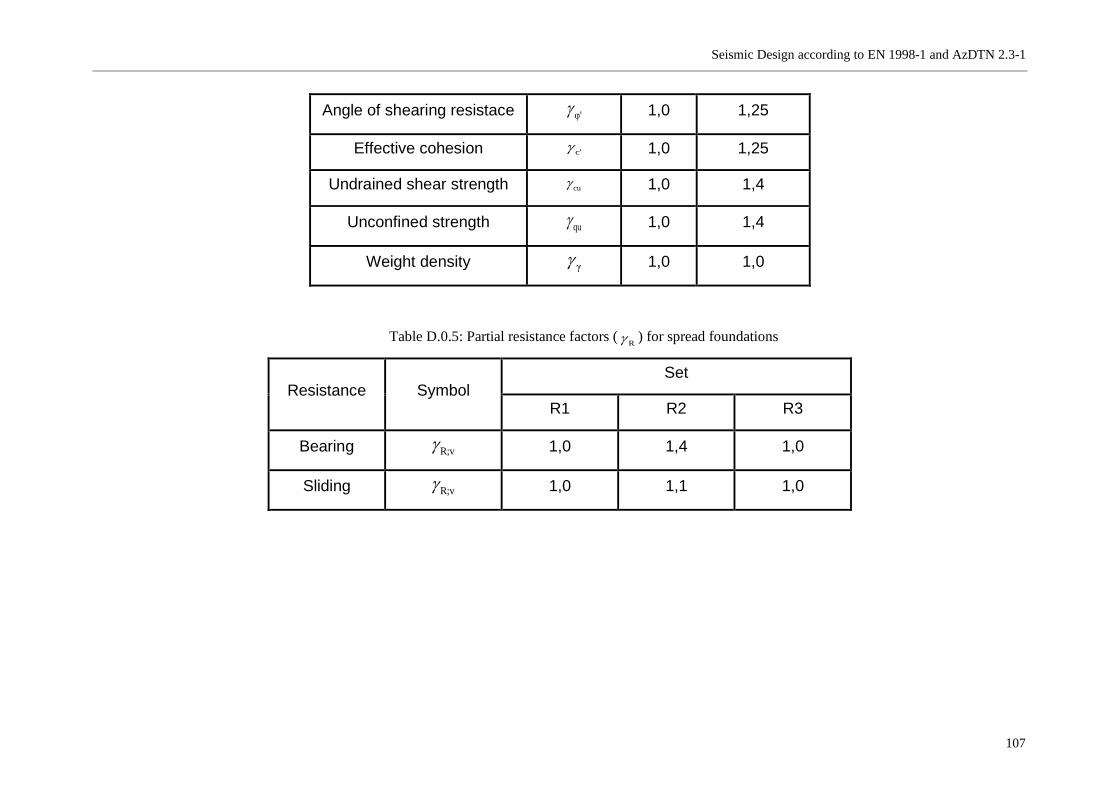
Seismic Design according to EN 1998-1 and AzDTN 2.3-1
107
Angle of shearing resistace φ' 1,0 1,25
Effective cohesion c' 1,0 1,25
Undrained shear strength cu 1,0 1,4
Unconfined strength qu 1,0 1,4
Weight density γ 1,0 1,0
Table D.0.5: Partial resistance factors (R ) for spread foundations
Resistance Symbol Set
R1 R2 R3
Bearing R;v 1,0 1,4 1,0
Sliding R;v 1,0 1,1 1,0
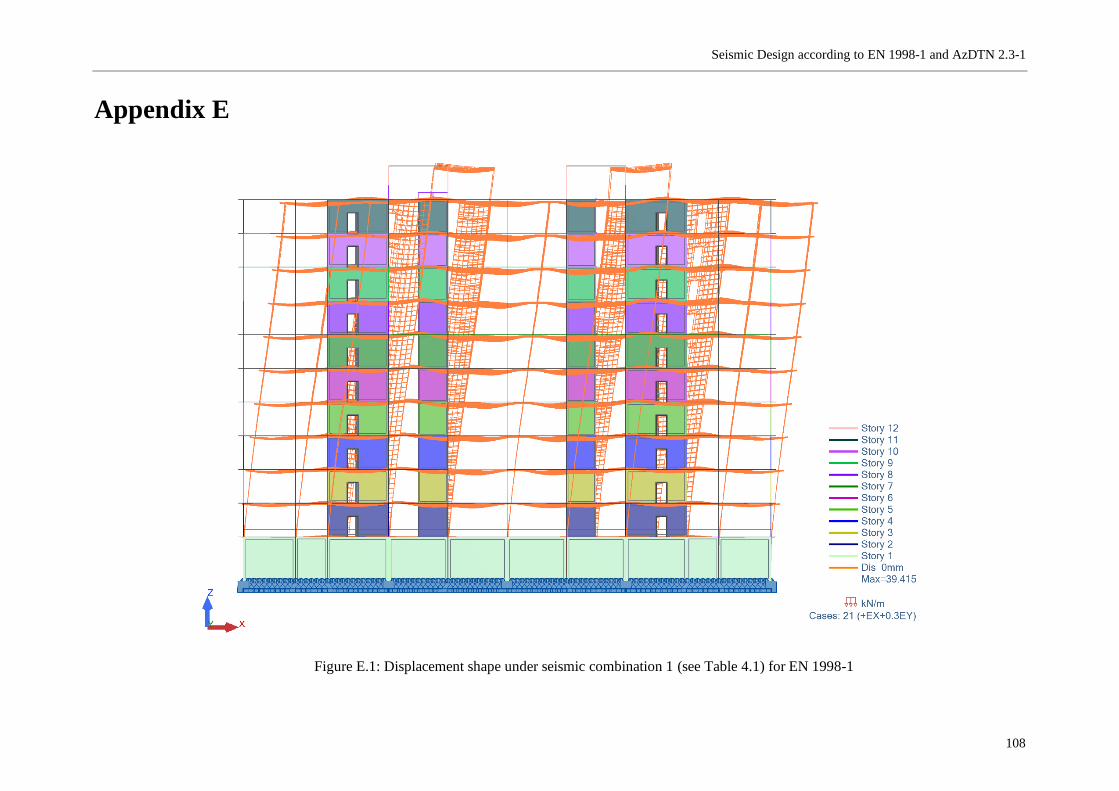
Seismic Design according to EN 1998-1 and AzDTN 2.3-1
108
Appendix E
Figure E.1: Displacement shape under seismic combination 1 (see Table 4.1) for EN 1998-1
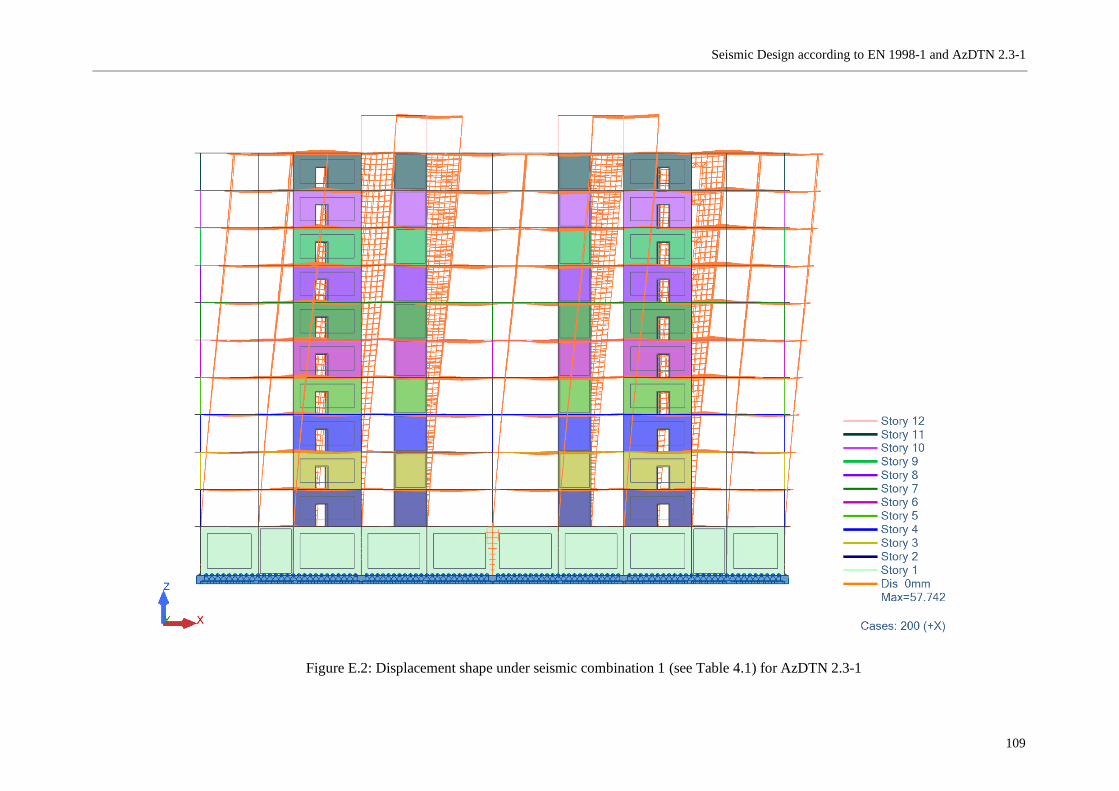
Seismic Design according to EN 1998-1 and AzDTN 2.3-1
109
Figure E.2: Displacement shape under seismic combination 1 (see Table 4.1) for AzDTN 2.3-1
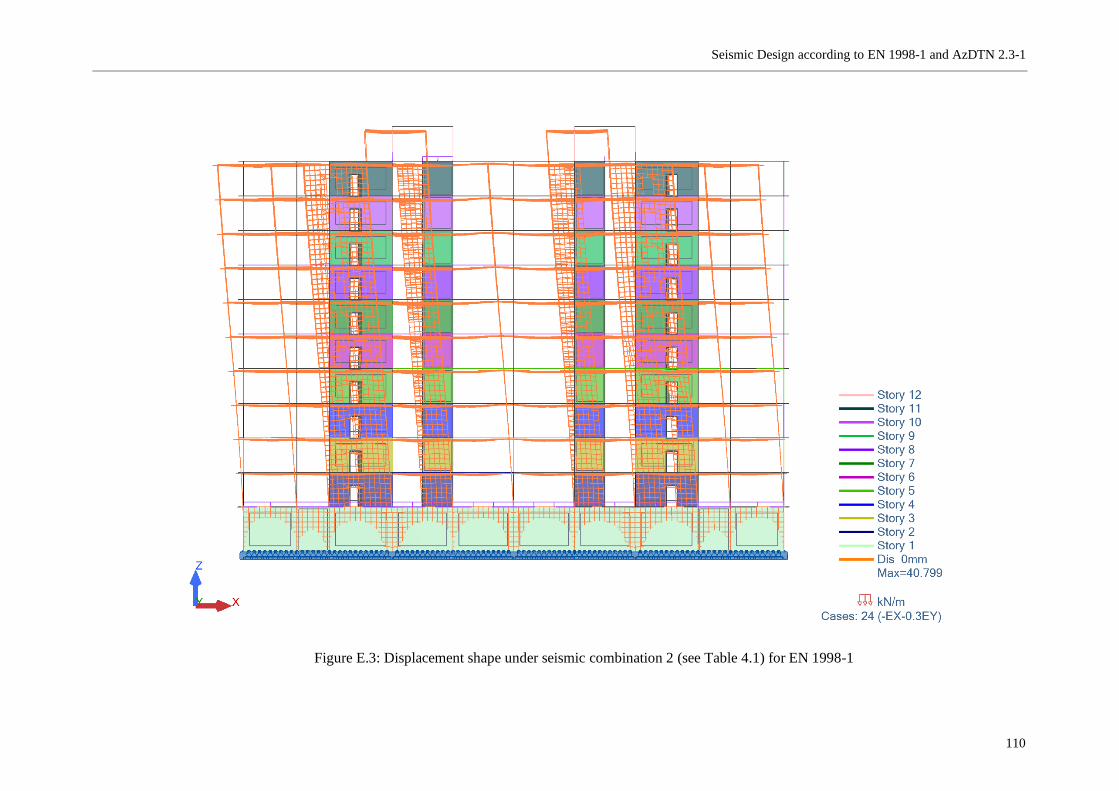
Seismic Design according to EN 1998-1 and AzDTN 2.3-1
110
Figure E.3: Displacement shape under seismic combination 2 (see Table 4.1) for EN 1998-1
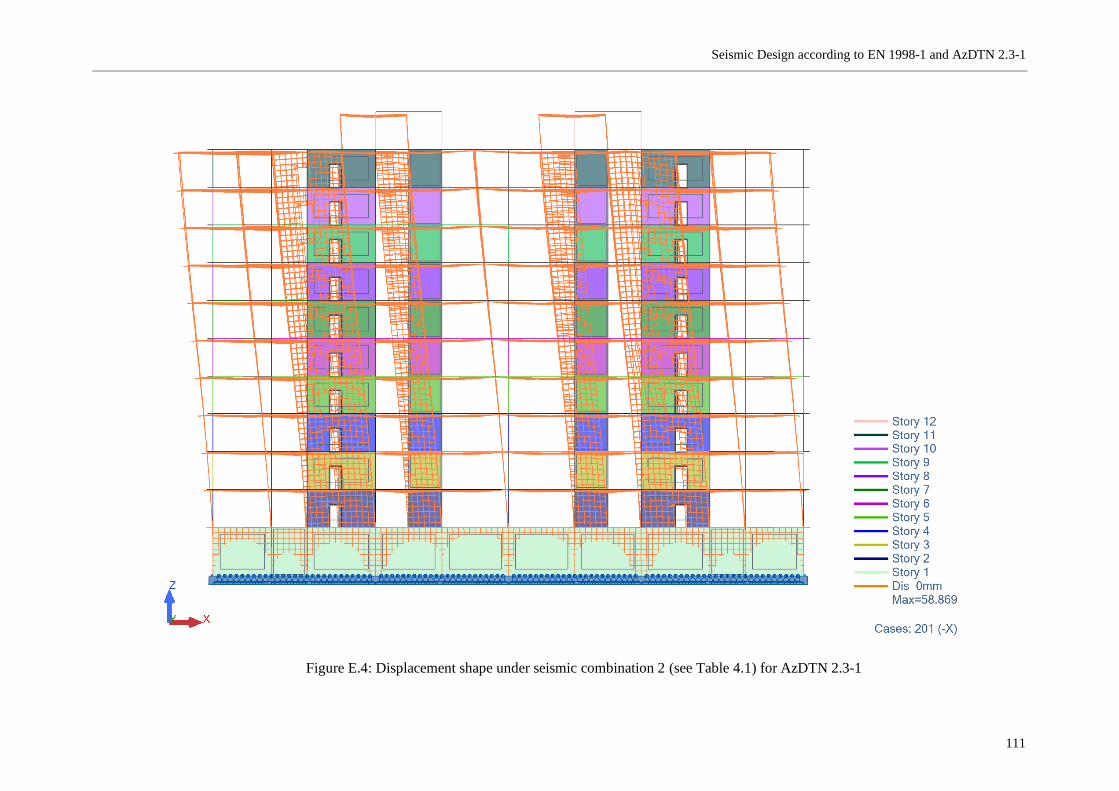
Seismic Design according to EN 1998-1 and AzDTN 2.3-1
111
Figure E.4: Displacement shape under seismic combination 2 (see Table 4.1) for AzDTN 2.3-1
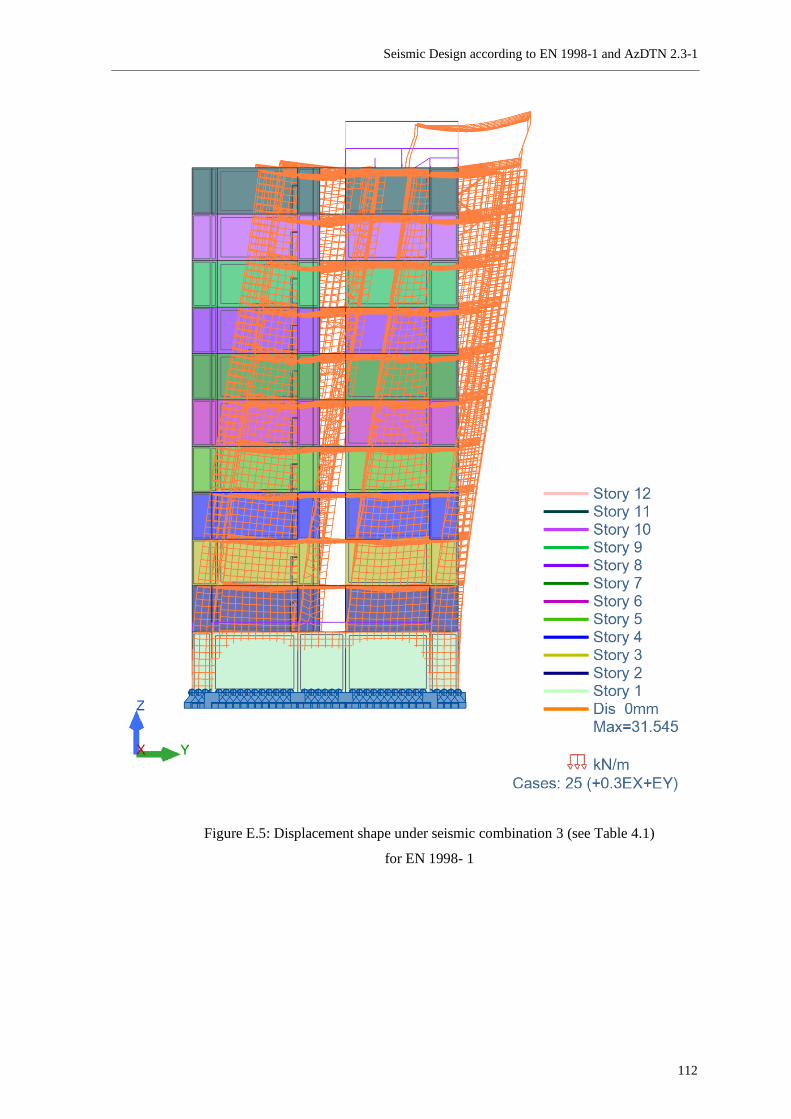
Seismic Design according to EN 1998-1 and AzDTN 2.3-1
112
Figure E.5: Displacement shape under seismic combination 3 (see Table 4.1)
for EN 1998- 1
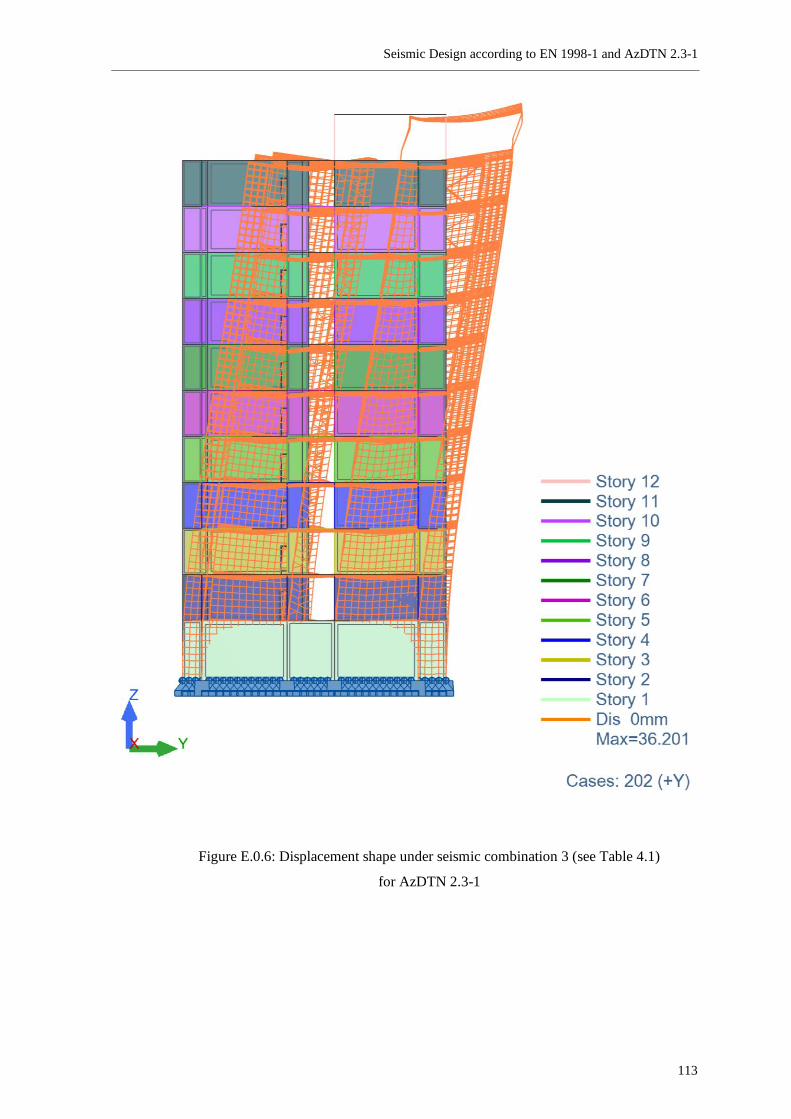
Seismic Design according to EN 1998-1 and AzDTN 2.3-1
113
Figure E.0.6: Displacement shape under seismic combination 3 (see Table 4.1)
for AzDTN 2.3-1
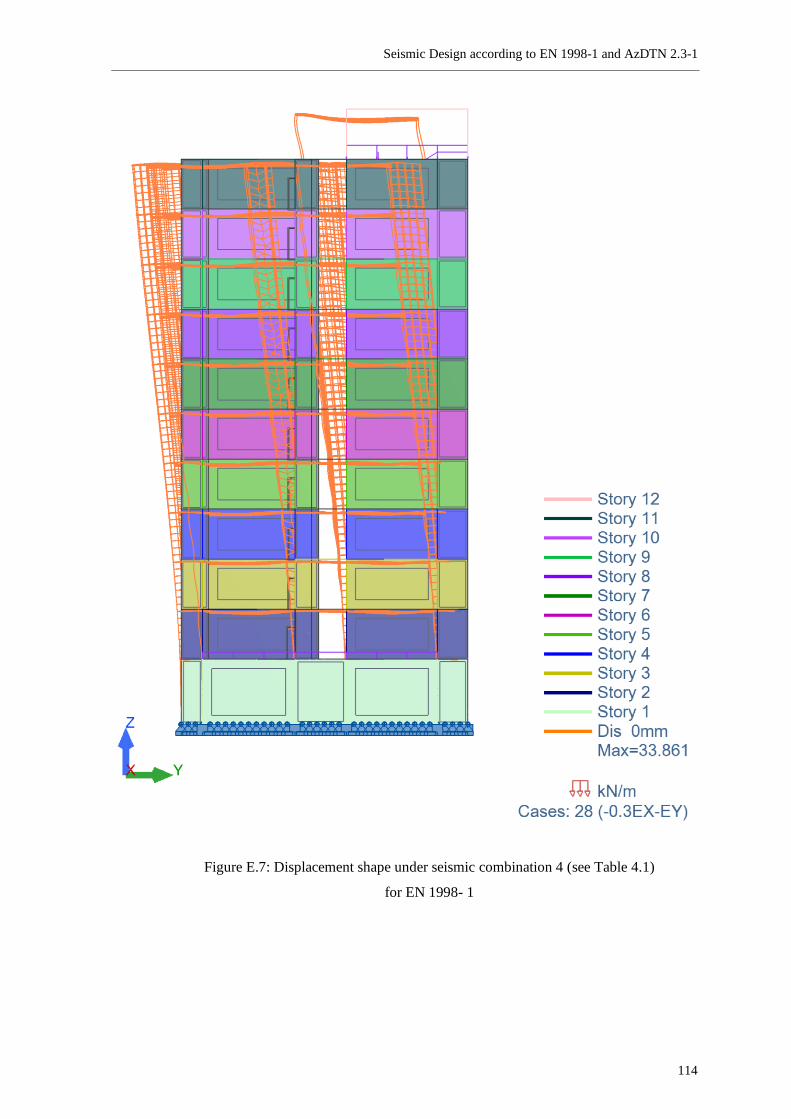
Seismic Design according to EN 1998-1 and AzDTN 2.3-1
114
Figure E.7: Displacement shape under seismic combination 4 (see Table 4.1)
for EN 1998- 1
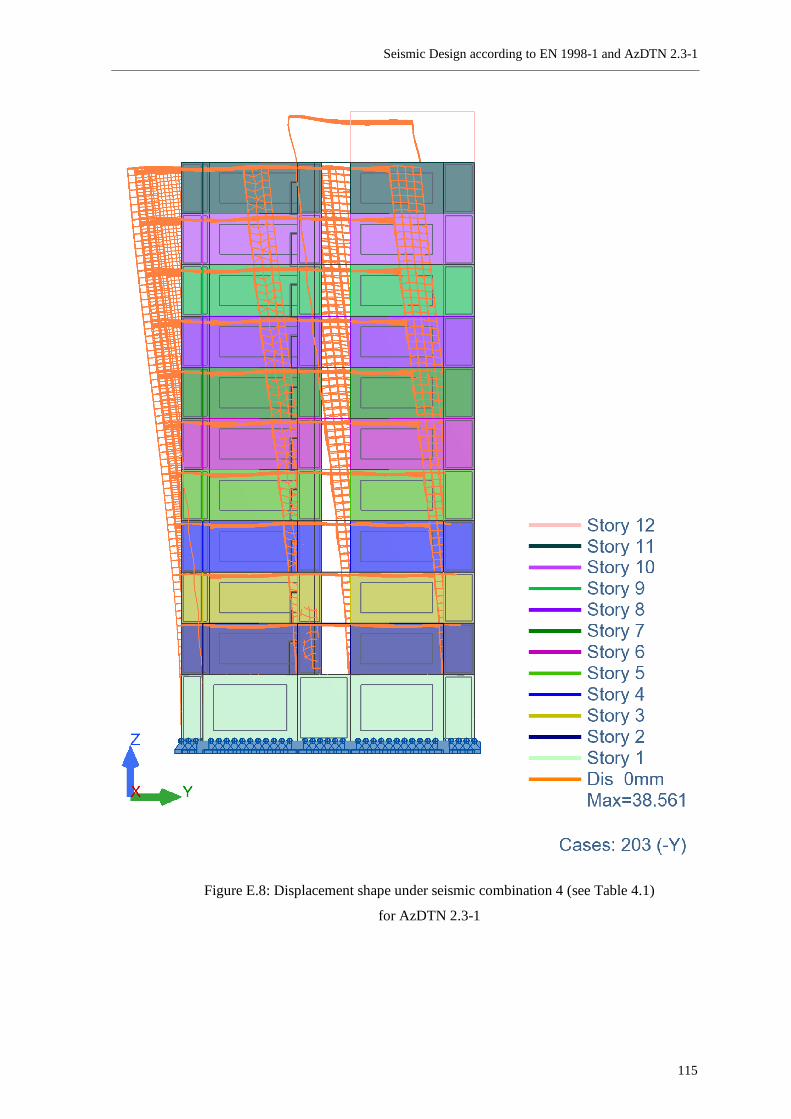
Seismic Design according to EN 1998-1 and AzDTN 2.3-1
115
Figure E.8: Displacement shape under seismic combination 4 (see Table 4.1)
for AzDTN 2.3-1
Related Documents