SEGRO PLC Presentation to Bondholders 12 April 2011

Welcome message from author
This document is posted to help you gain knowledge. Please leave a comment to let me know what you think about it! Share it to your friends and learn new things together.
Transcript

SEGRO PLC
Presentation to Bondholders
12 April 2011
1
Contents
1. Business Overview and Strategy
2. 2010 Results and 2011 outlook
3. Funding and Treasury overview
4. Summary and Q&A
Appendices

1. Business Overview and Strategy
Ian Coull - CEO
3
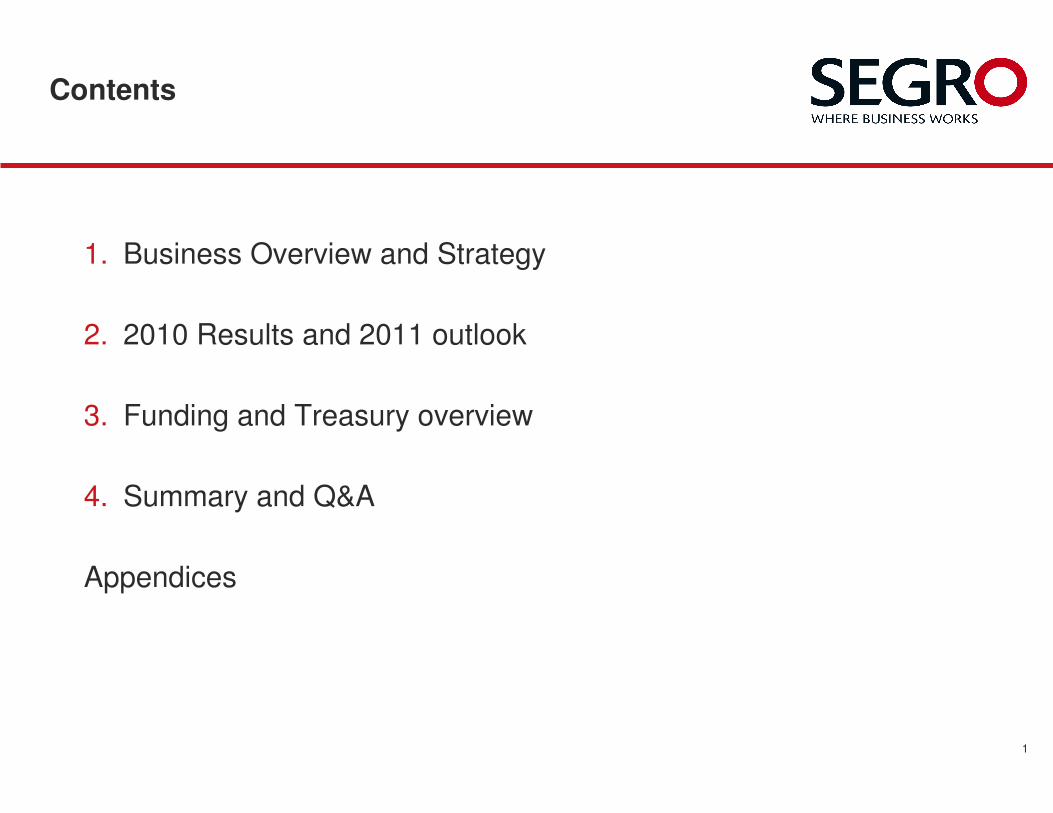
SEGROEurope’s leading industrial REIT
SEGRO provides a range of flexible business space concentrated in and around major business centres and transportation hubs such as ports, airports and motorway intersections
4
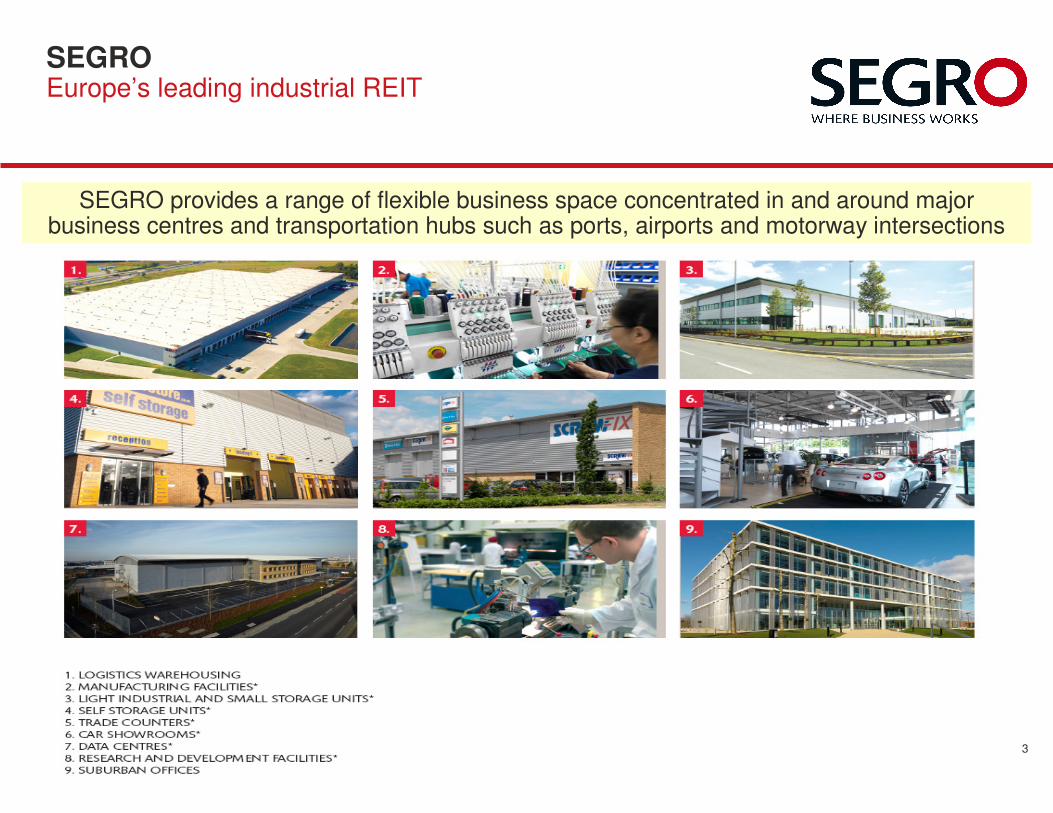
Straightforward business modelBuy Smart, Add Value, Sell Well
BUY SMARTCAREFUL AND
WELL TIMED ASSET
SELECTION
ADD VALUEDEVELOPEMNT
AND/OR ASSET MANAGEMENT
SELL WELLCO-ORDINATE
INDIVIDUAL ASSET
STRATEGIES WITHMARKET CYCLE
Efficient Financial
Structure
5
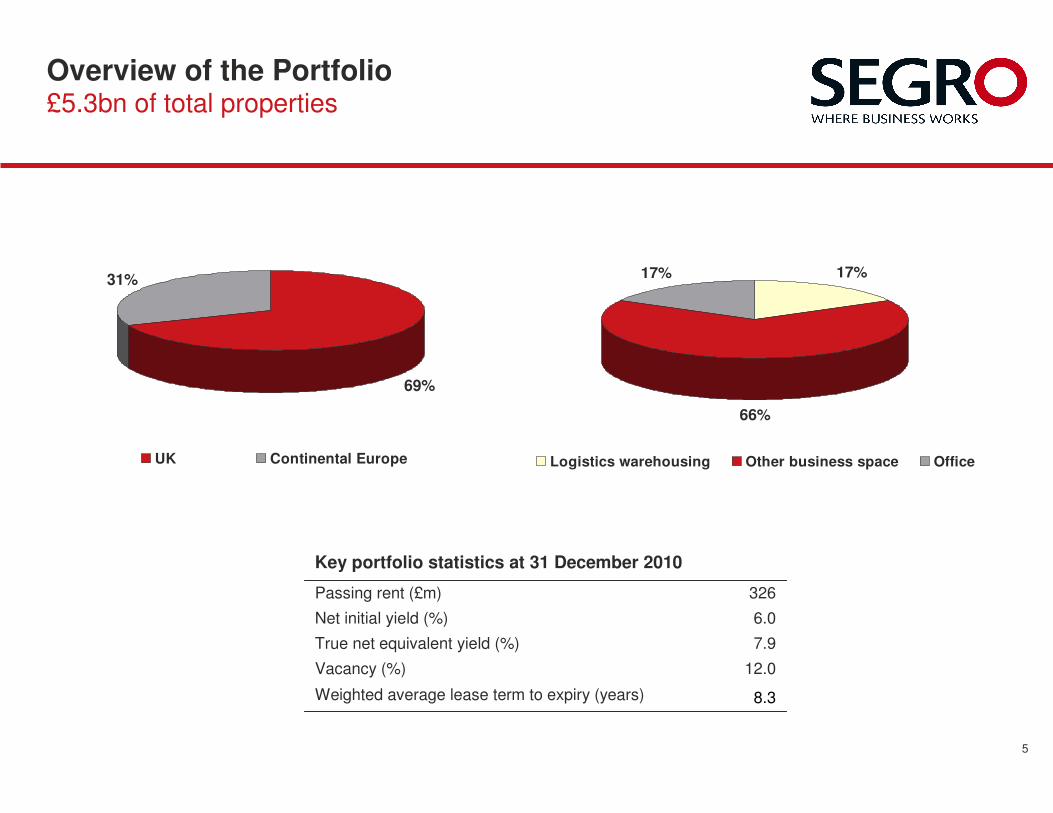
Overview of the Portfolio£5.3bn of total properties
69%
31%
UK Continental Europe
8.3Weighted average lease term to expiry (years)
Key portfolio statistics at 31 December 2010
326
6.0
7.9
12.0
Passing rent (£m)
Net initial yield (%)
True net equivalent yield (%)
Vacancy (%)
17%
66%
17%
Logistics warehousing Other business space Office
6
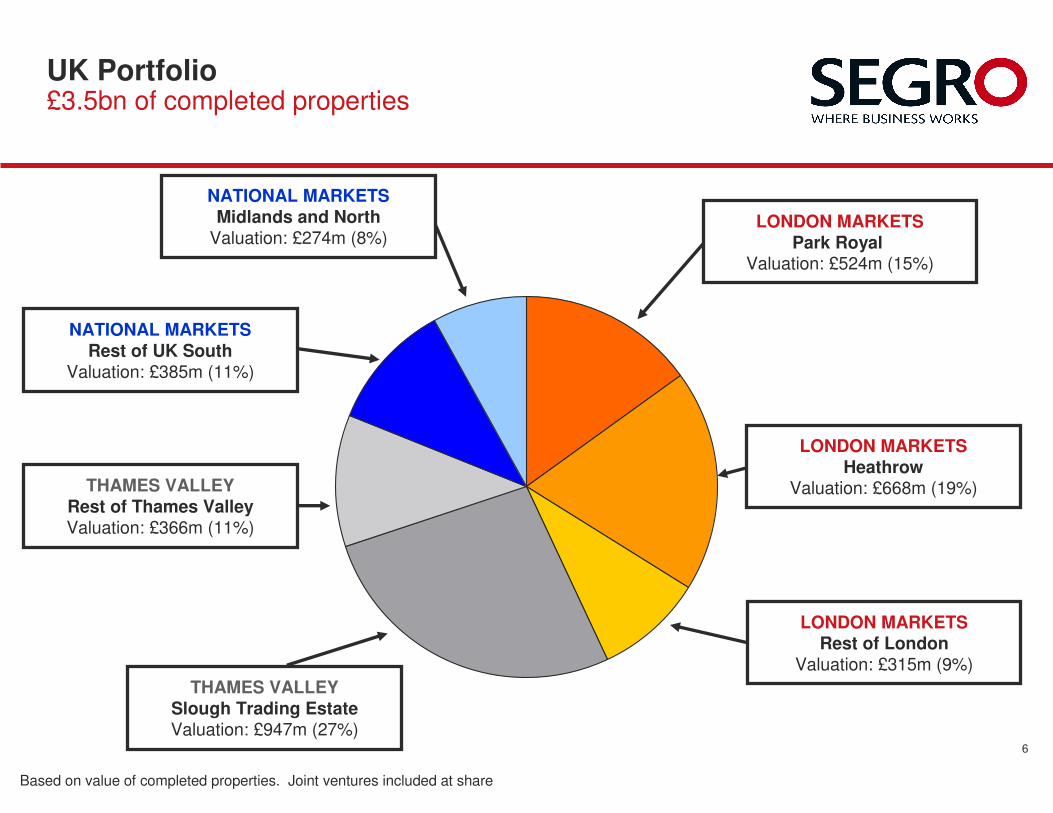
UK Portfolio£3.5bn of completed properties
LONDON MARKETSPark Royal
Valuation: £524m (15%)
LONDON MARKETSHeathrow
Valuation: £668m (19%)
LONDON MARKETSRest of London
Valuation: £315m (9%)
THAMES VALLEYSlough Trading EstateValuation: £947m (27%)
THAMES VALLEYRest of Thames ValleyValuation: £366m (11%)
NATIONAL MARKETSRest of UK South
Valuation: £385m (11%)
NATIONAL MARKETSMidlands and North
Valuation: £274m (8%)
Based on value of completed properties. Joint ventures included at share
7
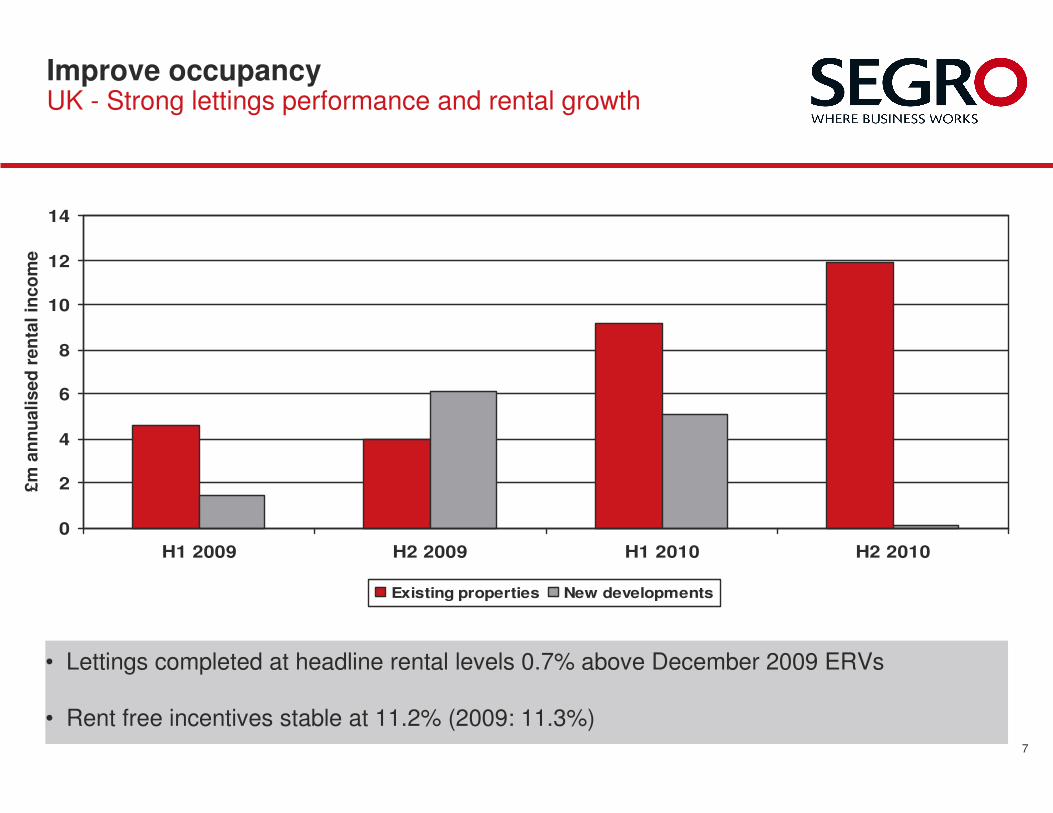
Improve occupancyUK - Strong lettings performance and rental growth
0
2
4
6
8
10
12
14
H1 2009 H2 2009 H1 2010 H2 2010
Existing properties New developments
£m
an
nu
ali
sed
ren
tal
inco
me
• Lettings completed at headline rental levels 0.7% above December 2009 ERVs
• Rent free incentives stable at 11.2% (2009: 11.3%)
8
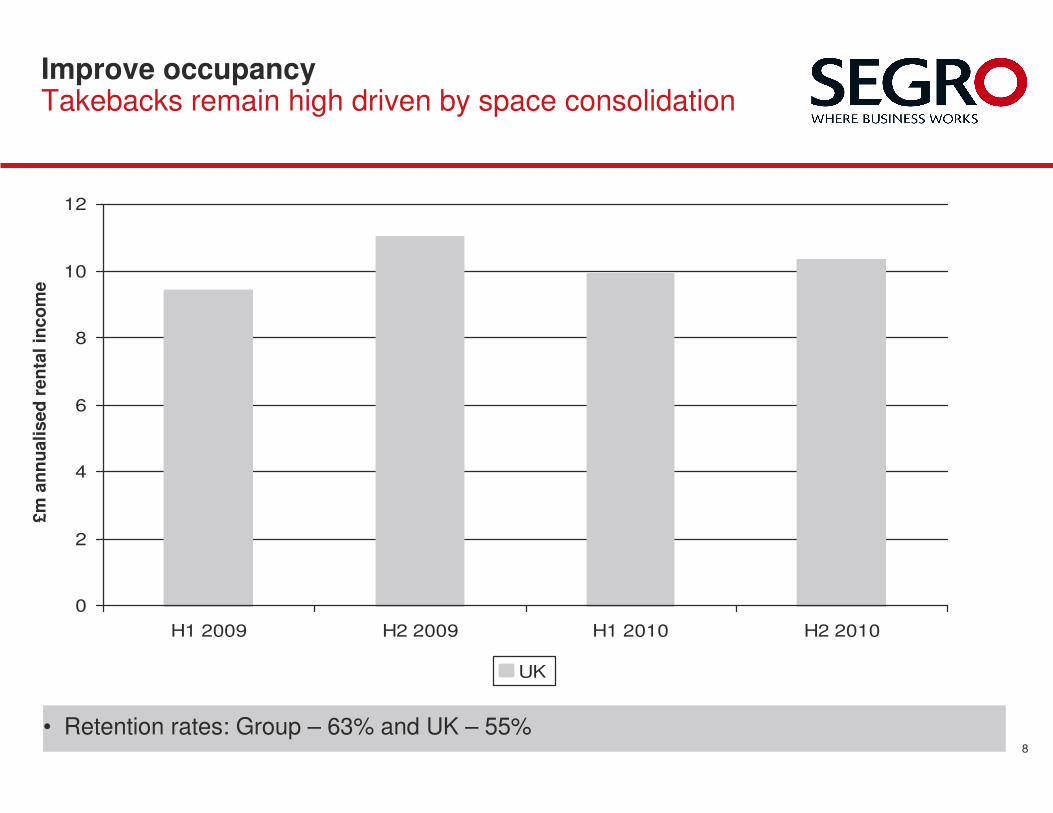
Improve occupancyTakebacks remain high driven by space consolidation
0
2
4
6
8
10
12
H1 2009 H2 2009 H1 2010 H2 2010
UK
£m
an
nu
ali
sed
ren
tal
inco
me
• Retention rates: Group – 63% and UK – 55%
9
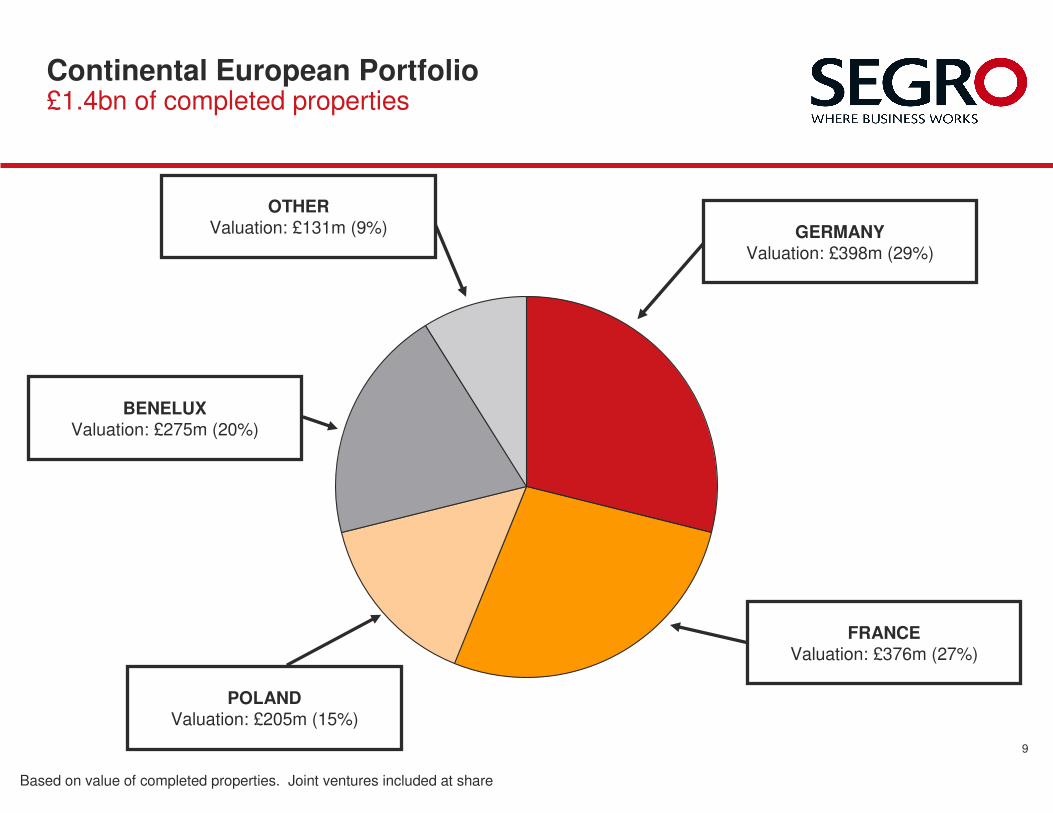
Continental European Portfolio£1.4bn of completed properties
GERMANYValuation: £398m (29%)
FRANCEValuation: £376m (27%)
POLANDValuation: £205m (15%)
BENELUXValuation: £275m (20%)
OTHERValuation: £131m (9%)
Based on value of completed properties. Joint ventures included at share
10
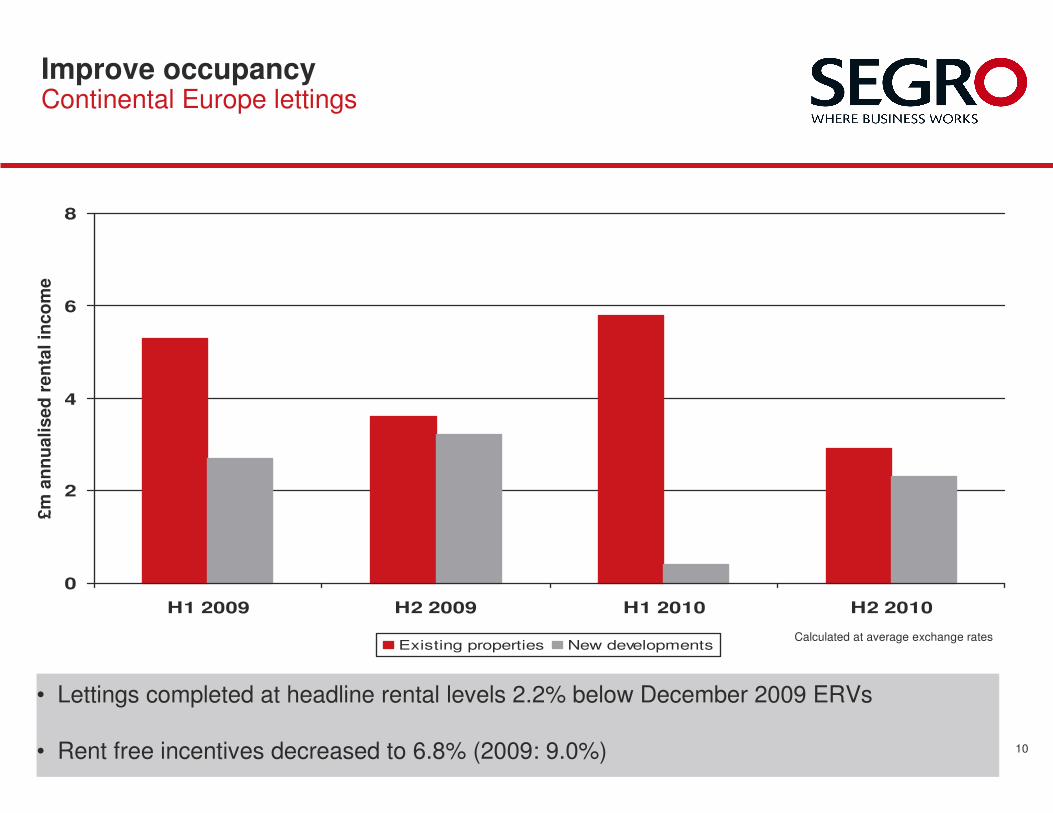
Improve occupancyContinental Europe lettings
0
2
4
6
8
H1 2009 H2 2009 H1 2010 H2 2010
Existing properties New developments
£m
an
nu
ali
sed
ren
tal
inco
me
• Lettings completed at headline rental levels 2.2% below December 2009 ERVs
• Rent free incentives decreased to 6.8% (2009: 9.0%)
Calculated at average exchange rates
11
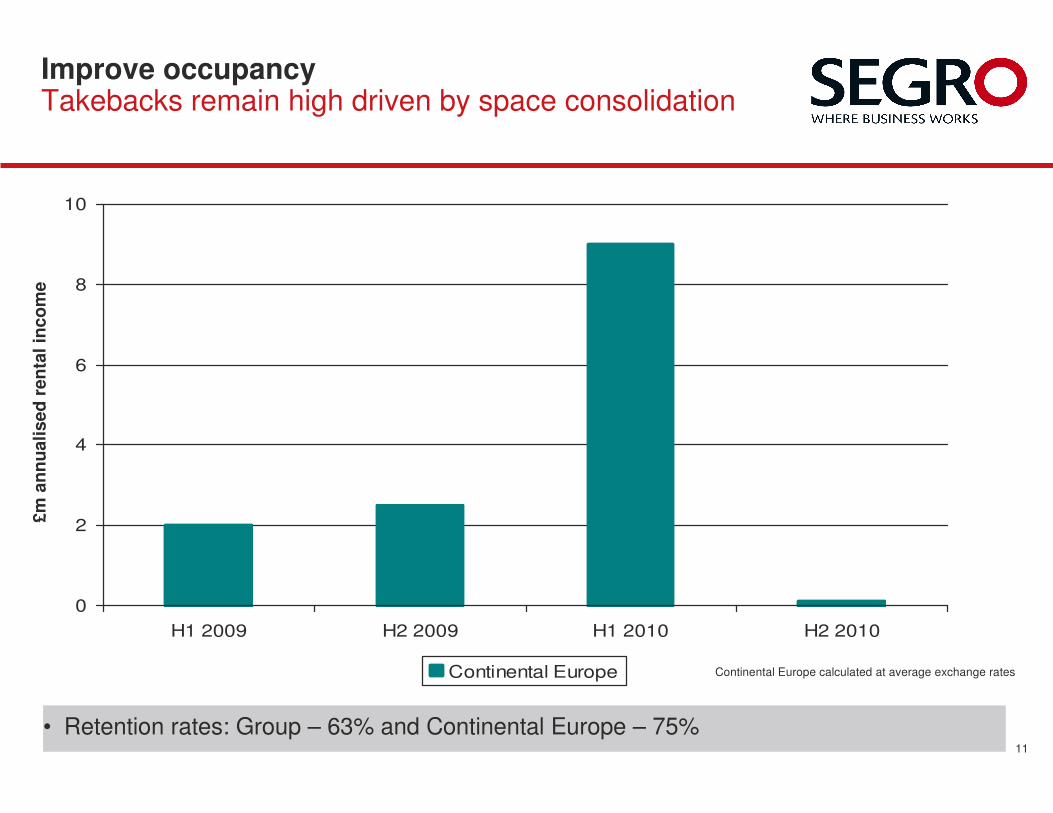
Improve occupancyTakebacks remain high driven by space consolidation
0
2
4
6
8
10
H1 2009 H2 2009 H1 2010 H2 2010
Continental Europe
£m
an
nu
ali
sed
ren
tal
inco
me
• Retention rates: Group – 63% and Continental Europe – 75%
Continental Europe calculated at average exchange rates

2010 results and 2011 outlook
David Sleath – Group Finance Director
13
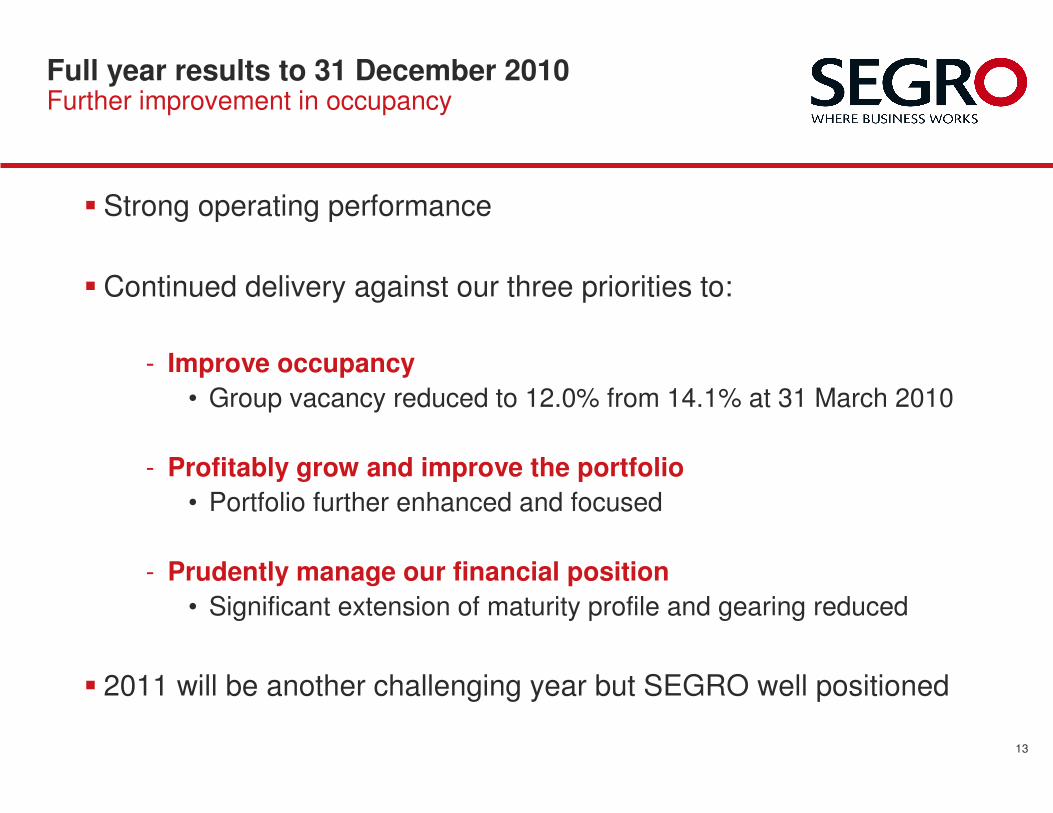
Full year results to 31 December 2010Further improvement in occupancy
� Strong operating performance
� Continued delivery against our three priorities to:
- Improve occupancy
• Group vacancy reduced to 12.0% from 14.1% at 31 March 2010
- Profitably grow and improve the portfolio
• Portfolio further enhanced and focused
- Prudently manage our financial position
• Significant extension of maturity profile and gearing reduced
� 2011 will be another challenging year but SEGRO well positioned
14
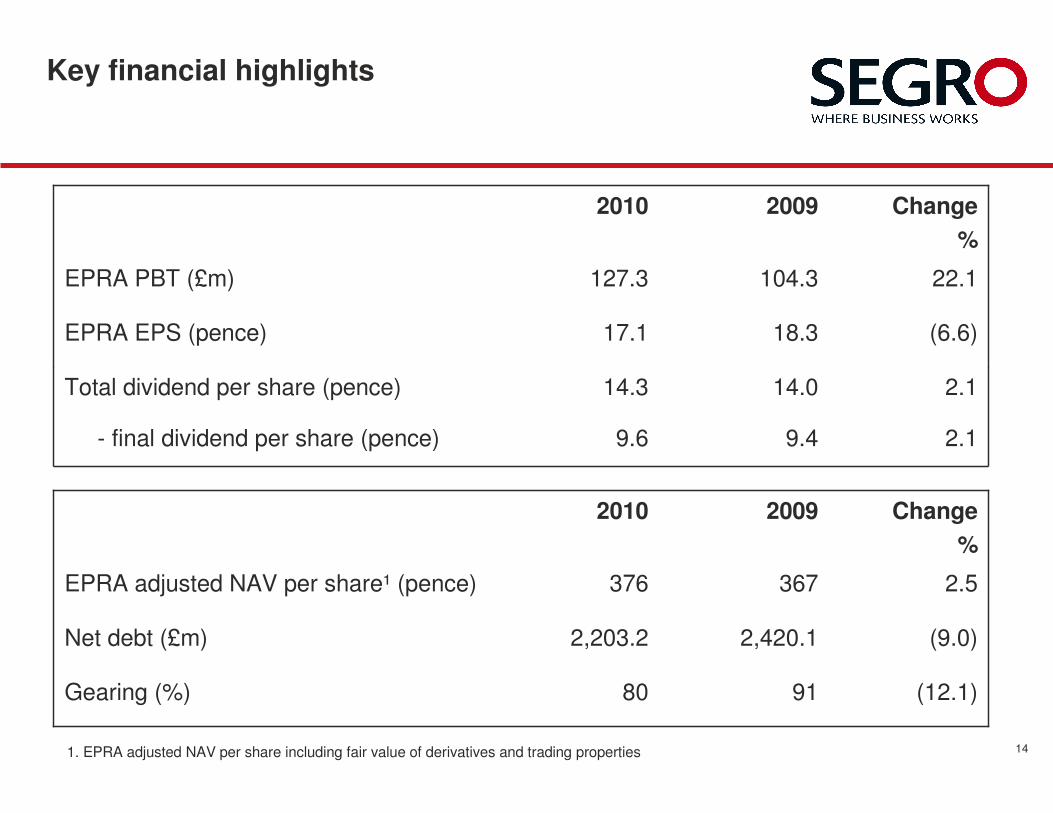
Key financial highlights
2.114.014.3Total dividend per share (pence)
Change
%
20092010
(12.1)9180Gearing (%)
(9.0)2,420.12,203.2Net debt (£m)
2.5367376EPRA adjusted NAV per share¹ (pence)
2.19.49.6- final dividend per share (pence)
(6.6)18.317.1EPRA EPS (pence)
22.1104.3127.3EPRA PBT (£m)
Change
%
20092010
1. EPRA adjusted NAV per share including fair value of derivatives and trading properties
15
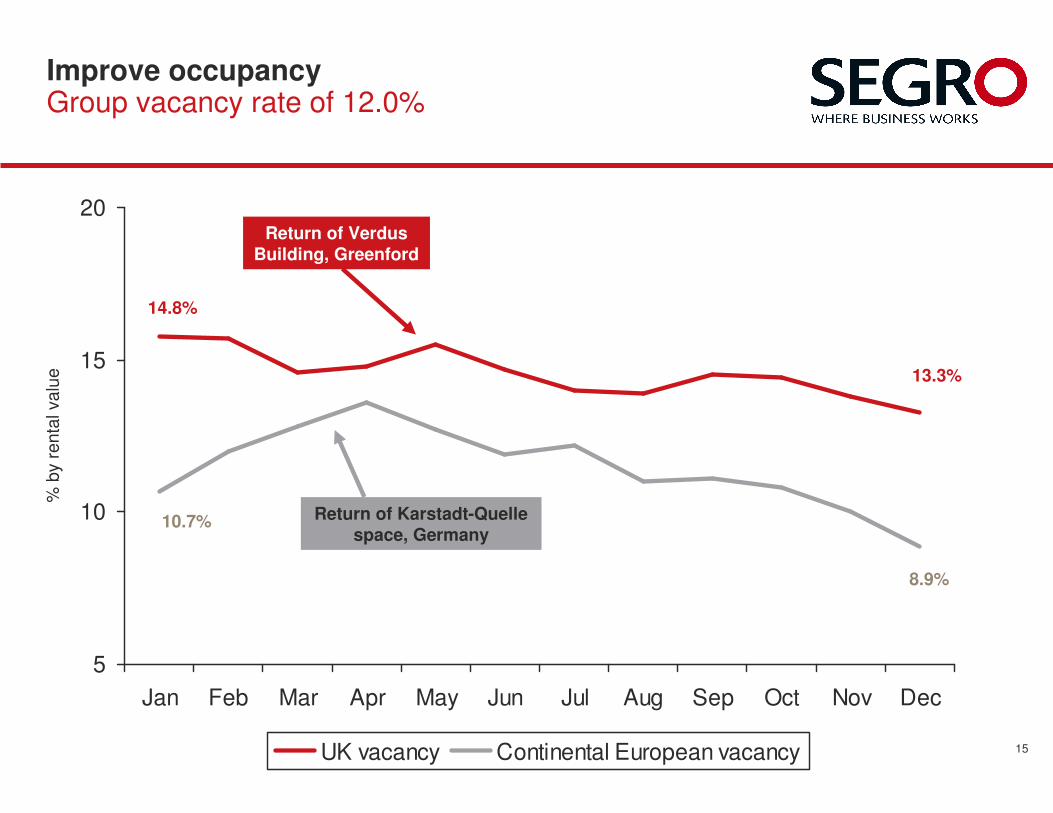
Improve occupancyGroup vacancy rate of 12.0%
5
10
15
20
Jan Feb Mar Apr May Jun Jul Aug Sep Oct Nov Dec
UK vacancy Continental European vacancy
% b
y r
enta
l valu
e
14.8%
13.3%
Return of Verdus Building, Greenford
10.7%
8.9%
Return of Karstadt-Quelle space, Germany
16
Vacancy rate as
at 31 December
2009
Space returned Development
completions
Short term
lettings/vacations
Other (ERV
changes)
Space let Space made
redundant
Disposals Acquisitions Vacancy rate as
at 31 December
2010
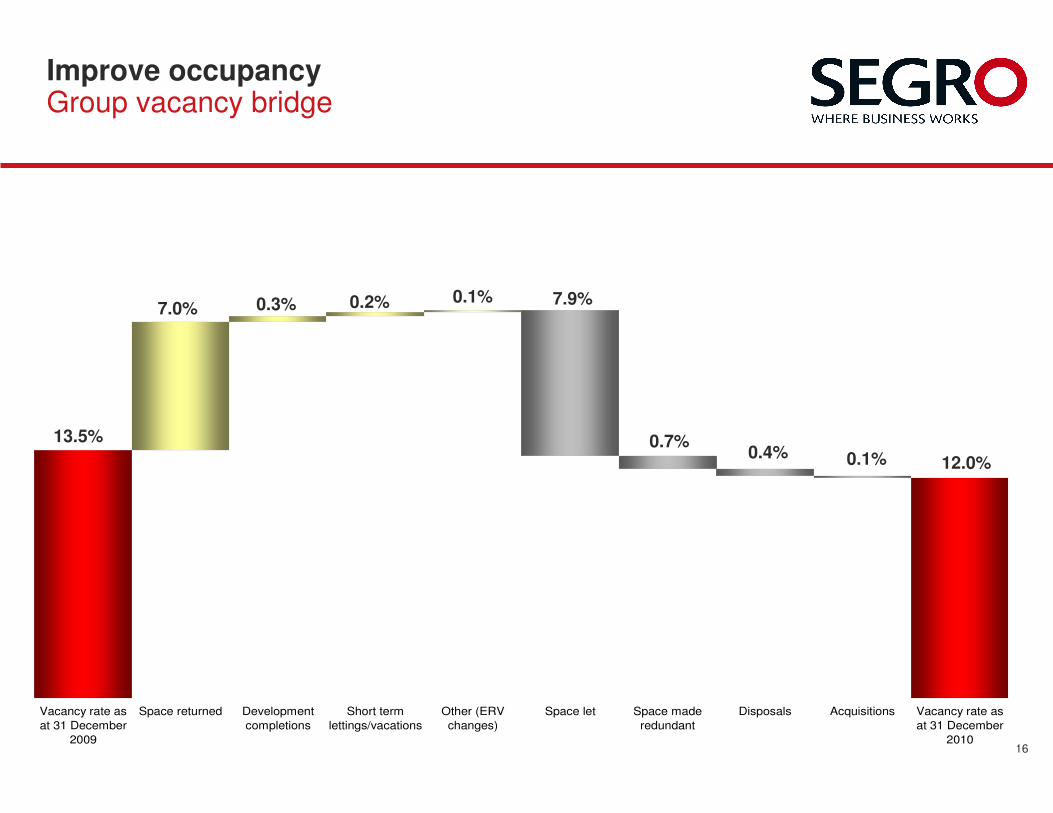
Improve occupancyGroup vacancy bridge
13.5%
7.0% 0.2%0.3% 0.1% 7.9%
0.7%0.4% 0.1% 12.0%
17
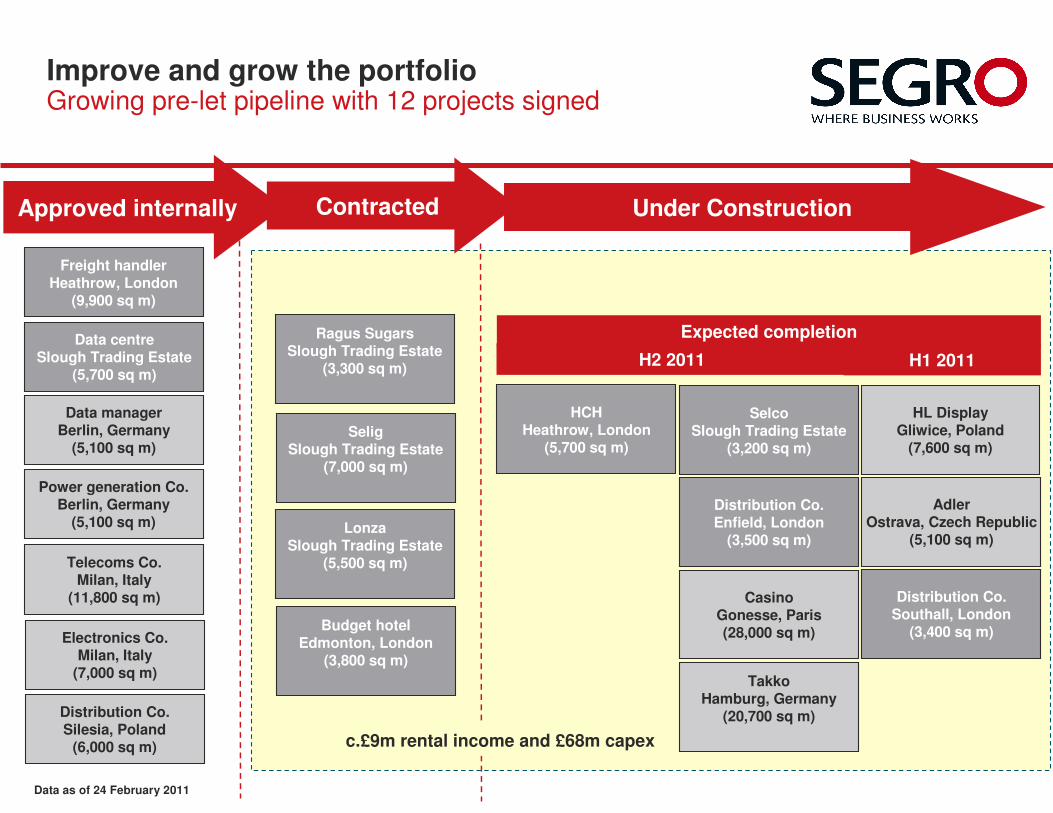
Improve and grow the portfolioGrowing pre-let pipeline with 12 projects signed
TakkoHamburg, Germany
(20,700 sq m)
Under ConstructionContractedApproved internally
Ragus SugarsSlough Trading Estate
(3,300 sq m)
SeligSlough Trading Estate
(7,000 sq m)
LonzaSlough Trading Estate
(5,500 sq m)
Budget hotelEdmonton, London
(3,800 sq m)
Freight handlerHeathrow, London
(9,900 sq m)
Data centreSlough Trading Estate
(5,700 sq m)
Data managerBerlin, Germany
(5,100 sq m)
Power generation Co.Berlin, Germany
(5,100 sq m)
Telecoms Co.Milan, Italy
(11,800 sq m)
Electronics Co.Milan, Italy
(7,000 sq m)
Distribution Co.Southall, London
(3,400 sq m)
SelcoSlough Trading Estate
(3,200 sq m)
Distribution Co.Enfield, London
(3,500 sq m)
HCHHeathrow, London
(5,700 sq m)
CasinoGonesse, Paris(28,000 sq m)
HL DisplayGliwice, Poland
(7,600 sq m)
AdlerOstrava, Czech Republic
(5,100 sq m)
Expected completion
H2 2011 H1 2011
c.£9m rental income and £68m capex
Distribution Co.Silesia, Poland
(6,000 sq m)
Data as of 24 February 2011
18
Outlook2011 will present further challenges
� Enquiry levels strong
� Healthy pipeline of pre-let developments
� Challenges in 2010 likely to continue into 2011
- Managing takebacks remains key focus
� Future potential:
- Reduction of 1% in vacancy = c.£6m additional annualised earnings
- Well located and prudently valued land bank

Funding and Treasury Strategy
Andrew Pilsworth – Group Treasurer
20
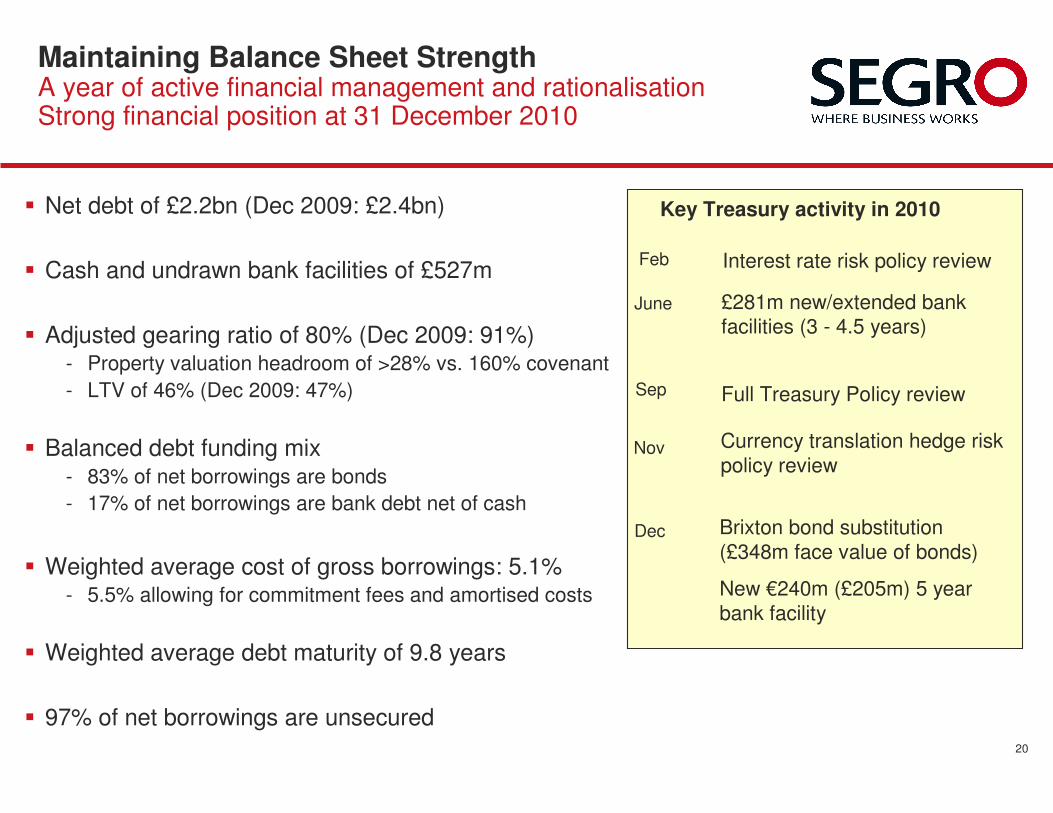
Maintaining Balance Sheet StrengthA year of active financial management and rationalisationStrong financial position at 31 December 2010
� Net debt of £2.2bn (Dec 2009: £2.4bn)
� Cash and undrawn bank facilities of £527m
� Adjusted gearing ratio of 80% (Dec 2009: 91%)- Property valuation headroom of >28% vs. 160% covenant
- LTV of 46% (Dec 2009: 47%)
� Balanced debt funding mix- 83% of net borrowings are bonds
- 17% of net borrowings are bank debt net of cash
� Weighted average cost of gross borrowings: 5.1%- 5.5% allowing for commitment fees and amortised costs
� Weighted average debt maturity of 9.8 years
� 97% of net borrowings are unsecured
June £281m new/extended bank facilities (3 - 4.5 years)
Sep
Currency translation hedge risk
policy review Nov
Dec Brixton bond substitution
(£348m face value of bonds)
New €240m (£205m) 5 year
bank facility
Key Treasury activity in 2010
Feb Interest rate risk policy review
Full Treasury Policy review
21
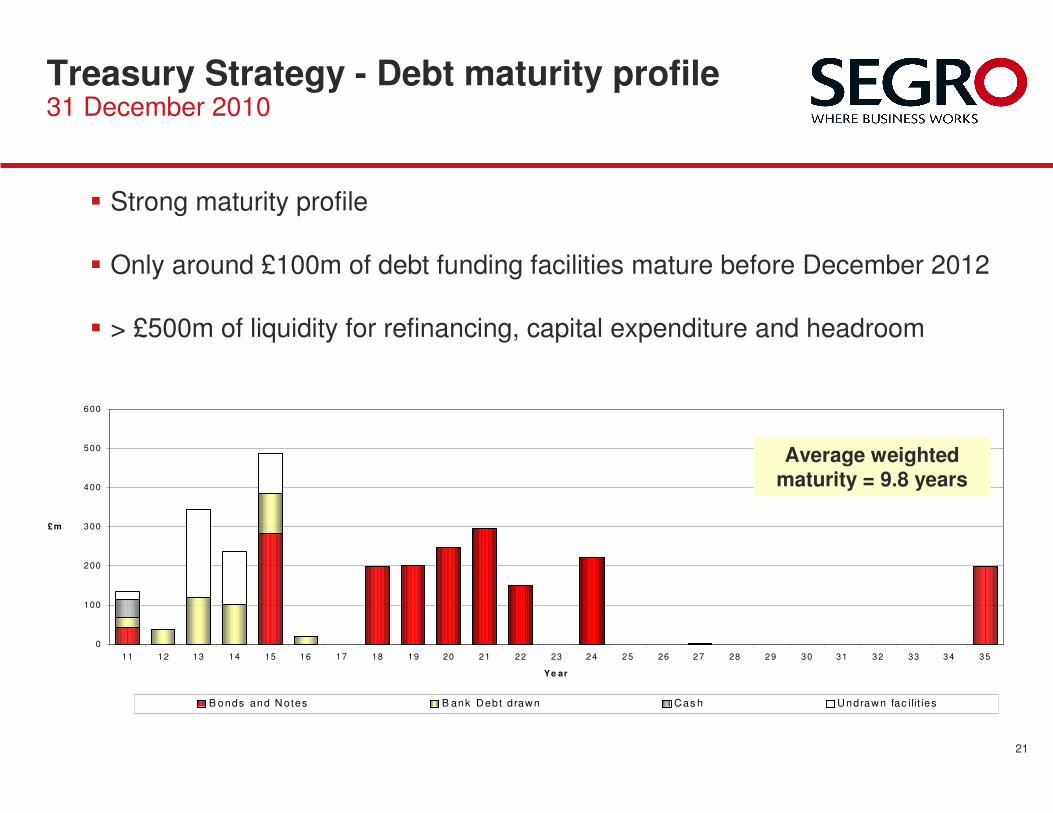
Treasury Strategy - Debt maturity profile31 December 2010
0
100
200
300
400
500
600
11 12 13 14 15 16 17 18 19 20 21 22 23 24 25 26 27 28 29 30 31 32 33 34 35
Ye ar
B onds and N otes B ank Debt d rawn Cas h Undrawn fac ilit ies
£m
Average weighted maturity = 9.8 years
� Strong maturity profile
� Only around £100m of debt funding facilities mature before December 2012
� > £500m of liquidity for refinancing, capital expenditure and headroom
22
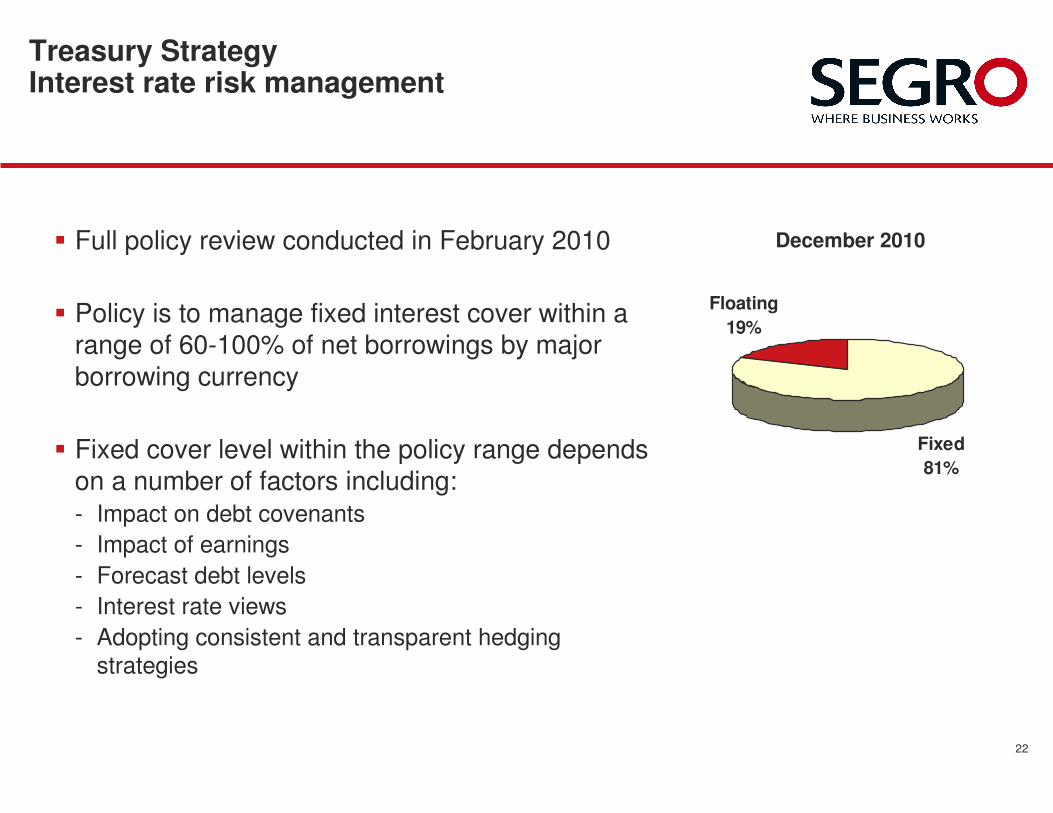
Treasury Strategy Interest rate risk management
� Full policy review conducted in February 2010
� Policy is to manage fixed interest cover within a
range of 60-100% of net borrowings by major
borrowing currency
� Fixed cover level within the policy range depends
on a number of factors including:
- Impact on debt covenants
- Impact of earnings
- Forecast debt levels
- Interest rate views
- Adopting consistent and transparent hedging
strategies
December 2010
Floating
19%
Fixed
81%
23
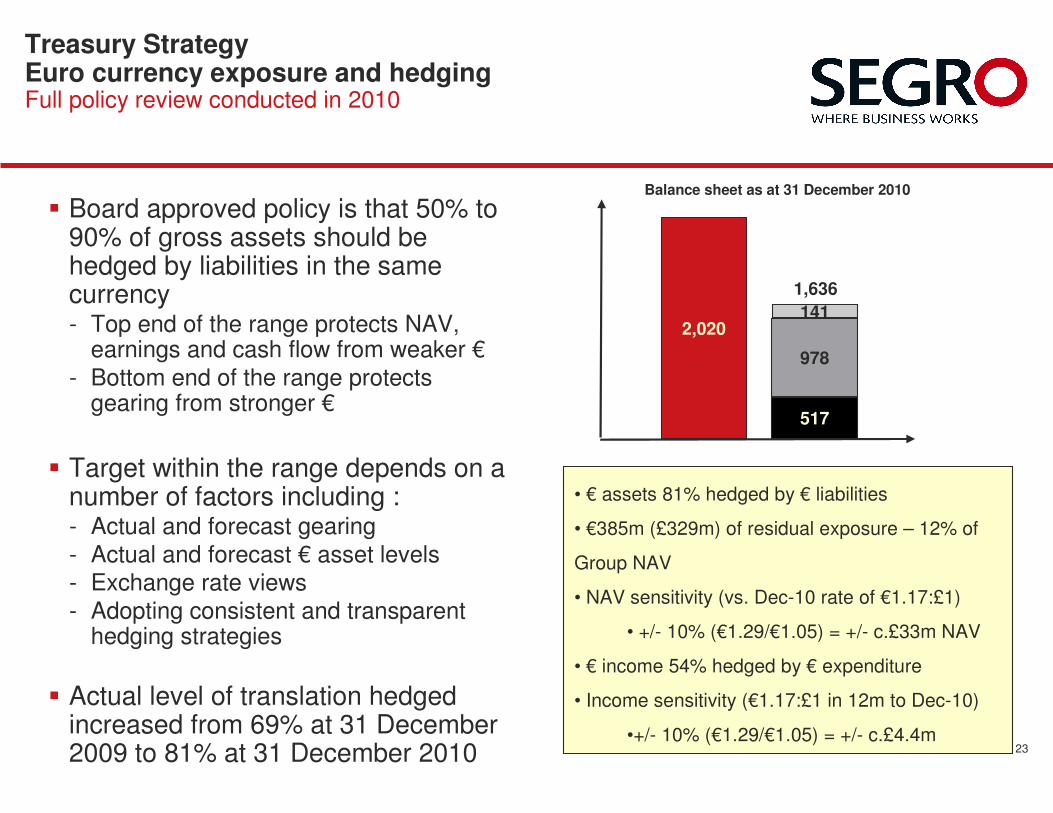
Treasury Strategy Euro currency exposure and hedgingFull policy review conducted in 2010
• € assets 81% hedged by € liabilities
• €385m (£329m) of residual exposure – 12% of
Group NAV
• NAV sensitivity (vs. Dec-10 rate of €1.17:£1)
• +/- 10% (€1.29/€1.05) = +/- c.£33m NAV
• € income 54% hedged by € expenditure
• Income sensitivity (€1.17:£1 in 12m to Dec-10)
•+/- 10% (€1.29/€1.05) = +/- c.£4.4m
� Board approved policy is that 50% to 90% of gross assets should be hedged by liabilities in the same currency- Top end of the range protects NAV,
earnings and cash flow from weaker €
- Bottom end of the range protects gearing from stronger €
� Target within the range depends on a number of factors including :- Actual and forecast gearing
- Actual and forecast € asset levels- Exchange rate views
- Adopting consistent and transparent hedging strategies
� Actual level of translation hedged increased from 69% at 31 December 2009 to 81% at 31 December 2010
2,020
517
978
141
Balance sheet as at 31 December 2010
1,636

Executive Summary
Ian Coull – Group CEO
25
Executive Summary
� A strong operating performance in 2010 despite a challenging environment
� Group vacancy reduced from 13.5% to 12.0%
� Strong balance sheet position maintained during 2010
� Clear business and financial strategy - Well placed to take advantage of market opportunities
� Ongoing commitment to transparency with stakeholders
� The support of our bond investors is valued and appreciated
Questions?
26
Forward-looking statements
This presentation may contain certain forward-looking statements with respect to SEGRO’s
expectations and plans, strategy, management’s objectives, future performance, costs,
revenues and other trend information. These statements and forecasts involve risk and
uncertainty because they relate to events and depend upon circumstances that may occur
in the future. There are a number of factors which could cause actual results or
developments to differ materially from those expressed or implied by these forward looking
statements and forecasts. The statements have been made with reference to forecast price
changes, economic conditions and the current regulatory environment. Nothing in this
presentation should be construed as a profit forecast. Past share performance cannot be
relied on as a guide to future performance.

APPENDICES
28
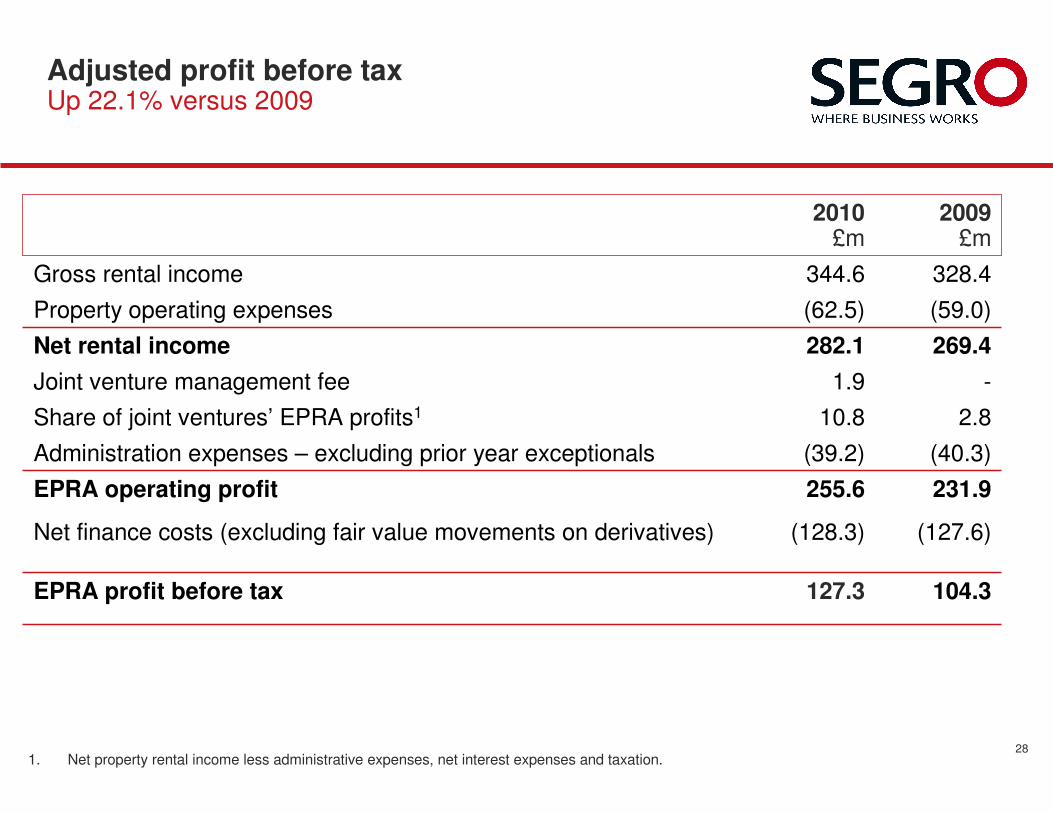
Adjusted profit before taxUp 22.1% versus 2009
2.810.8Share of joint ventures’ EPRA profits1
(59.0)(62.5)Property operating expenses
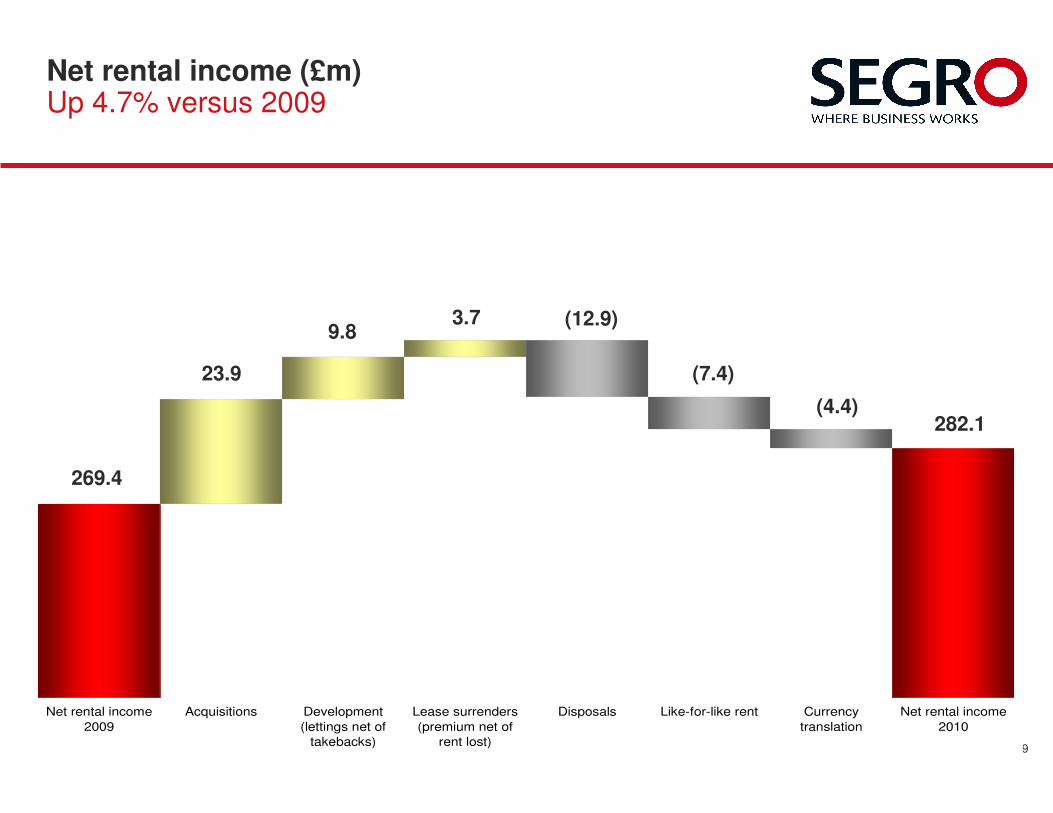
269.4282.1Net rental income
-1.9Joint venture management fee
(40.3)(39.2)Administration expenses – excluding prior year exceptionals
231.9255.6EPRA operating profit
104.3127.3EPRA profit before tax
(127.6)(128.3)Net finance costs (excluding fair value movements on derivatives)
328.4344.6Gross rental income
2009£m
2010£m
1. Net property rental income less administrative expenses, net interest expenses and taxation.
29
Net rental income
2009
Acquisitions Development
(lettings net of
takebacks)
Lease surrenders
(premium net of
rent lost)
Disposals Like-for-like rent Currency
translation
Net rental income
2010
Net rental income (£m) Up 4.7% versus 2009
269.4
23.9
9.83.7 (12.9)
(7.4)
(4.4)282.1
30
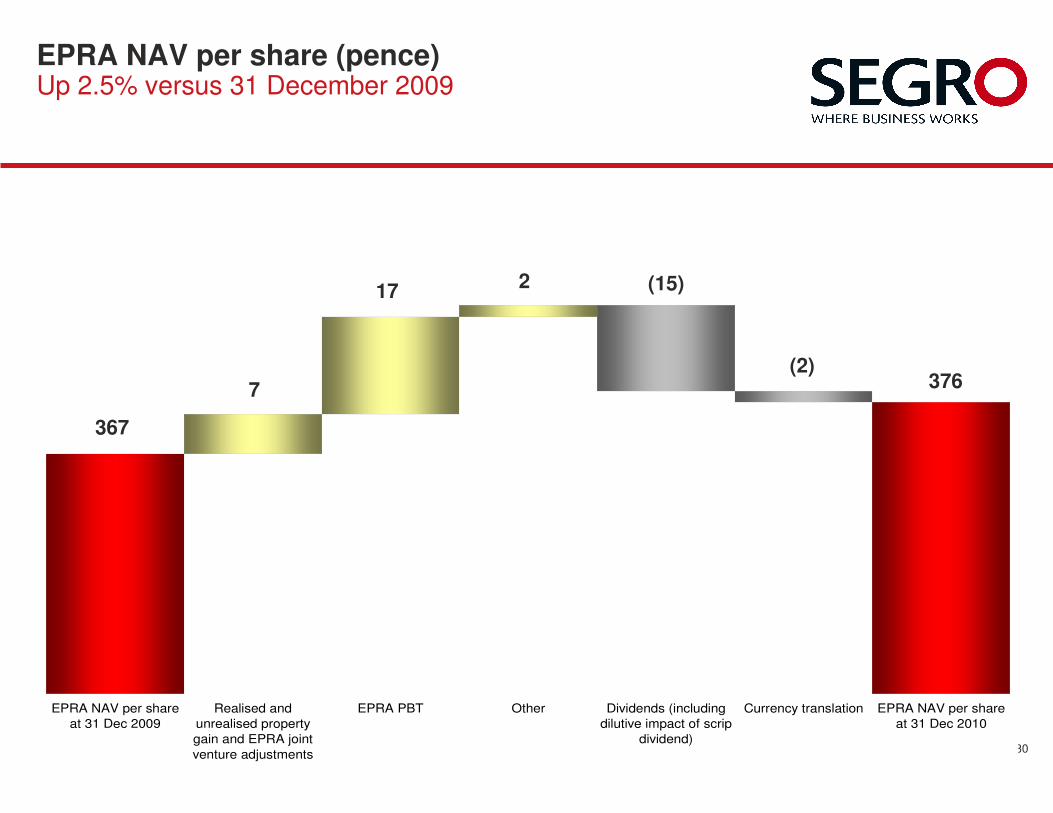
EPRA NAV per share
at 31 Dec 2009
Realised and
unrealised property
gain and EPRA joint
venture adjustments
EPRA PBT Other Dividends (including
dilutive impact of scrip
dividend)
Currency translation EPRA NAV per share
at 31 Dec 2010
EPRA NAV per share (pence)Up 2.5% versus 31 December 2009
367
7
172 (15)
(2)376
31
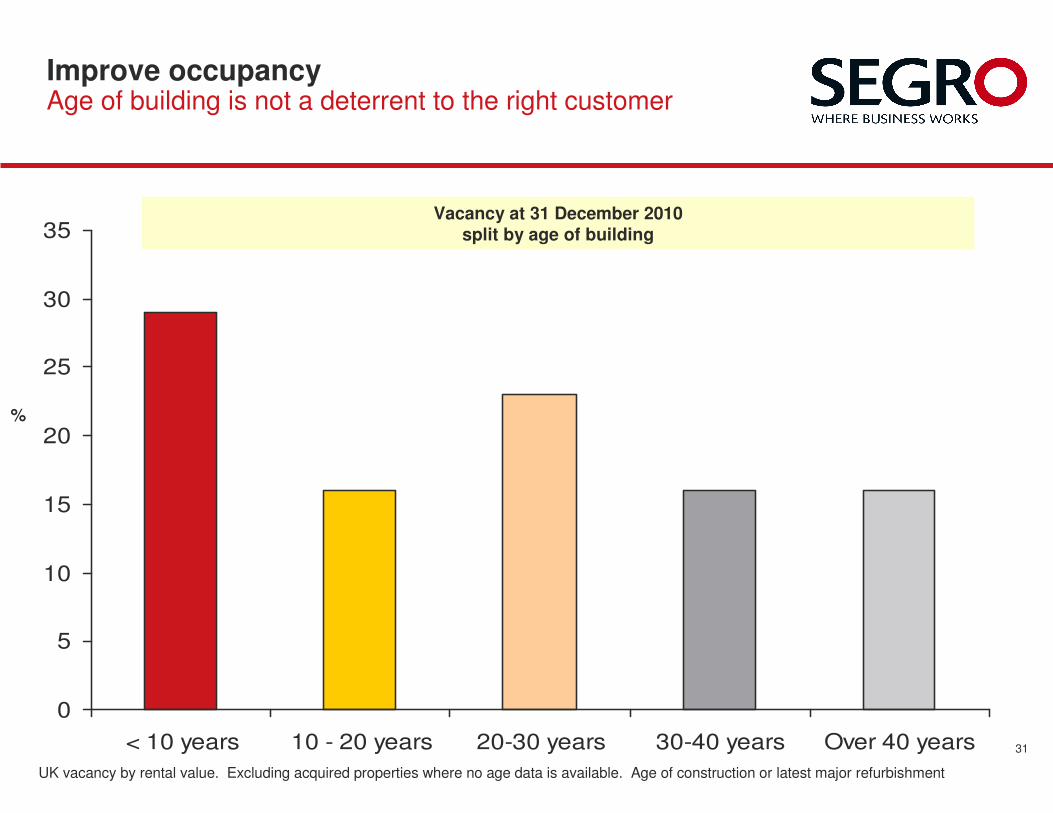
Improve occupancyAge of building is not a deterrent to the right customer
0
5
10
15
20
25
30
35
< 10 years 10 - 20 years 20-30 years 30-40 years Over 40 years
UK vacancy by rental value. Excluding acquired properties where no age data is available. Age of construction or latest major refurbishment
Vacancy at 31 December 2010 split by age of building
%
32
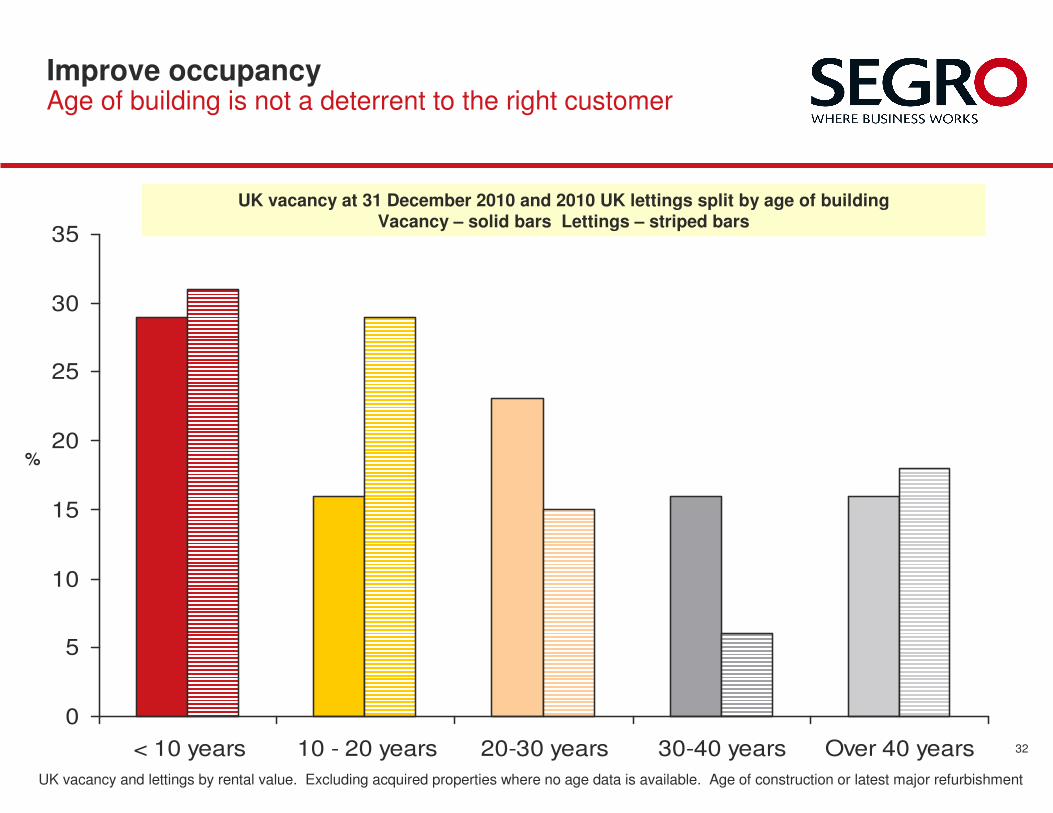
Improve occupancyAge of building is not a deterrent to the right customer
0
5
10
15
20
25
30
35
< 10 years 10 - 20 years 20-30 years 30-40 years Over 40 years
UK vacancy and lettings by rental value. Excluding acquired properties where no age data is available. Age of construction or latest major refurbishment
UK vacancy at 31 December 2010 and 2010 UK lettings split by age of building Vacancy – solid bars Lettings – striped bars
%
33
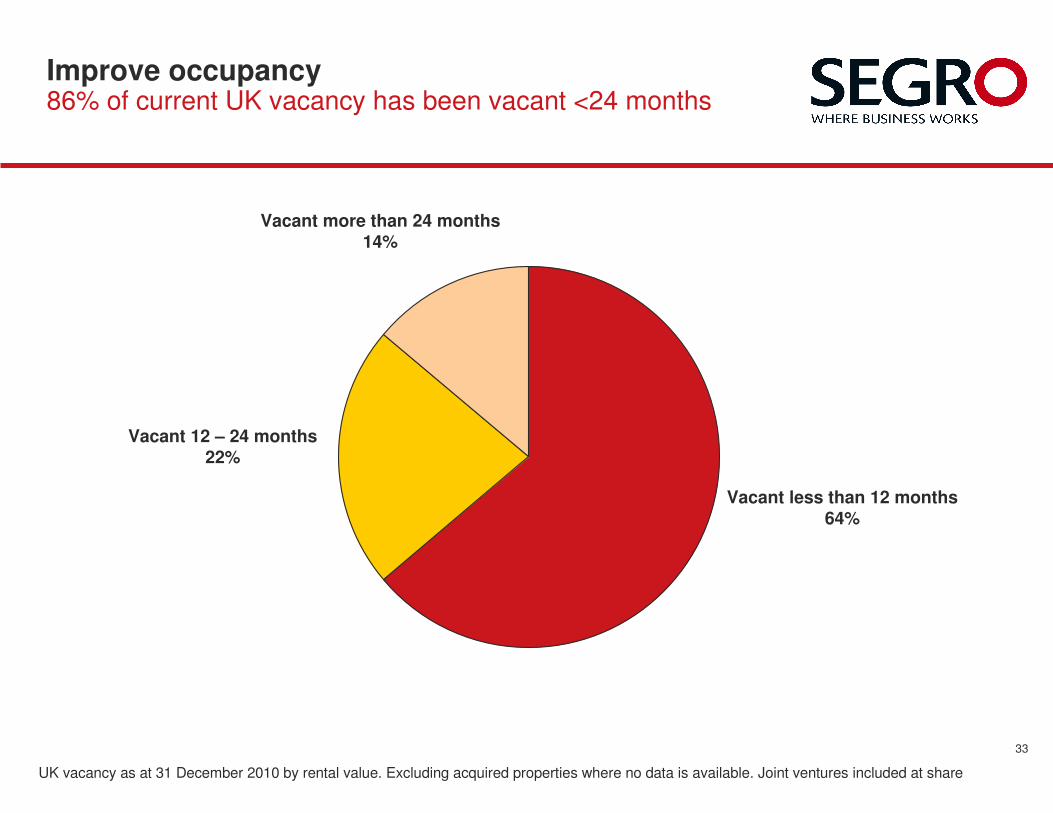
Improve occupancy86% of current UK vacancy has been vacant <24 months
Vacant less than 12 months64%
Vacant 12 – 24 months22%
UK vacancy as at 31 December 2010 by rental value. Excluding acquired properties where no data is available. Joint ventures included at share
Vacant more than 24 months14%
34
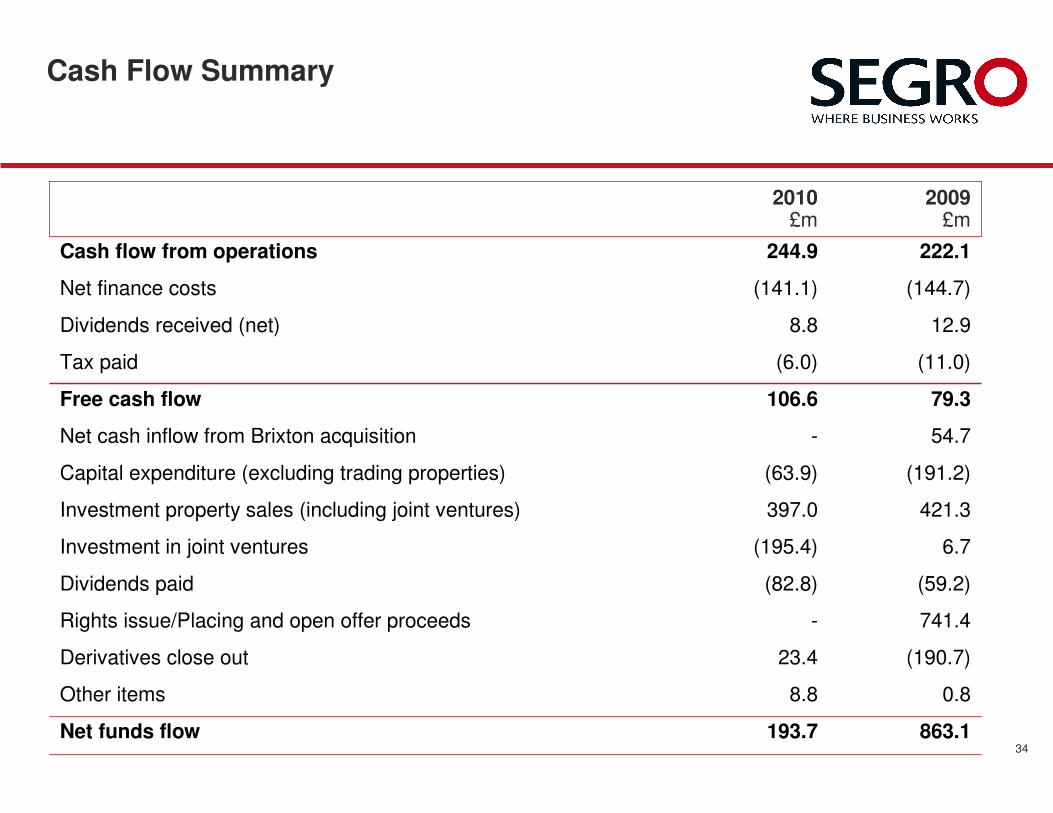
Cash Flow Summary
6.7(195.4)Investment in joint ventures
54.7-Net cash inflow from Brixton acquisition
421.3397.0Investment property sales (including joint ventures)
741.4-Rights issue/Placing and open offer proceeds
(59.2)(82.8)Dividends paid
(191.2)(63.9)Capital expenditure (excluding trading properties)
(190.7)23.4Derivatives close out
863.1193.7Net funds flow
0.88.8Other items
79.3106.6Free cash flow
(11.0)(6.0)Tax paid
12.98.8Dividends received (net)
(144.7)(141.1)Net finance costs
222.1244.9Cash flow from operations
2009£m
2010£m
35
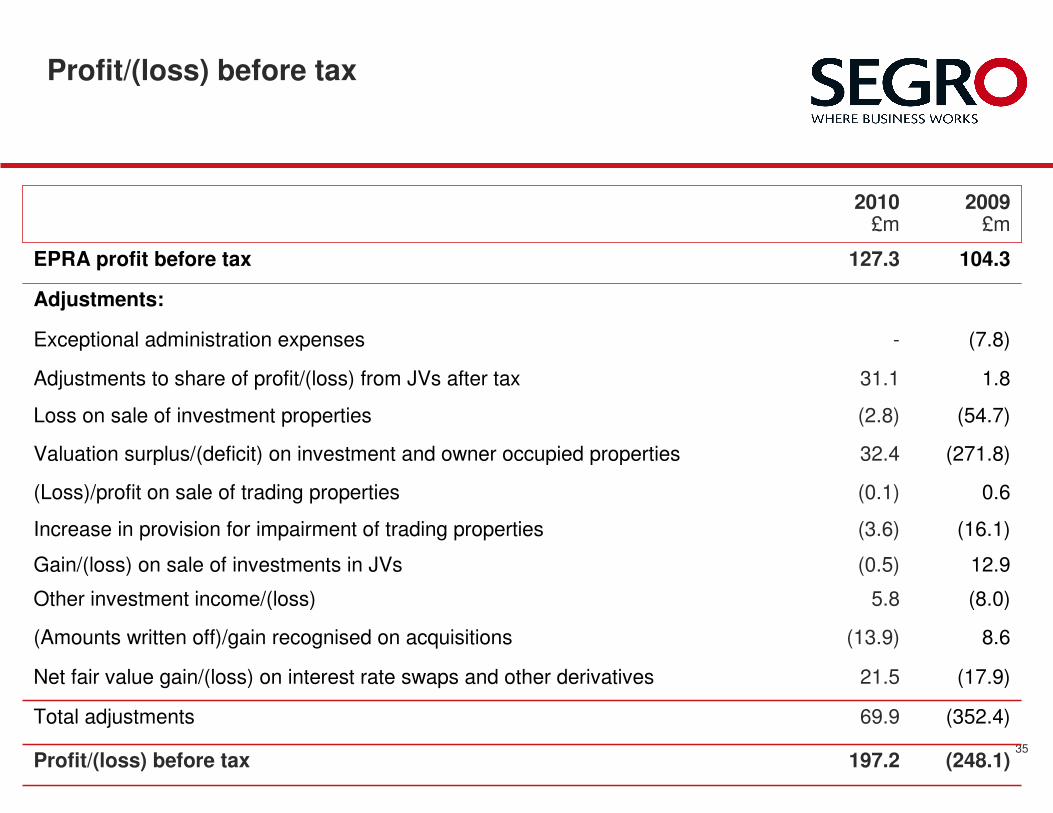
Profit/(loss) before tax
(54.7)(2.8)Loss on sale of investment properties
(248.1)197.2Profit/(loss) before tax
(352.4)69.9Total adjustments
(17.9)21.5Net fair value gain/(loss) on interest rate swaps and other derivatives
8.6(13.9)(Amounts written off)/gain recognised on acquisitions
(8.0)5.8Other investment income/(loss)
12.9(0.5)Gain/(loss) on sale of investments in JVs
(16.1)(3.6)Increase in provision for impairment of trading properties
0.6(0.1)(Loss)/profit on sale of trading properties
(271.8)32.4Valuation surplus/(deficit) on investment and owner occupied properties
1.831.1Adjustments to share of profit/(loss) from JVs after tax
(7.8)-Exceptional administration expenses
Adjustments:
104.3127.3EPRA profit before tax
2009£m
2010£m
36
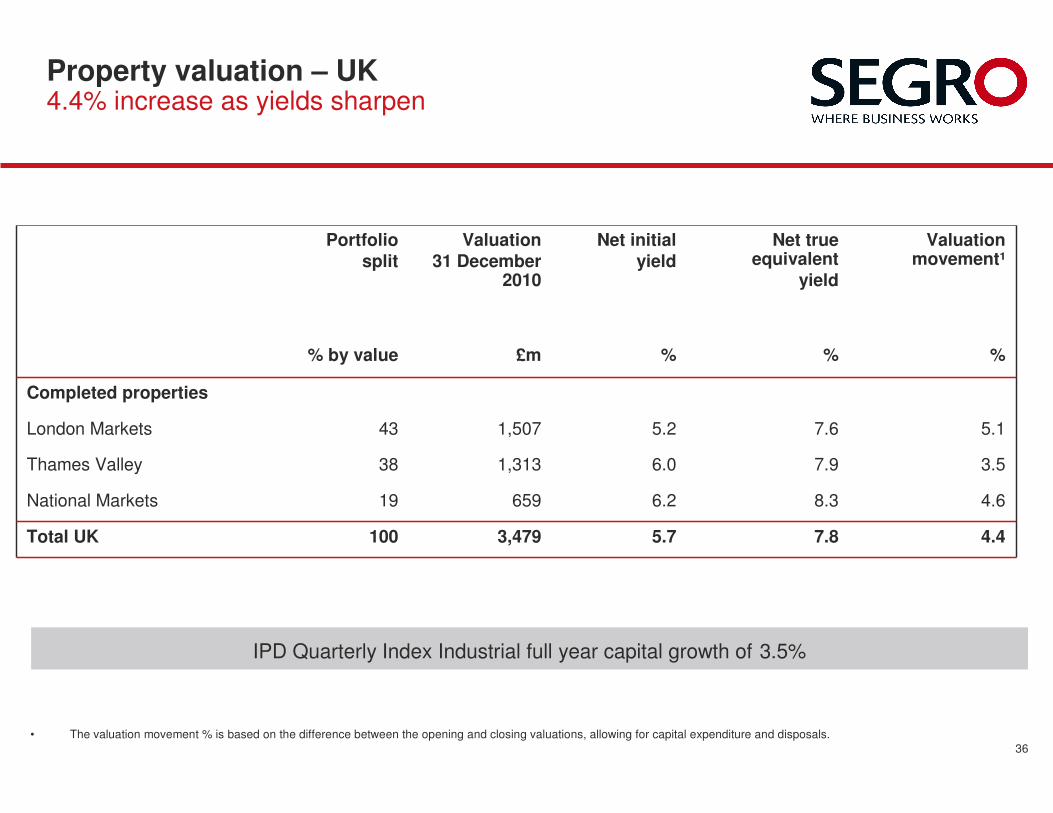
Property valuation – UK4.4% increase as yields sharpen
7.8
8.3
7.9
7.6
%
Net true equivalent
yield
3.56.01,31338Thames Valley
100
19
43
% by value
Portfolio
split
%%£m
5.7
6.2
5.2
Net initial
yield
4.43,479Total UK
4.6
5.1
Valuation movement¹
Completed properties
659National Markets
1,507London Markets
Valuation
31 December 2010
• The valuation movement % is based on the difference between the opening and closing valuations, allowing for capital expenditure and disposals.
IPD Quarterly Index Industrial full year capital growth of 3.5%
37
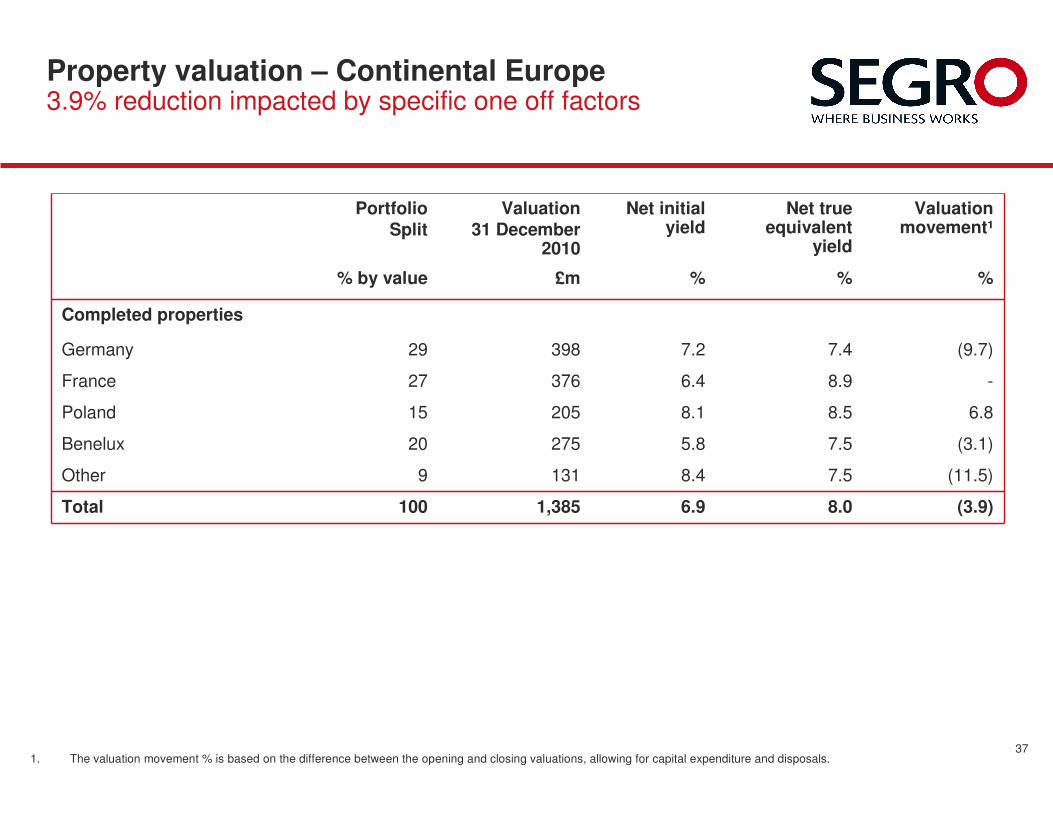
Property valuation – Continental Europe3.9% reduction impacted by specific one off factors
(11.5)7.58.41319Other
(3.1)7.55.827520Benelux
-8.96.437627France
(9.7)7.47.239829Germany
100
15
% by value
Portfolio
Split
(3.9)
6.8
%
Valuation movement¹
Net true equivalent
yield
Net initial yield
Valuation
31 December 2010
%%£m
6.9
8.1
8.01,385Total
8.5205Poland
Completed properties
1. The valuation movement % is based on the difference between the opening and closing valuations, allowing for capital expenditure and disposals.
38
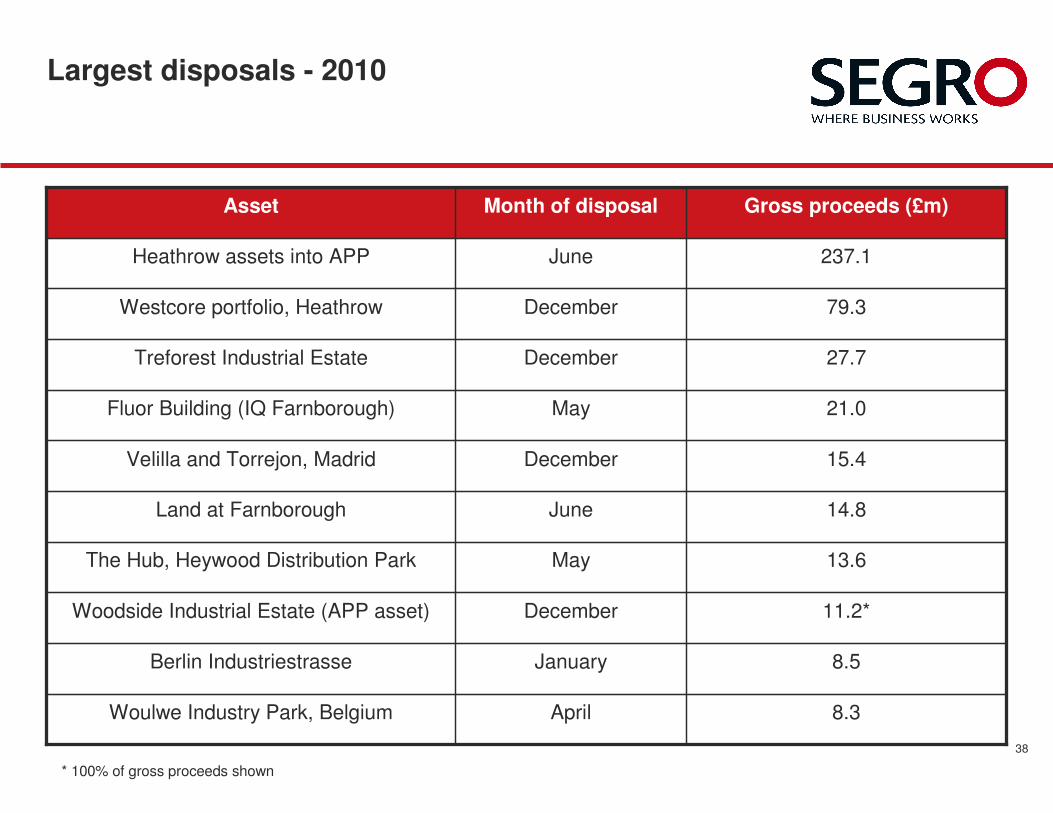
Largest disposals - 2010
15.4DecemberVelilla and Torrejon, Madrid
8.3AprilWoulwe Industry Park, Belgium
8.5JanuaryBerlin Industriestrasse
11.2*DecemberWoodside Industrial Estate (APP asset)
13.6MayThe Hub, Heywood Distribution Park
14.8JuneLand at Farnborough
21.0MayFluor Building (IQ Farnborough)
27.7DecemberTreforest Industrial Estate
79.3DecemberWestcore portfolio, Heathrow
237.1JuneHeathrow assets into APP
Gross proceeds (£m)Month of disposalAsset
* 100% of gross proceeds shown
Related Documents