Computer Aided Geometric Design 23 (2006) 495–509 www.elsevier.com/locate/cagd Segmenting molecular surfaces Vijay Natarajan a,∗ , Yusu Wang b , Peer-Timo Bremer c , Valerio Pascucci d , Bernd Hamann a,e a Institute for Data Analysis and Visualization, University of California, Davis, USA b Department of Computer Science and Engineering, The Ohio State University, USA c Department of Computer Science, University of Illinois, Urbana-Champaign, USA d Center for Applied Scientific Computing, Lawrence Livermore National Laboratory, USA e Department of Computer Science, University of California, Davis, USA Received 18 August 2005; received in revised form 9 February 2006; accepted 10 February 2006 Available online 27 April 2006 Abstract This paper presents a new method for segmentation of molecular surfaces. Topological analysis of a scalar function defined on the surface and its associated gradient field reveals the relationship between the features of interest and critical points of the scalar function. The segmentation is obtained by associating segments with local minima/maxima. Controlled simplification of the function merges segments resulting in a hierarchical segmentation of the molecular surface. This segmentation is used to identify rigid components of protein molecules and to study the role of cavities and protrusions in protein–protein interactions. © 2006 Elsevier B.V. All rights reserved. Keywords: Segmentation; Morse theory; Morse–Smale complex; Multiresolution data structure; Visualization; Structural biology; Molecular graphics 1. Introduction Rapid advances in imaging and simulation technologies allow us to study and understand life at the molecular level. In the quest towards understanding how molecules (proteins in particular) function, structural analysis emerges as a fundamental problem, because it is generally believed that the three-dimensional structure of a molecule to a large extent determines its particular functionality (Taylor et al., 2001). Structural analysis presents one of the major challenges in molecular biology: Detailed structures are extremely hard and time-consuming to obtain using existing imaging technology; protein structures are complex; there is no consensus on the best way to represent them; they are hard to manipulate; and, most important of all, the connection between the geometry (shape) and chemical properties of a molecule is not well-understood. Despite these difficulties, an increasing amount of research is being devoted to annotate and analyze molecular structures, especially in the post-genomic era. * Corresponding author. E-mail addresses: [email protected] (V. Natarajan), [email protected] (Y. Wang), [email protected] (P.-T. Bremer), [email protected] (V. Pascucci), [email protected] (B. Hamann). 0167-8396/$ – see front matter © 2006 Elsevier B.V. All rights reserved. doi:10.1016/j.cagd.2006.02.003

Welcome message from author
This document is posted to help you gain knowledge. Please leave a comment to let me know what you think about it! Share it to your friends and learn new things together.
Transcript
Computer Aided Geometric Design 23 (2006) 495–509
www.elsevier.com/locate/cagd
Segmenting molecular surfaces
Vijay Natarajan a,∗, Yusu Wang b, Peer-Timo Bremer c,Valerio Pascucci d, Bernd Hamann a,e
a Institute for Data Analysis and Visualization, University of California, Davis, USAb Department of Computer Science and Engineering, The Ohio State University, USAc Department of Computer Science, University of Illinois, Urbana-Champaign, USA
d Center for Applied Scientific Computing, Lawrence Livermore National Laboratory, USAe Department of Computer Science, University of California, Davis, USA
Received 18 August 2005; received in revised form 9 February 2006; accepted 10 February 2006
Available online 27 April 2006
Abstract
This paper presents a new method for segmentation of molecular surfaces. Topological analysis of a scalar function definedon the surface and its associated gradient field reveals the relationship between the features of interest and critical points of thescalar function. The segmentation is obtained by associating segments with local minima/maxima. Controlled simplification of thefunction merges segments resulting in a hierarchical segmentation of the molecular surface. This segmentation is used to identifyrigid components of protein molecules and to study the role of cavities and protrusions in protein–protein interactions.© 2006 Elsevier B.V. All rights reserved.
Keywords: Segmentation; Morse theory; Morse–Smale complex; Multiresolution data structure; Visualization; Structural biology; Moleculargraphics
1. Introduction
Rapid advances in imaging and simulation technologies allow us to study and understand life at the molecularlevel. In the quest towards understanding how molecules (proteins in particular) function, structural analysis emergesas a fundamental problem, because it is generally believed that the three-dimensional structure of a molecule to alarge extent determines its particular functionality (Taylor et al., 2001). Structural analysis presents one of the majorchallenges in molecular biology: Detailed structures are extremely hard and time-consuming to obtain using existingimaging technology; protein structures are complex; there is no consensus on the best way to represent them; they arehard to manipulate; and, most important of all, the connection between the geometry (shape) and chemical propertiesof a molecule is not well-understood. Despite these difficulties, an increasing amount of research is being devoted toannotate and analyze molecular structures, especially in the post-genomic era.
* Corresponding author.E-mail addresses: [email protected] (V. Natarajan), [email protected] (Y. Wang), [email protected] (P.-T. Bremer),
[email protected] (V. Pascucci), [email protected] (B. Hamann).
0167-8396/$ – see front matter © 2006 Elsevier B.V. All rights reserved.doi:10.1016/j.cagd.2006.02.003
496 V. Natarajan et al. / Computer Aided Geometric Design 23 (2006) 495–509
Visualization methods are crucially important for comprehending the vast amount of structural information avail-able to us in multiple online databases (Bajaj et al., 1993, 2004; Leach, 1996; Voorintholt et al., 1989). Humans areable to interpret and comprehend visual information more easily than numerical or textual information. The field ofdata visualization capitalizes on this ability and aims at providing the user with a deeper understanding of the data.Better understanding can be achieved by providing a comprehensive display of the data along with annotations. Inmolecular biology, visualization facilitates the recognition of meaningful relations between bio-chemical informationand the shape of a molecule. One question is especially relevant: What aspects of the structure of a molecule de-termine its functionality and hence are crucial? For example, one can visualize various chemical properties, such aselectrostatic potential or hydrophobicity, on molecular surfaces to see whether the binding sites (the locations on themolecule that interact with another molecule) have any inherent characteristics.
We use a surface representation of molecules. A molecule consists of a set of atoms. If each atom is modeled as aball, then the molecule can be represented as the union of all balls. Various methods have been proposed to obtain asurface from the set of balls. The surface of this union, called the Van der Waal surface is easily computable but notcontinuous (Connolly, 1996). The molecular surface refers to the surface traced out by the inward-facing surface of aprobing sphere rolled on top of the van der Waal surface (Richards, 1977). It is continuous in most cases, but can havesingularities (self-intersections). The skin surface is the envelope of families of an infinite number of evolving spheres(Cheng et al., 2001). It satisfies many desirable mathematical properties. For example, it is smooth everywhere and,although defined using an infinite number of spheres, it can be described by a finite number of quadric surface patches.We prefer the skin surface because of its above-mentioned properties.
Segmentation of the surface into regions that identify characteristic features is useful for visual analysis of themolecule. Different criteria and methods have been proposed for the segmentation of surfaces in general (Shamir,2004). We focus on the problem of segmentation of molecular surfaces, in particular. Ideas presented in this paper arebased on Morse theory, which allows us to infer the shape characteristics of a surface from the study of a real-valuedfunction, called a Morse function, defined on the surface. For example, when the surface represents a terrain, wewould like to capture its peaks and valleys. Such characterization is obtained by defining a function that evaluates theheight of points, making it possible to associate regions with the local maxima and minima of this function. Definingsuch a function for a more general surface is non-trivial, and will naturally depend on the motivating application. Forexample, Hilaga et al. (2001) define a function whose value at a given point is equal to the average geodesic distanceto all points on the surface. Local maxima of this function identifies distinct features in the surface. They use theidentified features for shape matching purposes. In certain scientific applications, the function is already defined overthe surface and represents a physical quantity: for example, electron density, temperature, or pressure. In these cases,a segmentation of the domain surface helps the scientist understand the characteristics of the function.
We describe an algorithm for segmenting a molecular surface when such a function is given. Our algo-rithm computes a hierarchical segmentation of a molecular surface, enabling a user to interact with and ana-lyze the surface at multiple levels of detail. We describe two applications to demonstrate the usefulness of oursegmentation technique. Existing segmentation methods are either based on bio-chemical information (Bajaj etal., 2004) (if detailed atomic information is available), region-growing techniques (Mangan and Whitaker, 1999;Srinark and Kambhamettu, 2003; Vivodtzev et al., 2003), or Morse theory (Bremer et al., 2004; Cazals et al., 2003;Natarajan and Pascucci, 2005). Our method has the advantage that it respects the topology of the associated functionas described by its critical points, while those based on growing regions are ad-hoc. Region-growing methods, alsocalled watershed algorithms, construct segments around either minima or maxima. Instead, we are able to simultane-ously construct segments around both minima and maxima, and in a hierarchical fashion. Furthermore, we providevarious options to compute the boundary of these segments, each appropriate for particular scenarios.
In practice, the input surface is usually represented as a triangle mesh in R3. The function defined over it is not
smooth; it is a piecewise-linear (PL) function. These functions violate some of the assumptions made in the underlyingmathematical framework of our methods. We refer to the papers by Edelsbrunner et al. (2003b) and Bremer et al.(2004) for a comprehensive description of how key ideas from Morse theory can be extended to PL functions definedover triangle meshes. Morse theory is discussed in detail by Matsumoto (2002) and Milnor (1963). Forman (1998)has developed a discrete version of Morse theory for cell complexes, which has also been used to analyze molecularsurfaces (Cazals et al., 2003).
V. Natarajan et al. / Computer Aided Geometric Design 23 (2006) 495–509 497
2. Flow-based segmentation
Segmentation is a key ingredient for molecular surface analysis. We segment a given surface by first designing anappropriate scalar function over it and then analyzing its gradient flow field. The Morse–Smale complex partitionsthe surface into monotonic patches. We use these patches to construct a segmentation of the surface into peaks andvalleys. Before describing our algorithm, we introduce various ideas from Morse theory and discuss their extensionto the PL setting.
2.1. Critical points
Let M be a closed surface in R3 and f : M → R be a real-valued smooth function. A point on the surface is critical
if the gradient of f at this point is zero. f is a Morse function if none of its critical points are degenerate i.e., theHessian matrix is non-singular for all critical points, and no two critical points have the same function value. Thelocal behavior of a Morse function at critical points is characterized by the following lemma:
Morse Lemma. (Matsumoto, 2002) Let p0 be a critical point of a Morse function f defined on a surface. Then wecan choose appropriate local coordinates (X,Y ), with p0 as the origin, in such a way that the function f expressedwith respect to (X,Y ) has one of the following three standard forms:
(i) f = X2 + Y 2 + c,(ii) f = X2 − Y 2 + c, or
(iii) f = −X2 − Y 2 + c,
where c = f (p0).
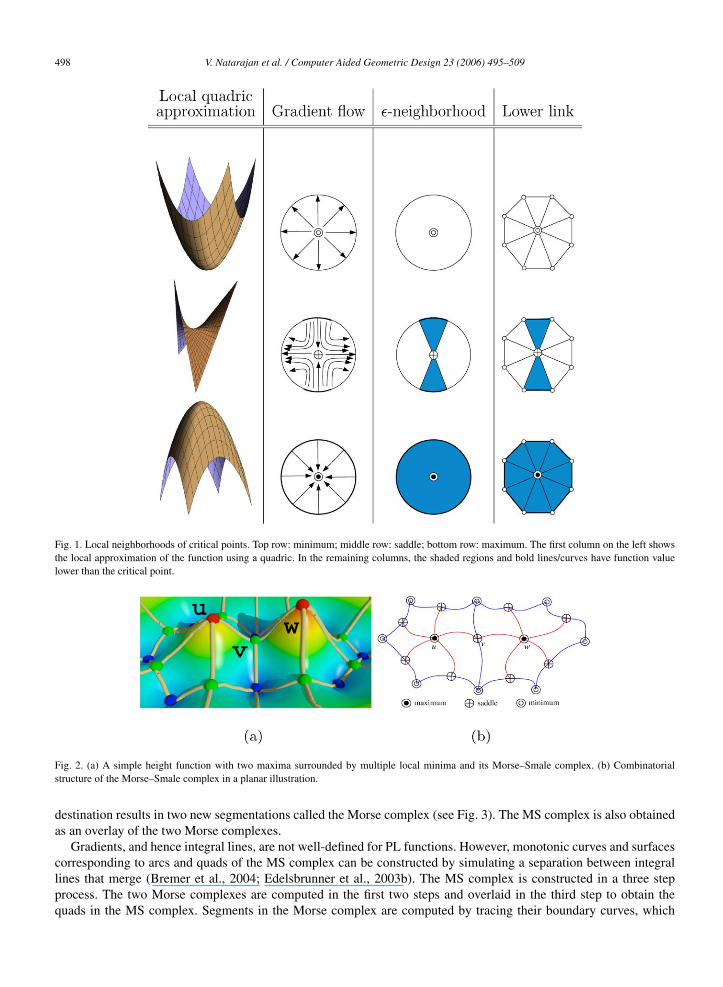
The Morse Lemma states that a Morse function has quadratic behavior within a local neighborhood of every non-degenerate critical point p. This fact leads to a method for identification and characterization of critical points. Fig. 1shows the different types of critical points and how their local neighborhood characterizes the type of criticality.A molecular surface is typically represented by a triangular mesh K . The scalar function1 f is sampled at the verticesand linearly interpolated within edges and triangles of K . The local neighborhood of a vertex needs to be formallydefined in order to characterize critical points of a PL function defined on K . The star of a vertex v consists of alltriangles and edges containing v. The link of v consists of those vertices and edges that are faces of edges and trianglesin star(v) and are disjoint from v. The number of connected components of the lower link of v, consisting of verticesand edges in the link where f has values lower than f (v), characterizes the critical points of f (Banchoff, 1970). Theindex of a critical point is equal to the number of negative coefficients of its local quadratic approximation, which isequal to the number of negative eigen-values of the Hessian matrix.
2.2. Morse–Smale complexes
An integral line of f is a maximal path on the surface M whose tangent vectors agree with the gradient of f atevery point of the path. Integral lines have a natural origin and destination at critical points where the gradient equalszero. Grouping the integral lines based on their origin and destination results in a segmentation of the surface. TheMorse–Smale (MS) complex is a topological data structure that stores this segmentation (see Fig. 2). Cells of differentdimension in the MS complex are called nodes, arcs, and quads. A quad clusters integral lines originating at a givenminimum and terminating at an associated maximum. An arc consists of a single integral line connecting a saddleand an extremum (minimum/maximum). A node is a trivial integral line whose origin and destination are identical.Every cell of the MS complex is monotonic i.e., it does not contain any critical point in its interior. This character-istic property of the segmentation makes it attractive for various applications including remeshing, parametrization,hierarchical and multiresolution representation. Grouping integral lines based exclusively on either their origin or
1 We use f to denote both smooth and PL functions. The context clarifies what type of function we refer to.
498 V. Natarajan et al. / Computer Aided Geometric Design 23 (2006) 495–509
Fig. 1. Local neighborhoods of critical points. Top row: minimum; middle row: saddle; bottom row: maximum. The first column on the left showsthe local approximation of the function using a quadric. In the remaining columns, the shaded regions and bold lines/curves have function valuelower than the critical point.
Fig. 2. (a) A simple height function with two maxima surrounded by multiple local minima and its Morse–Smale complex. (b) Combinatorialstructure of the Morse–Smale complex in a planar illustration.
destination results in two new segmentations called the Morse complex (see Fig. 3). The MS complex is also obtainedas an overlay of the two Morse complexes.
Gradients, and hence integral lines, are not well-defined for PL functions. However, monotonic curves and surfacescorresponding to arcs and quads of the MS complex can be constructed by simulating a separation between integrallines that merge (Bremer et al., 2004; Edelsbrunner et al., 2003b). The MS complex is constructed in a three stepprocess. The two Morse complexes are computed in the first two steps and overlaid in the third step to obtain thequads in the MS complex. Segments in the Morse complex are computed by tracing their boundary curves, which

V. Natarajan et al. / Computer Aided Geometric Design 23 (2006) 495–509 499
Fig. 3. Morse complex computed for the set of all (a) maxima and (b) minima. The Morse–Smale complex is obtained as an overlay of these twoMorse complexes.
Fig. 4. (a) We compute paths connecting saddles within each quad. (b) These paths form the boundaries of a segmentation of the surface into peaksand valleys.
are paths of steepest ascent/descent. In the first step, paths of steepest descent are traced beginning at saddles andterminating at minima. If two paths merge geometrically, then they remain together till they terminate at a minimum.However the two paths are identified to be topologically distinct and stored as two separate paths. Paths of steepestascent are traced in the second step while ensuring that they do not intersect the descending paths. The function f hasits critical points at the nodes of this complex and is monotonic within all arcs and quads of the MS complex.
Peaks and valleys are natural features in a terrain. In the case of more general surfaces, the definition of peaksand valleys is non-trivial. Assuming that there exists a function that measures the “height” of a point in M, we canassociate peaks and valleys with the local minima, and maxima of this function. We define two such functions anddiscuss their applications in Section 3. Identifying the local “sea level” that divides two adjacent peaks or valleys isan interesting and challenging problem. The Morse complex and the MS complex provide only a partial solution tothis problem. For example, computing the Morse complex for the set of all maxima results in a segmentation wherepeaks are separated. However, these segments extend all the way to adjoining valleys. The MS complex, on the otherhand, refines more than necessary. We now describe how we extend this partial solution to obtain a segmentation thatdefines both peak and valley regions.
2.3. Peak-valley decomposition
A quad in the MS complex contains one maximum and one minimum on its boundary. Consider a path withinthis quad connecting the two saddles. This path bisects the quad: One region contains the maximum and the othercontains the minimum. Bisecting all quads that contain a given maximum u, we get all regions that constitute the peakcontaining u. Similarly, a valley is obtained by bisecting all quads that contain a given minimum. The saddle-saddlepath describes the local sea level, forming the boundary between a peak and its adjoining valley. Fig. 4 shows howthese saddle-saddle paths form the boundaries of peaks and valleys in a surface. For a PL function defined on a trianglemesh, the saddle-saddle paths are restricted to lie along edges of the mesh.
We explore various optimality criteria for the construction of the saddle-saddle paths. Each one has its advantagesand disadvantages. We unify all criteria into one framework, where we compute the shortest path between saddles in

500 V. Natarajan et al. / Computer Aided Geometric Design 23 (2006) 495–509
Fig. 5. The geodesic path (dashed) between saddles could lie on the quad boundary thereby creating disconnected segments. (a) The geodesic pathwithin the lower quad touches the boundary twice (red dashed) and has two components that lie in the interior. The two disconnected segments ofthe maximum are shaded in red. (b) Penalizing boundary edges prevents the creation of disconnected segments but may result in thin and elongatedsegments. (c) Constructing a medial path that maximizes distance to the boundary results in segments that have a more rounded shape.
a weighted graph. The graph is constructed using the vertices and edges of mesh triangles constituting the quad, andedge weights are determined by one of the following optimality criteria:
• Geodesic path. This is the simplest criterion. The weight of an edge is equal to the Euclidean distance between itsendpoint vertices. Under reasonable sampling conditions, the shortest path in the mesh is a good approximationto the geodesic path between two points on the original smooth surface (Bernstein et al., 2000).
• Horizontal path. Consider sweeping the surface using isocontours of the height function. Two isocontour com-ponents that originate from adjacent minima merge at a saddle lying between them. Similarly, an isocontourcomponent that bifurcates at a saddle eventually terminates at adjacent maxima. The height at the saddle, there-fore, is a natural candidate for the sea-level. This is one of the reasons why we choose to compute paths betweensaddles. Restricting the path to lie within the height interval given by the saddle pair while computing the geodesicpath results in a good interpolation between the height at the two saddles. Since such a path may not exist, weinstead minimize deviation from the height interval by penalizing edges whose end points lie outside this heightinterval.
• Monotonic path. Another possible method for computing an interpolation between the height at saddles is onethat attempts to create a path that is monotonic in height i.e., where the function value is non-decreasing (ornon-increasing) from one saddle to a neighboring saddle. We implement this criterion by finding a directed pathalways from the lower saddle to the higher one and penalizing any edge that goes from a higher vertex to a lowerone.
• Interior path. Paths between saddles can lie partially on the quad boundary. Fig. 5 shows an example. Thisbehavior frequently creates disconnected segments because it is very likely that geodesic paths between saddleswithin the adjacent quad also lies on the boundary. Adding a big penalty to edges lying on the boundary pushesthe shortest path toward the interior. The segments are no longer disconnected, but they can be thin and elongated.
• Medial path. One way to prevent thin and elongated segments is to penalize nearness to the boundary. This forcesthe path to lie as far away from the extrema as possible, thereby creating rounded segments. Fig. 5(c) illustratesthis idea. Fig. 6 tabulates edge weights for the different optimality criteria. We demonstrate the advantages ofthese optimality criteria in Section 3, where we discuss applications of our segmentation to molecular surfaces.
The above framework does not hold when the quad contains exactly one saddle on its boundary. Two distinct arcson the boundary of this quad connect a saddle with a unique extremum. The saddle-saddle path degenerates into aloop, which bisects the quad as shown in Fig. 7. The loop passes through the saddle and separates the minimum andmaximum. The optimality criteria described above for paths hold for this loop as well. Consider the case when botharcs from the saddle connect it to the same maximum. First, we construct the loop as follows: delete the minimumand its incident edges, creating a hole in the quad. The problem of computing a loop around the minimum reduces tocomputing a loop that does not shrink to a point. We compute such a loop, which in addition satisfies the optimalitycriterion, using the minimum weight tree that spans the quad and is rooted at the saddle. The weight of the shortestpath from the root to each vertex is stored at the vertex. A loop is constructed as the union of a non-tree edge andpaths from its endpoints to the root of the tree. After constructing the tree, we classify non-tree edges depending on
V. Natarajan et al. / Computer Aided Geometric Design 23 (2006) 495–509 501
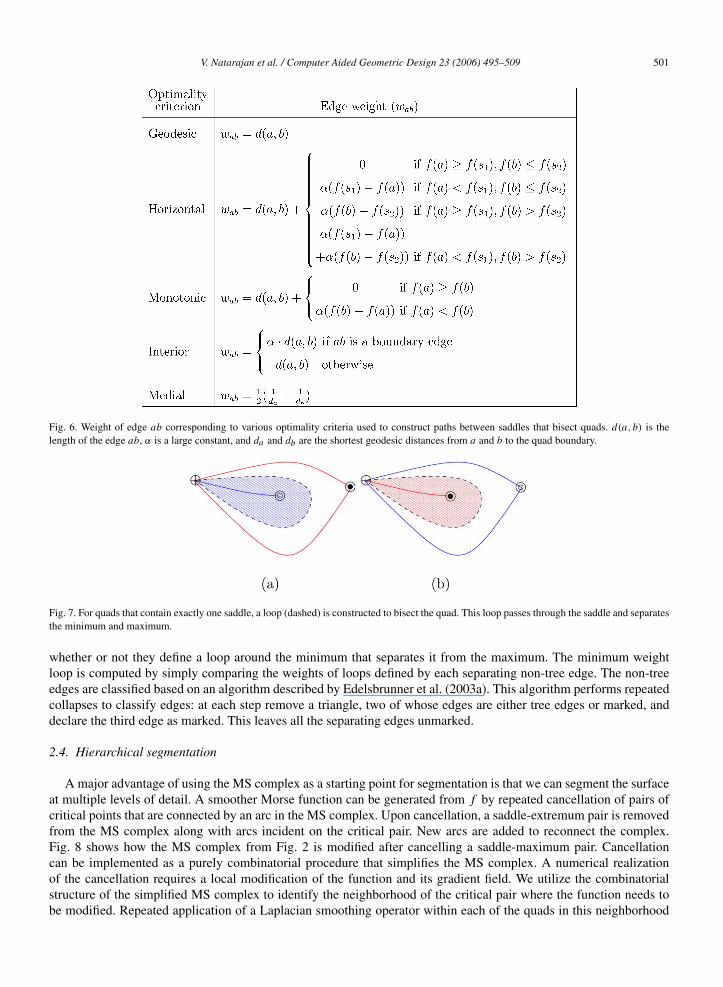
Fig. 6. Weight of edge ab corresponding to various optimality criteria used to construct paths between saddles that bisect quads. d(a, b) is thelength of the edge ab, α is a large constant, and da and db are the shortest geodesic distances from a and b to the quad boundary.
Fig. 7. For quads that contain exactly one saddle, a loop (dashed) is constructed to bisect the quad. This loop passes through the saddle and separatesthe minimum and maximum.
whether or not they define a loop around the minimum that separates it from the maximum. The minimum weightloop is computed by simply comparing the weights of loops defined by each separating non-tree edge. The non-treeedges are classified based on an algorithm described by Edelsbrunner et al. (2003a). This algorithm performs repeatedcollapses to classify edges: at each step remove a triangle, two of whose edges are either tree edges or marked, anddeclare the third edge as marked. This leaves all the separating edges unmarked.
2.4. Hierarchical segmentation
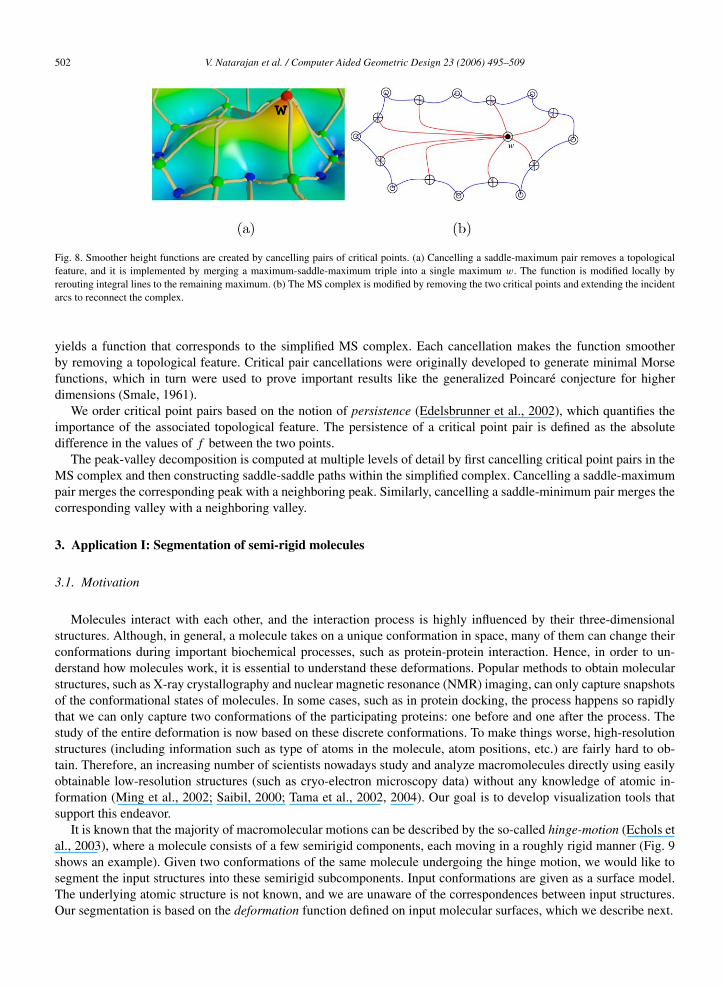
A major advantage of using the MS complex as a starting point for segmentation is that we can segment the surfaceat multiple levels of detail. A smoother Morse function can be generated from f by repeated cancellation of pairs ofcritical points that are connected by an arc in the MS complex. Upon cancellation, a saddle-extremum pair is removedfrom the MS complex along with arcs incident on the critical pair. New arcs are added to reconnect the complex.Fig. 8 shows how the MS complex from Fig. 2 is modified after cancelling a saddle-maximum pair. Cancellationcan be implemented as a purely combinatorial procedure that simplifies the MS complex. A numerical realizationof the cancellation requires a local modification of the function and its gradient field. We utilize the combinatorialstructure of the simplified MS complex to identify the neighborhood of the critical pair where the function needs tobe modified. Repeated application of a Laplacian smoothing operator within each of the quads in this neighborhood
502 V. Natarajan et al. / Computer Aided Geometric Design 23 (2006) 495–509
Fig. 8. Smoother height functions are created by cancelling pairs of critical points. (a) Cancelling a saddle-maximum pair removes a topologicalfeature, and it is implemented by merging a maximum-saddle-maximum triple into a single maximum w. The function is modified locally byrerouting integral lines to the remaining maximum. (b) The MS complex is modified by removing the two critical points and extending the incidentarcs to reconnect the complex.
yields a function that corresponds to the simplified MS complex. Each cancellation makes the function smootherby removing a topological feature. Critical pair cancellations were originally developed to generate minimal Morsefunctions, which in turn were used to prove important results like the generalized Poincaré conjecture for higherdimensions (Smale, 1961).
We order critical point pairs based on the notion of persistence (Edelsbrunner et al., 2002), which quantifies theimportance of the associated topological feature. The persistence of a critical point pair is defined as the absolutedifference in the values of f between the two points.
The peak-valley decomposition is computed at multiple levels of detail by first cancelling critical point pairs in theMS complex and then constructing saddle-saddle paths within the simplified complex. Cancelling a saddle-maximumpair merges the corresponding peak with a neighboring peak. Similarly, cancelling a saddle-minimum pair merges thecorresponding valley with a neighboring valley.
3. Application I: Segmentation of semi-rigid molecules
3.1. Motivation
Molecules interact with each other, and the interaction process is highly influenced by their three-dimensionalstructures. Although, in general, a molecule takes on a unique conformation in space, many of them can change theirconformations during important biochemical processes, such as protein-protein interaction. Hence, in order to un-derstand how molecules work, it is essential to understand these deformations. Popular methods to obtain molecularstructures, such as X-ray crystallography and nuclear magnetic resonance (NMR) imaging, can only capture snapshotsof the conformational states of molecules. In some cases, such as in protein docking, the process happens so rapidlythat we can only capture two conformations of the participating proteins: one before and one after the process. Thestudy of the entire deformation is now based on these discrete conformations. To make things worse, high-resolutionstructures (including information such as type of atoms in the molecule, atom positions, etc.) are fairly hard to ob-tain. Therefore, an increasing number of scientists nowadays study and analyze macromolecules directly using easilyobtainable low-resolution structures (such as cryo-electron microscopy data) without any knowledge of atomic in-formation (Ming et al., 2002; Saibil, 2000; Tama et al., 2002, 2004). Our goal is to develop visualization tools thatsupport this endeavor.
It is known that the majority of macromolecular motions can be described by the so-called hinge-motion (Echols etal., 2003), where a molecule consists of a few semirigid components, each moving in a roughly rigid manner (Fig. 9shows an example). Given two conformations of the same molecule undergoing the hinge motion, we would like tosegment the input structures into these semirigid subcomponents. Input conformations are given as a surface model.The underlying atomic structure is not known, and we are unaware of the correspondences between input structures.Our segmentation is based on the deformation function defined on input molecular surfaces, which we describe next.
V. Natarajan et al. / Computer Aided Geometric Design 23 (2006) 495–509 503
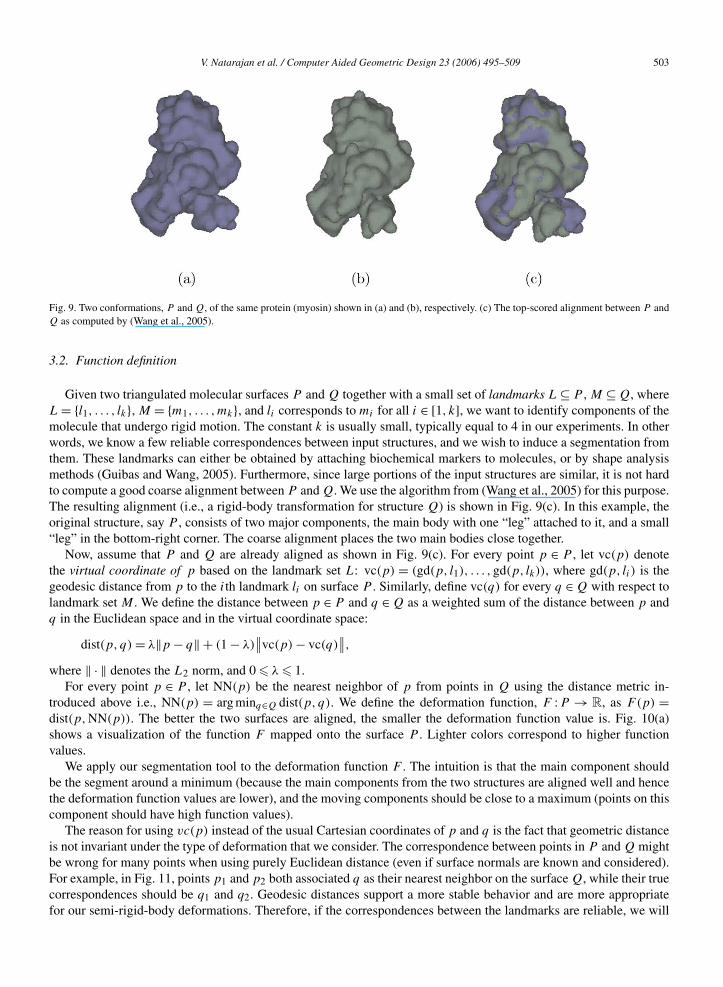
Fig. 9. Two conformations, P and Q, of the same protein (myosin) shown in (a) and (b), respectively. (c) The top-scored alignment between P andQ as computed by (Wang et al., 2005).
3.2. Function definition
Given two triangulated molecular surfaces P and Q together with a small set of landmarks L ⊆ P , M ⊆ Q, whereL = {l1, . . . , lk}, M = {m1, . . . ,mk}, and li corresponds to mi for all i ∈ [1, k], we want to identify components of themolecule that undergo rigid motion. The constant k is usually small, typically equal to 4 in our experiments. In otherwords, we know a few reliable correspondences between input structures, and we wish to induce a segmentation fromthem. These landmarks can either be obtained by attaching biochemical markers to molecules, or by shape analysismethods (Guibas and Wang, 2005). Furthermore, since large portions of the input structures are similar, it is not hardto compute a good coarse alignment between P and Q. We use the algorithm from (Wang et al., 2005) for this purpose.The resulting alignment (i.e., a rigid-body transformation for structure Q) is shown in Fig. 9(c). In this example, theoriginal structure, say P , consists of two major components, the main body with one “leg” attached to it, and a small“leg” in the bottom-right corner. The coarse alignment places the two main bodies close together.
Now, assume that P and Q are already aligned as shown in Fig. 9(c). For every point p ∈ P , let vc(p) denotethe virtual coordinate of p based on the landmark set L: vc(p) = (gd(p, l1), . . . ,gd(p, lk)), where gd(p, li) is thegeodesic distance from p to the ith landmark li on surface P . Similarly, define vc(q) for every q ∈ Q with respect tolandmark set M . We define the distance between p ∈ P and q ∈ Q as a weighted sum of the distance between p andq in the Euclidean space and in the virtual coordinate space:
dist(p, q) = λ‖p − q‖ + (1 − λ)∥∥vc(p) − vc(q)
∥∥,
where ‖ · ‖ denotes the L2 norm, and 0 � λ � 1.For every point p ∈ P , let NN(p) be the nearest neighbor of p from points in Q using the distance metric in-
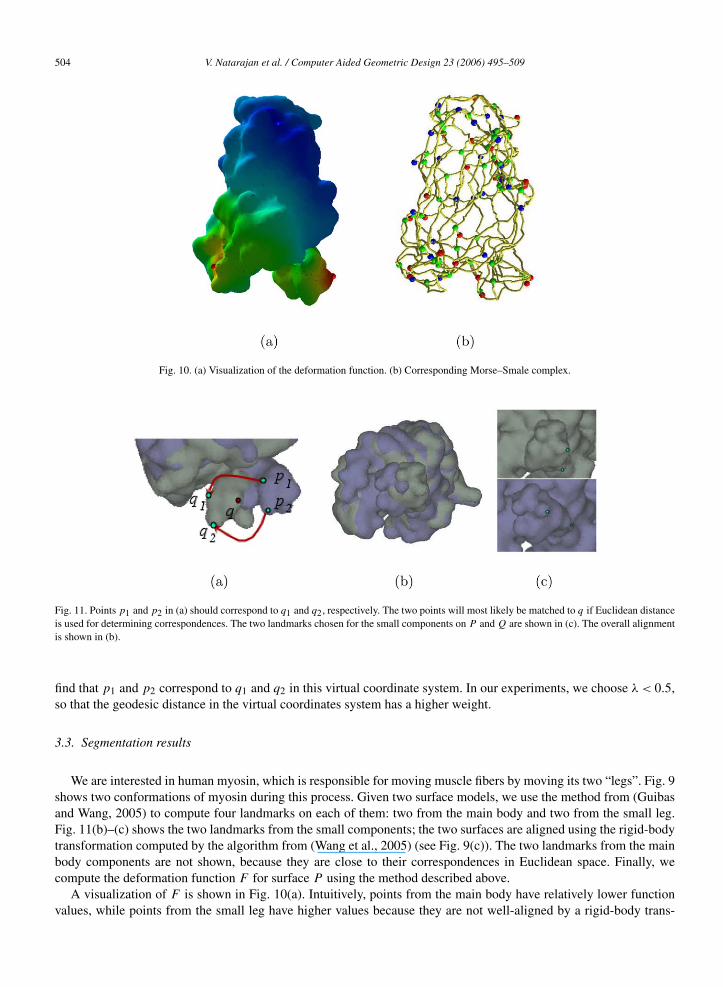
troduced above i.e., NN(p) = arg minq∈Q dist(p, q). We define the deformation function, F :P → R, as F(p) =dist(p,NN(p)). The better the two surfaces are aligned, the smaller the deformation function value is. Fig. 10(a)shows a visualization of the function F mapped onto the surface P . Lighter colors correspond to higher functionvalues.
We apply our segmentation tool to the deformation function F . The intuition is that the main component shouldbe the segment around a minimum (because the main components from the two structures are aligned well and hencethe deformation function values are lower), and the moving components should be close to a maximum (points on thiscomponent should have high function values).
The reason for using vc(p) instead of the usual Cartesian coordinates of p and q is the fact that geometric distanceis not invariant under the type of deformation that we consider. The correspondence between points in P and Q mightbe wrong for many points when using purely Euclidean distance (even if surface normals are known and considered).For example, in Fig. 11, points p1 and p2 both associated q as their nearest neighbor on the surface Q, while their truecorrespondences should be q1 and q2. Geodesic distances support a more stable behavior and are more appropriatefor our semi-rigid-body deformations. Therefore, if the correspondences between the landmarks are reliable, we will
504 V. Natarajan et al. / Computer Aided Geometric Design 23 (2006) 495–509
Fig. 10. (a) Visualization of the deformation function. (b) Corresponding Morse–Smale complex.
Fig. 11. Points p1 and p2 in (a) should correspond to q1 and q2, respectively. The two points will most likely be matched to q if Euclidean distanceis used for determining correspondences. The two landmarks chosen for the small components on P and Q are shown in (c). The overall alignmentis shown in (b).
find that p1 and p2 correspond to q1 and q2 in this virtual coordinate system. In our experiments, we choose λ < 0.5,so that the geodesic distance in the virtual coordinates system has a higher weight.
3.3. Segmentation results
We are interested in human myosin, which is responsible for moving muscle fibers by moving its two “legs”. Fig. 9shows two conformations of myosin during this process. Given two surface models, we use the method from (Guibasand Wang, 2005) to compute four landmarks on each of them: two from the main body and two from the small leg.Fig. 11(b)–(c) shows the two landmarks from the small components; the two surfaces are aligned using the rigid-bodytransformation computed by the algorithm from (Wang et al., 2005) (see Fig. 9(c)). The two landmarks from the mainbody components are not shown, because they are close to their correspondences in Euclidean space. Finally, wecompute the deformation function F for surface P using the method described above.
A visualization of F is shown in Fig. 10(a). Intuitively, points from the main body have relatively lower functionvalues, while points from the small leg have higher values because they are not well-aligned by a rigid-body trans-
V. Natarajan et al. / Computer Aided Geometric Design 23 (2006) 495–509 505
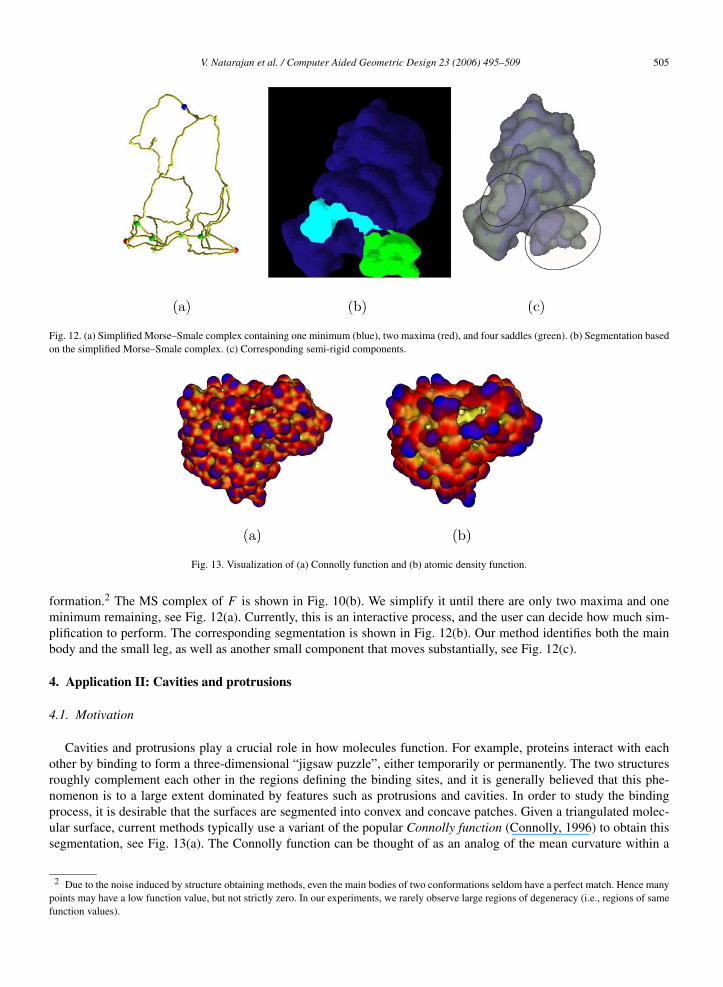
Fig. 12. (a) Simplified Morse–Smale complex containing one minimum (blue), two maxima (red), and four saddles (green). (b) Segmentation basedon the simplified Morse–Smale complex. (c) Corresponding semi-rigid components.
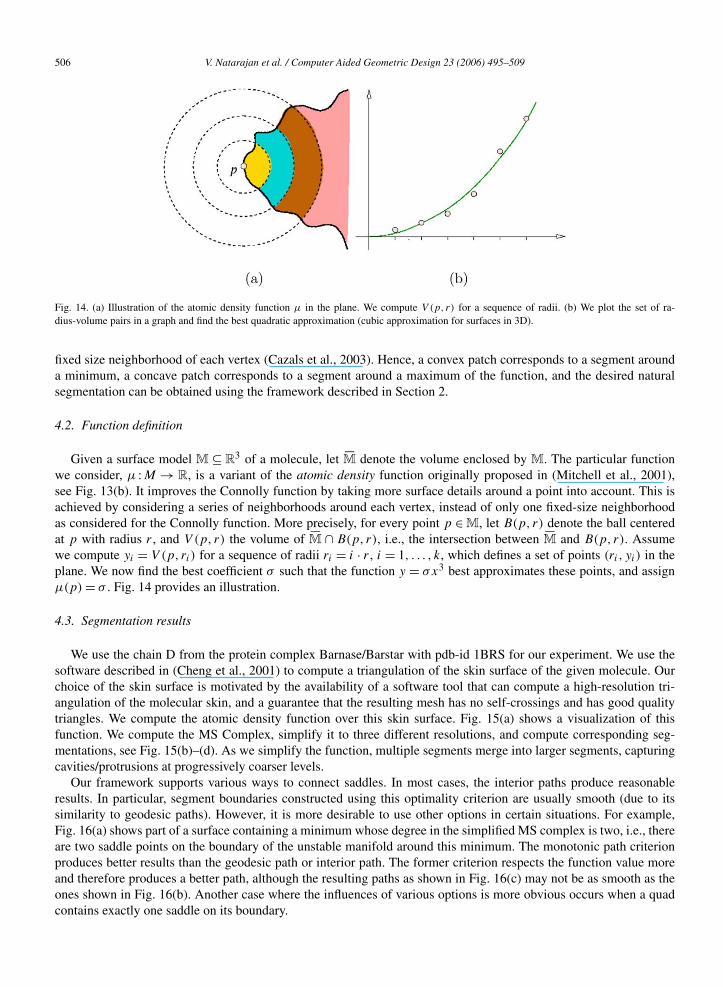
Fig. 13. Visualization of (a) Connolly function and (b) atomic density function.
formation.2 The MS complex of F is shown in Fig. 10(b). We simplify it until there are only two maxima and oneminimum remaining, see Fig. 12(a). Currently, this is an interactive process, and the user can decide how much sim-plification to perform. The corresponding segmentation is shown in Fig. 12(b). Our method identifies both the mainbody and the small leg, as well as another small component that moves substantially, see Fig. 12(c).
4. Application II: Cavities and protrusions
4.1. Motivation
Cavities and protrusions play a crucial role in how molecules function. For example, proteins interact with eachother by binding to form a three-dimensional “jigsaw puzzle”, either temporarily or permanently. The two structuresroughly complement each other in the regions defining the binding sites, and it is generally believed that this phe-nomenon is to a large extent dominated by features such as protrusions and cavities. In order to study the bindingprocess, it is desirable that the surfaces are segmented into convex and concave patches. Given a triangulated molec-ular surface, current methods typically use a variant of the popular Connolly function (Connolly, 1996) to obtain thissegmentation, see Fig. 13(a). The Connolly function can be thought of as an analog of the mean curvature within a
2 Due to the noise induced by structure obtaining methods, even the main bodies of two conformations seldom have a perfect match. Hence manypoints may have a low function value, but not strictly zero. In our experiments, we rarely observe large regions of degeneracy (i.e., regions of samefunction values).
506 V. Natarajan et al. / Computer Aided Geometric Design 23 (2006) 495–509
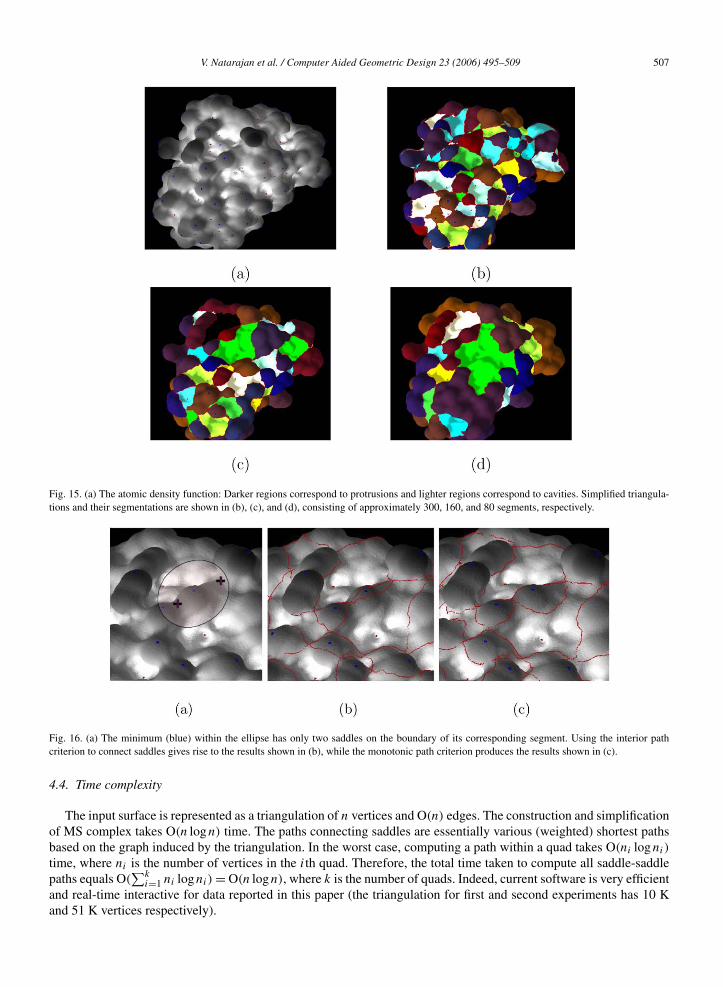
Fig. 14. (a) Illustration of the atomic density function μ in the plane. We compute V (p, r) for a sequence of radii. (b) We plot the set of ra-dius-volume pairs in a graph and find the best quadratic approximation (cubic approximation for surfaces in 3D).
fixed size neighborhood of each vertex (Cazals et al., 2003). Hence, a convex patch corresponds to a segment arounda minimum, a concave patch corresponds to a segment around a maximum of the function, and the desired naturalsegmentation can be obtained using the framework described in Section 2.
4.2. Function definition
Given a surface model M ⊆ R3 of a molecule, let �M denote the volume enclosed by M. The particular function
we consider, μ :M → R, is a variant of the atomic density function originally proposed in (Mitchell et al., 2001),see Fig. 13(b). It improves the Connolly function by taking more surface details around a point into account. This isachieved by considering a series of neighborhoods around each vertex, instead of only one fixed-size neighborhoodas considered for the Connolly function. More precisely, for every point p ∈ M, let B(p, r) denote the ball centeredat p with radius r , and V (p, r) the volume of �M ∩ B(p, r), i.e., the intersection between �M and B(p, r). Assumewe compute yi = V (p, ri) for a sequence of radii ri = i · r , i = 1, . . . , k, which defines a set of points (ri , yi) in theplane. We now find the best coefficient σ such that the function y = σx3 best approximates these points, and assignμ(p) = σ . Fig. 14 provides an illustration.
4.3. Segmentation results
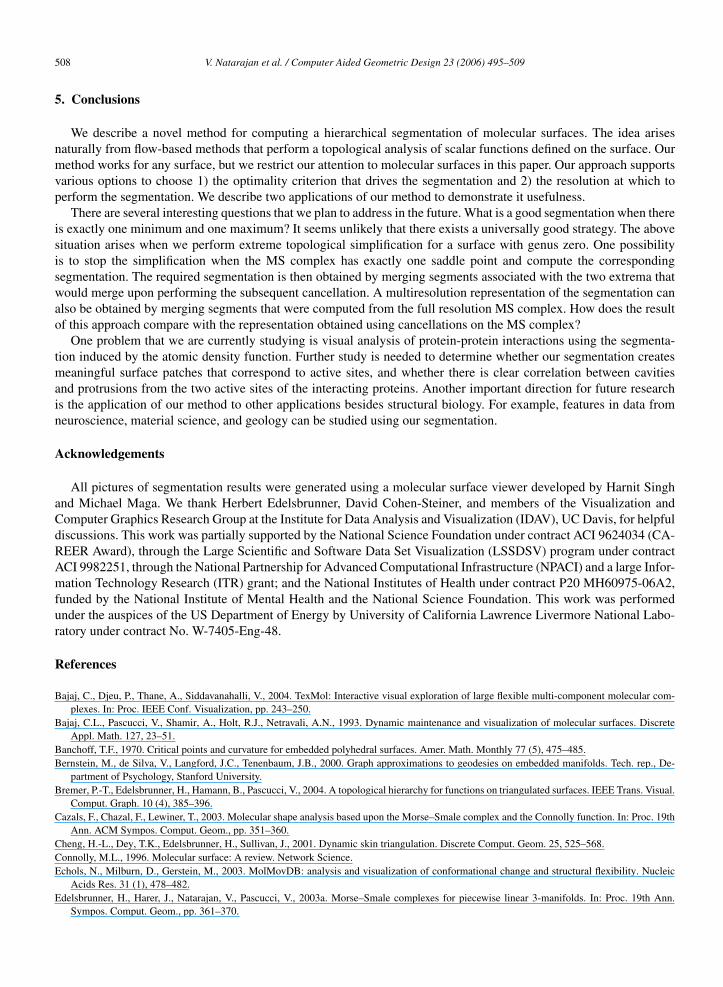
We use the chain D from the protein complex Barnase/Barstar with pdb-id 1BRS for our experiment. We use thesoftware described in (Cheng et al., 2001) to compute a triangulation of the skin surface of the given molecule. Ourchoice of the skin surface is motivated by the availability of a software tool that can compute a high-resolution tri-angulation of the molecular skin, and a guarantee that the resulting mesh has no self-crossings and has good qualitytriangles. We compute the atomic density function over this skin surface. Fig. 15(a) shows a visualization of thisfunction. We compute the MS Complex, simplify it to three different resolutions, and compute corresponding seg-mentations, see Fig. 15(b)–(d). As we simplify the function, multiple segments merge into larger segments, capturingcavities/protrusions at progressively coarser levels.
Our framework supports various ways to connect saddles. In most cases, the interior paths produce reasonableresults. In particular, segment boundaries constructed using this optimality criterion are usually smooth (due to itssimilarity to geodesic paths). However, it is more desirable to use other options in certain situations. For example,Fig. 16(a) shows part of a surface containing a minimum whose degree in the simplified MS complex is two, i.e., thereare two saddle points on the boundary of the unstable manifold around this minimum. The monotonic path criterionproduces better results than the geodesic path or interior path. The former criterion respects the function value moreand therefore produces a better path, although the resulting paths as shown in Fig. 16(c) may not be as smooth as theones shown in Fig. 16(b). Another case where the influences of various options is more obvious occurs when a quadcontains exactly one saddle on its boundary.
V. Natarajan et al. / Computer Aided Geometric Design 23 (2006) 495–509 507
Fig. 15. (a) The atomic density function: Darker regions correspond to protrusions and lighter regions correspond to cavities. Simplified triangula-tions and their segmentations are shown in (b), (c), and (d), consisting of approximately 300, 160, and 80 segments, respectively.
Fig. 16. (a) The minimum (blue) within the ellipse has only two saddles on the boundary of its corresponding segment. Using the interior pathcriterion to connect saddles gives rise to the results shown in (b), while the monotonic path criterion produces the results shown in (c).
4.4. Time complexity
The input surface is represented as a triangulation of n vertices and O(n) edges. The construction and simplificationof MS complex takes O(n logn) time. The paths connecting saddles are essentially various (weighted) shortest pathsbased on the graph induced by the triangulation. In the worst case, computing a path within a quad takes O(ni logni)
time, where ni is the number of vertices in the ith quad. Therefore, the total time taken to compute all saddle-saddlepaths equals O(
∑ki=1 ni logni) = O(n logn), where k is the number of quads. Indeed, current software is very efficient
and real-time interactive for data reported in this paper (the triangulation for first and second experiments has 10 Kand 51 K vertices respectively).
508 V. Natarajan et al. / Computer Aided Geometric Design 23 (2006) 495–509
5. Conclusions
We describe a novel method for computing a hierarchical segmentation of molecular surfaces. The idea arisesnaturally from flow-based methods that perform a topological analysis of scalar functions defined on the surface. Ourmethod works for any surface, but we restrict our attention to molecular surfaces in this paper. Our approach supportsvarious options to choose 1) the optimality criterion that drives the segmentation and 2) the resolution at which toperform the segmentation. We describe two applications of our method to demonstrate it usefulness.
There are several interesting questions that we plan to address in the future. What is a good segmentation when thereis exactly one minimum and one maximum? It seems unlikely that there exists a universally good strategy. The abovesituation arises when we perform extreme topological simplification for a surface with genus zero. One possibilityis to stop the simplification when the MS complex has exactly one saddle point and compute the correspondingsegmentation. The required segmentation is then obtained by merging segments associated with the two extrema thatwould merge upon performing the subsequent cancellation. A multiresolution representation of the segmentation canalso be obtained by merging segments that were computed from the full resolution MS complex. How does the resultof this approach compare with the representation obtained using cancellations on the MS complex?
One problem that we are currently studying is visual analysis of protein-protein interactions using the segmenta-tion induced by the atomic density function. Further study is needed to determine whether our segmentation createsmeaningful surface patches that correspond to active sites, and whether there is clear correlation between cavitiesand protrusions from the two active sites of the interacting proteins. Another important direction for future researchis the application of our method to other applications besides structural biology. For example, features in data fromneuroscience, material science, and geology can be studied using our segmentation.
Acknowledgements
All pictures of segmentation results were generated using a molecular surface viewer developed by Harnit Singhand Michael Maga. We thank Herbert Edelsbrunner, David Cohen-Steiner, and members of the Visualization andComputer Graphics Research Group at the Institute for Data Analysis and Visualization (IDAV), UC Davis, for helpfuldiscussions. This work was partially supported by the National Science Foundation under contract ACI 9624034 (CA-REER Award), through the Large Scientific and Software Data Set Visualization (LSSDSV) program under contractACI 9982251, through the National Partnership for Advanced Computational Infrastructure (NPACI) and a large Infor-mation Technology Research (ITR) grant; and the National Institutes of Health under contract P20 MH60975-06A2,funded by the National Institute of Mental Health and the National Science Foundation. This work was performedunder the auspices of the US Department of Energy by University of California Lawrence Livermore National Labo-ratory under contract No. W-7405-Eng-48.
References
Bajaj, C., Djeu, P., Thane, A., Siddavanahalli, V., 2004. TexMol: Interactive visual exploration of large flexible multi-component molecular com-plexes. In: Proc. IEEE Conf. Visualization, pp. 243–250.
Bajaj, C.L., Pascucci, V., Shamir, A., Holt, R.J., Netravali, A.N., 1993. Dynamic maintenance and visualization of molecular surfaces. DiscreteAppl. Math. 127, 23–51.
Banchoff, T.F., 1970. Critical points and curvature for embedded polyhedral surfaces. Amer. Math. Monthly 77 (5), 475–485.Bernstein, M., de Silva, V., Langford, J.C., Tenenbaum, J.B., 2000. Graph approximations to geodesies on embedded manifolds. Tech. rep., De-
partment of Psychology, Stanford University.Bremer, P.-T., Edelsbrunner, H., Hamann, B., Pascucci, V., 2004. A topological hierarchy for functions on triangulated surfaces. IEEE Trans. Visual.
Comput. Graph. 10 (4), 385–396.Cazals, F., Chazal, F., Lewiner, T., 2003. Molecular shape analysis based upon the Morse–Smale complex and the Connolly function. In: Proc. 19th
Ann. ACM Sympos. Comput. Geom., pp. 351–360.Cheng, H.-L., Dey, T.K., Edelsbrunner, H., Sullivan, J., 2001. Dynamic skin triangulation. Discrete Comput. Geom. 25, 525–568.Connolly, M.L., 1996. Molecular surface: A review. Network Science.Echols, N., Milburn, D., Gerstein, M., 2003. MolMovDB: analysis and visualization of conformational change and structural flexibility. Nucleic
Acids Res. 31 (1), 478–482.Edelsbrunner, H., Harer, J., Natarajan, V., Pascucci, V., 2003a. Morse–Smale complexes for piecewise linear 3-manifolds. In: Proc. 19th Ann.
Sympos. Comput. Geom., pp. 361–370.

V. Natarajan et al. / Computer Aided Geometric Design 23 (2006) 495–509 509
Edelsbrunner, H., Harer, J., Zomorodian, A., 2003b. Hierarchical Morse–Smale complexes for piecewise linear 2-manifolds. Discrete Comput.Geom. 30 (1), 87–107.
Edelsbrunner, H., Letscher, D., Zomorodian, A., 2002. Topological persistence and simplification. Discrete Comput. Geom. 28 (4), 511–533.Forman, R., 1998. Morse theory for cell complexes. Adv. in Math. 134, 90–145.Guibas, L., Wang, Y., 2005. Segmenting low resolution macro-molecular structures under hinge motion. Manuscript.Hilaga, M., Shinagawa, Y., Komura, T., Kunii, T.L., 2001. Topology matching for full automatic similarity estimation of 3d shapes. In: Proc.
SIGGRAPH, pp. 203–212.Leach, A.R., 1996. Molecular Modelling: Principles and Applications. Pearson Education Limited.Mangan, A.P., Whitaker, R.T., 1999. Partitioning 3d surface meshes using watershed segmentation. IEEE Trans. Visual. Comput. Graph. 5 (4),
308–321.Matsumoto, Y., 2002. An Introduction to Morse Theory. Amer. Math. Soc. Translated from Japanese by K. Hudson and M. Saito.Milnor, J., 1963. Morse Theory. Princeton Univ. Press, Princeton, NJ.Ming, D., Kong, Y., Lambert, M.A., Huang, Z., Ma, J., 2002. How to describe protein motion without amino acid sequence and atomic coordinates.
Proc. Natl. Acad. Sci. USA 99 (13), 8620–8625.Mitchell, J.C., Kerr, R., Eyck, L.F.T., 2001. Rapid atomic density measures for molecular shape characterization. J. Mol. Graph. Model. 19, 324–
329.Natarajan, V., Pascucci, V., 2005. Volumetric data analysis using Morse–Smale complexes. In: Proc. Intl. Conf. Shape Modeling and Applications,
pp. 320–325.Richards, F.M., 1977. Areas, volumes, packing and protein structure. Annu. Rev. Biophys. Bioeng. 6, 151–176.Saibil, H.R., 2000. Conformational changes studied by cryo-electron microscopy. Nat. Struct. Biol. 7 (9), 711–714.Shamir, A., 2004. A formulation of boundary mesh segmentation. In: Second International Symposium on 3D Data Processing, Visualization and
Transmission (3DPVT’04), pp. 82–89.Smale, S., 1961. Generalized Poincaré’s conjecture in dimensions greater than four. Ann. of Math. 74, 391–406.Srinark, T., Kambhamettu, C., 2003. A novel method for 3d surface mesh segmentation. In: Proc. 6th IASTED International Conference on
Computers, Graphics, and Imaging, pp. 212–217.Tama, E., Miyashita, O., Brooks III, C.L., 2004. Normal mode based flexible fitting of high-resolution structure into low-resolution experimental
data from cryo-EM. J. Struct. Biol. 147 (3), 315–326.Tama, E., Wriggers, W., Brooks III, C.L., 2002. Exploring global distortions of biological macromolecules and assemblies from low-resolution
structural information and elastic network theory. J. Mol. Biol. 321 (2), 297–305.Taylor, W.R., May, A.C.W., Brown, N.P., Aszodi, A., 2001. Protein structure: geometry, topology and classification. Rep. Progr. Phys. 64, 517–590.Vivodtzev, F., Linsen, L., Bonneau, G.-P., Hamann, B., Joy, K.I., Olshausen, B.A., 2003. Hierarchical isosurface segmentation based on discrete
curvature. In: VISSYM ’03: Proceedings of the Symposium on Data Visualisation, pp. 249–258.Voorintholt, R., Kosters, M.T., Vegter, G., Vriend, G., Hoi, W.G., 1989. A very fast program for visualizing protein surfaces, channels and cavities.
J. Molecular Graph. 7 (4), 243–245.Wang, Y., Agarwal, P., Brown, P., Edelsbrunner, H., Rudolph, J., 2005. Fast geometric algorithm for rigid protein docking. In: Proc. 10th. Pacific
Symposium on Biocomputing (PSB), pp. 64–75.
Related Documents