9/30/2013 1 Seed Driven ‘Resting State’ Functional Connectivity Susan Whitfield-Gabrieli MIT Outline • Seed driven resting state functional connectivity: rs-fcMRI • Treatment of noise • Current debates in the field (respiration/anticorrelations) • Compcor method /Anticorrelation experiment • Motion and Artifacts • Introduction to functional conn toolbox

Welcome message from author
This document is posted to help you gain knowledge. Please leave a comment to let me know what you think about it! Share it to your friends and learn new things together.
Transcript
9/30/2013
1
Seed Driven ‘Resting State’Functional Connectivity
Susan Whitfield-GabrieliMIT
Outline
• Seed driven resting state functional connectivity: rs-fcMRI
• Treatment of noise
• Current debates in the field (respiration/anticorrelations)
• Compcor method /Anticorrelation experiment
• Motion and Artifacts
• Introduction to functional conn toolbox
9/30/2013
2
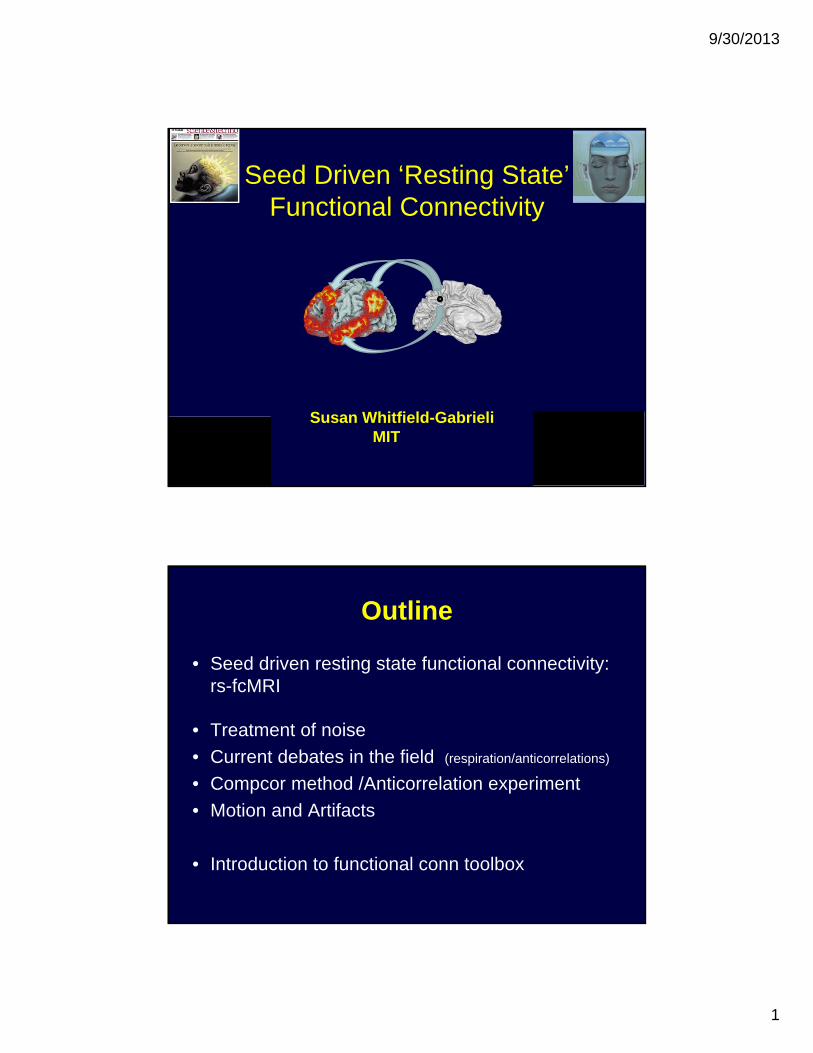
Structure – Function RelationshipsFunctional Segregation
• Univariate analyses of regionally specific effects
Identification of local regions thatare specialized for a particular task
Functional integration• Multivariate analyses of regional
interactionsIdentification of interactionsbetween regions that allow integrated function
Experimentally designed input
SPM
MODEL-FREE
Exploratory
Data Driven
No Causation
Whole brain connectivity
MODEL-DEPENDENT
Confirmatory
Hypothesis driven
Causal directions
Reduced set of regions
Functional connectivity= the temporal correlation between
spatially remote areas
Effective connectivity= the influence one area exerts over another
Functional integrationsubdivided into:
9/30/2013
3
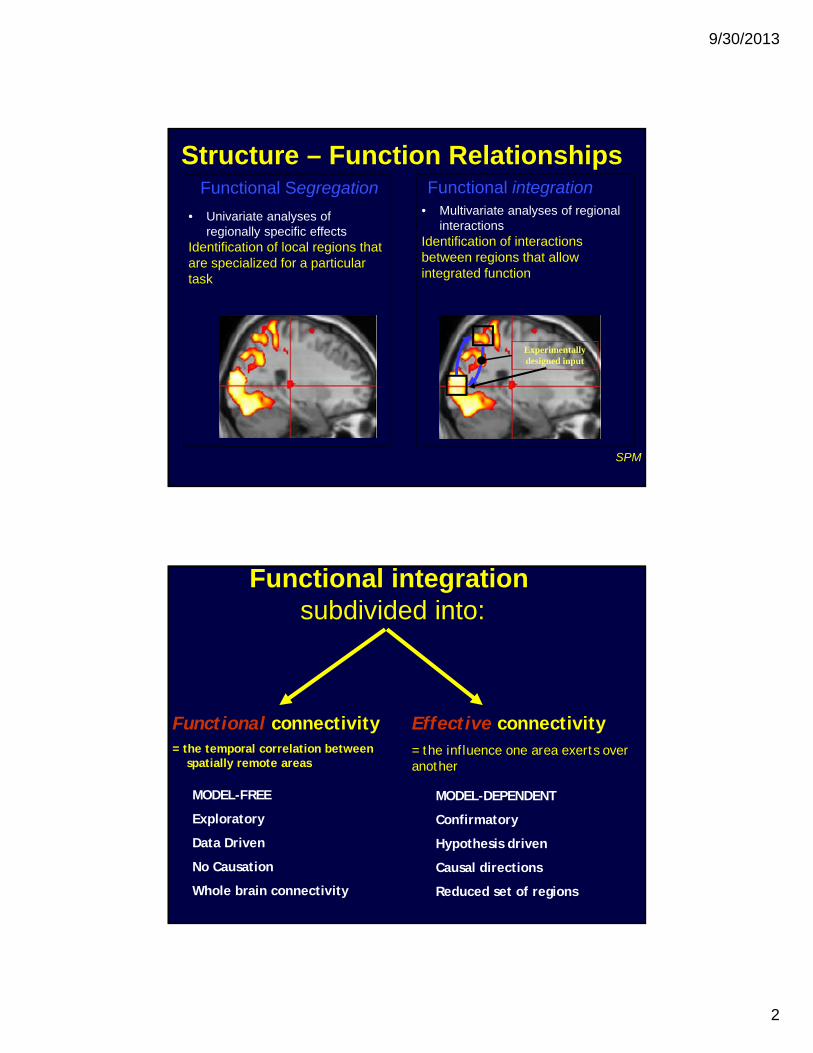
Connectivity Analysis Methods
• Functional Connectivity
- PCA/ICA (principal/independent component analyses)- Pairwise ROI Correlations- Seed driven connectivity **Estimates maps showing temporal correlations between the BOLD signal from a given seed and that at every brain voxel
- Graph analyses
• Effective Connectivity
- PPI (psycho-physiological interactions)- SEM (structural equation models)- MAR (multivariate autoregressive models)- Granger Causality - DCM (dynamic causal models)
Resting State Networks
Spontaneous, low-frequency fluctuations in the fMRI BOLD that exhibit specific networks of the human brain in the absence of over task.
(Biswal 1995, Lowe 2000, ,Greicius 2003, Fox 2005)

9/30/2013
4
Frequency Bands
Buzsaki , Science 2004[.025 .06], toolbox cutoff [.009 .08]
Resting State Network Characteristics
• Low Frequency ( < .1 Hz)• Reliable, robust and exists in infants, anesthesia, primates
• Task-independent: Relevant for understanding clinical & pediatric populations (bypass ceiling, floor & practice effects)
• Allows exploration of individual differences (e.g., Predict clinical outcome: identify which patients will respond to which treatments -Used as surrogate outcome measure for drug development or assessment of interventions)
• Easy to acquire and share data (Biswal in press PNAS, NYU )
(Large data sets can provide quantitative phenotypes for molecular genetic studies and biomarkers of developmental and pathological processes in the brain)
9/30/2013
5
rs –fcMRI ApplicationsResting state functional connectivity can reveal intrinsic, spontaneous
networks which can help us understand the basic functional organization of the brain:
a) Used to illustrate that the brain is intrinsically organized into dynamic “anticorrelated” functional networks (Fox 2005)
b) ROIs based on correlations in spontaneous fluctuations of the BOLD signal can predict localization of task-related functional responses. (Vincent et al 2006).
c) Used to functionally dissociate functionally and anatomically herterogeneous regions of interest (Margulies 2007 (ACC) , Roy 2009 (Amygdala) )
d) Used to delineate functional topography of the brain: sharp transitions in correlation patterns may be used to determine functional boundaries across cortex (Cohen 2008).
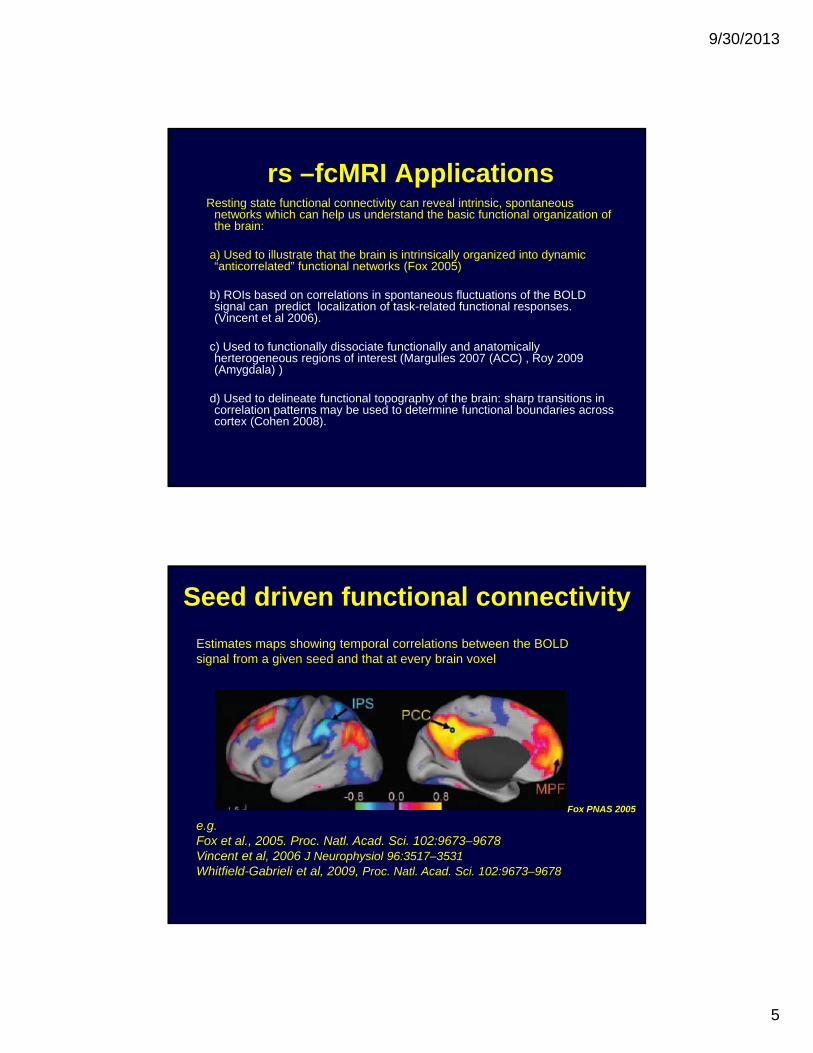
Estimates maps showing temporal correlations between the BOLD signal from a given seed and that at every brain voxel
e.g. Fox et al., 2005. Proc. Natl. Acad. Sci. 102:9673–9678Vincent et al, 2006 J Neurophysiol 96:3517–3531.Whitfield-Gabrieli et al, 2009, Proc. Natl. Acad. Sci. 102:9673–9678
Seed driven functional connectivity
Fox PNAS 2005
9/30/2013
6
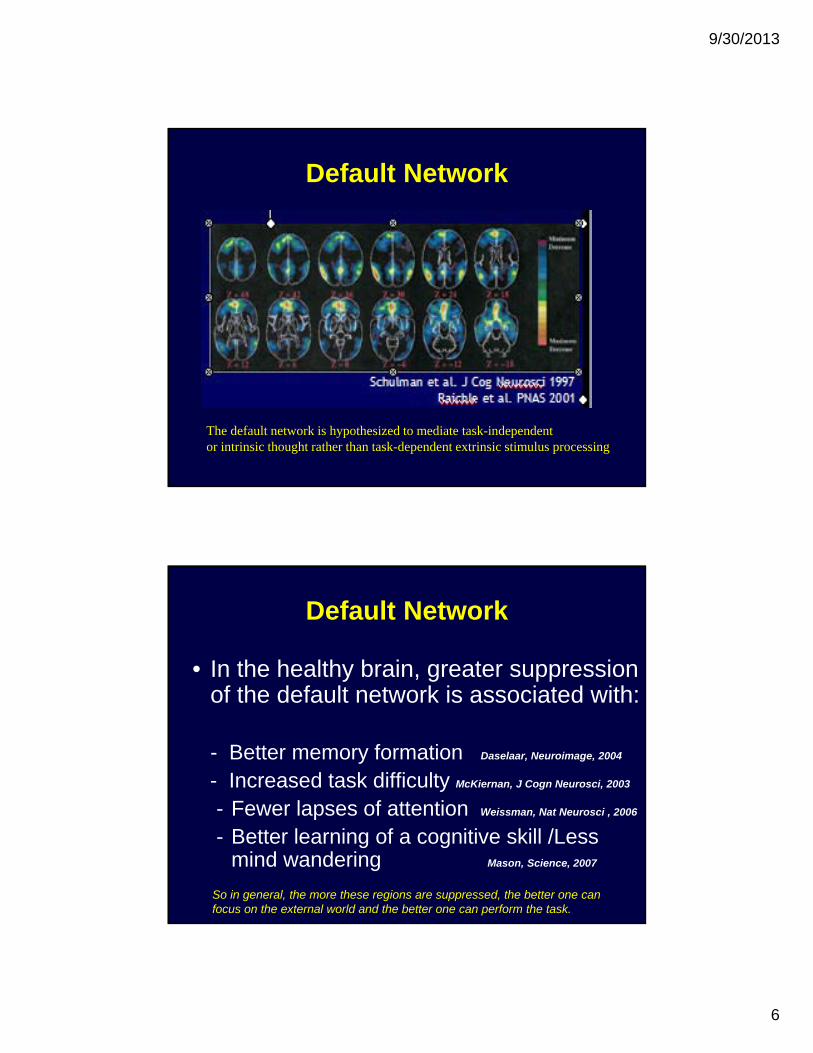
Default Network
The default network is hypothesized to mediate task-independent or intrinsic thought rather than task-dependent extrinsic stimulus processing
Default Network
• In the healthy brain, greater suppression of the default network is associated with:
- Better memory formation Daselaar, Neuroimage, 2004
- Increased task difficulty McKiernan, J Cogn Neurosci, 2003
- Fewer lapses of attention Weissman, Nat Neurosci , 2006
- Better learning of a cognitive skill /Less mind wandering Mason, Science, 2007
So in general, the more these regions are suppressed, the better one canfocus on the external world and the better one can perform the task.
9/30/2013
7
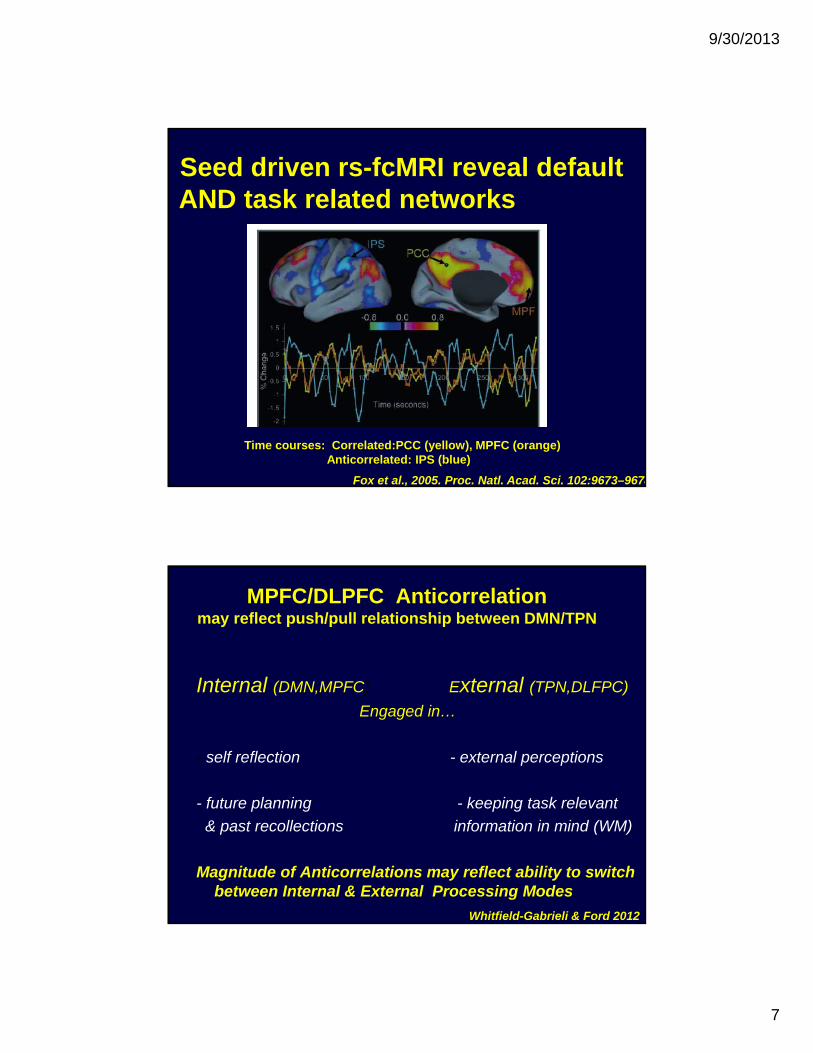
Time courses: Correlated:PCC (yellow), MPFC (orange)Anticorrelated: IPS (blue)
Fox et al., 2005. Proc. Natl. Acad. Sci. 102:9673–9678
Seed driven rs-fcMRI reveal defaultAND task related networks
MPFC/DLPFC Anticorrelation may reflect push/pull relationship between DMN/TPN
Internal (DMN,MPFC) External (TPN,DLFPC)
Engaged in…
- self reflection - external perceptions
- future planning - keeping task relevant
& past recollections information in mind (WM)
Magnitude of Anticorrelations may reflect ability to switch between Internal & External Processing Modes
Whitfield-Gabrieli & Ford 2012
9/30/2013
8
Connectivity Maps Depend on Seed Location:
Flaw or Feature?
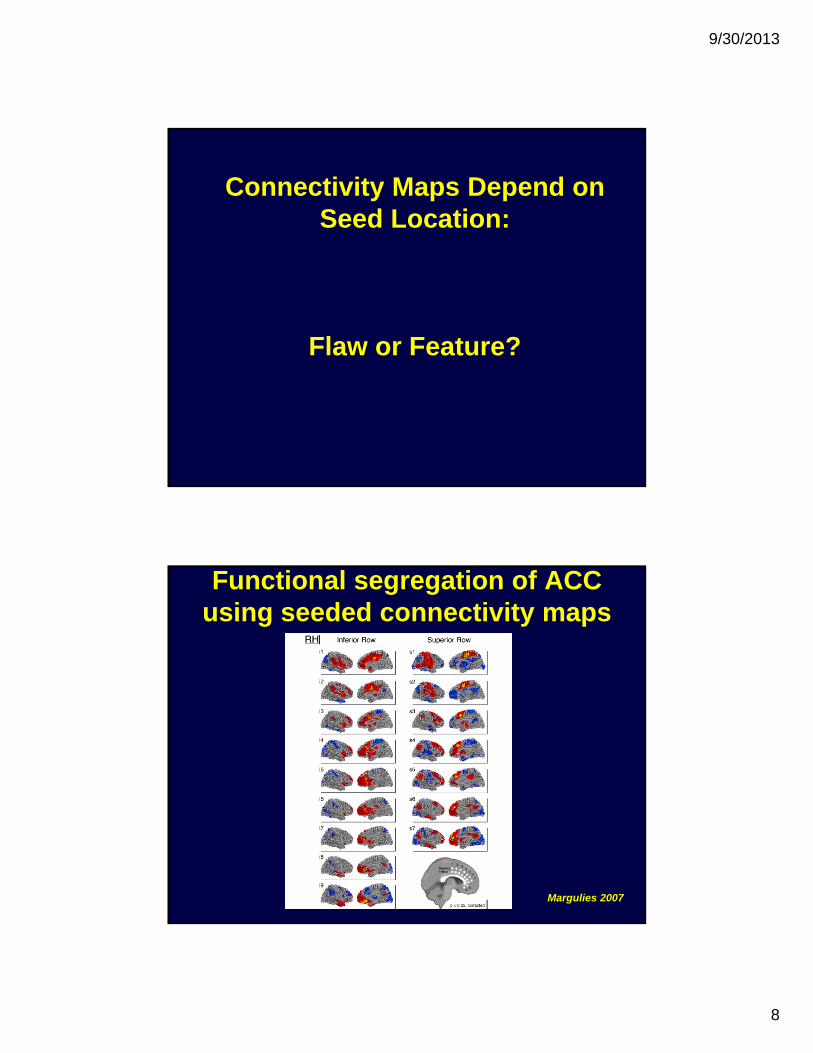
Functional segregation of ACC using seeded connectivity maps
Margulies 2007
9/30/2013
9
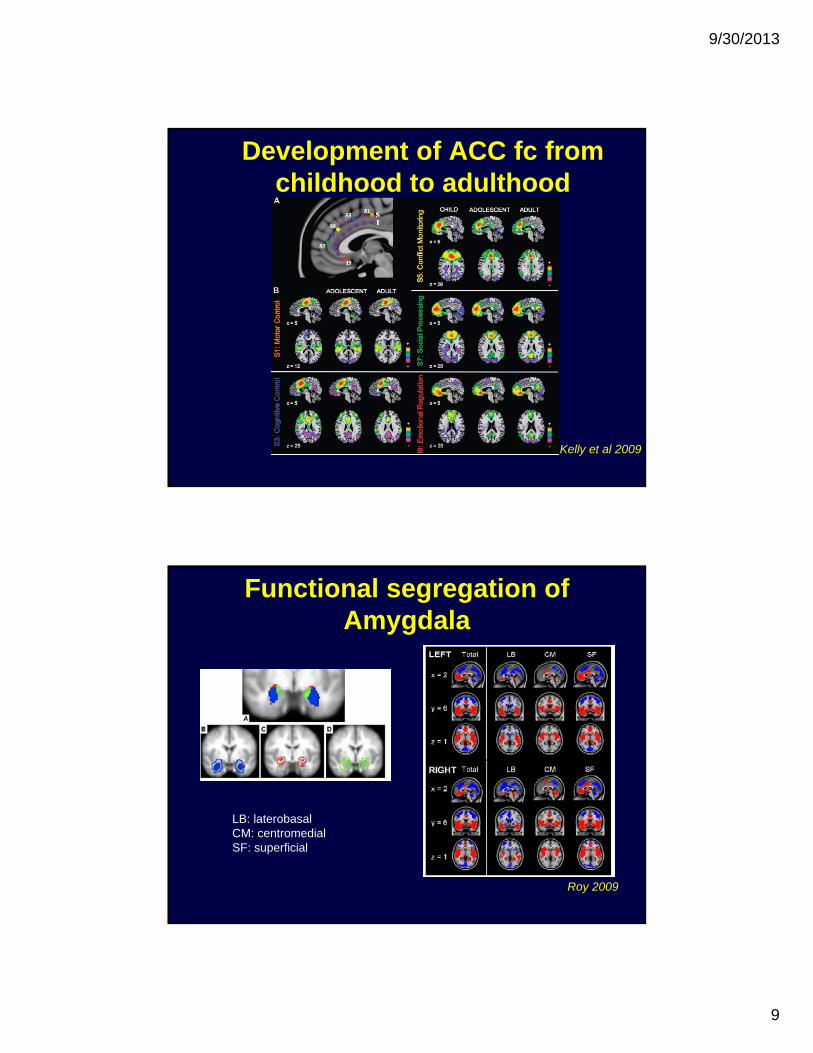
Development of ACC fc from childhood to adulthood
Kelly et al 2009
Functional segregation of Amygdala
Roy 2009
LB: laterobasalCM: centromedial SF: superficial
9/30/2013
10
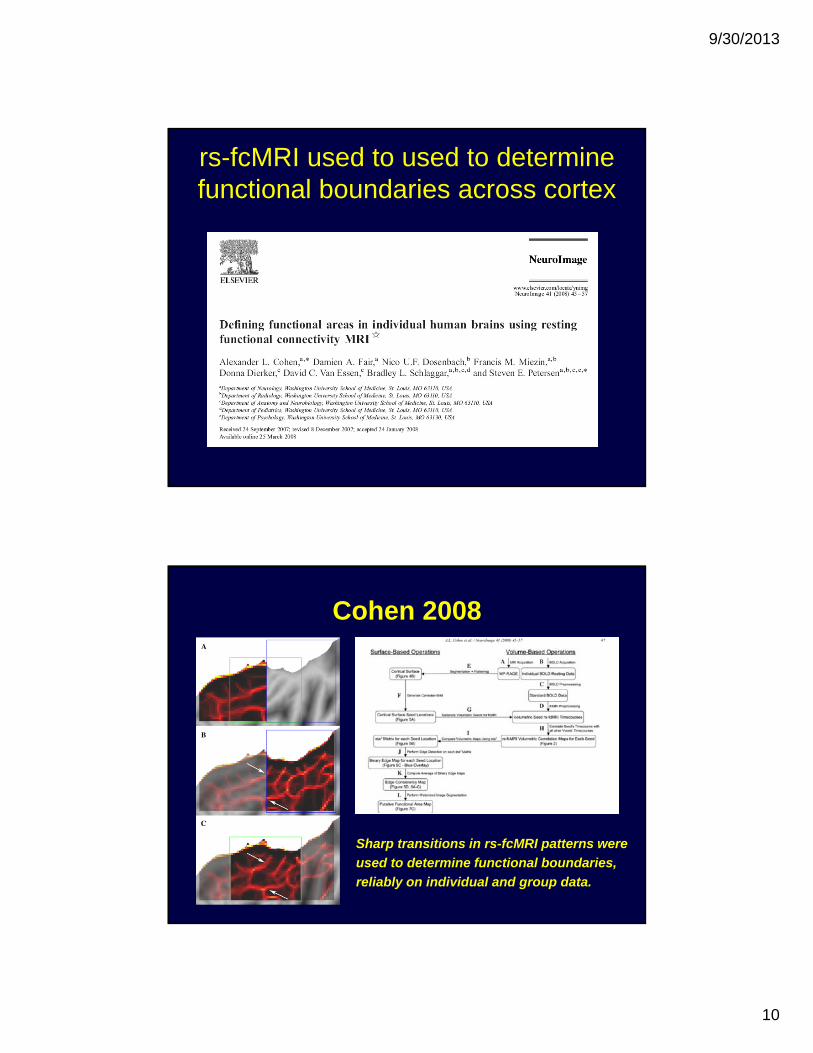
rs-fcMRI used to used to determine functional boundaries across cortex
Cohen 2008
Sharp transitions in rs-fcMRI patterns were
used to determine functional boundaries,
reliably on individual and group data.

9/30/2013
11
Clinical Characterization
Cingulate-Precuneus Interactions:A New Locus of Dysfunction in ADHD:ADHD decreases in Precuneus/ACCConnectivity. Also, ADHD decreases in connectivity among precuneus andother default network componentsCastellanos 2008
Increased default functional connectivityin patients with major depression*subgenual ACC
Greicius, Biological Psychiatry, 2007
Whitfield-Gabrieli, PNAS 2009
Increased default connectivityin schizophrenia, correlates with psychopathology
Clinical PredictionResting State HyperConnectivity with Amygdala
Whitfield-Gabrieli, 2013, in prep
9/30/2013
12
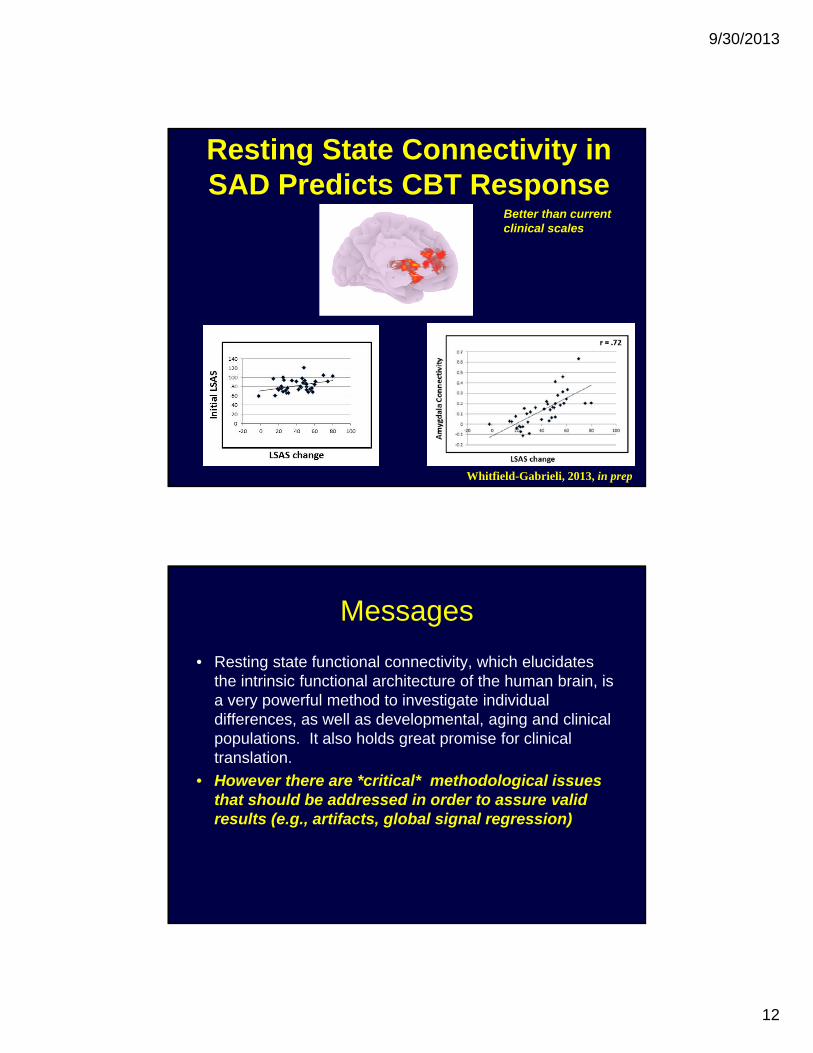
Resting State Connectivity in SAD Predicts CBT Response
r = .38
Whitfield-Gabrieli, 2013, in prep
Better than current clinical scales
Messages
• Resting state functional connectivity, which elucidates the intrinsic functional architecture of the human brain, is a very powerful method to investigate individual differences, as well as developmental, aging and clinical populations. It also holds great promise for clinical translation.
• However there are *critical* methodological issues that should be addressed in order to assure valid results (e.g., artifacts, global signal regression).
9/30/2013
13
Outline
• Seed driven functional connectivity
• Resting state seed driven functional connectivity: rs-fcMRI
• Treatment of noise
• Current debates in the field (respiration/anticorrelations)
• Compcor method
• Introduction to functional conn toolbox
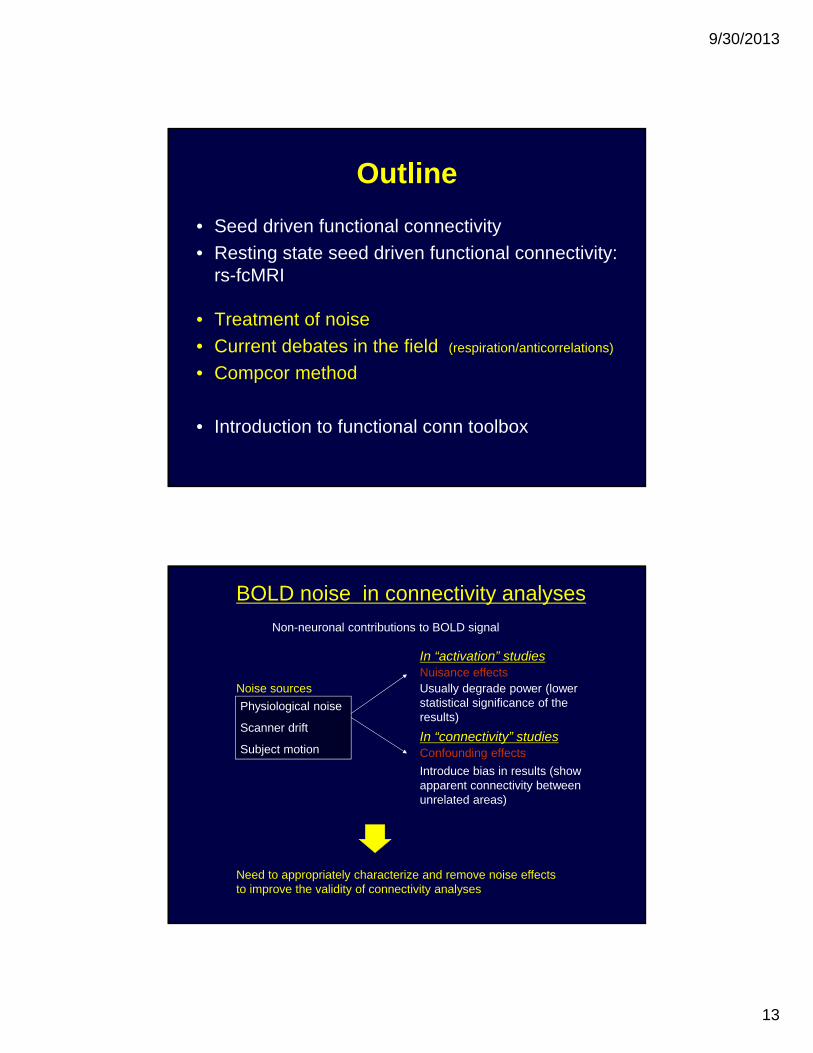
Physiological noise
Scanner drift
Subject motion
Nuisance effects
Confounding effects
In “activation” studies
In “connectivity” studies
Introduce bias in results (show apparent connectivity between unrelated areas)
Usually degrade power (lower statistical significance of the results)
BOLD noise in connectivity analyses
Noise sources
Need to appropriately characterize and remove noise effects to improve the validity of connectivity analyses
Non-neuronal contributions to BOLD signal
9/30/2013
14
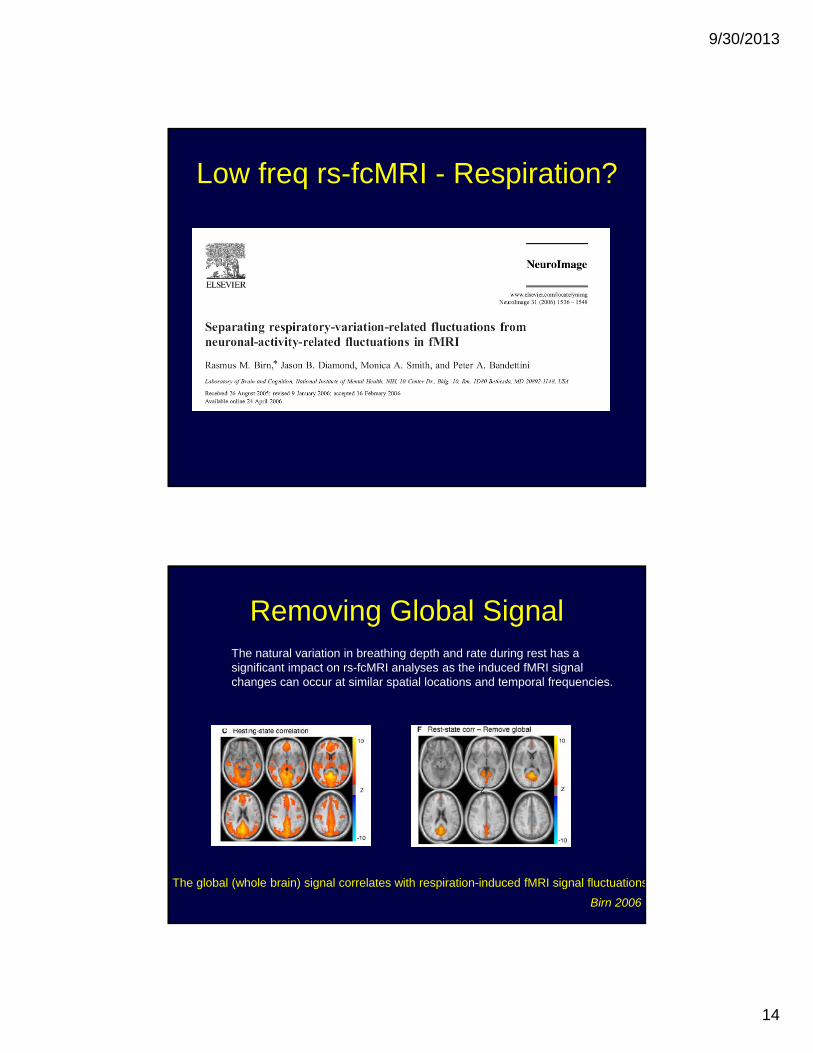
Low freq rs-fcMRI - Respiration?
Removing Global Signal
Birn 2006
The natural variation in breathing depth and rate during rest has a significant impact on rs-fcMRI analyses as the induced fMRI signalchanges can occur at similar spatial locations and temporal frequencies.
The global (whole brain) signal correlates with respiration-induced fMRI signal fluctuations
9/30/2013
15
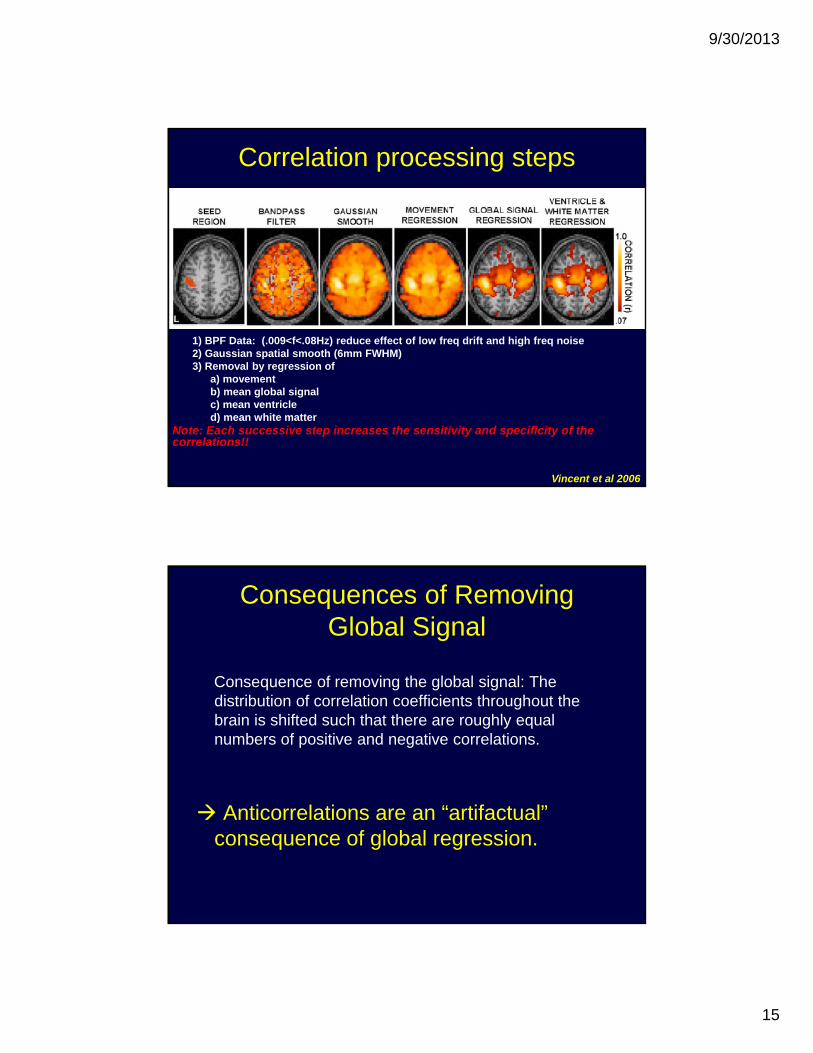
Correlation processing steps
Vincent et al 2006
1) BPF Data: (.009<f<.08Hz) reduce effect of low freq drift and high freq noise2) Gaussian spatial smooth (6mm FWHM)3) Removal by regression of
a) movement b) mean global signalc) mean ventricled) mean white matter
Note: Each successive step increases the sensitivity and specificity of the correlations!!
Consequences of Removing Global Signal
Consequence of removing the global signal: The distribution of correlation coefficients throughout the brain is shifted such that there are roughly equal numbers of positive and negative correlations.
Anticorrelations are an “artifactual” consequence of global regression.
9/30/2013
16
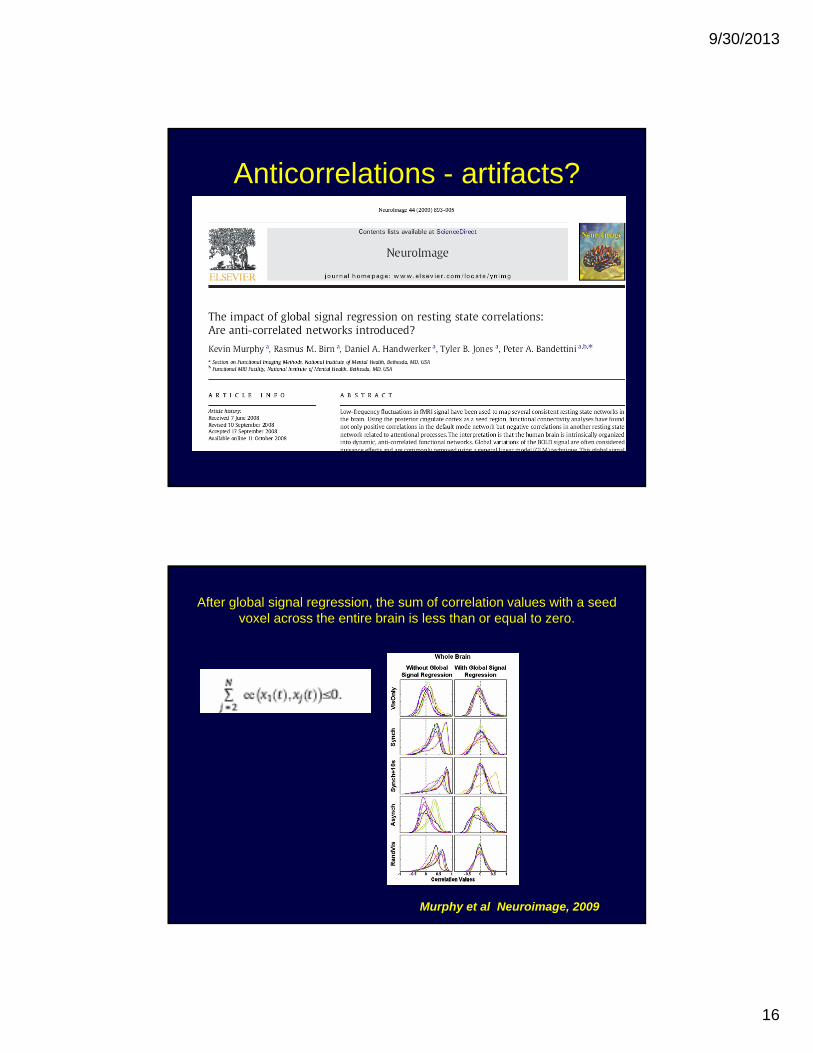
Anticorrelations - artifacts?
After global signal regression, the sum of correlation values with a seed voxel across the entire brain is less than or equal to zero.
Murphy et al Neuroimage, 2009
9/30/2013
17
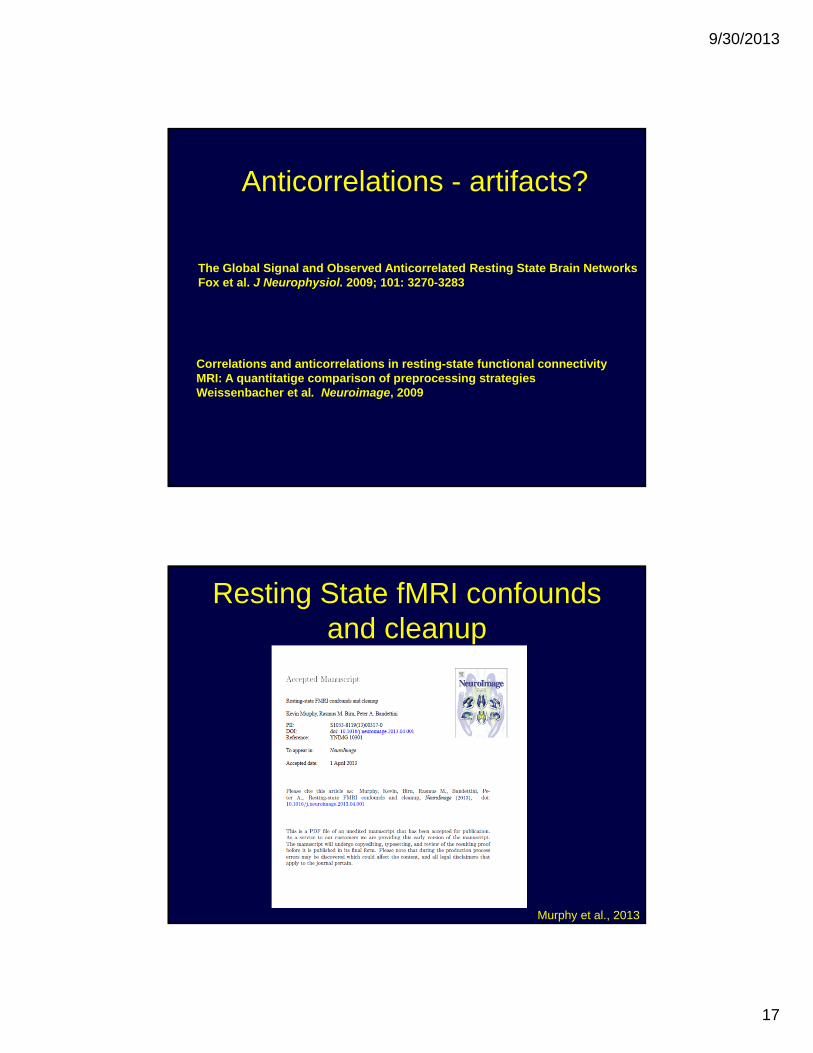
The Global Signal and Observed Anticorrelated Resting State Brain NetworksFox et al. J Neurophysiol. 2009; 101: 3270-3283
Correlations and anticorrelations in resting-state functional connectivityMRI: A quantitatige comparison of preprocessing strategiesWeissenbacher et al. Neuroimage, 2009
Anticorrelations - artifacts?
Resting State fMRI confounds and cleanup
Murphy et al., 2013
9/30/2013
18
CompCor Approach
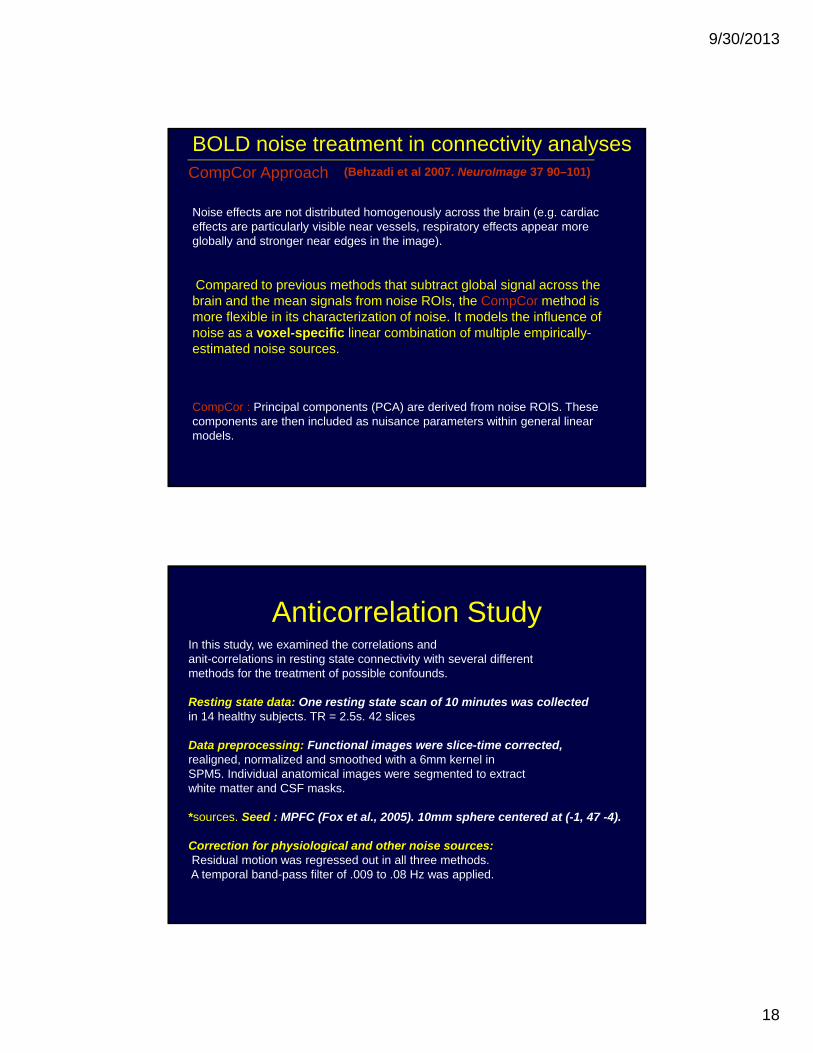
Noise effects are not distributed homogenously across the brain (e.g. cardiac effects are particularly visible near vessels, respiratory effects appear more globally and stronger near edges in the image).
Compared to previous methods that subtract global signal across the brain and the mean signals from noise ROIs, the CompCor method is more flexible in its characterization of noise. It models the influence of noise as a voxel-specific linear combination of multiple empirically-estimated noise sources.
CompCor : Principal components (PCA) are derived from noise ROIS. These components are then included as nuisance parameters within general linear models.
(Behzadi et al 2007. NeuroImage 37 90–101)
BOLD noise treatment in connectivity analyses
Anticorrelation StudyIn this study, we examined the correlations andanit-correlations in resting state connectivity with several differentmethods for the treatment of possible confounds.
Resting state data: One resting state scan of 10 minutes was collectedin 14 healthy subjects. TR = 2.5s. 42 slices
Data preprocessing: Functional images were slice-time corrected,realigned, normalized and smoothed with a 6mm kernel inSPM5. Individual anatomical images were segmented to extractwhite matter and CSF masks.
*sources. Seed : MPFC (Fox et al., 2005). 10mm sphere centered at (-1, 47 -4).
Correction for physiological and other noise sources:Residual motion was regressed out in all three methods.A temporal band-pass filter of .009 to .08 Hz was applied.
.
9/30/2013
19
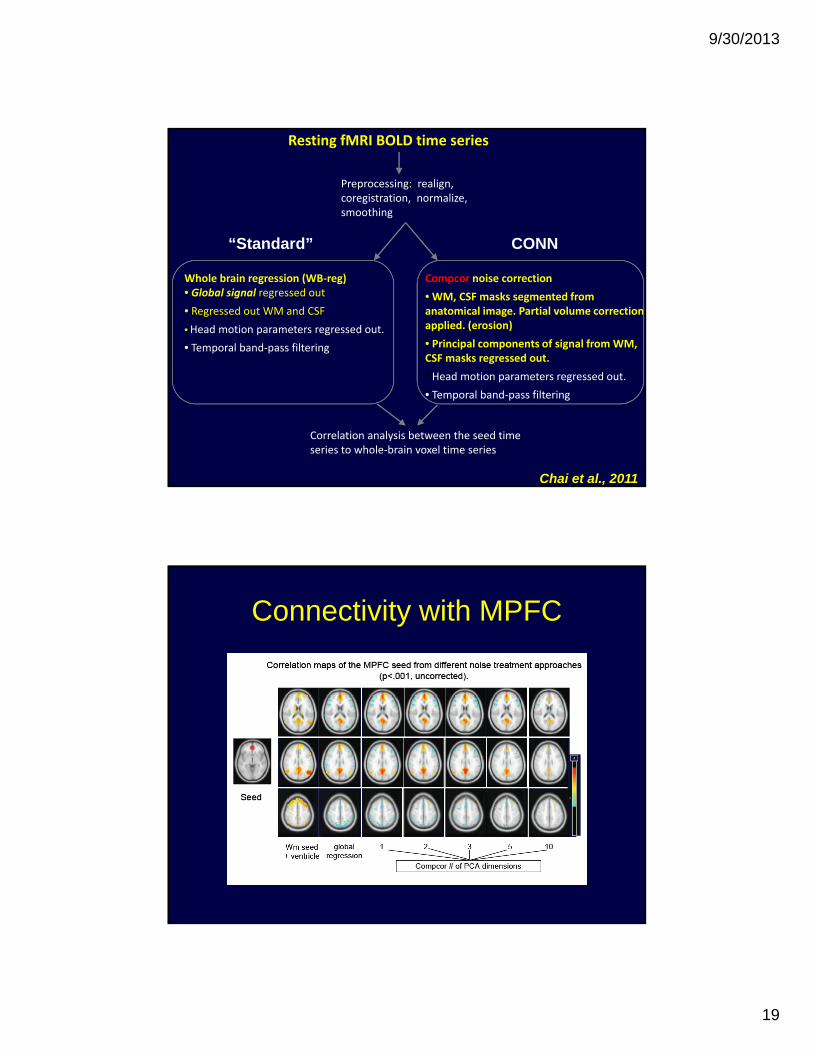
Resting fMRI BOLD time series
Preprocessing: realign, coregistration, normalize, smoothing
Whole brain regression (WB‐reg)• Global signal regressed out
• Regressed out WM and CSF
• Head motion parameters regressed out.
• Temporal band‐pass filtering
Compcor noise correction
• WM, CSF masks segmented from anatomical image. Partial volume correction applied. (erosion)
• Principal components of signal from WM, CSF masks regressed out.
• Head motion parameters regressed out.
• Temporal band‐pass filtering
Correlation analysis between the seed time series to whole‐brain voxel time series
“Standard” CONN
Chai et al., 2011
Connectivity with MPFC
9/30/2013
20
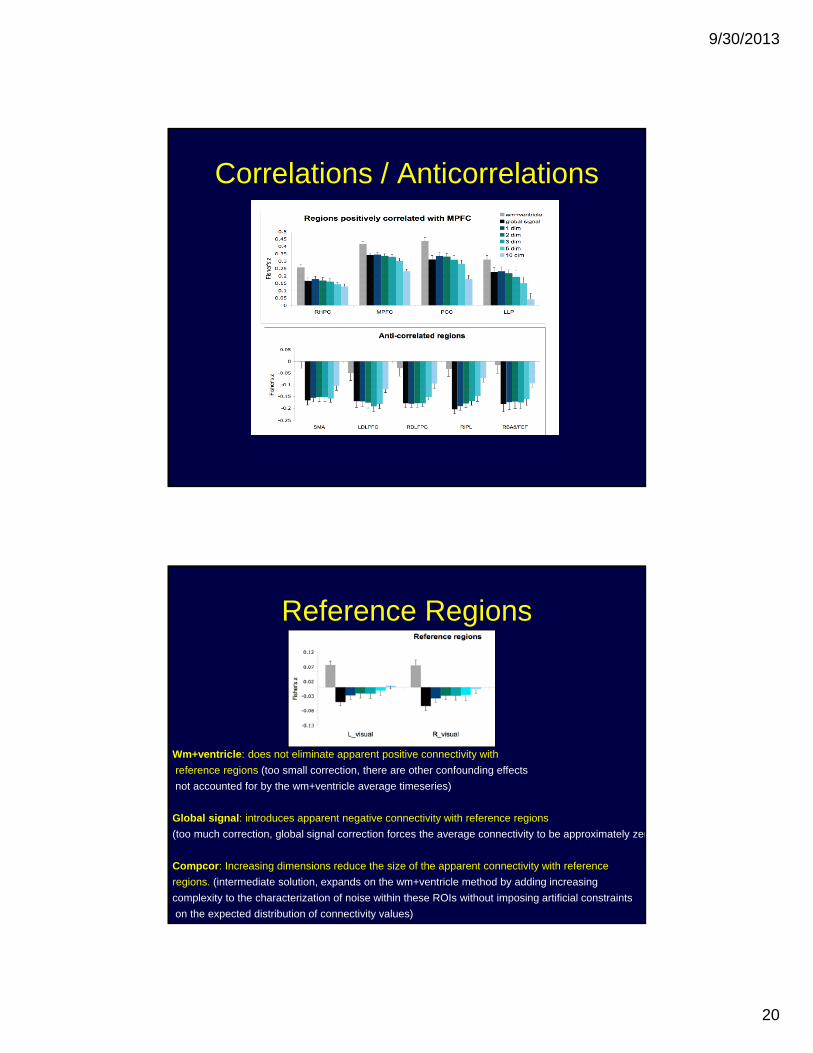
Correlations / Anticorrelations
Reference Regions
Wm+ventricle: does not eliminate apparent positive connectivity with
reference regions (too small correction, there are other confounding effects
not accounted for by the wm+ventricle average timeseries)
Global signal: introduces apparent negative connectivity with reference regions
(too much correction, global signal correction forces the average connectivity to be approximately zer
Compcor: Increasing dimensions reduce the size of the apparent connectivity with reference
regions. (intermediate solution, expands on the wm+ventricle method by adding increasing
complexity to the characterization of noise within these ROIs without imposing artificial constraints
on the expected distribution of connectivity values)
9/30/2013
21
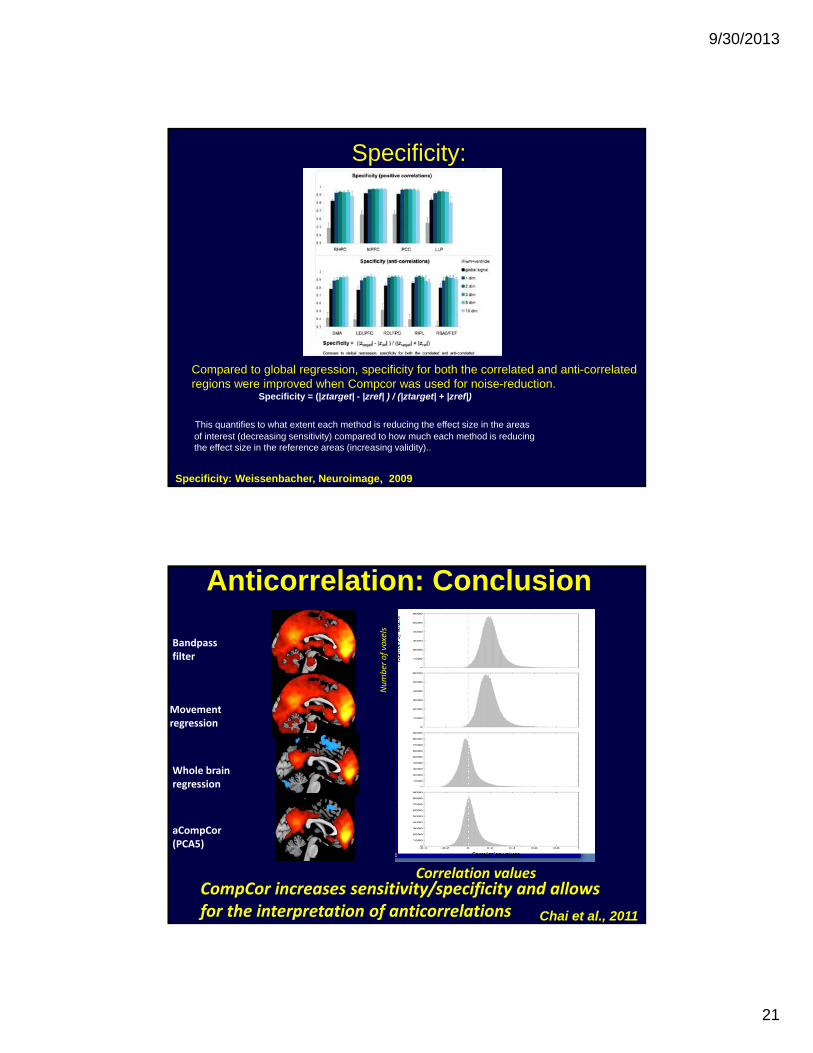
Specificity:
Compared to global regression, specificity for both the correlated and anti-correlatedregions were improved when Compcor was used for noise-reduction.
Specificity = (|ztarget| - |zref| ) / (|ztarget| + |zref|)
This quantifies to what extent each method is reducing the effect size in the areasof interest (decreasing sensitivity) compared to how much each method is reducingthe effect size in the reference areas (increasing validity)..
Specificity: Weissenbacher, Neuroimage, 2009
Movement regression
Whole brain regression
aCompCor(PCA5)
Bandpass filter
1.0
Correlation values
Number of voxels
Anticorrelation: Conclusion
CompCor increases sensitivity/specificity and allowsfor the interpretation of anticorrelations Chai et al., 2011
9/30/2013
22
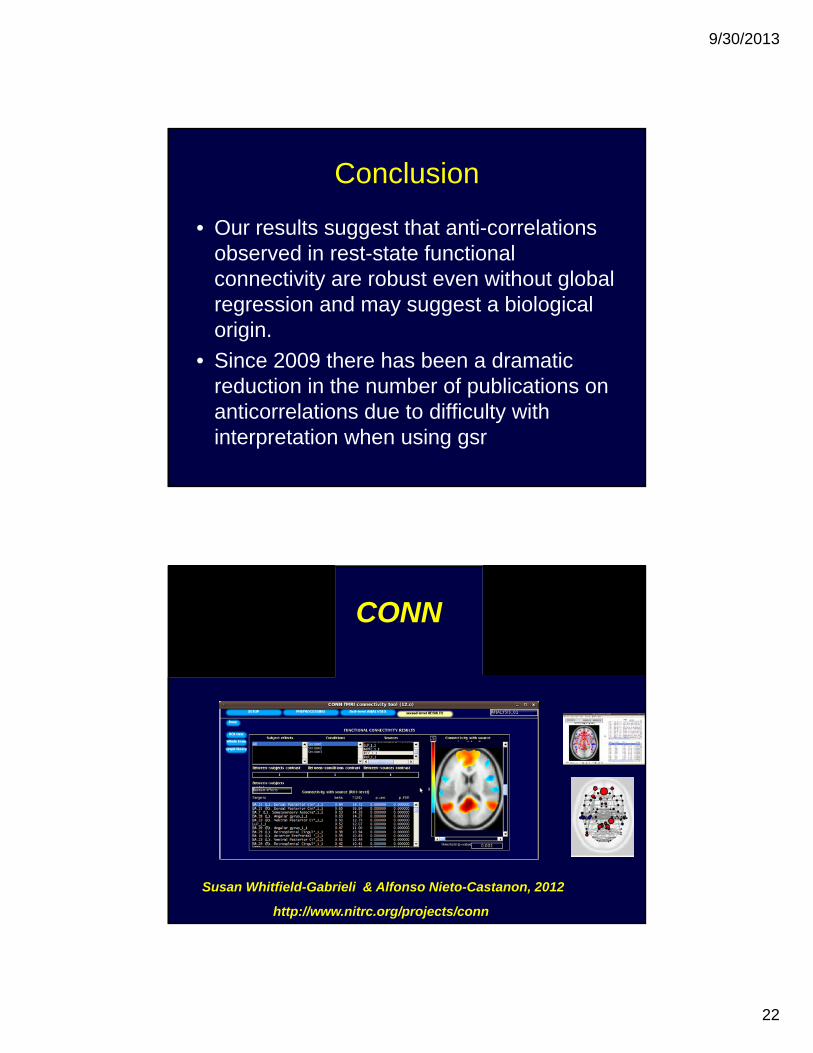
Conclusion
• Our results suggest that anti-correlations observed in rest-state functional connectivity are robust even without global regression and may suggest a biological origin.
• Since 2009 there has been a dramatic reduction in the number of publications on anticorrelations due to difficulty with interpretation when using gsr
CONN
Susan Whitfield-Gabrieli & Alfonso Nieto-Castanon, 2012
http://www.nitrc.org/projects/conn
9/30/2013
23
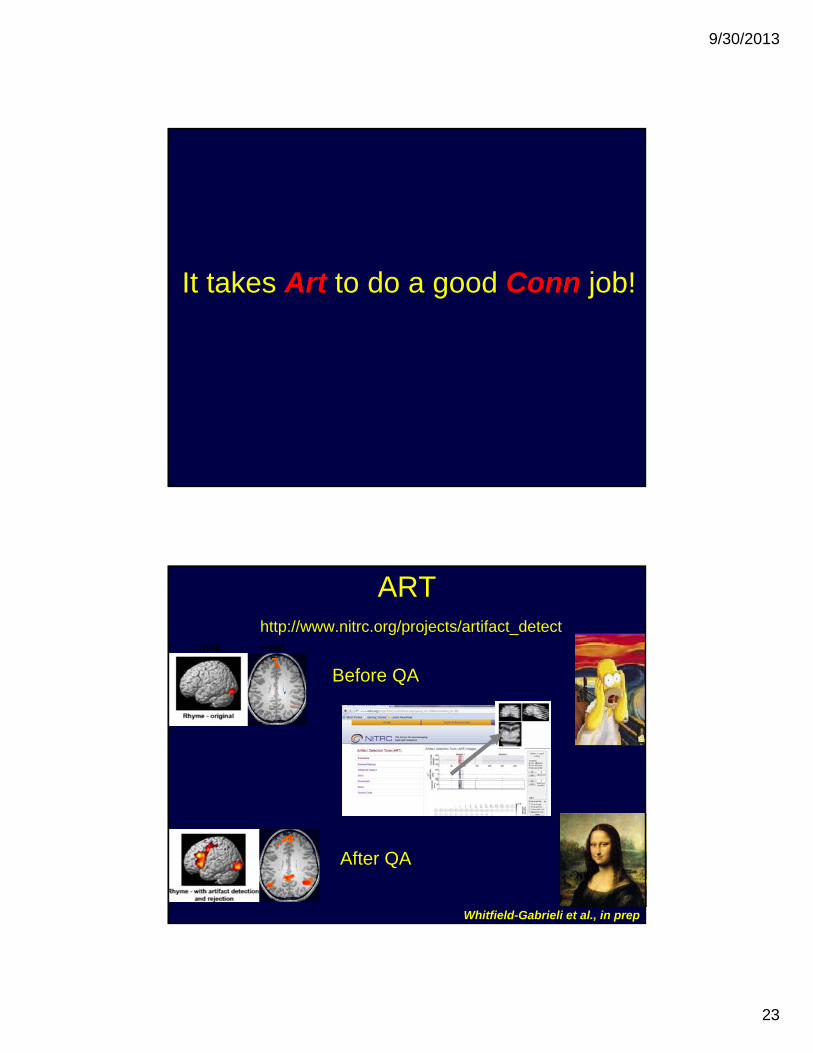
It takes Art to do a good Conn job!
ARThttp://www.nitrc.org/projects/artifact_detect
Whitfield-Gabrieli et al., in prep
Before QA
After QA
Task Rest

9/30/2013
24
The effect of motion
Comparisons between groups of individuals with subtly different levels of head motion yielded difference maps that could be mistaken for neuronal effects . These effects are important to consider when interpreting variation between groups and across individuals.
N = 1000, binned accordingto degree of motion
Group comparisons based on motion (n=1000)Group 1 (lowest 10% motion) > Group 10 (highest 10% motion)
(Van Dijk et al., 2012)
*5 and 6 that have Mean Motion estimates of 0.044 and 0.048 mmEven in this small range of motion, differences in head motion yield difference mapsthat could easily be mistaken for neuronal effects.
9/30/2013
25
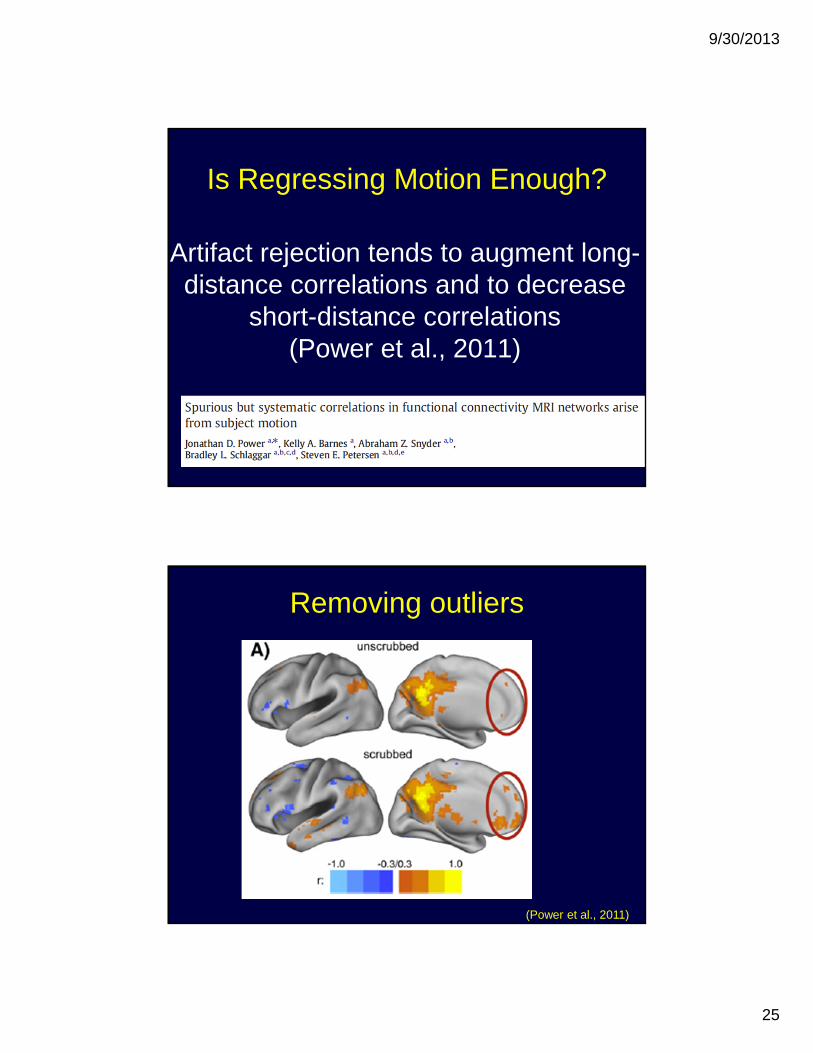
Artifact rejection tends to augment long-distance correlations and to decrease
short-distance correlations(Power et al., 2011)
Is Regressing Motion Enough?
Removing outliers
(Power et al., 2011)
9/30/2013
26
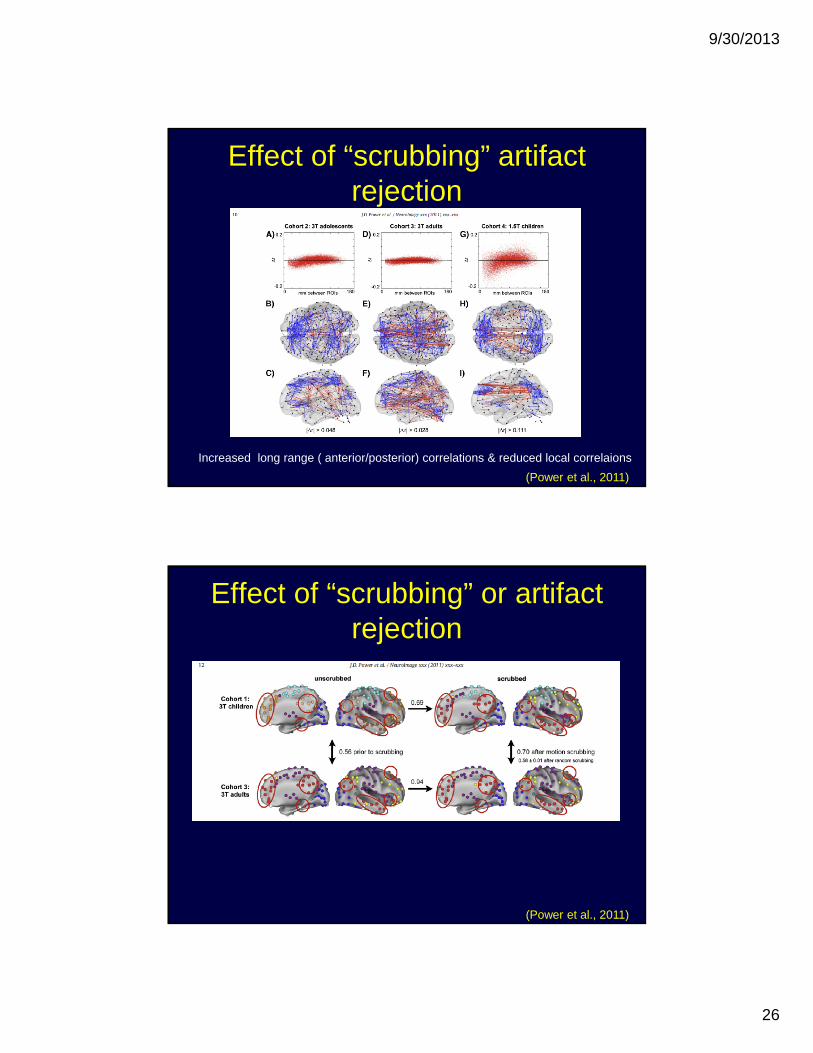
Effect of “scrubbing” artifact rejection
(Power et al., 2011)
Increased long range ( anterior/posterior) correlations & reduced local correlaions
Effect of “scrubbing” or artifactrejection
(Power et al., 2011)
9/30/2013
27
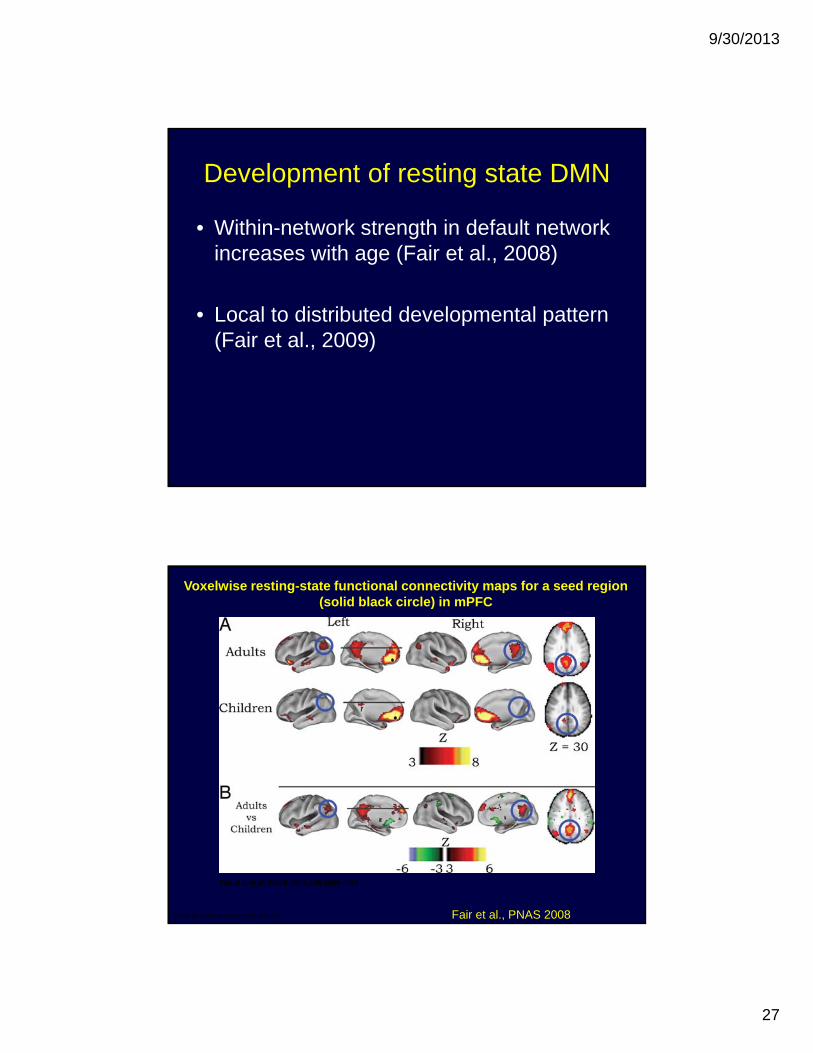
Development of resting state DMN
• Within-network strength in default network increases with age (Fair et al., 2008)
• Local to distributed developmental pattern (Fair et al., 2009)
Voxelwise resting-state functional connectivity maps for a seed region (solid black circle) in mPFC
Fair D A et al. PNAS 2008;105:4028-4032
©2008 by National Academy of Sciences Fair et al., PNAS 2008
9/30/2013
28
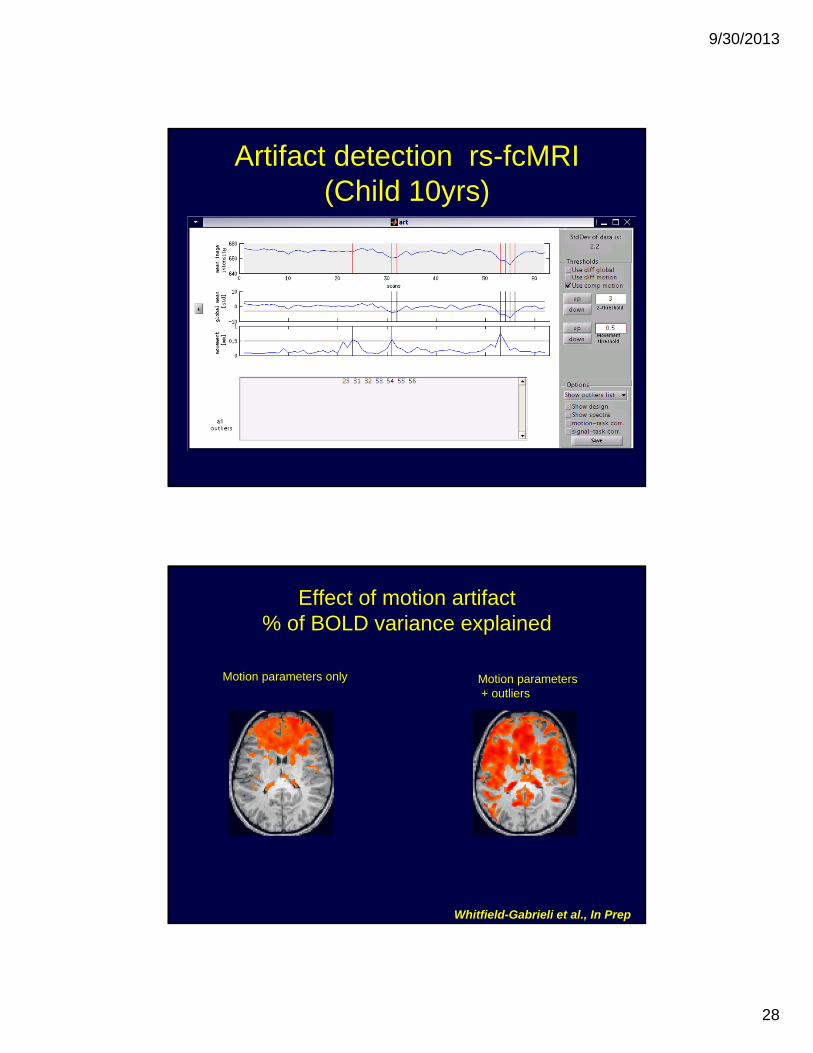
Artifact detection rs-fcMRI (Child 10yrs)
Effect of motion artifact% of BOLD variance explained
Motion parameters only Motion parameters + outliers
Whitfield-Gabrieli et al., In Prep
9/30/2013
29
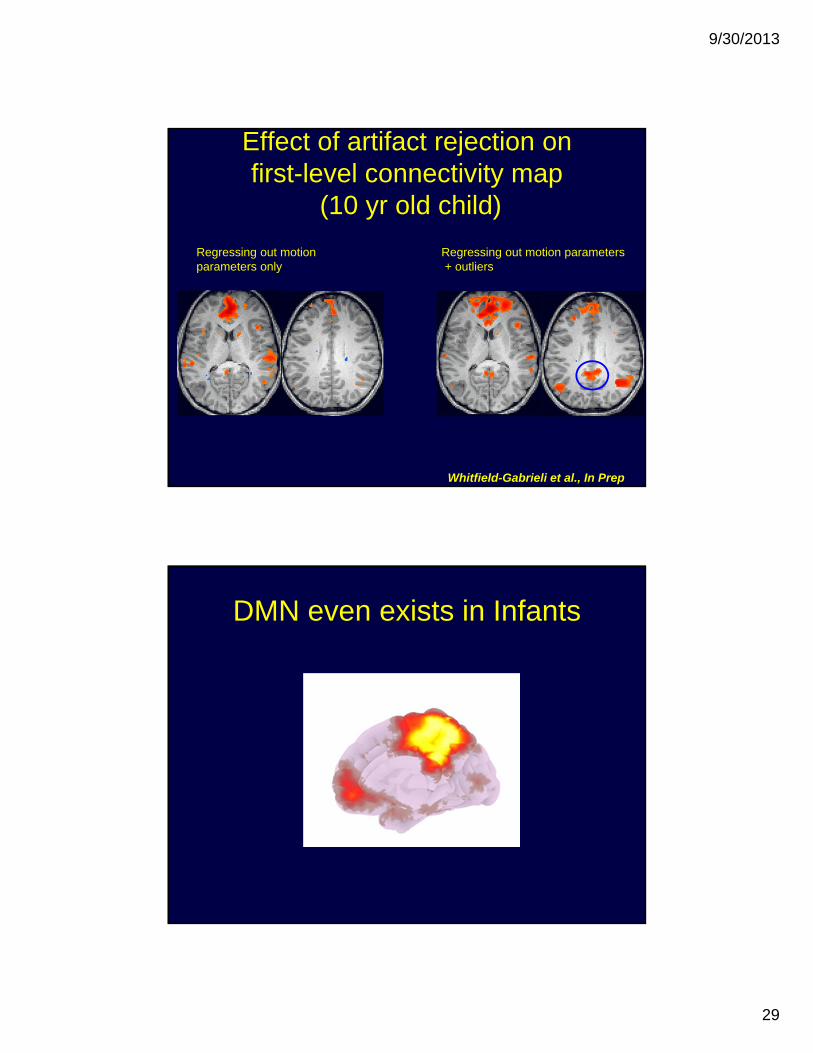
Effect of artifact rejection onfirst-level connectivity map
(10 yr old child)
Regressing out motion parameters only
Regressing out motion parameters + outliers
Whitfield-Gabrieli et al., In Prep
DMN even exists in Infants
9/30/2013
30
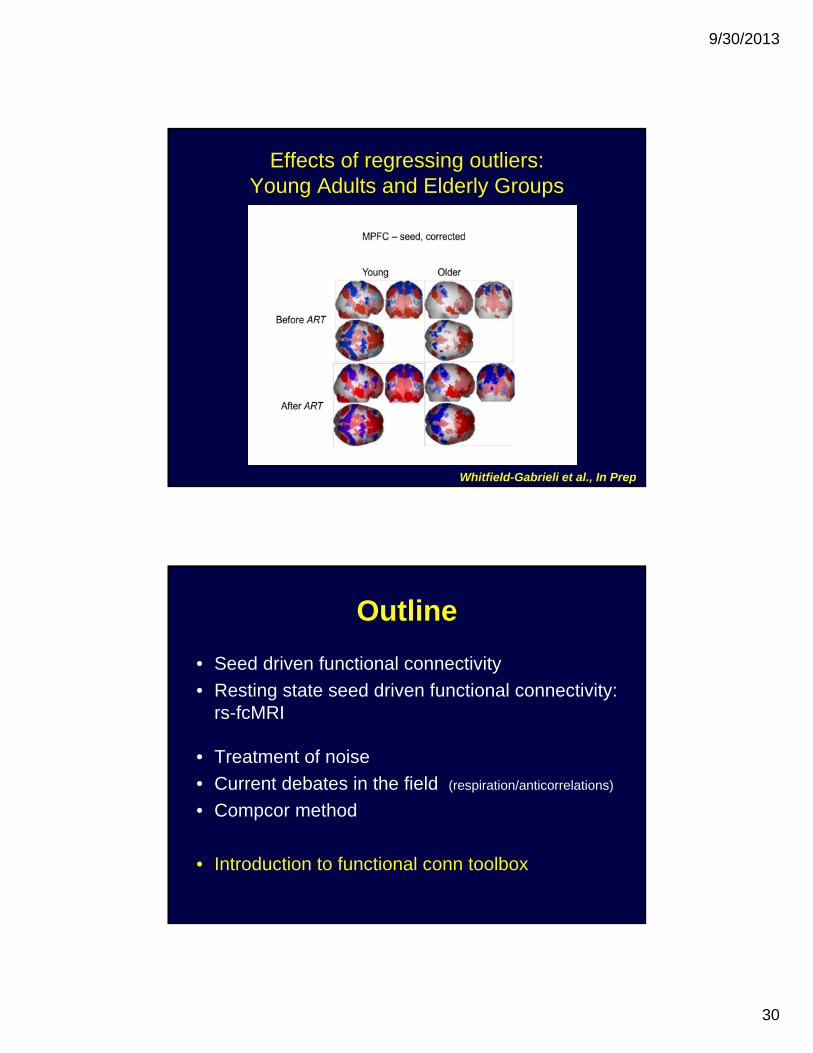
Effects of regressing outliers:Young Adults and Elderly Groups
Whitfield-Gabrieli et al., In Prep
Outline
• Seed driven functional connectivity
• Resting state seed driven functional connectivity: rs-fcMRI
• Treatment of noise
• Current debates in the field (respiration/anticorrelations)
• Compcor method
• Introduction to functional conn toolbox
9/30/2013
31
Functional Connectivity Overview
fMRI connectivity tool (beta)
Function: Perform functional connectivity analyses
(seeded voxel correlations)
• The toolbox implements aCompCor strategy for physiological (and other) noise source reduction, first-level General Linear Model for correlation and regression connectivity estimation, and second-level random-effect analyses.
• The toolbox is designed to work with both resting state scans and block designs where rest is another block amongst other conditions.
The following slides illustrate the operation of the toolbox
9/30/2013
32
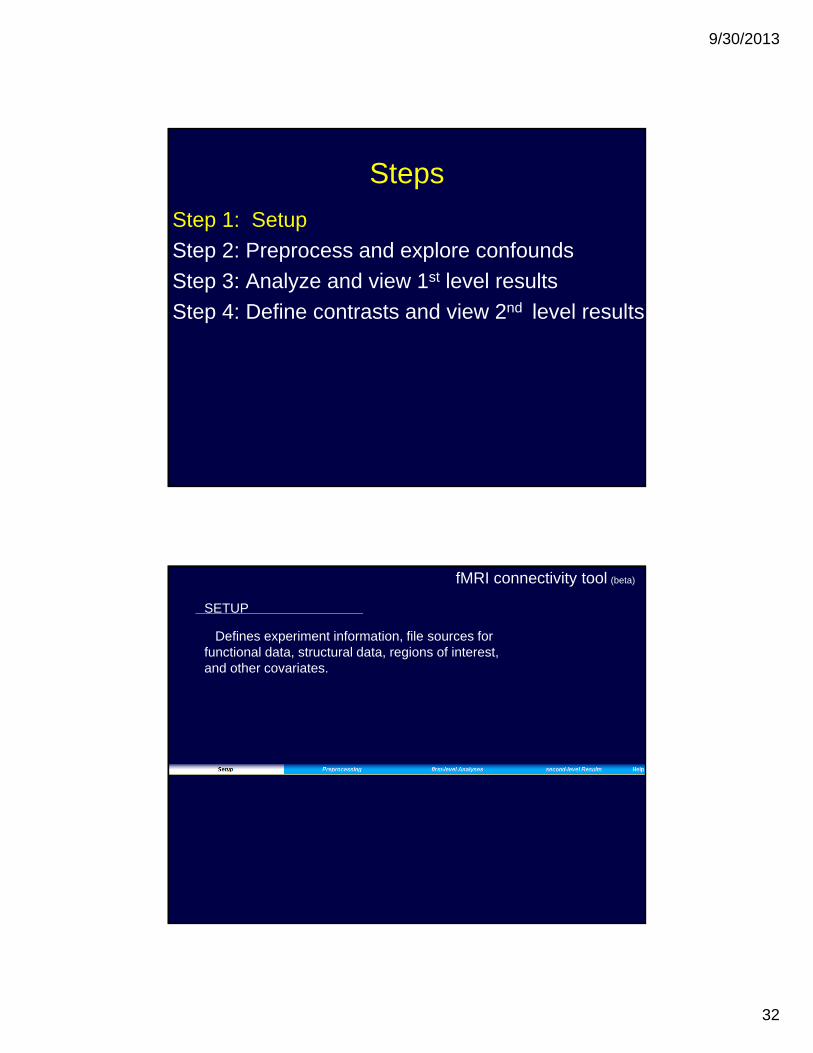
Steps
Step 1: Setup
Step 2: Preprocess and explore confounds
Step 3: Analyze and view 1st level results
Step 4: Define contrasts and view 2nd level results
fMRI connectivity tool (beta)
SETUP
Defines experiment information, file sources for functional data, structural data, regions of interest, and other covariates.
9/30/2013
33
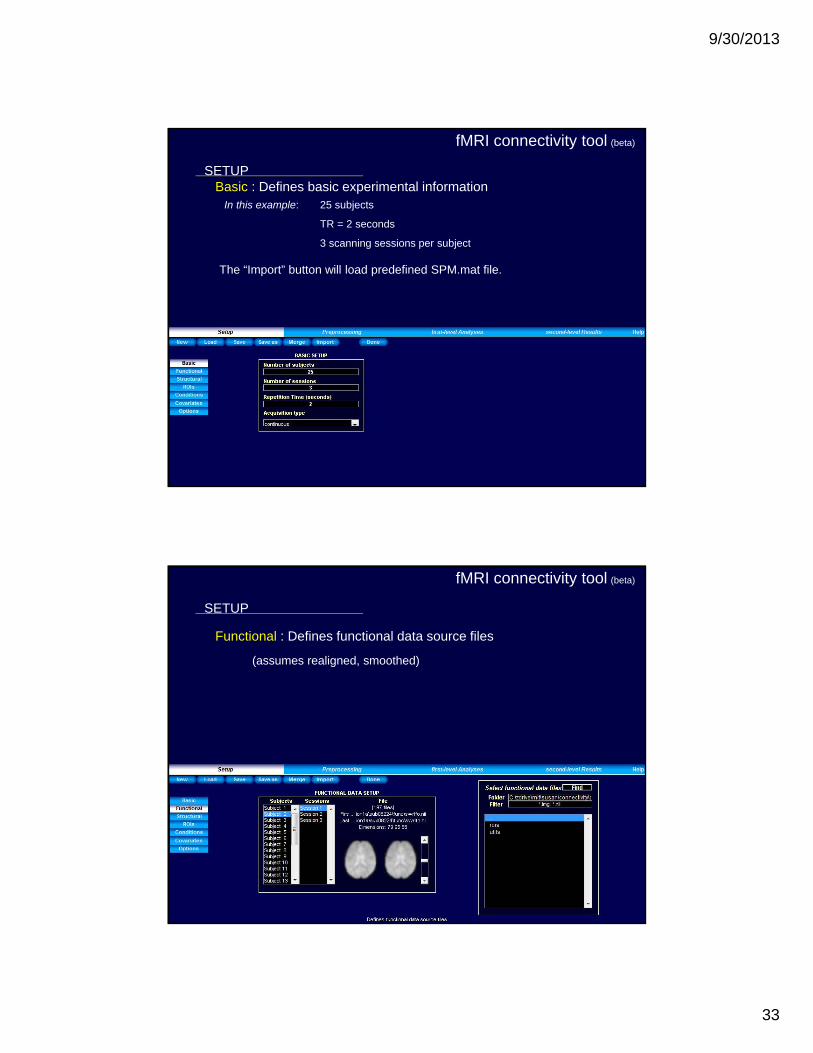
fMRI connectivity tool (beta)
SETUPBasic : Defines basic experimental information
In this example: 25 subjects
TR = 2 seconds
3 scanning sessions per subject
The “Import” button will load predefined SPM.mat file.
fMRI connectivity tool (beta)
SETUP
Functional : Defines functional data source files
(assumes realigned, smoothed)
9/30/2013
34
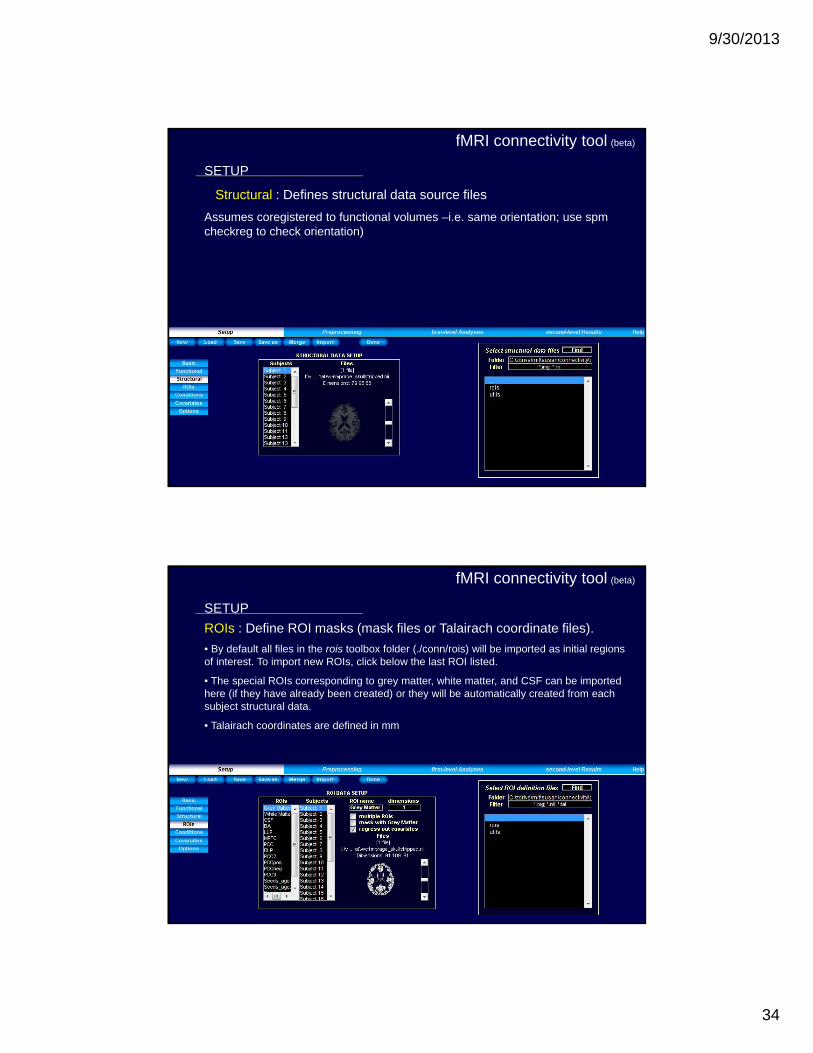
fMRI connectivity tool (beta)
SETUP
Structural : Defines structural data source files
Assumes coregistered to functional volumes –i.e. same orientation; use spm checkreg to check orientation)
fMRI connectivity tool (beta)
SETUP
ROIs : Define ROI masks (mask files or Talairach coordinate files).
• By default all files in the rois toolbox folder (./conn/rois) will be imported as initial regions of interest. To import new ROIs, click below the last ROI listed.
• The special ROIs corresponding to grey matter, white matter, and CSF can be imported here (if they have already been created) or they will be automatically created from each subject structural data.
• Talairach coordinates are defined in mm
9/30/2013
35
fMRI connectivity tool (beta)
SETUP
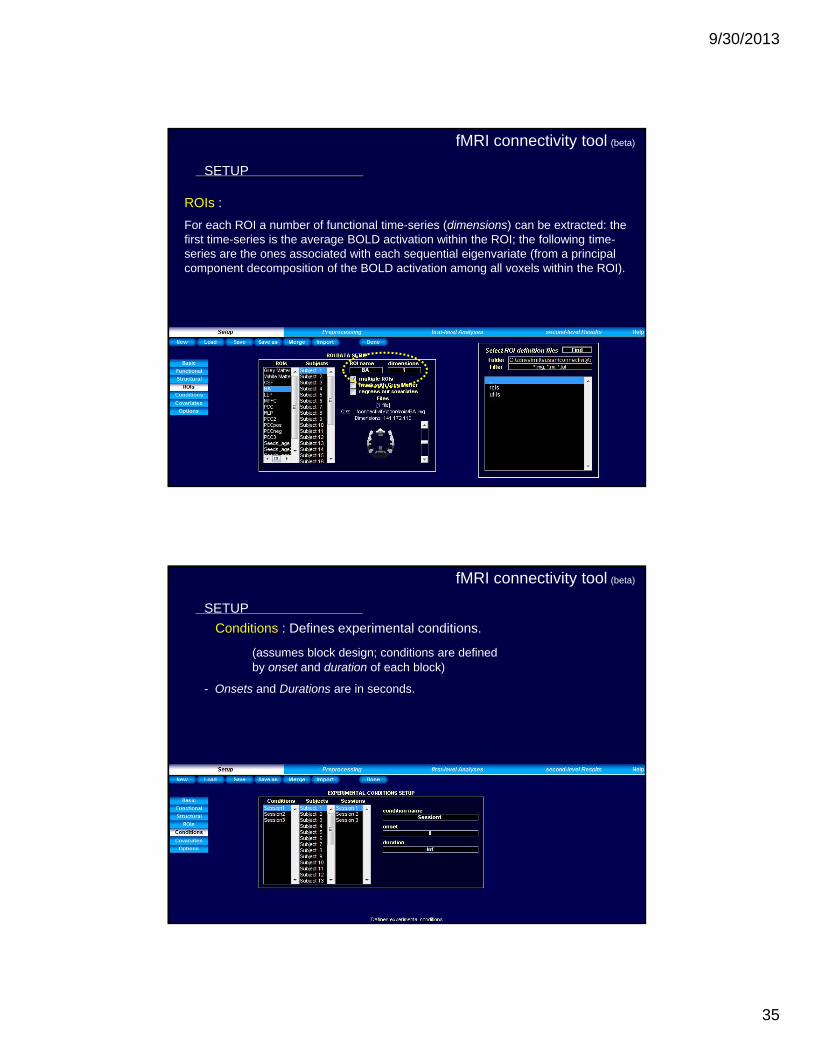
ROIs :
For each ROI a number of functional time-series (dimensions) can be extracted: the first time-series is the average BOLD activation within the ROI; the following time-series are the ones associated with each sequential eigenvariate (from a principal component decomposition of the BOLD activation among all voxels within the ROI).
fMRI connectivity tool (beta)
SETUP
Conditions : Defines experimental conditions.
(assumes block design; conditions are defined by onset and duration of each block)
- Onsets and Durations are in seconds.
9/30/2013
36
fMRI connectivity tool (beta)
SETUP
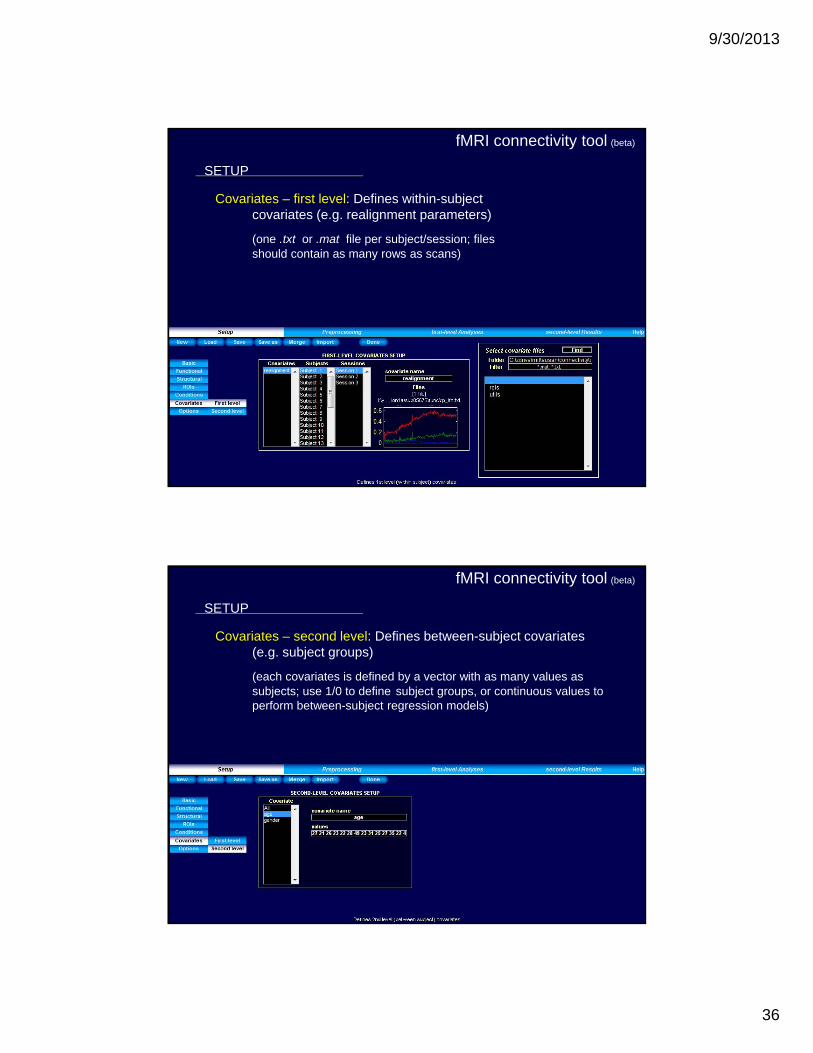
Covariates – first level: Defines within-subject covariates (e.g. realignment parameters)
(one .txt or .mat file per subject/session; files should contain as many rows as scans)
fMRI connectivity tool (beta)
SETUP
Covariates – second level: Defines between-subject covariates (e.g. subject groups)
(each covariates is defined by a vector with as many values as subjects; use 1/0 to define subject groups, or continuous values to perform between-subject regression models)
9/30/2013
37
fMRI connectivity tool (beta)
SETUP
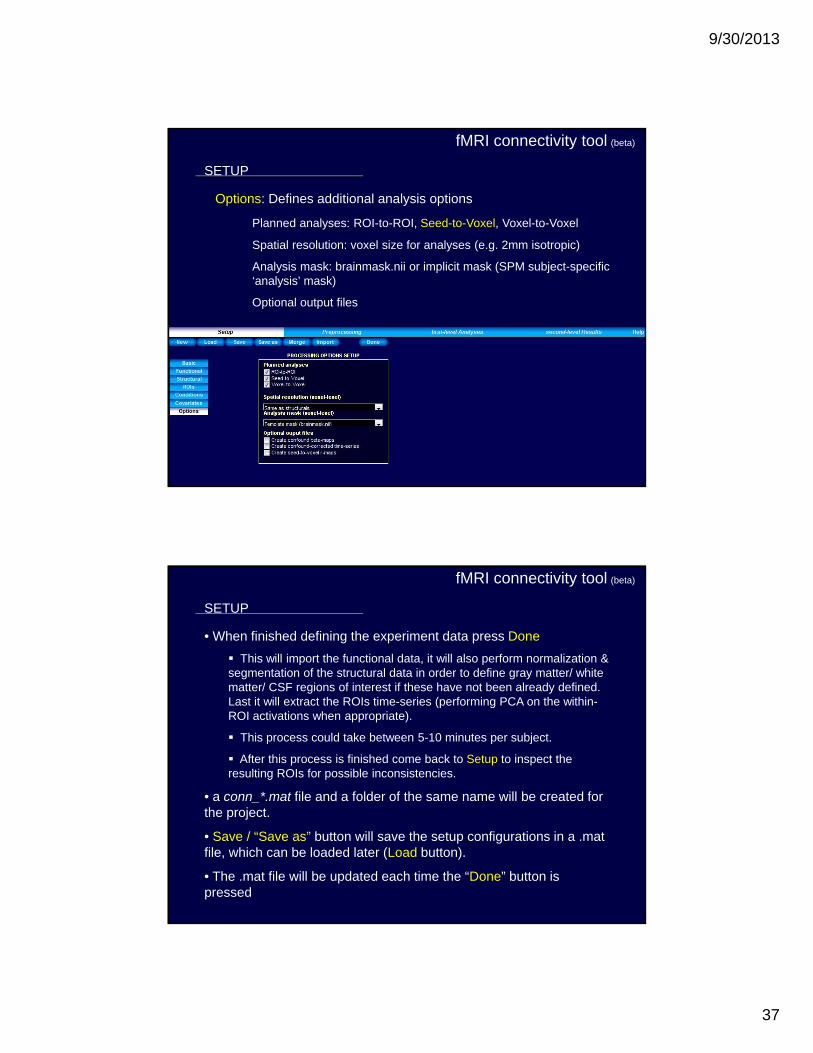
Options: Defines additional analysis options
Planned analyses: ROI-to-ROI, Seed-to-Voxel, Voxel-to-Voxel
Spatial resolution: voxel size for analyses (e.g. 2mm isotropic)
Analysis mask: brainmask.nii or implicit mask (SPM subject-specific ‘analysis’ mask)
Optional output files
fMRI connectivity tool (beta)
SETUP
• When finished defining the experiment data press Done
This will import the functional data, it will also perform normalization & segmentation of the structural data in order to define gray matter/ white matter/ CSF regions of interest if these have not been already defined. Last it will extract the ROIs time-series (performing PCA on the within-ROI activations when appropriate).
This process could take between 5-10 minutes per subject.
After this process is finished come back to Setup to inspect the resulting ROIs for possible inconsistencies.
• a conn_*.mat file and a folder of the same name will be created for the project.
• Save / “Save as” button will save the setup configurations in a .mat file, which can be loaded later (Load button).
• The .mat file will be updated each time the “Done” button is pressed

9/30/2013
38
fMRI connectivity tool (beta)
SETUP (revisited)
ROIs : If these had not been defined previously gray matter, white matter, and CSF masks will have been created now.
(check results; problems may occur when structural data is not reasonably reoriented)
Steps
Step 1: Setup
Step 2: Preprocess and explore confounds
Step 3: Analyze and view 1st level results
Step 4: Define contrasts and view 2nd level results
9/30/2013
39
fMRI connectivity tool (beta)
PREPROCESSING
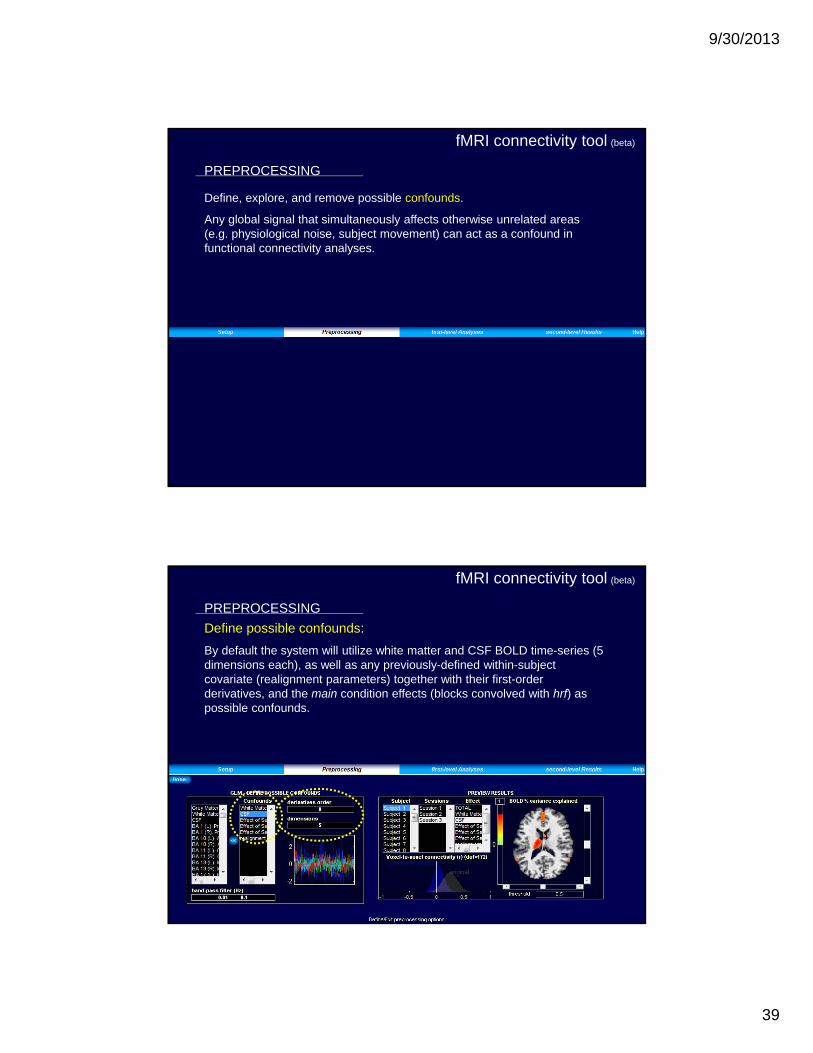
Define, explore, and remove possible confounds.
Any global signal that simultaneously affects otherwise unrelated areas (e.g. physiological noise, subject movement) can act as a confound in functional connectivity analyses.
fMRI connectivity tool (beta)
PREPROCESSING
Define possible confounds:
By default the system will utilize white matter and CSF BOLD time-series (5 dimensions each), as well as any previously-defined within-subject covariate (realignment parameters) together with their first-order derivatives, and the main condition effects (blocks convolved with hrf) as possible confounds.
9/30/2013
40
fMRI connectivity tool (beta)
PREPROCESSING
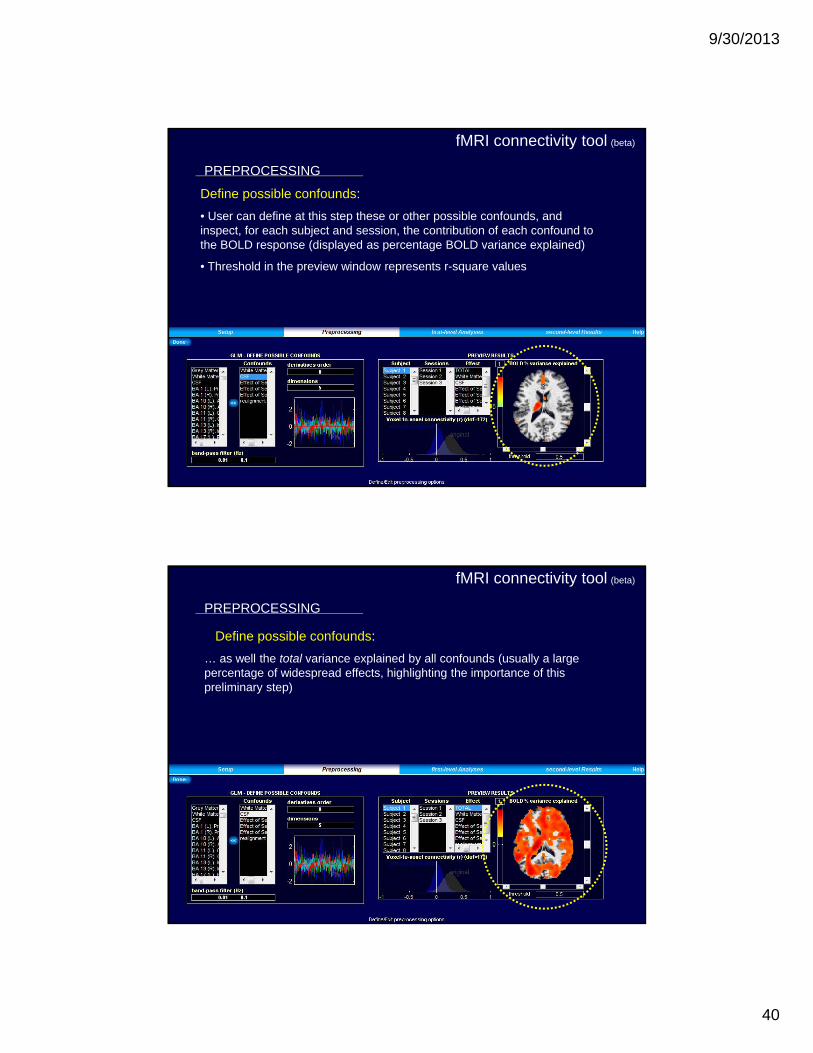
Define possible confounds:
• User can define at this step these or other possible confounds, and inspect, for each subject and session, the contribution of each confound to the BOLD response (displayed as percentage BOLD variance explained)
• Threshold in the preview window represents r-square values
fMRI connectivity tool (beta)
PREPROCESSING
Define possible confounds:
… as well the total variance explained by all confounds (usually a large percentage of widespread effects, highlighting the importance of this preliminary step)
9/30/2013
41
fMRI connectivity tool (beta)
PREPROCESSING
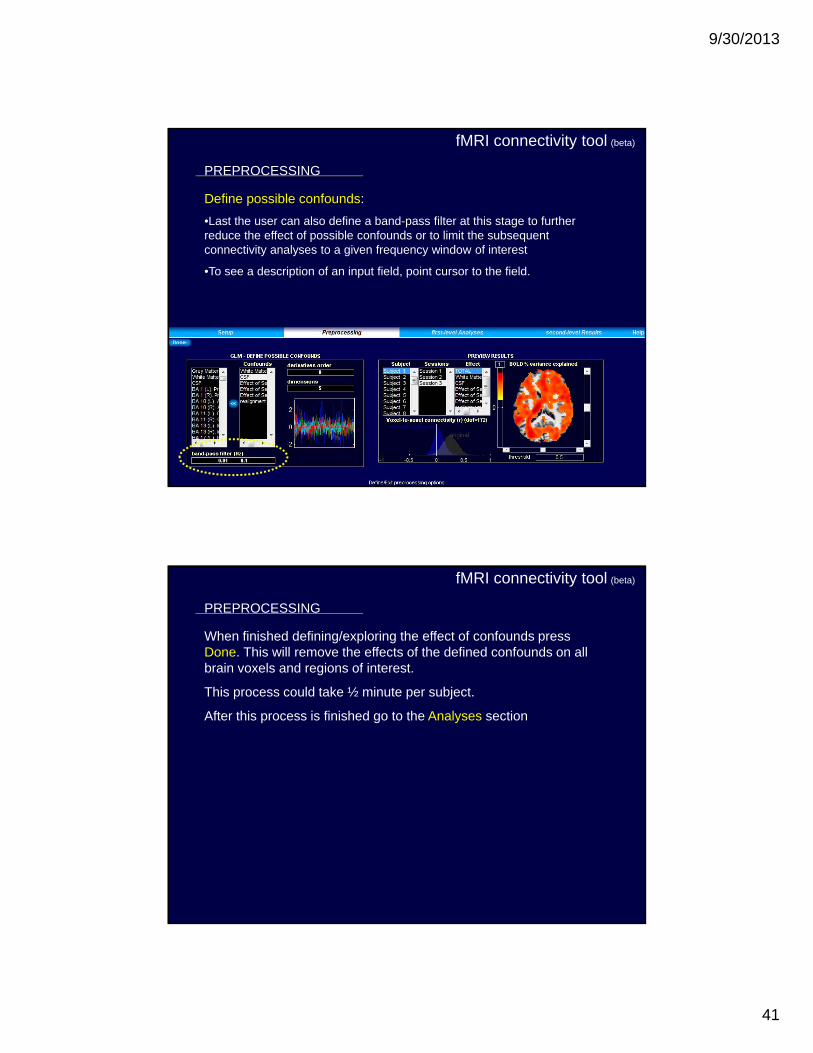
Define possible confounds:
•Last the user can also define a band-pass filter at this stage to further reduce the effect of possible confounds or to limit the subsequent connectivity analyses to a given frequency window of interest
•To see a description of an input field, point cursor to the field.
fMRI connectivity tool (beta)
PREPROCESSING
When finished defining/exploring the effect of confounds press Done. This will remove the effects of the defined confounds on all brain voxels and regions of interest.
This process could take ½ minute per subject.
After this process is finished go to the Analyses section
9/30/2013
42
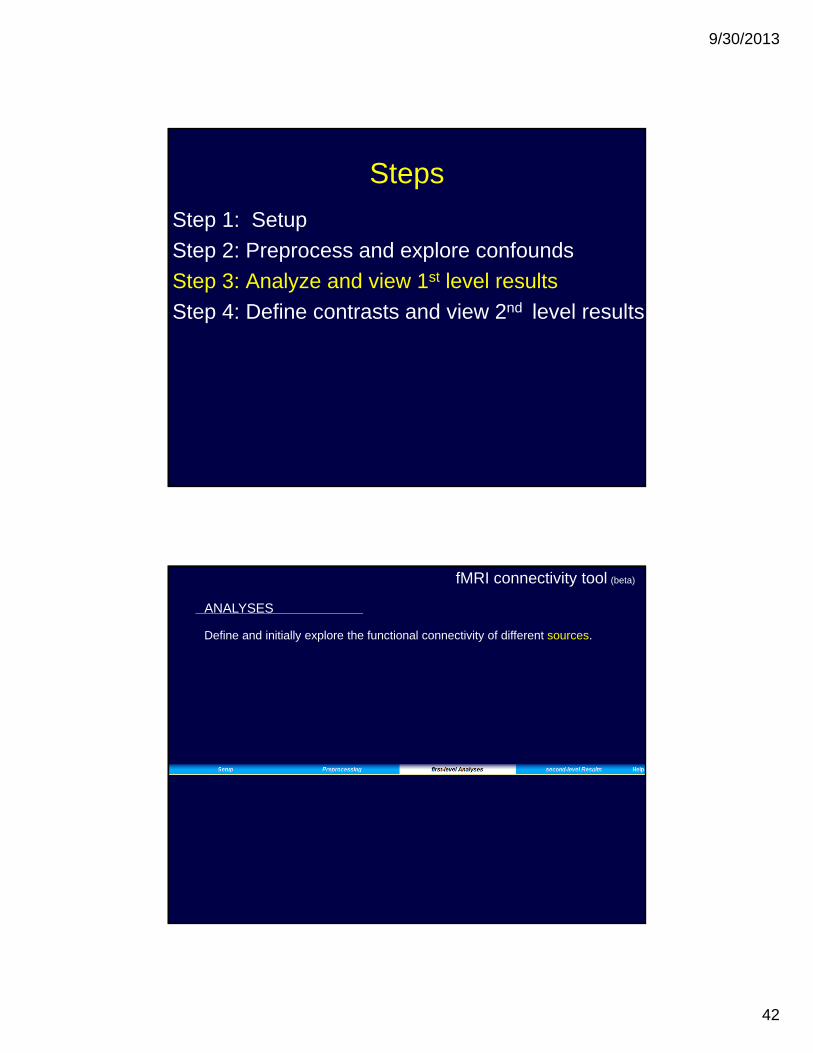
Steps
Step 1: Setup
Step 2: Preprocess and explore confounds
Step 3: Analyze and view 1st level results
Step 4: Define contrasts and view 2nd level results
fMRI connectivity tool (beta)
ANALYSES
Define and initially explore the functional connectivity of different sources.
9/30/2013
43
fMRI connectivity tool (beta)
ANALYSES
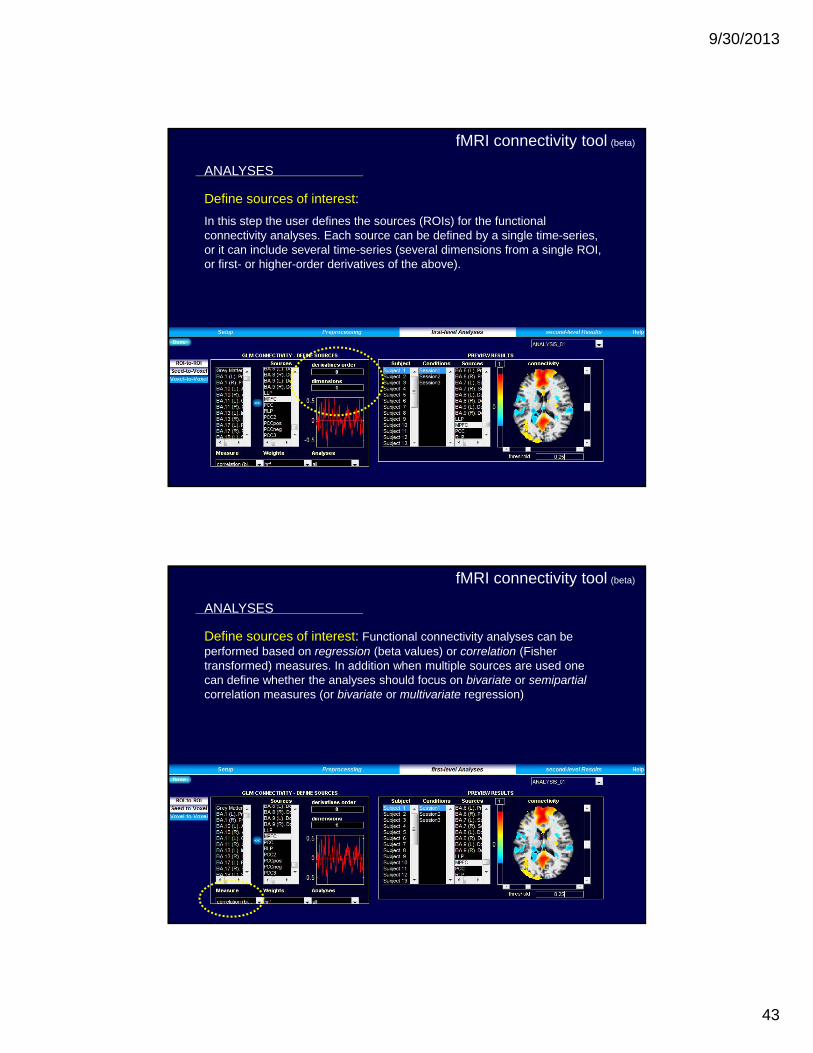
Define sources of interest:
In this step the user defines the sources (ROIs) for the functional connectivity analyses. Each source can be defined by a single time-series, or it can include several time-series (several dimensions from a single ROI, or first- or higher-order derivatives of the above).
fMRI connectivity tool (beta)
ANALYSES
Define sources of interest: Functional connectivity analyses can be performed based on regression (beta values) or correlation (Fisher transformed) measures. In addition when multiple sources are used one can define whether the analyses should focus on bivariate or semipartial correlation measures (or bivariate or multivariate regression)
9/30/2013
44
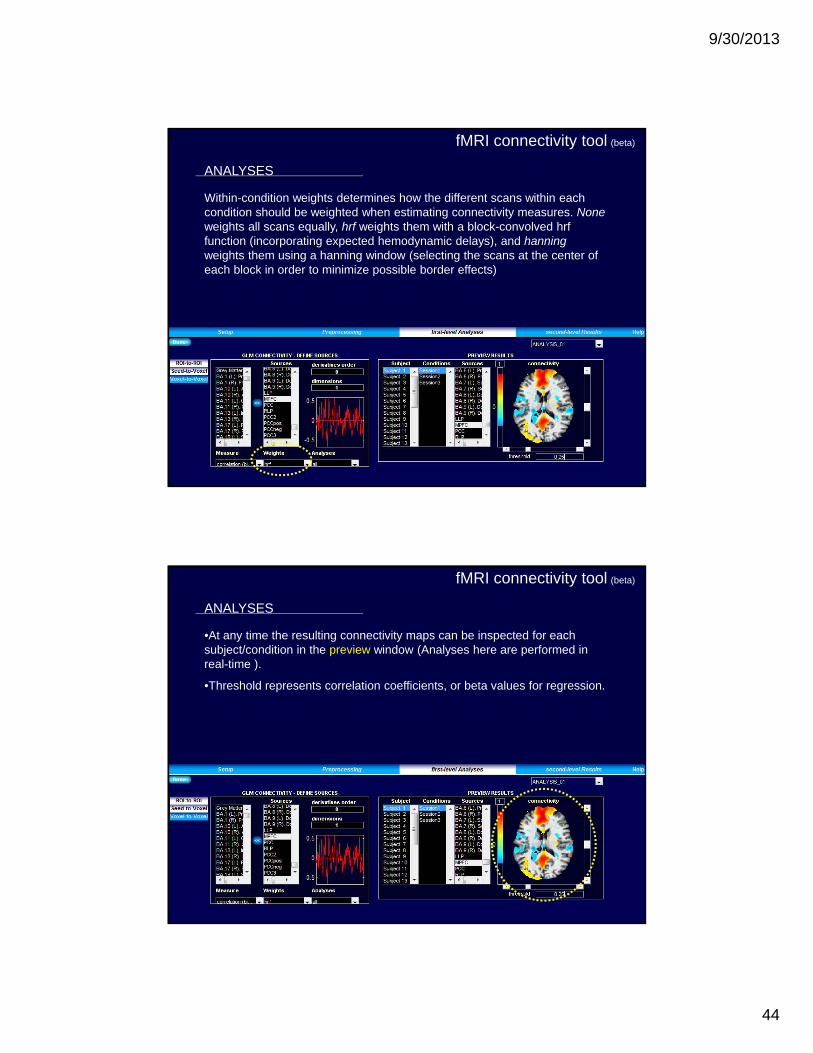
fMRI connectivity tool (beta)
ANALYSES
Within-condition weights determines how the different scans within each condition should be weighted when estimating connectivity measures. Noneweights all scans equally, hrf weights them with a block-convolved hrf function (incorporating expected hemodynamic delays), and hanningweights them using a hanning window (selecting the scans at the center of each block in order to minimize possible border effects)
fMRI connectivity tool (beta)
ANALYSES
•At any time the resulting connectivity maps can be inspected for each subject/condition in the preview window (Analyses here are performed in real-time ).
•Threshold represents correlation coefficients, or beta values for regression.
9/30/2013
45
fMRI connectivity tool (beta)
ANALYSES
When finished defining/exploring the connectivity analyses press Done. This will perform the defined analyses for all subjects and allow the user to explore second-level (between subject) results.
First-level results are also exported as .nii volumes (one per Subject/Condition/Source combination) in the results/firstlevel folder
This process could take 1 minute per source (depending on number of subjects in the study).
Steps
Step 1: Setup
Step 2: Preprocess and explore confounds
Step 3: Analyze and view 1st level results
Step 4: Define contrasts and view 2nd level results
9/30/2013
46
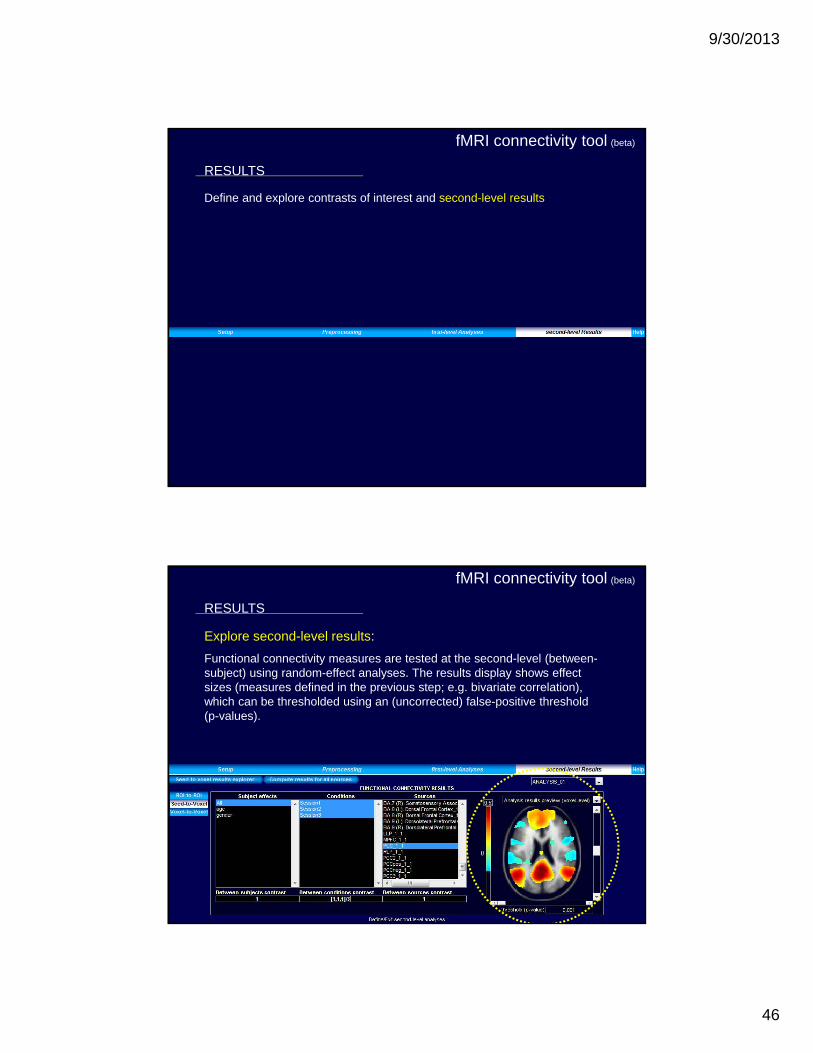
fMRI connectivity tool (beta)
RESULTS
Define and explore contrasts of interest and second-level results
fMRI connectivity tool (beta)
RESULTS
Explore second-level results:
Functional connectivity measures are tested at the second-level (between-subject) using random-effect analyses. The results display shows effect sizes (measures defined in the previous step; e.g. bivariate correlation), which can be thresholded using an (uncorrected) false-positive threshold (p-values).
9/30/2013
47
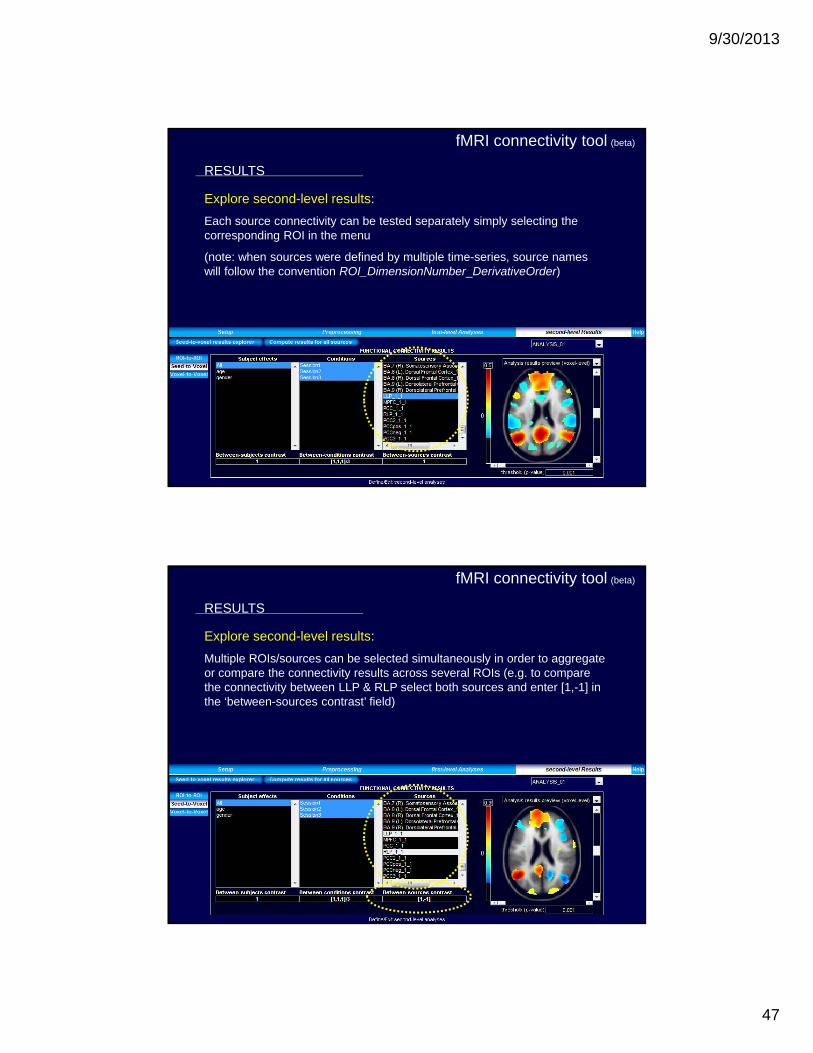
fMRI connectivity tool (beta)
RESULTS
Explore second-level results:
Each source connectivity can be tested separately simply selecting the corresponding ROI in the menu
(note: when sources were defined by multiple time-series, source names will follow the convention ROI_DimensionNumber_DerivativeOrder)
fMRI connectivity tool (beta)
RESULTS
Explore second-level results:
Multiple ROIs/sources can be selected simultaneously in order to aggregate or compare the connectivity results across several ROIs (e.g. to compare the connectivity between LLP & RLP select both sources and enter [1,-1] in the ‘between-sources contrast’ field)
9/30/2013
48
fMRI connectivity tool (beta)
RESULTS
Explore second-level results:
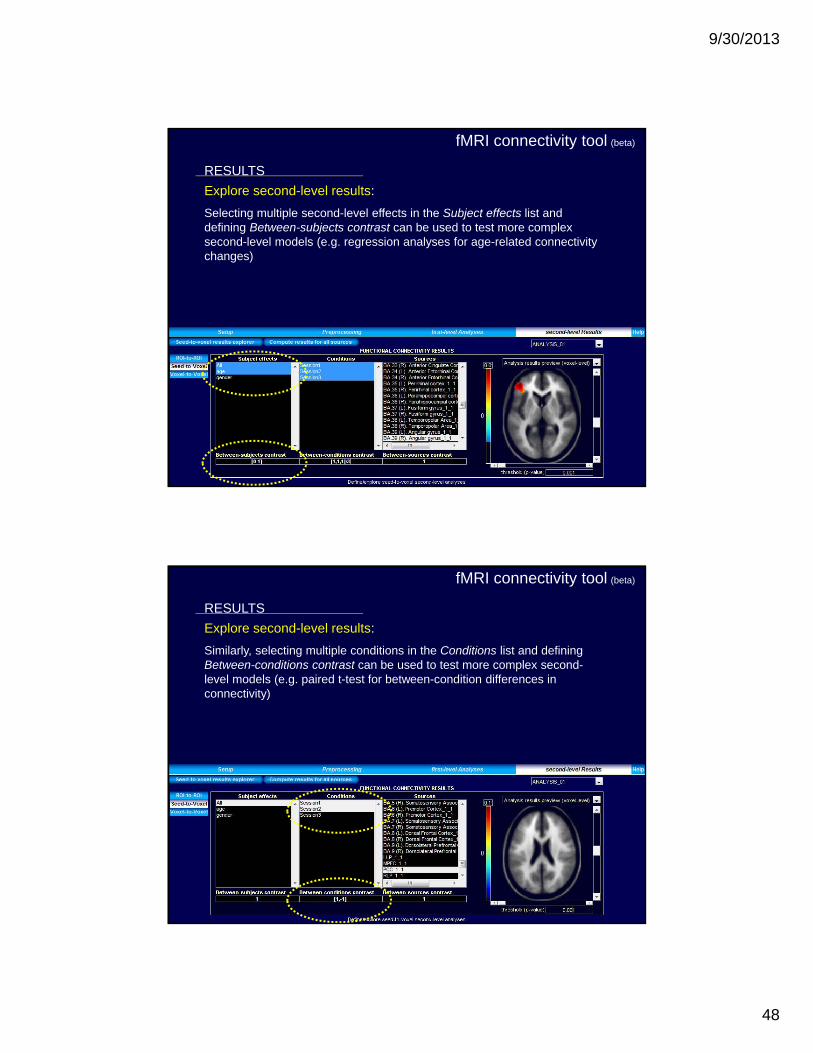
Selecting multiple second-level effects in the Subject effects list and defining Between-subjects contrast can be used to test more complex second-level models (e.g. regression analyses for age-related connectivity changes)
fMRI connectivity tool (beta)
RESULTS
Explore second-level results:
Similarly, selecting multiple conditions in the Conditions list and defining Between-conditions contrast can be used to test more complex second-level models (e.g. paired t-test for between-condition differences in connectivity)
9/30/2013
49
fMRI connectivity tool (beta)
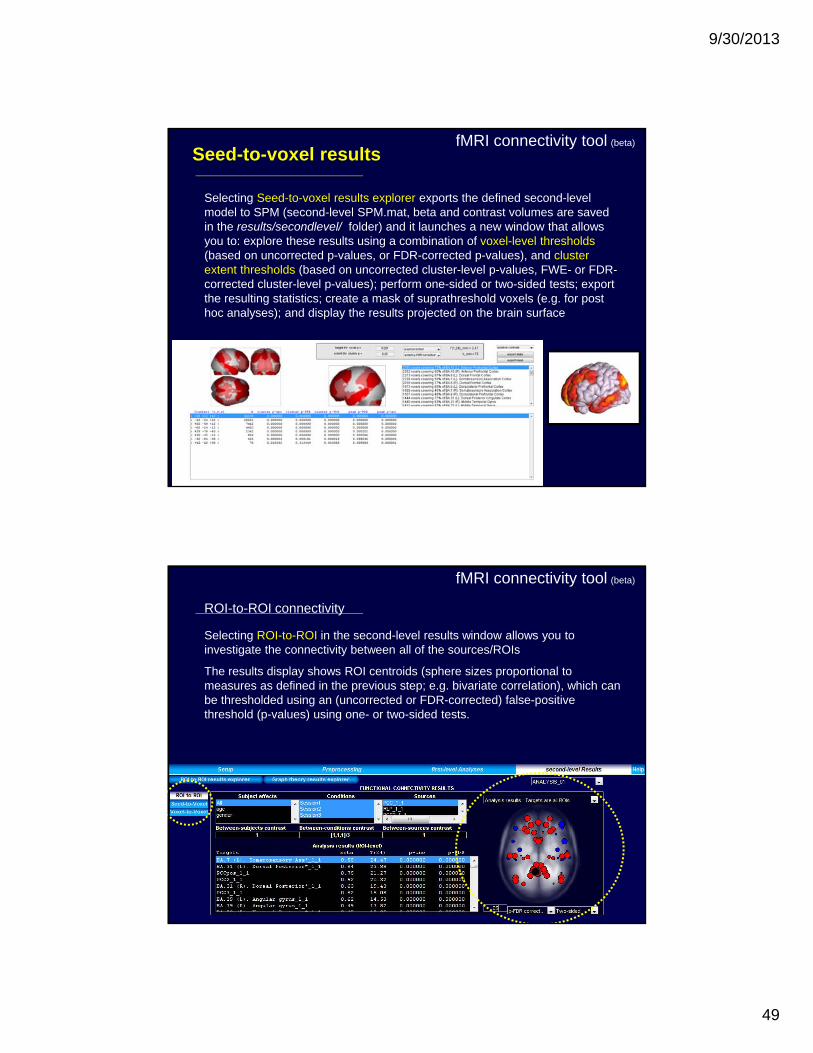
Selecting Seed-to-voxel results explorer exports the defined second-level model to SPM (second-level SPM.mat, beta and contrast volumes are saved in the results/secondlevel/ folder) and it launches a new window that allows you to: explore these results using a combination of voxel-level thresholds (based on uncorrected p-values, or FDR-corrected p-values), and cluster extent thresholds (based on uncorrected cluster-level p-values, FWE- or FDR-corrected cluster-level p-values); perform one-sided or two-sided tests; export the resulting statistics; create a mask of suprathreshold voxels (e.g. for post hoc analyses); and display the results projected on the brain surface
Seed-to-voxel results
ROI-to-ROI connectivity
Selecting ROI-to-ROI in the second-level results window allows you to investigate the connectivity between all of the sources/ROIs
The results display shows ROI centroids (sphere sizes proportional to measures as defined in the previous step; e.g. bivariate correlation), which can be thresholded using an (uncorrected or FDR-corrected) false-positive threshold (p-values) using one- or two-sided tests.
fMRI connectivity tool (beta)
9/30/2013
50
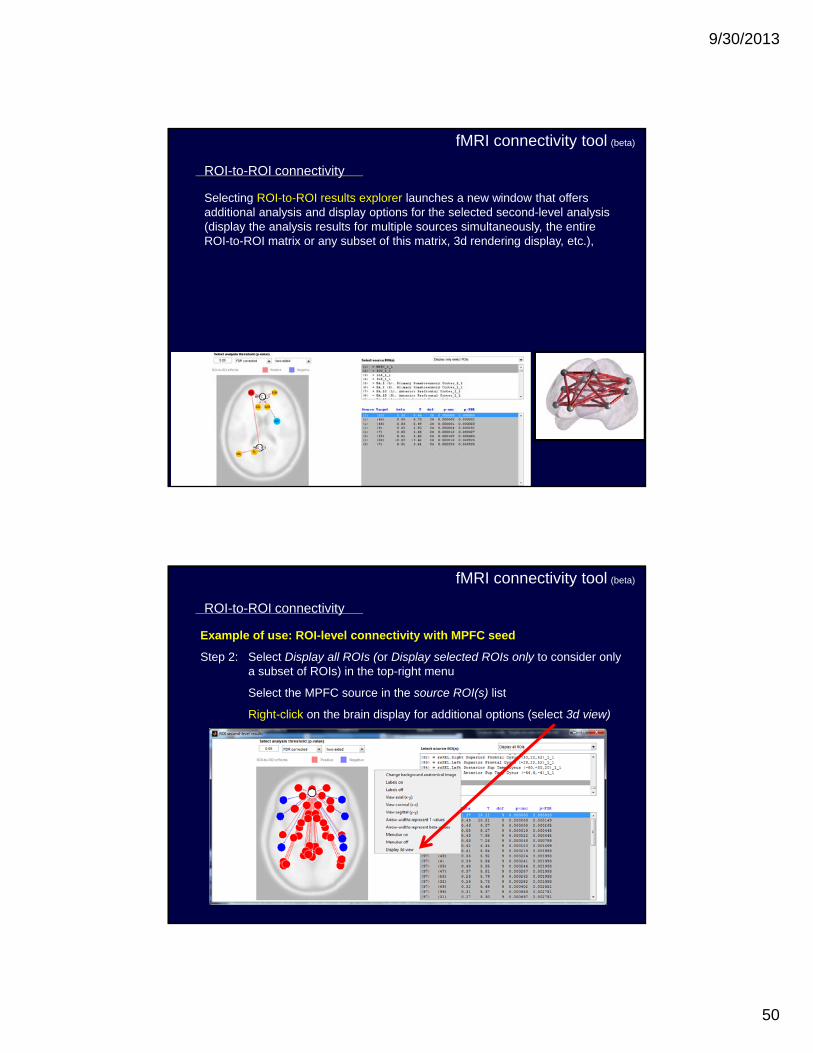
Selecting ROI-to-ROI results explorer launches a new window that offers additional analysis and display options for the selected second-level analysis (display the analysis results for multiple sources simultaneously, the entire ROI-to-ROI matrix or any subset of this matrix, 3d rendering display, etc.),
fMRI connectivity tool (beta)
ROI-to-ROI connectivity
Example of use: ROI-level connectivity with MPFC seed
Step 2: Select Display all ROIs (or Display selected ROIs only to consider only a subset of ROIs) in the top-right menu
Select the MPFC source in the source ROI(s) list
Right-click on the brain display for additional options (select 3d view)
ROI-to-ROI connectivity
fMRI connectivity tool (beta)
9/30/2013
51
ROI-to-ROI connectivity
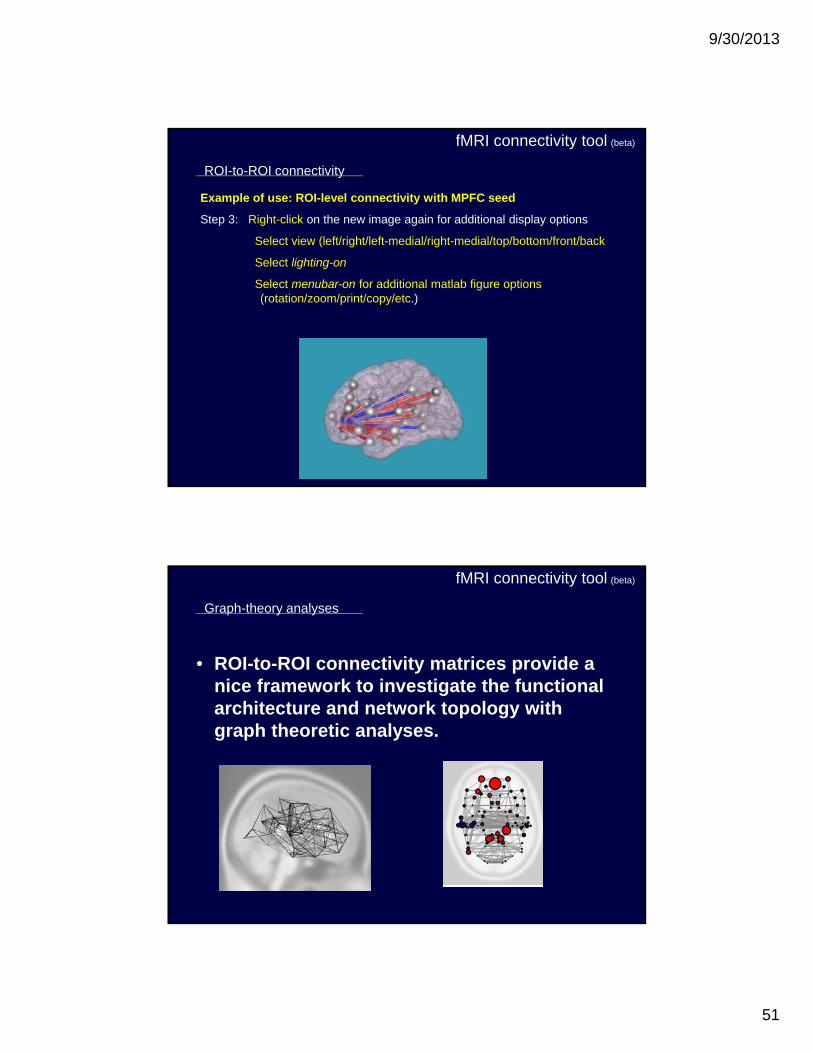
Example of use: ROI-level connectivity with MPFC seed
Step 3: Right-click on the new image again for additional display options
Select view (left/right/left-medial/right-medial/top/bottom/front/back
Select lighting-on
Select menubar-on for additional matlab figure options (rotation/zoom/print/copy/etc.)
fMRI connectivity tool (beta)
• ROI-to-ROI connectivity matrices provide a nice framework to investigate the functional architecture and network topology with graph theoretic analyses.
Graph-theory analyses
fMRI connectivity tool (beta)

9/30/2013
52
END OVERVIEW
Related Documents