CSIRO LAND and WATER Sediment transport and accumulation in Western Port Report on Phase 1 of a study determining the sources of sediment to Western Port Gary J. Hancock, Jon M. Olley and Peter J. Wallbrink CSIRO Land and Water, Environmental Hydrology, Canberra Technical Report 47/01, November 2001

Welcome message from author
This document is posted to help you gain knowledge. Please leave a comment to let me know what you think about it! Share it to your friends and learn new things together.
Transcript

C S I R O L A N D a nd WAT E R
Sediment transport and accumulation
in Western PortReport on Phase 1 of a study determining the sources
of sediment to Western Port
Gary J. Hancock, Jon M. Olley and Peter J. Wallbrink
CSIRO Land and Water, Environmental Hydrology, Canberra
Technical Report 47/01, November 2001

Sediment transport and accumulation
in Western PortReport on Phase 1 of a study determining the sources
of sediment to Western Port
Gary J. Hancock, Jon M. Olley and Peter J. Wallbrink
CSIRO Land and Water, Environmental Hydrology, Canberra
Technical Report 47/01, November 2001

ii
Copyright© 2001 CSIRO Land and Water.
To the extent permitted by law, all rights are reserved and no part of this publication coveredby copyright may be reproduced or copied in any form or by any means except with thewritten permission of CSIRO Land and Water.
Important Disclaimer
To the extent permitted by law, CSIRO Land and Water (including its employees andconsultants) excludes all liability to any person for any consequences, including but notlimited to all losses, damages, costs, expenses and any other compensation, arising directlyor indirectly from using this publication (in part or in whole) and any information or materialcontained in it.
This report should referenced as:Hancock, G.J., Olley, J.M. and Wallbrink, P.J. (2001). Sediment transport andaccumulation in Westernport. CSIRO Land and Water technical report 47/01.

iii
Executive Summary
Sediment accumulation and transport has been assessed in the north, east and southernregions of Western Port by examining the dynamics of of sediment transport in thebay, and estimating the rate of sediment accumulation. Sediment transport was studiedby determining the bay-wide spatial distribution of various particle size fractions, andestimating suspended particle residence times by measurements of 234Th uptake.Sediment accumulation was studied by determining sediment chronologies usingfallout radionuclides (210Pb, 137Cs), Pinus pollen and optically stimulatedluminescence (OSL) dating. Measurements of major and trace elements were alsomade in an attempt to establish proxy age horizons distinguished by changes tosediment characteristics resulting from recent human activities.
Suspended particle residence times are short, and generally less than 1 day. Thisinformation indicates a dynamic system of sediment resuspension and redeposition offine-grained sediment induced by tidal action. The pattern of fine-grained (<63 µm)sediment distribution in the bay, together with sediment core inventories of excess210Pb and 137Cs activities indicate that net transport of fine-grained sediment is in ageneral southwards direction clock-wise around the bay, such that fine-grainedsediment is being mobilised in the Upper North Arm, and focussed in the Rhyll (EastBasin) and Corinella segments of the East Arm. Comparison of the distribution offine-grained sediment determined by this study with that determined in the mid1970’s (Marsden and Mallet, 1975; Marsden et al., 1979) indicates a reduction inareal concentration of fine-grained sediment in the upper north armover the last 25year. The loss of fine is consistent with the observed particle size-distribution of theupper layers of sediment cores, which show highest sand content in Upper North Armsites and highest silt/clay content in East Arm sites.
Profiles of 210Pb indicate that fine-grained sediment in the East Arm is mixed to adepth of at least 18 cm. A simple 2-layer mixing model was applied to the 210Pbprofiles, where mixing below the upper mixed layer is assumed negligible. The modelyielded an apparent mean accumulation rate of 0.48 cm yr-1 (equivalent to 2.5 kg m-2
yr-1 of dry sediment) for the southern-most site of the bay (East Basin). The apparentaccumulation rate at the southern-most site in the Corinella segment is 0.21 cm yr-1.Cs-137 profiles are consistent with these rates. These accumulation rates represent anaverage of the last 60 years, and are considered upper limits due to the possibility ofslow vertical mixing of sediment below 20 cm depth. Approximate depositional loadsof fine-grained sediment in the East Arm are estimated by extrapolating the 210Pbaccumulation rates to the areas of clay-dominated sediment of the East Basin andCorinella segment. The calculated load load lies between 70 and 100 kt yr-1 of drysediment.
In the Upper North Arm sediment deposition over the last 40-60 years is confined toa sediment layer 12 to 24 cm thick. Due to the possibility of post-depositional mixing,the sediment deposition rate determined from this chronology (0-3-0.4 cm yr-1) is anupper limit. Despite the fact that recent sediment accumulation rates at most sites inthe bay are less than 0.5 cm yr-1, there are areas where sediment accumulation rateshave been much higher. At one site in the Corinella segment more than 60 cm hasbeen deposited over the last 40 years, equivalent to an accumulation rate of 1.6 cmyr-1. This site illustrates the dynamic nature of sediment movement in some areas ofthe bay.

iv
In the northern and eastern areas of the bay the particle size distribution of sediment ishighly variable both laterally and vertically. In the northern sites cores show a generaltrend of increasing sand content over a period of time extending beyond the last 40years. This trend could be due to an increasing rate of sand delivery to the bay, anincreasing rate of fine sediment removal (resuspension) from Upper North Armsediments, or a combination of both processes.
All cores show evidence for higher concentrations of P (50-100%) in the upper layerof sediment, corresponding to sediment delivered during the last 40 years. This maybe due to an increase in the P load delivered to the bay, or the presence of higherlevels of organic matter in the upper sediments (this is being investigated further).Trace element profiles do not show elevated levels of any metal in the upper layer.However, elevated levels of Cu and Mo are seen in sediment older than 40 years. It islikely that these concentration changes are a result of diagenesis (formation ofsulphide minerals) rather than anthropogenic input.

v
Acknowledgements
This study is jointly funded by Melbourne Water, CSIRO Land and Water and theEnvironmental Protection Agency (EPA) of Victoria.
We thank the following for their help with sample collection and for providing helpfulinformation and discussions on Western Port; Neil Biggins, Andy Steven, AndyStephens, Doug Newton (EPA), Rhys Coleman and Graham Rooney (MelbourneWater).
Danny Hunt, Haralds Alksnis and Carol Kelly (CSIRO) helped with samplecollection, preparation and radionuclide analysis. Ralph Ogden (CSIRO) providedadvice on pollen analysis. Heinz Buettikofer and Andrew Hughes (CSIRO) assistedwith the preparation of some of the figures in this report.

vi
Table of Contents
1. Introduction 1
2. Methods 2
2.1 Sample collection 22.2 Analytical procedures 52.3 Tracers and chronometers 9
3. Sediment transport and Distribution 12
3.1 Suspended particle residence time 123.2 Sediment distribution 143.3 Excess 210Pb and 137Cs inventories 17
3.4 Discussion and summary of sediment transport and distribution 18
4. Sediment Accumulation 19
4.1 Application of chronological methods 194.2 Core chronologies 294.3 Trace elements 33
5. Discussion 35
5.1 East Arm sites 355.2 Upper North Arm sites 37
6. Summary and Conclusions 38
References 39
Appendix 42

1
1. Introduction
This report presents the findings of Phase 1 of a three year study to determine theprimary sources of sediment to Western Port. The study was initiated by MelbourneWater to enable more effective setting of priorities for catchment rehabilitation. At thetime of the study links have been proposed between sediment delivery to the bay andloss of a significant area of seagrass since the early 1970’s. Although not the focus ofthe study, it is anticipated that a reduced sediment load is likely to benefit seagrasscommunities, and an increased understanding of sediment dynamics within the bay islikely to benefit seagrass restoration efforts.
The study is divided into three Phases. The main aim of Phase 1 is to determine theaccumulation rate of sediment in Western Port over the last 100 years, particularly inareas most affected by seagrass loss. By doing this, the study aims to establish ahistory of sediment delivery to the bay, and determine whether sediment sources havechanged significantly since European settlement. The sediment accumulation andsediment geochemistry data presented in this report will also be used in Phase 3 of thestudy, aimed at determining catchment sources.
The Westernport catchment has undergone significant change since Europeansettlement due to land clearing and drainage of the Koo-wee-rup swamp. Soil andriver bank erosion caused by these changes is believed to have significantly increasedsediment loads into the Western Port marine environment (Sargeant, 1977). Wilk etal. (1979) examined the stratigraphy of a series of sediment cores collected in the late1970’s from the Upper North Arm of the bay. In areas denuded of seagrass the coresshowed evidence of 3-5 cm of catchment-derived sediment overlying prior seagrassbeds. Wilk et al. concluded that sufficient soil had been removed from the catchmentsince the swamp had been drained to more than cover the denuded area.
Current estimates of the sediment load delivered to Westernport are mainly based onlimited periods of monitoring of suspended sediment and flow of rivers and streamsentering the bay. Monitoring is typically limited to monthly measurements, and spansno more than 20 years. Sargeant (1977) estimated a total sediment load of 99,000 m3y-
1 (equivalent to about 60 kt yr-1 dry weight) based on monitoring from 1973-1976.May and Stephens (1996) summarised data collected between 1973 and 1985 (fromCEE, 1986). By summing the data a mean load of about 40 kt yr-1 is determined.Using a longer time series Lowe (1999) provided annual estimates of load for streamsentering the northern area of the bay, ranging from 24-37 kt yr-1
However, it is well known that monitoring over limited periods of time does notnecessarily yield accurate long-term sediment load estimates, particularly inAustralian catchments where sporadic periods of high river flow deliverdisproportionately high sediment loads (Olive et al., 1995). The use of catchmentyields to estimate sediment accumulation in the bay is also affected by uncertainties inthe efficiency of sediment delivery to the bay, sediment movement within the bay, andexport of sediment to the sea. The significance of each of these factors on thesediment budget of the bay is largely unknown. In shallow coastal waters dominatedby tidal currents significant relocation and focussing of sediment deposits is likely.

2
This report assesses the extent of sediment transport and accumulation in the north,east and south-east regions of the bay. This is done by
i) examining the particle size distribution of sediment in the bayii) assessing the dynamics of suspended particle resuspension using 234Th uptake,
and relating it to the particle size distributioniii) establishing chronologies for sediment profiles from key areas of the bay using
fallout radioncuclides, OSL dating, pinus pollen measurements,
i) and ii) can allow an assessment of the transport pathways of fine-grained sedimentin the bay, information which may have implications for the source of turbidity in theBay. Sediment core chronologies can allow estimates of sediment accumulation andan assessment of the changing nature of bed stratum over recent decades.
2. Methods
2.1 Sample collection
Sediment core and water samples were collected from 8 sites during May 2 to May 4,2000. Sample site locations are shown in Fig. 1, and sample collection details aregiven in Table 1. Sediment cores were collected by divers from 7 of the sites, mainlyalong the northern and eastern sides of the bay. Four sites lie within the North Arm ofthe bay incorporating the embayment head of Western Port. This segment is describedas the Upper North Arm (Fig. 1). Three sites lie in the East Arm of the bay, includingthe Corinella segment (2) and the East Basin (1). Sites were selected adjacent to riverand stream inputs, within areas of seagrass loss, and within zones of fine-grainedsediment deposition.
Sediment cores were collected in two types of core tubes; ‘short’ polycarbonate tubes100 mm in diameter, and ‘long’ PVC tubes 50 mm in diameter. The widerpolycarbonate tubes were pushed into the sediment by the divers, and the PVC tubeswere driven in using a drop-hammer device. The polycarbonate tubes yielded cores upto 60 cm long, and the drop-hammer device recovered cores up to 160 cm long. Coreswere retrieved in an upright position, and placed upright in dry ice until frozen. Thecores remained frozen until required for analysis.
Filtered water and suspended particulates >0.5 µm were collected at 7 of the sites.Between 450 and 700 L of water was pumped through a 0.5 µm (nominal)polypropylene (PP) 25 cm cartridge filter (CUNO) at a flow rate of about 12 L/min.The cartridges and particles retained therein were kept for analysis. Filtered andunfiltered water (2 L) was also retained for suspended sediment analysis andradionuclide analysis.
Dissolved (<0.5 µm) 234Th was collected using a 25 cm cellulose melamine cartridge(CUNO Microkleen, 5 µm nominal pore size) impregnated with MnO2. This cartridgewas placed in line with the PP filter cartridge so dissolved radionuclides passingthrough the PP cartridge filter were scavenged by the MnO2. All cartridges wereplaced into clean plastic bags and returned to the laboratory for analysis.

3
Fig. 1. Sediment grain size distribution in Western Port (from Marsden et al.,1979). Segments and sample collection sites are shown. Segments are separatedby dotted lines.
BassRiver
1
8
2
6
7
3
5
4
LangLangRiver
BunyipDrain
EastBasin
Corinella
UpperNorth Arm
East Arm
NorthArm
Rhyll

4
Table 1. Sample collection information
Site Coordinates Approx. location Waterdepth
Watersamples
Cores(diameter)
Corelength(cm)
1 S 38° 29.059E 145° 22.897
East Basin; in mud lensadjacent to mouth of BassRiver
5 m Ebb tide580 litres
2 x 100 mm1 x 50 mm
40, 43135
8 S 38° 23.923E 145° 29.619
Corinella segmentnear Temby Point
3 m Flood tide780 litres
1 x 100 mm 69
2 S 38° 22.384E 145° 30.900
Corinella segment: midwaybetween Corinella and JanJerup point
2 m Ebb tide450 litres
2 x 100 mm1 x 50 mm
43, 46160
3 S 38° 23.433E 145° 25.138
Main channel near Corinella 11 m Flood tide680 litres
No corestaken
7 S 38° 17.422E 145° 28.197
NE Bay; adjacent to mouthof Lang Lang River
1.5 m Ebb tide535 litres
1 x 100 mm1 x 100 mm
3677
6 S 38° 14.873E 145° 27.526
NE Bay; adjacent to mouthof Yallock Ck
2 m Ebb tide755 litres
1 x 100 mm1 x 50 mm
4051
5 S 38° 14.008E 145° 27.306
NE Bay; adjacent to mouthof Bunyip Drain
2 m No watercollected
2 x 100 mm 47
4 S 38° 15.234E 145° 21.683
North Bay: near CharingCross Channel
2 m Flood tide675 litres
2 x 100 mm 22, 22
4 S 38° 15.087E 145° 21.563
North Bay: near CharingCross Channel
4.5 m Ebb tide690 litres
1 x 100 mm 55
Collection of surface sediment samples for particle size analysis occurred over aperiod of 6 days in September 2001. The sediment samples were collected using an‘Eckman’ grab sampler. This device captures up to 300 g of bottom sediment to adepth of ~10-15cm over an area of ~300 cm2. Sampling sites were selected using agrid based procedure (Fig. 2), and located by GPS on the VicEPA vessel. In total 148samples were taken.

5
Fig. 2. Locations of sediment grab samples for particle size determination.
2.2 Analytical procedures
Sediment cores
Visual descriptions of all cores were made prior to analysis, and are listed in Table 2.Descriptions of PVC cores were made after splitting the core in half lengthwise. Eightcores were sectioned for analysis.
The cores were partially thawed in the laboratory and sectioned into depth intervalsranging from 1 cm to 6 cm. Near-surface sections were sampled at smaller depthintervals. Water content (for porosity) and dry mass was determined for each section.Sediment dry density was also determined.
All sediment core sections were sieved prior to further analysis. The sediment waspartitioned into particle size fractions; >500 µm, 500-63 µm and <63 µm. All sizefractions were dried and weighed. The >500 µm fraction was not used for furtheranalysis. The >63 µm fraction was sub-sampled for XRF analysis; the two fractions<500 µm were recombined in their original proportions for alpha and gammaspectrometry (see below).
The total sediment fraction <500 µm was analysed using high-resolution gammaspectrometry (Murray et al., 1987) for 238U, 226Ra, 210Pb and 137Cs. Sediment wasashed at 450° C for 16 hours to determine loss on ignition (LOI). It was then cast inresin and counted for 1-2 days using intrinsic germanium gamma detectors. Thedetectors were calibrated using CANMET uranium ore BL-5, and thorium nitraterefined in 1906 (Amersham International).

6
Radiochemical separation and alpha spectrometry (Martin and Hancock, 1992) wasused to give improved estimates of 210Pb in selected samples (via 210Po analysis). Thismethod involves the addition of a tracer isotope of known activity (supplied byAmersham, ±1% uncertainty), followed by radiochemical separation andelectroplating. The electroplated discs were counted using high-resolution alphaspectrometry.
Major and trace element concentrations were determined on the <63 µm fraction ofsediment using XRF analysis. Prior to analysis the sediment was washed free ofinterstitial salt by shaking the sediment with demineralised water, centrifuging anddecantation. This process was repeated until less than 1% of the original saltremained. Major elements were fused in a lithium borate matrix (Norrish and Hutton,1969). Trace elements were determined using the pressed powder method (Norrishand Chappell, 1977).
Surface sediment samples
After collection the sediment samples for particle size analysis were chilled andtransported to the CSIRO laboratories in Canberra for size analysis. Samples wereinitially sieved to remove sediment >2 mm. This mostly removed shell fragments.Smaller shell fragments and fine carbonates were removed by 10% HCL. Organicmaterial was decomposed using 10% hydrogen peroxide. Sodium hexametaphosphate(Calgon) was added to the treated sample as a dispersant, and sieving and settlingtechniques were used to separate the particle size classes. The sediment pretreatmentand separation procedures are given as a flowchart in Fig. 3. Size classes are <4 µm(clay minerals), 4-63 µm, 63-125 µm, 250-125 µm, 250–500 µm and >500 µm(coarse sands).
The size class data were entered into ARCVIEW and a surface fitting algorithm usedto fit isolines of percent mass for each size class. These were then presented as aseries of overlays. All sediment masses are expressed the dry weight of mineral(inorganic) material, and collated as percentage mass by size class at each location.

7
Table 2. Core descriptions
Site Location Description1 East Arm, East
Basin,135 cm depth
0-16 cm; dark fine-grained clay-rich mud16-24 cm; clay-rich mud with small shell fragments24-42 cm; clay-rich mud with large shell fragments increasing withdepth; many intact mollusc shells.42-135 cm; base of shell bed at 42 cm. Clay-rich mud below 42 cmwith no visible stratification
8 East Arm,southernCorinellasegment
69 cm depth
0-20 cm; brownish fine-grained clay-rich mud; some cavitiesindication the presence of fauna20-42 cm; dark clay-rich mud with large shell fragments42-60 cm; dark clay-rich mud; occasional small shell fragments60-69 cm; dark clay-rich mud; occasional large shell fragments
2 East Arm,North Corinella
segment160 cm depth
0-30 cm; dark clay/silt/sandy sediment; no visible stratification0-50 cm; as above, increasing sand content50-70 cm; increasing density of large shell fragments with depth50-160 cm; base of shell bed at 70 cm; dark clay-rich mud; decreasingwater content with depth.
7 Upper NorthArm inter-tidal;Near mouth ofLang Lang R.36 cm depth
0-8 cm; brownish clay/silt/sand8-20 cm; brownish clay/silt/sand with large shell fragments; isolatedspherical patches of dark organic-rich sediment, 1-2 cm in diameter.20-30 cm; less shell fragments; increasing content of dark organic richmaterial.30-36 cm: dark brown fibrous peaty organic matter dominant
6 Upper NorthArm inter-tidal;near mouth ofYallock Ck51 cm depth
0-12 cm; brownish clay/silt/sand12-22 cm; brownish clay/silt/sand; large shell fragments28-51 cm; compact dark brown clay; low water content; occasionalcoarse angular gravel-sized fragments of terrestrial origin
5 Upper NorthArm inter-tidalNear mouth ofBunyip Drain48 cm depth
0-10 cm; sandy with small intact shells10-20 cm; sandy with large shell fragments; black patches of sediment,possibly organic-rich, 1-2 cm in diameter; occasional plant filaments 2-3 cm in length20-32 cm; increasing density of large shell fragments; numerous intactbivalves; patches of dark sediment32-48 cm; decreasing shell fragments and increasing clay and siltcontent
4 North Arm: nearCharing CrossChannel69 cm depth
0-15 cm; dark brown clay/silt/sand15-40 cm; large shell fragments increasing in density with depth; intactvalves.40-70 cm; dark clay/silt/sand; increasing mud content.

8
Fig. 3. Sample analysis procedure for particle size determination
Bulk Sample
Sub sample approx.100g wet foranalysis
Take sub sample forstorage, dry and weigh
Place 100g sample in settling cylinder and add distilled water to1000 mlThoroughly mix and settle overnight
Making sure water is clearSiphon off saline water
Sieve out shell and large organics using a 4mm sieveDry shell and organics>4mmRecord mass
Dry <4mm sample at400 C and record massRecord mass
Remove carbonatesusing 10% HCL andwash sample Dry sample at 400C and
record mass
Sieve sample using 500, 250,125, and 63µm sieves
Re suspend sample in 200ml of distilled waterand disperse sample using 50ml of 10%sodium hexametaphosphate (calgon) and letstand overnight
Dry 500, 250, 125, and 63µmfractions at 400C and record masses
Place the <63µm sample in a settling cylinder adddistilled water up to the 30 cm mark. Settle out the63–3.9µm fraction
Dry and weigh both the 63–3.9µm andthe <3.9µm fractions and record themasses
Remove organics using 10%Hydrogen peroxide and washsample
Dry sample at400C and recordmass
Sonicate for 6 minutes

9
Water samples
Filter cartridges were ashed at 450° C and analysed for 234Th by gamma spectrometry.Suspended sediment concentrations were determined by filtration of the water samplethrough a 0.2 µm membrane filter, and determination of the dry mass retained by thefilter.
2.3 Tracers and chronometers
The sources and pathways of the radionuclide tracers used in this study are illustratedin Fig. 4.
Suspended particle residence time
Suspended particle residence times are estimated from the activity of ‘excess’ 234Thaccumulated by particles in the water column. The method utilises the fact thatdissolved 234Th (half-life 24 days) is produced by decay of 238U dissolved in seawater. Being particle-reactive, dissolved Th is rapidly scavenged by suspendedparticles. The amount of 234Th activity scavenged by particles is related to the amountof time a particle has spent suspended in sea water. The scavenged 234Th is removedfrom the water column by particle deposition, advection to Bass Strait and radioactivedecay.
Sediment accumulation and chronology using excess 210Pb and 137Cs
The two fallout chronometers used in this study are ‘excess’ 210Pb, and 137Cs. Boththese radionuclides accumulate in soils and sediments as a result of atmosphericfallout. Radioactive 210Pb (half-life 22 years) occurs throughout nature, but the“excess” component found in sediments is usually generated in the atmosphere bydecay of radioactive radon gas. Once formed, atmospheric 210Pb rapidly attaches itselfto dust particles, and is deposited as dry dust or with rainfall. Fallout 210Pb leads to theaccumulation of 210Pb activity over and above that already present in the sediment.The additional 210Pb is termed ‘excess’ 210Pb, and is determined by the differencebetween the total 210Pb and 226Ra activities of the sediment. Once isolated by burial,the excess 210Pb activity of sediment decreases by radioactive decay. Underfavourable conditions therate of sediment accumulation can be determined by the distribution of excess 210Pb inthe sediment profile (Appleby and Oldfield, 1992). The most commonly used modelfor the determination of sediment chronologies is the Constant Rate of Supply (CRS)model. Using this model the age (t) of sediment at depth i is calculated from
(1)
where A i( )is the integrated activity (Bq m-2) of excess 210Pb below depth i, andA( )∞ is the total integrated activity of the sediment column. The model has a set ofassumptions, the validity of which depend on the mechanisms of sediment and 210Pbdelivery to the sediment accumulation zone of the water body.
tA i
Ai = −∞LNMOQP
1
λln
( )
( )

10
Cs-137 (half-life 30 years) is an artificial “man-made” radionuclide originating fromthe atmospheric testing of nuclear weapons that began in the 1950s. The testingresulted in atmospheric fallout of 137Cs on a global scale, and it is detected in surfacesoils of all continents. Olley et al. (1990) calculated that the detection of 137Cs inAustralian sediments indicates that the sediments were deposited after 1958(assuming 137Cs had remained immobile in the sediment profile).
Excess 210Pb and 137Cs are measured using the alpha and gamma spectrometryprocedures outlined above.
Fig. 4. Schematic of radionuclide tracers and chronometers
Optically Stimulated Luminescence (OSL) dating
Optical dating is used to estimate the time elapsed since buried sediment grains werelast exposed to sunlight (Huntley et al., 1985; Aitken, 1998). The method uses therelease of electrons from light-sensitive traps in the crystal defects of quartz andfeldspar grains. On exposure to sunlight trapped electrons are released, resetting theOSL signal to zero. When the grains are buried and hidden from sunlight, they beginto accumulate a trapped-electron population due to the effect of ionizing radiationemitted by the decay of radionuclides present in the deposit. Some of this naturalradioactivity may be derived from within the quartz or feldspar grains, but theradiation dose is mainly derived from the surrounding material. If the effectiveionizing radiation is constant, then the burial time of the grains can be determined by
238Udiss
234Thdiss
Deposition
Transport to Bass Strait234Thpart210Pb137Cs
River input
210Pb137Cs
Atmosphericfallout
Resuspension
Sediment
decay
adsorption ..
λ

11
measuring the dose response stored in the grains (burial dose; De), divided by theeffective ionizing radiation (the dose rate; Dr) such that
Burial-time (years) = Burial-dose (Gy)/Dose Rate (Gy year-1) (2)
Dating of sediment by OSL involves measurements of many discrete aliquots ofsediment grains. These measurements yield an age distribution for each sample. Therange of this distribution depends on how well the grains are bleached (how well theOSL signal is set to zero prior to deposition) and the extent of post-depositionalmixing of sediment. The OSL age distribution of each sample needs to be consideredwith these factors in mind.
Preparation and analysisSediment samples were taken from the cores in the laboratory under subdued redillumination. Sand grains (180-212 µm in diameter) were extracted by wet sieving andetched in hydrofluoric acid. Additional sub-samples of core material were takenadjacent to the OSL samples for determination of water content and lithogenicradionuclide concentrations.
The burial dose was determined by measurement of the OSL from small aliquots(1 mm diameter) of quartz grains. All measurements were made on a Risø automatedTL/OSL reader, fitted with a photomultiplier tube and three U-340 transmissionfilters. The machine has a 90Sr/90Y beta source. The aliquots were analysed using theregenerative-dose protocol described by Roberts et al. (1998), which was modifiedfrom those presented by Murray and Roberts (1998) and by Murray and Mejdahl(1998). The field dose rates were determined by laboratory analysis of theradionuclide concentration in the samples taken from adjacent to the OSL samples.The reported uncertainties of OSL dates are determined by propagating theuncertainties of field and reader doses.
Pinus pollen
Pine trees are exotic to Australia, and detection of Pinus pollen in sediment profilescan be used as a chronological marker. Pines were first introduced to Australia in late1850's and were planted extensively in Victoria by 1870 (Fielding, 1957). The mostcommon species, Monterey Pine (Pinus radiata) begins pollinating after 3-9 years ofage. Large amounts of pollen are released and dispersed by individual trees annually,and grains of Pinus pollen in southern Australia were probably entering regionalpollen rains by about 1880. Significant increases in the regional flux of pollen arelikely to have occurred when plantations of Pines were established in Victoria around1920. Although the timing of the first appearance of Pinus pollen in aquatic sedimentsundoubtedly varies between regions, it is probable that Pinus pollen was widespreadin Victoria by the late 1800’s (Ogden, 2000).
Preparation and analysisThe method is a modification of a Cladoceran extraction method (Ogden, 1996). A 1-2 mL sub-sample of sediment was dispersed in hot 10% KOH. To aid recognition,pollen grains were stained pink by addition of saffranin. The dispersed sedimentswere then sieved and the silt fraction (35-63 µm particle size range), which included

12
Pinus grains, was isolated. Pinus grains were separated from silt-sized inorganic andcoarse-silt organic particles by settling through a 120 cm glass column. Pinus grainsremained in suspension, and were collected and concentrated to 2 mL in volume bysieving.
The whole sample was counted under a dissecting scope at 60x magnification. About1/8 of the sample was removed at a time using a Pasteur pipette and smeared across amicroscope slide, which was left uncovered for counting. Results are expressed asgrains per mL wet sediment.
3. Sediment Transport and Distribution
3.1 Suspended particle residence time
The particle residence time, τ p , is determined from the equation
(3)
whereATh
p is the excess particle-bound activity of 234Th (Bq m-3), given by the difference inthe particle-bound activities of 234Th and 238U;ATh
d is the dissolved activity of 234Th (Bq m-3);
AUd is the dissolved 238U activity (Bq m-3),
and λTh is the 234Th decay constant (= ln2/half-life = 0.029 day-1).
Suspended particulate material (SPM) and dissolved activities of 238U and 234Th aregiven Table 3, along with calculated values of τ p . Dissolved 238U was measured in
two samples, and found to be 39 Bq m-3, a value close to that of the open ocean. Atthe time of sampling the salinity of Western Port did not vary significantly from theocean value (around 36), and the dissolved 238U activity of bay water is likewiseassumed constant. Most of the measured values of dissolved 234Th ( ATh
d ) are close to,
or below detection, and the mean value of all measurements of AThd (0.3 Bq m-3) has
been used in Eqn. 3. Although the relative uncertainty of AThd is high, variation within
its measured range (0-2 Bq m-3) has very little effect on τ p .
In applying Eqn. 3 there are two main assumptions. First, steady state, on a time scaleapproaching the 234Th half-life, is assumed with regard to Th scavenging and removal.This assumption will not always hold in a dynamic environment like Western Port,the most significant parameter showing short-term variation being SPM. Nevertheless,the steady-state assumption can still serve as a useful starting for a comparison ofvarious deposition environments within the bay. SPM concentrations at the time ofthis study were similar at all sites, and close to the concentration mean of data fromlonger-term monitoring sites (data from Victorian EPA). This observation indicatesSPM fluctuations were not likely to have seriously affected determinations of τ p at
the time of sampling.
τλp
Th
Thp
Ud
Thd
Thp
A
A A A=
− +LNM
OQP
1
( )

13
The second assumption supposes that particles entering the water column of WesternPort have zero excess 234Th. Major sources of SPM to the bay include particles withdelivered river water, particles resuspended from the bay floor, and particles fromBass Strait. Due to the very low 238U activities in river water, riverine particlescontain very little excess 234Th. Concentrations of particle-bound 234Th in the oceanare typically 1-2 Bq m-3, similar to values in Western Port water (Table 3). Dependingon the rate of exchange of northern and eastern bay water with ocean water, input ofoceanic particles may contribute significantly to the observed particle-bound activityof 234Th in Western Port, elevating our estimate of τ p . Particles deposited onto the
floor of the bay will lose most of the excess 234Th that they accumulated while in thewater column by radioactive decay over a period of weeks to months. However if theparticle is resuspended within this time frame, some residual excess 234Th activity willremain from the previous resuspension event. This residual activity will lead to anoverestimate of τ p for the new period of resuspension.
This assessment indicates that the values of τ p given in Table 3 may be too high.
However all values of τ p are very low (<1.5 days). On this time scale over-estimation
of τ p has no bearing on our conclusion (section 3.4 below) relating to the mechanism
of particle resuspension and transport.
Table 3. Particle residence times calculated from 234Th and 238U data.Particulate Particulate Particulate Particulate Dissolved
Site Location SPM 234Th 238U 234Thex234Thex
234Th τ p
mg L-1 Bq kg-1 Bq kg-1 Bq kg-1 Bq m-3 Bq m-3 (days)1 East Basin 6.9 135 ± 13 13 ± 9 123 ± 21 0.85 ± 0.15 0.1 ± 0.0 0.77 ± 0.13
8 Corinella South 8.4 163 ± 21 21 ± 7 142 ± 16 1.19 ± 0.13 0.3 ± 0.1 1.09 ± 0.12
2 Corinella North 10.0 78 ± 15 12 ± 8 66 ± 20 0.66 ± 0.20 0.5 ± 1.4 0.60 ± 0.18
3 East ArmChannel
7.1 236 ± 26 20 ± 10 216 ± 31 1.53 ± 0.22 0.3 ± 0.5 1.42 ± 0.21
4 Charing Cross(ebb)
7.6 121 ± 13 8 ± 7 113 ± 17 0.86 ± 0.13 0.2 ± 0.2 0.78 ± 0.12
4 Charing Cross(flood)
8.9 135 ± 13 18 ± 6 117 ± 15 1.04 ± 0.14 0.3 ± 0.7 0.95 ± 0.12
6 Yallock Ck. 7.6 122 ± 13 9 ± 6 113 ± 17 0.86 ± 0.13 0.3 ± 1.9 0.78 ± 0.12
7 Lang Lang 7.9 135 ± 14 15 ± 9 121 ± 18 0.95 ± 0.14 0.2 ± 0.1 0.87 ± 0.13
The distribution of τ p in Western Port is shown in Fig. 5. No spatial trend is seen,
with most values lying between 0.6-1.0 day. These small values indicate a dynamiccycle of frequent input and rapid removal of particles from the water column. Theimplications for particle transport in the bay are discussed in section 3.4 below.

14
Fig. 5. Distribution of suspended particle residence times (τ p). Units aredays.
3.2 Sediment distribution
The distribution of the particle size fractions are shown in Fig. 6. The distribution ofclay-rich sediment (<4 µm) appears to be consolidated within three main regions ofthe bay; the eastern side of the Upper North Arm in a zone extending ~5 km offshoreencompassing the mouths of Yallock Creek and the Lang Lang River; the easternedge of the Corinella segment (two main areas); and the Rhyll segment including theEast Basin. Some of these regions match the distribution of the corresponding sizefraction mapped by Marsden et al., (1979) (Fig. 1), although there are two majordifferences. The first is that clay deposits mapped by Marsden offshore from theBunyip Drain and Cardinia Creek are no longer present. The second major differenceis the appearance of major clay-rich deposits offshore of eastern Phillip Island,adjacent to the East Basin.
The ‘mud’ (<63 µm) class of sediment includes, clay, silt and fine sands. Itsdistribution shows a similar pattern to the clay fraction, with the same three zones ofaccumulation. The sediment size fractions >63 µm (light areas) are concentrated inthe deeper channels and adjacent to the mouths of Cardinia Creek, Bunyip Drain andBass River.
The coarsest size fraction (>500 µm) is present in the lobes offshore of the Cardiniaand Bunyip, but not the Bass. Sediment adjacent to the Bass River mouth falls mainlyin the 250-500 µm size range. Only minor deposits of fine sands are seen off-shorefrom the Lang Lang River mouth.
0.8
0.61.4
0.8
1.1
1.0 0.8
0.9
FrenchIsland
PhillipIsland
Hastings
Corinella

15
Fig. 6. Particle size distribution (%) of surface sediment;<4 µm (top) and <63 µm (bottom).

16
Fig. 6. continued. Particle size distribution of surface sediment;4-250 µm (top); 250-500 µm (middle) and >500 µm (bottom).

17
3.3 Excess 210Pb and 137Cs inventories
Bottom sediment inventories of excess 210Pb and 137Cs activity are determined byintegrating their activities over the entire sediment profile, from the surface down to alevel where the excess 210Pb activity is consistent with zero, ie.
(4)
where Ai is the activity of the ith section of the core, numbered downwards.
Analysis of the various particle size fraction of selected sediment grab samples fromwithin the bay show that excess 210Pb and 137Cs is held almost exclusively held by themud (<63 µm) fraction. Bottom sediment inventories of excess 210Pb and 137Cs aretherefore expected to provide similar information to the <63 µm sediment distributionmap, but with the addition of time-averaged estimates of mud accumulation. Byexamining the values of inventories in various parts of the bay the relative efficiencyof mud entrapment within specific zones over the last 40-60 years is quantified,indicating focal points for sediment deposition and longer-term transport routes.
The distribution of excess 210Pb and 137Cs inventories determined in seven cores isshown in Fig. 7. Inventories of both tracers are lowest in the Upper North Arm, andgenerally increase in a clockwise direction southwards. An exception is northernCorinella site (site 2), at which the 137Cs inventory in particular is much higher thanall other sites. Explanations for this high value are discussed in section 4.2 below.
Fig. 7. Inventories of excess 210Pb and 137Cs (square brackets).
I Aii
==
∞
1
FrenchIsland
PhillipIsland
Hastings
Corinella
590[94]
630[110]
[66]
4080
1140
[150]2890
[110]570
5010[220]
[660]

18
The excess 210Pb inventories in the Upper North Arm are much lower than theinventories expected solely from atmospheric fallout in southeast Australia. Theexpected excess 210Pb inventory due to fallout is 2000 Bq m-2 (Turekian et al., 1977).Normally low inventories would indicate a zone of low mud sedimentation and/orerosion of mud-sized sediment. East Arm sites show excess 210Pb inventories higherthan expected from fallout, indicating that the Corinella and Rhyll segments are majordeposition zones for mud.
3.4 Discussion and summary of sediment transport and distribution results
Suspended particle residence times of less than one day indicate a dynamic cycle ofinput and removal of suspended particles. The immediate source of the suspendedparticles to the water column is mainly resuspended sediment from the bay floor,rather than riverine sediment directly transported from the mouths of rivers andstreams. This conclusion is reached via a simple mass balance calculation. The rate ofremoval of sediment from the bay water column (F) can be roughly estimated by
F = CpVτp (5)
where Cp is the mean SPM concentration in the bay (0.008 g L-1), and V is the volumeof water in the bay (about 2 x 10⁹ m3; Shapiro, 1975). A particle residence time of 1day is used for τ p . Using these values F is estimated to be about 6 x 10⁶ t yr-1, a load
two orders of magnitude higher than sediment input loads estimated from rivermonitoring (section 1). Although terrestrial sediment undoubtedly makes up a largecomponent of SPM in the bay, this calculation shows that the immediate source of themost of the SPM in the bay is not SPM delivered directly to the bay by rivers, butrather deposited sediment resuspended from the floor of the bay. This situation is onlylikely to change during rare periods of very high river flow.
The resuspension of sediment and its removal from the water column on a time scaleof >1 day is best explained by the action of the tides. Water movement in the bay isdominated by the motion of the tides (Marsden, 1979), and the potential exists forresuspension of sediment from the shallow inter-tidal regions of the Upper North Arm(Harris et al. 1979). The mechanisms of particle removal from the water columninclude redeposition onto the bay floor, and/or transport to Bass Strait. Of these twoparticle removal processes it is likely that deposition dominates. This is concludedfrom the very low and relatively constant values of τ p seen throughout the bay, and
the trend in excess 210Pb and 137Cs inventories. Harris and Robinson (1979) indicatedan exchange period of weeks-months for water in the upper parts of Western Port. If asignificant fraction ofsuspended particles were being transported to Bass Strait during a single phase ofsuspension (ie. without being redeposited somewhere in the bay), a range of values ofτ p (from days to weeks) would be expected, with values increasing southwards. To
explain the short and relatively constant values of τ p , sediment transport must be
happening mainly as a series of short (<1 day) resuspension and deposition episodes,rather than as a single episode of resuspension and transport.

19
The deposition-resuspension cycle, in conjunction with the net clockwise movementof water in the bay (Marsden, 1979; Hinwood, 1979) provides a mechanism forsediment movement which is consistent with both the observed distribution of mud inthe bay and the trend in excess 210Pb and 137Cs inventories. Fig 8 schematicallydescribes the model of sediment transport and deposition which has emerged fromthis study, whereby fine-grained sediment is apparently being focussed in the easternand southern regions of the bay by a continual cycle of resuspension and deposition.Some of the sediment deposited in the East Basin will certainly have been deliveredthrough the mouth of the adjacent Bass River, but this model of sediment transportsuggests a significant contribution from northern river inputs as well.
The model also provides a mechanism to explain the differences observed in the claymineral distribution shown by the maps produced by Marsden et al. (1979) (Fig. 1)and our recent work (Fig 4). These differences indicate a decrease in the extent ofmud-dominated areas in the north, and an increase in the south, especially in andaround the East Basin. If these differences are a true reflection of changes in thesediment distribution, north-south transport of mud may have significantly changedthe composition of the bottom sediment substrate in some areas of the bay over thelast twenty years. Some of these apparent changes in substrate composition haveoccurred in areas affected by seagrass loss.
4. Sediment Accumulation
4.1 Grain size composition of sediment cores
Visual inspection indicated very little fine layering, although coarse bands of varyingcomposition are present in all cores. The core from site 7 (Lang Lang) is unique, inthat it contains what appears to be a thick layer of fibrous peat-like organic-richmaterial at depths greater than 25 cm. At site 8 (south Corinella) a distinct colourationchange occurs at a depth of about 25 cm depth, from light brown to a dark grey. Thischange is not associated with organic matter content, and probably indicates a changefrom oxygen-rich to anaerobic conditions in the sediment. Bioturbation (mixing) inthe upper sediment layer is probably responsible for this change.
Porosity varies from core to core, and is usually highest in the surface layer, and inlayers of fine-grained clay-rich sediment. The organic matter content, as estimated byloss on ignition at 450° C, is mostly less than 15% by mass, the exception being site 7.This is probably related to the peat-like material (discussed above). Patches of darksediment, possibly organic-rich, were seen below 10 cm in the core from site 5(Bunyip Drain) but no trend is seen in the LOI data. Notably absent were recognisableremains of past seagrass beds in Upper North Arm cores, as noted by Wilk et al.(1979).

20
Fig. 8. Schematic illustrating the sediment transport model.

21
Three particle size fractions are used to broadly describe the composition of thesediment; >500 µm, 500-63 µm, and <63 µm. In all cores except one the >500 µmfraction is made up entirely of shell fragments, and this fraction has been used toestimate the shell content of the sediment. Once again the exception is the deepsediment from site 7 which contains fibrous matted organic matter. The degree offragmentation of the >500 µm fraction varies considerably, ranging from fully intactbi-valves up to 20 cm wide, to angular broken fragments not much greater than500 µm. The intermediate size fraction (500 to 63 µm) consists mostly of quartzgrains, and this size fraction has been used to estimate the sand content of the cores.The finest size fraction (<63 µm) contains mostly silt and clay minerals.
Variations in the mud (silt/clay), sand and shell composition with depth in all sevencores are shown in Fig. 9. The LOI (organic) component is not included, so thesefigures represent just the inorganic (mineral) fraction of the sediment. All corescontain mud, but the content varies. The mud fraction is lowest in the surface 10 cmof the Upper North Arm, mostly lying in the range 8-40%, and greatest (>99%) in thecores from the south Corinella and East Basin sites. By contrast, the sand content ofthe cores is greatest at the northern sites, comprising 40-80% by mass in the upper10 cm of sediment. In most of the northern cores the sand content increases towardsthe surface.
The shell content of the cores is also variable. Shell beds, made up of layers of intactand fragmented mollusc shells interspersed with sediment, are a feature of the EastArm cores. The beds generally cover a depth interval of about 20 cm. Upper NorthArm cores also have a large component of shell fragments, but these fragments aremore evenly distributed through the upper layer.
4.2 Application of chronological methods
Sediment accumulation was initially assessed using routine 210Pb and 137Csgeochronology. However doubts about the validity of the basic assumptions of thismethod, and the possibility of post-depositional mixing of the sediment profile hasprecluded high-resolution dating, and limited the time span over which dating couldbe confidently applied. Where suitable core sediment remained additional dating wasundertaken using OSL and Pinus pollen methods. This was done to extend thehistorical period, and to corroborate 210Pb and 137Cs chronologies. Profiles of selectedparameters from each site are shown in Figs 10-16. All sediment data is listed in theAppendix.
210Pb and 137Cs geochronology
In most cores excess 210Pb activity is highest near the top of the core, and decreaseswith depth. The depth at which excess 210Pb becomes undetectable varies from core tocore (detection limit ~2-3 Bq kg-1), but the depth of penetration of detectable excess210Pb and 137Cs is greatest in the cores from the East Arm. These cores also showapproximately constant excess 210Pb activity in the upper sediment layer.

22
Fig. 9. Sediment composition depth profiles. The organic (LOI) component has been excluded. Profiles listed from left to rightcorrespond to a north-south clockwise direction around the bay (see inset)
Site 2
% Mass
Dep
th(c
m)
Sand
Shells
Silt/clay (mud)
0 1003
63
51
39
27
15
75
1000
46
2
30
8
16
115
2
1000
22
43
68
1000
120
3
28
53
81
1000
67
4
22
46
Pre-1933
Site 4
Pre-1958
Pre-1950
Pre-1890
10
21
39
Pre-1890
30
1000
18
3
4 56
728
1
Site 5Site 6
Site 7
Site 8
Site 1
Pre-1958
Pre-1958
Pre-1958
0 100
Pre-1958
Pre-1945
MixedMixed

23
Mixing of the upper sediment layer by macrofauna (bioturbation) is common inmarine sediment, and where it occurs on a time scale less than the 210Pb half-life (22years) a layer of constant excess 210Pb activity is usually seen (eg. Hancock et al.,2000). In such cases a 2-layer mixing model (Berger and Heath, 1968) is sometimesapplied to interpret the 210Pb profile. This model assumes vertical mixing of sedimentoccurs in an upper layer of constant depth at a more or less constant rate. Below theupper layer mixing is assumed absent. As sediment accumulates the mixed layer isassumed to move upwards in synchrony with the sediment column. As this happenssediment is transferred from the mixed layer into the unmixed layer at a ratedetermined by the rate of sediment accumulation. Once in the unmixed layer, excess210Pb decays in accordance with its half-life. The mean rate of sediment accumulationaveraged over the last 60-70 years (about three 210Pb half-lives) can be estimated fromthe slope of the linear regression of log excess 210Pb activity against depth in thesegment of the profile immediately below the mixed layer (Figures 10, 11 anddiscussion below).
In applying the 2-layer model it is assumed that the excess 210Pb activity of thesediment transferred into the bottom (unmixed) layer is approximately constant. Inmost near-shore marine sediment this assumption is reasonable given the largeapparent depth of the mixed layer (usually greater than 10 cm). Although the excess210Pb activity of depositing sediment will vary as a result of the “flashy” nature ofriver flow and sediment delivery to the bay, the homogenising effect of bioturbationwithin a thick layer of sediment can have the effect of smoothing 210Pb activityvariations to the point where steady 210Pb activity at the base of the mixed layer canbe reasonably assumed. The other important assumption of the 2-layer model is thatmixing is assumed absent below the mixed layer. If slow mixing is occurring belowthe rapidly mixed layer the rate of sediment accumulation will be over-estimated.Such a situation was seen in Port Phillip Bay sediment (Hancock and Hunter, 1999).Deep mixing may also occur in Western Port sediment, and accumulation ratesdetermined using the 2-layer model should be considered upper limits.
In cores from the northern sites the excess 210Pb activity of the upper sediment is morevariable, and interpretation more problematic. If mixing is occurring at these sites thedepth and rate of mixing is uncertain, and application of the 2-layer mixing model isnot viable. Proper application of the constant 210Pb flux model (the CRS model) isalso questionable at some Upper North Arm sites, given the very few measurementsof detectable excess 210Pb obtained from some core profiles, and the variable input ofsediment (and hence 210Pb) into this region of the bay. Nevertheless, a time horizoncan often be determined by assessing 210Pb profiles in a similar way to 137Cs; ie. bydetermining the depth at which excess 210Pb becomes undetectable. For most cores inthe Upper North Arm excess 210Pb becomes undetectable at about 10-15% of theexcess 210Pb activity of sediment at the surface of the core, equivalent to radioactivedecay over a period of around three 210Pb half-lives (about 60 years). Using thisrationale, it can be confidently predicted that the sediment horizon at which excess210Pb becomes undetectable was deposited prior to 1940.

24
Figures 10-16. Sediment core profiles. Filled circles, excess 210Pb; unfilled circles,137Cs; filled diamonds, mass ratio of P/Fe; unfilled diamonds, mass ratio of P/Al;unfilled squares, Cu; unfilled triangle, Mo; filled squares, SO3; filled triangles,loss on ignition (LOI). Lines associated with the excess 210Pb plots (Figs 6 and 7)represent linear regression plots.
Fig. 10
Fig. 11
Site 1
Excess 210Pb (Bq kg-1)
1 10
Dep
th(c
m)
0
20
40
60
80
100
137Cs (Bq kg-1)
0 2 4 6 8
LOI (%)
0 5 10 150
20
40
60
80
100
0.48 cm yr-1
Mixed
layer
notdetectedSO3 (%)
0 1 2
0
20
40
60
80
100
Cu, Mo (µg g-1)
0 20
Cu
P/Fe
0.5 1.0 1.5 2.00
20
40
60
80
100
120
P/Al
0.4 0.6 0.8
Site 8
Excess 210Pb (Bq kg-1)
1 10
Dep
th(c
m)
0
20
40
60
137Cs (Bq kg-1)
0 2 4 6 8
0.21 cm yr-1
LOI (%)
0 5 10 150
20
40
60
Cu, Mo (µg g-1)
0 20 40 600
20
40
60
SO3 (%)
0 1 2 3 4
Cu
Mo
notdetectable
SO3
P/Fe
0.5 1.0 1.50
20
40
60
P/Al
0.4 0.6 0.8

25
Fig. 12
Fig. 13
Site 2
Excess 210Pb (Bq kg-1)
1 10
Dep
th(c
m)
0
20
40
60
80
100
120
140
137Cs (Bq kg-1)
0 2 4 6 8 10
notdetected
Cu, Mo (µg g-1)
0 20 400
20
40
60
80
100
120
140
SO3 (%)
0 1 2 3 4 5
CuMo
LOI (%)
0 5 10 150
20
40
60
80
100
120
140
SO3
P/Fe
0 1 20
20
40
60
80
100
120
140
P/Al
0.0 0.4 0.8
Site 7
Excess 210Pb (Bq kg-1)
10
Dep
th(c
m)
0
10
20
30
40
137Cs (Bq kg-1)
0 2 4 6 8 10
LOI (%)
0 10 20 300
10
20
30
40
Cu, Mo (µg g-1)
0 20 400
10
20
30
40
SO3 (%)
0.2 0.4 0.6
SO3
Mo
Cu
P/Fe (x 102)
0.0 0.5 1.0 1.50
10
20
30
40
P/Al
0.2 0.4 0.6

26
Fig. 14
Fig. 15
Site 6
Excess 210Pb (Bq kg-1)
10
Dep
th(c
m)
0
10
20
30
40
137Cs (Bq kg-1)
0 2 4 6 8 10
LOI (%)
0 10 200
10
20
30
40
notdetected
Site 5
Excess 210Pb (Bq kg-1)
1 10
Dep
th(c
m)
0
10
20
30
40
50
137Cs (Bg kg-1)
0 4 8
notdetected
P/Fe (x 102)
0 1 20
10
20
30
40
50
P/Al
0.0 0.5 1.0
LOI (%)0 10 20
0
10
20
30
40
50

27
Fig. 16
OSL
OSL dating was attempted on 5 cores. One or two layers were analysed from eachcore, each layer corresponding to a vertical depth interval of up to 10 cm. The entiresediment profile from site 1, and deep sediment from site 2 (>70 cm) was foundunsuitable for OSL dating due to the lack of sand-sized quartz and feldspar grains.
Successful OSL dating results from four sites are given in Table 4. Dates areexpressed as the minimum, maximum and mean ages of at least 40 small aliquotmeasurements. The age range in some depth sections is quite large, and may representpoor grain bleaching, or mixing of varying proportions of young and old sediment.
Table 4. Results of OSL dating. Uncertainties in age determinations are due toanalytical uncertainties.
Site Location Depth(cm)
Min age(years)
Max age(years)
Mean age(years)
2 Corinella (north) 57-62 40 ±10 40 ±10 40 ±10
7 Upper North Arm (Lang Lang) 18-24 50 ±10 200 ±20 170 ±40
6 Upper North Arm (Yallock Ck) 10-18 30 ±10 4000 ±400 170 ±30
4 Upper North Arm (CharingCross)
4-10 <10 420 ±60 45 ±6
36-46 680 ±60 2340 ±270 1630 ±50
Pinus pollen
Site 4
Excess 210Pb (Bq kg-1)
1 10
Dep
th(c
m)
0
20
40
60
80
137Cs (Bq kg-1)
0 2 4 6
LOI (%)
0 10 200
20
40
60
80
notdetected

28
The relatively sensitive method of Ogden (1996) has been used to detect Pinus pollenin Western Port sediments. Given the sensitivity of the method, and the proximity ofthe Western Port catchment to a large population center (Melbourne), it is assumedthat Pinus pollen would have been easily detectable in Western Port sediments by thelate 1800’s. A date of 1890 (±10 years) is assigned to the sediment horizon of firstdetection.
Two of the longest cores, from sites 1 and 2 (East Basin and Corinella north), werechosen for pollen determinations, as these were expected to provide the longesthistorical record of sedimentation, and because the alternative dating method, OSL,provided little or no chronological information for these cores. Pinus pollenconcentration profiles are given in Table 5.
Table 5. Pinus abundance in two cores from the East Arm.
Location Depth(cm)
Pinus pollen(grains g-1 wet sediment)
Site 1(East Basin)
7-13 3025-30 2135-40 1246-52 258-64 164-72 072-80 088-96 0
Site 2(Corinella north)
7-13 2424-30 1443-49 1362-70 1070-78 486-94 0
102-110 0112-120 0

29
4.3 Core chronologies
In this section the chronology and sedimentation history of each core is evaluated anddiscussed. Discussion is ordered by location, from south to north, starting at site 1(East Basin). Time horizons are shown in Fig. 9, and the chronologies are summarisedin Table 6.
Site 1 (East Basin)
A combination of measurements from two adjacent cores are used to determine thesediment chronology at this site. The two cores include a short core (length 43 cm)and a long core (135 cm). The radionuclide profiles and the occurrence of a denseshell layer at 35-45 cm correlate well in both cores, and the two profiles areconsidered to be well matched. OSL dating of sediment from the long core wasattempted but was unsuccessful due to the lack of sand-sized grains.
The 2-layer mixing model is applied to the excess 210Pb profile. Approximatelyconstant excess 210Pb activity is seen in the upper 18 cm (±2 cm) of sediment (Fig. 10)and is assumed to be due to mixing. Below the mixed layer the log-linear plot ofactivity and depth is approximately linear. Applying a linear regression to the lowerlayer gives a mean accumulation rate over the last 60 years of 0.48 ±0.05 cm yr-1.
The 137Cs profile is consistent with the 210Pb accumulation rate. Cs-137 is seen to adepth of 42 cm, equivalent to a penetration depth of 24 cm below the mixed layer.The 137Cs estimate of sediment accumulation is therefore given by 24 cm/42 years, or0.57 cm yr-1. Given the depth resolution of core sectioning (4 cm), and the uncertaintyin thickness of the mixed layer (±2 cm), this accumulation rate is probably notsignificantly different to the 210Pb-derived rate.
Based on the excess 210Pb accumulation rate, sediment below 42 cm is older thanabout 50 years (pre-1950 A D). It should be recognised however, that sediment at42 cm does not necessarily represent the characteristics of sediment deposited in1950. Due to the homogenising effect of the mixing, sediment emerging from beneaththe mixed layer exhibits a mixture of the characteristics of sediment deposited over aperiod of time equal to the time it takes sediment grains to move through the mixedlayer. This time is equal to the depth of the mixed layer divided by the accumulationrate, and is 37 years at site 1 (18 cm/0.48 cm yr-1). Thus sediment at 42 cm exhibitscharacteristics of sediment deposited over a 37 year period prior to 1950, ie. 1913-1950.
Pinus pollen at site 1 (Table 5) is abundant in the upper 42 cm of sediment at site 1. Itbecomes less abundant below 46 cm and is not detected below 64 cm. If sediment at42 cm is dated at 1950, the horizon of first appearance of Pinus, dated at 1890, is22 cm deeper. The mean accumulation rate between 1890 and 1944 is therefore0.37 cm yr-1 (22 cm/60 years). This rate is not much different to the apparent 210Pb-137Cs rate determined for the last 50 years, and indicates a reasonably constantaccumulation rate over the last 100 years at this site.
Site 8 (Corinella south)

30
This core shows similar trends in excess 210Pb activity to site 1, and the 2-layer mixingmodel is applied. Constant excess 210Pb activity is seen to a depth of 22 cm indicatingrapid mixing. The observation of brownish sediment to a depth of about 25 cm is alsoconsistent with sediment oxidation induced by rapid mixing. Below 22 cm a linearregression of excess 210Pb activity and depth yields an accumulation rate of0.21 ±0.03 cm yr-1. As was the case at site 1, the 137Cs profile is consistent with theexcess 210Pb estimate of accumulation. The maximum depth of 137Cs detection is32 cm, or 10 cm below the mixed layer, yielding an average 42-year accumulationrate of 0.24 cm yr-1.
Excess 210Pb is not detected below 36 cm, or 14 cm below the base of the mixed layer.Assuming an accumulation rate of 0.21 cm yr-1, sediment below 36 cm is dated asbeing older than 67 years (14 cm/0.21 cm yr-1), or pre-1933.
Site 2 (Corinella north)
Excess 210Pb activity is approximately constant (~20 Bq kg-1) to a depth of 62 cm. Theactivity decreases rapidly below this depth and is not detected below 70 cm. Thedeepest detectable 137Cs activity occurs in the 57-62 cm depth interval.
The rapid disappearance of excess 210Pb below 62 cm does not allow for more than avery crude estimate of sediment accumulation. The lack of excess 210Pb below 70 cmindicates that this sediment is older than about three 210Pb half-lives (66 years, pre-1934). Applying the 2-layer mixing model with a 62 cm mixed layer gives anaccumulation rate of <0.1 cm yr-1. However, such a deep layer of rapid mixing mustbe considered unlikely, given that the mixing depths at site1 and site 8 are less than25 cm.
An alternative explanation is that the layer of constant excess 210Pb activity representsa period of very rapid accumulation of sediment. This explanation is supported byOSL dating, and by the relatively high 137Cs inventory. The OSL technique gave asimilar and very concise dose value (standard error 7%) for all aliquots of sand-sizedsediment sampled from the 57-62 cm depth interval. This result indicates a verynarrow age range. If the sediment in the upper 62 cm represented slow accumulationand post-depositional mixing a broad dose range reflecting a wide range of sedimentages would have been seen. Thus OSL dating of the 57-62 cm depth section (40 ±10years) indicates that the entire upper 62 cm has been deposited within the last 50years, with an average accumulation rate of 1.6 ±0.4 cm yr-1. The relatively high 137Csinventory at this site shows that the amount of sediment that has accumulated since1960 is much higher than other areas of the bay, in agreement with the OSLinterpretation.
In summary, the 210Pb, 137Cs and OSL chronologies are consistent with an age of 42years or less for sediment above 62 cm, and indicate that substantial deposition ofsediment has occurred at this site in the last 40 years.
Pinus pollen is plentiful to a depth of 62 cm. It is detected in smaller quantitiesbetween 62 and 78 cm and is not seen below 86 cm. This places the 1890 horizon

31
between 78 and 86 cm, and yields an accumulation rate of around 0.3 cm yr-1 for theperiod between 1890 and 1958.
Site 7 (near Lang Lang R. mouth)
Sediment at site 7 overlies a dense layer of organic-rich peat-like material (describedabove), the proportion of which increases markedly below 20 cm. Excess 210Pbactivity is not constant in the upper layers (Fig. 13), indicating that if vertical mixingis occurring at this site it is restricted to the upper few cm. Excess 210Pb activitydecreases rapidly below 10 cm to a minimum at about 20 cm. It then increases slightlyto low positive values between 20 and 32 cm.
A non-monotonic decrease of excess 210Pb with depth is often indicative of variablerates of sediment accumulation (Appleby and Oldfield, 1992). In these cases the CRSmodel is commonly used to determine a chronology. The model assumes a constantrate of 210Pb supply to the sediment, a doubtful assumption in a dynamic environmentsuch as Western Port. Nevertheless, if approximately steady state conditions areassumed between supply of 210Pb by deposition of fine-grained particles, and loss byresuspension and transport to other areas of the bay, the model can serve as a usefulstarting point in constraining sediment ages. Application of this model yields the ageversus depth plot shown in Fig. 17.
The CRS age profile agrees well with the first appearance 137Cs at 12 cm, giving anage of 44 ±6 years. The oldest CRS-dated sediment occurs at 28 cm, with an age of132 ±7 years. The latter age should be treated with some caution, as 210Pb dating ofsediment older than 100 years is less reliable than dating of younger sediment,especially where the assumptions of the dating model are questionable. Even so, someage constraints can be confidently applied. The agreement of 210Pb ages with the firstappearance of 137Cs indicates that ages down to 12 cm are reasonable. OSL dating ofthe 18-24 cm depth interval yielded ages in the range 50-200 years. The youngest ageis 55 ±5 years. This age compares reasonably with the nearest equivalent 210Pb-datedsection (66 to 78 years in the 16-20 cm depth interval). If the minimum OSL age of 55years is assumed to be associated with the uppermost portion of the 18-24 cm interval(say 18 cm), an accumulation rate of ~0.5 cm yr-1 is indicated between 12 cm (datedat 1958 by 137Cs) and 18 cm (dated at 1945 by OSL).

32
The maximum OSL age of 200 years in the 18-24 cm interval is not consistent withthe 210Pb ages, as the presence of detectable excess 210Pb at 20-30 cm dates the mudfraction of sediment above 30 cm as less than 100 years old. Poorly bleached sandgrains, or mixing of young sediment with sand grains from older deeper sediment arepossible explanations for the disparity.
Figs. 17 and 18. 210Pb and 137Cs age versus depth plots at site 7 (left) and site 5(right). Filled circles, CRS 210Pb ages; unfilled circles, 137Cs horizon. Error barsare determined by propagation of analytical uncertainties.
Site 6 (near Yallock Ck. mouth)
Excess 210Pb activity is low and limited to the upper 12 cm of sediment (Fig. 14).Neither excess 210Pb nor 137Cs are detected below 12 cm. In combination, the 210Pband 137Cs activities indicate that sediment below 12 cm is older than 42 years.
OSL dating of the 10-20 cm interval yields an age range of 25-4000 years. If theyoungest sediment is assumed to come from the uppermost portion of the interval (say10 cm) the minimum OSL age of 25 years is consistent with the 210Pb-137Cschronology. Again, OSL indicates that mixing of young and very old sand grains hasoccurred and the accumulation rate determined from 210Pb and 137Cs in the upper12 cm (0.3 cm yr-1) is therefore an upper limit.
Site 5 ( near Bunyip Drain mouth)
The excess 210Pb profile at site 5 is similar to site 7; a sub-surface maximum (14 cm)decreasing to non-detectable activity below 28 cm (Fig. 15). Cs-137 activity is notdetectable below 24 cm. Applying the CRS model gives an age versus depth plot
Site 5
Age (years)
0 20 40 60 80 100
Dep
th(c
m)
0
10
20
30
137Cs
Site 7
Age (years)
0 40 80 120 160
Dep
th(c
m)
0
10
20
30
40
137Cs

33
shown in Fig. 18. The oldest sediment able to be dated occurs at 24 cm, with an age of65 ±3 years. The appearance of 137Cs in the 20-24 cm depth interval agrees within thebounds of the 210Pb chronology (35-68 years).
Based on this chronology, sediment at 24 cm is dated as 42-68 years and theaccumulation rate for the upper 24 cm is 0.35-55 cm yr-1.
Site 4 (Charing Cross)
Excess 210Pb and 137Cs are not detected below 18 cm (Fig. 16), dating this sediment aspre-1958. It is interesting to note the absence of excess 210Pb and 137Cs in the 0-6 cminterval. Given that this sediment must be younger than sediment below it, the lack ofthese two tracers indicates recent deposition of sediment not exposed to fallouttracers. This sediment must have come from a subsoil source; either remobilisation ofburied marine sand, or subsoil erosion of the Westernport catchment.
The OSL age range for the 4-10 cm interval is <10 to 420 years. Most of the agemeasurements were at the younger end of the age range, with a median age of 45 ±6years. In combination, the OSL and 210Pb and 137Cs chronologies indicate a mixture ofyoung and old sediment to a depth of 18 cm. The accumulation over the last 40 yearsrate is therefore less than 0.4 cm yr-1.
The OSL age range for the 36-46 cm interval is 680-2340 years. The much greater ageof this deeper layer shows that the effects of sediment influx over the last century islimited to sediment above 36 cm. The very large age range of quartz grains below36 cm indicates relict marine sand deposited prior to European settlement.
4.4 Major and trace elements
Tables of selected major and trace elements for cores from sites 1, 5, 7 and 8 are givenin the Appendix. Most elements show little change with depth. Exceptions are P, Cuand Mo, all of which show consistent trends at all sites. P shows a general decreasewith depth. Plots of the mass ratio of P/Fe and P/Al are shown in Figs. 10, 11, 12, 13and 14. P is normalised to both Fe and Al to correct for variation in particle size andclay- mineral content of the sediment. Al and Fe are usually good indicators of theclay mineral content of the bulk sediment, and due to their small particle size range(<2 µm) clay minerals bind most of the available P in aquatic systems (Golterman,1973), either by direct adsorption to particle surfaces, or bound to Fe-oxides coatingthe soil grains (Norrish and Rosser, 1983). The P/Fe and P/Al ratios both showsimilar trends; an increase in the upper layer of sediment at all sites where it they weremeasured, corresponding to an increase of 50-100% over deeper sediment.

34
Table 6. Summary of core chronologies and historical accumulation rates.
Site Depth Chronology Accumulation rate
1 0-18 cm Mixed layer; age range 0-37 years Not known, but 0.48 cm yr-1
assumed42 cm Sediment below 42 cm is pre-1950. 0.48 cm yr-1
64 cm Sediment below 64 cm is pre-1890. 0.37 cm yr-1
8 0-22 cm Mixed layer; age range 0-105 years Not known, but 0.21 cm yr-1
assumed22-36 cm Sediment below 36 cm is pre-1950 0.21 cm yr-1
2 0-62 cm Very rapid deposition >1.6 cm yr-1
62-86 cm Sediment below 62 cm is pre-1958Sediment below 86 cm is pre-1890
0.30 cm yr-1
7 0-12 cm 0-42 years; sediment below 12 cm pre-1958;old and young sand present
<0.30 cm yr-1
12-18 cm 42-55 years <0.50 cm yr-1
18-30 cm Transition into dense “peat” layer; 55 to <100years;
>0.25 cm yr-1
6 0-12 cm 0-42 years; old and young sand present <0.3 cm yr-1
5 0-24 cm 0-42 years 0.35-0.55 cm yr-1
4 0-18 cm 0 to 42 years; old and young sand present <0.4 cm yr-1
36 cm Sediment below 36 cm >680 years. n.d.
Although these higher levels of P are associated with sediment deposited in the bayover the last 40 years (based on the chronologies determined above) it is noted that theelevated concentrations of P are not high compared to natural levels of P in soils(Norrish and Rosser, 1983). Moreover, it is not known whether the elevated P isderived directly from the Westerport catchment, or whether it has accumulated in theupper layer of sediment as a result of in-situ biological activity and/or desorption oforganic matter (dead plankton). Enrichment of organic matter in the upper sedimentlayer would lead to elevated levels of P. The required increase in organic matter,which is approximately 1% P dry weight, would not need to be more than a few % ofthe total sediment mass to account for the observed elevation in P, and would not beeasy to detect using LOI measurements. The origin of this elevated P is the subject offurther investigation.
Cu, Mo and S are plotted in Figs 10,11,12 and 13. Both show a concentration increaseat some point in the sediment profile, although the trend at site 1 is weak. At site 2, Cuconcentrations reach a maximum at 100 cm, and decrease at greater depths.Molybdenum shows similar trends to Cu. The cause of these variations is uncertain,although the correlation of Cu and Mo with S indicates diagenesis is likely, ie.diffusion, dissolution and precipitation of various chemical phases due to changingredox conditions in the sediment profile. Cu and Mo are known for their ability to beincorporated into sulphides in anoxic sediments (Calvert, 1976). The elevatedconcentrations do not appear to be of anthropogenic origin as they extend well below

35
the Pinus 1890 horizon, putting them in a historical period not readily associated withthe onset of industrial activities in Westernport.
5. Discussion
Fig. 19 is a schematic summarising sediment accumulation determined from theabove chronologies. The accumulation rates indicated are upper limits.
5.1 East Arm SitesThe accumulation of mud at East Arm sites is up to an order of magnitude higher thanat Upper North Arm sites, based on excess 210Pb inventories, apparent 210Pb-137Csaccumulation rates, and the fact that sediment at the East Arm sites is almost entirelycomposed of fine-grained silt and clay (<98% mud). The accumulation rate ofsediment at site 1 (East Basin, 0.48 cm yr-1) is equivalent to 2.5 kg m-2 yr-1, based onthe porosity (0.75) and sediment dry density (2.1 g cm-3) at this site. An approximatedepositional load for the East Basin can be determined if it assumed that this corerepresents sediment accumulation in the mud-rich areas of the Basin. Applying thesite 1 accumulation rate to the mud-rich area within the East Basin (33 km2, the areadefined by the 50-95% mud contour, containing an average 60% mud) gives a muddepositional load of 49 kt yr-1 (60% of 33 km2 x 2.6 kg m-2 yr-1). An approximatecontour of the East Basin is shown by the area drawn in the <63 µm distribution inFig. 4, and is defined by water depth >3 m. If the mud content of the entire basin isconsidered (area 64 km2, average 50% mud) a load of 80 kt yr-1 is calculated.
Applying the 210Pb estimate of sediment accumulation at site 8 (Corinella south,0.21 cm yr-1, or 1.1 kg m-2 yr-1) to the area of mud-rich sediment within the Corinellasegment (area 30 km-2) gives a total fine-grained depositional load of 20 kt yr-1.Thesum of the East Basin and Corinella depositional load estimates lies between 70 and100 kt yr-1. However, it is acknowledged that this depositional load estimate is basedon extrapolations from just two cores which may not represent a wider depositionzone, and that a significant degree of uncertainty is associated with the estimate.
An interesting feature of all East Arm cores is the occurrence of discrete beds ofcoarse shell fragments. The beds, which cover a depth interval of about 20 cm, aredated as post 1890 at their base (sites 1 and 2). The beds span the 1960 time horizon,although the effect of mixing in the upper the layer would suggest that the input ofshells into surficial sediment may have diminished well before this. It is not known ifthe beds represent different bottom sediment regime ecology in the past, or are aproduct of bioturbation. The concentration of shell fragments increases immediatelybelow the mixed layer, but if bioturbation is responsible for the transport of shell fromthe mixed layer into deeper sediment, and the supply of shell fragments has remainedplentiful, a continuous distribution of shells of unchanging concentration would beexpected immediately below the mixed layer. The occurrence of a discrete layersuggests a changing supply of shell fragments to the East Arm over the last 100 years.

36
Fig. 18. Schematic of sediment accumulation in Western Port. Sediment accumulation rates are upper limits

37
5.2 Upper North ArmSediment profiles at sites 4, 5, 6 and 7 show that the sediment that has accumulatedover the last 40-60 years in the Upper North Arm is confined to a layer 12 to 24 cmthick. The maximum accumulation rate is 0.3-0.4 cm yr-1 at most sites, but it may beas high as 0.55 cm yr-1 at the Bunyip Drain outlet. Table 4 shows that a mix of‘young’ (<50 years) and ‘old’ (>200 years) sand occurs in all OSL-dated sedimentfrom the Upper North Arm. These older ages are consistent with a relict marinesource, and suggest that deposited sand is a mixture of old reworked marine sand andrecent input of well bleached (young) sand from the catchment. The spatial origin ofthe relic sand is not known, but the very low activities of excess 210Pb and 137Cs in thesurface 4 cm of the core from site 4 (Charring Cross) indicates a recent “dump” ofsand, the immediate origin of which is almost certainly subsurface (Wallbrink et al.,1999). Subsurface sand might include eroded subsoil in the Westerport catchment, orlateral transport of old deep sediment exposed by erosion within the bay.
The range of OSL ages of sand grains in the Upper North Arm suggests a processwhereby old and young sand grains are being mixed. The non-constant excess 210Pbactivity seen in the upper layers of most of the Upper North Arm cores indicates thatvertical mixing within the sediment profile, if occurring, is limited to just the upperfew cm. However, given the dynamic nature of water movement in the shallowregions of the bay, lateral mixing of old and young sand prior to deposition resultingfrom resuspension and transport, is also a distinct possibility. This lateral transport, or“smearing” of old and young sand around the Upper North Arm may be a continualprocess, or it may be episodic, occurring as a result of significant events in the bay(large tides, storms etc). Whatever the frequency of the process, mixing of sediment,whether lateral or vertical, would have the same effect on the apparent accumulationrate; ie. it would cause an over-estimate of net mass deposition by allowing downwardmovement of 137Cs and excess 210Pb. The implication of this diagnosis is that theapparent sediment accumulation rates in the Upper North Arm should be consideredupper limits with regard to catchment input.
A feature of all Upper North Arm cores is the change in sediment composition withdepth, indicating a change in the characteristics of sediment being delivered toWestern Port and/or a changing depositional environment. All Upper North Armcores show evidence of a trend towards a higher sand content over the last 40-60years, and possibly longer (Fig. 9). By contrast, the silt/clay content at sites 4, 5 and 6has decreased by a factor of about three over the same period. OSL dating suggeststhat a finite fraction of the upper layer of sand deposits in the Upper North Arm hasbeen recently delivered from the Westernport catchment. An increase in the rate ofdelivery of catchment-derived sand over the last few decades may explain the highersand content of the upper layers of sediment in the Upper North Arm. On the otherhand, there is strong evidence presented in this study for widespread resuspension ofmud in the Upper North Arm, and the relocation of some of it to the East Arm. Recentincreases in the rate of removal of mud from the Upper North Arm, perhaps as a resultof loss of seagrass meadows, would also explain the observed trend towards coarsersediment composition. It is likely that both these processes have influenced theparticle size characteristics of sediment accumulated in the Upper North Arm over thelast 40 years, but without more extensive core and suspended particle analysis it is not

38
possible to determine which process (sand influx or particle resuspension) is primarilyresponsible.
6. Summary and ConclusionsA combination of particle tracers, fallout chronometers, and OSL and Pinus pollendating techniques have been used to study sediment transport and accumulation inWestern Port bay. The following conclusions are drawn.
• Suspended particle residence times are short (of the order of 1-2 tidal cycles)indicating a dynamic process of resuspension and removal of fine-grainedsediment (mud). Sediment inventories of the fallout tracers 210Pb and 137Csindicate a relocation of fine-grained (silt/clay) sediment from the Upper NorthArm in a clockwise southerly direction.
• Mud is focused in the East Arm. Comparison of the spatial distribution ofsediment grain size undertaken by this study with a similar map published inthe 1970’s indicates a net loss of mud from the Upper North Arm over the last25 years.
• The accumulation rate of mud is greatest in the East Basin. Sediment in thiszone is apparently vertically mixed to a depth of 20 cm. When averaged over atime scale of a few decades, the sediment accumulation rate in this segmenthas not deviated much outside a range of 0.4-0.5 cm yr-1 over the past 100years. When applied to mud-rich zones in the east Arm these rates yields adepositional load of mud in the East Arm of 70 to 100 kt yr-1.
• Sediment accumulation in the Corinella segment appears more variable, withtwo cores yielding accumulation rates of 0.2 and 1.6 cm yr-1 over the past 40years.
• In the Upper North Arm influx of sediment during the last 40 to 60 years isconfined to a sediment layer 12 to 24 cm thick. This yields an accumulationrate, averaged over the last few decades, of 0.3-0.5 cm yr-1 for this segment.Due to the possibility of sediment reworking these estimates are upper limitswith regard to catchment input.
• Upper North Arm cores show a transition to higher sand and lower silt/claycomposition over the last 40-60 years. This could be due an increase in the rateof sand supply to the Upper North Arm from the Westernport catchment overthe last few decades, or an increase in the rate of removal (resuspension andtransport) of mud, or a combination of both processes.
• Generally P concentrations are enhanced by 50-100% in recent (<60 year old)sediment. This could be due to an increase in the P load delivered to the bay,or the presence of higher concentrations of organic matter in the uppersediments. This is being investigated further. Higher concentrations of Cu andMo are seen in older sediments, but this appears to due be to diagenesis(sulphide formation) caused by anoxic conditions within the sediment profile.

39
References
Aitken M.J. (1998). An Introduction to Optical Dating. Oxford Univ. Press, Oxford.
Appleby, P.G. and Oldfield F. (1992). Application of lead-210 to sedimentationstudies. In: Uranium-series Disequilibrium: Applications to Earth, Marine andEnvironmental Sciences, M. Ivanovich and R.S. Harmon eds., 731-778, Clarendonpress, Oxford.
Berger, W.H. and Heath, G.R (1968). Vertical Mixing in Pelagic Sediments. Journalof Marine Research, 26, 134-143.
Calvert, S.E. (1976). Mineralogy and geochemistry of near-shore sediments, In J.P.Riley and R. Chester (eds.), Chemical Oceanography, Vol. 6, 2nd Edn. Academicpress, London, pp 187-280.
Fielding, J.M. (1957). Pinus in Australia. Australian Forestry 21, 15-16.
Golterman, H.L. (1973). Vertical movement of phosphate in freshwater. In:Environmental Phosphorus Handbook, E.J. Griffith, A.L Beeton, J.M. Spencer andD.T. Mitchell eds., 509-538, Wiley, New York.
Hancock G.J. and Hunter J.R. (1999). Use of excess 210Pb and 228Th to estimate ratesof sediment accumulation and bioturbation in Port Phillip Bay, Australia. Marineand Freshwater Research, 50, 533-45.
Hancock, G.J., Webster, I.T., Ford, P.F. and Moore W.S. (2000). Using Ra isotopes toexamine transport processes controlling benthic fluxes into a shallow estuarinelagoon. Geochimica et Cosmochimica Acta, 64, 3685-3699.
Harris, J.E. and Robinson, J.B. (1979). Circulation in Western Port, Victoria, asdeduced from salinity and reactive-silica distributions. Marine Geology, 30, 101-116.
Harris, J.E., Hinwood, J.B., Marsden, M.A.H. and Sternberg, R.W. (1979). Watermovements, sediment transport and deposition, Western Port, Victoria. MarineGeology, 30, 131-161.
Hinwood, J.B. (1979). Hydrodynamic and transport models of Western Port, Victoria.Marine Geology, 30, 117-130.
Huntley, D.J., Godfrey-Smith D.I. and Thewalt M.L.W. (1985). Optical dating ofsediments. Nature 313, 105-107.
Lowe, M. (1999). Sediment sources in Western Port catchment. Honours thesis.University unknown, 47 pp.
May, D. and Stephens, A. (1996). The Western Port Marine Environment. Publication493, Environment Protection Authority, Victoria.
Martin, P. and Hancock, G. J. (1992). Routine analysis of naturally occurringradionuclides in environmental samples by alpha-particle spectrometry, ResearchReport 7, Supervising Scientist for the Alligator Rivers Region, AGPS, Canberra,Australia.
Marsden, M.A.H. (1979). Circulation patterns from seabed-drifter studies, WesternPort and inner Bass Strait, Australia. Marine Geology, 30, 85-99.

40
Marsden, M.A.H. and Mallet, C.W. (1975). Quaternary evolution, morphology, andsediment distribution, Westernport Bay, Victoria. Proceedings of the Royal Societyof Victoria, 87, 107-138.
Marsden, M.A.H., Mallet, C.W. and Donaldson, A.K. (1979) Geological and Physicalsetting, sediments, and environments, Western Port, Victoria. Marine Geology, 30,11-46.
Murray A.S. and Mejdahl V. (1998). Comparison of regenerative-dose single-aliquotand multiple-aliquot (SARA) protocols using heated quartz from archaeologicalsites. Quaternary Science Reviews (in press).
Murray A.S. and Roberts R.G. (1998). Measurement of the equivalent dose in quartzusing a regenerative-dose single-aliquot protocol. Radiation Measurements, 29,503-515.
Murray A.S., Marten, R., Johnson, A. and Martin, P. (1987). Analysis for naturallyoccurring radionuclides at environmental concentrations by gamma spectrometry.Journal of Radioanalytical and Nuclear Chemistry Articles, 115, 263-288.
Norrish, K., and Hutton J.T. (1969). An accurate X-ray spectrographic method for theanalysis of a wide range of geological samples. Geochimica et CosmochimicaActa 33, 431-453.
Norrish, K., and Chappell B.W. (1977). X-ray fluorescence spectrometry. In'Physical methods in determinative mineralogy', second edition, ed. J. Zussman(Academic Press: London), 201-272.
Norrish, K., and Rosser, H. (1983). Mineral Phosphate, In: Soils: An AustralianViewpoint. Division of Soils, CSIRO, pp 335-361, CSIRO Melbourne.
Ogden, R.W. (1996). The impact of farming and river regulation on billabongs of thesoutheast Murray Basin, Australia. PhD thesis, Australian National University,Canberra. 396 pp.
Ogden, R.W. (2000). Modern and historical variation in aquatic macrophyte cover ofbillabongs associated with catchment development. Regulated Rivers: Researchand Management, 16, 497-512.
Olive, L. J., Olley, J. M., Murray, A. S. and Wallbrink, P. J. (1995). Variations insediment transport at a variety of temporal scales in the Murrumbidgee River, NewSouth Wales, Australia. In: Effect of Scale on Interpretation and Management ofSediment and Water Quality (Proceedings of Boulder Symposium, July, 1995).IAHS Publication no. 226, 275-284.
Olley, J. M., Murray, A. S., Wallbrink, P. J., Stanton, R. K. and Caitcheon, G. G.(1990). The use of Fallout nuclides as chronometers. Quaternary dating workshop,A.N.U., Aug. 1990, pp 51-55.
Roberts R., Bird M., Olley J., Galbraith R., Lawson E., Laslett G., Yoshida H., JonesR., Fullagar R., Jacobsen G. and Hua Q. (1998). Optical and radiocarbon dating atJinmium rock shelter in northern Australia. Nature 393, 358-362.
Sargeant, I. (1977). A review of the extent and environmental effects of erosion in theWesternport catchment. Environmental Studies Series Publication No.174.Ministry for Conservation, Victoria.
Shapiro, M.A. (1975). Westernport Bay environmental study 173-1974. Ministry forConservation, Victoria, Australia.

41
Turekian, K. K., Nozaki, Y., and Benninger, L. K. (1977). Geochemistry ofatmospheric radon and radon products. Annual Review Earth Planet Science 5,227-255.
Wallbrink, P.J., Murray, A.S. and Olley, J.M. (1999). Relating suspended sediment toits original soil depth using fallout radionuclides. Soil Science of America Journal,63, 369-378.
Wilk, R.R. Keene, J.B. and Marden, M.A.H. (1979). Sediment characteristics in theembayment head of Western Port – The impact of swamp drainage and erosion onsedimentation and seagrass distribution. Environmental Studies Series PublicationNo. 24, Ministry for Conservation, Victoria.

42
Appendix
Table A1. Radionuclide (Bq kg-1), LOI and porosity data. Radionuclideuncertainties (±1 SD) are given in small font.
Site 1. East Basin
Depth(cm)
porosity LOI(%)
137Cs 210Pb 226Ra 210Pbexcess
Short core0-1 0.83 9.1 0.2 0.6 48.5 1.5 21.1 1.6 27.4 2.21-2 0.80 8.8 0.2 0.6 24.0 1.62-3 0.80 9.5 1.3 0.6 50.6 1.6 22.1 1.0 28.5 1.93-4 0.79 9.4 0.4 0.6 23.0 1.24-6 0.78 9.9 0.8 0.3 53.2 1.3 22.8 0.8 30.4 1.56-8 0.76 9.1 0.5 0.5 53.3 1.2 23.0 1.0 30.3 1.6
10-12 0.75 10.6 1.2 0.5 50.0 1.9 22.7 0.8 27.3 2.112-16 0.74 8.4 0.6 0.6 49.3 1.9 22.8 1.0 26.5 2.116-20 0.72 8.7 0.6 0.5 47.5 1.9 24.7 0.8 22.8 2.120-24 0.70 0.5 0.5 43.7 1.5 24.7 0.8 19.0 1.724-28 0.67 8.5 1.0 0.4 40.4 1.8 26.0 0.6 14.4 1.928-32 0.67 1.0 0.2 39.5 1.4 25.7 0.4 13.8 1.532-36 0.66 9.9 0.7 0.4 38.3 1.7 25.5 0.7 12.8 1.836-39 0.62 30.7 1.3 23.7 1.4 7.0 1.9
39-42.5 0.61 9.7 1.3 0.4 28.1 0.8 23.7 0.8 4.4 1.1Long core
0-5 0.78 9.8 2.4 0.5 55.9 3.6 22.9 0.6 33.0 3.411-16 0.74 8.7 2.8 0.6 55.4 4.3 25.9 0.7 29.5 4.120-25 0.72 8.0 1.4 0.4 50.4 4.1 27.0 0.6 23.4 3.930-35 0.70 9.0 1.8 0.6 35.5 1.0 26.9 0.7 8.6 1.235-40 26.9 1.1 25.6 0.7 1.3 1.340-46 7.6 0.7 0.5 23.2 0.8 25.4 0.7 -2.2 1.146-52 0.72 8.2 0.5 0.352-58 0.75 9.1 0.4 0.5 28.1 0.9 30.1 0.7 -2.0 1.264-72 9.4 0.5 0.480-88 0.76 8.7 0.5 0.5 31.7 1.3 32.6 0.5 -0.9 1.496-104 0.75 9.1 0.3 0.4112-120 0.75 9.6 0.7 0.4
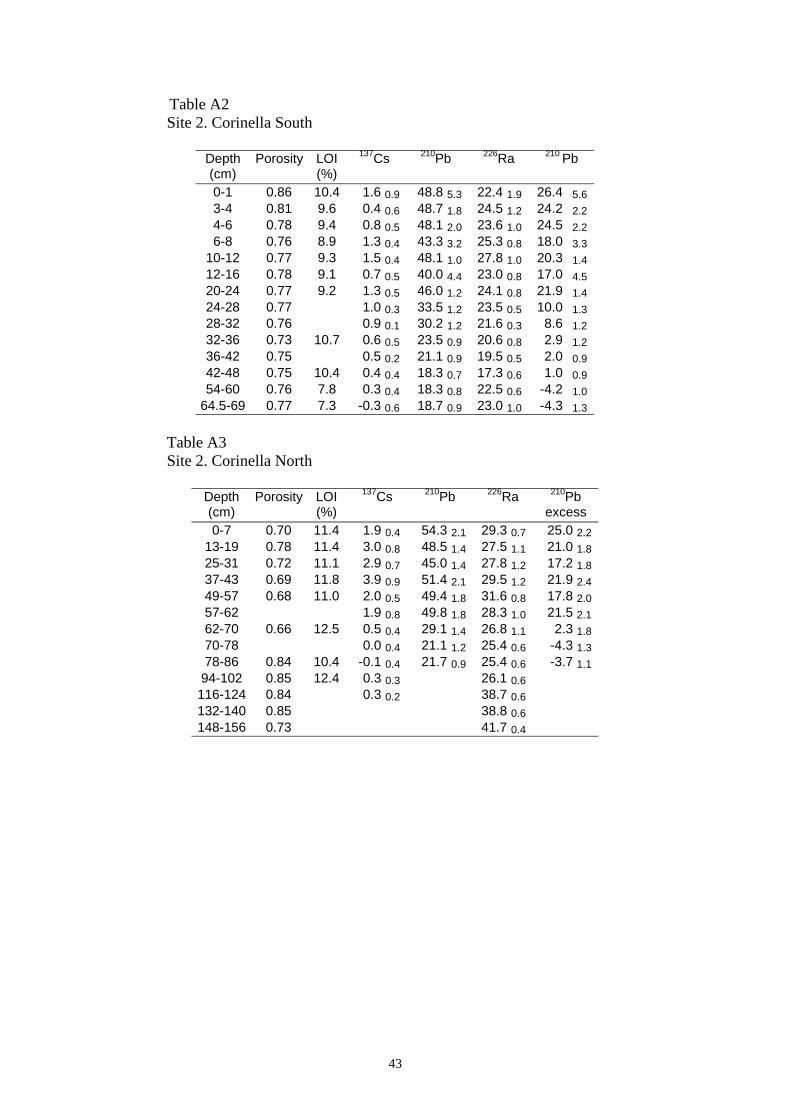
43
Table A2Site 2. Corinella South
Depth(cm)
Porosity LOI(%)
137Cs 210Pb 226Ra 210 Pb
0-1 0.86 10.4 1.6 0.9 48.8 5.3 22.4 1.9 26.4 5.63-4 0.81 9.6 0.4 0.6 48.7 1.8 24.5 1.2 24.2 2.24-6 0.78 9.4 0.8 0.5 48.1 2.0 23.6 1.0 24.5 2.26-8 0.76 8.9 1.3 0.4 43.3 3.2 25.3 0.8 18.0 3.3
10-12 0.77 9.3 1.5 0.4 48.1 1.0 27.8 1.0 20.3 1.412-16 0.78 9.1 0.7 0.5 40.0 4.4 23.0 0.8 17.0 4.520-24 0.77 9.2 1.3 0.5 46.0 1.2 24.1 0.8 21.9 1.424-28 0.77 1.0 0.3 33.5 1.2 23.5 0.5 10.0 1.328-32 0.76 0.9 0.1 30.2 1.2 21.6 0.3 8.6 1.232-36 0.73 10.7 0.6 0.5 23.5 0.9 20.6 0.8 2.9 1.236-42 0.75 0.5 0.2 21.1 0.9 19.5 0.5 2.0 0.942-48 0.75 10.4 0.4 0.4 18.3 0.7 17.3 0.6 1.0 0.954-60 0.76 7.8 0.3 0.4 18.3 0.8 22.5 0.6 -4.2 1.0
64.5-69 0.77 7.3 -0.3 0.6 18.7 0.9 23.0 1.0 -4.3 1.3
Table A3Site 2. Corinella North
Depth(cm)
Porosity LOI(%)
137Cs 210Pb 226Ra 210Pbexcess
0-7 0.70 11.4 1.9 0.4 54.3 2.1 29.3 0.7 25.0 2.213-19 0.78 11.4 3.0 0.8 48.5 1.4 27.5 1.1 21.0 1.825-31 0.72 11.1 2.9 0.7 45.0 1.4 27.8 1.2 17.2 1.837-43 0.69 11.8 3.9 0.9 51.4 2.1 29.5 1.2 21.9 2.449-57 0.68 11.0 2.0 0.5 49.4 1.8 31.6 0.8 17.8 2.057-62 1.9 0.8 49.8 1.8 28.3 1.0 21.5 2.162-70 0.66 12.5 0.5 0.4 29.1 1.4 26.8 1.1 2.3 1.870-78 0.0 0.4 21.1 1.2 25.4 0.6 -4.3 1.378-86 0.84 10.4 -0.1 0.4 21.7 0.9 25.4 0.6 -3.7 1.194-102 0.85 12.4 0.3 0.3 26.1 0.6116-124 0.84 0.3 0.2 38.7 0.6132-140 0.85 38.8 0.6148-156 0.73 41.7 0.4

44
Table A4Site 7 (near Lang Lang River).
Depth(cm)
Porosity LOI(%)
137Cs 210Pb 226Ra 210Pbexcess
0-2 0.79 11.8 0.3 0.5 43.3 1.8 29.2 1.1 14.1 2.04-6 0.81 12.8 1.0 0.5 47.9 1.8 31.3 1.2 16.6 2.08-10 0.81 13.2 1.3 0.6 47.0 1.5 26.4 1.3 20.6 1.810-12 0.78 12.5 1.0 0.4 40.0 1.3 25.4 1.0 14.6 1.612-16 0.79 11.8 0.3 0.5 32.2 1.1 25.1 0.8 7.1 1.416-20 0.79 14.8 0.5 0.7 24.3 0.9 21.4 1.1 2.9 1.324-28 0.83 20.2 0.3 0.4 20.2 0.5 16.0 0.7 4.2 0.832-36 0.86 24.8 -2.1 4.4 14.2 0.6 9.6 0.9 3.0 0.9
Table A5Site 6 (near Yallock Ck.).
Depth(cm)
porosity LOI(%)
137Cs 210Pb 226Ra 210Pbexcess
0 – 4 0.61 7.01 1.0 0.4 33.6 1.3 27.2 0.9 6.4 1.64 – 8 0.58 6.68 1.6 0.8 31.4 1.0 21.3 1.0 10.1 1.48 – 12 0.49 4.38 1.2 0.6 23.7 0.8 17.2 0.9 6.5 1.212 – 18 0.48 5.90 0.7 0.7 22.1 1.0 23.0 0.9 -0.9 1.318 – 24 0.49 8.78 0.0 0.3 35.5 1.8 37.2 1.4 1.7 2.524 – 30 0.54 8.69 0.1 0.3 42.9 1.2 45.9 0.5 3.0 1.030 – 36 0.49 6.54 0.0 0.2 46.2 1.5 49.1 1.5 -2.9 2.436 – 42 0.48 7.70 -0.1 0.3 49.0 2.8 52.9 1.6 -3.9 3.2
Table A6Site 5 (near Bunyip Drain).
Depth(cm)
Porosity LOI(%)
137Cs 210Pb 226Ra 210Pbexcess
0-2 0.47 13.7 0.5 0.4 100 2 82.2 0.6 20.2 3.62-4 0.41 14.0 2.1 0.6 119 5 97.3 1.4 25.7 5.36-8 0.40 14.0 1.3 0.6 107 5 73.4 1.3 39.0 4.6
10-12 0.37 14.2 0.8 1.0 100 9 73.2 1.6 30.8 7.812-16 0.36 13.7 1.4 1.2 126 11 77.7 2.1 55.7 10.220-24 0.32 12.0 2.0 1.0 96 10 71.2 1.9 27.7 8.824-28 0.5 1.0 48.4 3.9 33.2 1.7 17.1 4.528-32 0.39 12.8 1.0 1.1 38.4 6.7 33.3 1.7 5.8 6.036-40 0.46 12.7 0.3 0.5 21.9 5.1 27.7 0.9 -6.6 4.744-48 0.51 12.4 0.4 0.8 29.5 4.9 28.8 1.2 0.8 4.3

45
Table A7Site 4. Charing Cross.
Depth(cm)
porosity LOI(%)
137Cs 210Pb 226Ra 210Pbexcess
0 – 6 0.53 2.30 0.2 0.2 12.0 0.6 12.7 0.4 -0.7 0.76 – 12 0.67 6.35 0.7 0.3 27.4 1.1 16.8 0.5 10.6 1.218 – 24 0.66 7.08 0.6 0.3 23.4 1.1 17.4 0.5 6.0 1.230 – 36 0.60 6.76 0.8 0.4 14.9 2.9 13.1 0.5 0.9 2.942 – 48 0.74 6.90 -0.3 0.4 24.7 3.4 22.4 0.6 0.6 3.554 – 60 0.77 10.5 0.2 0.5 23.7 3.7 23.9 0.7 -3.0 3.866 – 72 0.76 9.74 1.5 0.6 26.7 4.3 22.9 0.8 1.3 4.472 – 77 0.71 8.22 0.9 0.4 21.4 4.3 19.2 0.7 0.5 4.4

46
Table A8. Major element (%) and trace element (µg g-1) concentrations. Sites 1 and 2.
SiO2 Al2O3 P2O5 TiO2 Fe2O3 SO3 Ni Cu Zn Ga Ge As Rb Sr Y Zr Nb Mo Cd Sn Ba La Ce Nd Yb Hg PbSite 1 % % % % % %
0-5 64.5 13.1 0.13 1.3 4.8 0.39 16 12 91 14 < 0.4 23 66 153 35 442 24 < 0.5 1.3 5 239 29 56 33 14 < 1.5 2111-16 66.3 12.2 0.12 1.3 4.5 0.33 8 12 76 10 5 23 64 163 36 455 24 < 0.5 1.6 4 253 33 62 41 29 < 1.5 2120-25 67.0 11.8 0.11 1.3 4.4 0.28 5 9 59 10 2 24 61 178 37 480 23 < 0.5 < 0.3 4 258 35 58 42 36 < 1.5 2130-35 66.3 11.7 0.11 1.3 4.4 0.33 5 9 57 9 2 23 61 184 37 526 23 < 0.5 1.2 3 241 33 65 31 27 < 1.5 2140-46 64.9 11.7 0.09 1.3 4.9 1.49 7 15 57 11 3 25 59 214 34 456 24 2.3 1.0 4 241 36 54 34 30 < 1.5 1846-52 61.5 14.7 0.11 1.8 6.7 1.61 11 15 47 16 2 29 64 150 34 353 30 1.8 0.6 3 235 32 61 47 67 < 1.5 2052-58 59.5 16.5 0.13 2.0 7.7 1.17 37 14 59 16 3 35 65 118 33 308 33 2.1 0.4 4 239 32 67 45 26 < 1.5 1764-72 59.7 16.6 0.14 2.0 7.6 0.73 29 20 57 15 < 0.4 24 67 120 35 307 35 4.5 0.3 3 252 32 64 51 31 < 1.5 1980-88 60.0 16.5 0.14 2.1 7.8 0.93 32 18 54 20 4 37 69 115 34 317 35 3.3 0.7 4 264 32 62 41 20 < 1.5 1696-104 59.3 16.8 0.15 2.1 7.7 0.70 28 21 62 19 2 29 67 114 34 300 34 3.2 0.4 5 250 21 56 < 3.0 14 < 1.5 18
112-120 59.2 17.0 0.15 2.1 7.8 0.69 31 17 61 17 1 33 68 122 33 308 36 4.7 0.9 2 236 19 58 9 33 < 1.5 16
Site 20-7 35.2 8.8 0.13 1.4 5.7 0.41 21 18 59 19 2 25 82 99 42 442 27 1.6 0.3 3 237 34 60 < 3.0 21 < 1.5 33
13-19 34.7 8.9 0.12 1.4 5.8 0.41 14 13 60 15 1 26 78 95 40 405 26 < 0.5 < 0.3 5 235 34 69 46 21 < 1.5 2825-31 34.7 8.6 0.11 1.4 5.7 0.33 10 20 52 14 3 25 80 97 44 478 26 < 0.5 0.7 4 255 44 83 33 29 < 1.5 2937-43 35.3 9.2 0.11 1.4 5.9 0.33 7 14 59 14 5 30 81 99 43 444 28 1.0 0.3 4 236 43 74 47 53 < 1.5 2749-57 35.5 8.5 0.09 1.4 5.4 0.27 < 0.8 19 55 16 6 24 79 99 42 526 27 < 0.5 0.6 4 235 37 64 < 3.0 54 < 1.5 2862-70 32.8 8.6 0.11 1.3 5.7 0.83 15 16 71 16 9 27 78 170 39 401 25 1.9 1.0 5 214 43 72 41 31 < 1.5 2378-86 35.3 7.9 0.13 1.7 5.5 2.18 2 34 54 20 4 16 86 96 43 293 26 6.0 0.4 3 293 33 73 48 42 < 1.5 2294-102 34.1 8.1 0.14 1.6 5.6 2.10 5 45 81 14 3 9 86 86 39 239 25 7.8 1.1 3 256 28 58 64 46 < 1.5 22
116-124 35.8 7.8 0.14 1.7 4.9 1.63 11 28 63 17 3 10 82 94 39 240 27 7.7 0.4 4 274 32 55 54 19 < 1.5 22132-140 35.3 8.0 0.15 1.6 4.7 1.69 15 31 76 11 5 14 81 91 38 251 26 3.4 < 0.3 3 290 33 69 50 40 < 1.5 25148-156 39.9 7.2 0.15 1.7 3.8 1.17 8 21 53 10 2 10 75 89 43 311 28 2.1 0.8 3 351 37 79 49 19 < 1.5 23

47
Table A9. Major element (%) and trace element (µg g-1) concentrations. Sites 8, 7 and 5.
SiO2 Al2O3 P2O5 Fe2O3 TiO2 SO3 V Cr Ni Cu Zn Ga Ge As Rb Sr Y Zr Nb Mo Cd Sn Ba La Ce Nd PbSite 8 % % % % % %
0-2 61.4 16.2 0.13 5.6 1.3 0.6 130 106 24 12 50 17 1.2 20 73 115 27 311 17 0.8 -0.1 3.3 204 26 60 19 212-4 63.1 15.9 0.12 5.5 1.3 0.6 131 112 25 14 46 18 0.8 21 73 112 29 340 17 0.7 -0.1 3.0 211 26 60 16 204-6 64.2 15.1 0.11 5.3 1.3 0.5 128 126 20 13 42 16 0.6 19 69 116 30 450 17 0.3 -0.1 2.8 230 26 63 21 196-8 65.5 14.9 0.11 5.1 1.3 0.5 131 210 21 15 43 16 1.0 18 69 117 29 407 17 1.2 -0.1 2.9 226 25 60 20 19
10-12 63.6 15.8 0.12 5.5 1.3 0.4 139 108 22 14 45 18 1.0 21 73 107 28 320 17 0.4 0.2 3.0 209 24 59 18 2012-16 64.8 15.2 0.12 5.2 1.3 0.4 136 111 24 47 69 19 1.0 21 75 110 29 306 17 1.1 -0.1 3.5 218 25 60 21 2220-24 64.3 15.5 0.12 5.3 1.3 0.4 148 113 25 34 57 19 -0.6 22 74 113 30 338 17 0.3 0.2 3.5 216 28 61 17 2132-36 58.9 16.4 0.09 5.4 1.2 1.7 142 112 25 51 66 19 0.9 16 78 158 28 281 16 1.7 -0.1 3.3 188 24 57 20 2042-48 55.5 17.4 0.10 6.1 1.2 3.5 141 104 28 39 64 18 1.2 19 78 175 27 248 16 7.4 0.5 3.8 181 25 59 17 2054-60 61.7 15.4 0.08 5.5 1.2 3.4 140 107 26 41 58 19 1.0 21 75 152 28 321 16 7.9 0.3 5.2 197 23 59 18 21
64.5-69 64.5 14.8 0.08 4.9 1.2 2.5 142 118 22 37 58 17 1.2 20 74 142 29 347 16 2.6 0.2 2.8 208 25 60 18 19
Site 70-2 65.3 13.8 0.10 4.64 1.2 0.3 108 97 18 16 45 14 0.8 16 63 105 31 442 16 -0.6 0.2 3.2 195 28 62 20 204-6 63.9 14.1 0.10 4.61 1.2 0.3 123 104 22 20 49 18 0.8 19 71 94 33 427 18 0.5 0.1 3.9 202 28 65 21 21
8-10 63.5 14.2 0.10 4.73 1.1 0.3 126 99 21 18 48 17 0.5 20 69 100 30 399 17 0.6 0.2 3.7 193 27 63 18 2212-16 65.7 13.1 0.08 4.35 1.1 0.4 119 94 19 19 44 16 1.0 21 69 106 31 405 17 1.8 0.2 4.0 221 30 69 22 2016-20 59.3 13.4 0.07 4.18 1.0 0.3 113 88 19 30 52 15 1.0 19 62 122 29 385 15 3.1 -0.1 3.8 171 27 60 15 1824-28 50.4 15.0 0.08 4.68 0.9 0.5 98 71 18 44 62 14 -0.6 19 60 118 22 234 12 8.1 -0.1 3.1 136 20 45 16 18
32-35.5 43.2 15.3 0.07 4.44 0.7 0.6
Site 50-2 57.3 17.1 0.15 5.75 1.6 0.32-4 57.6 17.0 0.17 5.75 1.7 0.36-8 56.2 18.0 0.15 5.60 1.4 0.2
10-12 56.9 17.9 0.13 5.34 1.5 0.312-16 58.3 17.3 0.13 5.22 1.5 0.320-24 60.4 17.1 0.10 4.60 1.3 0.428-32 54.6 18.4 0.09 5.67 1.2 0.736-40 55.0 19.7 0.07 5.85 1.2 0.744-48 56.2 19.4 0.06 5.58 1.2 0.6
Related Documents


