~ 228 ~ International Journal of Fisheries and Aquatic Studies 2014; 1(5): 228-241 ISSN: 2347-5129 IJFAS 2014; 1(5): 228-241 © 2013 IJFAS www.fisheriesjournal.com Received: 03-03-2014 Accepted: 08-04-2014 Patricia N Muendo South Eastern Keya University, P.O Box 170 – 90200, Kitui, Kenya Marc C J Verdegem Aquaculture and Fisheries Group, Wageningen Institute of Animal Sciences, Wageningen University, P.O Box, 338, 6700 AH Wageningen, The Netherlands Jetse J Stoorvogel Soil Science center/ Laboratory of Soil Science and Geology, Wageningen University, P.O Box, 37, 6700 AA Wageningen, The Netherlands Ana Milstein Fish and Aquaculture Research Station, Dor, M.P Hof HaCarmel, 30820, Israel. El-Naggar Gamal The World Fish Center (ICLARM), Africa and West Asia Regional Center (Sharkia), P.O Box 1261, Maadi- Cairo, Egypt Pham Minh Duc Aquaculture and Fisheries Group, Wageningen Institute of Animal Sciences, Wageningen University, P.O Box, 338, 6700 AH Wageningen, The Netherlands J. A.J. Verreth Aquaculture and Fisheries Group, Wageningen Institute of Animal Sciences, Wageningen University, P.O Box, 338, 6700 AH Wageningen, The Netherlands Correspondence: Patricia N. Muendo Department of fisheries and Aquaculture, South Eastern Kenya University (SEKU), P.O Box 170, 90200, Kitui, Kenya. Sediment Accumulation in Fish Ponds; Its Potential for Agricultural Use Patricia N Muendo, Marc C J Verdegem, Jetse J Stoorvogel, Ana Milstein, El- Naggar Gamal, Pham Minh Duc and J. A.J. Verreth ABSTRACT An experiment was conducted at the World Fish Center in Egypt, to describe and quantify sediment and nutrient accumulation in semi-intensive tilapia ponds, evaluate the effect of input type and stocking density on sediment and nutrient accumulation and estimate accumulated sediment’s potential for use in land-based agriculture. Sixteen 200 m 2 earthen (but with concrete walls) ponds were allocated 4 treatments with 4 replicates in a completely randomized 2x2 factorial design. The factors were input type (chicken manure at 50 kg dm / ha / day vs 25% protein pellets fed at 3% body weight day -1 ) and stocking density (1 or 2 fishes / m 2 ). All ponds were stocked with 20–25 g tilapia (Oreochromis niloticus) fingerlings and harvested after 4.5 months of culture. Ceramic tiles of 0.5 by 1 m 2 were installed horizontally at 5 cm depth in the sediment before pond filling and core sediment samples were taken above the ceramic tiles at monthly intervals for determination of sediment and nutrient accumulation. The quantified sediment and nutrient accumulation were used to estimate the fertilizer potential of pond sediment in land based agriculture. Up to173 tons of sediment / ha / cycle accumulated in the semi-intensive tilapia production ponds and contained nutrients that could potentially meet the nitrogen fertilizer requirement for 0.35–1.2 hectare and the potassium fertilizer requirement for 0.7 – 1.5 hectare at recommended Egyptian fertilization rates. In addition, the accumulated sediment contained 1.8 – 5 tons of organic matter, hence, has a high potential as a soil conditioner. Sediment and nutrient accumulation were not affected by input type or stocking density. Keywords: Quantify, sediment accumulation, nutrient accumulation, semi-intensive ponds. 1. Introduction Sediment rich in organic matter, nitrogen and phosphorus, accumulates in fish ponds during culture [18, 23, 28, 51, 25, 10] . From a management perspective, accumulation of sediment is a menace as it fills ponds reducing their volume [10, 53] . Accumulation of organic matter is undesirable too as it may accumulate to levels that can negatively impact fish yields due to release of toxic elements such as hydrogen sulfides and nitrites. High organic matter deposition may also impact a high oxygen demand and lead to oxygen depletion [13, 5] which in turn affects fish yields. To maintain desired pond volumes and an environment conducive for fish growth, accumulated sediment needs to be removed periodically [15, 25, 10] . On the other hand, management of the sediment removed from ponds becomes a scientific concern. Disposal of pond sediments to natural systems possess an environmental threat [18, 51] and is a waste of valuable nutrients [29] . In China, Thailand and Vietnam, pond sediment has been used to fertilise crops and higher yields have been realised [31, 43] . Although pond sediment use in agriculture and its resultant positive impacts on crop yields in Asia are widely reported [45, 31, 43] the information is not supported scientifically [24, 20] . Lack of scientific documentation on quantitative and qualitative aspects of pond sediment hampers wider adoption and promotion of pond sediment use in agriculture [20]. The objectives of this paper are to (i) quantitatively describe sediment accumulation in semi- intensive tilapia production ponds; its sources and accumulation rates (ii) quantify nutrients (N, P and K) in the accumulated sediment that are potentially available for land-based agriculture and (iii) evaluate whether pond input type (chicken manure vs. pellets) and stocking density (1 or 2 fishes / m 2 ) affect the quantity and nutrient content of the accumulated sediment.

Welcome message from author
This document is posted to help you gain knowledge. Please leave a comment to let me know what you think about it! Share it to your friends and learn new things together.
Transcript

~ 228 ~
International Journal of Fisheries and Aquatic Studies 2014; 1(5): 228-241
ISSN: 2347-5129
IJFAS 2014; 1(5): 228-241 © 2013 IJFAS
www.fisheriesjournal.com Received: 03-03-2014 Accepted: 08-04-2014
Patricia N Muendo South Eastern Keya University, P.O Box 170 – 90200, Kitui, Kenya
Marc C J Verdegem Aquaculture and Fisheries Group, Wageningen Institute of Animal Sciences, Wageningen University, P.O Box, 338, 6700 AH Wageningen, The Netherlands
Jetse J Stoorvogel Soil Science center/ Laboratory of Soil Science and Geology, Wageningen University, P.O Box, 37, 6700 AA Wageningen, The Netherlands
Ana Milstein Fish and Aquaculture Research Station, Dor, M.P Hof HaCarmel, 30820, Israel.
El-Naggar Gamal The World Fish Center (ICLARM), Africa and West Asia Regional Center (Sharkia), P.O Box 1261, Maadi-Cairo, Egypt
Pham Minh Duc Aquaculture and Fisheries Group, Wageningen Institute of Animal Sciences, Wageningen University, P.O Box, 338, 6700 AH Wageningen, The Netherlands
J. A.J. Verreth Aquaculture and Fisheries Group, Wageningen Institute of Animal Sciences, Wageningen University, P.O Box, 338, 6700 AH Wageningen, The Netherlands
Correspondence: Patricia N. Muendo Department of fisheries and Aquaculture, South Eastern Kenya University (SEKU), P.O Box 170, 90200, Kitui, Kenya.
Sediment Accumulation in Fish Ponds; Its Potential for Agricultural Use
Patricia N Muendo, Marc C J Verdegem, Jetse J Stoorvogel, Ana Milstein, El- Naggar Gamal, Pham Minh Duc and J. A.J. Verreth
ABSTRACTAn experiment was conducted at the World Fish Center in Egypt, to describe and quantify sediment and nutrient accumulation in semi-intensive tilapia ponds, evaluate the effect of input type and stocking density on sediment and nutrient accumulation and estimate accumulated sediment’s potential for use in land-based agriculture. Sixteen 200 m2 earthen (but with concrete walls) ponds were allocated 4 treatments with 4 replicates in a completely randomized 2x2 factorial design. The factors were input type (chicken manure at 50 kg dm / ha / day vs 25% protein pellets fed at 3% body weight day-1) and stocking density (1 or 2 fishes / m2). All ponds were stocked with 20–25 g tilapia (Oreochromis niloticus) fingerlings and harvested after 4.5 months of culture. Ceramic tiles of 0.5 by 1 m2 were installed horizontally at 5 cm depth in the sediment before pond filling and core sediment samples were taken above the ceramic tiles at monthly intervals for determination of sediment and nutrient accumulation. The quantified sediment and nutrient accumulation were used to estimate the fertilizer potential of pond sediment in land based agriculture. Up to173 tons of sediment / ha / cycle accumulated in the semi-intensive tilapia production ponds and contained nutrients that could potentially meet the nitrogen fertilizer requirement for 0.35–1.2 hectare and the potassium fertilizer requirement for 0.7 – 1.5 hectare at recommended Egyptian fertilization rates. In addition, the accumulated sediment contained 1.8 – 5 tons of organic matter, hence, has a high potential as a soil conditioner. Sediment and nutrient accumulation were not affected by input type or stocking density.
Keywords: Quantify, sediment accumulation, nutrient accumulation, semi-intensive ponds.
1. IntroductionSediment rich in organic matter, nitrogen and phosphorus, accumulates in fish ponds during culture [18, 23, 28, 51, 25, 10]. From a management perspective, accumulation of sediment is a menace as it fills ponds reducing their volume [10, 53]. Accumulation of organic matter is undesirable too as it may accumulate to levels that can negatively impact fish yields due to release of toxic elements such as hydrogen sulfides and nitrites. High organic matter deposition may also impact a high oxygen demand and lead to oxygen depletion [13, 5] which in turn affects fish yields. To maintain desired pond volumes and an environment conducive for fish growth, accumulated sediment needs to be removed periodically [15, 25, 10]. On the other hand, management of the sediment removed from ponds becomes a scientific concern. Disposal of pond sediments to natural systems possess an environmental threat [18, 51] and is a waste of valuable nutrients [29]. In China, Thailand and Vietnam, pond sediment has been used to fertilise crops and higher yields have been realised [31, 43]. Although pond sediment use in agriculture and its resultant positive impacts on crop yields in Asia are widely reported [45, 31, 43]
the information is not supported scientifically [24, 20]. Lack of scientific documentation on quantitative and qualitative aspects of pond sediment hampers wider adoption and promotion of pond sediment use in agriculture [20]. The objectives of this paper are to (i) quantitatively describe sediment accumulation in semi-intensive tilapia production ponds; its sources and accumulation rates (ii) quantify nutrients (N, P and K) in the accumulated sediment that are potentially available for land-based agriculture and (iii) evaluate whether pond input type (chicken manure vs. pellets) and stocking density (1 or 2 fishes / m2) affect the quantity and nutrient content of the accumulated sediment.
~ 229 ~
International Journal of Fisheries and Aquatic Studies 2. Materials and Methods 2.1 Study site and experimental design The experiment was carried out in June - October 2003 at the World Fish Centre in Egypt. Sixteen 200 m2 and 1-m deep ponds with earthen bottoms and concrete walls were allocated 4 treatments with 4 replicates in a completely randomized 2x2 factorial design. The factors were input type (chicken manure (CM) or pellets (P)) and stocking density (1 or 2 fish / m2). In treatments CM_1 and CM_2, ponds were fertilized with chicken manure at a rate of 50 kg dm / ha / day and stocked at a density of 1 and 2 fish / m2 respectively. All the chicken manure used came from a common stock, obtained from one source before the start of the experiment and properly stored through out the experimental period. The composition of the manure was determined by obtaining 3 random samples from the heap, from which a composite sample was taken and analysed for Nitrogen, phosphorus and potassium. In treatments P_1 and P_2, fishes were fed floating 25% protein pellets at 3% body weight / day and stocked at a density of 1 and 2 fish / m2, respectively. Ponds were filled with water from canals that received water from the Nile River. They were stocked with 20 – 25g tilapias (Oreochromis niloticus) and harvested after 4.5 months of culture. 2.2 Water replacement; Fertilization, feeding, oxygen and temperature monitoring Chicken manure was applied daily at 10 a.m by broadcasting all over the pond while the floating pellets were supplied twice a day at 10 a.m. and 3 p.m, also by broadcasting over the pond. Dissolved oxygen (DO) and temperature were monitored twice daily at 6 a.m. and 3 p.m. using an oxygen meter (OXYGARD HANDY III) with a combined oxygen (mg /l) and temperature (oC) probe. Fertilization or feeding was suspended when dawn oxygen levels dropped below 2 mg / l and resumed when the dawn oxygen levels were restored above 2 mg / l. Feed amounts were adjusted monthly based on average weights of 10% fish samples and assuming 100% survival. In the last month of culture, fish did not finish the supplied ration. Thus, fish were fed ad libitum at the same hours as when fed 3% body weight. Daily records of the amounts of chicken manure or pellets supplied were kept and later summed to give weekly or monthly application rates. Water losses due to seepage and evaporation were replaced weekly. 2.3 Determination of sediment accumulation rate and quantification of accumulated sediment In early spring (Egypt) ceramic tiles were installed in the pond floor at 5 cm depth to have a reference point to measure the depth of the sediment layer. Since the ponds were left dry during winter, the sediment was made slightly wet, before starting to place the tiles, and care was taken to remove the soil uniformely and place it back as close to the original position as possible, so as to minimise the disturbance in soil structure and density. In each pond, 5 ceramic tiles measuring 0.5 m by 1 m were installed. The 5 ceramic tiles were distributed to cover the whole pond area and to represent the different sections of the pond (the deeper end, the shallow end, and in the middle. Sticks protruding above the water surface were put at each corner of each ceramic tile to mark tile locations in each pond and to ensure that disturbances by people survicing the ponds would be minimal. Sediment samples were collected monthly using a soil core sampler with
a 5 cm diameter [13, 14]. On each sampling date, two sediment cores from each ceramic tile were collected by pushing down the cores through the sediment until at the surface of the ceramic tile. The top 5-cm of the first sediment cores were placed each in one tarred crucible for dry bulk density analysis by drying them to constant weight at 105 0C in the oven. From the 5 samples collected from the 5 ceramic tiles in a pond, the average dry bulk density (g /cm3) of the top 5-cm sediment layer of each pond was calculated. The second sediment core from each ceramic tile was taken immediately to the pond embankment where the sediment depth was measured while the sample was still in the core liner tube. The quantity of pond sediment in the layer above the ceramic tile was determined monthly as a product of the sediment depth on the ceramic tile, the pond area and the sediment dry bulk density. The difference between pond sediment quantity at the end of culture and in the beginning of culture was taken as the quantity of accumulated pond sediment over the culture period. 2.4 Quantification of sediment from various possible sources Inflow water Water samples were collected from pond inlet pipes for analysis of total solids during pond filling and weekly water replacements to seepage and evaporation losses. The volume of water added to ponds was estimated by monitoring water levels in the pond. PVC pipes, about 1.3 m high and marked in cm were installed in the deeper side of ponds, and used to monitor changes in pond water depth and volume. To determine the sediment load of inflow water, 100 ml samples were put in previously cleaned, dried and weighed crucibles and dried in the oven at 105 oC. The dry crucibles were cooled in a desiccator and weighed. The increase in crucible weight represents the total solids in 100 ml and was used to estimate the total solids / liter. The volume of water added to ponds (in litres) was estimated and the amount of solids added calculated. It was assumed that the contribution by salts to the total solids was negligible since the canals contain fresh waters (salinity was not determined). 2.5 Organic sources The quantity of organic inputs into the ponds (feed and manure) was recorded daily. Total organic inputs were quantified at the end of the culture period and their contribution to sediment accumulation was estimated based on the following assumptions: (i) direct consumption of manure by fish is minimal and most of the input settles to the sediment [22], (ii) in feed driven ponds, 15% of the feed offered is not eaten [ 13, 14, 38] and 30% of ingested feed is excreted as faeces [42] and (iii) 50% of the phytoplankton standing crop sediments daily [49]. To estimate the portion of plankton settling from the water column, primary productivity was estimated monthly using the free water method [21, 7, 9]. 2.6 Quantification of nutrients’ accumulation in the sediment After the sediment depth was measured from the second sediment core taken on the ceramic tiles, the top 5 cm segment of each of the same sediment cores was transferred to a container. All the 5-cm segments from the 5 ceramic tiles in each pond within a sampling date were homogenously mixed to form a composite sample from which a sub-sample was
~ 230 ~
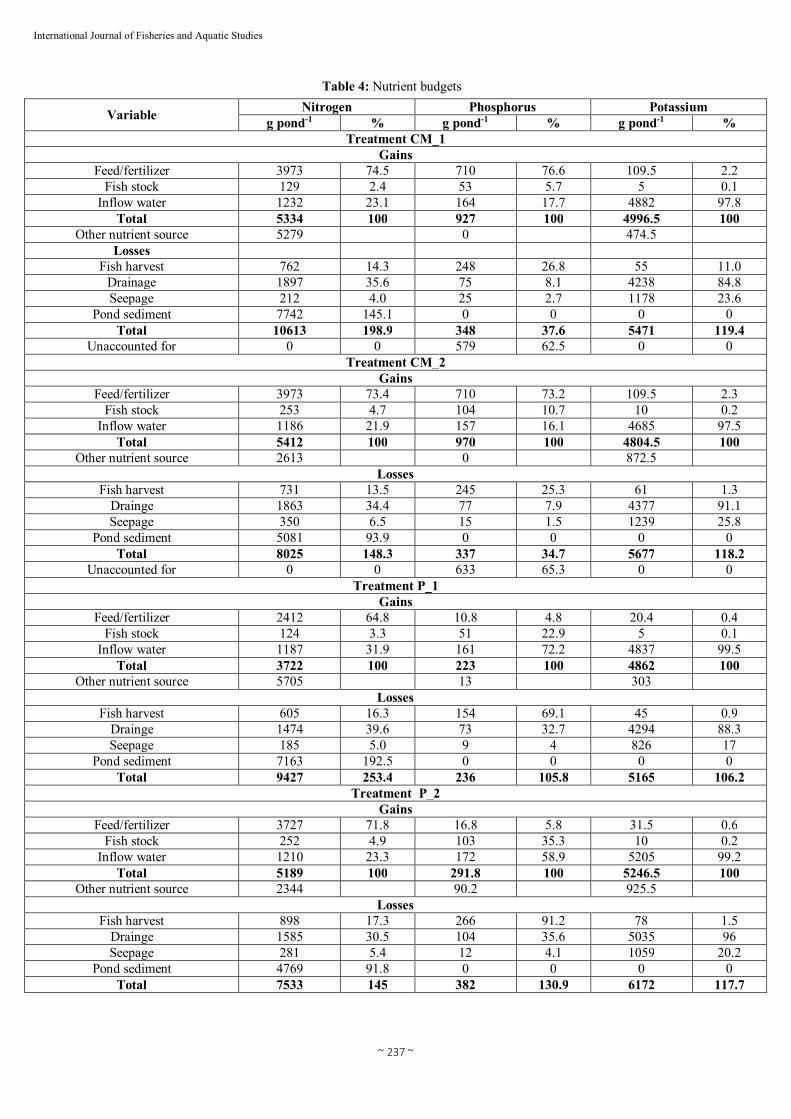
International Journal of Fisheries and Aquatic Studies collected for soil nutrient analysis. The sub-samples were air dried and analysed for total nitrogen, available phosphorus, organic carbon and exchangeable potassium (only available forms of the soil nutrients were analysed since the objective was to quantify nutrients potentially available for land-based agriculture). Total nitrogen was analysed by the Kjeldahl method [41] and organic carbon by the Walkley-Black dichromate method [16]. Available phosphorus was analysed by Olsen’s method of sodium bicarbonate extraction followed by a colorimetric determination of phosphorus with ammonium molybdate as a colouring agent [16]. Exchangeable potassium was analysed by determining the exchangeable potassium in a cation exchange-replacing solution (BaCl2) [16] followed by atomic absorption determination of potassium [41]. The quantity of available nutrients in the upper 5-cm pond sediment layer was quantified monthly as a product of the sediment nutrient concentrations (% on dry weight basis), the pond area and the sediment dry bulk density. The difference between the nutrient quantity in the upper 5-cm layer at the end the of culture period and the quantity by the beginning of the culture period was considered to represent the quantity by which nutrients accumulated during the culture period. 2.7 Nutrient budgets Total nitrogen, available phosphorus and exchangeable potassium budgets were prepared for each treatment to compare with the observed nutrient accumulation in the pond sediments. Nutrient gains considered were feed/manure, stocked fish and inflow water while considered nutrient losses were fish harvest, drainage water and seepage and pond sediment. To estimate nutrient gains from inflow water, water samples were collected from inlet canals during pond filling and pond water replacements and their total nitrogen, total phosphorus and exchangeable potassium contents determined. To estimate nutrient gains from stocked fish and pond inputs, proximate analyses were made of samples of fish, feed and manure. To estimate nutrient losses through drainage, water column samples were taken before drainage. The water samples were collected from three points in a pond using a column sampler
[9], mixed together and a one-litre sample collected from the homogenously mixed composite sample. Sub-samples drawn from the one-litre sample were analyzed for total nitrogen, total phosphorus and exchangeable potassium. Total nitrogen and total phosphorus in both samples of inflow water and of drainage water were analyzed through simultaneous persulphate digestion [20] followed by phenoldisulfonic acid method [6] for the nitrogen samples and ascorbic acid method [9] for the phosphorus samples (In the water samples total phosphorus was determined and not the available phosphorus as in the sediment samples so as to include available phosphorus utilised by the organic forms in the water). Exchangeable potassium in both water samples was analyzed by atomic absorption [41]. To estimate nutrient losses through seepage, the amount of water lost through seepage was measured by periodic observations of water levels in closed PVC pipes. The PVC pipes, which were also used for monitoring pond water levels, were pushed 30cm into the bond bottom and protruded to the water surface. A meter rule marked in centimetres was fixed on the inside of the PVC pipes with the zero cm mark at the surface end. The PVC pipes were filled with water to the zero mark and changes in water levels inside the pipes reflected
loss of water through seepage. Seepage water was collected using rhizons [37]. Rhizons are small suction probes made of a thin polymer tube with a 1 mm internal diameter and 0.1 micron pores, and are standard equipment used in soil science to sample soil moisture (Rhizon sampler from Eijkelkamp Agrisearch Equipment, http://www.eijkelkamp.com). The methodology of using Rhizons to sample seepage water in ponds has been tested and described by [37]. Two rhizons / pond were installed in pond bottoms at a 10 cm depth before pond filling. The rhizons were connected to plastic extension tubes extending above the water surface to allow for easy sampling. Seepage water samples were collected monthly by connecting the extension tubes to a vacuum tube. Seepage water samples from a pond were pooled and analysed for total nitrogen, total phosphorus and exchangeable potassium together with drainage water samples and inflow water samples as described in the preceding text. 2.8 Statistical analyses To evaluate the effect of input type and different stocking density on sediment and nutrient accumulation, data on monthly pond sediment depths and sediment nutrient concentrations, were analysed by two-way ANOVA (repeated measurements) with stocking density and nutrient input type as the main factors and sampling time as sub-factor, as shown in the following statistical model: Yijkl = + Si + Nk + (SxN)ik + eijk + Tl + (SxT)il + (NxT)kl + (SxNxT)ikl + eijkl where, Yijkl = observed value; = overall mean; Si = effect of stocking density (i=2); Nk = effect of nutrient input type (k = 2); (S+N)ik = effect of interaction between stocking density and nutrient input type; eijk = error 1 (j = 4 replicates); Tl = effect of sampling date (l = 5); (SxT)il = interaction of stocking density and sampling time; (NxT)kl= interaction of nutrient input type and sampling time; (SxNxT)ikl = interaction of stocking density and nutrient input type and sampling time; eijkl = error 2. The analyses were run in SAS (version 8.2) statistical software package (SAS Institute Inc., Cary, NC 27513, USA). Means were isolated by Tukey and differences were considered significant at an alpha level of 0.05. Before ANOVA and multi-comparison tests of means, normality tests were performed on the data and arc sine transformations done for data obtained in % values such as the sediment nutrient concentrations. 3. Results 3.1 Sediment accumulation In all the treatments, sediment depths on the ceramic tiles increased significantly while bulk densities (upper 5-cm sediment layer) declined significantly over time but effects due to input type or stocking density were not significant (Table 1). Sediment depths increased by about 3 cm/pond during the culture period while bulk densities declined by about 0.1–0.3 g/cm3 (Table 2). Over the experimental period, bulk densities were determined for the upper 5 cm. However, to quantify the pond sediment in the whole sediment layer above the ceramic tile, the bulk density for the total sediment depth above the ceramic tile was required. To address this oversight, two assumptions were made to estimate the maximum and minimum sediment accumulation (i) that the monthly bulk density of the total sediment layer above the

~ 231 ~
International Journal of Fisheries and Aquatic Studies ceramic tile was the same as that observed in the upper 5 cm layer (minimum) (ii), that in the preceding months, the bulk density of the sediment layer above the ceramic tile, but below the upper 5 cm remained the same as that of the first month (maximum). Minimum sediment accumulation quantities ranged from less than 1 to 3.1 tons/pond/cycle while the maximum quantities ranged from 1.5–3.46 tons / pond / cycle and there were no differences between treatments (Table 2). 3.2 Sediment sources Influent water contributed about 0.17 to 0.21 kg of sediment / pond during the entire culture period (Table 2). From the organic inputs, a total of 77 kg of manure was added to treatments CM_1 and CM_2, 82.9 kg of feed to P_2 and 53.6 kg of feed to P_1 (Figure 1). Assuming minimal consumption of manure by fish [22], organic inputs contributed at most 77 kg in CM_1 and CM_2 treatments. Assuming 15% of applied feed was uneaten [13, 14, 38] and 30% of ingested feed was excreted (Porter et al., 1997), uneaten feed and faecal solids contributed 12.4 and 21.1 kg, respectively in P_2 and 8.4 and 13.7 kg, respectively, in P_1. Primary production during the entire culture period averaged 4.36, 3.94, 2.91 and 3.08 g C / m2 / day in CM_1, CM_2, P_1 and P_2, respectively. Assuming 50% algal sedimentation day-1 [49], about 2.18, 1.87, 1.46 and 1.54 g C / m2 / day of plankton accumulated at the sediment surface in CM_1, CM_2, P_1 and P_2, respectively, and translates to about 60.6, 52.0, 40.6 and 42.8 kg / pond in CM_1, CM_2, P_1 and P_2, respectively, over the culture period. In total, contribution to sediment accumulation by organic sources (uneaten inputs, faecal matter and plankton sedimentation) amounts to 137.6, 129, 62.7 and 76.3 kg in CM_1, CM_2, P_1 and P_2, respectively (Table 2). 3.3 Nutrient accumulation 3.3.1 Nitrogen and organic carbon In all the treatments, nitrogen concentrations in the top 5cm pond sediment layer increased significantly over time while organic carbon concentrations increased in the first 3 months and after decreased to almost the original levels (Table 1 –multi-comparison tests of nitrogen means by month). For both nitrogen and organic carbon, there were no significant effects due to input type or stocking density (Table 1). Monthly quantifications of pond sediment nitrogen in the upper 5-cm layer show that the quantity of nitrogen increased by 4.77 - 7.74 kg during the culture period with no significant effects due to treatments (Table 3). However, in the nutrient budgets, when this quantity is assumed to be the nitrogen accumulation in the pond sediment, total nitrogen losses from the ponds are higher than the total nitrogen gains in all treatments by 2.3 - 5.7 kg (Table 4). 3.3.2 Available phosphorus Available phosphorus concentrations decreased in the first month of culture, increased in the second month, then decreased in the third and fourth months to concentrations lower than those at the beginning of the culture period (Table 1 –multi-comparison tests of available phosphorus means by month). Effects due to input type or stocking density were not significant (Table 1). By the end of the culture period, the quantity of available phosphorus in the top 5 cm was lower than that at the beginning by about 0.3 kg/pond in all the treatments (Table 3). In the nutrient budgets (Table 4), 62.5% (0.579 kg) and 65.3% (0.633 kg) of the available phosphorus
input in CM_1 and CM_2 was not accounted for in fish harvest, drainage and seepage, while in P_1 and P_2, losses to fish harvest, drainage and seepage were higher than gains by 0.013 kg and 0.09 kg, respectively. 3.3.3 Potassium Exchangeable potassium concentrations decreased significantly after one month, then stabilized for the rest of the culture period (Table 1 –multi-comparison tests of exchangeable potassium means by month). Differences due to input type or stocking density were not significant (Table 1). By the end of the culture period, the quantity in the top 5 cm sediment layer was lower by 3-4 kg / pond (Table 3) while in the nutrient budgets (Table 4), total losses were higher than total inputs in all treatments by < 1 kg. 4. Discussion 4.1 Sediment accumulation During the culture period, pond sediment depths increased in all treatments while bulk densities declined (Table 2). Taking into account possible minimum and maximum changes in sediment bulk density, up to 3.46 tons of sediment accumulation / pond / cycle (Table 2) was estimated, which translates to about 173 tons / ha / cycle. Considered sediment sources (influent water and organic sedimentation) contributed less than 10% of the estimated accumulated sediment (Table 3). On the average, a seasonal sediment deposition rate of about 200 tons / ha is reported for aquaculture ponds [3]. The majority of the accumulated sediment is said to originate from sediment load in influent water [7, 9, 2], inorganic solids from levee erosion [38, 51, 54] and sedimentation of organic inputs and wastes [19, 57, 23]. However, relative proportions of these sources have not been studied [23, 3]. In this study, estimation of the relative proportion of influent water and organic inputs shows that together they only account for less than 10% of the accumulated sediment. Hence, they are not major sources of the accumulated sediment. Similar observations and conclusions were made by [51, 52] when he found that the rate of sediment accumulation was not related to organic inputs and that the level of suspended material in influent water was low. Elsewhere, solids budgets by [18], also showed that the major source of sediments (88–93%) in shrimp ponds in Thailand was the erosion of pond soil, and, although applied feed was a significant source of organic matter (31-50%), it contributed only 4–7% of accumulated total solids. In this study, erosion of pond walls is not a possible major source of the accumulated sediment since the ponds, though earthen, had concrete walls. However, sand drifting from pond banks and wind blown debris are possible sources of the accumulated sediment [23]. The proportion of their contribution to sediment accumulation is however unknown since they have not been determined before and were not determined in this study too. In a study to determine the nutrient input by Harmattan dust to a forest ecosystem in West Africa, [55]
reported dust deposition rates ranging from 42–991 kg / ha / year. Assuming similar rates in the present study, about 0.3–7.4 kg of sediment / pond / cycle would originate from dust deposition and would account for about 0.5% of the accumulated sediment. However, the above reported deposition rate was in a forest ecosystem and the current study was in a desert ecosystem hence the dust deposition rate in the study could be higher. Presence of other wind blown debris
~ 232 ~
International Journal of Fisheries and Aquatic Studies such as leaves and sand from the pond banks could also increase the total deposition. Various studies by [53, 56, 59]
reported increase in sediment depths ranging from 12cm - 33
cm in culture periods ranging from 1 year - 30 years of fish production.
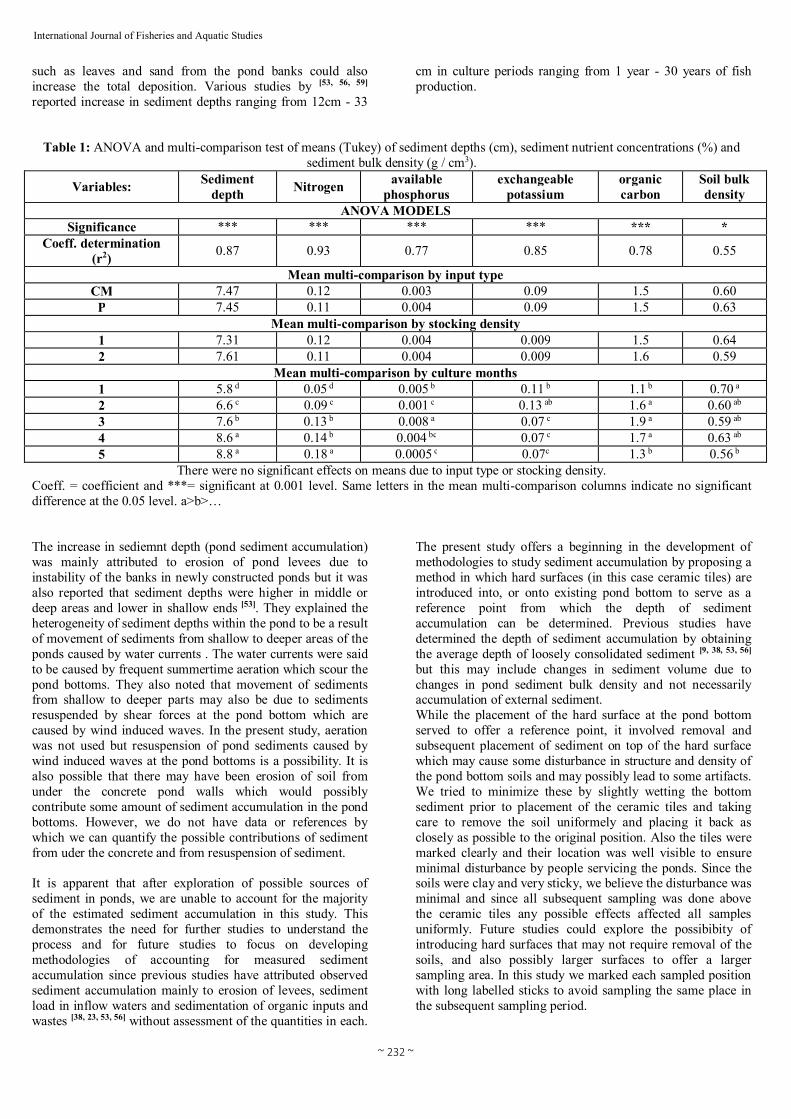
Table 1: ANOVA and multi-comparison test of means (Tukey) of sediment depths (cm), sediment nutrient concentrations (%) and sediment bulk density (g / cm3).
Variables: Sediment depth Nitrogen available
phosphorus exchangeable
potassium organic carbon
Soil bulk density
ANOVA MODELS Significance *** *** *** *** *** *
Coeff. determination (r2) 0.87 0.93 0.77 0.85 0.78 0.55
Mean multi-comparison by input type CM 7.47 0.12 0.003 0.09 1.5 0.60
P 7.45 0.11 0.004 0.09 1.5 0.63 Mean multi-comparison by stocking density
1 7.31 0.12 0.004 0.009 1.5 0.64 2 7.61 0.11 0.004 0.009 1.6 0.59
Mean multi-comparison by culture months 1 5.8 d 0.05 d 0.005 b 0.11 b 1.1 b 0.70 a 2 6.6 c 0.09 c 0.001 c 0.13 ab 1.6 a 0.60 ab 3 7.6 b 0.13 b 0.008 a 0.07 c 1.9 a 0.59 ab 4 8.6 a 0.14 b 0.004 bc 0.07 c 1.7 a 0.63 ab 5 8.8 a 0.18 a 0.0005 c 0.07c 1.3 b 0.56 b
There were no significant effects on means due to input type or stocking density. Coeff. = coefficient and ***= significant at 0.001 level. Same letters in the mean multi-comparison columns indicate no significant difference at the 0.05 level. a>b>… The increase in sediemnt depth (pond sediment accumulation) was mainly attributed to erosion of pond levees due to instability of the banks in newly constructed ponds but it was also reported that sediment depths were higher in middle or deep areas and lower in shallow ends [53]. They explained the heterogeneity of sediment depths within the pond to be a result of movement of sediments from shallow to deeper areas of the ponds caused by water currents . The water currents were said to be caused by frequent summertime aeration which scour the pond bottoms. They also noted that movement of sediments from shallow to deeper parts may also be due to sediments resuspended by shear forces at the pond bottom which are caused by wind induced waves. In the present study, aeration was not used but resuspension of pond sediments caused by wind induced waves at the pond bottoms is a possibility. It is also possible that there may have been erosion of soil from under the concrete pond walls which would possibly contribute some amount of sediment accumulation in the pond bottoms. However, we do not have data or references by which we can quantify the possible contributions of sediment from uder the concrete and from resuspension of sediment. It is apparent that after exploration of possible sources of sediment in ponds, we are unable to account for the majority of the estimated sediment accumulation in this study. This demonstrates the need for further studies to understand the process and for future studies to focus on developing methodologies of accounting for measured sediment accumulation since previous studies have attributed observed sediment accumulation mainly to erosion of levees, sediment load in inflow waters and sedimentation of organic inputs and wastes [38, 23, 53, 56] without assessment of the quantities in each.
The present study offers a beginning in the development of methodologies to study sediment accumulation by proposing a method in which hard surfaces (in this case ceramic tiles) are introduced into, or onto existing pond bottom to serve as a reference point from which the depth of sediment accumulation can be determined. Previous studies have determined the depth of sediment accumulation by obtaining the average depth of loosely consolidated sediment [9, 38, 53, 56]
but this may include changes in sediment volume due to changes in pond sediment bulk density and not necessarily accumulation of external sediment. While the placement of the hard surface at the pond bottom served to offer a reference point, it involved removal and subsequent placement of sediment on top of the hard surface which may cause some disturbance in structure and density of the pond bottom soils and may possibly lead to some artifacts. We tried to minimize these by slightly wetting the bottom sediment prior to placement of the ceramic tiles and taking care to remove the soil uniformely and placing it back as closely as possible to the original position. Also the tiles were marked clearly and their location was well visible to ensure minimal disturbance by people servicing the ponds. Since the soils were clay and very sticky, we believe the disturbance was minimal and since all subsequent sampling was done above the ceramic tiles any possible effects affected all samples uniformly. Future studies could explore the possibibity of introducing hard surfaces that may not require removal of the soils, and also possibly larger surfaces to offer a larger sampling area. In this study we marked each sampled position with long labelled sticks to avoid sampling the same place in the subsequent sampling period.

~ 233 ~
International Journal of Fisheries and Aquatic Studies
Table 2: Multi-comparison tests (Tukey) of sediment accumulation means by treatment (±stdev)
Treatments Parameters CM_1 CM_2 P_1 P_2 Sediment accumulation Sediment depths(cm) during culture months First Second Third Fourth Fifth Accumulated sediment layer (cm)
5.6 ± 0.57 6.4 ± 0.44 7.3 ± 0.82 8.2 ± 0.37 8.6 ± 0.45
3.0
6.1 ± 0.57 6.9 ± 1.09 7.8 ± 0.32 8.9 ± 0.87 8.9 ± 0.84
2.8
5.9 ± 0.69 6.3 ± 0.38 7.4 ± 0.63 8.7 ± 1.54 8.7 ± 1.26
2.9
5.6 ± 0.54 6.9 ± 0.36 7.8 ± 0.82 8.6 ± 0.45 8.8 ± 0.45
3.2
Soil bulk density (g cm-3) during culture months First Second Third Fourth Fifth
0.63 ± 0.09 0.63 ± 0.19 0.63 ± 0.17 0.59 ±0.15 0.59 ± 0.17
0.75 ± 0.11 0.58 ±0.11 0.58 ± 0.1
0.55 ± 0.11 0.47 ± 0.05
0.71 ± 0.09 0.59 ± 0.07 0.67 ± 0.11 0.68 ± 0.13 0.64 ± 0.09
0.72 ± 0.18 0.59 ± 0.07 0.47 ± 0.05 0.70 ± 0.28 0.55 ± 0.28
Pond sediment quantity (tons pond-1) above ceramic minimum maximum minimum maximum minimum maximum minimum maximum
First Second Third Fourth Fifth Quantity of accumulated sediment over the culture period (tons pond-1 cycle)
7.06 ± 0.80 8.03 ± 2.41 9.04 ± 2.13 9.82 ± 2.70 10.16±2.69
3.1
7.06 ± 0.80 8.05 ± 2.10 9.18 ± 0.92 10.01±2.15 10.52±1.96
3.46
9.05 ±1.51 8.17 ± 2.75 8.94 ± 1.31 9.60 ± 1.09 8.27 ± 1.28
-0.78
9.05 ± 1.51 8.64 ± 2.76 9.91 ± 0.46 11.30±0.83 10.55±2.10
1.5
8.40 ± 1.47 7.47 ± 1.32 9.83 ± 1.82 11.66±2.86 11.20±2.26
2.8
8.40 ± 1.47 7.73 ± 0.87 9.99 ± 1.08 11.94±2.78 11.67±2.18
3.3
8.08 ± 2.66 8.22 ± 1.09 7.22 ± 0.28 11.9 ± 4.79 9.75 ± 5.56
1.67
8.08 ± 2.66 8.66 ± 1.33 8.59 ± 0.84 12.08±3.91 10.86±4.21
2.8
Sediment sources Influent water (kg pond-1 culture period-1) Estimated sedimentation from organic sources (kg) Total (kg)
0.19 ± 0.01 137.79 137.79
0.21 ± 0.07 129.21 129.21
0.20 ± 0.02 62.9 62.9
0.17 ± 0.03 76.47 76.47
% of accumulated sediment accounted by influent water and organic sources
4.4
4.0
-
8.6
2.5
1.9
4.6
2.7
Treatment means were not significant for all parameters (P > 0.05)Treatment means were not significant for all parameters (P > 0.05)

~ 234 ~
International Journal of Fisheries and Aquatic Studies An important observation from the present results is the importance of temporal bulk density measurements in the quantification of sediment accumulation. Previous studies have measured sediment depths and assumed a constant bulk density [51]. However, the results show that in some cases the increase in pond sediment depths could be due to changes in pond sediment volumes as a result of decline in sediment bulk densities and may not necessarily be due to sediment accumulation (Table 2: CM_2). Measuring the change in pond sediment depths and assuming a constant bulk density from beginning to end may lead to overestimation of the accumulated sediment while assuming the final bulk density only may lead to underestimation. 4.2 Nutrient accumulation 4.2.1 Nitrogen and organic Carbon The increase in concentration of sediment organic carbon in the first months of culture can be attributed to organic inputs
in the form of organic fertilizers and feeds. After the first 2 months of culture however, a decline of morning DO levels to below 2 mg / l (Figure 1) led to temporary suspension of feeding and fertilization and subsequent reduction of the quantities of fertilizer and feed (Figure 2). Reduction of organic inputs coupled with consumption of organic matter by respiration is likely to have contributed to the decrease in organic carbon. During respiration, the sediment’s organic carbon is consumed and converted mostly to CO2
[4] that is released from the water to the atmosphere and does not accumulate in the pond [8]. However, nitrogen losses are slight since ammonium, the end product of organic nitrogen mineralization is absorbed by the clay present in the sediment [4]. Inorganic nitrogen therefore accumulates whereas organic carbon declines [27], hence, the continued increase in pond sediment nitrogen with time even as organic carbon decreased.
0
1
2
3
4
5
6
1 2 3 4 5 6 7 8 9 10 11 12 13 14 15 16 17 18
Time in weeks
Oxy
gen
conc
entr
atio
n (m
g l -1
)
CM_1CM_2P_1
P_2
Fig 1: Oxygen concentrations during the culture period
0.0
1.0
2.0
3.0
4.0
5.0
6.0
7.0
8.0
9.0
1 2 3 4 5 6 7 8 9 10 11 12 13 14 15 16 17 18
Time in weeks
CM
and
feed
am
ount
s (kg
)
P_2
P_1
CM_1 & _2
Fig 2: Weekly chicken manure (CM) and feed amounts pond -1 over the culture period
~ 235 ~
International Journal of Fisheries and Aquatic Studies In the nutrient quantifications, the increase in the quantity of nitrogen in the top 5-cm layer during the culture period (Table 3) was taken to represent the quantity of accumulated nitrogen in the pond sediments and was used in the nutrient budgets. However, the nutrient budgets had a negative balance (Table 4). In all the treatments, the total nitrogen losses from the ponds were higher than the total nitrogen gains by 2.3-5.7 kg (Table 3). This implies the presence of other sources of nitrogen input into the ponds other than those considered and may be attributed to nitrogen fixation. Nitrogen fixation by blue green algae that are a common occurrence in fish ponds has been reported to contribute significant amounts of nitrogen inputs in ponds (Lin et al., 1988). Nitrogen fixation rates ranging from 6 – 57 mg N / m2 / d in tropical fish ponds were reported by Lin et al. (1988) while [1] reported an average of 24 mg N / m2 / d in a tropical fresh water fish pond stocked with hybrid Oreochromis niloticus and fed on a pelleted feed. Nitrogen fixation is recognized as an important source of nitrogen in ponds but was not measured in this study. Due to lack of easily applied methods to measure it, nitrogen fixation is often not measured in many nutrient dynamic studies [12]. 4.2.2 Available phosphorus Available phosphorus concentrations fluctuated over time (Table 1: mean multi-comparison by culture months). By the end of the culture period, the quantity in the top 5 cm was lower than at the beginning (Table 3), implying that pond sediment lost available phosphorus during the culture period. The nutrient budgets (Table 4) show that, in P_1 and P_2, total available phosphorus losses were higher than gains by 5.5% (0.013 kg) and 23.5% (0.09 kg) respectively which appears to support the possibility of available phosphorus loss from the sediment to the pond system. Contrarily, 62.5% (0.579 kg) and 65.3% (0.633 kg) of the available phosphorus input in CM_1 and CM_2 was not accounted for in fish harvest, drainage and seepage which implies accumulation in the pond sediment. These contradictions in the results could be due to the small quantities of available phosphorus involved (total inputs of less than 1 kg). Thus, the discrepancies could be due to analytical errors as observed by [8] that detection of small changes in phosphorus in bottom soils is difficult within a single crop. On the other hand, the main reason for phosphorus accumulation in sediments is due to its adsorption by mud [50]. The adsorption results from the transformation of water-soluble forms of phosphorus into less soluble or insoluble ones bound to divalent and trivalent cations on the soil solid phase [36]. The adsorbed phosphate on oxides or clays may be covered by more oxides or become a part of a crystalline oxide, thus a tendency for the solubility of the adsorbed phosphate to decline with time [50]. This may be the case in the manured treatments where although the nutrient budgets imply phosphate accumulation, it was not observed since only the available phosphorus was measured and not the total phosphorus. [33] found that the phosphorus pool in the pond soil was over 500 times greater than that of pond water but most of the soil phosphorus was strongly adsorbed and unavailable. They concluded that most of the phosphorus added to fish ponds ends up in the soil in an unavailable form and the present results appear to conform to this conclusion. However, for further understanding of phosphorus availability, and potential of pond sediment as an agricultural input, future studies should measure both total and available phosphorus. This is because while the inorganic forms of phosphorus (and
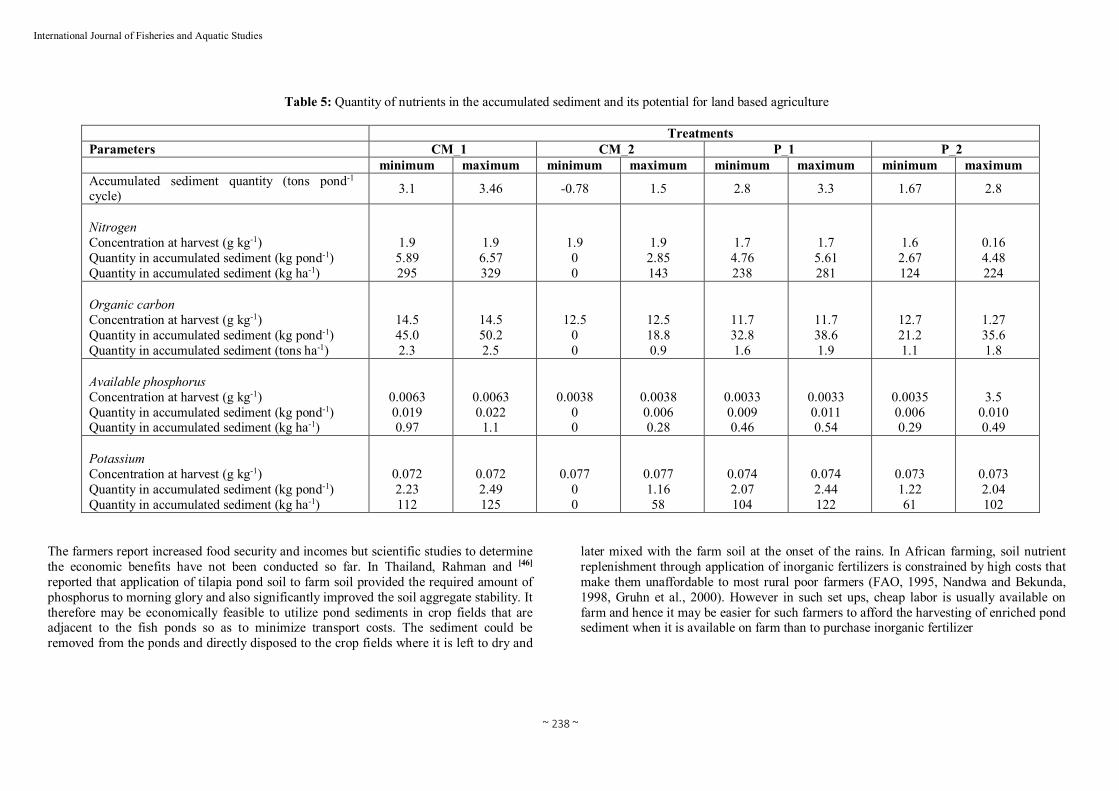
other nutrients as well) in pond sediments will be immediately available to plants, organic forms will become available after some time through microbial activity. Quantification of the total phosphorus in the pond sediments is therefore also important because once the pond sediment is used as an agricultural input, the total phosphorus added to the fields, especially in poor soils will be important in building the long term fertility of the soils. In sediments of aquaculture ponds that have been used for periods ranging from 1 year to 30 years, various studies have reported total phosphorus concentrations ranging from 0.334 to 1.73 g/kg while the available phosphorus concentrations ranged 0.005 to 0.022 g / kg [58, 59, 35, 59]. It was noted that the total phosphorus increased with pond age and organic phosphorus formed 23-60% of the total phosphorus [48, 35, 11]. 4.2.3 Potassium The decrease in sediment potassium concentration after one month (Table 1) may be attributed to ion exchange reactions [17]. Potassium concentration in the sediment may have been higher than that in the overlying pond water, hence potassium ions were released from the pond sediment to the water column until equilibrium was established and maintained afterwards. In the nutrient budgets (Table 4), higher total losses than total inputs imply that there was another source of exchangeable potassium other than feed/fertilizer, stocked fish and inflow. The ‘other source’ could be the pond sediment. However, the contribution of exchangeable potassium by ‘other source’ was less than 1 kg / pond in all treatments (Table 4) while the apparent loss from the sediment was about 3-4 kg / pond (Table 3). It is possible that part of the potassium was leached to the deeper layers of the pond sediments. 4.3 Pond sediment potential as a crop fertilizer Assuming the estimated quantities of the accumulated sediment was harvested for use in agriculture, estimates of the potentially available nutrients were calculated. The estimated quantities of the accumulated sediment could contain from 100 – > 300 kg of nitrogen, 1.8–5 tons of organic matter (twice the values of organic carbon), 0.2–1.1 kg of available phosphorus and 50–125 kg of exchangeable potassium / ha / growing season (Table 5). In Egypt, the location of the study site (and in many other countries in Africa), corn is one of the main food crops and the recommended nitrogen, phosphorus and potassium fertilization rates are 286, 200 and 85 kg / ha
respectively (personal communication, Agricultural officer, Zagazig, Egypt). At the observed sediment and nutrient accumulation rates, accumulated sediment ha / cycle could potentially meet the nitrogen fertilizer requirement for 0.35 – 1.2 hectare, and the potassium fertilizer requirement for 0.7 – 1.5 hectare but only less than 1% of the phosphorus fertilizer requirement. It is important to note that the culture cycle in the present study was short (4.5 months) and the ponds were newly constructed, thus with longer culture periods and older fertilized or fed fish ponds and with higher intensities of nutrient inputs, the nutrient quantities could be higher. [60]
found one hectare of old pond sediment to be equivalent to 2.8 tons of urea and 3 tons of TSP while Yang et al. (2002) reported the same to be equivalent to 3.44 – 3.92 tons of urea and 4.11 – 4.81 of TSP. Elsewhere, the fertilizer value of sediment of one hectare tilapia fingerling production pond at the Asian Institute of Technology (AIT) was reported to be equivalent to 6.26 tons of urea and 1.96 tons of TSP
~ 236 ~
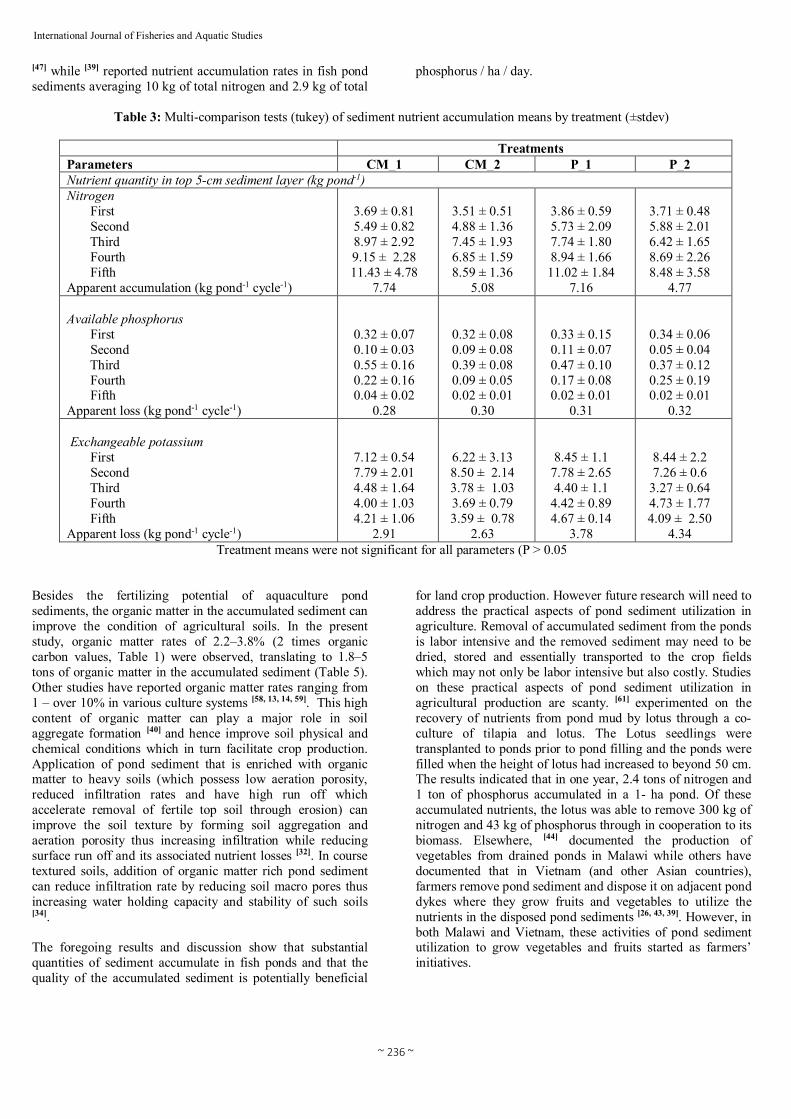
International Journal of Fisheries and Aquatic Studies [47] while [39] reported nutrient accumulation rates in fish pond sediments averaging 10 kg of total nitrogen and 2.9 kg of total
phosphorus / ha / day.
Table 3: Multi-comparison tests (tukey) of sediment nutrient accumulation means by treatment (±stdev)
Treatments Parameters CM_1 CM_2 P_1 P_2 Nutrient quantity in top 5-cm sediment layer (kg pond-1) Nitrogen First Second Third Fourth Fifth Apparent accumulation (kg pond-1 cycle-1)
3.69 ± 0.81 5.49 ± 0.82 8.97 ± 2.92 9.15 ± 2.28 11.43 ± 4.78
7.74
3.51 ± 0.51 4.88 ± 1.36 7.45 ± 1.93 6.85 ± 1.59 8.59 ± 1.36
5.08
3.86 ± 0.59 5.73 ± 2.09 7.74 ± 1.80 8.94 ± 1.66 11.02 ± 1.84
7.16
3.71 ± 0.48 5.88 ± 2.01 6.42 ± 1.65 8.69 ± 2.26 8.48 ± 3.58
4.77 Available phosphorus First Second Third Fourth Fifth Apparent loss (kg pond-1 cycle-1)
0.32 ± 0.07 0.10 ± 0.03 0.55 ± 0.16 0.22 ± 0.16 0.04 ± 0.02
0.28
0.32 ± 0.08 0.09 ± 0.08 0.39 ± 0.08 0.09 ± 0.05 0.02 ± 0.01
0.30
0.33 ± 0.15 0.11 ± 0.07 0.47 ± 0.10 0.17 ± 0.08 0.02 ± 0.01
0.31
0.34 ± 0.06 0.05 ± 0.04 0.37 ± 0.12 0.25 ± 0.19 0.02 ± 0.01
0.32 Exchangeable potassium First Second Third Fourth Fifth Apparent loss (kg pond-1 cycle-1)
7.12 ± 0.54 7.79 ± 2.01 4.48 ± 1.64 4.00 ± 1.03 4.21 ± 1.06
2.91
6.22 ± 3.13 8.50 ± 2.14 3.78 ± 1.03 3.69 ± 0.79 3.59 ± 0.78
2.63
8.45 ± 1.1 7.78 ± 2.65 4.40 ± 1.1
4.42 ± 0.89 4.67 ± 0.14
3.78
8.44 ± 2.2 7.26 ± 0.6
3.27 ± 0.64 4.73 ± 1.77 4.09 ± 2.50
4.34 Treatment means were not significant for all parameters (P > 0.05
Besides the fertilizing potential of aquaculture pond sediments, the organic matter in the accumulated sediment can improve the condition of agricultural soils. In the present study, organic matter rates of 2.2–3.8% (2 times organic carbon values, Table 1) were observed, translating to 1.8–5 tons of organic matter in the accumulated sediment (Table 5). Other studies have reported organic matter rates ranging from 1 – over 10% in various culture systems [58, 13, 14, 59]. This high content of organic matter can play a major role in soil aggregate formation [40] and hence improve soil physical and chemical conditions which in turn facilitate crop production. Application of pond sediment that is enriched with organic matter to heavy soils (which possess low aeration porosity, reduced infiltration rates and have high run off which accelerate removal of fertile top soil through erosion) can improve the soil texture by forming soil aggregation and aeration porosity thus increasing infiltration while reducing surface run off and its associated nutrient losses [32]. In course textured soils, addition of organic matter rich pond sediment can reduce infiltration rate by reducing soil macro pores thus increasing water holding capacity and stability of such soils
[34]. The foregoing results and discussion show that substantial quantities of sediment accumulate in fish ponds and that the quality of the accumulated sediment is potentially beneficial
for land crop production. However future research will need to address the practical aspects of pond sediment utilization in agriculture. Removal of accumulated sediment from the ponds is labor intensive and the removed sediment may need to be dried, stored and essentially transported to the crop fields which may not only be labor intensive but also costly. Studies on these practical aspects of pond sediment utilization in agricultural production are scanty. [61] experimented on the recovery of nutrients from pond mud by lotus through a co-culture of tilapia and lotus. The Lotus seedlings were transplanted to ponds prior to pond filling and the ponds were filled when the height of lotus had increased to beyond 50 cm. The results indicated that in one year, 2.4 tons of nitrogen and 1 ton of phosphorus accumulated in a 1- ha pond. Of these accumulated nutrients, the lotus was able to remove 300 kg of nitrogen and 43 kg of phosphorus through in cooperation to its biomass. Elsewhere, [44] documented the production of vegetables from drained ponds in Malawi while others have documented that in Vietnam (and other Asian countries), farmers remove pond sediment and dispose it on adjacent pond dykes where they grow fruits and vegetables to utilize the nutrients in the disposed pond sediments [26, 43, 39]. However, in both Malawi and Vietnam, these activities of pond sediment utilization to grow vegetables and fruits started as farmers’ initiatives.
~ 237 ~
International Journal of Fisheries and Aquatic Studies
Table 4: Nutrient budgets
Variable Nitrogen Phosphorus Potassium g pond-1 % g pond-1 % g pond-1 %
Treatment CM_1 Gains
Feed/fertilizer 3973 74.5 710 76.6 109.5 2.2 Fish stock 129 2.4 53 5.7 5 0.1
Inflow water 1232 23.1 164 17.7 4882 97.8 Total 5334 100 927 100 4996.5 100
Other nutrient source 5279 0 474.5 Losses
Fish harvest 762 14.3 248 26.8 55 11.0 Drainage 1897 35.6 75 8.1 4238 84.8 Seepage 212 4.0 25 2.7 1178 23.6
Pond sediment 7742 145.1 0 0 0 0 Total 10613 198.9 348 37.6 5471 119.4
Unaccounted for 0 0 579 62.5 0 0 Treatment CM_2
Gains Feed/fertilizer 3973 73.4 710 73.2 109.5 2.3
Fish stock 253 4.7 104 10.7 10 0.2 Inflow water 1186 21.9 157 16.1 4685 97.5
Total 5412 100 970 100 4804.5 100 Other nutrient source 2613 0 872.5
Losses Fish harvest 731 13.5 245 25.3 61 1.3
Drainge 1863 34.4 77 7.9 4377 91.1 Seepage 350 6.5 15 1.5 1239 25.8
Pond sediment 5081 93.9 0 0 0 0 Total 8025 148.3 337 34.7 5677 118.2
Unaccounted for 0 0 633 65.3 0 0 Treatment P_1
Gains Feed/fertilizer 2412 64.8 10.8 4.8 20.4 0.4
Fish stock 124 3.3 51 22.9 5 0.1 Inflow water 1187 31.9 161 72.2 4837 99.5
Total 3722 100 223 100 4862 100 Other nutrient source 5705 13 303
Losses Fish harvest 605 16.3 154 69.1 45 0.9
Drainge 1474 39.6 73 32.7 4294 88.3 Seepage 185 5.0 9 4 826 17
Pond sediment 7163 192.5 0 0 0 0 Total 9427 253.4 236 105.8 5165 106.2
Treatment P_2 Gains
Feed/fertilizer 3727 71.8 16.8 5.8 31.5 0.6 Fish stock 252 4.9 103 35.3 10 0.2
Inflow water 1210 23.3 172 58.9 5205 99.2 Total 5189 100 291.8 100 5246.5 100
Other nutrient source 2344 90.2 925.5 Losses
Fish harvest 898 17.3 266 91.2 78 1.5 Drainge 1585 30.5 104 35.6 5035 96 Seepage 281 5.4 12 4.1 1059 20.2
Pond sediment 4769 91.8 0 0 0 0 Total 7533 145 382 130.9 6172 117.7
~ 238 ~
International Journal of Fisheries and Aquatic Studies
Table 5: Quantity of nutrients in the accumulated sediment and its potential for land based agriculture
Treatments Parameters CM_1 CM_2 P_1 P_2 minimum maximum minimum maximum minimum maximum minimum maximum Accumulated sediment quantity (tons pond-1 cycle) 3.1 3.46 -0.78 1.5 2.8 3.3 1.67 2.8
Nitrogen Concentration at harvest (g kg-1) Quantity in accumulated sediment (kg pond-1) Quantity in accumulated sediment (kg ha-1)
1.9 5.89 295
1.9 6.57 329
1.9 0 0
1.9 2.85 143
1.7 4.76 238
1.7 5.61 281
1.6 2.67 124
0.16 4.48 224
Organic carbon Concentration at harvest (g kg-1) Quantity in accumulated sediment (kg pond-1) Quantity in accumulated sediment (tons ha-1)
14.5 45.0 2.3
14.5 50.2 2.5
12.5 0 0
12.5 18.8 0.9
11.7 32.8 1.6
11.7 38.6 1.9
12.7 21.2 1.1
1.27 35.6 1.8
Available phosphorus Concentration at harvest (g kg-1) Quantity in accumulated sediment (kg pond-1) Quantity in accumulated sediment (kg ha-1)
0.0063 0.019 0.97
0.0063 0.022 1.1
0.0038 0 0
0.0038 0.006 0.28
0.0033 0.009 0.46
0.0033 0.011 0.54
0.0035 0.006 0.29
3.5 0.010 0.49
Potassium Concentration at harvest (g kg-1) Quantity in accumulated sediment (kg pond-1) Quantity in accumulated sediment (kg ha-1)
0.072 2.23 112
0.072 2.49 125
0.077 0 0
0.077 1.16 58
0.074 2.07 104
0.074 2.44 122
0.073 1.22 61
0.073 2.04 102
The farmers report increased food security and incomes but scientific studies to determine the economic benefits have not been conducted so far. In Thailand, Rahman and [46]
reported that application of tilapia pond soil to farm soil provided the required amount of phosphorus to morning glory and also significantly improved the soil aggregate stability. It therefore may be economically feasible to utilize pond sediments in crop fields that are adjacent to the fish ponds so as to minimize transport costs. The sediment could be removed from the ponds and directly disposed to the crop fields where it is left to dry and
later mixed with the farm soil at the onset of the rains. In African farming, soil nutrient replenishment through application of inorganic fertilizers is constrained by high costs that make them unaffordable to most rural poor farmers (FAO, 1995, Nandwa and Bekunda, 1998, Gruhn et al., 2000). However in such set ups, cheap labor is usually available on farm and hence it may be easier for such farmers to afford the harvesting of enriched pond sediment when it is available on farm than to purchase inorganic fertilizer

~ 239 ~
International Journal of Fisheries and Aquatic Studies 5. Conclusion The study showed that, up to173 tons of pond sediment could accumulate in semi-intensive tilapia production ponds / ha / cycle. While the major source of the accumulated sediment could not be explained, influent water and organic pond inputs were not major sources and temporal measurements of sediment bulk densities were found to be important for accurate estimates of accumulated sediment. Nutrients released during mineralization of the organic inputs enriched the accumulated sediment, especially with nitrogen. Declining quantities of sediment available phosphorus in the study suggest that accumulation of phosphorus in pond sediment may be in non available forms. The accumulated sediment is rich in nitrogen, exchangeable potassium and organic matter, hence has a high potential as nitrogen and potassium fertilizer and as a soil conditioner. Nevertheless, field trials to evaluate its fertilizing effect on important agricultural crops, to evaluate practical ways of its utilization as well as the economic benefits are recommended. 6. Acknowledgements The study was funded by the North-South Inter-disciplinary Research and Education Fund (INREF Project) of Wageningen University, The Netherlands. Research facilities and logistical support was provided by the World Fish Center, Egypt. 7. References
1. Acosta-Nasser MV, Morell JM, Corredor JE. The nitrogen budget of a tropical semi-intensive freshwater fish culture pond. Journal of the World Aquaculture Society 1994; 25:261-269.
2. Anon. Impact of shrimp culture on the environment. NACA Newsl, 1994; 11(2):9–11.
3. Avnimelech Y, Ritvo G. Shrimp and fish pond soils: Processes and management. Aquaculture 2003; 220:549–567.
4. Avnimelech Y, Lacher M. Atentative nutrient budget for intensive fish ponds. Bamidgeh, Isr. J Aquac 1979; 31:3–8.
5. Banerjea SM. Water quality and soil condition of fish ponds in some states of India in relation to fish production. Ind J Fish 1967; 14:113–114.
6. Boyd CE. Water quality in warm water fish ponds. Auburn University Agricultural Experiment Station. Craftmaster Printers Inc., Alabama, USA, 1979, 359.
7. Boyd CE. Shrimp pond bottom soil and sediment management. In: J. Wyban (Editor), Proceedings Special Session on Shrimp farming. World Aquaculture Society, Baton Rouge, LA, 1992, 166– 181.
8. Boyd CE. Chemical budgets for channel catfish ponds. Transactions of the American Fisheries Society 1985; 114:291-298.
9. Boyd CE, Tucker CS. Water quality and pond soil analysis for aquaculture. Alabama Agricultural Experiment Station. Auburn University, 1992, 183.
10. Boyd CE, Wood CW, Thunjai T. Aquaculture Pond Bottom Soil Quality Management. Pond Dynmics/ Aquaculture Collaborative Research Support Program. Oregon State University, Corvalis, Oregon, USA, 2002, 41.
11. Boyd CE, Corpron K, Bernard E, Pengseng P. Estimates of bottom soil and effuent load of
phosphorus at a semi-intensive marine shrimp farm. Journal of the World Aquaculture Society 2006, 37:41-47.
12. Boyd CE. Water quality management for pond fish culture. Development in aquaculture and fisheries science, 9. Elsevier Scientific Publishing Company, Amsterdam-Oxford-New York, 1982, 318.
13. Boyd CE, Tucker CS. Sustainability of channel catfish farming. World Aquaculture 1995, 26:45–53.
14. Boyd CE. Bottom soils, sediment and pond aquaculture. Chapman and Hall, New York, 1995, 348.
15. Briggs MRP, Funge-Smith SJ. A nutrient budget of some intensive marine shrimp ponds in Thailand. Aquaculture and Fisheries Management 1994; 25:789-8111.
16. Buurman P, Lagen BV, Velthorst EJ. Manual for Soil and water analysis. Backhuys Publishers Leiden, 1996, 314.
17. Chikafumbwa FJK. Use of fishpond mud as a source of organic fertilizers for crops and vegetables in integrated aquaculture-agriculture systems in Malawi. International Center for Living Aquatic Resources Management (ICLARM), Zomba, Malawi, 1996.
18. Funge-Smith SJ, Briggs MRP. The origins and fate of solids and suspended solids in intensive marine shrimp ponds in Thailand. Summary report from Sonykhla Region of Thailand. Institute of Aquaculture, Stirling, 1994, 20.
19. Gowen RJ, Rosenthal H, Makinen T, Ezzi I. Environmental impacts of aquacultural activities. In: N. De Pauw and R. Billards (Eds), Aquaculture Europe ’89 - Business joins science. European Aquaculture Society, Special Publication No. 12, Bredene, Belgium, 1990, 257–283.
20. Gross A, Boyd CE. A digestion procedure for the simultaneous determination of total nitrogen and total phosphorus in pond water. Journal of the World aquaculture Society 1998; 29(3):300-303.
21. Hall CAS, Moll R. Methods of assessing aquatic primary productivity. In: Leith H. and Whittaker, R.H. Eds. Primary productivity of the biosphere, Springer-Verlag, Newyork, NY, 1975, 19–53.
22. Hargreaves JA. Nitrogen biogeochemistry of aquaculture ponds. Aquaculture 1998; 166:181-212.
23. Hopkins JS, Sandifer PA, Browdy CL. Sludge management in intensive pond culture and shrimp – effect of management regime on water quality, sludge characteristics, nitrogen extinction, and shrimp production. Aquac Eng 1994; 13:11–30.
24. Hopkins KD, Bowman JR. A research methodology for integrated agriculture-aquaculture farming systems. In: Wang, J.K. (ed.). Techniques for Modern Aquaculture. Proceedings of an Aquacultural Engineering Conference 21 – 23 June 1993 Spokane, Washington. American Society of Agricultural Engineers. Michigan, USA, 1993, 604.
25. Jamu DM, Piedrahita RH. Ten year simulations of organic matter concentrations in tropical aquacultureponds using the multiple pool modelling approach. Aquacult Eng 2001; 25:187–201.
26. Knud-Hansen C. Pond history as a source of error in fish culture experiments: a quantitative assessment
~ 240 ~
International Journal of Fisheries and Aquatic Studies using covariate analysis. Aquaculture 1992; 105:21– 36.
27. Kochba M, Diab S, Avnimelech Y. Modeling of nitrogen transformation in intensive aerated fish ponds. Aquaculture 1994, 120:95–104.
28. Krom MD, Porter C, Gordin H. Nutrient budget of a marine fish pond in Eilat, Israel. Aquaculture 1985; 51:65–80.
29. Lin CK, Yi Y. Minimizing environmental impacts of freshwater aquaculture and reuse of pond effluents and mud. Aquaculture 2003; 226:57–68.
30. Lin CK, Tansakul V, Apihapath C. Biological nitrogen fixation as a source of nitrogen input in fishponds. In: Pullin, R.S.V., Bhukaswan, T., Tonguthai, k. Maclean J.L. (Eds.), The Second International Symposium on Tilapia in Aquaculture. ICLARM Conference Proceedings 15. Department of Fisheries, Bangok, Thailand, and International Center for Living Aquatic Resources Manangement, Manilla, Philiphines, 1988, 53–58.
31. Little D, Muir J. A guide to integrated warm water aquaculture. Institute of aquaculture publications, University of Stirling, Stirling 1987, 238.
32. Martens DA, Frankenberger J. Modification of infiltration rates in an organic amended irrigated soil. Agronomy journal 1992; 84:27–33.
33. Masuda K, Boyd CE. Chemistry of sediment pore water in aquaculture ponds built on clayey, Utisols at Auburn, Albama. Journal of the World Aquaculture Society 1994; 25:396-404.
34. Miller RW, Donahue RL. Soils: an introduction to soils and plant growth. Prentice Hall, Engelwood Cliffs, New Jersey, USA, 1990, 768.
35. Ming-Kui Z, Li-ping F. Phosphorus accumulation and eutrophication in feed-supply fresh water fish ponds. Journal of Environmental Sciences 2006; 18:816–821.
36. Morel JL, Fardeau JC, Beruff MA, Guckert A. Phosphate fixing capacity of soils: A survey, using the isotopic exchange technique, or soils from north-eastern France. Fertil Res 1989; 19:103-111.
37. Muendo PN, Stoorvogel JJ, Gamal NE, Verdegem MCJ. Rhizons improved estimation of nutrient losses because of seepage in aquaculture ponds. Aquaculture Research 2005; 36:1333–1336.
38. Munsiri P, Boyd CE, Hajek BF. Physical and chemical characteristics of bottom soil profiles in ponds at Auburn, Alabama, USA and a proposed system for describing pond soil horizons. Journal of the world Aquaculture Society 1995; 26(4):347–376.
39. Nhan DK, Milstein A, Verdegem MCJ, Verreth JAV. Food inputs, water quality and nutrient accumulation in integrtated pond systems: A multivariate approach. Aquaculture 2006; 261:160–173.
40. Nemati MR, Caron J, Gallichad J. Using paper de-inking sludge to maintain soil structural form: field measurements. Soil Science Society of America Journal 2000; 64:275–285.
41. Page AL, Miller RH, Keeney DR. Methods of soil analysis (Ed 2). American Society of agronomy, Soil Science Society of America, Madison, WI, USA. 1982, 1159.
42. Porter C, Krom MD, Robbins MD, Bricknell MG,
Davidson A. Ammonia excretion and total N budget for filthead seabream (Sparus aurata) and its effect on water quality conditions. Aquaculture 1987; 66:287–289.
43. Prein M. Integration of aquaculture into crop-animal systems in Asia. Agricultural systems 2002; 71:127–146.
44. Prein M, Ahmed M. Integration of aquaculture into small holder farming systems for improved food security and household nutrition. Food and Nutrition Bulletin, Vol. 21. No. 4, The United Nations University, 2000, 466–471.
45. Pullin RSV, Shehadeh Z. Integrated Agriculture – Aquaculture Farming Systems. ICLARM Conference Proceedings 4. ICLARM, Manilla, Philippines, 1980.
46. Rahman MM, Yakupitiyage A. Use of fish pond sediment for sustainable aquaculture – agriculture farming. International journal of Sustainable Development and Planing, 2006; 1:192–202.
47. Rahman MM, Yakupitiyage A, Ranamukhaarachchi SL. Agricultural use of fish pond sediment for environmental Amelioration. Thammasat International Journal of Science and Technology 2004; 9(4):1–10.
48. Rath KR. Aquatic environment fresh water aquaculture. Scientific publishers (India), Jodhpur, 2000, 34–71.
49. Schroeder GL, Alkon A, Laher M. Nutrient flow in pond aquaculture systems, Pages 498-505. In: D.E Brune and J. R. Tomasso (Eds) Aquaculture and Water Quality. World Aquaculture Society. Baton Rouge, USA, 1991.
50. Shrestha MK, Kwei-Lin C. Determination of saturation level in relation to clay content in formulated muds. Aquatic Engineering 1996; 15:441-459.
51. Smith PT. Physical and chemical characteristics of sediments from prawn farms and mangrove habitats on the Clarence River, Australia. Aquaculture 1996; 146, 47–83.
52. Smith PT. Characterisation of effluent from prawn farms. In: J. Bardach et al. (editors), Sustainable Aquaculture’95, Pacific Congress on Marine Science and Technology, Honolulu, Hawaii, 1995, 327–338.
53. Steeby JA, Kingsbury S, Tucker CS, Hargreaves J. Sediment accumulation in catfish production ponds. Global Aquaculture Advocate, 2001; 4:54-56.
54. Steeby JA, Hargreaves J, Tucker CS, Kingsbury S. Accumulation, organic carbon and dry matter concentration of sediment in commercial channel catfish ponds. Aquacultural Engineering 2004; 30:115-126.
55. Stoorvogel JJ, Van-Breemen N, Jansen BH. The nutrient input by Harmattan dust to a forest ecosystem in Cote d’Ivore, Africa. Biogeochemestry 1997; 37:145–157.
56. Thunjai T, Boyd CE, Boonyaratpalin M. Bottom soil quality in tilapia ponds of different age in Thailand. Aquaculture Research, 2004, 35:698-705.
57. Wahab MA, Stirling HP. Environment and development of benthos in earthen trout ponds in central Scotland. Aquaculture, 1991; 97:335–352.
58. Wahab MA, Haque A, Aminul AKM, Bhuiya ZH.
~ 241 ~
International Journal of Fisheries and Aquatic Studies Nutrient status of bottom soilsof two ponds in BAU (Banglandesh Agricultural University) Campus. Banglandesh Journal of Fisheries 1984; 6:1–10.
59. Wudtisin I, Boyd CE. Physical and chemical characteristics of sediments in catfish, freshwater prawn, and carp ponds in Thailand. Aquaculture Research 2006; 37:1202-1214.
60. Yang H, Hu B. Introduction of Chineese integrated fish farming and major models. In: Integrated fish farming in China. A World Food Day Publication of the NACA. NACA Technical Manual 7, Bangok, Thailand, 1989.
61. Yi Y, Lin CK, Diana JS. Recycling of pond mud nutrients in integrated Lotus–fish culture. Aquaculture 2002; 212:213–226.
Related Documents


