High Strength, High Toughness Micro-Alloyed Steel Forgings Produced with Relaxed Forging Conditions and No Heat Treatment – Progress Report – Year 1, December 2017 1 High Strength, High Toughness Micro-Alloyed Steel Forgings Produced with Relaxed Forging Conditions and No Heat Treatment – Progress Report – Year 1, December 2017 Aaron E. Stein, M.S. Student Anthony J. DeArdo, PhD The Basic Metals Processing and Research Institute (BAMPRI) The University of Pittsburgh, Mechanical Engineering and Materials Science (MEMS) Department The Forging Industry Education and Research Foundation (FIERF) Author Note The contents of this report contain a summation of work done under the financial support of the Forging Industry Education and Research Foundation (FIERF), and in cooperation with industry partners Meadville Forging Company (MFC) and TIMKENSTEEL Steel Company. The author wishes to thank his advisor, Professor A. J. DeArdo, and the cooperating individuals/companies Carl Mclean and Fred Geib, Meadville Forging Company (MFC), and Tom Zorc, TIMKENSTEEL Steel Company. Special thanks also are due to Karen Lewis, Executive VP of FIERF for both financially supporting the project, and for her enthusiastic encouragement throughout the program. Table of Contents Section I: Overview of Project Progress and Changes ....................................................... 4 Section II: Timeline and Gannt Charts................................................................................ 7

Welcome message from author
This document is posted to help you gain knowledge. Please leave a comment to let me know what you think about it! Share it to your friends and learn new things together.
Transcript
High Strength, High Toughness Micro-Alloyed Steel Forgings Produced with Relaxed Forging Conditions and No Heat Treatment – Progress Report – Year 1, December 2017 1
High Strength, High Toughness Micro-Alloyed Steel Forgings Produced with Relaxed Forging
Conditions and No Heat Treatment – Progress Report – Year 1, December 2017
Aaron E. Stein, M.S. Student
Anthony J. DeArdo, PhD
The Basic Metals Processing and Research Institute (BAMPRI)
The University of Pittsburgh, Mechanical Engineering and Materials Science (MEMS)
Department
The Forging Industry Education and Research Foundation (FIERF)
Author Note
The contents of this report contain a summation of work done under the financial support of the
Forging Industry Education and Research Foundation (FIERF), and in cooperation with industry
partners Meadville Forging Company (MFC) and TIMKENSTEEL Steel Company. The author
wishes to thank his advisor, Professor A. J. DeArdo, and the cooperating individuals/companies
Carl Mclean and Fred Geib, Meadville Forging Company (MFC), and Tom Zorc,
TIMKENSTEEL Steel Company. Special thanks also are due to Karen Lewis, Executive VP of
FIERF for both financially supporting the project, and for her enthusiastic encouragement
throughout the program.
Table of Contents
Section I: Overview of Project Progress and Changes ....................................................... 4
Section II: Timeline and Gannt Charts................................................................................ 7
“HIGH STRENGTH, HIGH TOUGHNESS…” PROGRESS REPORT – YEAR 1 2
Section III: Literature Search and Review .........................................................................11
Section IV: Preliminary/Training Studies on 10V40 ........................................................ 12
Section V: Steel Arrival and Machining ........................................................................... 14
Section VI: Reheat Studies of the 6 Steels and further studies ......................................... 17
Section VI: Thermomechanical Processing Experiments ................................................. 18
Section VII: Transformation Experiments ........................................................................ 19
Section VIII: Bainitic Transformation Study .................................................................... 20
Appendix A: Proposal ....................................................................................................... 21
Appendix B: Literature Review ........................................................................................ 37
Literature Review References ........................................................................................... 82
Appendix C: Reheat and Grain Coarsening Studies ......................................................... 86
Appendix D: Reheat Time Studies .................................................................................... 89
Appendix E: JMATPro Simulation Software Results ....................................................... 92
Appendix F: Equipment and Experiment Training ........................................................... 95
Appendix G: Certification of Steel Compositions ............................................................ 96
Appendix H: Austenite Grain Size Reheat Studies of the Steels ...................................... 97
Appendix I: Preliminary Quench Tank Studies .............................................................. 101
Appendix J: Spray Cooling Final Report ........................................................................ 103
Appendix K: Evaporative Cooling Quench Tank Experiments .......................................116
Appendix L: Thermomechanical Processing Experiments ..............................................119

“HIGH STRENGTH, HIGH TOUGHNESS…” PROGRESS REPORT – YEAR 1 3
Appendix M: Transformation Studies ............................................................................. 122
Appendix N: Bainitic Transformation Report................................................................. 128
“HIGH STRENGTH, HIGH TOUGHNESS…” PROGRESS REPORT – YEAR 1 4
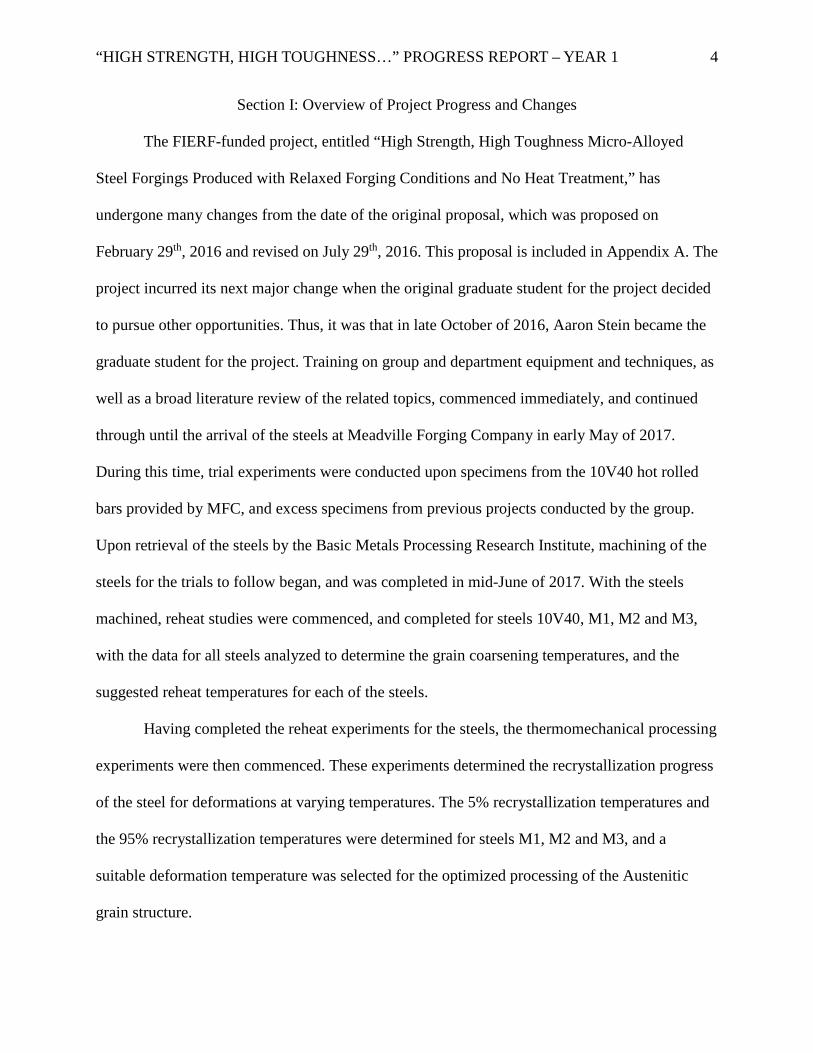
Section I: Overview of Project Progress and Changes
The FIERF-funded project, entitled “High Strength, High Toughness Micro-Alloyed
Steel Forgings Produced with Relaxed Forging Conditions and No Heat Treatment,” has
undergone many changes from the date of the original proposal, which was proposed on
February 29th, 2016 and revised on July 29th, 2016. This proposal is included in Appendix A. The
project incurred its next major change when the original graduate student for the project decided
to pursue other opportunities. Thus, it was that in late October of 2016, Aaron Stein became the
graduate student for the project. Training on group and department equipment and techniques, as
well as a broad literature review of the related topics, commenced immediately, and continued
through until the arrival of the steels at Meadville Forging Company in early May of 2017.
During this time, trial experiments were conducted upon specimens from the 10V40 hot rolled
bars provided by MFC, and excess specimens from previous projects conducted by the group.
Upon retrieval of the steels by the Basic Metals Processing Research Institute, machining of the
steels for the trials to follow began, and was completed in mid-June of 2017. With the steels
machined, reheat studies were commenced, and completed for steels 10V40, M1, M2 and M3,
with the data for all steels analyzed to determine the grain coarsening temperatures, and the
suggested reheat temperatures for each of the steels.
Having completed the reheat experiments for the steels, the thermomechanical processing
experiments were then commenced. These experiments determined the recrystallization progress
of the steel for deformations at varying temperatures. The 5% recrystallization temperatures and
the 95% recrystallization temperatures were determined for steels M1, M2 and M3, and a
suitable deformation temperature was selected for the optimized processing of the Austenitic
grain structure.
“HIGH STRENGTH, HIGH TOUGHNESS…” PROGRESS REPORT – YEAR 1 5
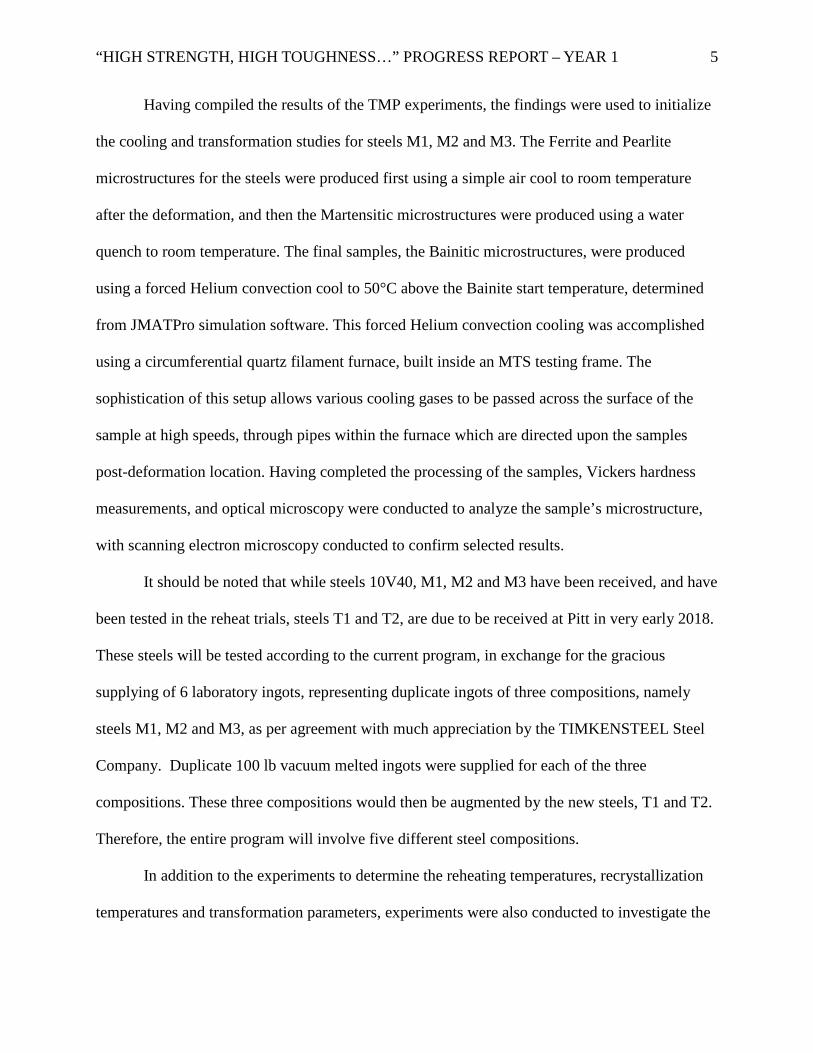
Having compiled the results of the TMP experiments, the findings were used to initialize
the cooling and transformation studies for steels M1, M2 and M3. The Ferrite and Pearlite
microstructures for the steels were produced first using a simple air cool to room temperature
after the deformation, and then the Martensitic microstructures were produced using a water
quench to room temperature. The final samples, the Bainitic microstructures, were produced
using a forced Helium convection cool to 50°C above the Bainite start temperature, determined
from JMATPro simulation software. This forced Helium convection cooling was accomplished
using a circumferential quartz filament furnace, built inside an MTS testing frame. The
sophistication of this setup allows various cooling gases to be passed across the surface of the
sample at high speeds, through pipes within the furnace which are directed upon the samples
post-deformation location. Having completed the processing of the samples, Vickers hardness
measurements, and optical microscopy were conducted to analyze the sample’s microstructure,
with scanning electron microscopy conducted to confirm selected results.
It should be noted that while steels 10V40, M1, M2 and M3 have been received, and have
been tested in the reheat trials, steels T1 and T2, are due to be received at Pitt in very early 2018.
These steels will be tested according to the current program, in exchange for the gracious
supplying of 6 laboratory ingots, representing duplicate ingots of three compositions, namely
steels M1, M2 and M3, as per agreement with much appreciation by the TIMKENSTEEL Steel
Company. Duplicate 100 lb vacuum melted ingots were supplied for each of the three
compositions. These three compositions would then be augmented by the new steels, T1 and T2.
Therefore, the entire program will involve five different steel compositions.
In addition to the experiments to determine the reheating temperatures, recrystallization
temperatures and transformation parameters, experiments were also conducted to investigate the

“HIGH STRENGTH, HIGH TOUGHNESS…” PROGRESS REPORT – YEAR 1 6
temperature path parameters required to most adequately obtain Bainitic microstructures. These
Bainitic microstructures are expected to be most difficult to obtain in the final forgings, and as
such were allotted significant experimental resources. Multiple studies were conducted with the
aid of undergraduate students. The first of these studies involved an investigation into the
Bainitic transformation as a function of quenching temperature, determining the ferritic phase
percentage and quantifying it as the complement of the possible Bainitic phase percentage. The
second set of experiments was designed to determine a cooling method capable of cooling the
forging fast enough to avoid the Ferritic phase transformation, yet slow enough to be stopped in
the bainitic region and held there long enough to complete the Bainitic phase transformation.
These experiments utilized hot water vaporization cooling to controllably bring the sample to the
expected Bainitic formation temperature range (550-450⁰C or 1032-842⁰F), and attempt to
keep the temperature within the Bainitic formation temperature regime for sufficient time for the
transformation to occur.

“HIGH STRENGTH, HIGH TOUGHNESS…” PROGRESS REPORT – YEAR 1 7
Section II: Timeline and Gannt Charts
Figures 1 and 2 below show the Gannt charts for the project schedule at 2 points in the
life of the project. Figure 1 shows a comparison of the original project schedule with the project
schedule as of March 6th, 2017, weeks in advance of the first FIERF partners presentation. Figure
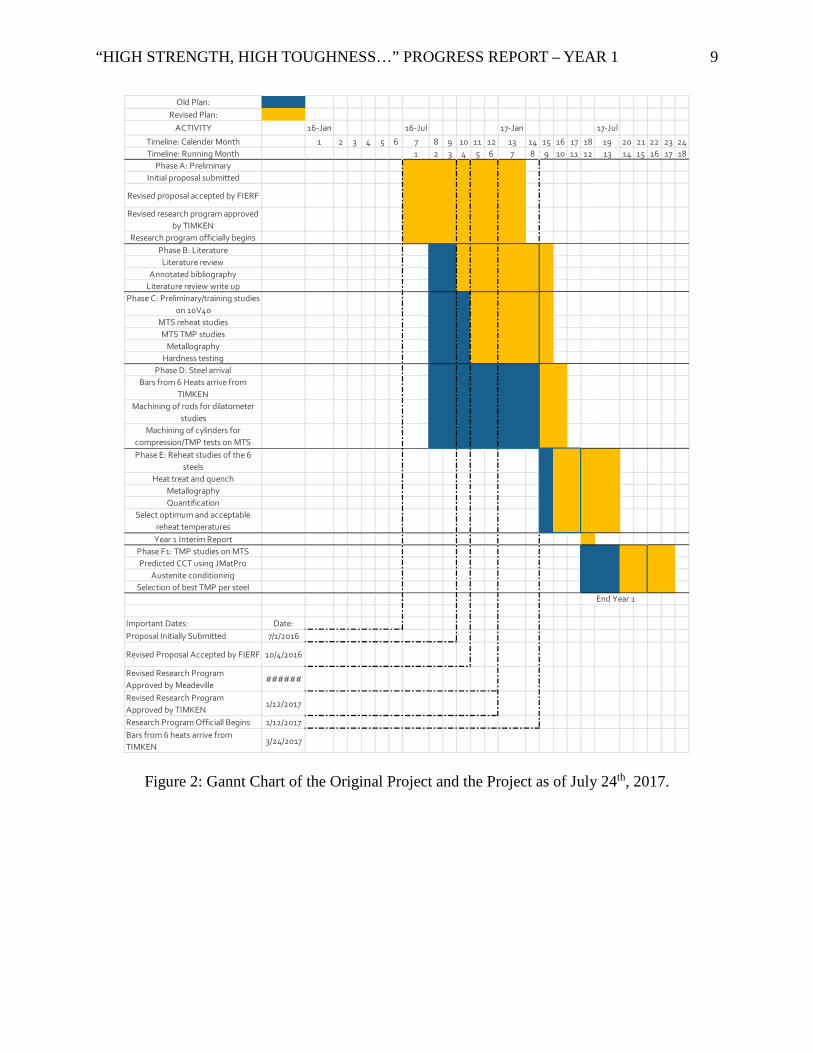
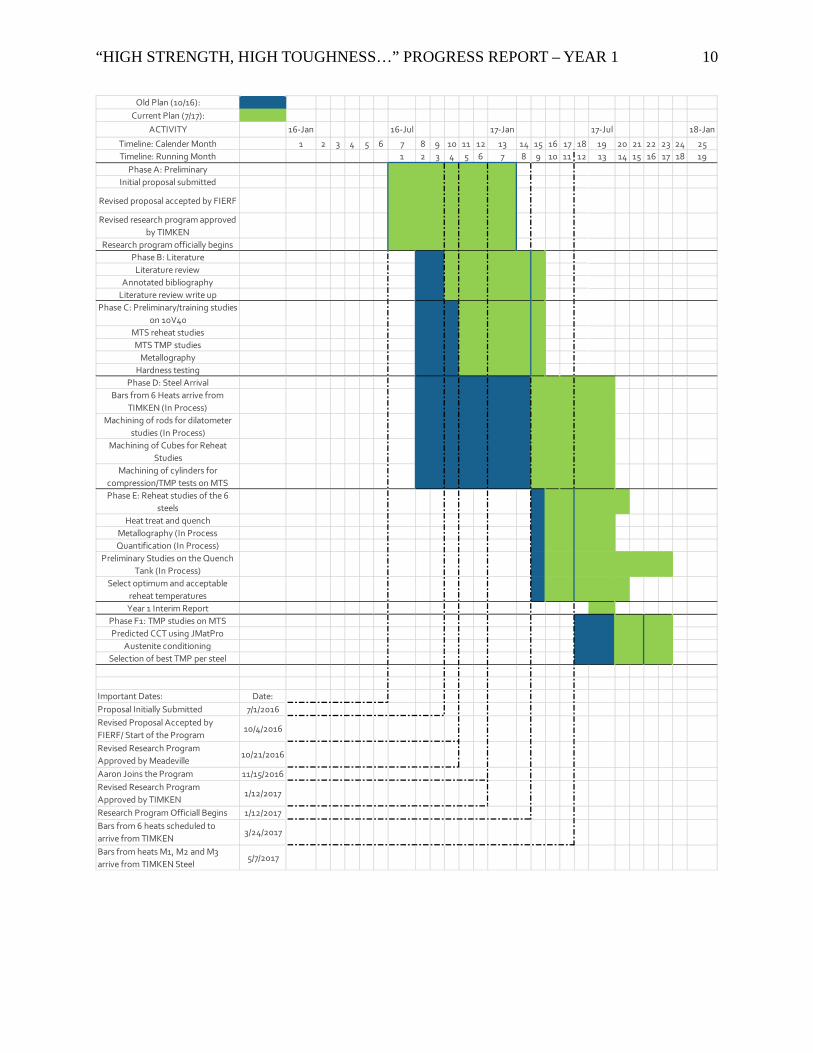
2 shows a comparison of the original project schedule with the current project schedule as of July
24th, 2017.
As can be seen, Figure 1 shows several differences between the original project and the
project as of March in 2016. At this point in time, the project had experienced 2 major delays;
The first of these delays came when the aforementioned graduate student left the group, leaving
the project without a primary student to further the status of the project. The progress of the
project resumed when Aaron Stein joined the BAMPRI group in October of 2016. As such, this
setback delayed the completion of the literature and preliminary studies phases of the project.
The second major delay of the project came in the acquisition of the laboratory heats for the
testing. After discussions with three possible ingot supplying vendors, it was decided that
TIMKENSTEEL Steel company would supply the laboratory-melted ingots. Initial estimations
for the cost of the supply of the steels were much less than the lowest provided quotes. As such,
BAMPRI and MFC engaged in discussion with TIMKENSTEEL Steel Company, which resulted
in the provision of the aforementioned 6 laboratory ingots, in exchange for the BAMPRI testing
of 2 commercially available TIMKENSTEEL steels T1 and T2. These discussions, as expected,
took time, and thus the receival of the steels was delayed. None-the-less, those involved in the
project are grateful for the charitable contributions provided by TIMKENSTEEL Steel Company,
without which, the full research of the steels in question would have been far too costly.

“HIGH STRENGTH, HIGH TOUGHNESS…” PROGRESS REPORT – YEAR 1 8
Similarly, Figure 2 shows differences in the original plan and the plan as of July 24th, 2017. The
delays from Figure 1 are also evident in the timeline shown in Figure 2, but also present are the
effects of 2 other changes from the original plan. The first of these changes is shown in the
extension of the machining and testing phases. For convenience purposes, steels T1 and T2 are
expected to be received by the end of 2017, and will then undergo machining and testing. A
second change occurs in the introduction of a new phase, in which the bainitic quench tank,
which will be used in a later phase of the program at MFC, undergoes preliminary design and
validity testing.
Figure 1: Gannt Chart of the Original Project and the Project as of March 6th, 2017.
“HIGH STRENGTH, HIGH TOUGHNESS…” PROGRESS REPORT – YEAR 1 9
Figure 2: Gannt Chart of the Original Project and the Project as of July 24th, 2017.
Old Plan:Revised Plan:
ACTIVITY 16-Jan 16-Jul 17-Jan 17-Jul
Timeline: Calender Month 1 2 3 4 5 6 7 8 9 10 11 12 13 14 15 16 17 18 19 20 21 22 23 24Timeline: Running Month 1 2 3 4 5 6 7 8 9 10 11 12 13 14 15 16 17 18
Phase A: PreliminaryInitial proposal submitted
Revised proposal accepted by FIERF
Revised research program approved by TIMKEN
Research program officially beginsPhase B: LiteratureLiterature review
Annotated bibliographyLiterature review write up
Phase C: Preliminary/training studies on 10V40
MTS reheat studiesMTS TMP studies
MetallographyHardness testing
Phase D: Steel arrivalBars from 6 Heats arrive from
TIMKENMachining of rods for dilatometer
studiesMachining of cylinders for
compression/TMP tests on MTSPhase E: Reheat studies of the 6
steelsHeat treat and quench
MetallographyQuantification
Select optimum and acceptable reheat temperatures
Year 1 Interim ReportPhase F1: TMP studies on MTSPredicted CCT using JMatPro
Austenite conditioningSelection of best TMP per steel
Important Dates: Date:Proposal Initially Submitted 7/1/2016
Revised Proposal Accepted by FIERF 10/4/2016
Revised Research Program Approved by Meadeville
######
Revised Research Program Approved by TIMKEN
1/12/2017
Research Program Officiall Begins 1/12/2017Bars from 6 heats arrive from TIMKEN
3/24/2017
End Year 1
“HIGH STRENGTH, HIGH TOUGHNESS…” PROGRESS REPORT – YEAR 1 10
Old Plan (10/16):Current Plan (7/17):
ACTIVITY 16-Jan 16-Jul 17-Jan 17-Jul 18-Jan
Timeline: Calender Month 1 2 3 4 5 6 7 8 9 10 11 12 13 14 15 16 17 18 19 20 21 22 23 24 25Timeline: Running Month 1 2 3 4 5 6 7 8 9 10 11 12 13 14 15 16 17 18 19
Phase A: PreliminaryInitial proposal submitted
Revised proposal accepted by FIERF
Revised research program approved by TIMKEN
Research program officially beginsPhase B: LiteratureLiterature review
Annotated bibliographyLiterature review write up
Phase C: Preliminary/training studies on 10V40
MTS reheat studiesMTS TMP studies
MetallographyHardness testing
Phase D: Steel ArrivalBars from 6 Heats arrive from
TIMKEN (In Process)Machining of rods for dilatometer
studies (In Process)Machining of Cubes for Reheat
StudiesMachining of cylinders for
compression/TMP tests on MTSPhase E: Reheat studies of the 6
steelsHeat treat and quench
Metallography (In ProcessQuantification (In Process)
Preliminary Studies on the Quench Tank (In Process)
Select optimum and acceptable reheat temperatures
Year 1 Interim ReportPhase F1: TMP studies on MTSPredicted CCT using JMatPro
Austenite conditioningSelection of best TMP per steel
Important Dates: Date:Proposal Initially Submitted 7/1/2016Revised Proposal Accepted by FIERF/ Start of the Program
10/4/2016
Revised Research Program Approved by Meadeville
10/21/2016
Aaron Joins the Program 11/15/2016Revised Research Program Approved by TIMKEN
1/12/2017
Research Program Officiall Begins 1/12/2017Bars from 6 heats scheduled to arrive from TIMKEN
3/24/2017
Bars from heats M1, M2 and M3 arrive from TIMKEN Steel
5/7/2017
“HIGH STRENGTH, HIGH TOUGHNESS…” PROGRESS REPORT – YEAR 1 11
Section III: Literature Search and Review
As can be seen in both figure 1 and figure 2, the first item on the agenda of the project is
the researching of relevant literature and previous research, and the subsequent presentation of
this research in an extensive literature review. This review is included in Appendix B. To create
the literature review, a general procedure was used, which is presented in the proceeding
paragraphs.
To begin, the necessary knowledge of the project was divided into 6 primary categories.
The first of these categories would include introductory material, involving the history and
economic comparisons of the steels of the project and the other steels available for the purposes.
A second category is included in the various strengthening mechanisms which were expected in
the steels of the experiment. The third category was decided to be a summation of the impacts of
the elements in the composition when they are present within steel. Categories 2 and 3 were
ordered as such to serve as supporting understanding for categories 4 through 6. Categories 4 and
5 include the impact of austenite conditioning and the cooling and transformation of the steels on
the properties of the steel. Finally, the scope of category 6 includes the impact of the previous
categories in the current scope.
Upon completion of categorization, the information for each category was found first
within academic journal articles upon which the Recrystallization Controlled Forging process
was based. These papers were largely about the Recrystallization Controlled Rolling process, and
the impact of the V-Ti-N steel system upon this process. Additional papers were selected using
various search engines, such as Google Scholar and services provided by the University of
Pittsburgh, to research topics in further depth for the project.

“HIGH STRENGTH, HIGH TOUGHNESS…” PROGRESS REPORT – YEAR 1 12
Section IV: Preliminary/Training Studies on 10V40
During completion of the literature segment of the project, the members of the BAMPRI
group at the University of Pittsburgh were provided with samples of 10V40 hot rolled stock for
preliminary microstructural evaluation and testing purposes. These samples were used for the
purpose of preliminary studies, and for training for the later parts of the project. Among these
studies were reheat studies and metallography, for the purpose of gathering information to better
plan for the experimentations to come later in the project’s lifespan. These experiments are
contained within Appendix C and D respectively, detailing the design and results of an
experiment designed to determine the grain coarsening temperature of the 10V40 steel, and
another experiment designed to determine the heat up time of a small sample of steel to a desired
temperature when cold charged into a preheated furnace. The findings of these studies were
utilized in the design of the reheating experiments which would occur later in the experiment.
Finally, JMATPro simulation software was used to fully analyze the predicted tendencies of the
steel, as in Appendix E.
The training which had occurred during this phase of the project is detailed within
Appendix F. Chief among the trainings which were undertaken was the training on the BAMPRI
group’s MTS machine. These trainings involved both instructions on the programming and use
of the mechanical aspects of the frame, which involves controlling the load path and the proper
syncing of the mechanical actions with the thermal actions, and additionally the temperature
aspects of the operation, which includes the programming of the thermal path, as well as the
manual operation of the accelerated cooling valves and quenching process. Other important
training operations which occurred during this phase involved hardness testing (both macro-

“HIGH STRENGTH, HIGH TOUGHNESS…” PROGRESS REPORT – YEAR 1 13
hardness and nano-hardness), metallographic etching (both nital and picric), and metallographic
microscopy (both optical microscopy and scanning electron microscopy).
“HIGH STRENGTH, HIGH TOUGHNESS…” PROGRESS REPORT – YEAR 1 14
Section V: Steel Arrival and Machining
Having completed the literature review, design of the steels, and the preliminary studies
for the project, the next step in the plan was the acquisition of the steels, and the deciding of a
supplier for the steels for the experiment.
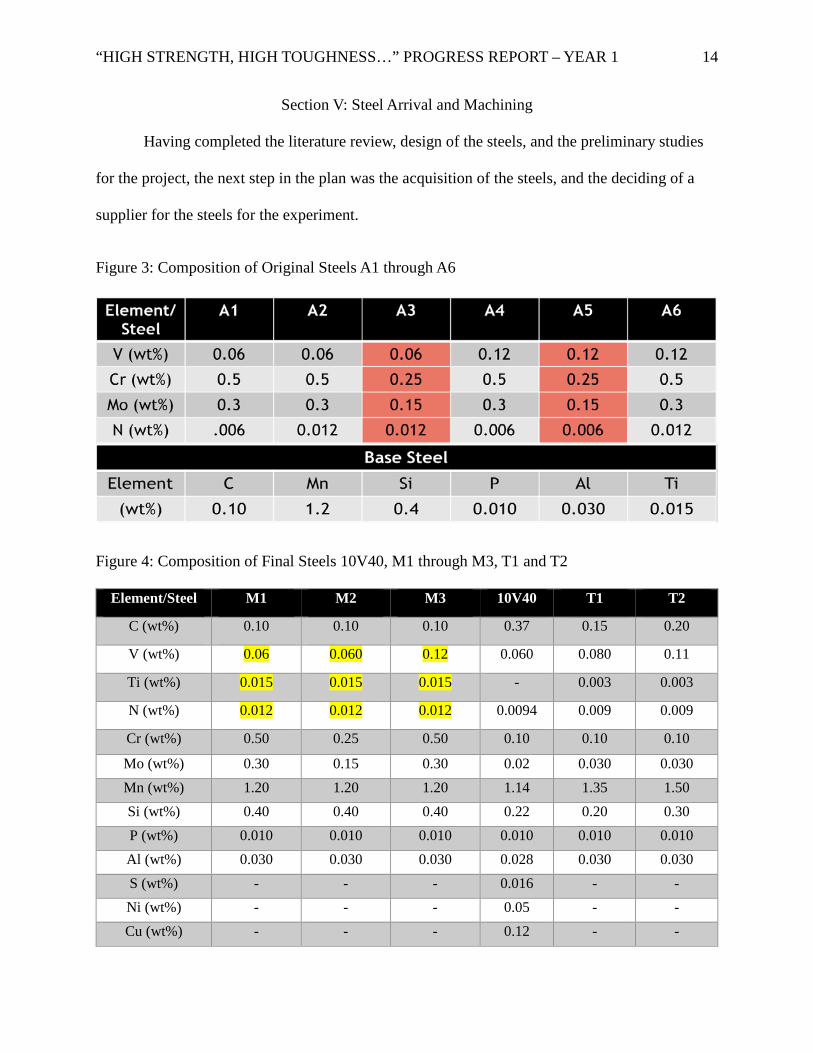
Figure 3: Composition of Original Steels A1 through A6
Figure 4: Composition of Final Steels 10V40, M1 through M3, T1 and T2
Element/Steel M1 M2 M3 10V40 T1 T2
C (wt%) 0.10 0.10 0.10 0.37 0.15 0.20
V (wt%) 0.06 0.060 0.12 0.060 0.080 0.11
Ti (wt%) 0.015 0.015 0.015 - 0.003 0.003
N (wt%) 0.012 0.012 0.012 0.0094 0.009 0.009
Cr (wt%) 0.50 0.25 0.50 0.10 0.10 0.10
Mo (wt%) 0.30 0.15 0.30 0.02 0.030 0.030 Mn (wt%) 1.20 1.20 1.20 1.14 1.35 1.50 Si (wt%) 0.40 0.40 0.40 0.22 0.20 0.30 P (wt%) 0.010 0.010 0.010 0.010 0.010 0.010 Al (wt%) 0.030 0.030 0.030 0.028 0.030 0.030 S (wt%) - - - 0.016 - - Ni (wt%) - - - 0.05 - - Cu (wt%) - - - 0.12 - -
“HIGH STRENGTH, HIGH TOUGHNESS…” PROGRESS REPORT – YEAR 1 15
Above in figure 3 is shown the original steels A1 through A6, and within figure 4 is
shown the final selected steels 10V40, M1 through M3, T1 and T2. As can be seen from an
analysis of figure 3 and figure 4, steels M1, M2 and M3 are identical to the original steels A2, A3
and A6 respectively. After extensive research of possible suppliers in the market for the steels
needed for the project, TIMKENSTEEL Steel Company offered help to further the project, due
to their interest in the project. TIMKENSTEEL Steel Company graciously agreed to supply the
BAMPRI research group with 6 laboratory steel ingots, provided that the members of BAMPRI
also test 2 other steels which were provided, T1 and T2. As only 6 heats could be provided for
testing, it was decided that the high Nitrogen level heats M2, M3 and M6, would each receive 2
ingots, to provide adequate specimens for a full analysis of the steels. The selection of the higher
N level was due to the prevalence of EAF steels in the forging industry. Much evidence was
present in the literature which showed that the higher Nitrogen steels in the Ti-V-N steel system,
showed superior property combinations. Thus, it was that the lower Nitrogen level steels, M1,
M4 and M5, were discarded in favor of the remaining steels. It should be noted that the
previously labeled M2 was re-designated M1, M3 as M2 and M6 as M3. The designations M1,
M2 and M3 will be used throughout the remainder of this study.
The process took much time, and thus it was that the steels for the experiment were
received in May of 2017. The remaining steels, T1 and T2, are expected to be received during
December of 2017 ot January 2018, and will undergo machining and testing shortly afterwards.
Upon receiving the steels, M1, M2 and M3, 1” x 1” x 0.5” samples of the steels were machined
from the heats, and these samples were sent to TIMKENSTEEL Steel Company, which offered
to complete a certification of the compositions, the results of which are shown within Appendix
G.

“HIGH STRENGTH, HIGH TOUGHNESS…” PROGRESS REPORT – YEAR 1 16
Having completed the compositional analysis of the steels, machining of the steels was
undertaken. Two mults from each composition of M1, M2 and M3 were sectioned for machining,
and a single mult of 10V40 composition. From these mults were cut 24 specimens each 0.5” x
0.5” x 0.5” austenite grain size reheat cubes, and 20 specimens each 12 mm diameter by 18 mm
in length MTS compression cylinders with inset ends and thermocouple insert holes. The
machining of these steels was completed in early July of 2017, and the samples were prepared
for the experiments to follow.
“HIGH STRENGTH, HIGH TOUGHNESS…” PROGRESS REPORT – YEAR 1 17
Section VI: Reheat Studies of the 6 Steels and further studies
Having completed the machining of the steels, the next step was to begin the reheat
experiments to determine the grain coarsening temperature for each of the steels. The outline and
results of these experiments are presented in Appendix H. While the experiments were
successfully conducted for each of the steels 10V40, M1, M2 and M3, it should be noted the
extent to which the etching of the steels was explored. Limited results were garnered with
accepted methods, and as such many etching experiments were conducted in order to expand on
this accepted method. With these experiments conducted, different successful methods for
etching the steels for prior austenite grain revealing were selected, and determination of the
investigated parameters or the reheat experiments could be conducted.
Having successfully etched steels 10V40, M1, M2 and M3, reheat temperatures 950°C
through 1250°C were tested, and the coarsening parameters relating to these samples were
determined. In brief summary, it was determined that the grain coarsening of steel M3 was
1250°C, the grain coarsening temperature of steels M1 and M2 was 1200°C, and steel 10V40
was determined to have a grain coarsening temperature of 1100°C.
Finally, upon completion and analyzation of the reheating temperature experiments, the
information gleaned was used to design the thermomechanical process experiments. The
information gathered from these experiments will be instrumental in determining the proper
temperatures at which to perform the forging passes for the final experiments. These experiments
represented the next item on the agenda, along with the finalization of the preliminary studies
concerning the quench tank, the current results of which are shown within Appendix I, J and K.
“HIGH STRENGTH, HIGH TOUGHNESS…” PROGRESS REPORT – YEAR 1 18
Section VI: Thermomechanical Processing Experiments
Using the suggested reheat temperatures determined from the reheat experiments, the
effects of different forging temperatures on the recrystallization behavior of the steels was
investigated in the thermomechanical processing experiments. During these experiments, the
samples were heated to the reheat temperature suggested in the reheat experiments, held for a 1-
minute hold, then cooled down to the tested deformation temperature, where it is compressed
50% and water quenched to room temperature. Using the etching methods determined in the
reheating experiments, the austenitic grain structure was revealed, and the extent of
recrystallization of the austenite determined.
A brief summation of results determines that steels M1 and M3 showed a T95 temperature
at 850°C, while steel M2 shows a recrystallization temperature of 800°C. Additionally, analysis
of the post quench microstructures reveal that the Austenitic grain size after the forging pass is
approximately 10µm, which shows sufficient grain refinement to achieve the scope and objective
of the overall project. Finally, the T5 temperature was determined to be approximately 775°C for
steels M1 and M3, and 750°C for steel M2.
Having completed the thermomechanical processing experiments, a forging temperature
was required to be selected for further experimentation of the steels for the project. To this
purpose a temperature of 900°C was selected for the deformations for the transformation
experiments. This temperature is high enough to avoid nonrecrystallization of austenite, yet low
enough to avoid extensive grain coarsening in the microstructure.
The results of these experiments are contained within Appendix L. It should be noted
that the reheating and forging temperatures used are compatible with the normal practice at MFC
for 10V40.
“HIGH STRENGTH, HIGH TOUGHNESS…” PROGRESS REPORT – YEAR 1 19
Section VII: Transformation Experiments
Having collected the necessary parameters for the reheating and forging of the steel, the
transformation experiments commenced. During these experiments, samples of the steels M1,
M2 and M3 were reheated at the appropriate temperatures, forged at the temperatures determined
in the previous experiments, and then finally cooled with various methods to determine the
phases and the hardness of the final sample. These experiments were conducted using the
computer controlled MTS system described above.
The purpose of these experiments was to find the appropriate cooling rates and WET
(water- or quench-end temperatures) interruption temperatures to obtain certain microstructures
and hardness values. First, a Ferrite and Pearlite microstructure was obtained through an air cool
to room temperature. This sample had moderate hardness values. A Martensitic microstructure
was obtained through a water quench to room temperature, immediately following the forging of
the sample. As expected, these samples had very high hardness values. Finally, a Bainitic
microstructure was obtained using an accelerated cooling into the bainite range to a temperature
above the Ms temperature, yet below the Bs temperature. These samples had moderate to high
hardness values.
The parameters which are set forth from the analysis of these experiments will be used to
determine the processing path of the final wheel hub forgings which will be conducted at MFC.
These parameters will specify how fast the samples will need to be cooled, and with how long
the approximately isothermal holding times must be in order to obtain the desired
microstructures and strengths of the specified levels.
The results of these experiments are included in Appendix M.

“HIGH STRENGTH, HIGH TOUGHNESS…” PROGRESS REPORT – YEAR 1 20
Section VIII: Bainitic Transformation Study
While the Ferrite/Pearlite and Martensite microstructures could be obtained with
common, simple cooling procedures (air cool to room temperature and water quench to room
temperature, respectively), the Bainite microstructures require interrupted cooling techniques.
Thus, a study was designed to determine the ideal stopping temperature and holding time to form
a sufficient quantity of Bainite. The results of this study can be found within Appendix N, and
were taken into consideration when the Bainite transformation techniques were designed for the
transformation experiments.
The results of this experiment roughly confirmed the estimations provided through the
aforementioned JMATPro simulations. A transformation temperature of 500°C for the Bainitic
transformations was selected after considering the JMATPro simulations, and the results of the
Bainitic transformation study.
“HIGH STRENGTH, HIGH TOUGHNESS…” PROGRESS REPORT – YEAR 1 21
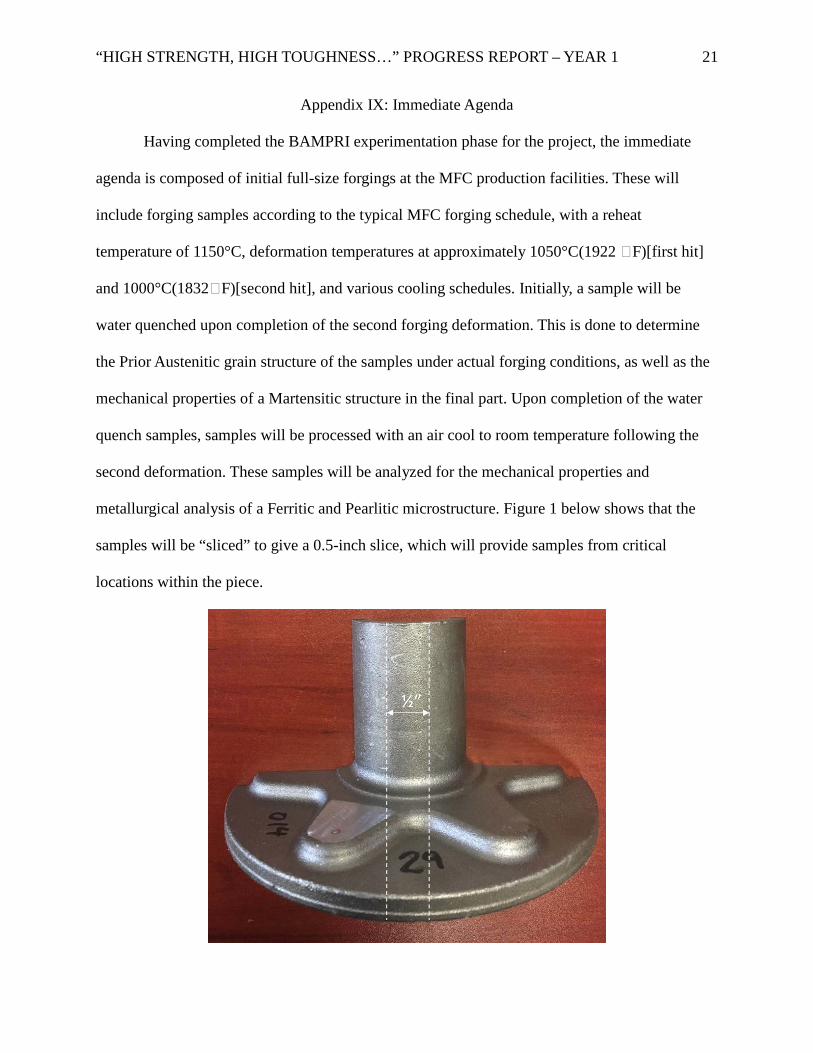
Appendix IX: Immediate Agenda
Having completed the BAMPRI experimentation phase for the project, the immediate
agenda is composed of initial full-size forgings at the MFC production facilities. These will
include forging samples according to the typical MFC forging schedule, with a reheat
temperature of 1150°C, deformation temperatures at approximately 1050°C(1922 ⁰F)[first hit]
and 1000°C(1832⁰F)[second hit], and various cooling schedules. Initially, a sample will be
water quenched upon completion of the second forging deformation. This is done to determine
the Prior Austenitic grain structure of the samples under actual forging conditions, as well as the
mechanical properties of a Martensitic structure in the final part. Upon completion of the water
quench samples, samples will be processed with an air cool to room temperature following the
second deformation. These samples will be analyzed for the mechanical properties and
metallurgical analysis of a Ferritic and Pearlitic microstructure. Figure 1 below shows that the
samples will be “sliced” to give a 0.5-inch slice, which will provide samples from critical
locations within the piece.

“HIGH STRENGTH, HIGH TOUGHNESS…” PROGRESS REPORT – YEAR 1 22
Figure 1: Slicing of Forging Piece for Mechanical Testing and Metallurgical Samples
“HIGH STRENGTH, HIGH TOUGHNESS…” PROGRESS REPORT – YEAR 1 23
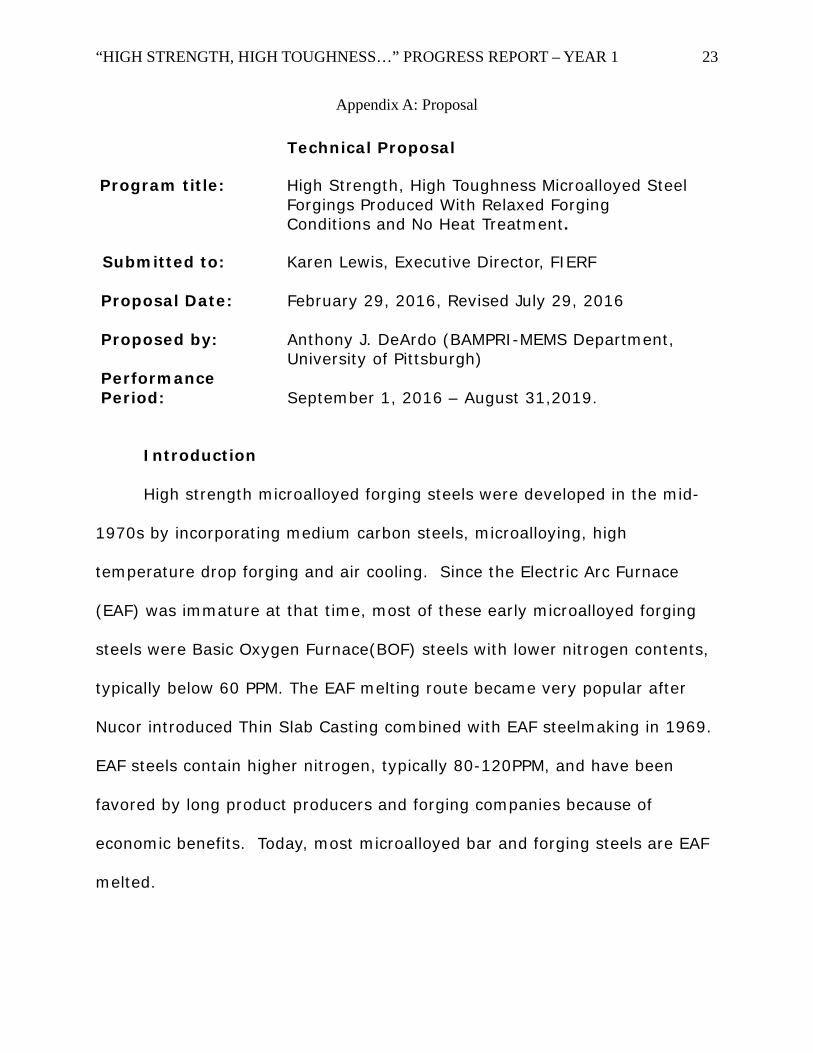
Appendix A: Proposal
Technical Proposal
Program title: High Strength, High Toughness Microalloyed Steel Forgings Produced With Relaxed Forging Conditions and No Heat Treatment.
Submitted to: Karen Lewis, Executive Director, FIERF Proposal Date: February 29, 2016, Revised July 29, 2016
Proposed by: Anthony J. DeArdo (BAMPRI-MEMS Department,
University of Pittsburgh) Performance Period: September 1, 2016 – August 31,2019.
Introduction
High strength microalloyed forging steels were developed in the mid-
1970s by incorporating medium carbon steels, microalloying, high
temperature drop forging and air cooling. Since the Electric Arc Furnace
(EAF) was immature at that time, most of these early microalloyed forging
steels were Basic Oxygen Furnace(BOF) steels with lower nitrogen contents,
typically below 60 PPM. The EAF melting route became very popular after
Nucor introduced Thin Slab Casting combined with EAF steelmaking in 1969.
EAF steels contain higher nitrogen, typically 80-120PPM, and have been
favored by long product producers and forging companies because of
economic benefits. Today, most microalloyed bar and forging steels are EAF
melted.

“HIGH STRENGTH, HIGH TOUGHNESS…” PROGRESS REPORT – YEAR 1 24
These precipitation hardened, microalloyed, pearlite-ferrite steels did
have high strength and good resistance to high cycle fatigue, but because of
large prior austenite grain sizes and the large volume fractions of pearlite,
these steels exhibited only average toughness. Later work attempted to
improve the toughness by adding low temperature forging to replicate the
success common in controlled rolled plate steels, where the plates are finish
hot rolled with substantial deformation below the recrystallization-stop
temperature, often below 1562°F(850°C) to 1652°F(900°C). This concept
was not accepted by the forging industry because of the excessive die wear
expected under low temperature forging conditions.
In the research proposed below, two accepted technologies will be
used to produce high strength forgings by incorporating high temperature
forging reductions followed by interrupted accelerated cooling(IAC) and/or
interrupted direct quenching(IDQ). It is considered that one grade of steel
could conceivably meet yield strength levels ranging from 70 KSi (490 MPa,
with Pearlite-Ferrite microstructures with high transformation temperatures)
to 120 KSi (840 MPa, with Bainitic microstructures and low transformation
temperatures). These strength ranges would be controlled by interrupted
accelerated cooling or interrupted direct quenching following the high
temperature hot forging operation.
The experimental steels proposed to be used in this study are not the
10V40 microalloyed steels typically used in forgings. In this current study, a

“HIGH STRENGTH, HIGH TOUGHNESS…” PROGRESS REPORT – YEAR 1 25
low carbon content will be used, since it is well-known that ferrite, bainite
and martensite formed in low carbon steels can be very beneficial to both
strength and toughness. On the other hand, steels with 0.3 or 0.4 wt. % C
would be very brittle if the final microstructure contained substantial
amounts of high carbon bainite or martensite; therefore, they must be used
mainly in the pearlite-ferrite microstructure to achieve reasonable
properties, albeit at lower strength levels.
It is imagined that three families of experimental steels may
eventually result from this research: (i) a standard version with excellent
properties, (ii) a higher carbon version when induction hardening would be
beneficial, and (iii) a third version containing higher sulfur when
machinability is important.
One of the foundations of good toughness is achieving a fine and
uniform prior austenite grain size (PAGS) from the forging operation prior to
cooling and transformation. In these proposed studies, the V-Ti-N system
will be used for austenite conditioning, the so-called Recrystallization
Controlled Forging (RCF) practice. It is proposed to use the Ti and N
additions to form stable TiN that will anchor the PAGB through multi-pass
forging deformations resulting in a uniform grain size of approximately 20-
30 microns. The Ti/N ratio will be hypo-stoichiometric resulting in two
benefits: (i) the high temperature coarsening of the TiN particles in hypo-
stoichiometric steels is known to be low, thereby retaining the pinning

“HIGH STRENGTH, HIGH TOUGHNESS…” PROGRESS REPORT – YEAR 1 26
potential of the TiN through multiple passes and over longer times resulting
in a fine and uniform austenite grain size, and (ii) the fine TiN can keep the
grain coarsening during multi-pass hot deformation to a minimum.
Once the PAGS platform has been achieved after billet reheating and multi-
pass forging, finishing at approximately 1832°F(1000°C), the next stage of
processing is to achieve the desired strength range using IAC or IDQ to
obtain the required microstructure. In the proposed steels 0.1C-1.8Mn-0.3Si
– W Cr – X Mo – Y V - 0.015Ti – ZN steel, it is expected that yield strengths
ranging from 70-120KSi(490-840MPa) and UTS ranging from 87-150
KSi(610-1050MPa) UTS can be achieved by varying the cooling conditions
without subsequent heat treatment. The IAC/IDQ process involves rapid
cooling or quenching from the finish forging temperature to the
transformation temperature required for the target strength, followed
immediately by air cooling to RT. For example, the 70 KSi(483 MPa) UTS
grade might be cooled to the Ar3 -122°F(Ar3-50°C) or 1332°F(790°C) while
the 150 KSi(1035 MPa) grade would be cooled to the B50 temperature near
960°F(515°C).
The IAC/IDQ process was initially developed in response to the Oil
Embargo of 1973-74, and the subsequent CAFÉ Standards mandated by
Congress through the National Highway Traffic and Safety Administration in
1975. This technology has been in use since the mid-1980s; it was
developed to help: (a) the linepipe industry increase the strength of the

“HIGH STRENGTH, HIGH TOUGHNESS…” PROGRESS REPORT – YEAR 1 27
plates for pipes, thereby allowing higher driving pressures and flow rates of
oil and gas, and (b) the automotive industry by increasing the strength
thereby permitting down gauging of the sheet and strip used in the body-in-
white for better fuel economy while maintaining high passenger safety and
lowering CO2 emissions. The IAC/IDQ process is a two- step technology that
allows the as-rolled or forged material to first be immediately, rapidly cooled
to a pre-determined temperature (often referred to as the water-end-
temperature or WET), as defined by the CCT diagram and the desired
strength level. This is followed by an immediate air cool to room
temperature, leading to the desired final microstructure. The IAC/IDQ
process has been very thoroughly studied in a range of strip and plate
steels. There have been dozens, if not hundreds, of technical papers written
on this subject, and at least three international conferences have been held
on this topic.
In these current experiments, attention will be paid to the carbon
content as well as the Cr and Mo levels, to help define a universal high
strength, high toughness forging steel. Steels with higher levels of carbon
and /or sulfur can be included if induction hardening and/or machinability
are needed. The lower N level heats are intended to replicate BOF steels,
while the higher N heats the EAF steels.
The successful completion of this program will result in a new
composition and process route for making high strength, high toughness
“HIGH STRENGTH, HIGH TOUGHNESS…” PROGRESS REPORT – YEAR 1 28
forgings with minimum die wear, limited distortion, and no heat treatment in
section sizes to 4 inches(100mm) thick.
Experimental Procedure
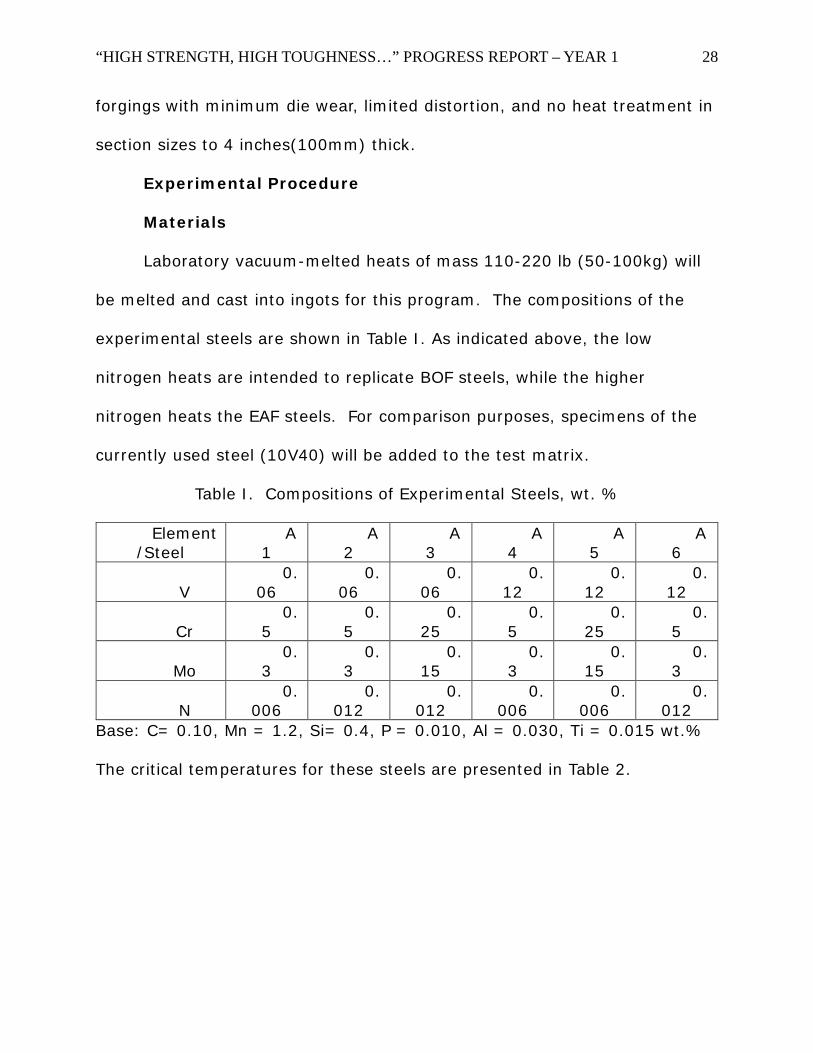
Materials
Laboratory vacuum-melted heats of mass 110-220 lb (50-100kg) will
be melted and cast into ingots for this program. The compositions of the
experimental steels are shown in Table I. As indicated above, the low
nitrogen heats are intended to replicate BOF steels, while the higher
nitrogen heats the EAF steels. For comparison purposes, specimens of the
currently used steel (10V40) will be added to the test matrix.
Table I. Compositions of Experimental Steels, wt. %
Element/Steel
A1
A2
A3
A4
A5
A6
V 0.
06 0.
06 0.
06 0.
12 0.
12 0.
12
Cr 0.
5 0.
5 0.
25 0.
5 0.
25 0.
5
Mo 0.
3 0.
3 0.
15 0.
3 0.
15 0.
3
N 0.
006 0.
012 0.
012 0.
006 0.
006 0.
012 Base: C= 0.10, Mn = 1.2, Si= 0.4, P = 0.010, Al = 0.030, Ti = 0.015 wt.%
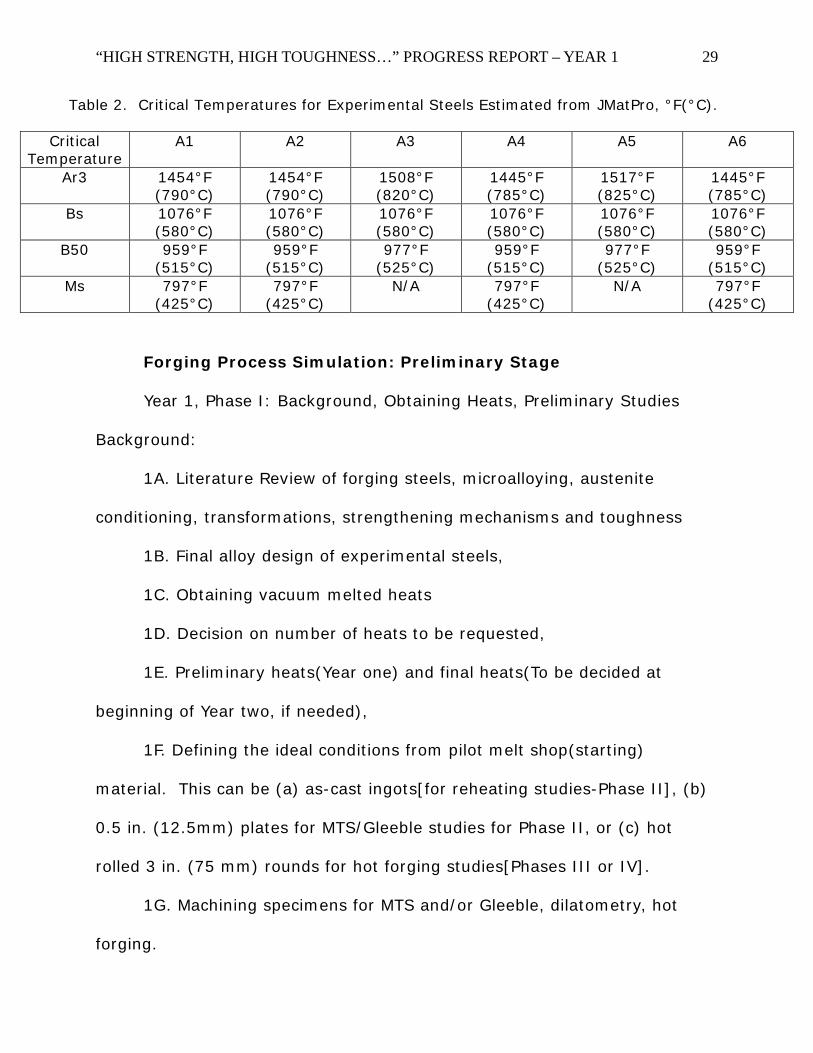
The critical temperatures for these steels are presented in Table 2.
“HIGH STRENGTH, HIGH TOUGHNESS…” PROGRESS REPORT – YEAR 1 29
Table 2. Critical Temperatures for Experimental Steels Estimated from JMatPro, °F(°C).
Critical Temperature
A1 A2 A3 A4 A5 A6
Ar3 1454°F (790°C)
1454°F (790°C)
1508°F (820°C)
1445°F (785°C)
1517°F (825°C)
1445°F (785°C)
Bs 1076°F (580°C)
1076°F (580°C)
1076°F (580°C)
1076°F (580°C)
1076°F (580°C)
1076°F (580°C)
B50 959°F (515°C)
959°F (515°C)
977°F (525°C)
959°F (515°C)
977°F (525°C)
959°F (515°C)
Ms 797°F (425°C)
797°F (425°C)
N/A 797°F (425°C)
N/A 797°F (425°C)
Forging Process Simulation: Preliminary Stage
Year 1, Phase I: Background, Obtaining Heats, Preliminary Studies
Background:
1A. Literature Review of forging steels, microalloying, austenite
conditioning, transformations, strengthening mechanisms and toughness
1B. Final alloy design of experimental steels,
1C. Obtaining vacuum melted heats
1D. Decision on number of heats to be requested,
1E. Preliminary heats(Year one) and final heats(To be decided at
beginning of Year two, if needed),
1F. Defining the ideal conditions from pilot melt shop(starting)
material. This can be (a) as-cast ingots[for reheating studies-Phase II], (b)
0.5 in. (12.5mm) plates for MTS/Gleeble studies for Phase II, or (c) hot
rolled 3 in. (75 mm) rounds for hot forging studies[Phases III or IV].
1G. Machining specimens for MTS and/or Gleeble, dilatometry, hot
forging.
“HIGH STRENGTH, HIGH TOUGHNESS…” PROGRESS REPORT – YEAR 1 30
Year 1, Phase II: MTS/Gleeble TMP and cooling studies
2A. Grain Coarsening Studies of the PAGS in the new steels using input
from forging colleagues (centered around the 2100-2200°F range typically
used). Starting material is as-cast ingots.
2B. Determine critical austenite temperatures for grain coarsening,
recrystallization stop temperature, Ar3, Bs and Ms. These data will be
generated in the MTS/Gleeble simulation studies, and will help define the
optimum forging processing window for each steel.
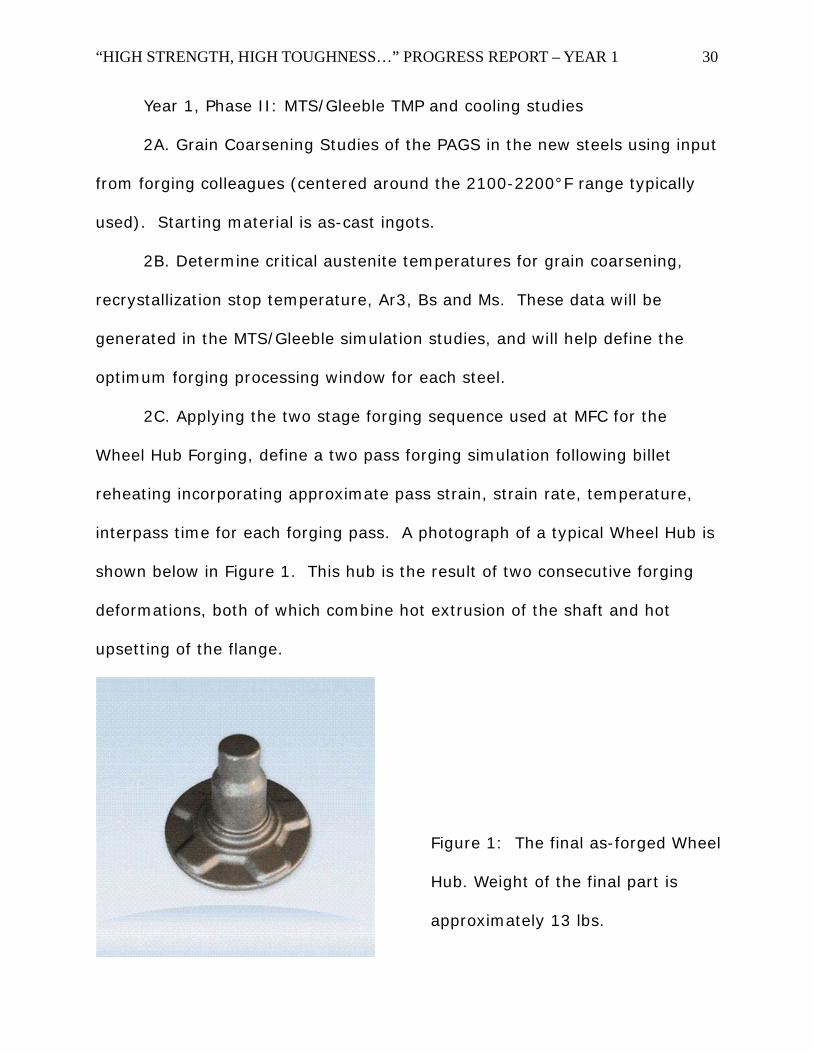
2C. Applying the two stage forging sequence used at MFC for the
Wheel Hub Forging, define a two pass forging simulation following billet
reheating incorporating approximate pass strain, strain rate, temperature,
interpass time for each forging pass. A photograph of a typical Wheel Hub is
shown below in Figure 1. This hub is the result of two consecutive forging
deformations, both of which combine hot extrusion of the shaft and hot
upsetting of the flange.
Figure 1: The final as-forged Wheel
Hub. Weight of the final part is
approximately 13 lbs.
High Strength, High Toughness Micro-Alloyed Steel Forgings Produced with Relaxed Forging Conditions and No Heat Treatment – Progress Report – Year 1, December 2017 31
The PAGS after each stage will be determined for each condition (i.e.,
after reheat, extrusion 1, extrusion 2 plus flange upset). The goal here is to
find the forging processing that will result in a PAGS in the 20-30μm range).
Starting material for the initial hot compression simulation performed on a
MTS or Gleeble machine, will be 0.5 in. (12.5mm) plates rolled from the lab
melted ingots. Earlier studies have found the following parameters to be
typical for effective austenite conditioning: Reheating at 2102°F (1150°C),
followed by forging passes (20% each) at 2012°F (1100°C) + 1922°F
(1050°C) + 1832°F (1000°C), followed by rapid cooling. The exact
deformation sequence used in these current MTS simulations is based on the
actual forging sequence used in the forging of the Wheel Hub at MFC. These
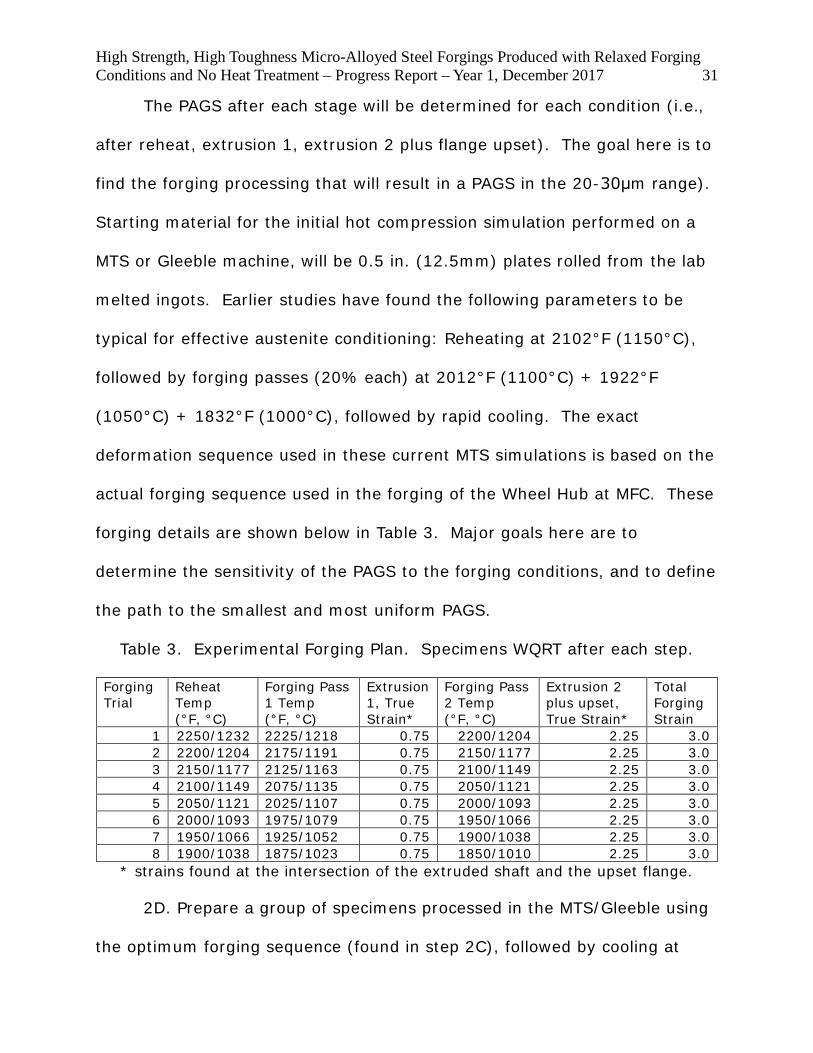
forging details are shown below in Table 3. Major goals here are to
determine the sensitivity of the PAGS to the forging conditions, and to define
the path to the smallest and most uniform PAGS.
Table 3. Experimental Forging Plan. Specimens WQRT after each step.
Forging Trial
Reheat Temp (°F, °C)
Forging Pass 1 Temp (°F, °C)
Extrusion 1, True Strain*
Forging Pass 2 Temp (°F, °C)
Extrusion 2 plus upset, True Strain*
Total Forging Strain
1 2250/1232 2225/1218 0.75 2200/1204 2.25 3.0 2 2200/1204 2175/1191 0.75 2150/1177 2.25 3.0 3 2150/1177 2125/1163 0.75 2100/1149 2.25 3.0 4 2100/1149 2075/1135 0.75 2050/1121 2.25 3.0 5 2050/1121 2025/1107 0.75 2000/1093 2.25 3.0 6 2000/1093 1975/1079 0.75 1950/1066 2.25 3.0 7 1950/1066 1925/1052 0.75 1900/1038 2.25 3.0 8 1900/1038 1875/1023 0.75 1850/1010 2.25 3.0
* strains found at the intersection of the extruded shaft and the upset flange.
2D. Prepare a group of specimens processed in the MTS/Gleeble using
the optimum forging sequence (found in step 2C), followed by cooling at

“HIGH STRENGTH, HIGH TOUGHNESS…” PROGRESS REPORT – YEAR 1 32
different rates to various WET in the MTS. Cooling rates will be varied from
2-30 °C/s and WETs to be varied systematically from 1400-520°F (760-
520°C), all followed by air cooling to RT.
2E. Determine bulk hardness (500 gm VHN) of each condition
(i.e.,steel composition, dT/dt, WET)
2F. Characterization of microstructure for each condition, first by
optical metallography, and for selected conditions by SEM[secondary
electron imaging], SEM-EBSD[ Inverse pole figure, image quality, Kernel
Average Mis-orientation and Stored Energy].
2G. Define optimum processing pathways for each composition that
can be expected to result in UTS values of 70KSi (483 MPa-150 VHN),
100KSi (690MPa -220 VHN) and 150KSI (1035 MPa – 320 VHN). These data
will define the critical cooling path for each desired strength level, e.g.,
cooling path 70: the cooling path needed for ~150 VHN, cooling path
100(for ~220 VHN) and cooling path 150 (for ~320 VHN).
Year 2, Phase III: Initial Shop Floor Forging Trials
3A. Three inch diameter bar stock rolled from the laboratory ingots will
be cut to the 6.5 inch lengths for full scale extrusion/forging trial of the
Wheel Hub. These forgings will be deformed and WQRT to observe the PASG
in the real forging, and also to compare it to the results of the earlier
simulations. Only the most promising composition/forging sequence
conditions will be replicated in the fully processed Wheel Hub forgings to be
“HIGH STRENGTH, HIGH TOUGHNESS…” PROGRESS REPORT – YEAR 1 33
described in Phase IV. The seven compositions and eight forging conditions
will be reduced to perhaps 14 actual forging conditions for full PAGS
analysis. Success will be based on the PAGS as determined after WQRT after
reheating, after the first deformation, and after the second deformation.
The last condition will be considered the most important one, since that
PAGS will be the one subsequently transformed during cooling.
3B. The PAGS will be measured through the use of optical
metallography, which will be performed on the forgings quenched to RT after
reheating and after first and second deformations. Of particular interest is
the border of shaft or stem of the Wheel Hub forging as it enters the flange.
3C. The hardness will be determined at various locations in the final
forged and quenched condition. Vickers hardness at 500 grams will be used.
3D. Based on PAGS in the shank after the second deformation and
WQRT, the four best combinations of composition and forging sequence will
be selected for further study in Phase 4, presented below.
Year 2, Phase IV: Shop Floor Forging Trials
4A. The first stage of this experiment will involve the construction of
the accelerated cooling unit that can be located close to the forging
equipment. This unit will consist of two parts. The first part will be a 55-
gallon drum that will hold the circulating quenching medium (water, oil,
polymer-to be determined based on the subject forging cross section and
mass and the required cooling rate) that will cool the forging from the second
“HIGH STRENGTH, HIGH TOUGHNESS…” PROGRESS REPORT – YEAR 1 34
forging blow (2000°F / 1093°C) to the WET ranging from 1332°F (790°C) to
960°F (515°C). The second stage will be a unit for air cooling the quenched
parts from 1332°F (790°C) or 960°F (515°C) to RT. This could simply be a
means to suspend the forged parts in air after removal from the quench tank
to permit them to uniformly air cool.
4B. Once the controlled cooling system has been fabricated, it must
then be tested to both verify its design and to complete the controlled cooling
portion of the final forging trial. This final trial will include first selecting two
experimental compositions plus the standard 10V40 for the trial. Next, the
reheat temperature and details of the first and second hot extrusions will be
selected. Then, the controlled cooling path to RT will be chosen for each
grade from the second extrusion temperature, based on the results of 3B-3D,
above. The VHN of these forgings will be determined to see if they conform
to what was expected by the experimental design. The VHN data will be
supplemented with metallographic observation. This will be valuable if the
data do not conform to the expected, and likely will suggest the changes or
corrections that should be made. If there is reasonable agreement, then the
controlled cooling system can be deemed successful and the final
experiments can be attempted.
4C. The final forging experiments will consist of selecting the final
compositions, reheat and forging temperatures, and controlled cooling paths
to be used. Complete Wheel Hub forgings will be produced using these
“HIGH STRENGTH, HIGH TOUGHNESS…” PROGRESS REPORT – YEAR 1 35
guidelines. These final forgings will be subjected to mechanical property
evaluation, which will include standard tensile and Charpy V-notch impact
tests. The usual static engineering properties will be determined (YS,
UTS, % UE, %TE, % Red. Area, Upper shelf, FATT). The mechanical property
data will again be supplemented with metallographic observation. This will
be valuable if the data do not conform to the expected, and likely will
suggest the changes or corrections that should be made.
4D. The final mechanical properties of the experimental compositions/
forging sequences/cooling paths will be compared with the standard
properties found after traditional processing of 10V40.
Benefits of this Study
The results of this study will reveal a new series of steels that would
be ideal for the lighter forgings used in the automotive and other forging-
intensive industries. By varying the post-forging cooling rate, one grade can
be processed to satisfy a broad range of properties. UTS levels in the range
of 87-150 KSi(610-1050MPa) can be reasonably expected. These new steel
are ideal for moderate temperature forging, where long die life can be
expected and where distortions leading to costly rework can be avoided.
Finally, this program will support one MS student, who will have a favorable
view of working in the North American Forging Industry.

“HIGH STRENGTH, HIGH TOUGHNESS…” PROGRESS REPORT – YEAR 1 36
Timeline
Timeline to complete the three year program starting in September
2016. The proposed progress is illustrated in the following Gannt Chart.
Task Feb 2017
Aug 2017
Feb 2018
Aug 2018
Feb 2019
Aug 2019
Phase I Obtain Steels (Initial) Preliminary Studies Machine Specimens for dilatometry, MTS/Gleeble TMP Studies
Phase II TMP Studies Metallography Cooling Studies VHN Measurements Interim Report Phase III Preliminary Full forging studies for PAGS on forged and quenched specimens of Wheel Hub
VHN Measurements Metallography Select best combinations Phase IIIa (if needed) Forging Studies (repeat) VHN Measurements Metallography (repeat) Phase IV Selection of forging conditions for shop floor studies
Development and Testing of Two Stage Cooling Equipment
Conduct final forging trials on Wheel Hub Conduct final forging & cooling trials on Wheel Hub
Mechanical Testing Metallography Phase IVa (if needed) Conduct final forging & cooling trials on Wheel Hub(repeat)
Mechanical Testing (repeat) Metallography (repeat) Phase V Final Report
Thank you.
“HIGH STRENGTH, HIGH TOUGHNESS…” PROGRESS REPORT – YEAR 1 37
Appendix B: Literature Review
To: Karen Lewis, Executive Director
From: Aaron Stein, Forging Industry and Education Research
Foundation (FIERF) Graduate Fellow, Basic Metals Processing Research
Institute (BAMPRI), Mechanical Engineering and Materials Science
(MEMS) Department, University of Pittsburgh
Date: Date of Sending
Topic: Literature Review for the FIERF Funded Project
“High Strength, High-Toughness Microalloyed Steel Forgings Produced
with Relaxed Forging Conditions and No Heat Treatment”

“HIGH STRENGTH, HIGH TOUGHNESS…” PROGRESS REPORT – YEAR 1 38
Acknowledgements
The author wishes to thank his advisor, Professor A. J. DeArdo, and the
cooperating individuals/companies Carl Mclean and Fred Geib,
Meadville Forging Company (MFC), and Tom Zorc, TIMKENSTEEL Steel
Company. Special thanks also are due to Karen Lewis, Executive VP of
FIERF for both financially supporting the project, and for her
enthusiastic encouragement.
“HIGH STRENGTH, HIGH TOUGHNESS…” PROGRESS REPORT – YEAR 1 39
REPORT: Literature Review
1. Introduction High strength low alloy steels have been the subject of extensive studies since the early
1970’s for many different applications, such as the VAN 80 HSLA steels developed by the former
Jones and Laughlin Steel Corporation.[1] Prior to the development of these technologies, high
strength forgings were achievable only through the application of the quenching and tempering
process. This process was both uneconomical and detrimental to the environment through the
necessity of extra processing steps.[2] 1974 through 1980 saw the development of the medium
carbon steels which utilize the benefits of the microalloying elements niobium, titanium, and
vanadium. The individuals who investigated these steels found that additions of these elements
increased both the yield and ultimate strengths of the steels, with this effect being enhanced in
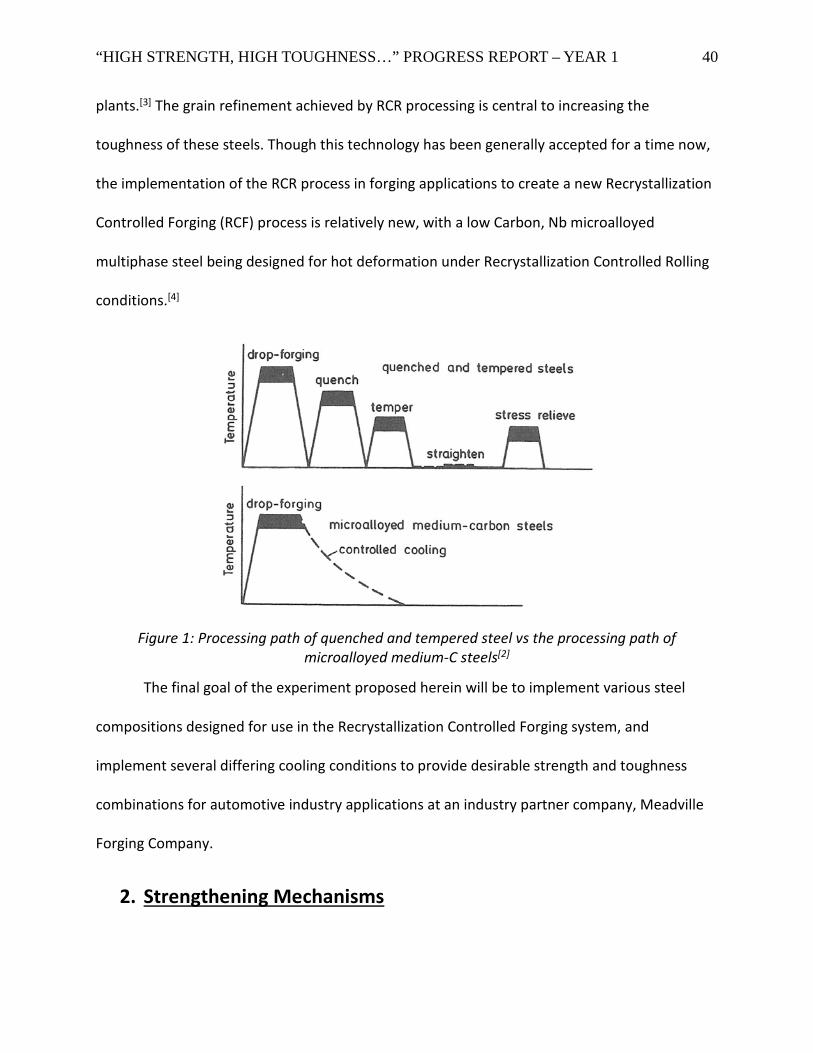
the presence of accelerated cooling.[2] As can be seen in Figure 1 below, the processing of these
steels is much simpler than the QT steels, and thus the economic viability of these steels, and
their processing, is much higher.[2]
Recrystallization Controlled Rolling (RCR) combined with Interrupted Direct Quenching
(IDQ)/ Indirect Accelerated Cooling (IAC) is a technology which has been in development since
the early 1980’s. The attractive qualities of this technology are its uncomplicated nature, its
elimination of normalizing steps, and its capability of application on unconventional forging
“HIGH STRENGTH, HIGH TOUGHNESS…” PROGRESS REPORT – YEAR 1 40
plants.[3] The grain refinement achieved by RCR processing is central to increasing the
toughness of these steels. Though this technology has been generally accepted for a time now,
the implementation of the RCR process in forging applications to create a new Recrystallization
Controlled Forging (RCF) process is relatively new, with a low Carbon, Nb microalloyed
multiphase steel being designed for hot deformation under Recrystallization Controlled Rolling
conditions.[4]
Figure 1: Processing path of quenched and tempered steel vs the processing path of microalloyed medium-C steels[2]
The final goal of the experiment proposed herein will be to implement various steel
compositions designed for use in the Recrystallization Controlled Forging system, and
implement several differing cooling conditions to provide desirable strength and toughness
combinations for automotive industry applications at an industry partner company, Meadville
Forging Company.
2. Strengthening Mechanisms

“HIGH STRENGTH, HIGH TOUGHNESS…” PROGRESS REPORT – YEAR 1 41
2.1 – Strengthening Overview
Plastic deformation in steels occurs due to the motion of dislocations throughout the
structure. Strengthening methods refer to methods of changing the structure of the steel, to
make it more resistant to the motion of these dislocations, and thus requiring of higher stress
levels to force the motion of the dislocations. In such a manner, the yield strength of a steel can
be adjusted, and can be expressed according the generalized form of the Hall-Petch equation
shown below:[5]
σy = σ0 + σSS + σpptn + σdis + σtexture + σGB
Where σ0 is the Peierl’s-Nabarro stress, which quantifies the resistance to dislocation motion in
the perfect lattice, σSS is the solid solution strengthening contribution, σpptn is the precipitation
strengthening contribution, σdis is the dislocation strengthening contribution, σtexture is the
texture hardening contribution, and σGB is the grain boundary strengthening contribution.
2.2 – Solid Solution Strengthening
Alloying elements which have not precipitated out of the matrix in which they were
introduced into instead incorporate themselves into the host matrix, and are said to be in solid
solution. Depending upon the size of the atom relative to the matrix, these solute atoms can
occupy either substitutional sites or interstitial sites in the matrix. If the solute and solvent
atoms are similar in size, substitutional solid solution behavior occurs, and the solute atoms
occupy the positions of solvent atoms. However, if the solute atoms are much smaller than the
solvent atoms, interstitial solid solution behavior occurs. The elements which commonly form
interstitial solid solutions are C, Nitrogen, Oxygen, Hydrogen and Boron. Typically, interstitial

“HIGH STRENGTH, HIGH TOUGHNESS…” PROGRESS REPORT – YEAR 1 42
solid solutions produce strengthening effects which are 10-100 times more pronounced than
that of the substitutional solid solutions.[5] In general, solute atoms in solid solutions affect the
strength of the material through the creation of local distortions, which impede dislocation
motion throughout the material.
2.3– Precipitation Strengthening
Precipitation strengthening is the method of increasing the strength of a material
through the precipitation of compounds within the matrix. These precipitates impede the
dislocation motion within the metal, and thus increase the strength. This increase in strength is
dependent upon the individual precipitate characteristics, such as size, shape, and coherency
with the matrix, as well as bulk characteristics, such as distribution and volume fraction of the
precipitates. For this strengthening mechanism to be employed, the elements of the precipitate
must be solid soluble at higher temperatures, and also demonstrate decreasing solubility with
temperature, such that they precipitate upon cool down.[6]
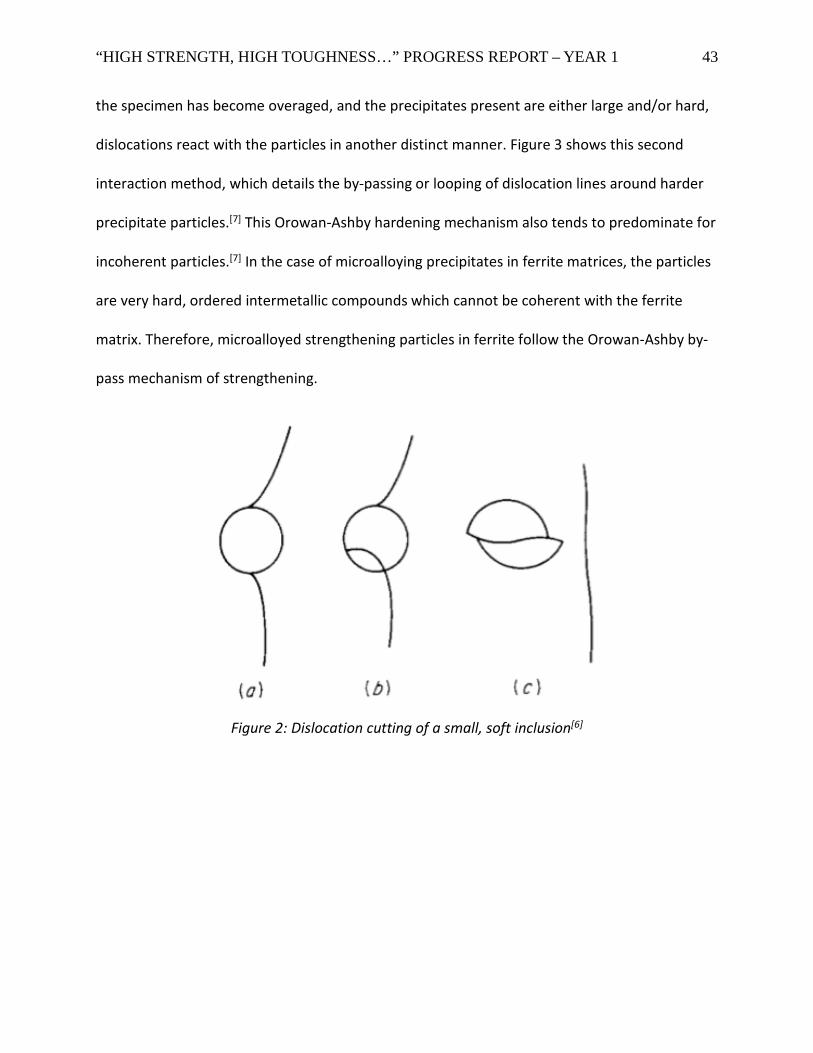
Dislocation motion within the metal may interact with the precipitate particles in 1 of 2
distinct ways, depending on the nature of the particles. When the precipitates are deformable
by the moving dislocations, then the strengthening is described by the Friedel Process.
Deformable particles tend to be small, soft and coherent with the matrix, and are mainly found
in FCC systems such as aluminum, copper and nickel-based alloys. A schematic view of particle
cutting is shown in Figure 2.[6] The extent of strengthening introduced due to this type of
precipitation/dislocation interaction is dependent upon several strengthening mechanisms,
including coherency strains and stacking-fault energies, among others.[6] In FCC systems, when
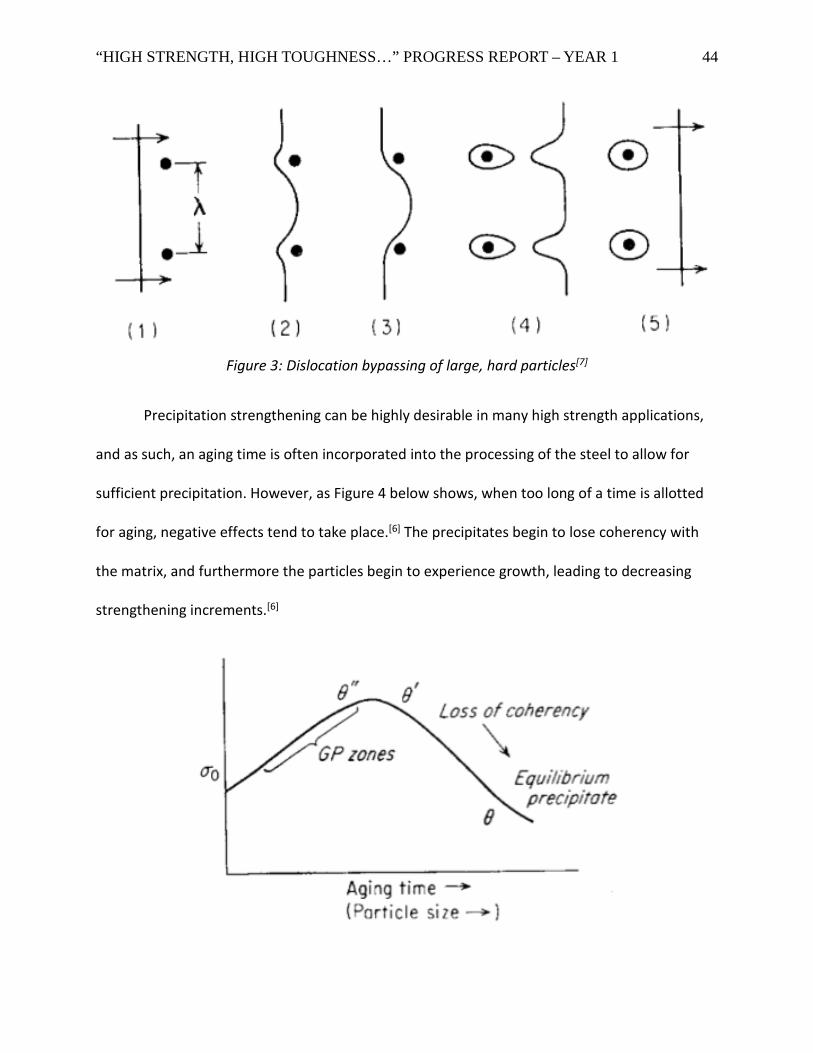
“HIGH STRENGTH, HIGH TOUGHNESS…” PROGRESS REPORT – YEAR 1 43
the specimen has become overaged, and the precipitates present are either large and/or hard,
dislocations react with the particles in another distinct manner. Figure 3 shows this second
interaction method, which details the by-passing or looping of dislocation lines around harder
precipitate particles.[7] This Orowan-Ashby hardening mechanism also tends to predominate for
incoherent particles.[7] In the case of microalloying precipitates in ferrite matrices, the particles
are very hard, ordered intermetallic compounds which cannot be coherent with the ferrite
matrix. Therefore, microalloyed strengthening particles in ferrite follow the Orowan-Ashby by-
pass mechanism of strengthening.
Figure 2: Dislocation cutting of a small, soft inclusion[6]
“HIGH STRENGTH, HIGH TOUGHNESS…” PROGRESS REPORT – YEAR 1 44
Figure 3: Dislocation bypassing of large, hard particles[7]
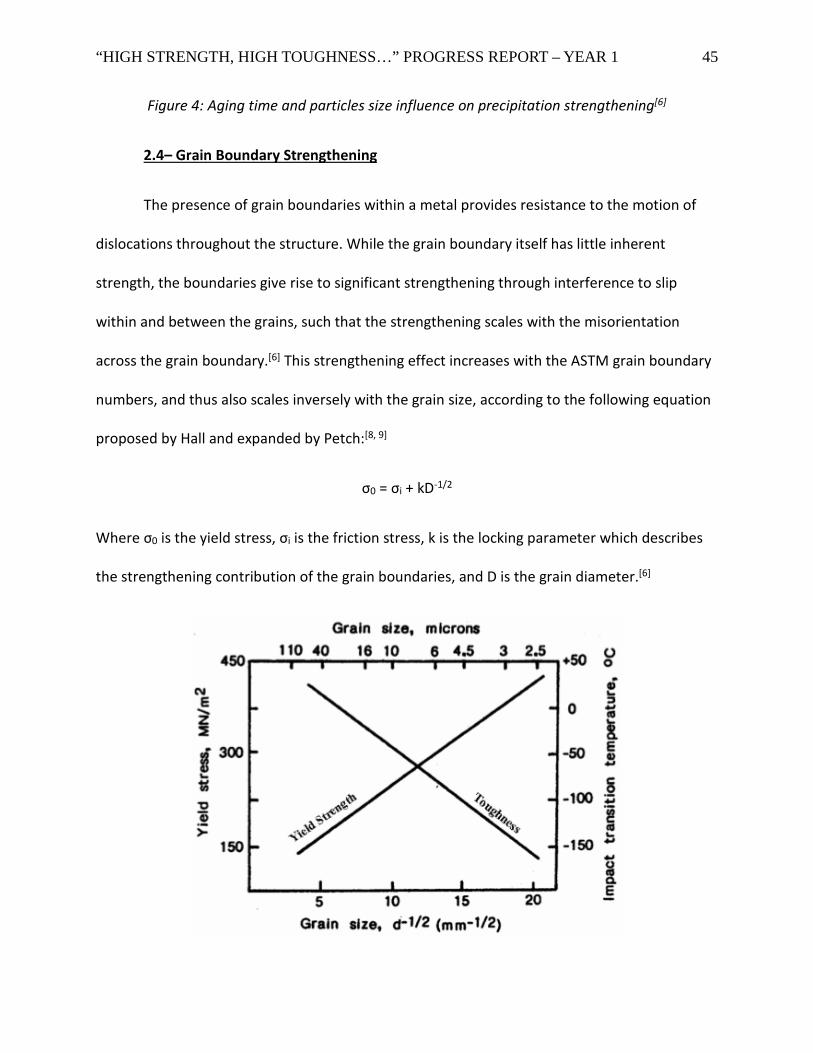
Precipitation strengthening can be highly desirable in many high strength applications,
and as such, an aging time is often incorporated into the processing of the steel to allow for
sufficient precipitation. However, as Figure 4 below shows, when too long of a time is allotted
for aging, negative effects tend to take place.[6] The precipitates begin to lose coherency with
the matrix, and furthermore the particles begin to experience growth, leading to decreasing
strengthening increments.[6]
“HIGH STRENGTH, HIGH TOUGHNESS…” PROGRESS REPORT – YEAR 1 45
Figure 4: Aging time and particles size influence on precipitation strengthening[6]
2.4– Grain Boundary Strengthening
The presence of grain boundaries within a metal provides resistance to the motion of
dislocations throughout the structure. While the grain boundary itself has little inherent
strength, the boundaries give rise to significant strengthening through interference to slip
within and between the grains, such that the strengthening scales with the misorientation
across the grain boundary.[6] This strengthening effect increases with the ASTM grain boundary
numbers, and thus also scales inversely with the grain size, according to the following equation
proposed by Hall and expanded by Petch:[8, 9]
σ0 = σi + kD-1/2
Where σ0 is the yield stress, σi is the friction stress, k is the locking parameter which describes
the strengthening contribution of the grain boundaries, and D is the grain diameter.[6]
“HIGH STRENGTH, HIGH TOUGHNESS…” PROGRESS REPORT – YEAR 1 46
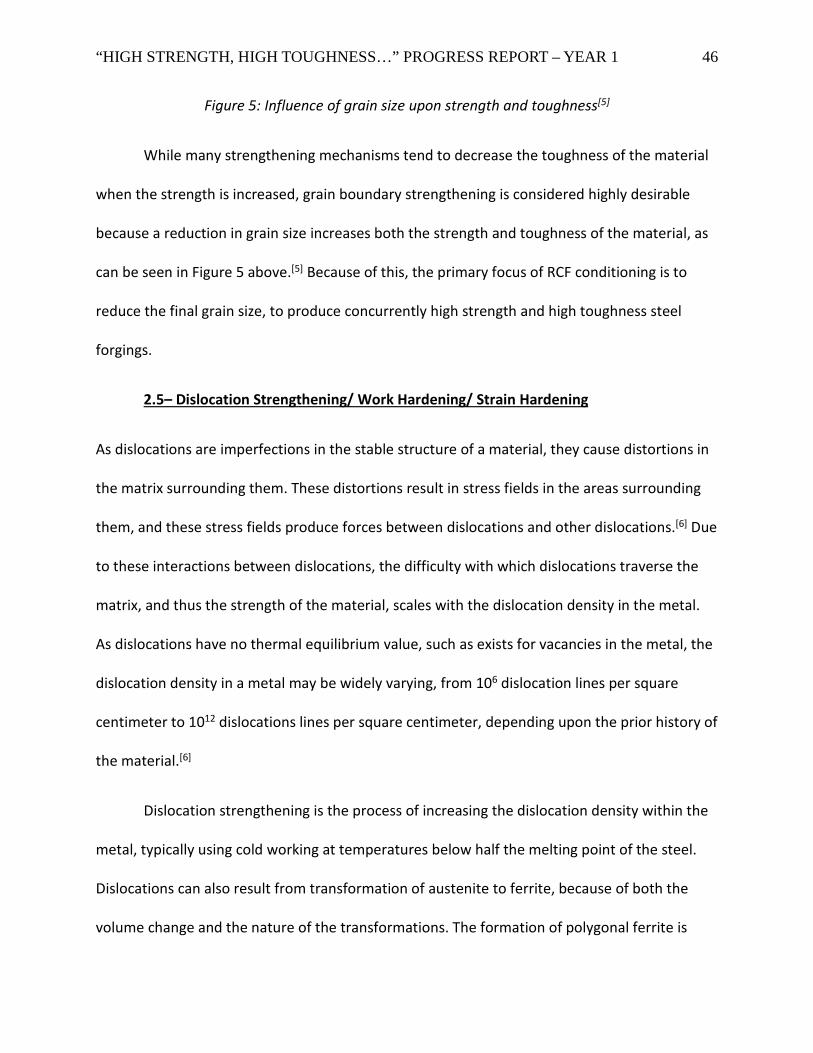
Figure 5: Influence of grain size upon strength and toughness[5]
While many strengthening mechanisms tend to decrease the toughness of the material
when the strength is increased, grain boundary strengthening is considered highly desirable
because a reduction in grain size increases both the strength and toughness of the material, as
can be seen in Figure 5 above.[5] Because of this, the primary focus of RCF conditioning is to
reduce the final grain size, to produce concurrently high strength and high toughness steel
forgings.
2.5– Dislocation Strengthening/ Work Hardening/ Strain Hardening
As dislocations are imperfections in the stable structure of a material, they cause distortions in
the matrix surrounding them. These distortions result in stress fields in the areas surrounding
them, and these stress fields produce forces between dislocations and other dislocations.[6] Due
to these interactions between dislocations, the difficulty with which dislocations traverse the
matrix, and thus the strength of the material, scales with the dislocation density in the metal.
As dislocations have no thermal equilibrium value, such as exists for vacancies in the metal, the
dislocation density in a metal may be widely varying, from 106 dislocation lines per square
centimeter to 1012 dislocations lines per square centimeter, depending upon the prior history of
the material.[6]
Dislocation strengthening is the process of increasing the dislocation density within the
metal, typically using cold working at temperatures below half the melting point of the steel.
Dislocations can also result from transformation of austenite to ferrite, because of both the
volume change and the nature of the transformations. The formation of polygonal ferrite is

“HIGH STRENGTH, HIGH TOUGHNESS…” PROGRESS REPORT – YEAR 1 47
considered a reconstructive transformation, and therefore leads to moderate increases in
dislocation density. However, the formation of bainite and martensite are considered displacive
transformations occurring by shearing of the austenite. These transformations can lead to very
high dislocation densities. Figure 6 below shows the influence of cold working upon the physical
properties of the metal. In general, the dislocation density contribution to the flow stress of the
material is related to the structure through the following relation:[6]
σ0 = σi + αGbρ1/2
Where σ0 is the flow stress, σi is the base stress of the lattice, α is a constant, G is the shear
modulus, b is the burger’s vector, and ρ is the dislocation density in the metal.
Figure 6: Influence of cold working on physical properties[6]
“HIGH STRENGTH, HIGH TOUGHNESS…” PROGRESS REPORT – YEAR 1 48
While dislocation strengthening increases the yield strength of a material, this benefit is
usually accompanied by several negative influences, such as decreases in ductility and chemical
effects such as decreases in electrical conductivity and corrosion resistance.[6]
3. Composition
3.1 – BAMPRI, Meadville, TIMKEN Steel Composition
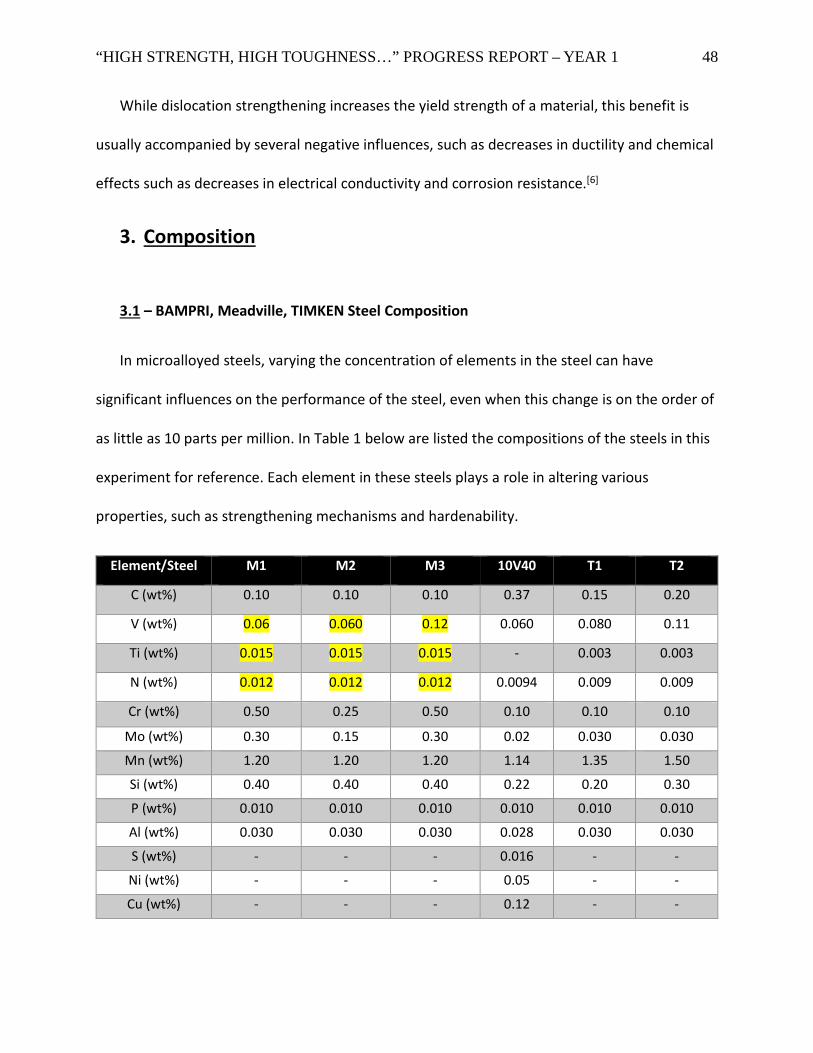
In microalloyed steels, varying the concentration of elements in the steel can have
significant influences on the performance of the steel, even when this change is on the order of
as little as 10 parts per million. In Table 1 below are listed the compositions of the steels in this
experiment for reference. Each element in these steels plays a role in altering various
properties, such as strengthening mechanisms and hardenability.
Element/Steel M1 M2 M3 10V40 T1 T2
C (wt%) 0.10 0.10 0.10 0.37 0.15 0.20
V (wt%) 0.06 0.060 0.12 0.060 0.080 0.11
Ti (wt%) 0.015 0.015 0.015 - 0.003 0.003
N (wt%) 0.012 0.012 0.012 0.0094 0.009 0.009
Cr (wt%) 0.50 0.25 0.50 0.10 0.10 0.10
Mo (wt%) 0.30 0.15 0.30 0.02 0.030 0.030
Mn (wt%) 1.20 1.20 1.20 1.14 1.35 1.50
Si (wt%) 0.40 0.40 0.40 0.22 0.20 0.30
P (wt%) 0.010 0.010 0.010 0.010 0.010 0.010
Al (wt%) 0.030 0.030 0.030 0.028 0.030 0.030
S (wt%) - - - 0.016 - -
Ni (wt%) - - - 0.05 - -
Cu (wt%) - - - 0.12 - -

“HIGH STRENGTH, HIGH TOUGHNESS…” PROGRESS REPORT – YEAR 1 49
Table 1: Compositions of final BAMPRI steels M1,M2 and M3, Meadville 10V40 steel, and TIMKEN steels T1 and T2
3.2 – Carbon
Carbon is perhaps the oldest alloying element in iron, and is the defining addition in the
widely-used carbon steels. C displays one of the largest solute strengthening capacities of any
element, with the slightest additions returning significant strengthening increments.
Additionally, C contributes to the precipitation strengthening of the material, through
formation of carbide precipitates. One form of precipitate shown in the literature are
precipitates of the type V(CN), shown by Siwecki and Engberg.[10] Furthermore, higher
concentrations of C in the steel favor formation of alternative phases over ferrite, allowing for
various microstructures such as bainite and martensite to form more easily, providing a range
of possible mechanical properties. High levels of C, however, also have a significant, negative
influence on the toughness of the steel, thus limiting the amount of carbon strengthening a
steel designer can practically employ for a given application.
Additional consideration of C in the steels studied herein must be taken to determine
the effect upon the forging loads during hot deformation of the steel, a factor which directly
influences the economic viability of the steel through die wear. These factors were studied in
[11], and the results are summarized in Figure 7 below in the form of flow stress curves from a
hot compression test `at 1000°C, the expected region of hot deformation for the steels
presented herein. These curves show that for the higher tested strain rates of 10s-1 and 1s-1,
which among the tested strain rates more closely resemble the strain rates anticipated in the
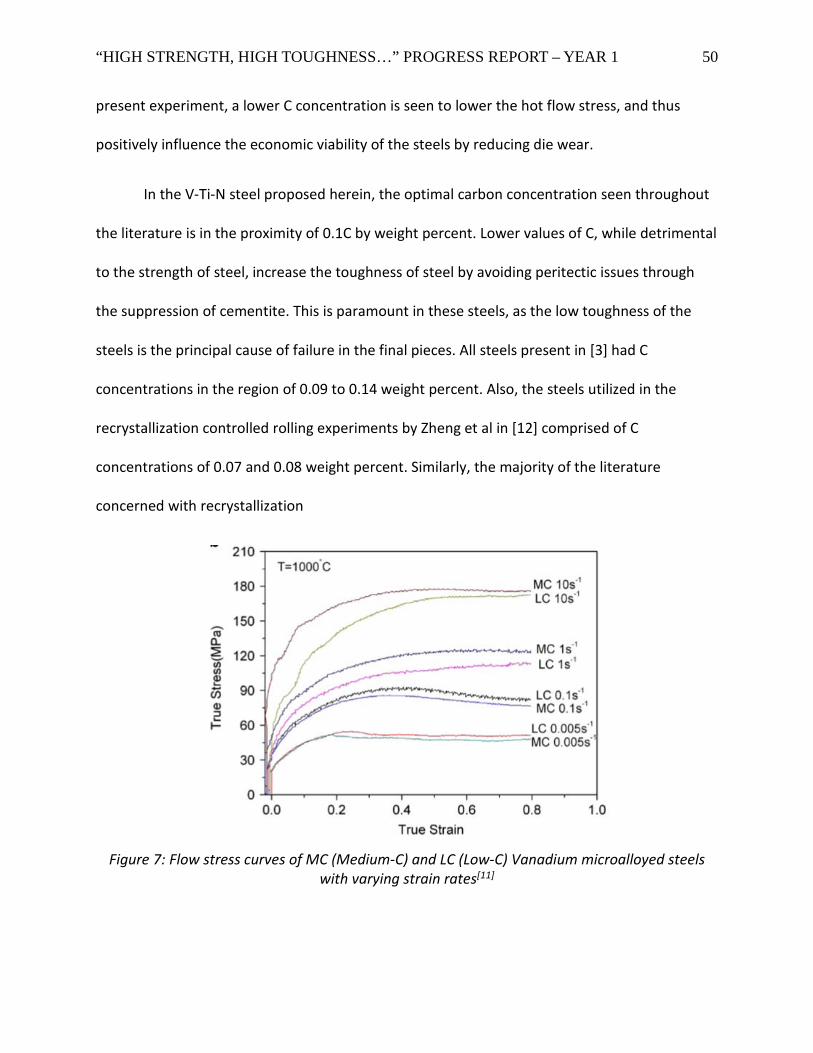
“HIGH STRENGTH, HIGH TOUGHNESS…” PROGRESS REPORT – YEAR 1 50
present experiment, a lower C concentration is seen to lower the hot flow stress, and thus
positively influence the economic viability of the steels by reducing die wear.
In the V-Ti-N steel proposed herein, the optimal carbon concentration seen throughout
the literature is in the proximity of 0.1C by weight percent. Lower values of C, while detrimental
to the strength of steel, increase the toughness of steel by avoiding peritectic issues through
the suppression of cementite. This is paramount in these steels, as the low toughness of the
steels is the principal cause of failure in the final pieces. All steels present in [3] had C
concentrations in the region of 0.09 to 0.14 weight percent. Also, the steels utilized in the
recrystallization controlled rolling experiments by Zheng et al in [12] comprised of C
concentrations of 0.07 and 0.08 weight percent. Similarly, the majority of the literature
concerned with recrystallization
Figure 7: Flow stress curves of MC (Medium-C) and LC (Low-C) Vanadium microalloyed steels with varying strain rates[11]
“HIGH STRENGTH, HIGH TOUGHNESS…” PROGRESS REPORT – YEAR 1 51
controlled rolling in the V-Ti-N steel system shows C concentrations above a minimum of 0.07
weight percent C, with only Chen et al. using a concentration lower than this, with a carbon
weight percent of 0.051.[13]
3.3 – Vanadium
Vanadium is a prominent microalloying addition, being potentially involved with
austenite conditioning, hardenability, and precipitation hardening of the final microstructure.
The primary purpose of V in the steels proposed herein is to supply a substantial quantity of
precipitation strengthening. Vanadium carbides may form in the steel under suitable
transformation and cooling conditions, but in the presence of sufficient quantities of N,
vanadium nitride precipitates may form and substantially increase the strength even more.[10]
However, since in the current experiments the N content is kept constant at approximately 60
ppm, this may not be a factor.
An additional benefit of V additions in the Ti-V-N steels studied in the literature is the
refinement of the final microstructure through the intragranular nucleation of ferrite upon
inclusions, especially the V precipitates which form on MnS inclusions.[14] Traditionally, ferrite
nucleation during the austenite to ferrite transformation occurs predominantly upon the prior
austenite grain boundaries. With the increased nucleation rates from the intragranular
nucleation of the ferrite, a higher quantity of individual ferrite grains is formed, and thus an
overall smaller ferrite grain size is observed.[14] These methods of intragranular ferrite
nucleation upon inclusions in V-bearing steels were studied by several authors in [15], [16], and
[17], and were found to be effective means of refining the final microstructure of the steel.

“HIGH STRENGTH, HIGH TOUGHNESS…” PROGRESS REPORT – YEAR 1 52
3.4 – Titanium
Titanium is the other prominent microalloying element in the proposed steels. The role of Ti
is primarily in the control of austenitic grain size, through the Zenner pinning of austenite grain
boundaries by stable, high-temperature Titanium-Nitride precipitate particles.[42] These TiN
particles, when subjected to proper conditions, can significantly lower the potential for grain
coarsening, providing the optimal conditions for Recrystallization Controlled Forging.
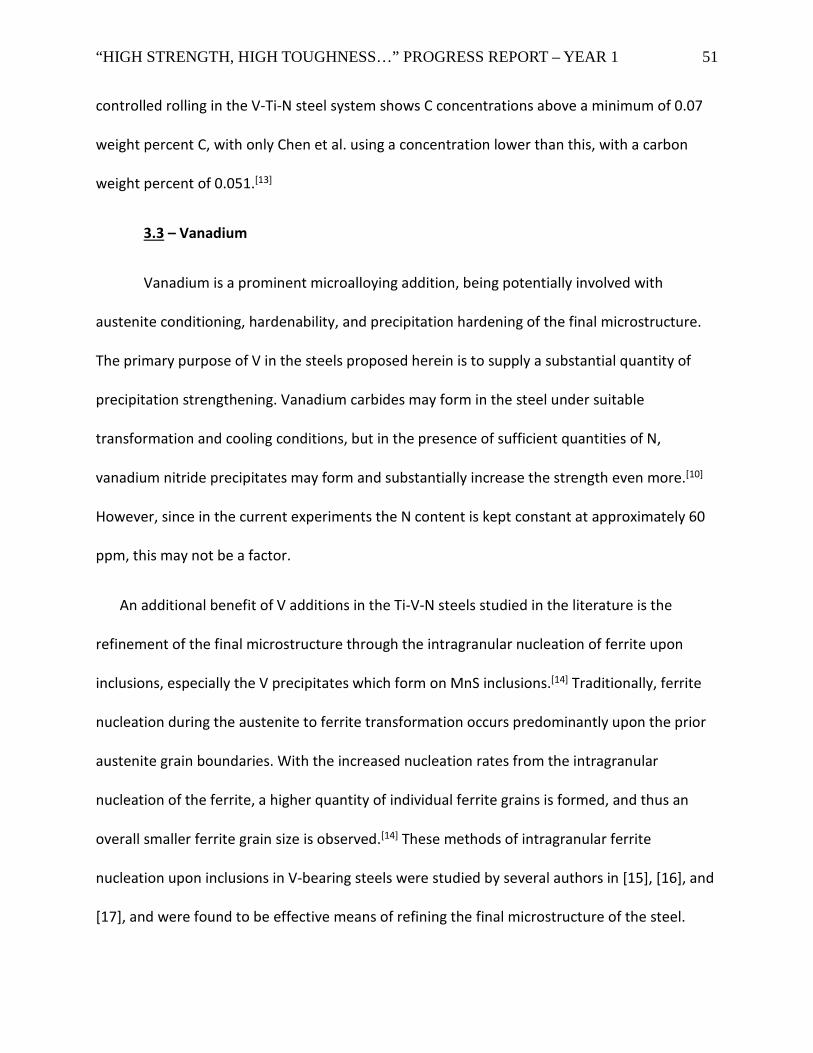
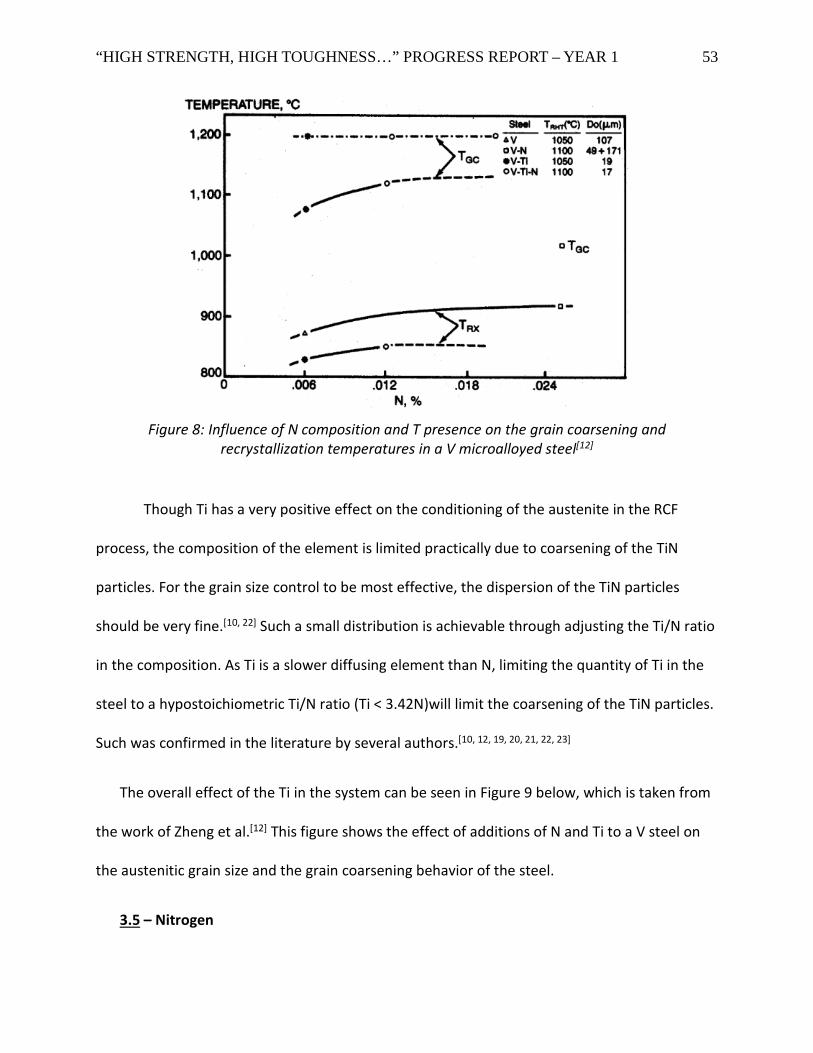
With regards to austenite conditioning and control, an addition of Ti to a N containing alloy
results in the high temperature precipitation of Titanium Nitride particles, which pin austenitic
grain boundaries and impede growth, significantly raising the grain coarsening temperature.[12]
These TiN particles were observed by various authors in the literature, and are well
documented to be a key austenitic conditioner.[10, 12, 18, 19, 20, 21] TiN particles also have a
significant effect upon the recrystallization kinetics of the steel, which is a very core component
in the Recrystallization Controlled Forging process proposed. Zheng et al. in [12] demonstrates
that additions of Ti to the V and N steels resulted in a depressing of the recrystallization
temperature. Figure 8 below demonstrates both the effects of Ti on the grain coarsening and
recrystallization temperatures, and the effects of the N level, which will be explained shortly.
“HIGH STRENGTH, HIGH TOUGHNESS…” PROGRESS REPORT – YEAR 1 53
Figure 8: Influence of N composition and T presence on the grain coarsening and recrystallization temperatures in a V microalloyed steel[12]
Though Ti has a very positive effect on the conditioning of the austenite in the RCF
process, the composition of the element is limited practically due to coarsening of the TiN
particles. For the grain size control to be most effective, the dispersion of the TiN particles
should be very fine.[10, 22] Such a small distribution is achievable through adjusting the Ti/N ratio
in the composition. As Ti is a slower diffusing element than N, limiting the quantity of Ti in the
steel to a hypostoichiometric Ti/N ratio (Ti < 3.42N)will limit the coarsening of the TiN particles.
Such was confirmed in the literature by several authors.[10, 12, 19, 20, 21, 22, 23]
The overall effect of the Ti in the system can be seen in Figure 9 below, which is taken from
the work of Zheng et al.[12] This figure shows the effect of additions of N and Ti to a V steel on
the austenitic grain size and the grain coarsening behavior of the steel.
3.5 – Nitrogen
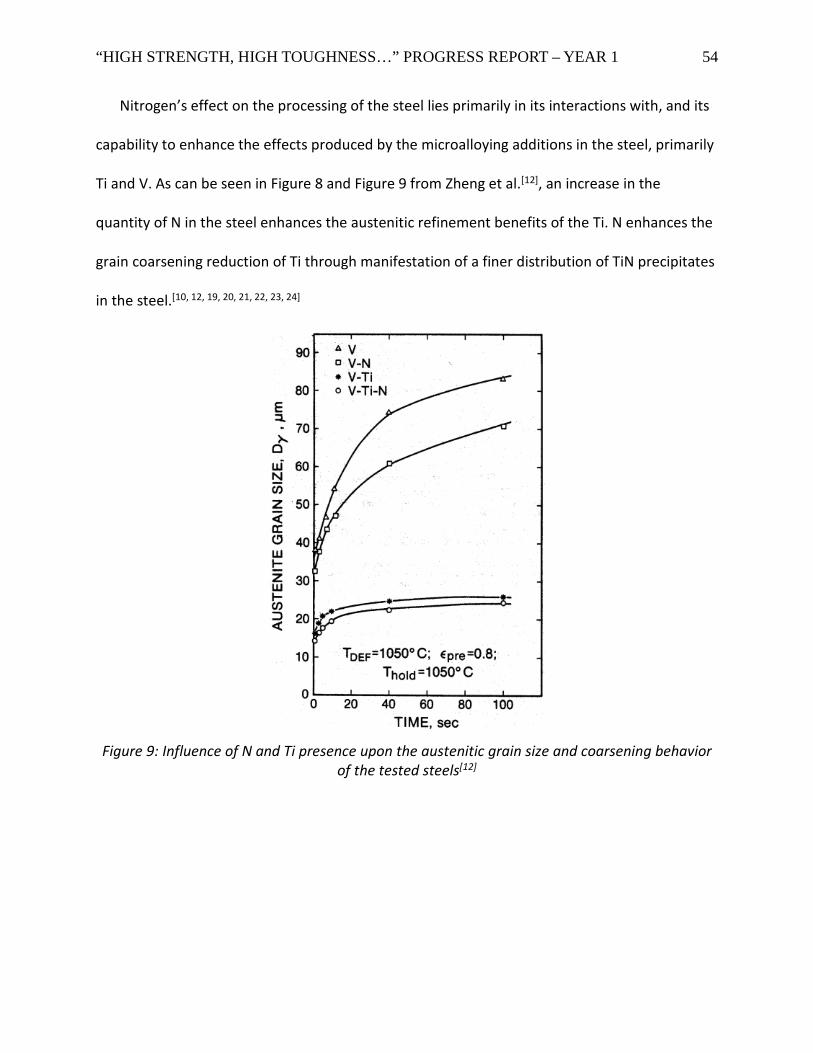
“HIGH STRENGTH, HIGH TOUGHNESS…” PROGRESS REPORT – YEAR 1 54
Nitrogen’s effect on the processing of the steel lies primarily in its interactions with, and its
capability to enhance the effects produced by the microalloying additions in the steel, primarily
Ti and V. As can be seen in Figure 8 and Figure 9 from Zheng et al.[12], an increase in the
quantity of N in the steel enhances the austenitic refinement benefits of the Ti. N enhances the
grain coarsening reduction of Ti through manifestation of a finer distribution of TiN precipitates
in the steel.[10, 12, 19, 20, 21, 22, 23, 24]
Figure 9: Influence of N and Ti presence upon the austenitic grain size and coarsening behavior of the tested steels[12]
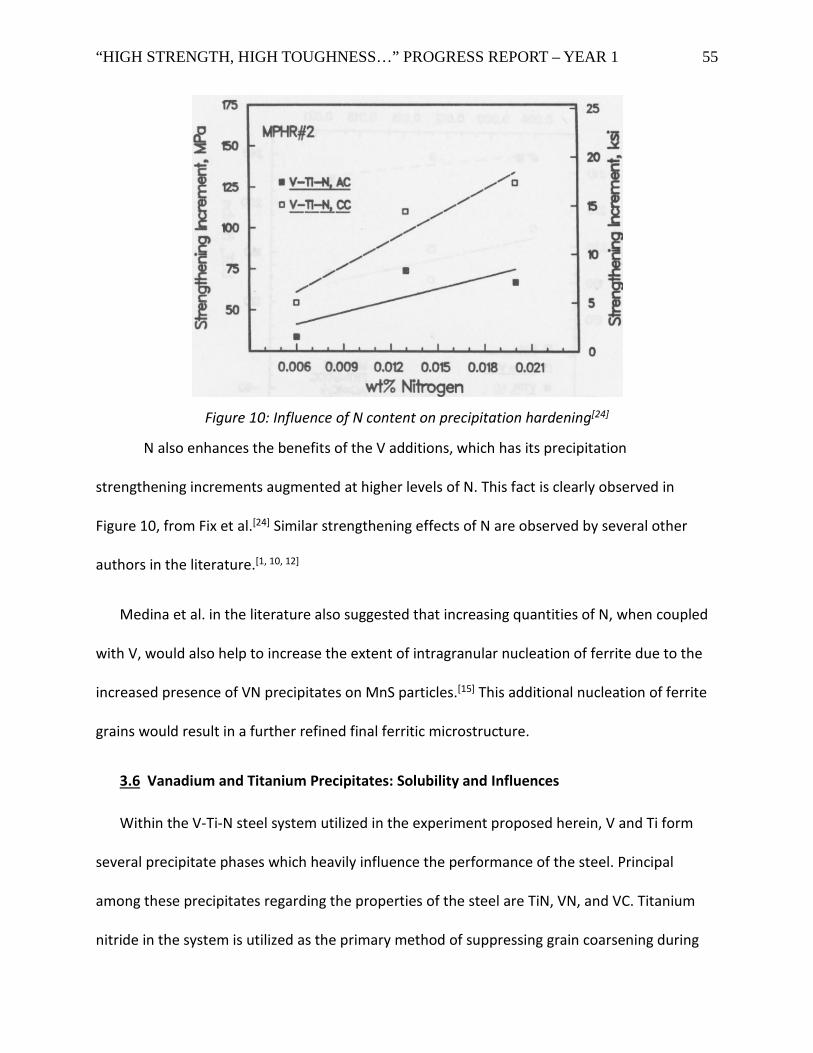
“HIGH STRENGTH, HIGH TOUGHNESS…” PROGRESS REPORT – YEAR 1 55
Figure 10: Influence of N content on precipitation hardening[24]
N also enhances the benefits of the V additions, which has its precipitation
strengthening increments augmented at higher levels of N. This fact is clearly observed in
Figure 10, from Fix et al.[24] Similar strengthening effects of N are observed by several other
authors in the literature.[1, 10, 12]
Medina et al. in the literature also suggested that increasing quantities of N, when coupled
with V, would also help to increase the extent of intragranular nucleation of ferrite due to the
increased presence of VN precipitates on MnS particles.[15] This additional nucleation of ferrite
grains would result in a further refined final ferritic microstructure.
3.6 Vanadium and Titanium Precipitates: Solubility and Influences
Within the V-Ti-N steel system utilized in the experiment proposed herein, V and Ti form
several precipitate phases which heavily influence the performance of the steel. Principal
among these precipitates regarding the properties of the steel are TiN, VN, and VC. Titanium
nitride in the system is utilized as the primary method of suppressing grain coarsening during
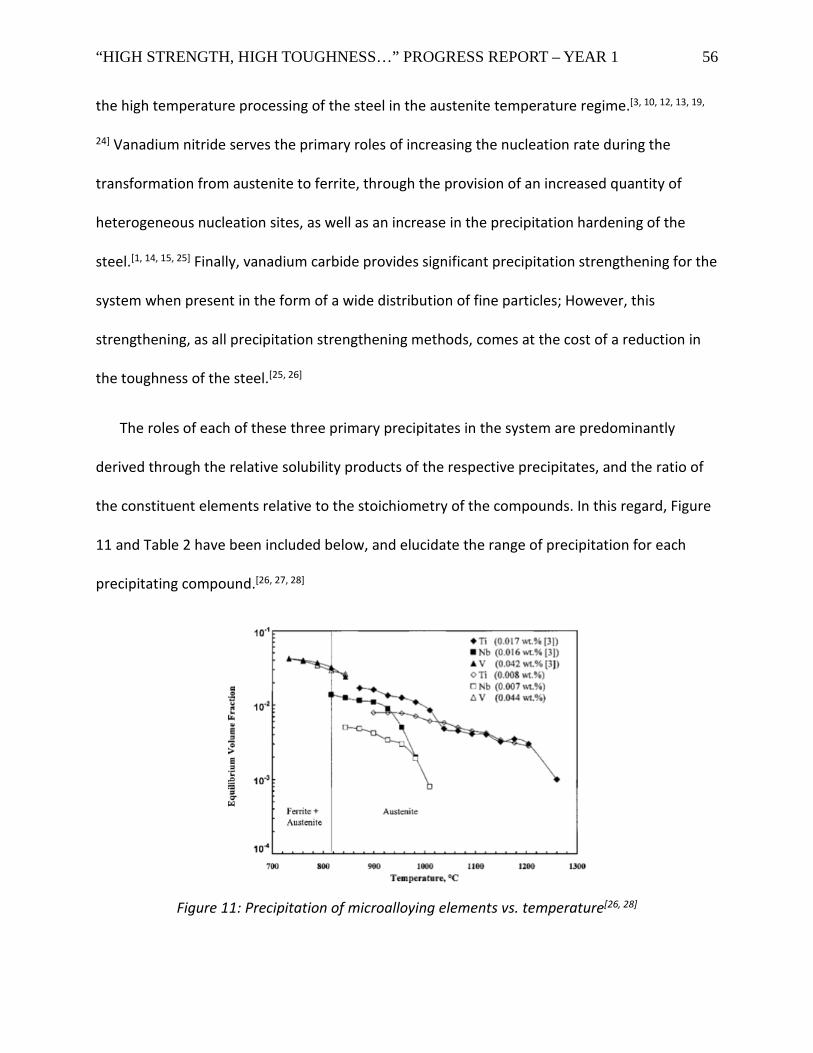
“HIGH STRENGTH, HIGH TOUGHNESS…” PROGRESS REPORT – YEAR 1 56
the high temperature processing of the steel in the austenite temperature regime.[3, 10, 12, 13, 19,
24] Vanadium nitride serves the primary roles of increasing the nucleation rate during the
transformation from austenite to ferrite, through the provision of an increased quantity of
heterogeneous nucleation sites, as well as an increase in the precipitation hardening of the
steel.[1, 14, 15, 25] Finally, vanadium carbide provides significant precipitation strengthening for the
system when present in the form of a wide distribution of fine particles; However, this
strengthening, as all precipitation strengthening methods, comes at the cost of a reduction in
the toughness of the steel.[25, 26]
The roles of each of these three primary precipitates in the system are predominantly
derived through the relative solubility products of the respective precipitates, and the ratio of
the constituent elements relative to the stoichiometry of the compounds. In this regard, Figure
11 and Table 2 have been included below, and elucidate the range of precipitation for each
precipitating compound.[26, 27, 28]
Figure 11: Precipitation of microalloying elements vs. temperature[26, 28]
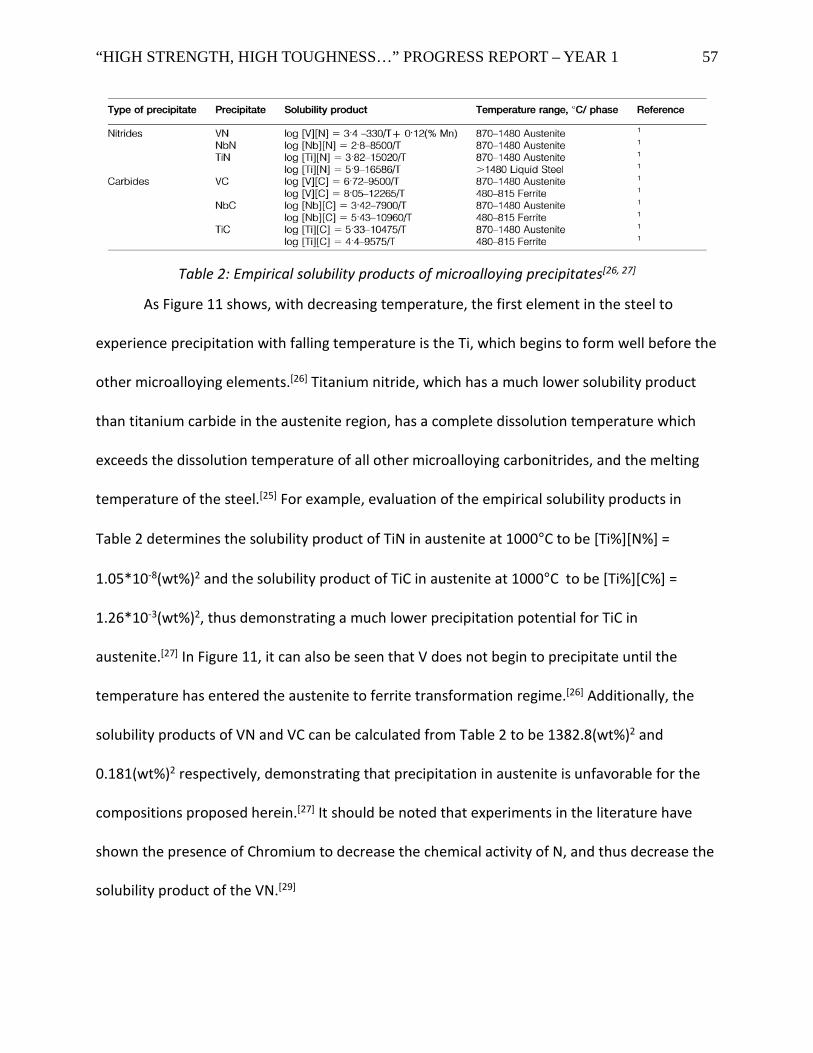
“HIGH STRENGTH, HIGH TOUGHNESS…” PROGRESS REPORT – YEAR 1 57
Table 2: Empirical solubility products of microalloying precipitates[26, 27]
As Figure 11 shows, with decreasing temperature, the first element in the steel to
experience precipitation with falling temperature is the Ti, which begins to form well before the
other microalloying elements.[26] Titanium nitride, which has a much lower solubility product
than titanium carbide in the austenite region, has a complete dissolution temperature which
exceeds the dissolution temperature of all other microalloying carbonitrides, and the melting
temperature of the steel.[25] For example, evaluation of the empirical solubility products in
Table 2 determines the solubility product of TiN in austenite at 1000°C to be [Ti%][N%] =
1.05*10-8(wt%)2 and the solubility product of TiC in austenite at 1000°C to be [Ti%][C%] =
1.26*10-3(wt%)2, thus demonstrating a much lower precipitation potential for TiC in
austenite.[27] In Figure 11, it can also be seen that V does not begin to precipitate until the
temperature has entered the austenite to ferrite transformation regime.[26] Additionally, the
solubility products of VN and VC can be calculated from Table 2 to be 1382.8(wt%)2 and
0.181(wt%)2 respectively, demonstrating that precipitation in austenite is unfavorable for the
compositions proposed herein.[27] It should be noted that experiments in the literature have
shown the presence of Chromium to decrease the chemical activity of N, and thus decrease the
solubility product of the VN.[29]

“HIGH STRENGTH, HIGH TOUGHNESS…” PROGRESS REPORT – YEAR 1 58
The stoichiometric ratio of TiN is equal to the ratio of the atomic weights of the elements
and results in a Ti:N mass ratio equal to 3.42.[30] As titanium nitride begins to precipitate well
before the other nitrides and carbides, a sub-stoichiometric Ti:N ratio (i.e. a ratio less than 3.42)
results in a depletion of Ti within solid solution, and reduces the formation of TiC to a small
fraction.[26] Following the depletion of the Ti, the excess N then combines with the V in solid
solution to form VN, which has a lower solubility in austenite than that of VC, which has a
considerably higher solubility than any other microalloy carbide or nitride.[26] If the V
concentration is greater than the stoichiometric ratio compared to the excess N remaining in
solid solution ([V%] / [excess N%] > 3.64), then VN will precipitate until the depletion of the N in
solid solution. In this super-stoichiometric condition, the excess V remains in solution for
interphase precipitation or precipitation after transformation as vanadium carbides.[26]
3.7 – Chromium, Molybdenum and Manganese
Chromium and Molybdenum are the two most pronounced hardenability alloying elements
in steels. Additions of these elements to the steels cause shifts to longer times in the
transformation temperatures, which is equivalent to a rightward shift on the CCT diagrams of
the steels. This effect can be seen below in Figure 12, which displays the CCT diagrams for the
M1 and M2 steels, which differ only in that steel M2 has half the quantity of Cr and Mo that
steel M1 has. The rightward shift in the curves on steel M1, which has the higher Cr and Mo
compositions, encourage the formation of non-ferritic/pearlitic microstructures, such as bainite
at lower cooling rates, and martensite at elevated cooling rates. Additionally, Mo was seen to
decrease the transformation start temperature of the steel in several of the works in the
literature.[31, 32] Additionally, Radovic et al, in [33] shows that the addition of Cr and Mo to the V
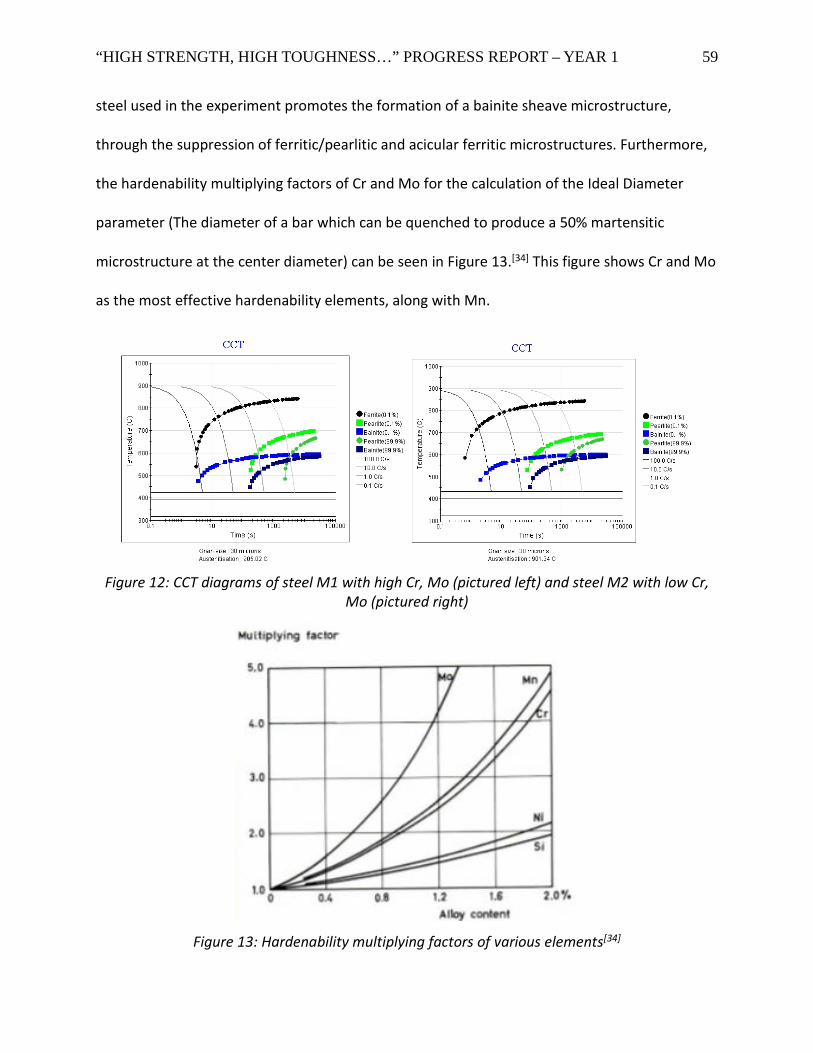
“HIGH STRENGTH, HIGH TOUGHNESS…” PROGRESS REPORT – YEAR 1 59
steel used in the experiment promotes the formation of a bainite sheave microstructure,
through the suppression of ferritic/pearlitic and acicular ferritic microstructures. Furthermore,
the hardenability multiplying factors of Cr and Mo for the calculation of the Ideal Diameter
parameter (The diameter of a bar which can be quenched to produce a 50% martensitic
microstructure at the center diameter) can be seen in Figure 13.[34] This figure shows Cr and Mo
as the most effective hardenability elements, along with Mn.
Figure 12: CCT diagrams of steel M1 with high Cr, Mo (pictured left) and steel M2 with low Cr, Mo (pictured right)
Figure 13: Hardenability multiplying factors of various elements[34]
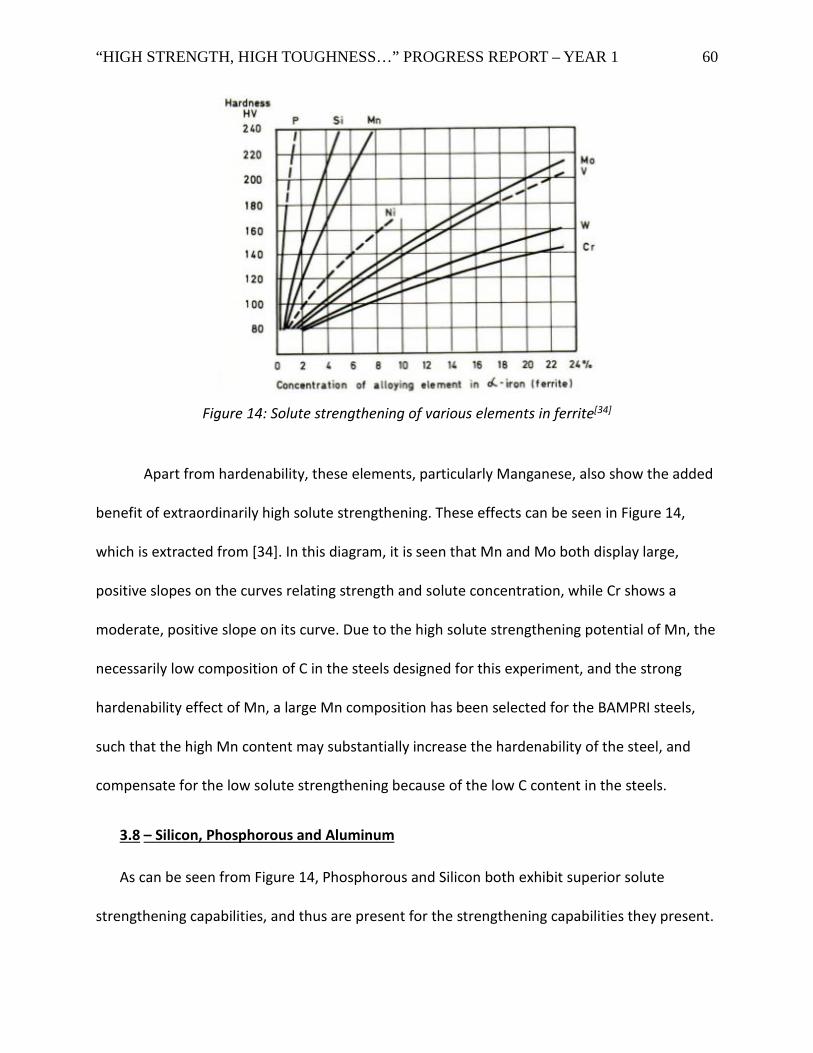
“HIGH STRENGTH, HIGH TOUGHNESS…” PROGRESS REPORT – YEAR 1 60
Figure 14: Solute strengthening of various elements in ferrite[34]
Apart from hardenability, these elements, particularly Manganese, also show the added
benefit of extraordinarily high solute strengthening. These effects can be seen in Figure 14,
which is extracted from [34]. In this diagram, it is seen that Mn and Mo both display large,
positive slopes on the curves relating strength and solute concentration, while Cr shows a
moderate, positive slope on its curve. Due to the high solute strengthening potential of Mn, the
necessarily low composition of C in the steels designed for this experiment, and the strong
hardenability effect of Mn, a large Mn composition has been selected for the BAMPRI steels,
such that the high Mn content may substantially increase the hardenability of the steel, and
compensate for the low solute strengthening because of the low C content in the steels.
3.8 – Silicon, Phosphorous and Aluminum
As can be seen from Figure 14, Phosphorous and Silicon both exhibit superior solute
strengthening capabilities, and thus are present for the strengthening capabilities they present.
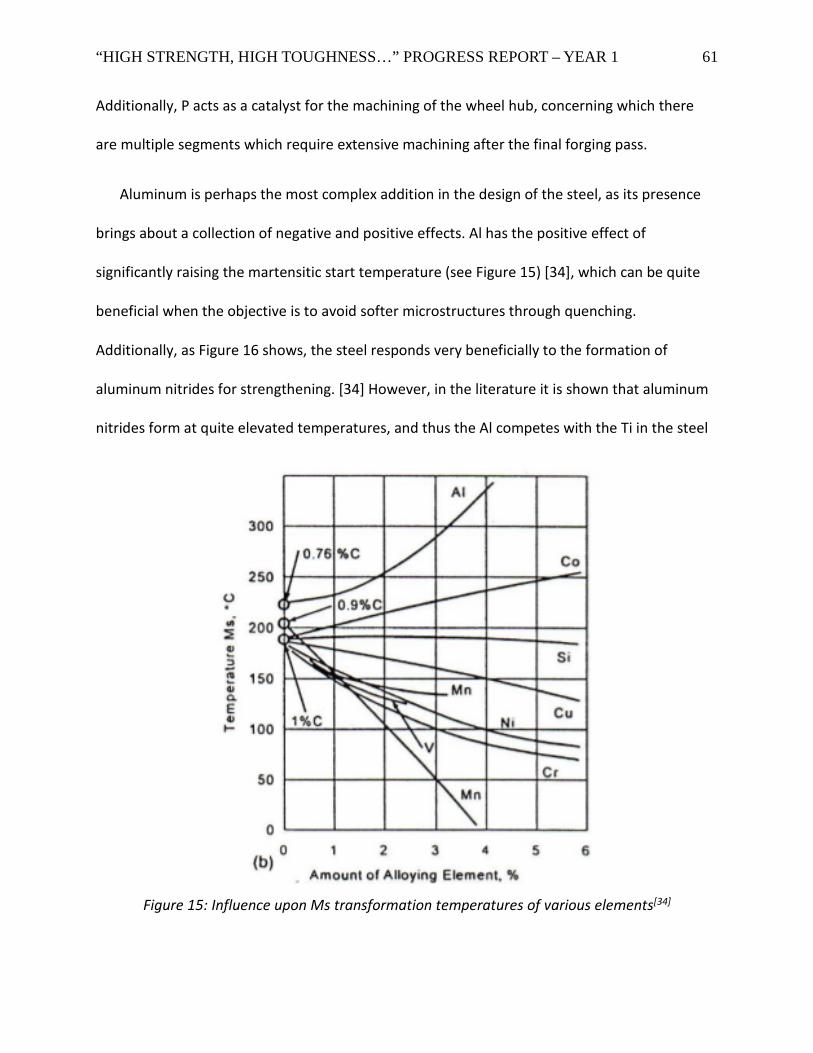
“HIGH STRENGTH, HIGH TOUGHNESS…” PROGRESS REPORT – YEAR 1 61
Additionally, P acts as a catalyst for the machining of the wheel hub, concerning which there
are multiple segments which require extensive machining after the final forging pass.
Aluminum is perhaps the most complex addition in the design of the steel, as its presence
brings about a collection of negative and positive effects. Al has the positive effect of
significantly raising the martensitic start temperature (see Figure 15) [34], which can be quite
beneficial when the objective is to avoid softer microstructures through quenching.
Additionally, as Figure 16 shows, the steel responds very beneficially to the formation of
aluminum nitrides for strengthening. [34] However, in the literature it is shown that aluminum
nitrides form at quite elevated temperatures, and thus the Al competes with the Ti in the steel
Figure 15: Influence upon Ms transformation temperatures of various elements[34]

“HIGH STRENGTH, HIGH TOUGHNESS…” PROGRESS REPORT – YEAR 1 62
for the formation of nitrides.[35] This effect could be quite hampering to the austenitic
conditioning of the steel, as TiN is the primary retardant of grain coarsening in the RCR process,
while AlN only very slightly affects coarsening.
Figure 16: Nitride precipitation strengthening of various elements.[34]
4. Austenite Conditioning
4.1 – Sv Parameter
The goal of austenite conditioning is to increase the value of the parameter Sv, which
represents the Interfacial near-planar surface area per unit volume, since these are both
nucleating sites for subsequent transformation and barriers to cleavage crack growth. This
parameter is tied to the geometry of the grains comprising the microstructure; It is increased
when grains become smaller, or when the grains become less spherical in shape, i.e., pancaked.
With regards to the increase in Sv for a decrease in ferrite grain size, Underwood proposes that
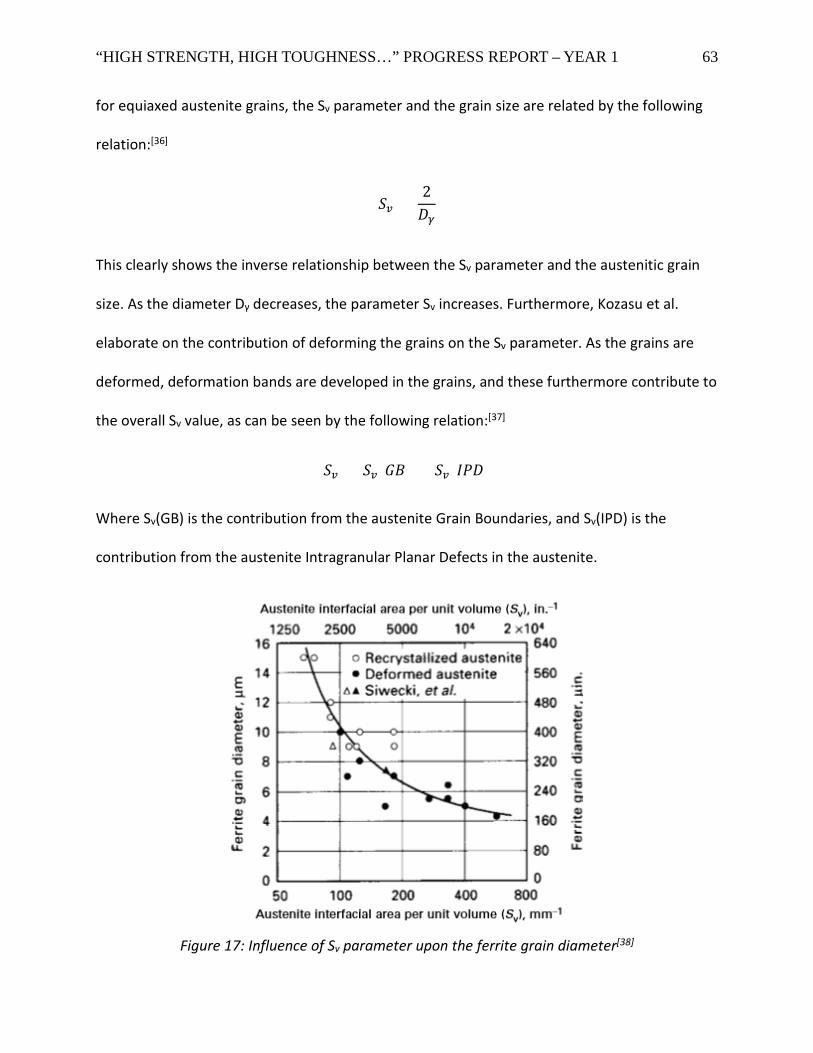
“HIGH STRENGTH, HIGH TOUGHNESS…” PROGRESS REPORT – YEAR 1 63
for equiaxed austenite grains, the Sv parameter and the grain size are related by the following
relation:[36]
𝑆𝑆𝑣𝑣 = 2𝐷𝐷𝛾𝛾
This clearly shows the inverse relationship between the Sv parameter and the austenitic grain
size. As the diameter Dγ decreases, the parameter Sv increases. Furthermore, Kozasu et al.
elaborate on the contribution of deforming the grains on the Sv parameter. As the grains are
deformed, deformation bands are developed in the grains, and these furthermore contribute to
the overall Sv value, as can be seen by the following relation:[37]
𝑆𝑆𝑣𝑣 = 𝑆𝑆𝑣𝑣(𝐺𝐺𝐺𝐺) + 𝑆𝑆𝑣𝑣(𝐼𝐼𝐼𝐼𝐷𝐷)
Where Sv(GB) is the contribution from the austenite Grain Boundaries, and Sv(IPD) is the
contribution from the austenite Intragranular Planar Defects in the austenite.
Figure 17: Influence of Sv parameter upon the ferrite grain diameter[38]
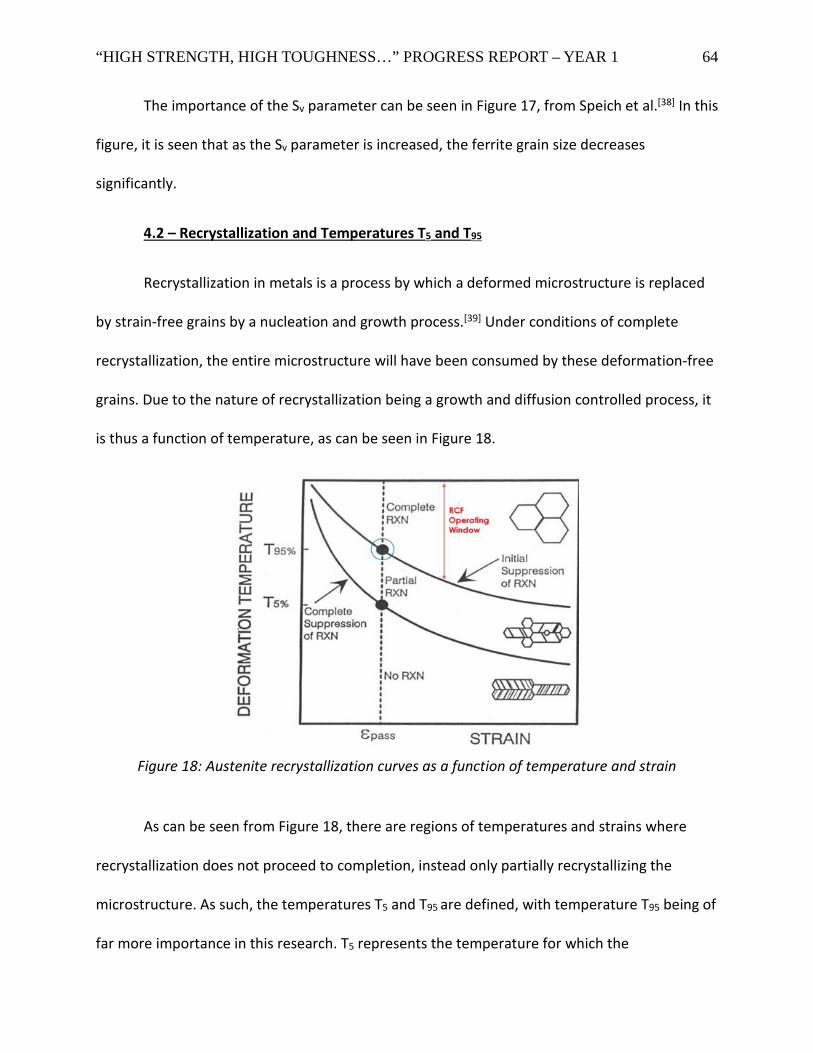
“HIGH STRENGTH, HIGH TOUGHNESS…” PROGRESS REPORT – YEAR 1 64
The importance of the Sv parameter can be seen in Figure 17, from Speich et al.[38] In this
figure, it is seen that as the Sv parameter is increased, the ferrite grain size decreases
significantly.
4.2 – Recrystallization and Temperatures T5 and T95
Recrystallization in metals is a process by which a deformed microstructure is replaced
by strain-free grains by a nucleation and growth process.[39] Under conditions of complete
recrystallization, the entire microstructure will have been consumed by these deformation-free
grains. Due to the nature of recrystallization being a growth and diffusion controlled process, it
is thus a function of temperature, as can be seen in Figure 18.
Figure 18: Austenite recrystallization curves as a function of temperature and strain
As can be seen from Figure 18, there are regions of temperatures and strains where
recrystallization does not proceed to completion, instead only partially recrystallizing the
microstructure. As such, the temperatures T5 and T95 are defined, with temperature T95 being of
far more importance in this research. T5 represents the temperature for which the
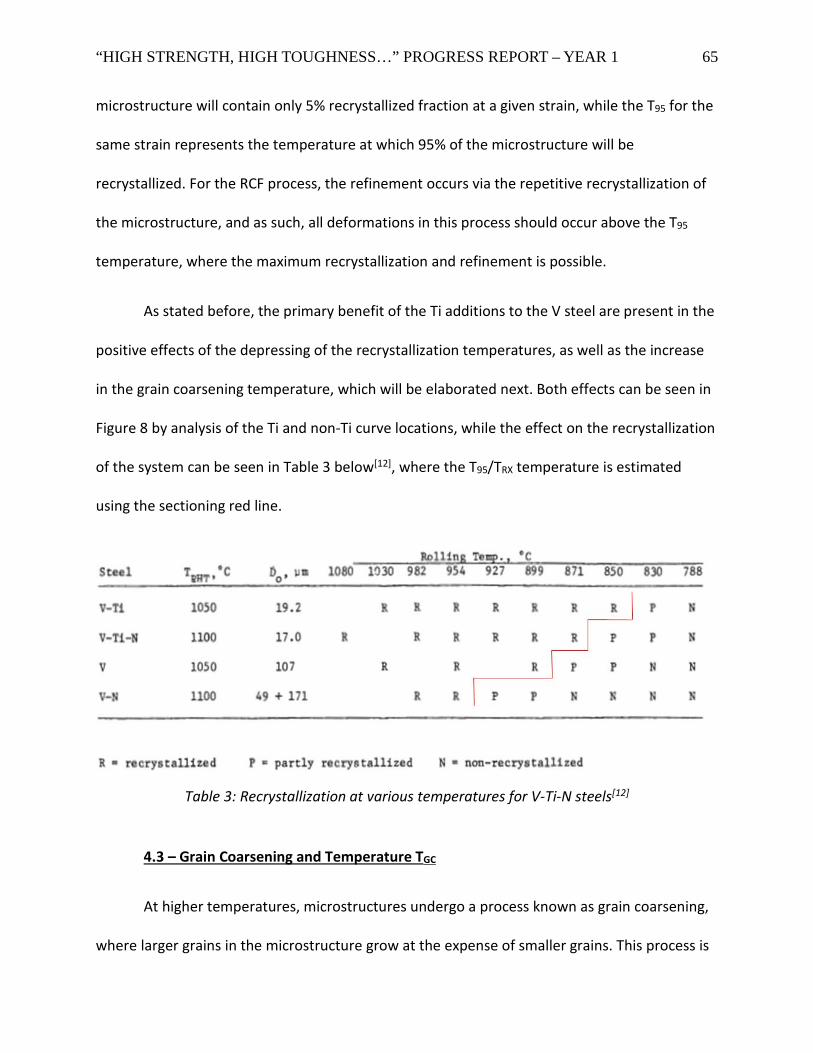
“HIGH STRENGTH, HIGH TOUGHNESS…” PROGRESS REPORT – YEAR 1 65
microstructure will contain only 5% recrystallized fraction at a given strain, while the T95 for the
same strain represents the temperature at which 95% of the microstructure will be
recrystallized. For the RCF process, the refinement occurs via the repetitive recrystallization of
the microstructure, and as such, all deformations in this process should occur above the T95
temperature, where the maximum recrystallization and refinement is possible.
As stated before, the primary benefit of the Ti additions to the V steel are present in the
positive effects of the depressing of the recrystallization temperatures, as well as the increase
in the grain coarsening temperature, which will be elaborated next. Both effects can be seen in
Figure 8 by analysis of the Ti and non-Ti curve locations, while the effect on the recrystallization
of the system can be seen in Table 3 below[12], where the T95/TRX temperature is estimated
using the sectioning red line.
Table 3: Recrystallization at various temperatures for V-Ti-N steels[12]
4.3 – Grain Coarsening and Temperature TGC
At higher temperatures, microstructures undergo a process known as grain coarsening,
where larger grains in the microstructure grow at the expense of smaller grains. This process is
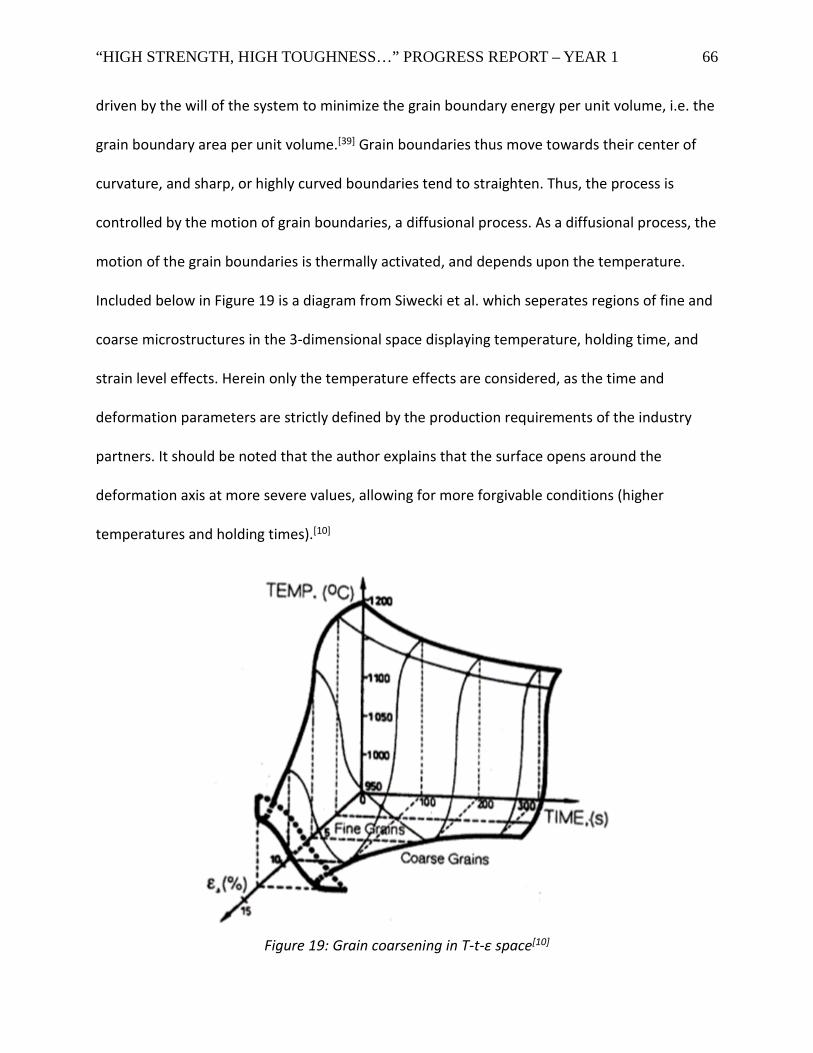
“HIGH STRENGTH, HIGH TOUGHNESS…” PROGRESS REPORT – YEAR 1 66
driven by the will of the system to minimize the grain boundary energy per unit volume, i.e. the
grain boundary area per unit volume.[39] Grain boundaries thus move towards their center of
curvature, and sharp, or highly curved boundaries tend to straighten. Thus, the process is
controlled by the motion of grain boundaries, a diffusional process. As a diffusional process, the
motion of the grain boundaries is thermally activated, and depends upon the temperature.
Included below in Figure 19 is a diagram from Siwecki et al. which seperates regions of fine and
coarse microstructures in the 3-dimensional space displaying temperature, holding time, and
strain level effects. Herein only the temperature effects are considered, as the time and
deformation parameters are strictly defined by the production requirements of the industry
partners. It should be noted that the author explains that the surface opens around the
deformation axis at more severe values, allowing for more forgivable conditions (higher
temperatures and holding times).[10]
Figure 19: Grain coarsening in T-t-ε space[10]
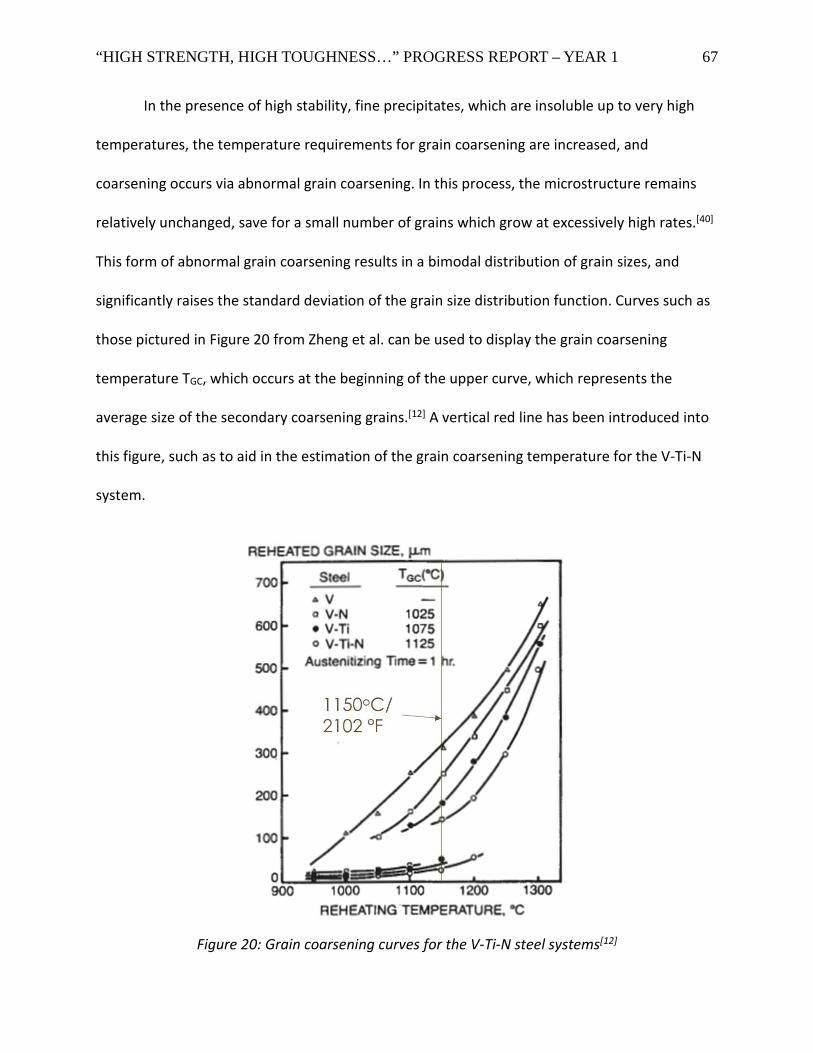
“HIGH STRENGTH, HIGH TOUGHNESS…” PROGRESS REPORT – YEAR 1 67
In the presence of high stability, fine precipitates, which are insoluble up to very high
temperatures, the temperature requirements for grain coarsening are increased, and
coarsening occurs via abnormal grain coarsening. In this process, the microstructure remains
relatively unchanged, save for a small number of grains which grow at excessively high rates.[40]
This form of abnormal grain coarsening results in a bimodal distribution of grain sizes, and
significantly raises the standard deviation of the grain size distribution function. Curves such as
those pictured in Figure 20 from Zheng et al. can be used to display the grain coarsening
temperature TGC, which occurs at the beginning of the upper curve, which represents the
average size of the secondary coarsening grains.[12] A vertical red line has been introduced into
this figure, such as to aid in the estimation of the grain coarsening temperature for the V-Ti-N
system.
Figure 20: Grain coarsening curves for the V-Ti-N steel systems[12]
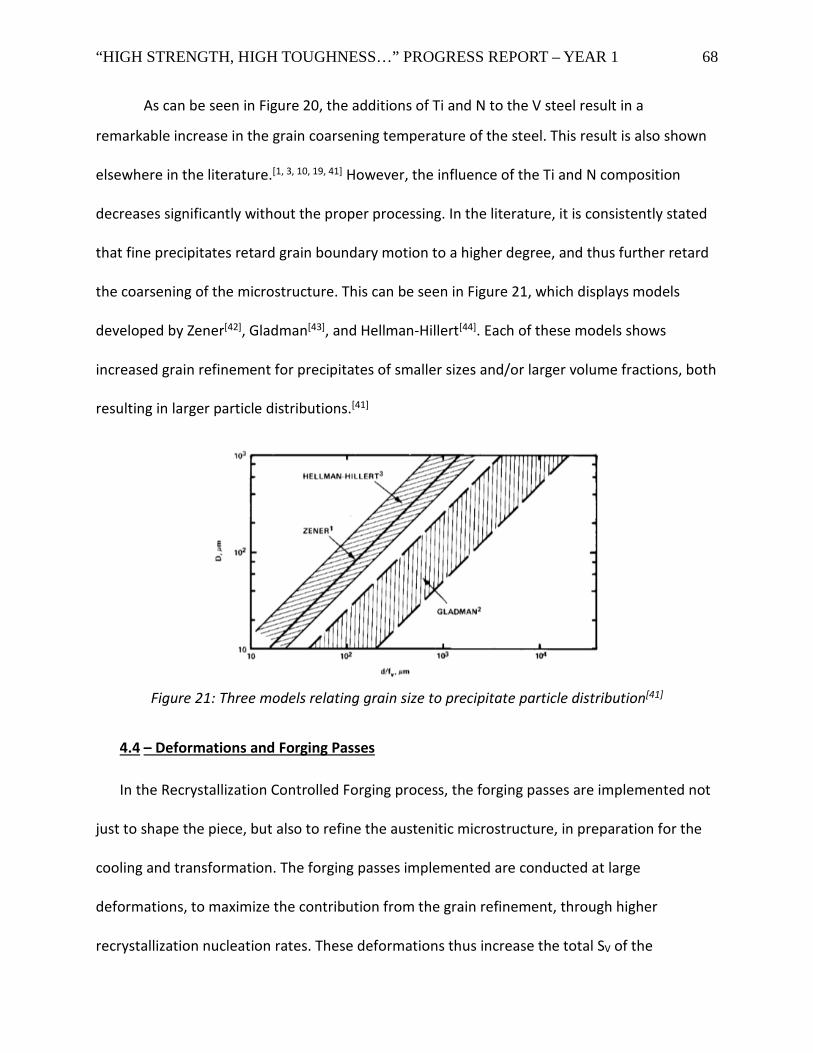
“HIGH STRENGTH, HIGH TOUGHNESS…” PROGRESS REPORT – YEAR 1 68
As can be seen in Figure 20, the additions of Ti and N to the V steel result in a
remarkable increase in the grain coarsening temperature of the steel. This result is also shown
elsewhere in the literature.[1, 3, 10, 19, 41] However, the influence of the Ti and N composition
decreases significantly without the proper processing. In the literature, it is consistently stated
that fine precipitates retard grain boundary motion to a higher degree, and thus further retard
the coarsening of the microstructure. This can be seen in Figure 21, which displays models
developed by Zener[42], Gladman[43], and Hellman-Hillert[44]. Each of these models shows
increased grain refinement for precipitates of smaller sizes and/or larger volume fractions, both
resulting in larger particle distributions.[41]
Figure 21: Three models relating grain size to precipitate particle distribution[41]
4.4 – Deformations and Forging Passes
In the Recrystallization Controlled Forging process, the forging passes are implemented not
just to shape the piece, but also to refine the austenitic microstructure, in preparation for the
cooling and transformation. The forging passes implemented are conducted at large
deformations, to maximize the contribution from the grain refinement, through higher
recrystallization nucleation rates. These deformations thus increase the total SV of the
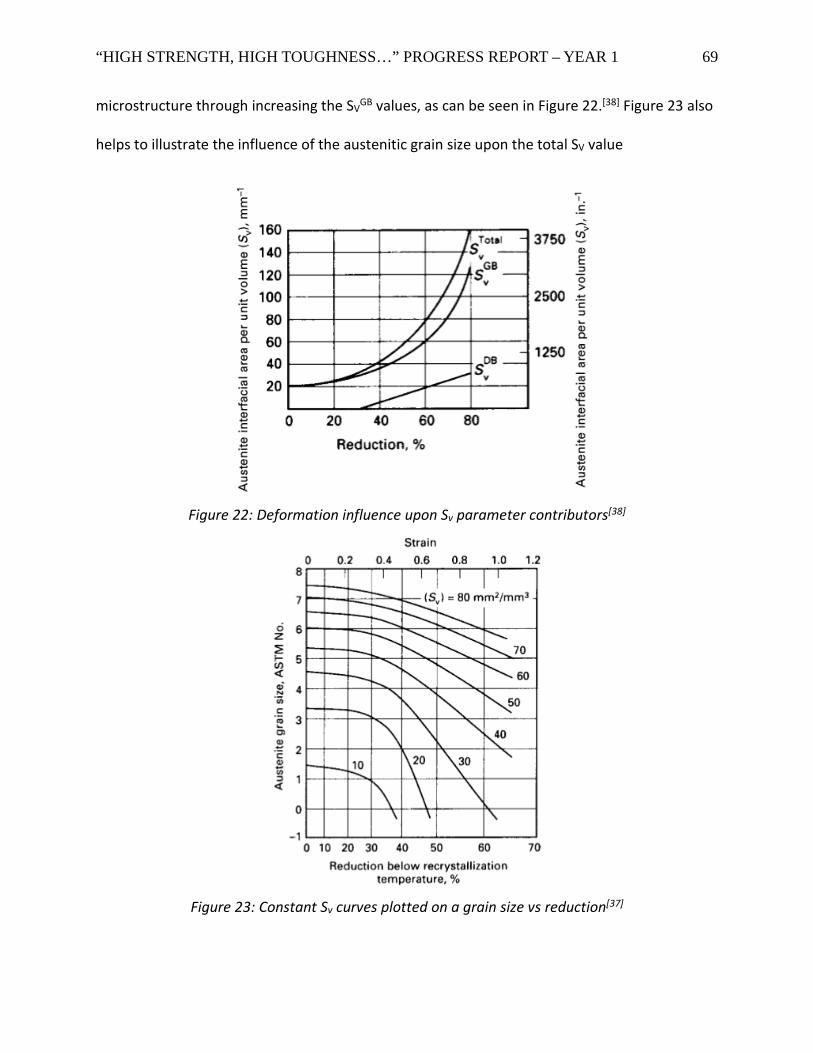
“HIGH STRENGTH, HIGH TOUGHNESS…” PROGRESS REPORT – YEAR 1 69
microstructure through increasing the SVGB values, as can be seen in Figure 22.[38] Figure 23 also
helps to illustrate the influence of the austenitic grain size upon the total SV value
Figure 22: Deformation influence upon Sv parameter contributors[38]
Figure 23: Constant Sv curves plotted on a grain size vs reduction[37]
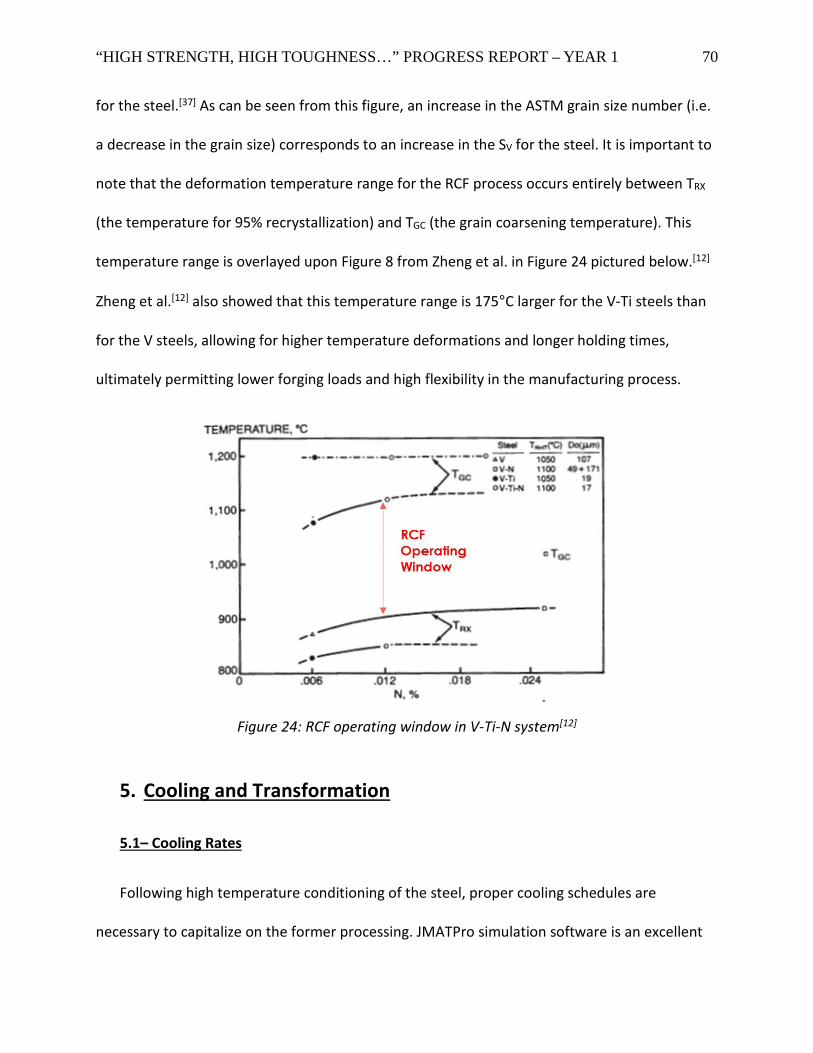
“HIGH STRENGTH, HIGH TOUGHNESS…” PROGRESS REPORT – YEAR 1 70
for the steel.[37] As can be seen from this figure, an increase in the ASTM grain size number (i.e.
a decrease in the grain size) corresponds to an increase in the SV for the steel. It is important to
note that the deformation temperature range for the RCF process occurs entirely between TRX
(the temperature for 95% recrystallization) and TGC (the grain coarsening temperature). This
temperature range is overlayed upon Figure 8 from Zheng et al. in Figure 24 pictured below.[12]
Zheng et al.[12] also showed that this temperature range is 175°C larger for the V-Ti steels than
for the V steels, allowing for higher temperature deformations and longer holding times,
ultimately permitting lower forging loads and high flexibility in the manufacturing process.
Figure 24: RCF operating window in V-Ti-N system[12]
5. Cooling and Transformation
5.1– Cooling Rates
Following high temperature conditioning of the steel, proper cooling schedules are
necessary to capitalize on the former processing. JMATPro simulation software is an excellent
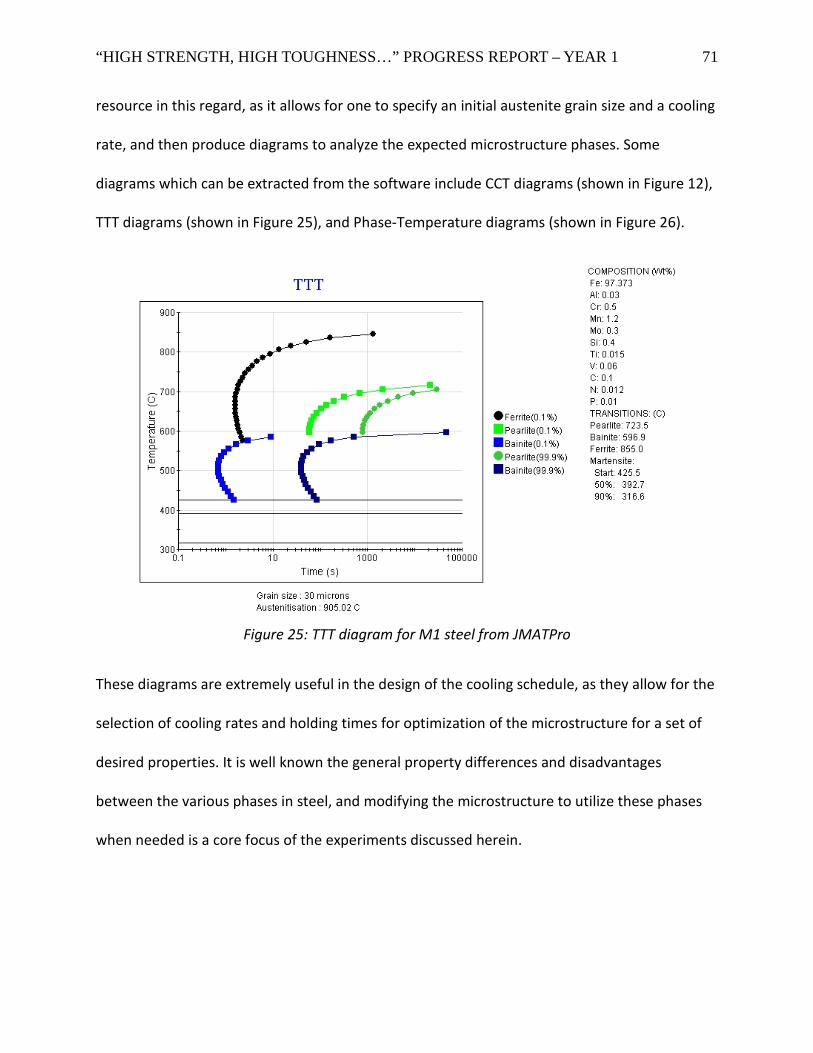
“HIGH STRENGTH, HIGH TOUGHNESS…” PROGRESS REPORT – YEAR 1 71
resource in this regard, as it allows for one to specify an initial austenite grain size and a cooling
rate, and then produce diagrams to analyze the expected microstructure phases. Some
diagrams which can be extracted from the software include CCT diagrams (shown in Figure 12),
TTT diagrams (shown in Figure 25), and Phase-Temperature diagrams (shown in Figure 26).
Figure 25: TTT diagram for M1 steel from JMATPro
These diagrams are extremely useful in the design of the cooling schedule, as they allow for the
selection of cooling rates and holding times for optimization of the microstructure for a set of
desired properties. It is well known the general property differences and disadvantages
between the various phases in steel, and modifying the microstructure to utilize these phases
when needed is a core focus of the experiments discussed herein.
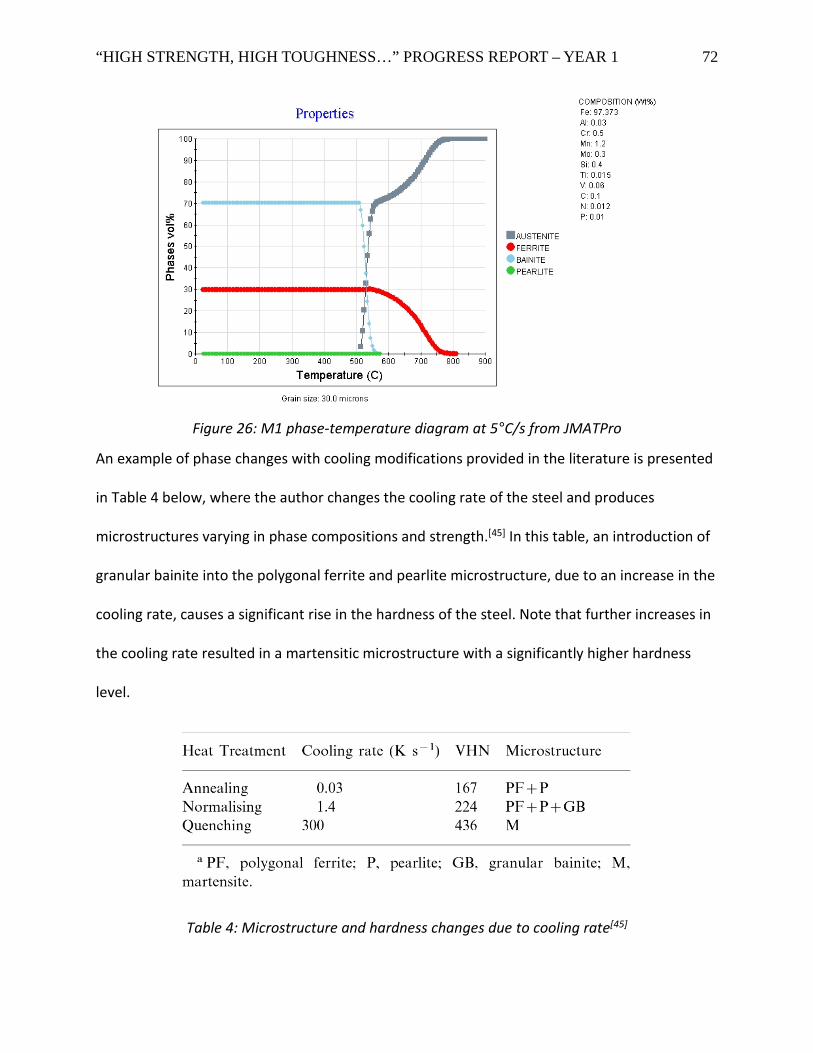
“HIGH STRENGTH, HIGH TOUGHNESS…” PROGRESS REPORT – YEAR 1 72
Figure 26: M1 phase-temperature diagram at 5°C/s from JMATPro
An example of phase changes with cooling modifications provided in the literature is presented
in Table 4 below, where the author changes the cooling rate of the steel and produces
microstructures varying in phase compositions and strength.[45] In this table, an introduction of
granular bainite into the polygonal ferrite and pearlite microstructure, due to an increase in the
cooling rate, causes a significant rise in the hardness of the steel. Note that further increases in
the cooling rate resulted in a martensitic microstructure with a significantly higher hardness
level.
Table 4: Microstructure and hardness changes due to cooling rate[45]
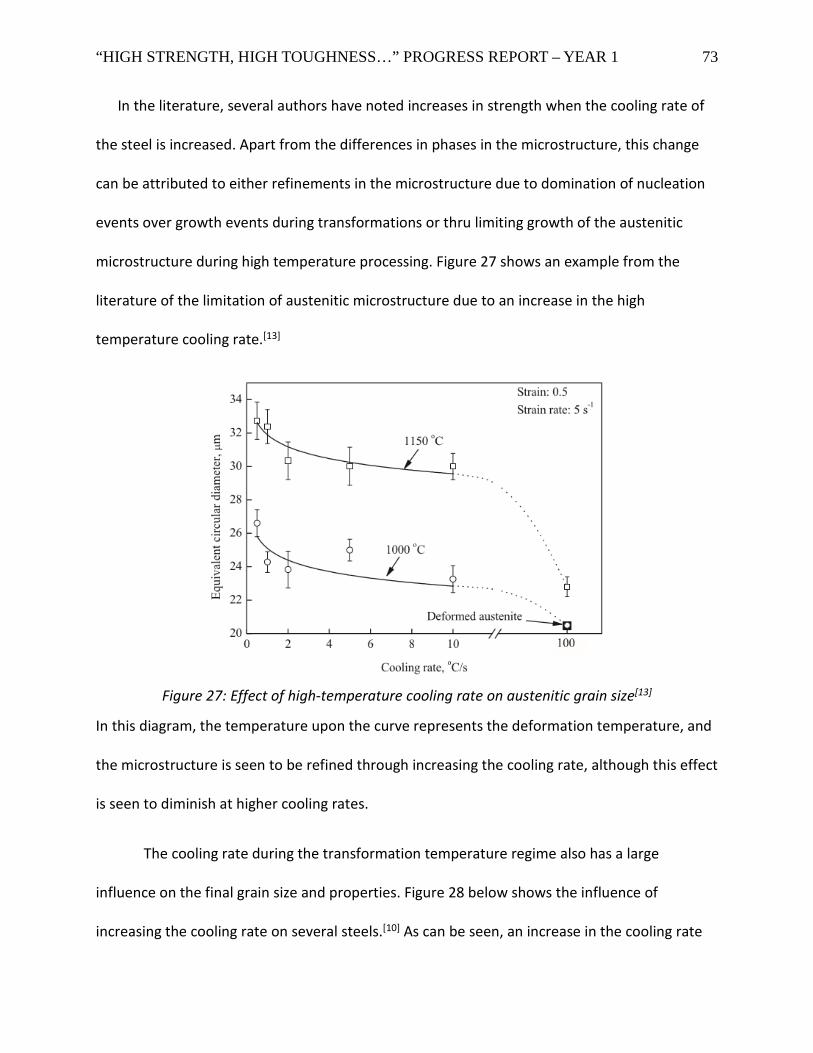
“HIGH STRENGTH, HIGH TOUGHNESS…” PROGRESS REPORT – YEAR 1 73
In the literature, several authors have noted increases in strength when the cooling rate of
the steel is increased. Apart from the differences in phases in the microstructure, this change
can be attributed to either refinements in the microstructure due to domination of nucleation
events over growth events during transformations or thru limiting growth of the austenitic
microstructure during high temperature processing. Figure 27 shows an example from the
literature of the limitation of austenitic microstructure due to an increase in the high
temperature cooling rate.[13]
Figure 27: Effect of high-temperature cooling rate on austenitic grain size[13]
In this diagram, the temperature upon the curve represents the deformation temperature, and
the microstructure is seen to be refined through increasing the cooling rate, although this effect
is seen to diminish at higher cooling rates.
The cooling rate during the transformation temperature regime also has a large
influence on the final grain size and properties. Figure 28 below shows the influence of
increasing the cooling rate on several steels.[10] As can be seen, an increase in the cooling rate
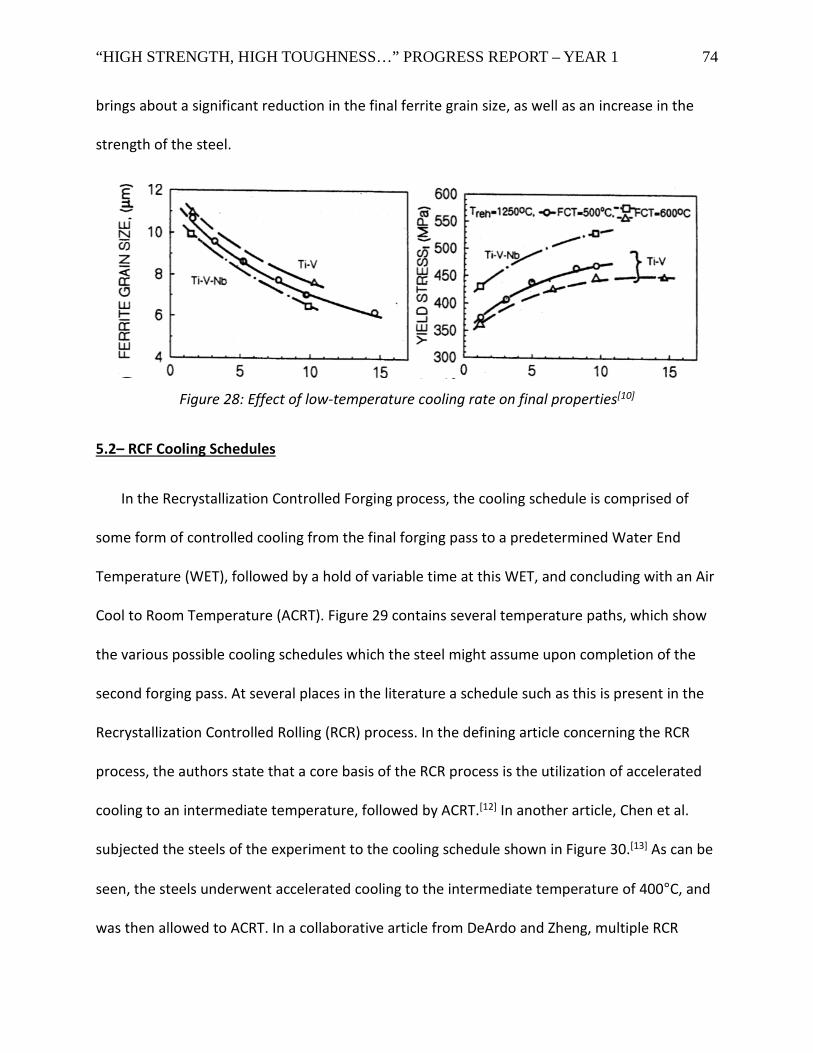
“HIGH STRENGTH, HIGH TOUGHNESS…” PROGRESS REPORT – YEAR 1 74
brings about a significant reduction in the final ferrite grain size, as well as an increase in the
strength of the steel.
Figure 28: Effect of low-temperature cooling rate on final properties[10]
5.2– RCF Cooling Schedules
In the Recrystallization Controlled Forging process, the cooling schedule is comprised of
some form of controlled cooling from the final forging pass to a predetermined Water End
Temperature (WET), followed by a hold of variable time at this WET, and concluding with an Air
Cool to Room Temperature (ACRT). Figure 29 contains several temperature paths, which show
the various possible cooling schedules which the steel might assume upon completion of the
second forging pass. At several places in the literature a schedule such as this is present in the
Recrystallization Controlled Rolling (RCR) process. In the defining article concerning the RCR
process, the authors state that a core basis of the RCR process is the utilization of accelerated
cooling to an intermediate temperature, followed by ACRT.[12] In another article, Chen et al.
subjected the steels of the experiment to the cooling schedule shown in Figure 30.[13] As can be
seen, the steels underwent accelerated cooling to the intermediate temperature of 400°C, and
was then allowed to ACRT. In a collaborative article from DeArdo and Zheng, multiple RCR
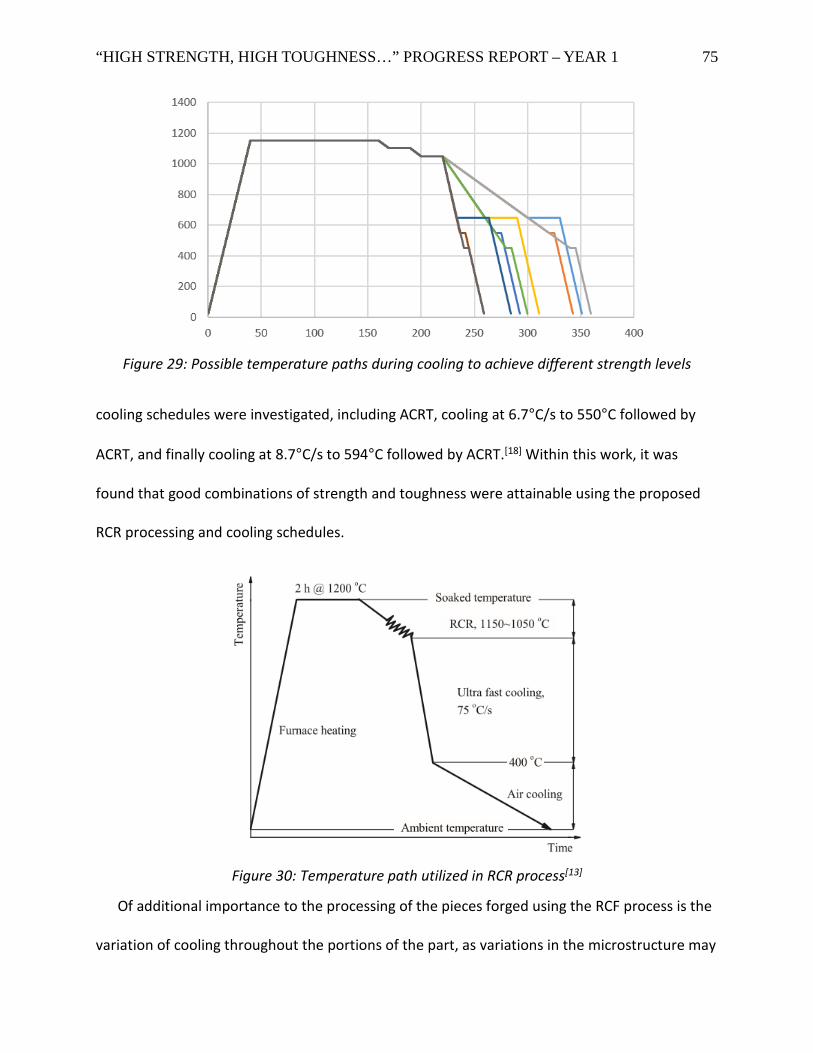
“HIGH STRENGTH, HIGH TOUGHNESS…” PROGRESS REPORT – YEAR 1 75
Figure 29: Possible temperature paths during cooling to achieve different strength levels
cooling schedules were investigated, including ACRT, cooling at 6.7°C/s to 550°C followed by
ACRT, and finally cooling at 8.7°C/s to 594°C followed by ACRT.[18] Within this work, it was
found that good combinations of strength and toughness were attainable using the proposed
RCR processing and cooling schedules.
Figure 30: Temperature path utilized in RCR process[13]
Of additional importance to the processing of the pieces forged using the RCF process is the
variation of cooling throughout the portions of the part, as variations in the microstructure may
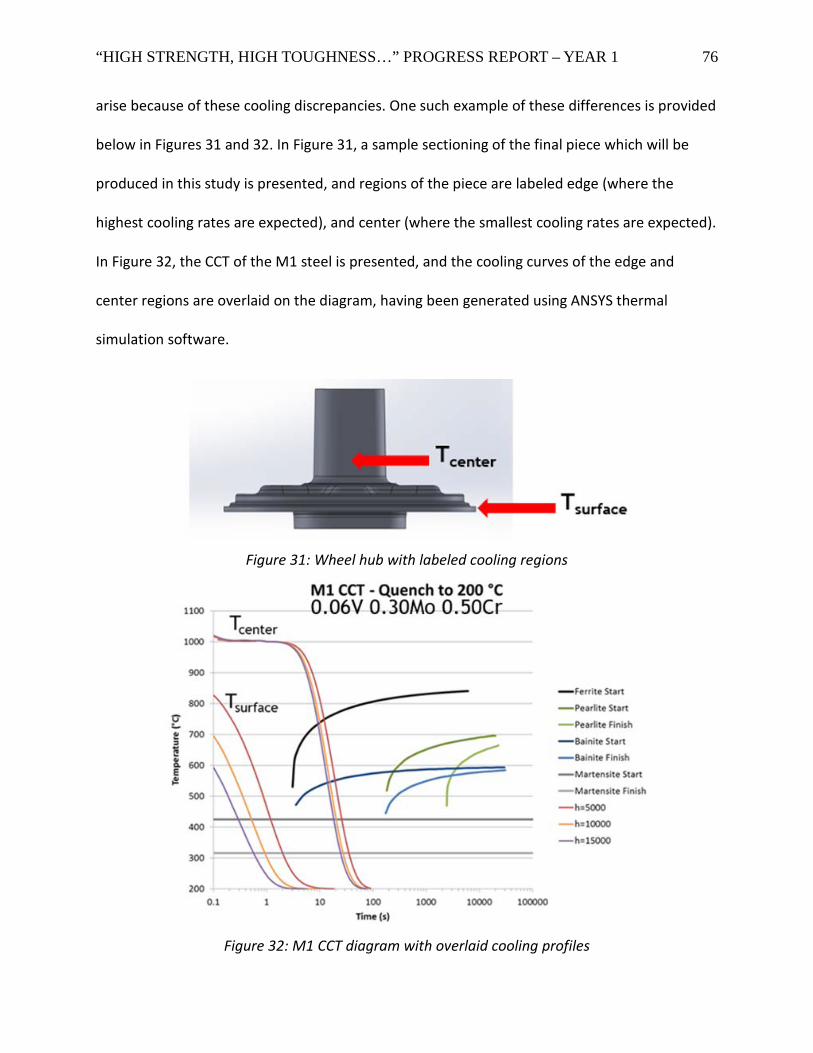
“HIGH STRENGTH, HIGH TOUGHNESS…” PROGRESS REPORT – YEAR 1 76
arise because of these cooling discrepancies. One such example of these differences is provided
below in Figures 31 and 32. In Figure 31, a sample sectioning of the final piece which will be
produced in this study is presented, and regions of the piece are labeled edge (where the
highest cooling rates are expected), and center (where the smallest cooling rates are expected).
In Figure 32, the CCT of the M1 steel is presented, and the cooling curves of the edge and
center regions are overlaid on the diagram, having been generated using ANSYS thermal
simulation software.
Figure 31: Wheel hub with labeled cooling regions
Figure 32: M1 CCT diagram with overlaid cooling profiles
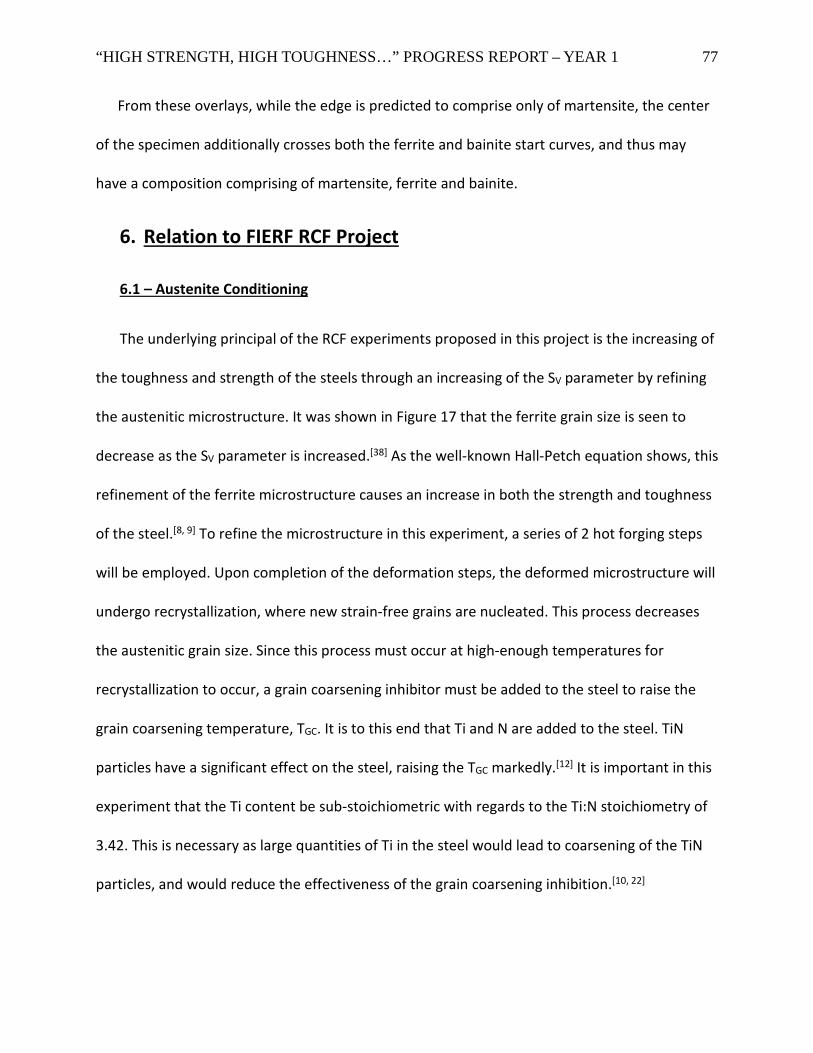
“HIGH STRENGTH, HIGH TOUGHNESS…” PROGRESS REPORT – YEAR 1 77
From these overlays, while the edge is predicted to comprise only of martensite, the center
of the specimen additionally crosses both the ferrite and bainite start curves, and thus may
have a composition comprising of martensite, ferrite and bainite.
6. Relation to FIERF RCF Project
6.1 – Austenite Conditioning
The underlying principal of the RCF experiments proposed in this project is the increasing of
the toughness and strength of the steels through an increasing of the SV parameter by refining
the austenitic microstructure. It was shown in Figure 17 that the ferrite grain size is seen to
decrease as the SV parameter is increased.[38] As the well-known Hall-Petch equation shows, this
refinement of the ferrite microstructure causes an increase in both the strength and toughness
of the steel.[8, 9] To refine the microstructure in this experiment, a series of 2 hot forging steps
will be employed. Upon completion of the deformation steps, the deformed microstructure will
undergo recrystallization, where new strain-free grains are nucleated. This process decreases
the austenitic grain size. Since this process must occur at high-enough temperatures for
recrystallization to occur, a grain coarsening inhibitor must be added to the steel to raise the
grain coarsening temperature, TGC. It is to this end that Ti and N are added to the steel. TiN
particles have a significant effect on the steel, raising the TGC markedly.[12] It is important in this
experiment that the Ti content be sub-stoichiometric with regards to the Ti:N stoichiometry of
3.42. This is necessary as large quantities of Ti in the steel would lead to coarsening of the TiN
particles, and would reduce the effectiveness of the grain coarsening inhibition.[10, 22]
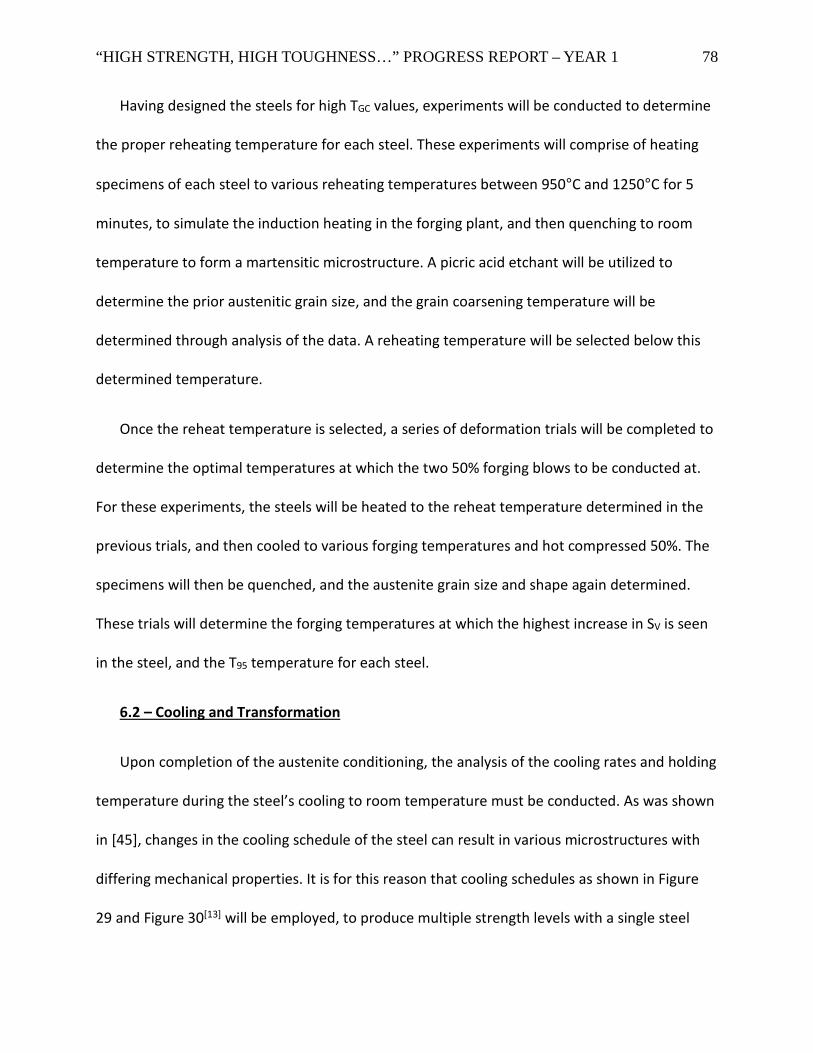
“HIGH STRENGTH, HIGH TOUGHNESS…” PROGRESS REPORT – YEAR 1 78
Having designed the steels for high TGC values, experiments will be conducted to determine
the proper reheating temperature for each steel. These experiments will comprise of heating
specimens of each steel to various reheating temperatures between 950°C and 1250°C for 5
minutes, to simulate the induction heating in the forging plant, and then quenching to room
temperature to form a martensitic microstructure. A picric acid etchant will be utilized to
determine the prior austenitic grain size, and the grain coarsening temperature will be
determined through analysis of the data. A reheating temperature will be selected below this
determined temperature.
Once the reheat temperature is selected, a series of deformation trials will be completed to
determine the optimal temperatures at which the two 50% forging blows to be conducted at.
For these experiments, the steels will be heated to the reheat temperature determined in the
previous trials, and then cooled to various forging temperatures and hot compressed 50%. The
specimens will then be quenched, and the austenite grain size and shape again determined.
These trials will determine the forging temperatures at which the highest increase in SV is seen
in the steel, and the T95 temperature for each steel.
6.2 – Cooling and Transformation
Upon completion of the austenite conditioning, the analysis of the cooling rates and holding
temperature during the steel’s cooling to room temperature must be conducted. As was shown
in [45], changes in the cooling schedule of the steel can result in various microstructures with
differing mechanical properties. It is for this reason that cooling schedules as shown in Figure
29 and Figure 30[13] will be employed, to produce multiple strength levels with a single steel
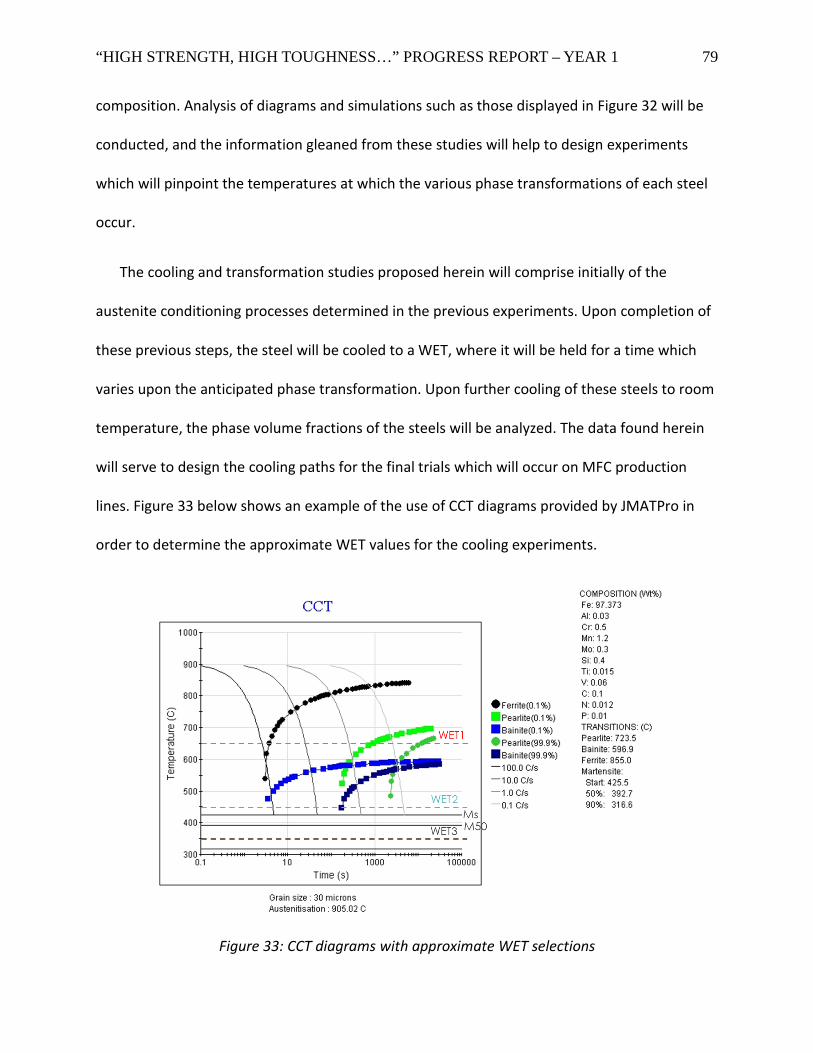
“HIGH STRENGTH, HIGH TOUGHNESS…” PROGRESS REPORT – YEAR 1 79
composition. Analysis of diagrams and simulations such as those displayed in Figure 32 will be
conducted, and the information gleaned from these studies will help to design experiments
which will pinpoint the temperatures at which the various phase transformations of each steel
occur.
The cooling and transformation studies proposed herein will comprise initially of the
austenite conditioning processes determined in the previous experiments. Upon completion of
these previous steps, the steel will be cooled to a WET, where it will be held for a time which
varies upon the anticipated phase transformation. Upon further cooling of these steels to room
temperature, the phase volume fractions of the steels will be analyzed. The data found herein
will serve to design the cooling paths for the final trials which will occur on MFC production
lines. Figure 33 below shows an example of the use of CCT diagrams provided by JMATPro in
order to determine the approximate WET values for the cooling experiments.
Figure 33: CCT diagrams with approximate WET selections

“HIGH STRENGTH, HIGH TOUGHNESS…” PROGRESS REPORT – YEAR 1 80
6.3 – Strengthening Employed
Multiple strengthening mechanisms are employed within the steels in the current
experiment. Grain boundary strengthening is by far the most prevalent strengthening
mechanism, as the foremost purpose of the project is the refinement of the microstructure of
the steel, to amplify physical properties via the Hall-Petch equation. In addition, the benefit to
toughness of fine austenite grains is also recognized. However, several other strengthening
mechanisms are present in the steels.
The V presence in the steel primarily serves to provide a source of precipitation
strengthening in the steel. Because the steel is substoichiometric in the Ti:N ratio, complete
precipitation of TiN particles leaves excess N for the precipitation of VN, which precipitates at a
lower temperature than TiN, and has significant precipitation hardening effects.[1] Additionally,
upon the depletion of N in the steel, the V further precipitates as VC, increasing the
precipitation hardening increment furthermore. Precipitation hardening, however, also serves
to decrease the toughness of the steel[25, 26], and thus the current experiments primarily utilizes
toughness favoring grain boundary strengthening over, or at least in conjunction with, the
detrimental precipitation hardening effects.
A third strengthening mechanism is present in the steels’ designs in the form of solute
strengthening. While C is the most prevalent of solute strengthening additions, many other
elements are added for this purpose as well. Figure 14[34] displays quite well the strengthening
effect of additions of many of the elements in the current steels’ designs.
“HIGH STRENGTH, HIGH TOUGHNESS…” PROGRESS REPORT – YEAR 1 81
Apart from the strengthening mechanisms previously mentioned, the most prevalent
remaining mechanism is dislocation strengthening. This strengthening mechanism is generally
accrued through the deformation passes of the steel. However, this mechanism is not present
in notable quantities in the steels present herein, because the high temperatures at which the
deformations occur. The recrystallization of the microstructure following the deformation
nucleates strain-free grains[39], and thus eliminates the dislocations from which the dislocation
strengthening would derive. However, the formation of bainite and/or martensite will result in
high dislocation densities leading to the possibility of very high strength being attained in the
final forging.
“HIGH STRENGTH, HIGH TOUGHNESS…” PROGRESS REPORT – YEAR 1 82
Literature Review References
[1] A. J. DeArdo and M. Hua, "Some Comments on the Physical Metallurgy of HSLA Steels Containing Vanadium and Nitrogen," in Materials Science and Technology 2014, Warrendale, 2014.
[2] M. Hua, X. Liang and A. J. DeArdo, "Microalloyed Steels for High-Strength Forgings," in ASM International, Metals Park, 1986.
[3] T. Siwecki, "Modelling of microstructure evolution during recrystallization controlled rolling," ISIJ international, vol. 32, no. 3, pp. 368-376, 1992.
[4] A. J. DeArdo, C. I. Garcia and M. Hua, "Multi-Phase, Microalloyed Bar Steels for Premium Forging Performance," in AIM International Conference Hot Forming of Steels & Product Properties - Associazione Italiana di Metallurgia, Grado, 2009.
[5] F. B. Pickering, "Physical Metallurgy and the design of the steels," Applied Science Publishers, pp. 1-88, 1978.
[6] G. E. Dieter and D. J. Bacon, Mechanical Metallurgy, vol. 3, New York: McGraw-Hill, 1986.
[7] E. Orowan, "Discussion in The Symposium on Internal Stresses in Metals and Alloys, Inst.," in Metals, London, 1948.
[8] E. O. Hall, "The deformation and ageing of mild steel: III discussion of results," in Proceedings of the Physical Society, Cambridge, 1951.
[9] N. J. Petch, "The cleavage strength of polycrystals," J. Iron and Steel Inst., p. 174 .
[10] T. Siwecki and G. Engberg, "Recrystallization controlled rolling of steels," Thermo-Mechanical Processing in Theory, Modelling & Practice[TMP] exp 2, pp. 121-144., 1996.
[11] H.-l. Wei, G. Liu, H. Zhao and M. Zhang, "Effect of carbon content on hot deformation behaviors of vanadium microalloyed steels," Materials Science and Engineering: A 596, pp. 112-120, 2014.
[12] Y. Z. Zheng, A. J. DeArdo, R. M. Fix and G. Fitzsimons, "Achieving Grain Refinement Through Recrystallization-Controlled Rolling and Controlled Cooling in V--Ti--N Microalloyed Steels," in HSLA Steels, Technology and Applications, Metals Park, 1983.
[13] J. Chen, M. Y. Lv, S. Tang, Z. Y. Liu and G. D. Wang, "Low-carbon bainite steel with high strength and toughness processed by recrystallization controlled rolling and ultra fast cooling (RCR+ UFC)," ISIJ International, vol. 54, no. 12, pp. 2926-2932.
[14] K. F. Al-Hajeri, "The grain coarsening and subsequent transformation of austenite in the HSLA steel during high temperature thermomechanical processing," University of Pittsburgh, 2005.
“HIGH STRENGTH, HIGH TOUGHNESS…” PROGRESS REPORT – YEAR 1 83
[15] S. F. Medina, M. Gómez and L. Rancel, "Grain refinement by intragranular nucleation of ferrite in a high nitrogen content vanadium microalloyed steel," Scripta Materialia, vol. 58, no. 12, pp. 1110-1113, 2008.
[16] L. Cheng and K. M. Wu, "New insights into intragranular ferrite in a low-carbon low-alloy steel," Acta Materialia, vol. 57, no. 13, pp. 3754-3762, 2009.
[17] T. Pan, Z. G. Yang, Z. C, B. B. Z and H. S. Fang, "Kinetics and mechanisms of intragranular ferrite nucleation on non-metallic inclusions in low carbon steels," Materials Science and Engineering: A 438, pp. 1128-1132, 2006.
[18] Y. Z. Zheng, G. T. Tang and Z. H. Lin, "Precipitation, Recrystallization and Transformation in V--Ti--N Microalloyed Steels," in HSLA Steels: Processing, Properties and Applications, Warrendale, 1990.
[19] M. Arribas, B. López and J. M. Rodriguez-Ibabe, "Additional grain refinement in recrystallization controlled rolling of Ti-microalloyed steels processed by near-net-shape casting technology," Materials Science and Engineering: A, vol. 485, no. 1, pp. 383-394, 2008.
[20] M. T. Nagata, J. G. Speer and D. K. Matlock, "Titanium nitride precipitation behavior in thin-slab cast high-strength low-alloy steels," Metallurgical and Materials Transactions A, vol. 33, no. 10, pp. 3099-3110, 2002.
[21] M. I. Vega, S. F. Medina, A. Quispe and M. Gomez, "Influence of TiN particle precipitation state on static recrystallisation in structural steels," ISIJ international, vol. 45, no. 12, pp. 1878-1886, 2005.
[22] F. B. Pickering, "Titanium nitride technology," in 35th Mechanical Working and Steel Processing Conference, Warrendale, 1993.
[23] S. F. Medina, M. Chapa, P. Valles and A. Quispe, "Influence of Ti and N contents on austenite grain control and precipitate size in structural steels," ISIJ international, vol. 39, no. 9, pp. 930-936, 1999.
[24] R. M. Fix, Y. Z. Zheng and A. J. DeArdo, "Mechanical Properties of V--Ti Microalloyed Steels Subject to Plate Rolling Simulations Utilizing Recrystallization Controlled Rolling.(Extended Abstract).," in HSLA Steels'85, Russell Township, 1985.
[25] D. Litvinenko, "Development of Vanadium-Nitride-Strengthened Low-Alloy Steels for Large-Diameter Gas Pipelines," in Proc. Conf. on Microalloying 75, Metals Park, 1977.
[26] S. Shanmugam, M. Tanniru and R. D. K. Misra, "Precipitation in V bearing microalloyed steel containing low concentrations of Ti and Nb," Materials science and technology, vol. 21, no. 8, pp. 883-892, 2005.
[27] T. Gladman, "Physical metallurgy of microalloyed steels," The Institute of Materials, 1997.
[28] S. Shanmugam, M. Tanniru and R. D. K. Misra, "Microalloyed V–Nb–Ti and V steels Part 2–Precipitation behaviour during processing of structural beams," Materials science and technology, vol. 21, no. 2, pp. 165-177, 2005.
“HIGH STRENGTH, HIGH TOUGHNESS…” PROGRESS REPORT – YEAR 1 84
[29] M. Tamura, H. Lida, H. Esaka and K. Shinozuka, "Solubility product of VN in austenite of high Cr heat resistant steel," ISIJ international, vol. 43, no. 11, pp. 1807-1813, 2003.
[30] K. Inoue, I. Ohnuma, H. Ohtani and K. Ishida, "Solubility product of TiN in austenite," ISIJ international, vol. 38, no. 9, pp. 991-997, 1998.
[31] S. H. M. Anijdan, A. Rezaeian and S. Yue, "The effect of chemical composition and austenite conditioning on the transformation behavior of microalloyed steels," Materials Characterization 63, pp. 27-38, 2012.
[32] J. Calvo, I. H. Jung, A. M. Elwazri, D. Bai and S. Yue, "Influence of the chemical composition on transformation behaviour of low carbon microalloyed steels," Materials Science and Engineering: A, vol. 520, no. 1, pp. 90-96, 2009.
[33] N. Radović, A. Koprivica, D. Glisic and F. Abdunnaser, "Influence of Cr, Mn and Mo on structure and properties of V microalloyed medium carbon forging steels," Metalurgija, vol. 16, no. 1, pp. 1-9, 2010.
[34] M. Maalekian, "The Effects of Alloying Elements on Steels (I)," Institut für Werkstoffkunde, Schweißtechnik und Spanlose Formgebungsverfahren, pp. 1-36, 2010.
[35] M. Gómez, R. Lucía and S. F. ". Medina, "Effects of aluminium and nitrogen on static recrystallisation in V-microalloyed steels," Materials Science and Engineering: A, vol. 506, no. 1, pp. 165-173, 2009.
[36] E. E. Underwood, "Surface area and length in volume," QUANTITATIVE MICROSCOPY, pp. 77-127, 1968.
[37] I. Kozasu, C. Ouchi, T. Sampei and T. Okita, "Hot rolling as a high-temperature thermo-mechanical process," in Proc. Conf. on Microalloying 75, Metals Park, 1977.
[38] G. R. Speich, L. J. Cuddy, C. R. Gordon and A. J. DeArdo, "Phase transformations in ferrous alloys," in TMS-AIME, Warrendale, 1984.
[39] G. E. Dieter, H. A. Kuhn and S. L. Semiatin, Handbook of workability and process design, ASM international, 2003.
[40] T. Gladman, "On the theory of the effect of precipitate particles on grain growth in metals," Proceedings of the Royal Society of London A: Mathematical, Physical and Engineering Sciences, vol. 294, no. 1438, 1966.
[41] L. J. Cuddy and J. C. Raley, "Austenite grain coarsening in microalloyed steels," Metallurgical Transactions A, vol. 14, no. 10, pp. 1989-1995, 1983.
[42] C. Zener, "Phase transformations in steel," Transactions of the Metallurgical Society, AIME 167, pp. 550-559, 1946.

“HIGH STRENGTH, HIGH TOUGHNESS…” PROGRESS REPORT – YEAR 1 85
[43] P. Hellman and M. Hillert, "Effect of second-phase particles on grain growth," Scandinavian Journal of Metallurgy, vol. 4, no. 5, pp. 211-219, 1975.
[44] T. Gladman, "On the theory of the effect of precipitate particles on grain growth in metals," Proceedings of the Royal Society of London A: Mathematical, Physical and Engineering Sciences, vol. 294, no. 1438, 1966.
[45] P. C. M. Rodrigues, E. V. Pereloma and D. B. Santos, "Mechanical properities of an HSLA bainitic steel subjected to controlled rolling with accelerated cooling," Materials Science and Engineering: A, vol. 283, no. 1, pp. 136-143, 2000.
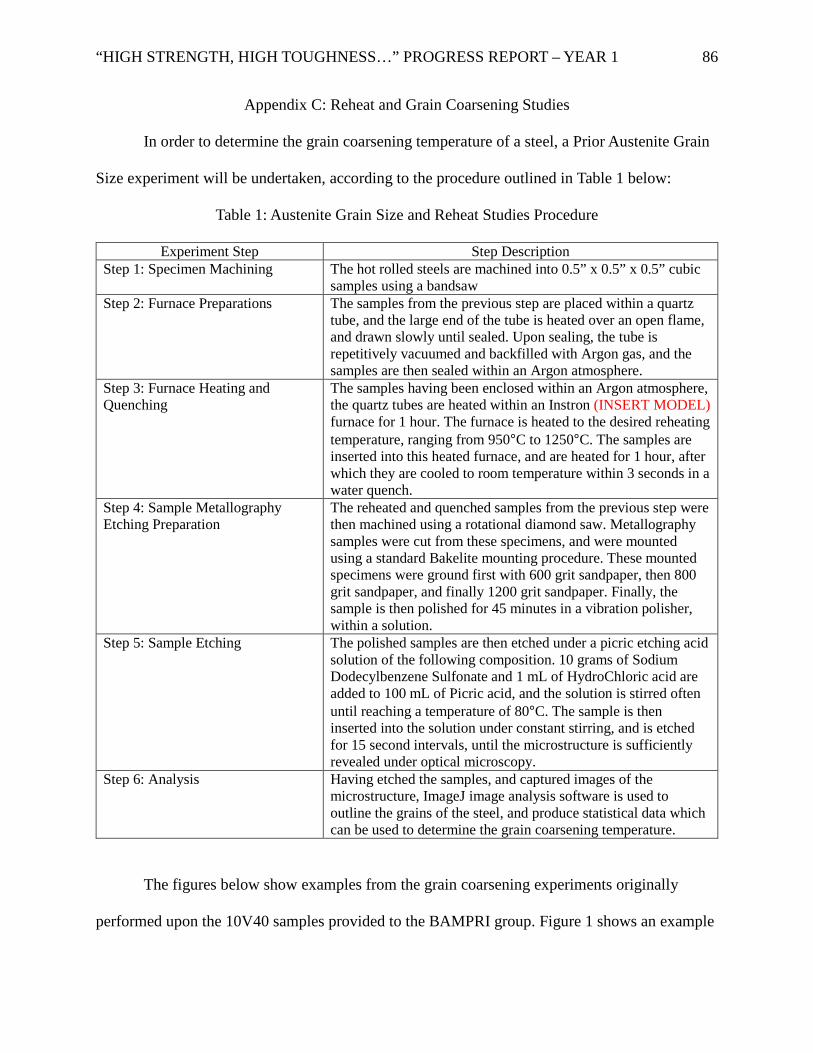
“HIGH STRENGTH, HIGH TOUGHNESS…” PROGRESS REPORT – YEAR 1 86
Appendix C: Reheat and Grain Coarsening Studies
In order to determine the grain coarsening temperature of a steel, a Prior Austenite Grain
Size experiment will be undertaken, according to the procedure outlined in Table 1 below:
Table 1: Austenite Grain Size and Reheat Studies Procedure
Experiment Step Step Description Step 1: Specimen Machining The hot rolled steels are machined into 0.5” x 0.5” x 0.5” cubic
samples using a bandsaw Step 2: Furnace Preparations The samples from the previous step are placed within a quartz
tube, and the large end of the tube is heated over an open flame, and drawn slowly until sealed. Upon sealing, the tube is repetitively vacuumed and backfilled with Argon gas, and the samples are then sealed within an Argon atmosphere.
Step 3: Furnace Heating and Quenching
The samples having been enclosed within an Argon atmosphere, the quartz tubes are heated within an Instron (INSERT MODEL) furnace for 1 hour. The furnace is heated to the desired reheating temperature, ranging from 950°C to 1250°C. The samples are inserted into this heated furnace, and are heated for 1 hour, after which they are cooled to room temperature within 3 seconds in a water quench.
Step 4: Sample Metallography Etching Preparation
The reheated and quenched samples from the previous step were then machined using a rotational diamond saw. Metallography samples were cut from these specimens, and were mounted using a standard Bakelite mounting procedure. These mounted specimens were ground first with 600 grit sandpaper, then 800 grit sandpaper, and finally 1200 grit sandpaper. Finally, the sample is then polished for 45 minutes in a vibration polisher, within a solution.
Step 5: Sample Etching The polished samples are then etched under a picric etching acid solution of the following composition. 10 grams of Sodium Dodecylbenzene Sulfonate and 1 mL of HydroChloric acid are added to 100 mL of Picric acid, and the solution is stirred often until reaching a temperature of 80°C. The sample is then inserted into the solution under constant stirring, and is etched for 15 second intervals, until the microstructure is sufficiently revealed under optical microscopy.
Step 6: Analysis Having etched the samples, and captured images of the microstructure, ImageJ image analysis software is used to outline the grains of the steel, and produce statistical data which can be used to determine the grain coarsening temperature.
The figures below show examples from the grain coarsening experiments originally
performed upon the 10V40 samples provided to the BAMPRI group. Figure 1 shows an example
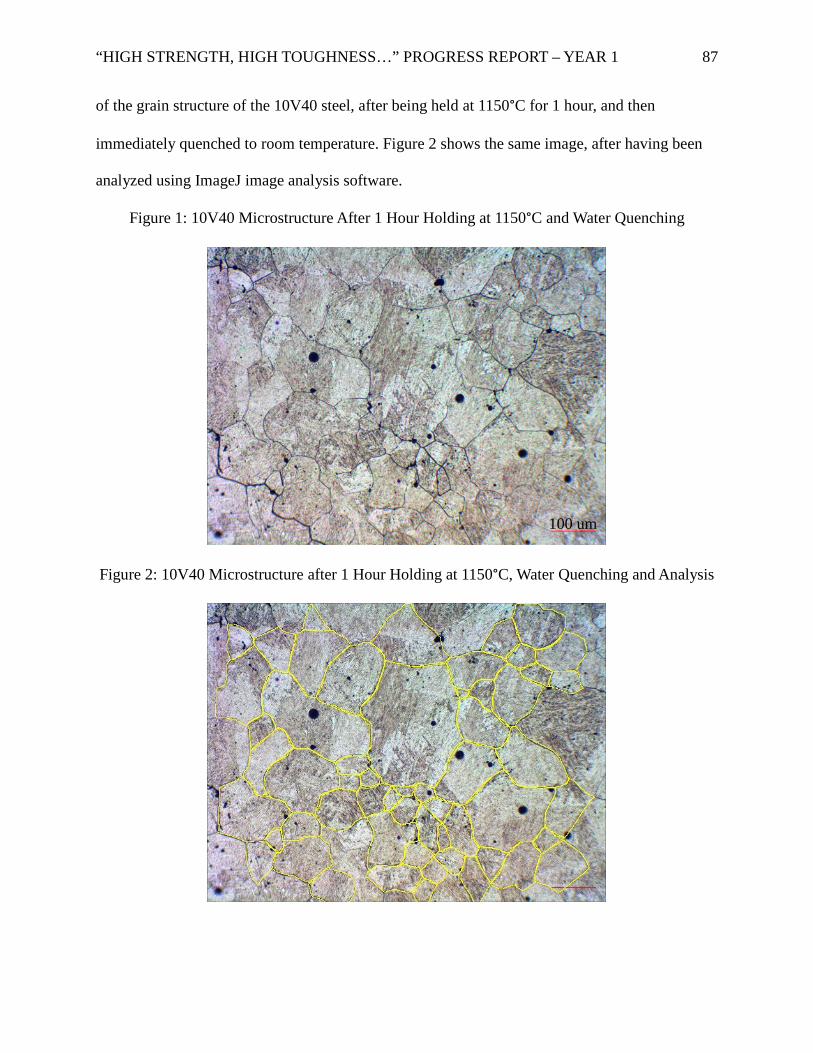
“HIGH STRENGTH, HIGH TOUGHNESS…” PROGRESS REPORT – YEAR 1 87
of the grain structure of the 10V40 steel, after being held at 1150°C for 1 hour, and then
immediately quenched to room temperature. Figure 2 shows the same image, after having been
analyzed using ImageJ image analysis software.
Figure 1: 10V40 Microstructure After 1 Hour Holding at 1150°C and Water Quenching
Figure 2: 10V40 Microstructure after 1 Hour Holding at 1150°C, Water Quenching and Analysis
100 um
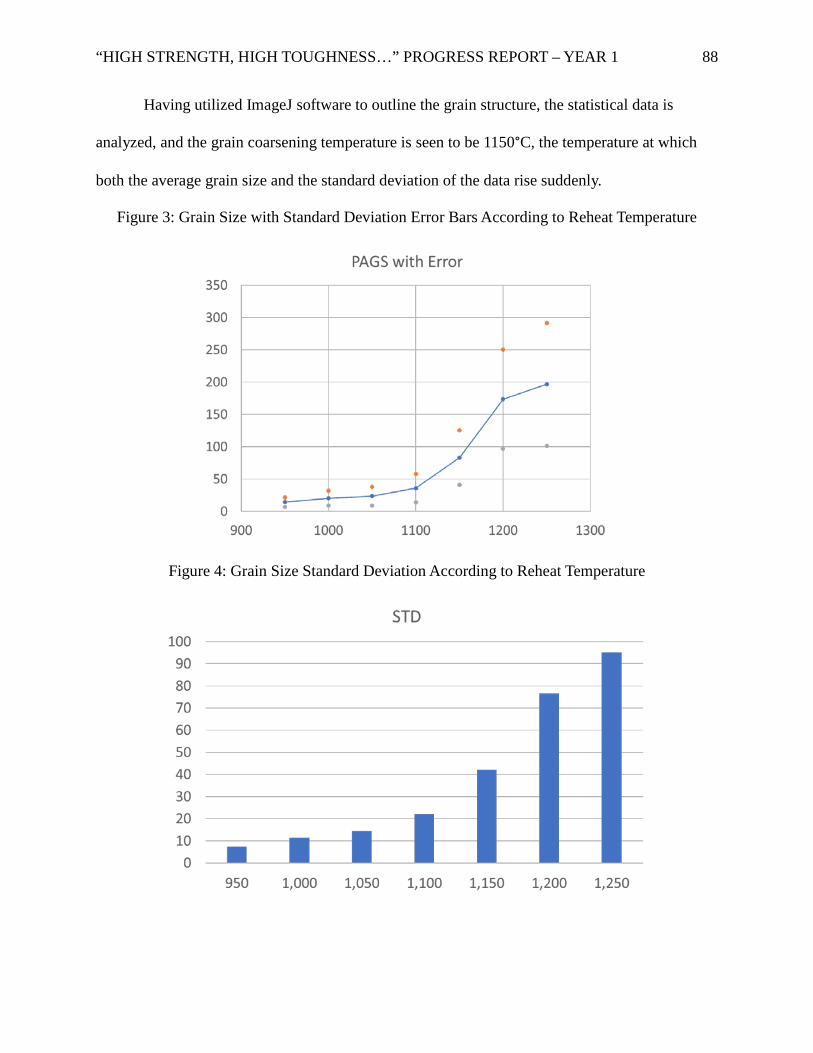
“HIGH STRENGTH, HIGH TOUGHNESS…” PROGRESS REPORT – YEAR 1 88
Having utilized ImageJ software to outline the grain structure, the statistical data is
analyzed, and the grain coarsening temperature is seen to be 1150°C, the temperature at which
both the average grain size and the standard deviation of the data rise suddenly.
Figure 3: Grain Size with Standard Deviation Error Bars According to Reheat Temperature
Figure 4: Grain Size Standard Deviation According to Reheat Temperature
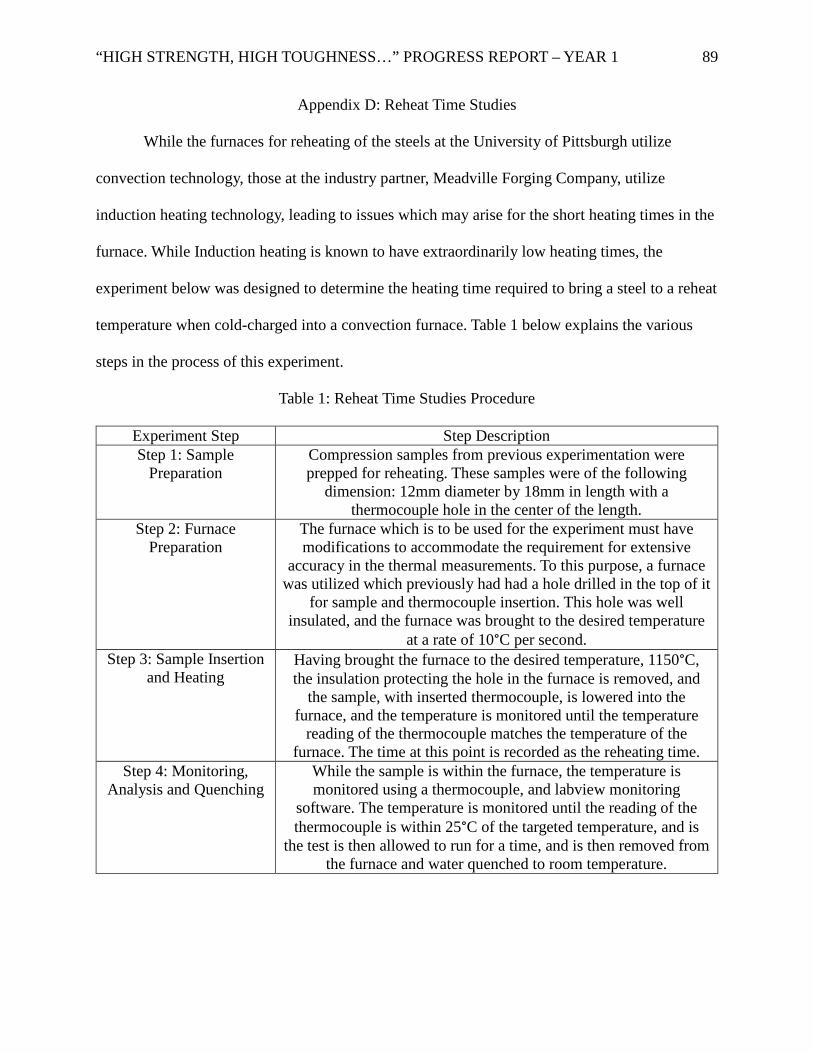
“HIGH STRENGTH, HIGH TOUGHNESS…” PROGRESS REPORT – YEAR 1 89
Appendix D: Reheat Time Studies
While the furnaces for reheating of the steels at the University of Pittsburgh utilize
convection technology, those at the industry partner, Meadville Forging Company, utilize
induction heating technology, leading to issues which may arise for the short heating times in the
furnace. While Induction heating is known to have extraordinarily low heating times, the
experiment below was designed to determine the heating time required to bring a steel to a reheat
temperature when cold-charged into a convection furnace. Table 1 below explains the various
steps in the process of this experiment.
Table 1: Reheat Time Studies Procedure
Experiment Step Step Description Step 1: Sample
Preparation Compression samples from previous experimentation were prepped for reheating. These samples were of the following
dimension: 12mm diameter by 18mm in length with a thermocouple hole in the center of the length.
Step 2: Furnace Preparation
The furnace which is to be used for the experiment must have modifications to accommodate the requirement for extensive
accuracy in the thermal measurements. To this purpose, a furnace was utilized which previously had had a hole drilled in the top of it
for sample and thermocouple insertion. This hole was well insulated, and the furnace was brought to the desired temperature
at a rate of 10°C per second. Step 3: Sample Insertion
and Heating Having brought the furnace to the desired temperature, 1150°C, the insulation protecting the hole in the furnace is removed, and
the sample, with inserted thermocouple, is lowered into the furnace, and the temperature is monitored until the temperature
reading of the thermocouple matches the temperature of the furnace. The time at this point is recorded as the reheating time.
Step 4: Monitoring, Analysis and Quenching
While the sample is within the furnace, the temperature is monitored using a thermocouple, and labview monitoring
software. The temperature is monitored until the reading of the thermocouple is within 25°C of the targeted temperature, and is
the test is then allowed to run for a time, and is then removed from the furnace and water quenched to room temperature.
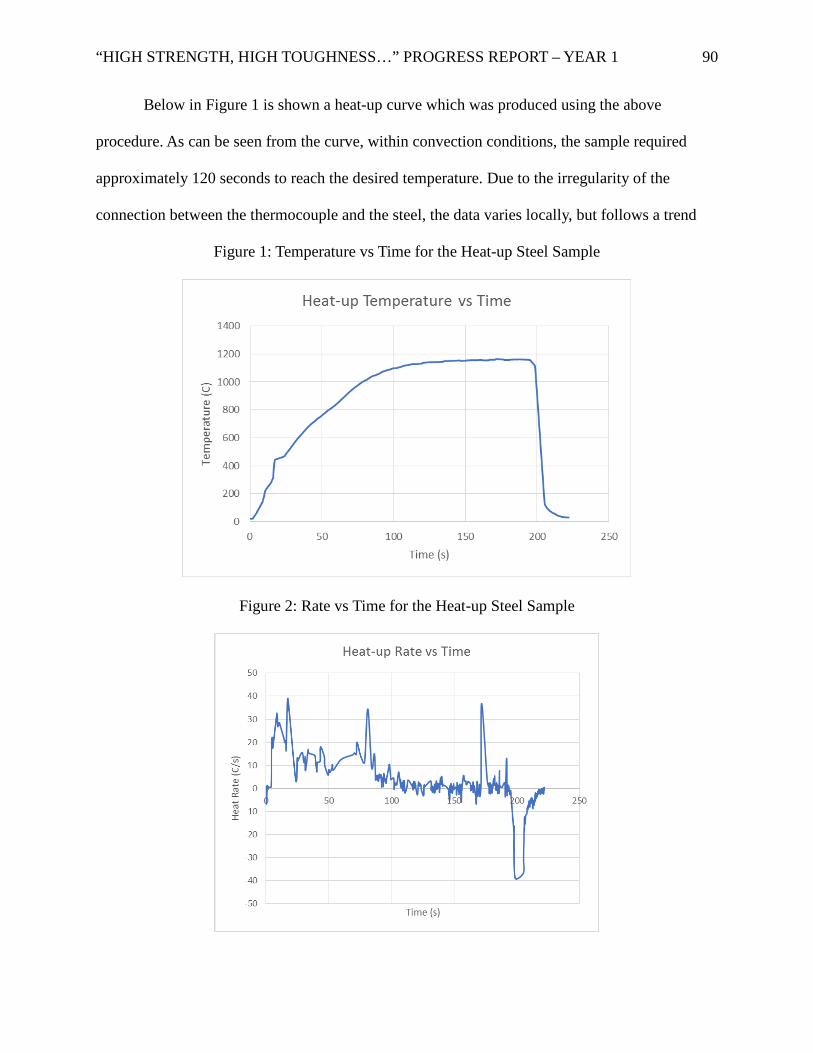
“HIGH STRENGTH, HIGH TOUGHNESS…” PROGRESS REPORT – YEAR 1 90
Below in Figure 1 is shown a heat-up curve which was produced using the above
procedure. As can be seen from the curve, within convection conditions, the sample required
approximately 120 seconds to reach the desired temperature. Due to the irregularity of the
connection between the thermocouple and the steel, the data varies locally, but follows a trend
Figure 1: Temperature vs Time for the Heat-up Steel Sample
Figure 2: Rate vs Time for the Heat-up Steel Sample
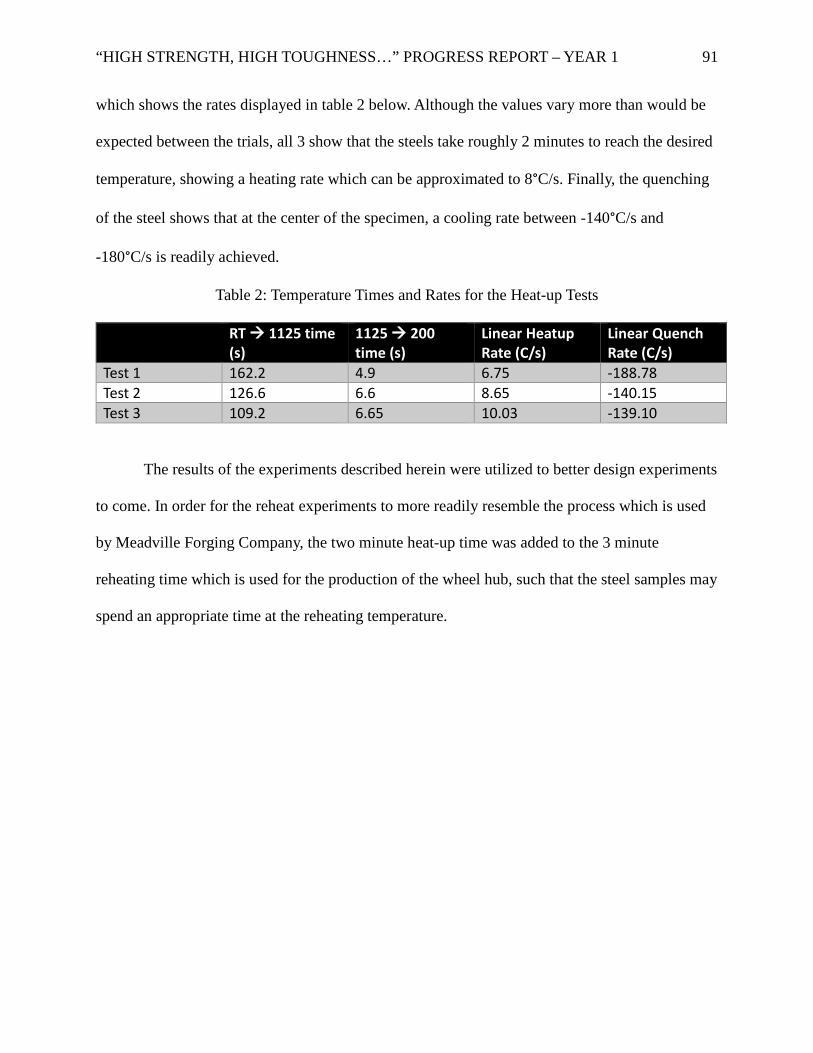
“HIGH STRENGTH, HIGH TOUGHNESS…” PROGRESS REPORT – YEAR 1 91
which shows the rates displayed in table 2 below. Although the values vary more than would be
expected between the trials, all 3 show that the steels take roughly 2 minutes to reach the desired
temperature, showing a heating rate which can be approximated to 8°C/s. Finally, the quenching
of the steel shows that at the center of the specimen, a cooling rate between -140°C/s and
-180°C/s is readily achieved.
Table 2: Temperature Times and Rates for the Heat-up Tests
RT 1125 time (s)
1125 200 time (s)
Linear Heatup Rate (C/s)
Linear Quench Rate (C/s)
Test 1 162.2 4.9 6.75 -188.78 Test 2 126.6 6.6 8.65 -140.15 Test 3 109.2 6.65 10.03 -139.10
The results of the experiments described herein were utilized to better design experiments
to come. In order for the reheat experiments to more readily resemble the process which is used
by Meadville Forging Company, the two minute heat-up time was added to the 3 minute
reheating time which is used for the production of the wheel hub, such that the steel samples may
spend an appropriate time at the reheating temperature.
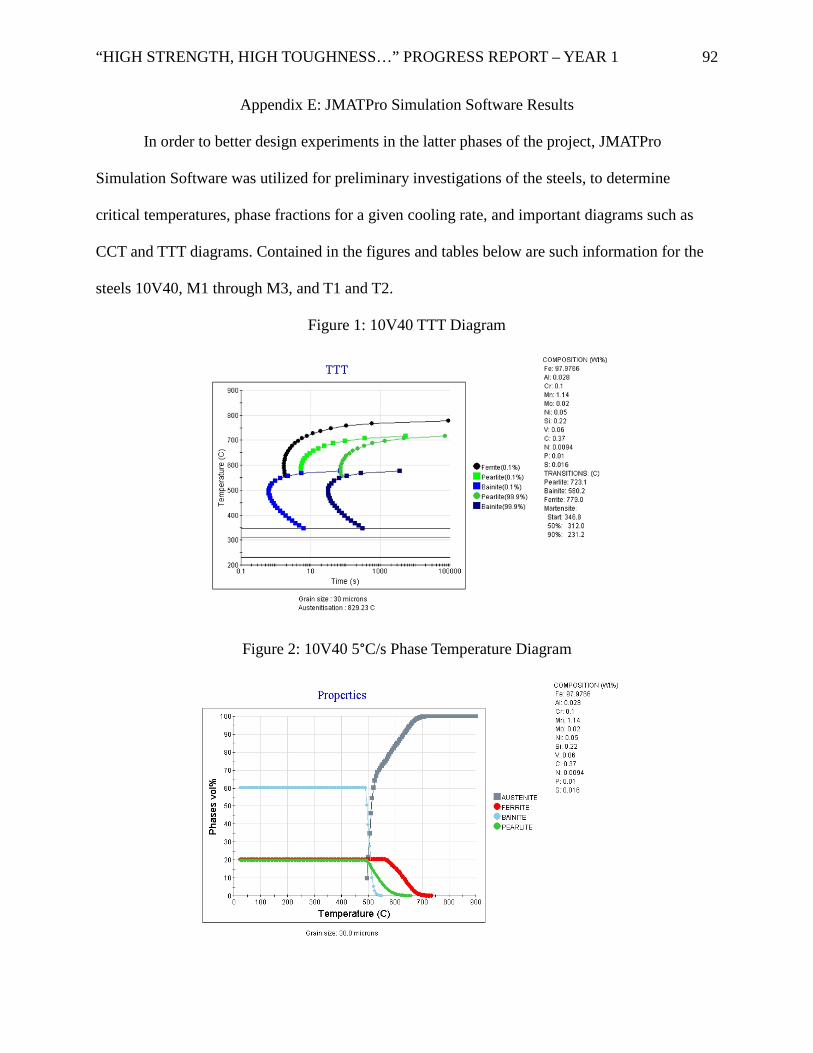
“HIGH STRENGTH, HIGH TOUGHNESS…” PROGRESS REPORT – YEAR 1 92
Appendix E: JMATPro Simulation Software Results
In order to better design experiments in the latter phases of the project, JMATPro
Simulation Software was utilized for preliminary investigations of the steels, to determine
critical temperatures, phase fractions for a given cooling rate, and important diagrams such as
CCT and TTT diagrams. Contained in the figures and tables below are such information for the
steels 10V40, M1 through M3, and T1 and T2.
Figure 1: 10V40 TTT Diagram
Figure 2: 10V40 5°C/s Phase Temperature Diagram
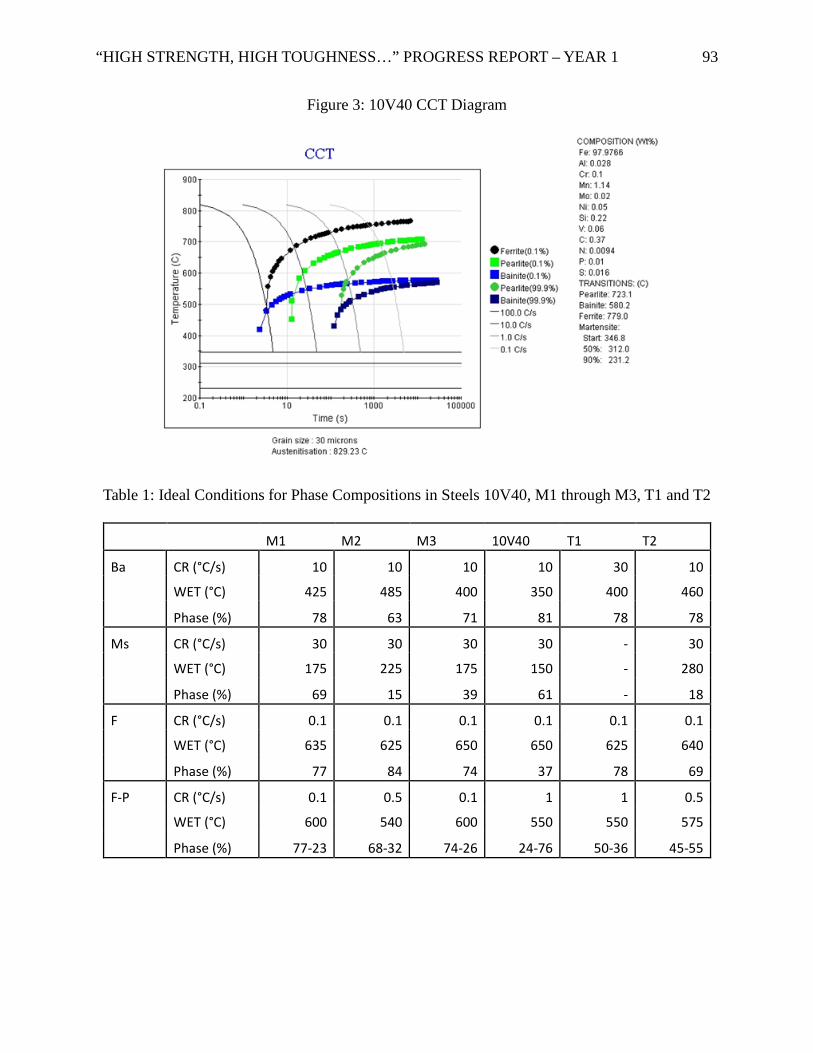
“HIGH STRENGTH, HIGH TOUGHNESS…” PROGRESS REPORT – YEAR 1 93
Figure 3: 10V40 CCT Diagram
Table 1: Ideal Conditions for Phase Compositions in Steels 10V40, M1 through M3, T1 and T2
M1 M2 M3 10V40 T1 T2
Ba CR (°C/s) 10 10 10 10 30 10
WET (°C) 425 485 400 350 400 460
Phase (%) 78 63 71 81 78 78
Ms CR (°C/s) 30 30 30 30 - 30
WET (°C) 175 225 175 150 - 280
Phase (%) 69 15 39 61 - 18
F CR (°C/s) 0.1 0.1 0.1 0.1 0.1 0.1
WET (°C) 635 625 650 650 625 640
Phase (%) 77 84 74 37 78 69
F-P CR (°C/s) 0.1 0.5 0.1 1 1 0.5
WET (°C) 600 540 600 550 550 575
Phase (%) 77-23 68-32 74-26 24-76 50-36 45-55
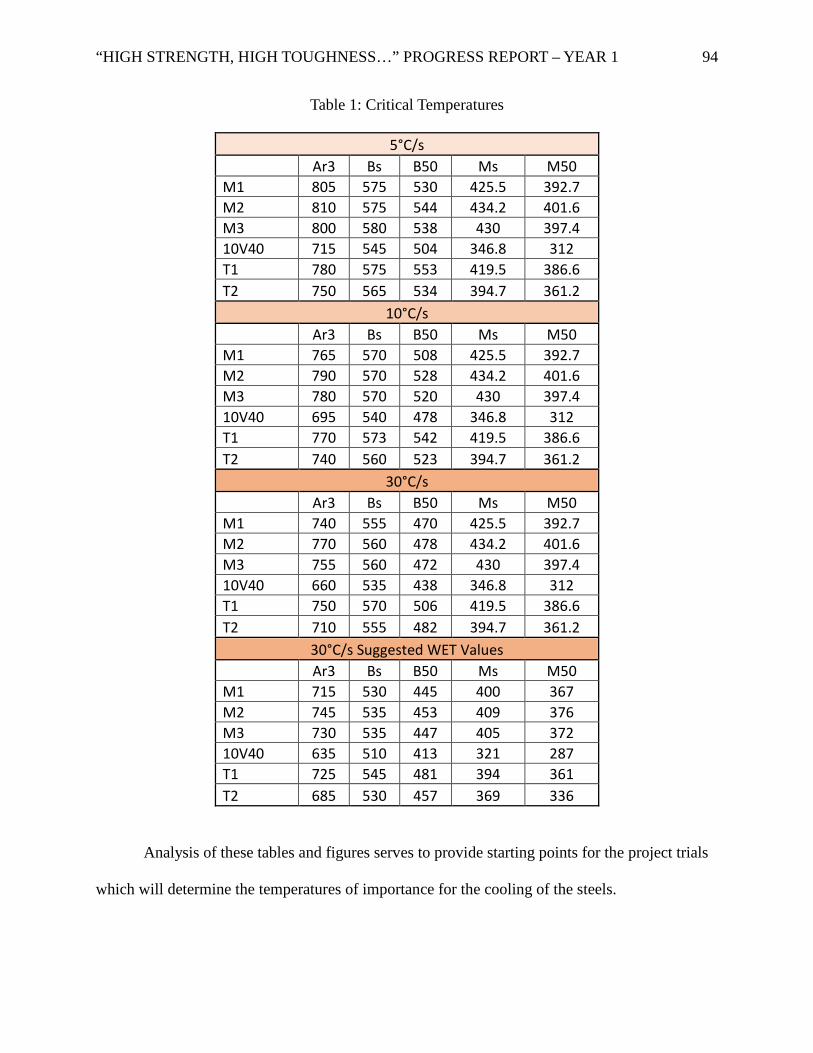
“HIGH STRENGTH, HIGH TOUGHNESS…” PROGRESS REPORT – YEAR 1 94
Table 1: Critical Temperatures
5°C/s Ar3 Bs B50 Ms M50 M1 805 575 530 425.5 392.7 M2 810 575 544 434.2 401.6 M3 800 580 538 430 397.4 10V40 715 545 504 346.8 312 T1 780 575 553 419.5 386.6 T2 750 565 534 394.7 361.2
10°C/s Ar3 Bs B50 Ms M50 M1 765 570 508 425.5 392.7 M2 790 570 528 434.2 401.6 M3 780 570 520 430 397.4 10V40 695 540 478 346.8 312 T1 770 573 542 419.5 386.6 T2 740 560 523 394.7 361.2
30°C/s Ar3 Bs B50 Ms M50 M1 740 555 470 425.5 392.7 M2 770 560 478 434.2 401.6 M3 755 560 472 430 397.4 10V40 660 535 438 346.8 312 T1 750 570 506 419.5 386.6 T2 710 555 482 394.7 361.2
30°C/s Suggested WET Values Ar3 Bs B50 Ms M50 M1 715 530 445 400 367 M2 745 535 453 409 376 M3 730 535 447 405 372 10V40 635 510 413 321 287 T1 725 545 481 394 361 T2 685 530 457 369 336
Analysis of these tables and figures serves to provide starting points for the project trials
which will determine the temperatures of importance for the cooling of the steels.
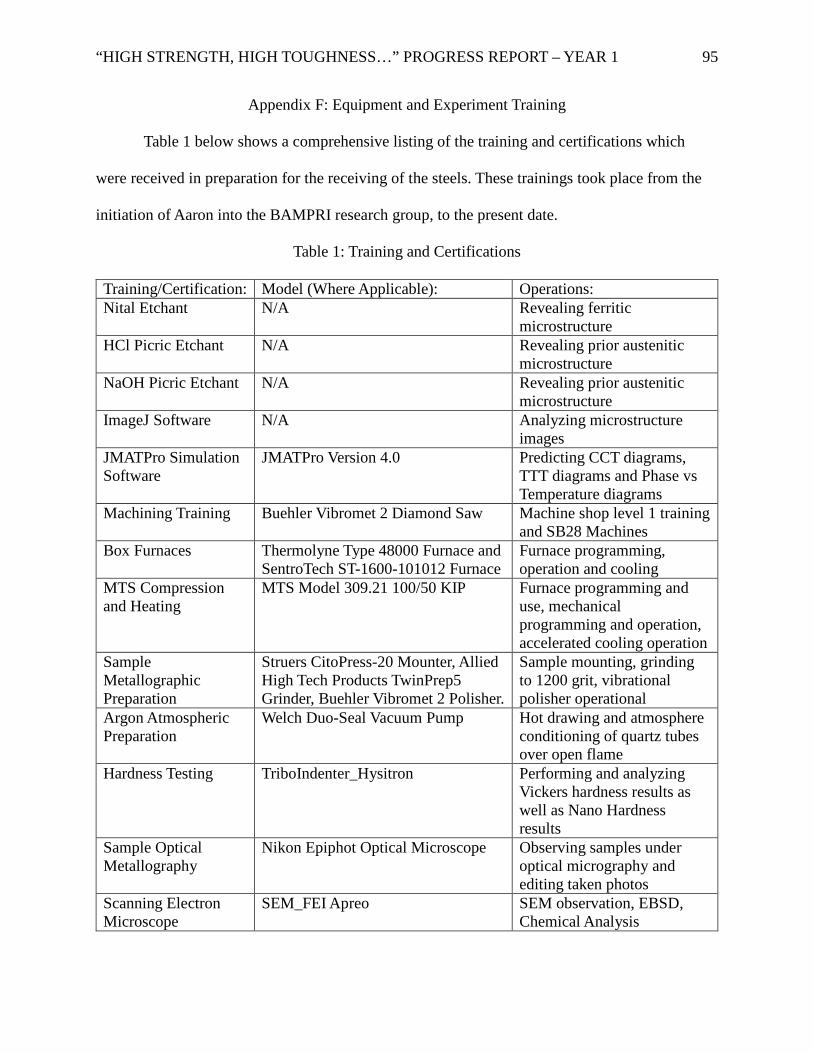
“HIGH STRENGTH, HIGH TOUGHNESS…” PROGRESS REPORT – YEAR 1 95
Appendix F: Equipment and Experiment Training
Table 1 below shows a comprehensive listing of the training and certifications which
were received in preparation for the receiving of the steels. These trainings took place from the
initiation of Aaron into the BAMPRI research group, to the present date.
Table 1: Training and Certifications
Training/Certification: Model (Where Applicable): Operations: Nital Etchant N/A Revealing ferritic
microstructure HCl Picric Etchant N/A Revealing prior austenitic
microstructure NaOH Picric Etchant N/A Revealing prior austenitic
microstructure ImageJ Software N/A Analyzing microstructure
images JMATPro Simulation Software
JMATPro Version 4.0 Predicting CCT diagrams, TTT diagrams and Phase vs Temperature diagrams
Machining Training Buehler Vibromet 2 Diamond Saw Machine shop level 1 training and SB28 Machines
Box Furnaces Thermolyne Type 48000 Furnace and SentroTech ST-1600-101012 Furnace
Furnace programming, operation and cooling
MTS Compression and Heating
MTS Model 309.21 100/50 KIP Furnace programming and use, mechanical programming and operation, accelerated cooling operation
Sample Metallographic Preparation
Struers CitoPress-20 Mounter, Allied High Tech Products TwinPrep5 Grinder, Buehler Vibromet 2 Polisher.
Sample mounting, grinding to 1200 grit, vibrational polisher operational
Argon Atmospheric Preparation
Welch Duo-Seal Vacuum Pump Hot drawing and atmosphere conditioning of quartz tubes over open flame
Hardness Testing TriboIndenter_Hysitron Performing and analyzing Vickers hardness results as well as Nano Hardness results
Sample Optical Metallography
Nikon Epiphot Optical Microscope Observing samples under optical micrography and editing taken photos
Scanning Electron Microscope
SEM_FEI Apreo SEM observation, EBSD, Chemical Analysis
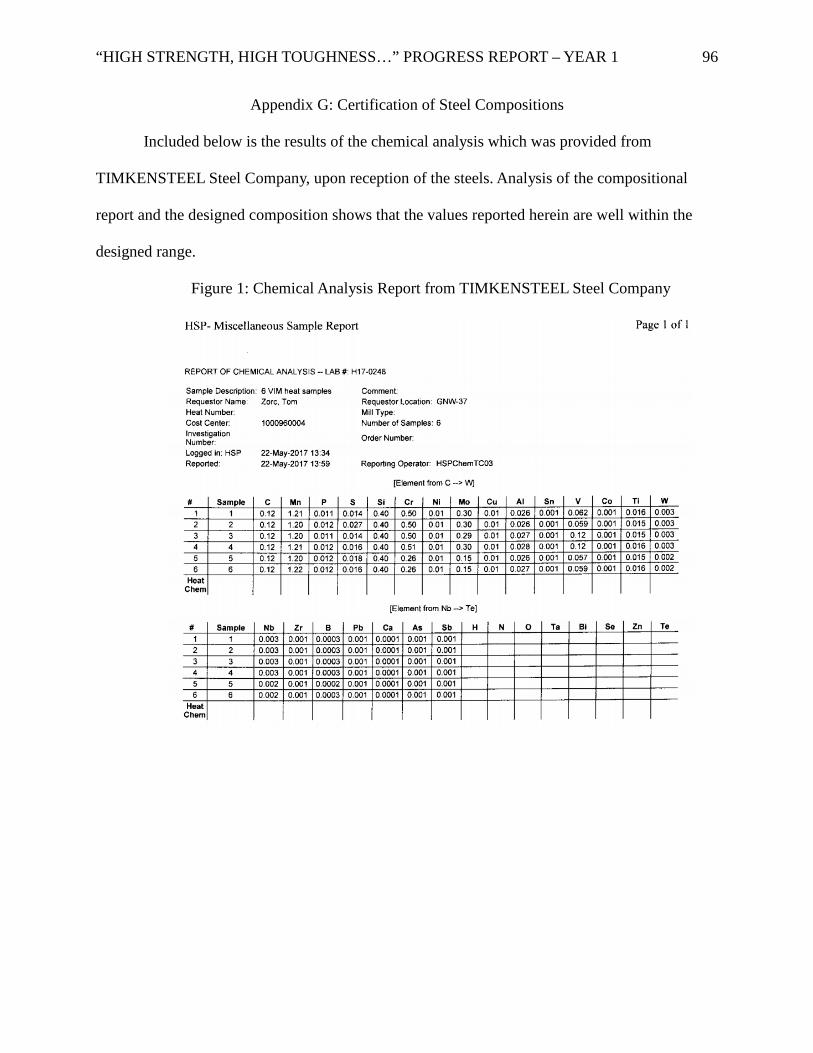
“HIGH STRENGTH, HIGH TOUGHNESS…” PROGRESS REPORT – YEAR 1 96
Appendix G: Certification of Steel Compositions
Included below is the results of the chemical analysis which was provided from
TIMKENSTEEL Steel Company, upon reception of the steels. Analysis of the compositional
report and the designed composition shows that the values reported herein are well within the
designed range.
Figure 1: Chemical Analysis Report from TIMKENSTEEL Steel Company
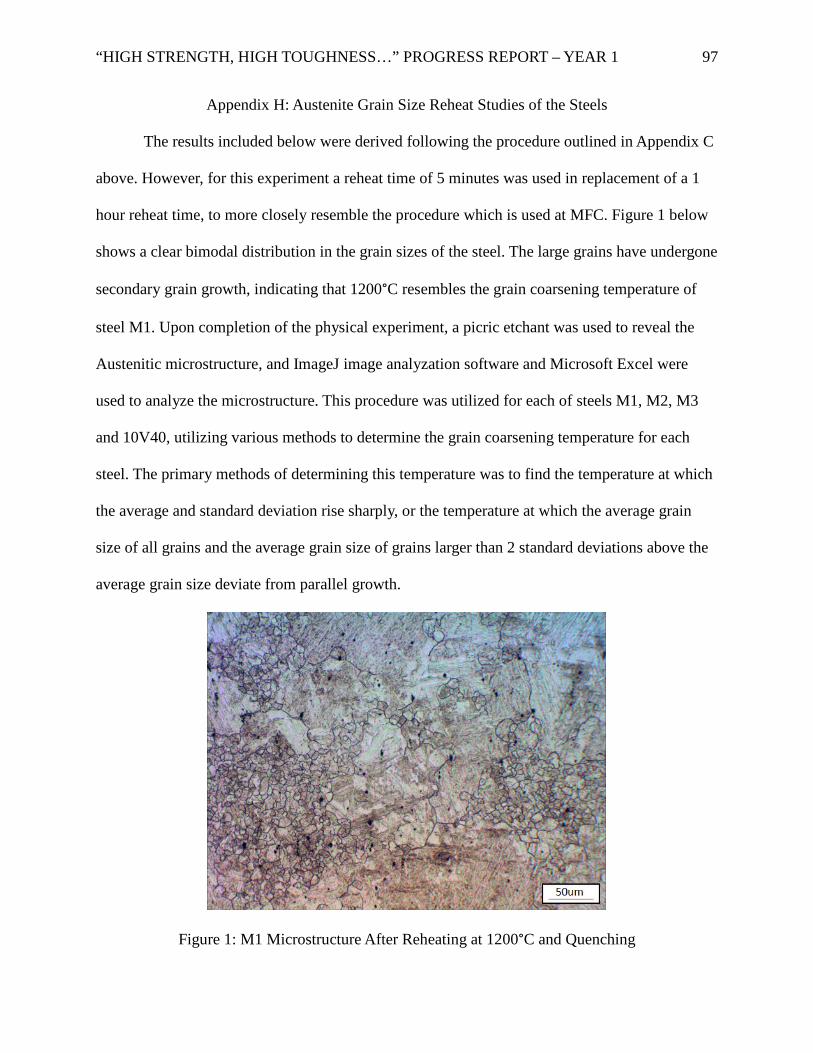
“HIGH STRENGTH, HIGH TOUGHNESS…” PROGRESS REPORT – YEAR 1 97
Appendix H: Austenite Grain Size Reheat Studies of the Steels
The results included below were derived following the procedure outlined in Appendix C
above. However, for this experiment a reheat time of 5 minutes was used in replacement of a 1
hour reheat time, to more closely resemble the procedure which is used at MFC. Figure 1 below
shows a clear bimodal distribution in the grain sizes of the steel. The large grains have undergone
secondary grain growth, indicating that 1200°C resembles the grain coarsening temperature of
steel M1. Upon completion of the physical experiment, a picric etchant was used to reveal the
Austenitic microstructure, and ImageJ image analyzation software and Microsoft Excel were
used to analyze the microstructure. This procedure was utilized for each of steels M1, M2, M3
and 10V40, utilizing various methods to determine the grain coarsening temperature for each
steel. The primary methods of determining this temperature was to find the temperature at which
the average and standard deviation rise sharply, or the temperature at which the average grain
size of all grains and the average grain size of grains larger than 2 standard deviations above the
average grain size deviate from parallel growth.
Figure 1: M1 Microstructure After Reheating at 1200°C and Quenching
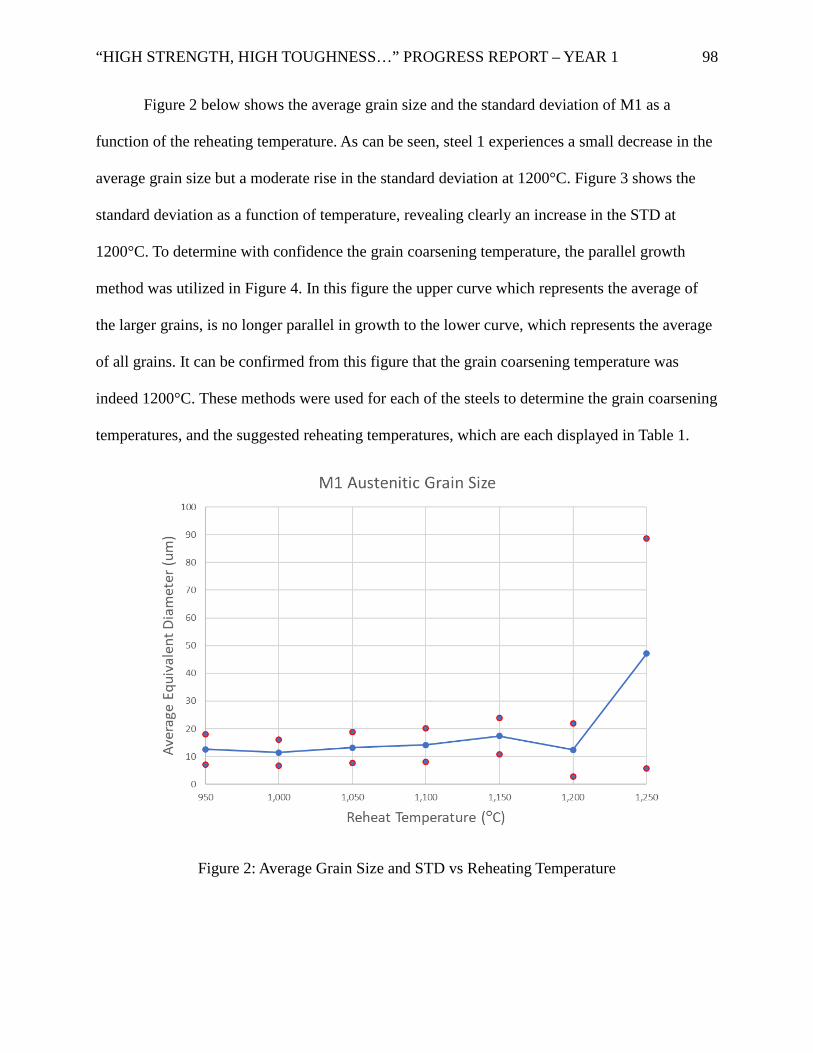
“HIGH STRENGTH, HIGH TOUGHNESS…” PROGRESS REPORT – YEAR 1 98
Figure 2 below shows the average grain size and the standard deviation of M1 as a
function of the reheating temperature. As can be seen, steel 1 experiences a small decrease in the
average grain size but a moderate rise in the standard deviation at 1200°C. Figure 3 shows the
standard deviation as a function of temperature, revealing clearly an increase in the STD at
1200°C. To determine with confidence the grain coarsening temperature, the parallel growth
method was utilized in Figure 4. In this figure the upper curve which represents the average of
the larger grains, is no longer parallel in growth to the lower curve, which represents the average
of all grains. It can be confirmed from this figure that the grain coarsening temperature was
indeed 1200°C. These methods were used for each of the steels to determine the grain coarsening
temperatures, and the suggested reheating temperatures, which are each displayed in Table 1.
Figure 2: Average Grain Size and STD vs Reheating Temperature
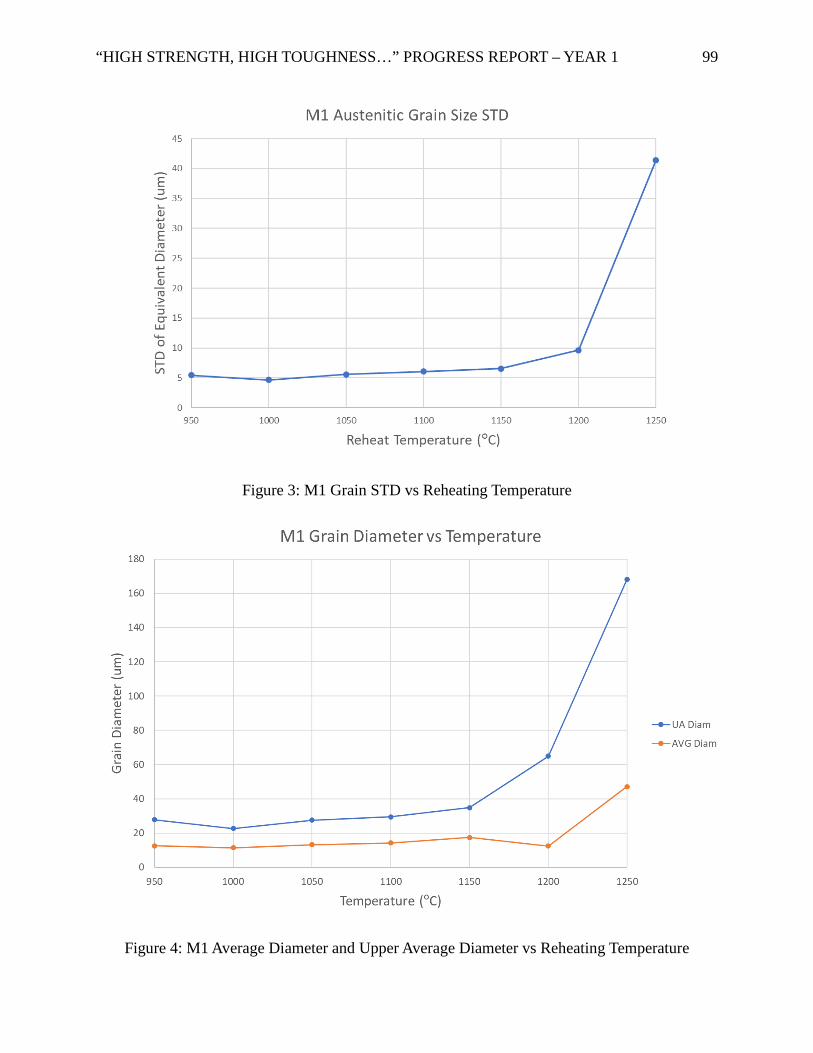
“HIGH STRENGTH, HIGH TOUGHNESS…” PROGRESS REPORT – YEAR 1 99
Figure 3: M1 Grain STD vs Reheating Temperature
Figure 4: M1 Average Diameter and Upper Average Diameter vs Reheating Temperature
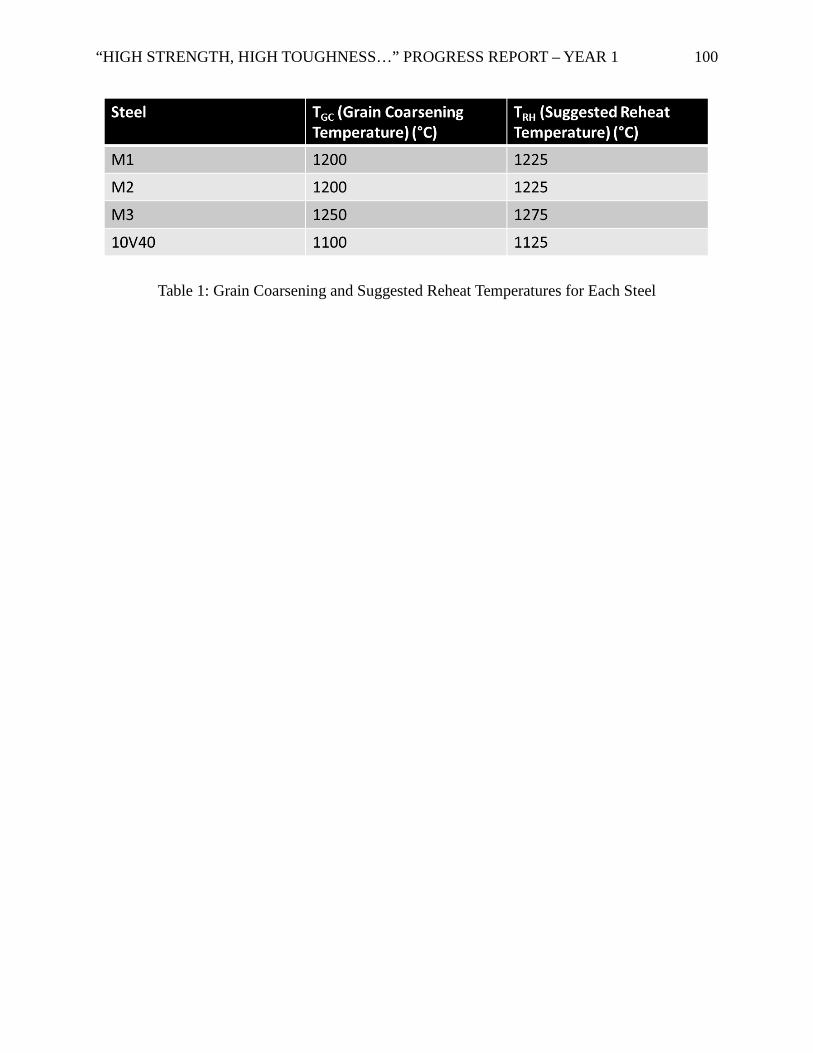
“HIGH STRENGTH, HIGH TOUGHNESS…” PROGRESS REPORT – YEAR 1 100
Table 1: Grain Coarsening and Suggested Reheat Temperatures for Each Steel
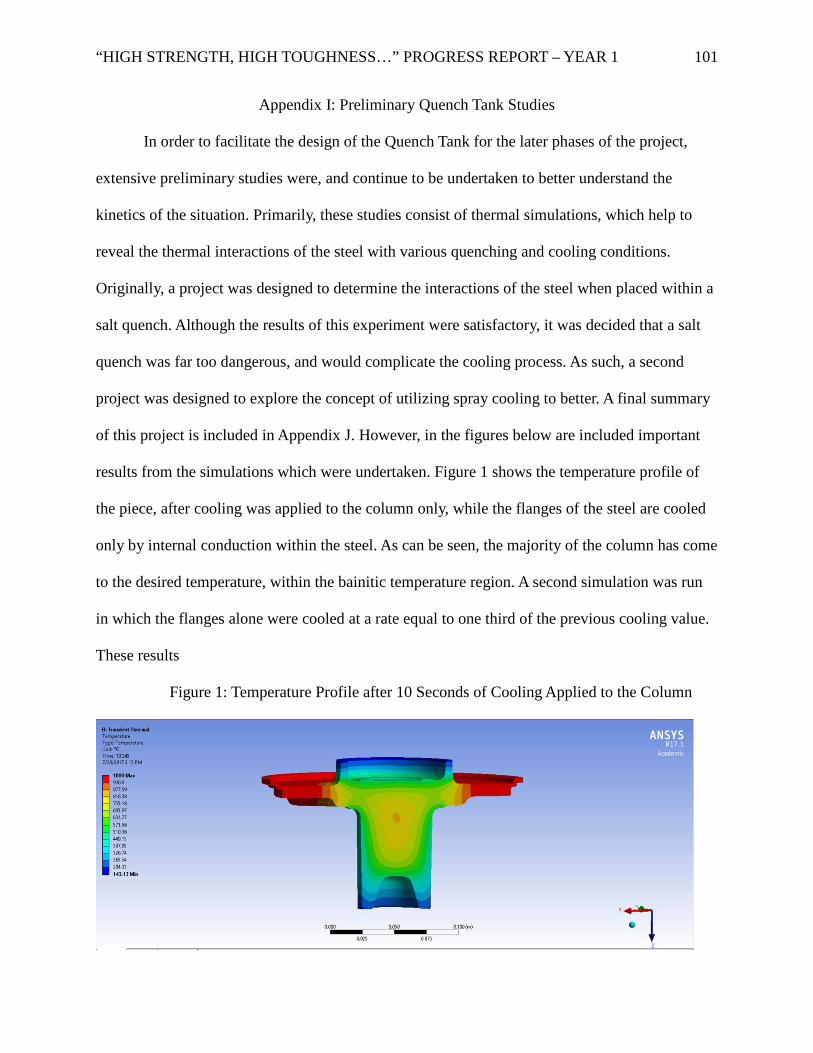
“HIGH STRENGTH, HIGH TOUGHNESS…” PROGRESS REPORT – YEAR 1 101
Appendix I: Preliminary Quench Tank Studies
In order to facilitate the design of the Quench Tank for the later phases of the project,
extensive preliminary studies were, and continue to be undertaken to better understand the
kinetics of the situation. Primarily, these studies consist of thermal simulations, which help to
reveal the thermal interactions of the steel with various quenching and cooling conditions.
Originally, a project was designed to determine the interactions of the steel when placed within a
salt quench. Although the results of this experiment were satisfactory, it was decided that a salt
quench was far too dangerous, and would complicate the cooling process. As such, a second
project was designed to explore the concept of utilizing spray cooling to better. A final summary
of this project is included in Appendix J. However, in the figures below are included important
results from the simulations which were undertaken. Figure 1 shows the temperature profile of
the piece, after cooling was applied to the column only, while the flanges of the steel are cooled
only by internal conduction within the steel. As can be seen, the majority of the column has come
to the desired temperature, within the bainitic temperature region. A second simulation was run
in which the flanges alone were cooled at a rate equal to one third of the previous cooling value.
These results
Figure 1: Temperature Profile after 10 Seconds of Cooling Applied to the Column
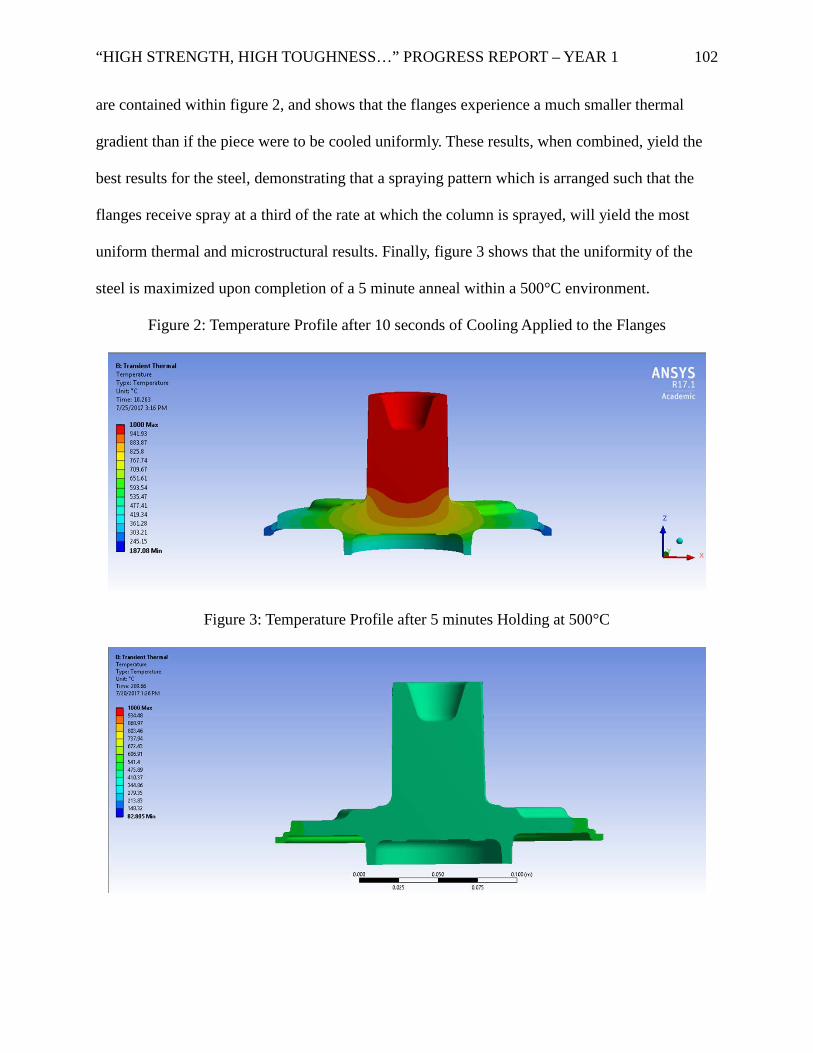
“HIGH STRENGTH, HIGH TOUGHNESS…” PROGRESS REPORT – YEAR 1 102
are contained within figure 2, and shows that the flanges experience a much smaller thermal
gradient than if the piece were to be cooled uniformly. These results, when combined, yield the
best results for the steel, demonstrating that a spraying pattern which is arranged such that the
flanges receive spray at a third of the rate at which the column is sprayed, will yield the most
uniform thermal and microstructural results. Finally, figure 3 shows that the uniformity of the
steel is maximized upon completion of a 5 minute anneal within a 500°C environment.
Figure 2: Temperature Profile after 10 seconds of Cooling Applied to the Flanges
Figure 3: Temperature Profile after 5 minutes Holding at 500°C
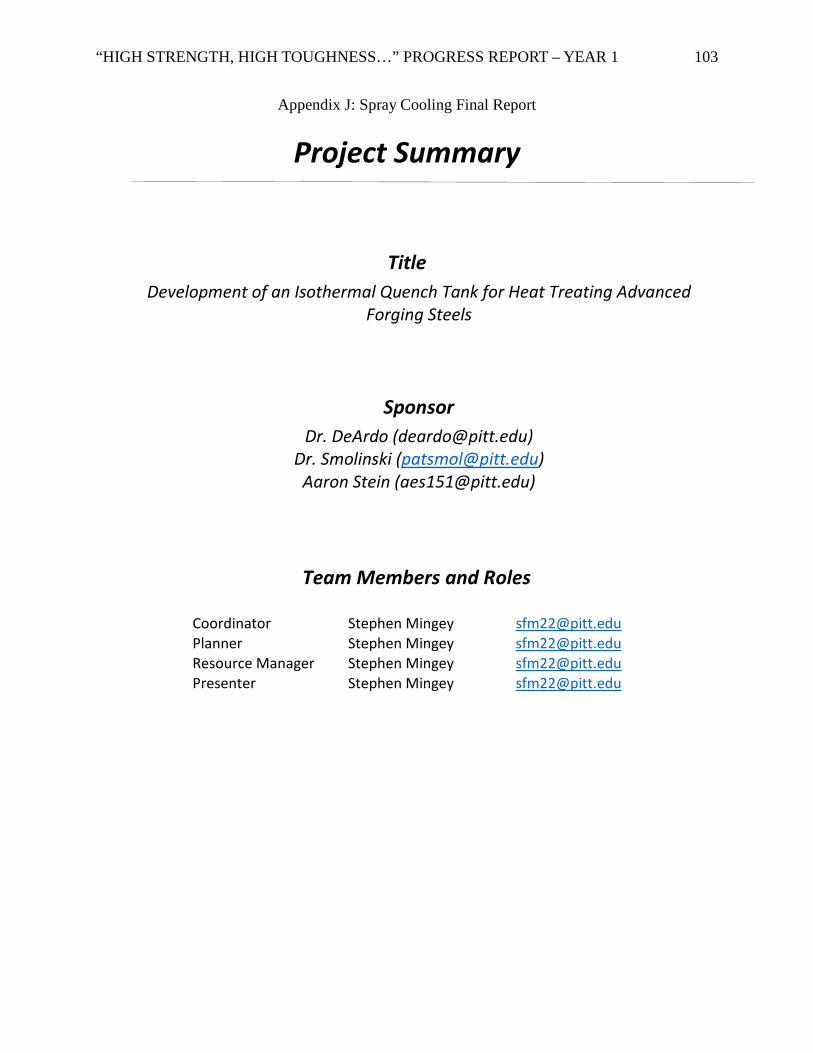
“HIGH STRENGTH, HIGH TOUGHNESS…” PROGRESS REPORT – YEAR 1 103
Appendix J: Spray Cooling Final Report
Project Summary
Title
Development of an Isothermal Quench Tank for Heat Treating Advanced Forging Steels
Sponsor
Dr. DeArdo ([email protected]) Dr. Smolinski ([email protected])
Aaron Stein ([email protected])
Team Members and Roles
Coordinator Stephen Mingey [email protected]
Planner Stephen Mingey [email protected]
Resource Manager Stephen Mingey [email protected]
Presenter Stephen Mingey [email protected]
“HIGH STRENGTH, HIGH TOUGHNESS…” PROGRESS REPORT – YEAR 1 104
1. Project Background
Overall Project Summary
Forged automobile wheel hubs require strength and toughness in order to withstand daily
operations. These wheel hubs are composed of new micro-alloyed high strength low alloy (HSLA)
steel compositions and undergo a heat treatment to control the microstructural transformations
of the material to optimize physical properties. Outdated technology requires a post forging
cooling practice that is time consuming and costly to produce the required to produce the
necessary transformations and mechanical properties. In order to eliminate this unproductive
forging practice, a project has been sponsored by Dr. DeArdo’s group and Meadville Forging
Company to design an Isothermal Quench tank that will spray cool the wheel hub directly after
forging in order to obtain complete microstructural transformation without the need for
secondary heat treatments. The focus of this project is to model the thermal properties of a spray
cooled isothermal quench tank that will be integrated into Meadville Forging Company’s
production line.
Background Information
Current production practice for Forged Wheel Hubs
The wheel hubs produced by Meadville Forging Company are forged in a closed die
process. Post forging process, the wheel hubs are heat treated in order to ensure that required
mechanical properties are met. In the article Closed-Die Forging in Hammers and Presses, one of
the greatest benefits of closed die forging is that it allows for complex shapes and heavy
“HIGH STRENGTH, HIGH TOUGHNESS…” PROGRESS REPORT – YEAR 1 105
reductions on parts. This minimizing the amount of machining time required, therefore, making
the closed die forging process highly profitable.
Meadville Forging Company forges the metal at 1000⁰C and then air cools the part to
room temperature. The post forging heat treatments is what controls the formation of the
microstructure that will influence the mechanical properties of the part. The current practice of
subsequent heat treatments is costly and time consuming. For that reason, a more efficient post
forging practice is desired. The goal of this project is to design a spray cooled Isothermal Quench
Tank that will achieve the desired microstructure in the wheel hub in one post forge processing
step.
Project Motivation
In order to decrease production time and cost of the wheel hub, there is interest in
designing a spray cooled isothermal quench tank to perform the post forging quenching. Water
will be sprayed onto the piece by a series of nozzles. The sprayed water will act as quenching
the piece because it will be surrounded by water. Due to the continuous flow of water at the
same temperature the design allows for an isothermal quench. This will allow for a complete
microstructural transformation and will eliminate the need for conventional heat treatments to
produce the same results. This design will increase the rate of production while decreasing the
cost.
Significance and Impact to Industry
“HIGH STRENGTH, HIGH TOUGHNESS…” PROGRESS REPORT – YEAR 1 106
The development of an isothermal quench tank would directly affect small forging and
heat treating industries. An isothermal quench tank would be an extremely valuable investment
to any company whose product requires uniform mechanical properties, especially if the
desired properties currently require several post forging heat treatments. The design of this
spray cooled isothermal quench tank could be easily adapted to other post forge parts besides
wheel hubs. Allowing for the adaptability of nozzle configuration, this design would be
beneficial to small forging companies whose products require essential mechanical properties.
Along with the improved product, the companies would save a considerable amount in
production cost by eliminating furnaces that would be used for post forging heat treatments.
Project Continuation
Our group’s goal is to continue working toward the design objectives of the project that
were left by the previous group and sponsors, but starting over using different technology.
The previous group had designed an isothermal quench tank that used a salts as
quenchant in a submersion bath. An ANSYS model was developed for the steel hub and data
gathered using simulated heat transfer runs. They simulated quenching the steel from 1000⁰ to
450⁰ C and 1000⁰ to 200⁰ C, simulating each in environments ranging from stagnant to high
agitation. Temperature maps of the steel were used to analyze the internal and surface
temperature for a range of 90 seconds.

“HIGH STRENGTH, HIGH TOUGHNESS…” PROGRESS REPORT – YEAR 1 107
The design path of the project has since changed, as the salt bath was found unsuitable
for use in the industry due to toxicity concerns with the salts. The new project is still an
isothermal quench tank, but it is now driven by spray cooling.
2. Project Objectives Project Goal
The goal of the project is to develop a design for an isothermal quench tank that will
spray cool a post forging wheel hub to produce a uniform, bainitic microstructure in the HSLA
steel. The device will cool the steel from 1000⁰ C down to either 200⁰ C or 450⁰ C.
Objectives
Objective 1 – Concept Development and Calculations: Develop a concept of the cooling system with
thermodynamic and fluid mechanic fundamentals, approximating a specific enthalpy and mass flow to
meet the needed rate of heat transfer. The initial design will be shown to the sponsors for evaluation, and
the parameters will be fine-tuned or kept depending on feedback.
Objective 2 – Simulation and further development: A model will be developed for the wheel hub, and the
quenching system will be simulated using ANSYS. The specific enthalpy and mass flow will be tested and
adjusted based on simulation results, possibly resulting in a redesign of the concept (e.g. number of spray
nozzles, nozzle placement, water temperature, etc.) Adjustments will be made until the simulation meet
the project requirements.

“HIGH STRENGTH, HIGH TOUGHNESS…” PROGRESS REPORT – YEAR 1 108
Objective 3 (time and budget permitting) – Prototype Development: A prototype will be produced based
on the concept. Materials and supplies will be acquired from suppliers or machined based on the needed
specifications. Prototype will be tested and compared to ANSYS simulation.
Specifications and Functional Requirements
1. The quench tank is to cool a steel hub from 1000⁰ C to either 200⁰ C or 450⁰ C.
2. The quenching process must be timed properly to form sufficient levels of bainite or
martensite that can be tempered.
3. The whole system is to fit in a 55-gallon drum.
4. The wheel hubs weigh approximately 5 kg.
5. The quench tank must be isothermal or approximately isothermal.
6. The desired cooling rate needs to occur in approximately 10 seconds.
Along with this, we know certain functional requirements:
-The quench tank must able to contain steel hub at 1000⁰ C
-The quenching system cannot have toxic byproducts, as that was what ended the previous
iteration of the project.
The device will cool the steel from 1000⁰ C down to 450⁰ C and must fit within a 55 gallon
drum.
Endpoints – Deliverables and Metrics for Success
The deliverable endpoints are:

“HIGH STRENGTH, HIGH TOUGHNESS…” PROGRESS REPORT – YEAR 1 109
1. A thermodynamic and fluid mechanical set of equations and calculations, detailing
aspects of the quench tank mathematically.
2. A concept design of the tank, including the positions and specificaltions of spray nozzles.
3. A model of the steel wheel hub that is to be quenched.
4. Experimental results from the simulation.
5. Possibly a prototype.
3. Project Planning Resources
• SOLIDWORKS • JMATpro • ANSYS • Previous groups work
Anticipated Design Iterations
There are many different parameters when it comes to spray cooling. When running
thermal simulations for this design it will be important to limit the parameters being changed in
order to verify the efficacy of the change. Since this project will be primarily based on computer
simulations, it greatly reduces any chance for human error in data collection.
Support from Project Sponsor
Regular meetings to monitor progress of project and assistance with knowledge of
metallurgical concepts.

“HIGH STRENGTH, HIGH TOUGHNESS…” PROGRESS REPORT – YEAR 1 110
Support from Swanson Center for Product Innovation
The only support required from Benedum Hall is the software programs SOLIDWORKS,
ANSYS, and JMATpro.
Support from Subject Matter Experts
Sponsors of the project will provide advice on advance metallurgical topics and assistance
with ANSYS simulation software. Kevin Glunt will provide for his expertise in using the
simulation software program ANSYS.
Potential Risks and Anticipated Failures
Being a group of one, not having experience with ANSYS, and not having a background
with heat transfer significantly hinders the success of this project. It is anticipated that the
success of this project will be stunted. Diligent planning and staying on top of tasks will help the
group progress as much as possible. Regular meetings with Kevin Glunt to assist with ANSYS
simulation will be done along with several meeting with the sponsor during the week.
Milestones
Assignments required for the course along with three mini presentations will be
completed during the course. At the end of the course a completed binder, poster, and
presentation will be completed for the classroom portion of the project.

“HIGH STRENGTH, HIGH TOUGHNESS…” PROGRESS REPORT – YEAR 1 111
The primary milestone for this semester will be to verify that the spray cooling can achieve the
desired cooling rate to produce the required material properties. This will be done through
various ANSYS simulations. The secondary and tertiary milestones for the course will be to
configure the nozzles in the most effective way and to build a prototype. However, the
secondary and tertiary milestones will most likely be completed by future groups.
Budget
Future groups will require a budget when it comes to constructing the prototype and testing
the nozzles.
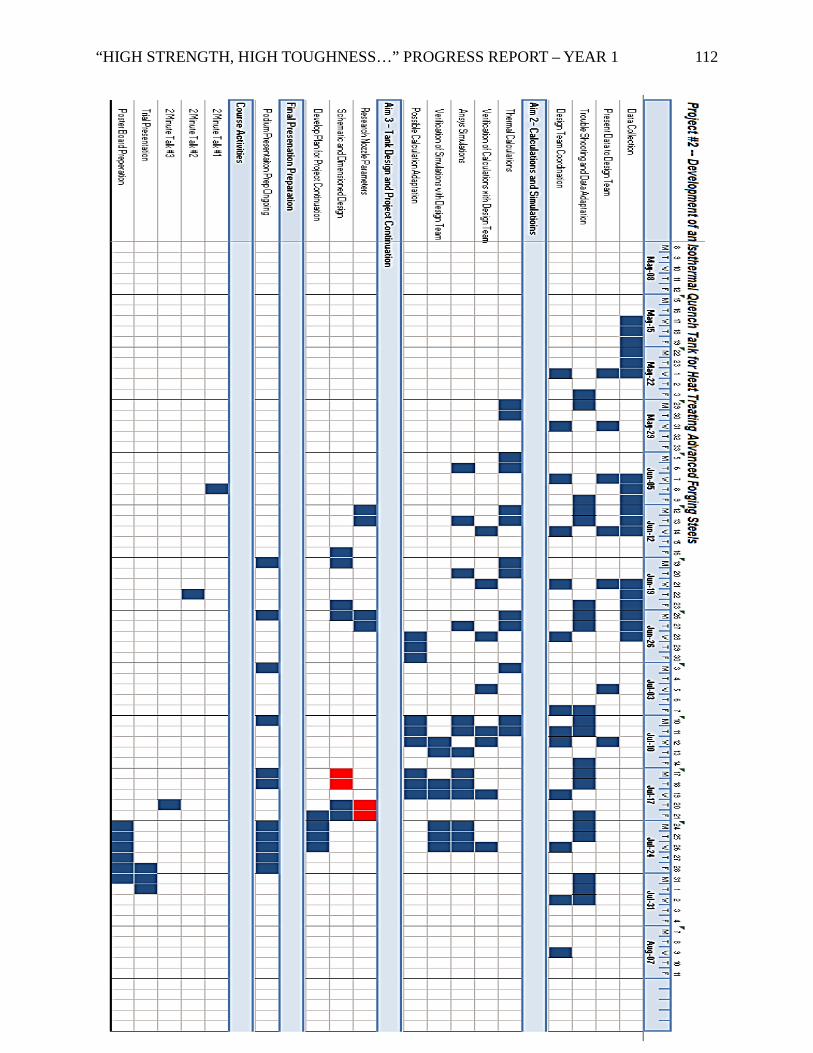
“HIGH STRENGTH, HIGH TOUGHNESS…” PROGRESS REPORT – YEAR 1 112
“HIGH STRENGTH, HIGH TOUGHNESS…” PROGRESS REPORT – YEAR 1 113
4. Project Execution
Analysis & Design
This project will heavily analyze the heat transfer of the forged wheel hub and the
surrounding quench medium. In order to get a visual representation of the rate of heat transfer
ANSYS will be used. I will seek help from Dr. Schmidt and Kevin Glunt for help using ANSYS in his
Simulation Workshop (MEMS 1121) and Applied Engineering Simulation in Design Lecture
(MEMS 1120). One of the advisors, Dr. Smolinski, is experienced with using heat treatment
simulations and may be able to provide assistance. In order to obtain dimensions of the part for
calculations SolidWorks was used along with skills gained in Introduction to Mechanical Design
(MEMS 0024).
Due to the requirement of Meadville Forging Company to obtain a bainitic
microstructure a strong background in the effects of heat treatments, CCT diagrams, and phase
transformations of steel is necessary for this project. Information on these topics were taught in
the courses Materials Structures and Properties (ENGR 0022), Materials and Manufacturing
(MEMS 0040), and Ferrous Physical Metallurgy (MEMS 1101).
Verification
The thermal simulations that will be created using ANSYS will be regularly be presented
to Dr. DeArdo and Dr. Smolinski. ANSYS also provides time and temperature data that can be
exported to excel to make graphs that are helpful to understand the data. This information can
be used to verify that the required objectives for quenching are fully met.

“HIGH STRENGTH, HIGH TOUGHNESS…” PROGRESS REPORT – YEAR 1 114
5. Project Organization
Team Meetings
I will meet with the sponsors on the project every Wednesday at 11:00 AM to 12:00 PM,
however, if needed the meeting can exceed the one-hour time frame is necessary. I also meet
with Kevin Glunt on Tuesdays at 2:00 PM as needed to work on ANSYS simulations. Being a one
person group, I heavily rely on Aaron Stein who is the graduate student that is a sponsor for the
project and meet with him several times a week normally between 10:00 AM and 3:00 PM.
Work Space
Work for the project will be done in computer labs in Benedum Hall and Hillman. As
needed room 318 in Benedum Hall for using specific software for the project. Research and
sponsor review takes place in Dr. DeArdo’s lab in room 614 in Benedum Hall. All work will be
stored in an online account that is accessible to group members and sponsors.
Sponsor Meetings
Meetings with sponsor will take place every Wednesday at 11:00 a.m. in room 614 of
Benedum Hall.
Sharing, Distribution and Archival of Project Data
All information is to be collected and stored on an online account created by the
sponsor. Due to the nature of the project, all project data will be generated from a computer
and there is no need for actual material storage.

“HIGH STRENGTH, HIGH TOUGHNESS…” PROGRESS REPORT – YEAR 1 115
6. Project Outcomes
Educational
This project will develop a greater understanding of the effect of cooling rates on the
microstructure of steel. Skills in computer simulation will be gained in the design of the
isothermal quench tank. Engineering concepts of thermodynamics, heat and mass transfer, and
fluid dynamics will also be expanded for industrial purposes. I will also have a better
understanding of the microstructural development during quenching.
Working alone I have strengthened my ability to work independently and stay self-
motivated. I have always been a better group worker because I good at recognizing my
strengths and weaknesses compared to other group members. With this project I had to rely on
my strengths and focus on improving my weaknesses because I had no choice.
“HIGH STRENGTH, HIGH TOUGHNESS…” PROGRESS REPORT – YEAR 1 116
Appendix K: Evaporative Cooling Quench Tank Experiments
In the fall of 2017, experiments were conducted to determine the cooling capabilities of
the evaporation of water. For these experiments, 1 inch diameter by 3 inch length cylinders of
low carbon steel were homogenized at 1000°C for 20 minutes. Following homogenization, the
samples were removed from the furnace, and inserted into a pot of water at 90°C ± 3°C. The
water was at this temperature so that the cooling may be conducted via the heat of evaporation of
water, which was theorized to be fast enough to avoid the ferrite pearlite transformation in the
steels, yet slow enough to be controllable and avoid martensite. The main variable for these
experiments was the residency time of the sample in the hot water. The results of these
experiments can be seen in the chart below.
Following the initial experiments, it was determined that the initial temperature of the
water when the sample was submerged was a large factor in the cooling of the sample. Thus, in
order to eliminate this factor, it was decided that the quenching water and pot would be
continuously boiled on a hot plate, to ensure that the water was at 100°C, and that all cooling of
the sample was accomplished via evaporation of the water. The purpose of these experiments
was to determine a method of cooling that cool the sample at a rate faster than 10°C/s to the
temperature region of 450°C to 550°C, where the sample would be held long enough to complete
the Bainitic transformation, i.e. approximately 110 seconds. This desired cooling path is shown
in Figure 1 below.
As this was the initial experimentation phase for the quench tank, the main goal was to
provide a proof of concept. To this purpose the experiments were successful, demonstrating the
plausibility of the cooling. Unfortunately, the experiments showed limited reproducibility, which
is theorized to be due to the varying orientations of the sample in the quench affecting the flow
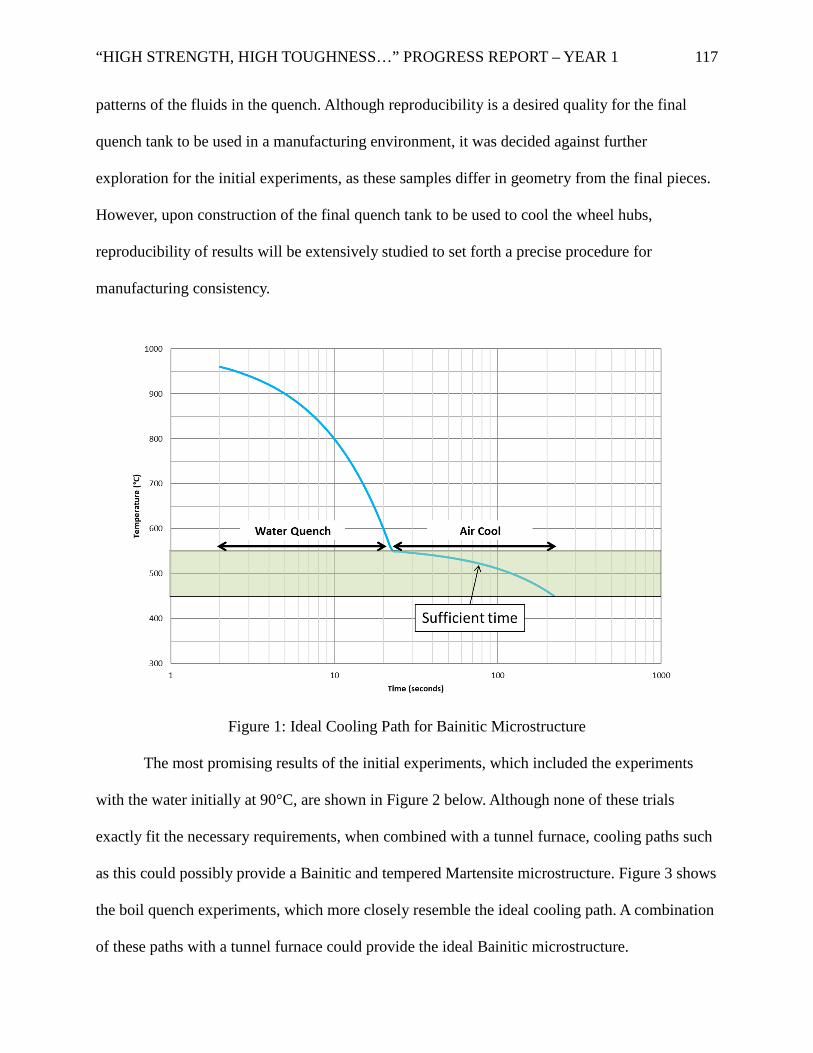
“HIGH STRENGTH, HIGH TOUGHNESS…” PROGRESS REPORT – YEAR 1 117
patterns of the fluids in the quench. Although reproducibility is a desired quality for the final
quench tank to be used in a manufacturing environment, it was decided against further
exploration for the initial experiments, as these samples differ in geometry from the final pieces.
However, upon construction of the final quench tank to be used to cool the wheel hubs,
reproducibility of results will be extensively studied to set forth a precise procedure for
manufacturing consistency.
Figure 1: Ideal Cooling Path for Bainitic Microstructure
The most promising results of the initial experiments, which included the experiments
with the water initially at 90°C, are shown in Figure 2 below. Although none of these trials
exactly fit the necessary requirements, when combined with a tunnel furnace, cooling paths such
as this could possibly provide a Bainitic and tempered Martensite microstructure. Figure 3 shows
the boil quench experiments, which more closely resemble the ideal cooling path. A combination
of these paths with a tunnel furnace could provide the ideal Bainitic microstructure.
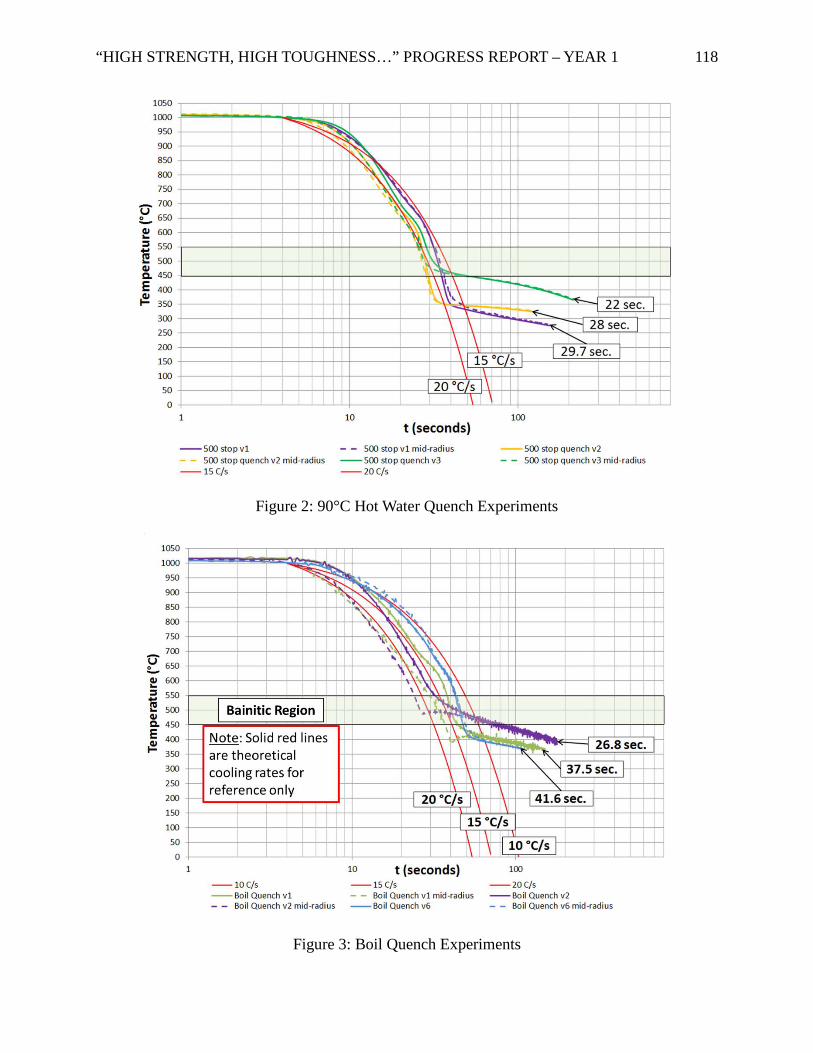
“HIGH STRENGTH, HIGH TOUGHNESS…” PROGRESS REPORT – YEAR 1 118
Figure 2: 90°C Hot Water Quench Experiments
Figure 3: Boil Quench Experiments
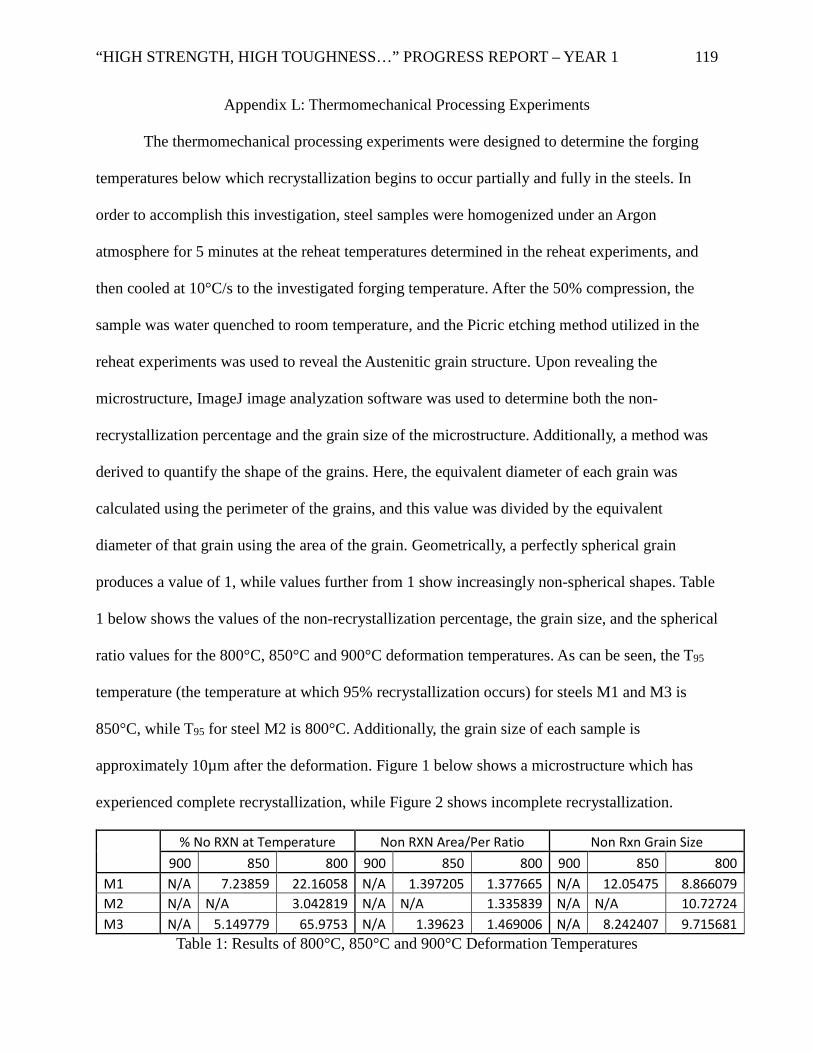
“HIGH STRENGTH, HIGH TOUGHNESS…” PROGRESS REPORT – YEAR 1 119
Appendix L: Thermomechanical Processing Experiments
The thermomechanical processing experiments were designed to determine the forging
temperatures below which recrystallization begins to occur partially and fully in the steels. In
order to accomplish this investigation, steel samples were homogenized under an Argon
atmosphere for 5 minutes at the reheat temperatures determined in the reheat experiments, and
then cooled at 10°C/s to the investigated forging temperature. After the 50% compression, the
sample was water quenched to room temperature, and the Picric etching method utilized in the
reheat experiments was used to reveal the Austenitic grain structure. Upon revealing the
microstructure, ImageJ image analyzation software was used to determine both the non-
recrystallization percentage and the grain size of the microstructure. Additionally, a method was
derived to quantify the shape of the grains. Here, the equivalent diameter of each grain was
calculated using the perimeter of the grains, and this value was divided by the equivalent
diameter of that grain using the area of the grain. Geometrically, a perfectly spherical grain
produces a value of 1, while values further from 1 show increasingly non-spherical shapes. Table
1 below shows the values of the non-recrystallization percentage, the grain size, and the spherical
ratio values for the 800°C, 850°C and 900°C deformation temperatures. As can be seen, the T95
temperature (the temperature at which 95% recrystallization occurs) for steels M1 and M3 is
850°C, while T95 for steel M2 is 800°C. Additionally, the grain size of each sample is
approximately 10µm after the deformation. Figure 1 below shows a microstructure which has
experienced complete recrystallization, while Figure 2 shows incomplete recrystallization.
% No RXN at Temperature Non RXN Area/Per Ratio Non Rxn Grain Size 900 850 800 900 850 800 900 850 800 M1 N/A 7.23859 22.16058 N/A 1.397205 1.377665 N/A 12.05475 8.866079 M2 N/A N/A 3.042819 N/A N/A 1.335839 N/A N/A 10.72724 M3 N/A 5.149779 65.9753 N/A 1.39623 1.469006 N/A 8.242407 9.715681
Table 1: Results of 800°C, 850°C and 900°C Deformation Temperatures
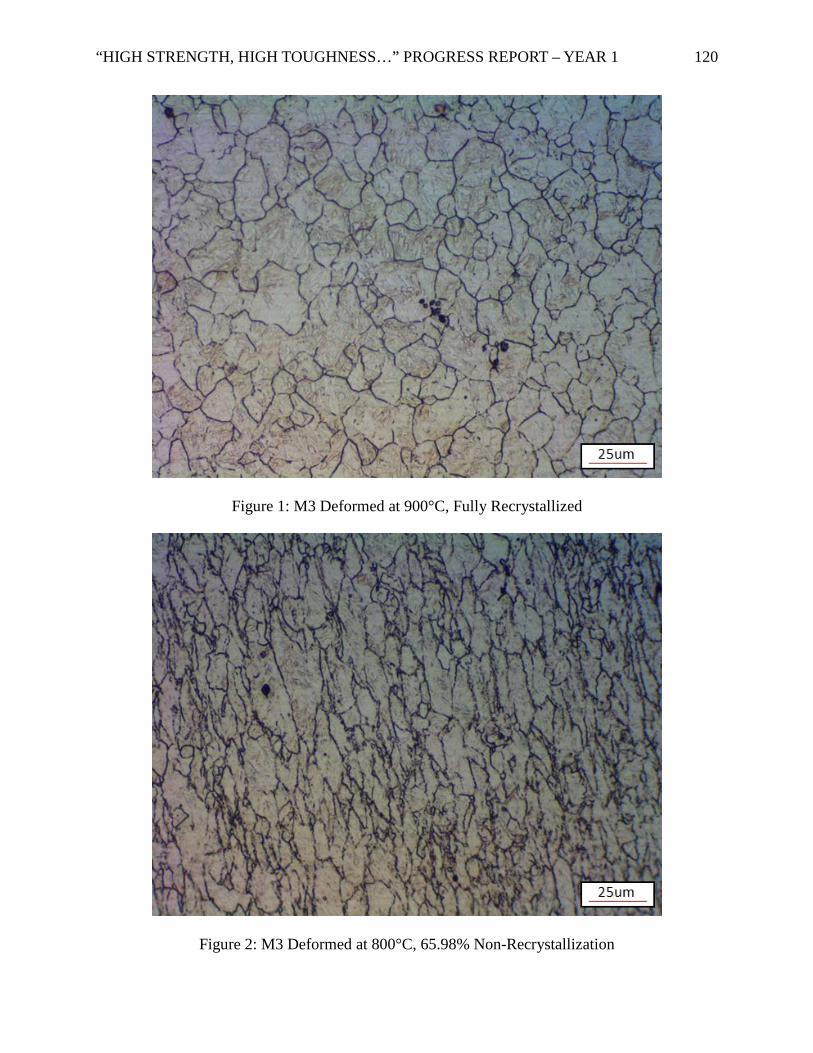
“HIGH STRENGTH, HIGH TOUGHNESS…” PROGRESS REPORT – YEAR 1 120
Figure 1: M3 Deformed at 900°C, Fully Recrystallized
Figure 2: M3 Deformed at 800°C, 65.98% Non-Recrystallization
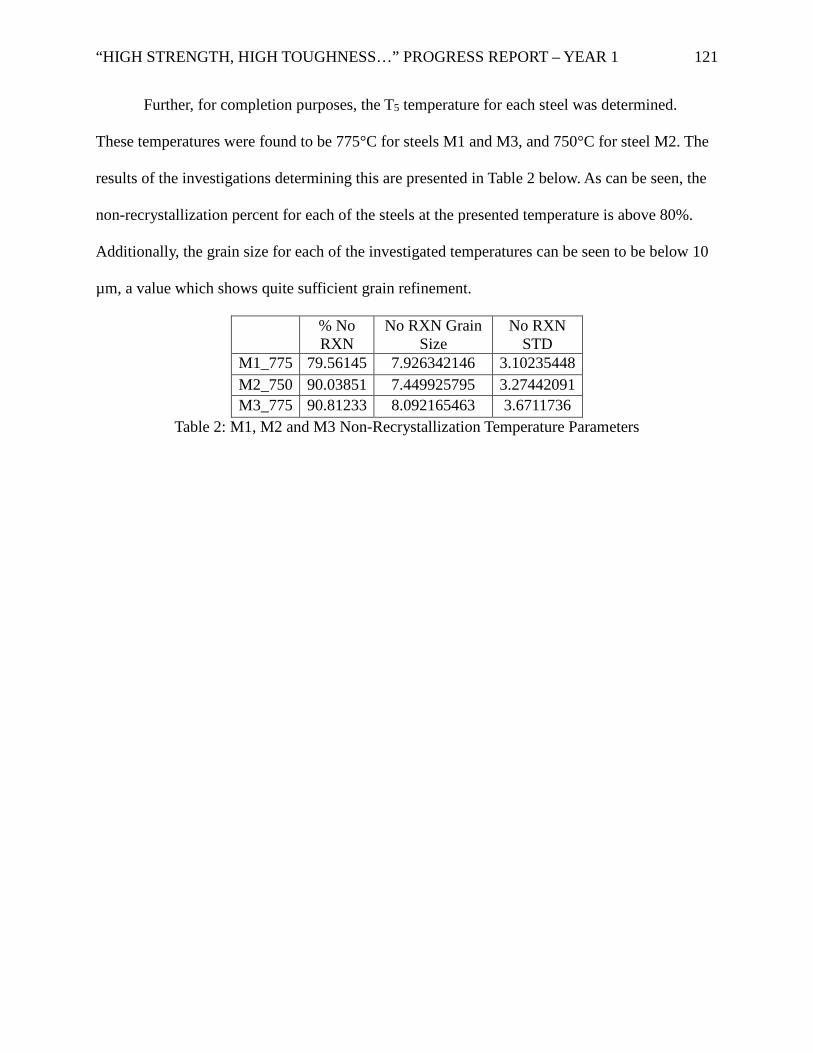
“HIGH STRENGTH, HIGH TOUGHNESS…” PROGRESS REPORT – YEAR 1 121
Further, for completion purposes, the T5 temperature for each steel was determined.
These temperatures were found to be 775°C for steels M1 and M3, and 750°C for steel M2. The
results of the investigations determining this are presented in Table 2 below. As can be seen, the
non-recrystallization percent for each of the steels at the presented temperature is above 80%.
Additionally, the grain size for each of the investigated temperatures can be seen to be below 10
µm, a value which shows quite sufficient grain refinement.
% No RXN
No RXN Grain Size
No RXN STD
M1_775 79.56145 7.926342146 3.10235448 M2_750 90.03851 7.449925795 3.27442091 M3_775 90.81233 8.092165463 3.6711736
Table 2: M1, M2 and M3 Non-Recrystallization Temperature Parameters
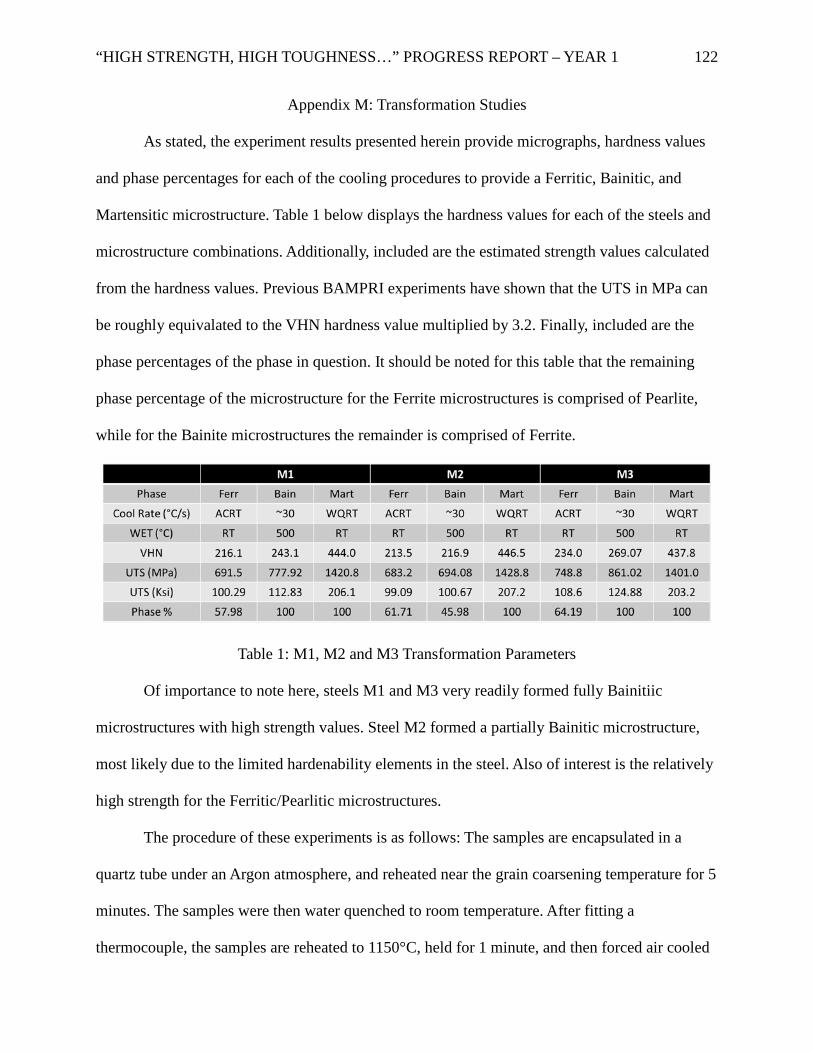
“HIGH STRENGTH, HIGH TOUGHNESS…” PROGRESS REPORT – YEAR 1 122
Appendix M: Transformation Studies
As stated, the experiment results presented herein provide micrographs, hardness values
and phase percentages for each of the cooling procedures to provide a Ferritic, Bainitic, and
Martensitic microstructure. Table 1 below displays the hardness values for each of the steels and
microstructure combinations. Additionally, included are the estimated strength values calculated
from the hardness values. Previous BAMPRI experiments have shown that the UTS in MPa can
be roughly equivalated to the VHN hardness value multiplied by 3.2. Finally, included are the
phase percentages of the phase in question. It should be noted for this table that the remaining
phase percentage of the microstructure for the Ferrite microstructures is comprised of Pearlite,
while for the Bainite microstructures the remainder is comprised of Ferrite.
Table 1: M1, M2 and M3 Transformation Parameters
Of importance to note here, steels M1 and M3 very readily formed fully Bainitiic
microstructures with high strength values. Steel M2 formed a partially Bainitic microstructure,
most likely due to the limited hardenability elements in the steel. Also of interest is the relatively
high strength for the Ferritic/Pearlitic microstructures.
The procedure of these experiments is as follows: The samples are encapsulated in a
quartz tube under an Argon atmosphere, and reheated near the grain coarsening temperature for 5
minutes. The samples were then water quenched to room temperature. After fitting a
thermocouple, the samples are reheated to 1150°C, held for 1 minute, and then forced air cooled
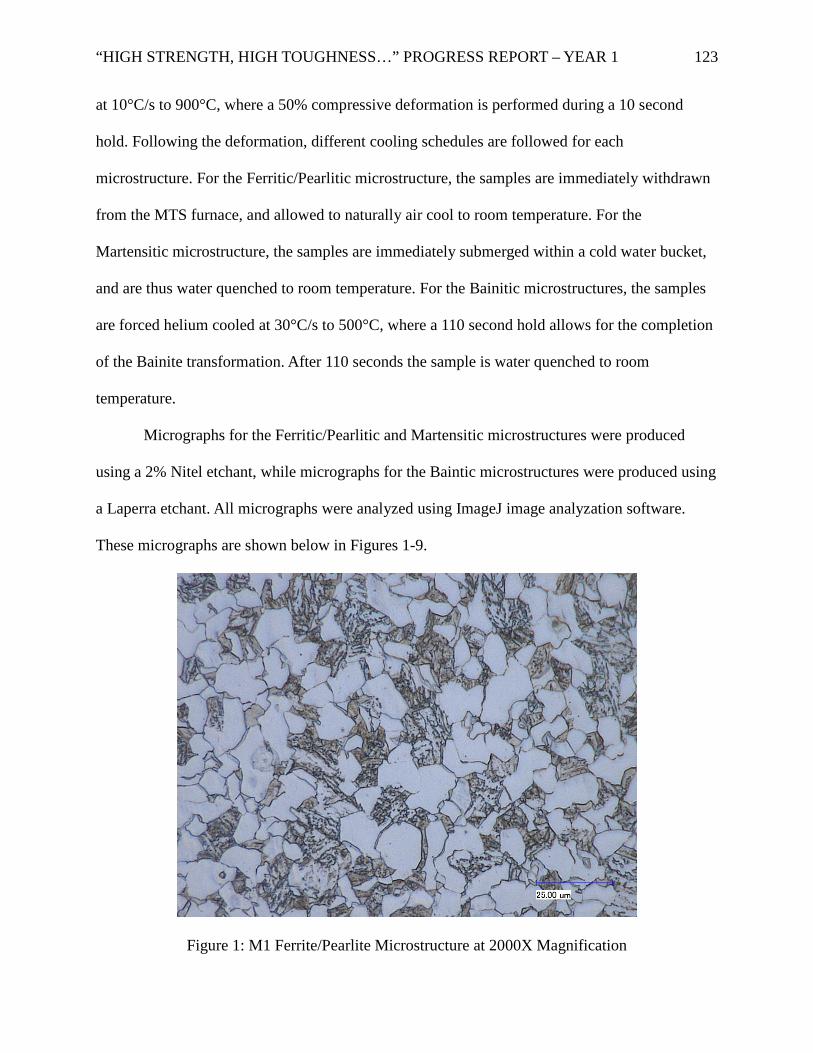
“HIGH STRENGTH, HIGH TOUGHNESS…” PROGRESS REPORT – YEAR 1 123
at 10°C/s to 900°C, where a 50% compressive deformation is performed during a 10 second
hold. Following the deformation, different cooling schedules are followed for each
microstructure. For the Ferritic/Pearlitic microstructure, the samples are immediately withdrawn
from the MTS furnace, and allowed to naturally air cool to room temperature. For the
Martensitic microstructure, the samples are immediately submerged within a cold water bucket,
and are thus water quenched to room temperature. For the Bainitic microstructures, the samples
are forced helium cooled at 30°C/s to 500°C, where a 110 second hold allows for the completion
of the Bainite transformation. After 110 seconds the sample is water quenched to room
temperature.
Micrographs for the Ferritic/Pearlitic and Martensitic microstructures were produced
using a 2% Nitel etchant, while micrographs for the Baintic microstructures were produced using
a Laperra etchant. All micrographs were analyzed using ImageJ image analyzation software.
These micrographs are shown below in Figures 1-9.
Figure 1: M1 Ferrite/Pearlite Microstructure at 2000X Magnification
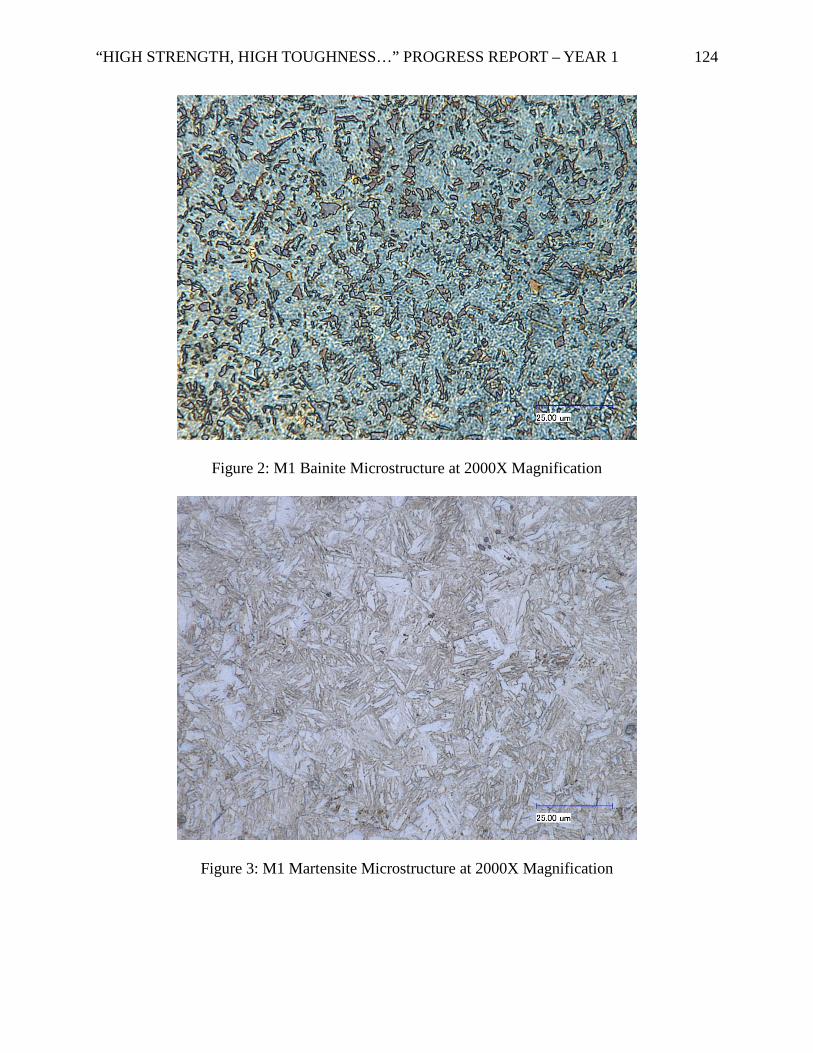
“HIGH STRENGTH, HIGH TOUGHNESS…” PROGRESS REPORT – YEAR 1 124
Figure 2: M1 Bainite Microstructure at 2000X Magnification
Figure 3: M1 Martensite Microstructure at 2000X Magnification
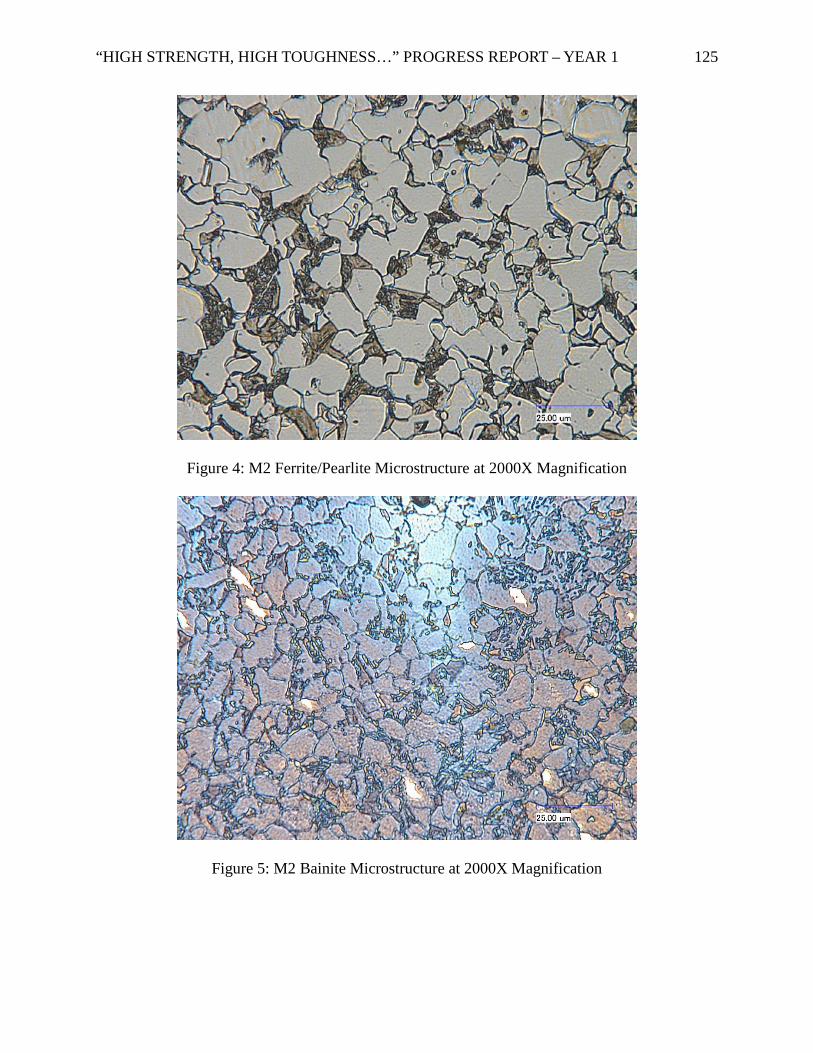
“HIGH STRENGTH, HIGH TOUGHNESS…” PROGRESS REPORT – YEAR 1 125
Figure 4: M2 Ferrite/Pearlite Microstructure at 2000X Magnification
Figure 5: M2 Bainite Microstructure at 2000X Magnification
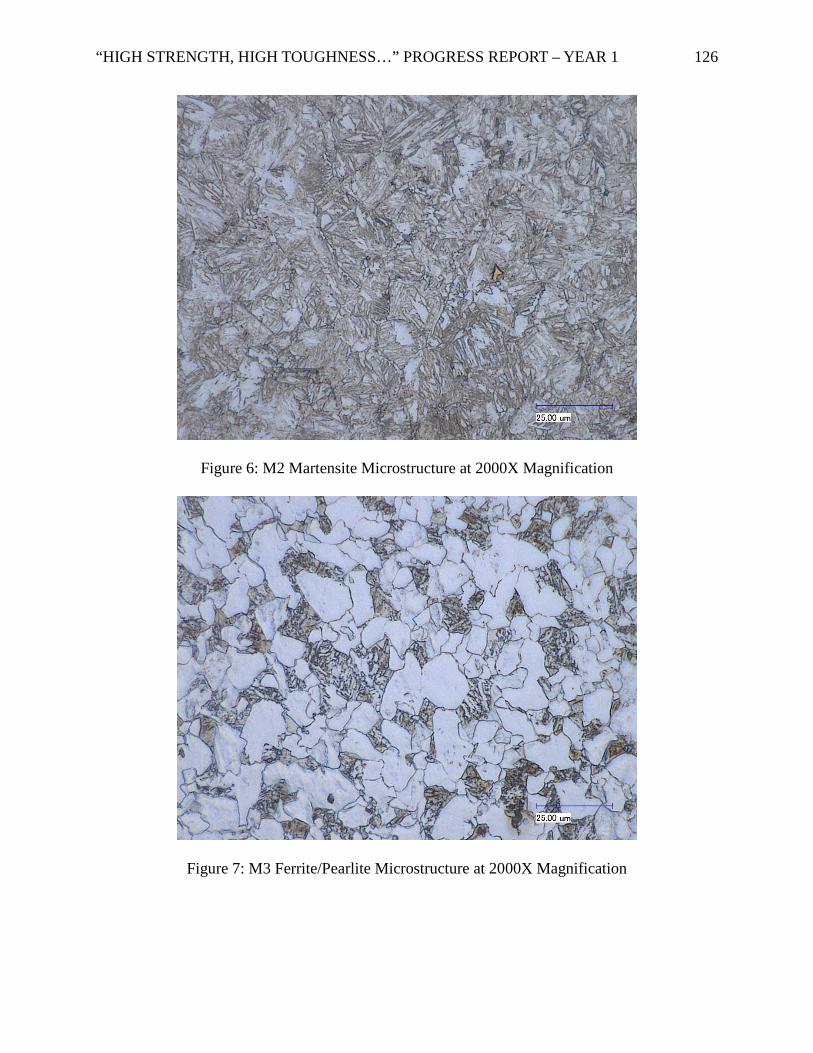
“HIGH STRENGTH, HIGH TOUGHNESS…” PROGRESS REPORT – YEAR 1 126
Figure 6: M2 Martensite Microstructure at 2000X Magnification
Figure 7: M3 Ferrite/Pearlite Microstructure at 2000X Magnification
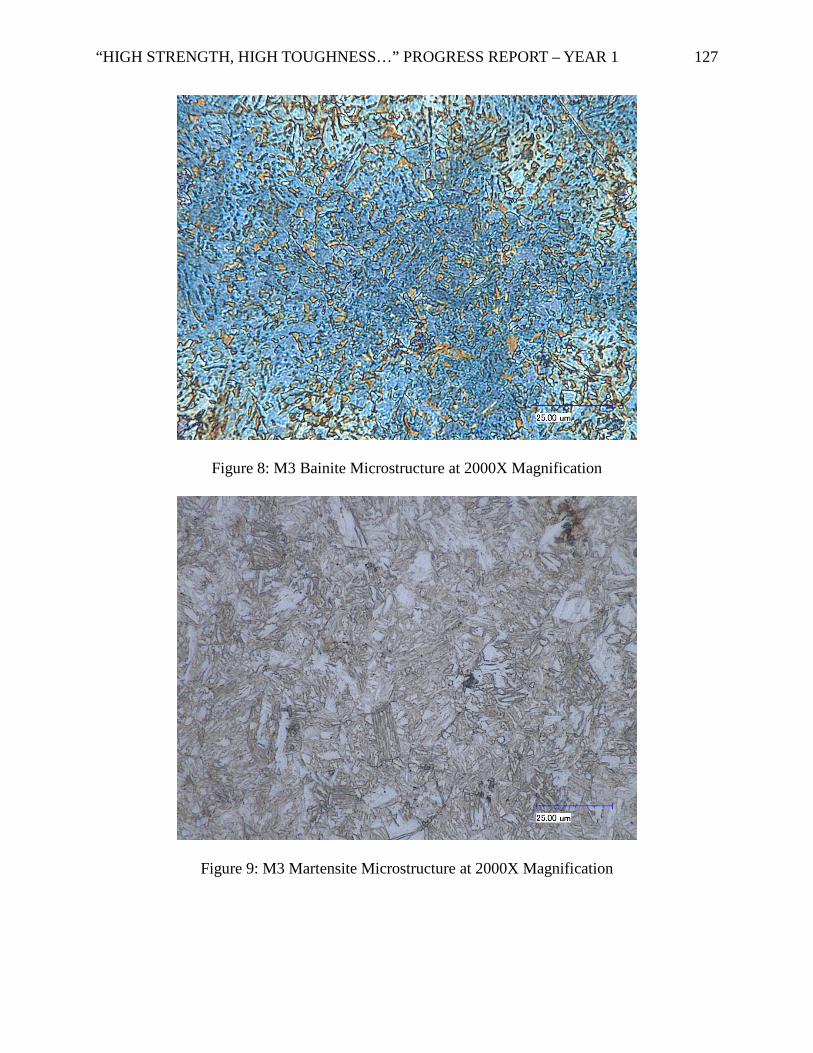
“HIGH STRENGTH, HIGH TOUGHNESS…” PROGRESS REPORT – YEAR 1 127
Figure 8: M3 Bainite Microstructure at 2000X Magnification
Figure 9: M3 Martensite Microstructure at 2000X Magnification
“HIGH STRENGTH, HIGH TOUGHNESS…” PROGRESS REPORT – YEAR 1 128
Appendix N: Bainitic Transformation Report
Microstructural Observation of the Isothermal Bainite Transformation in a Low-Carbon HLSA Forging Steel
Jacob Wolfman
Date: 12/6/17
MEMS 1079: Senior Research
Department of Mechanical Engineering and Materials Science, University of Pittsburgh
Abstract
In this work, the isothermal bainite transformation is observed in two steps. The
first looks at the microstructural development as the steel is cooled at a rate of 30 ˚C/s from the
end forging temperature. The microstructure was examined every 50 ˚C down to 400 ˚C to
understand that rate at which ferrite was forming and to determine the possible amount of bainite
that could form during the isothermal transformation. Much more ferrite was formed during the
cool down to the isothermal hold temperature than was expected which was due to the very fine
grain size. The microstructure was then observed at various hold times at 450 ˚C. The bainite
formed very quickly which was also due to the fine grain size. There was a severe drop in
hardness observed after just a short 7.5 second hold time. After this initial hold time, the
microstructure had only very small observable changes. There was a rebound in hardness
observed during the isothermal hold that could be explained by precipitation hardening which
was delayed to slow diffusion at the low transformation temperature that was used.
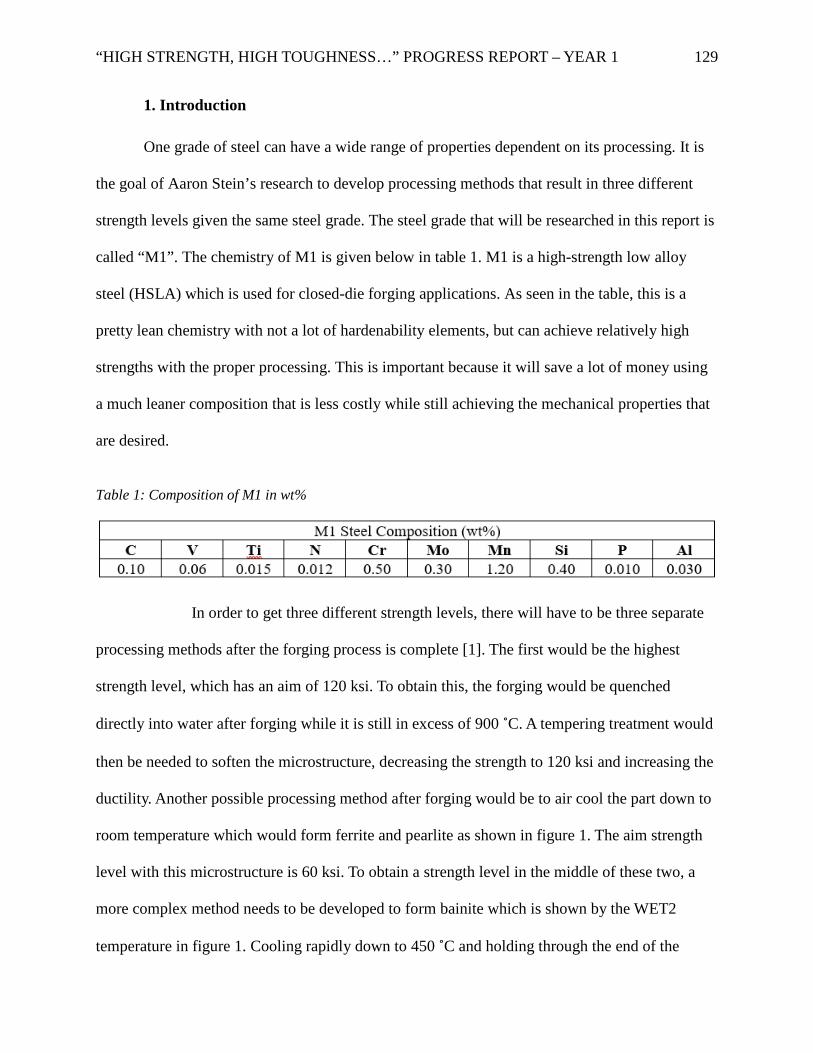
“HIGH STRENGTH, HIGH TOUGHNESS…” PROGRESS REPORT – YEAR 1 129
1. Introduction
One grade of steel can have a wide range of properties dependent on its processing. It is
the goal of Aaron Stein’s research to develop processing methods that result in three different
strength levels given the same steel grade. The steel grade that will be researched in this report is
called “M1”. The chemistry of M1 is given below in table 1. M1 is a high-strength low alloy
steel (HSLA) which is used for closed-die forging applications. As seen in the table, this is a
pretty lean chemistry with not a lot of hardenability elements, but can achieve relatively high
strengths with the proper processing. This is important because it will save a lot of money using
a much leaner composition that is less costly while still achieving the mechanical properties that
are desired.
Table 1: Composition of M1 in wt%
In order to get three different strength levels, there will have to be three separate
processing methods after the forging process is complete [1]. The first would be the highest
strength level, which has an aim of 120 ksi. To obtain this, the forging would be quenched
directly into water after forging while it is still in excess of 900 ˚C. A tempering treatment would
then be needed to soften the microstructure, decreasing the strength to 120 ksi and increasing the
ductility. Another possible processing method after forging would be to air cool the part down to
room temperature which would form ferrite and pearlite as shown in figure 1. The aim strength
level with this microstructure is 60 ksi. To obtain a strength level in the middle of these two, a
more complex method needs to be developed to form bainite which is shown by the WET2
temperature in figure 1. Cooling rapidly down to 450 ˚C and holding through the end of the
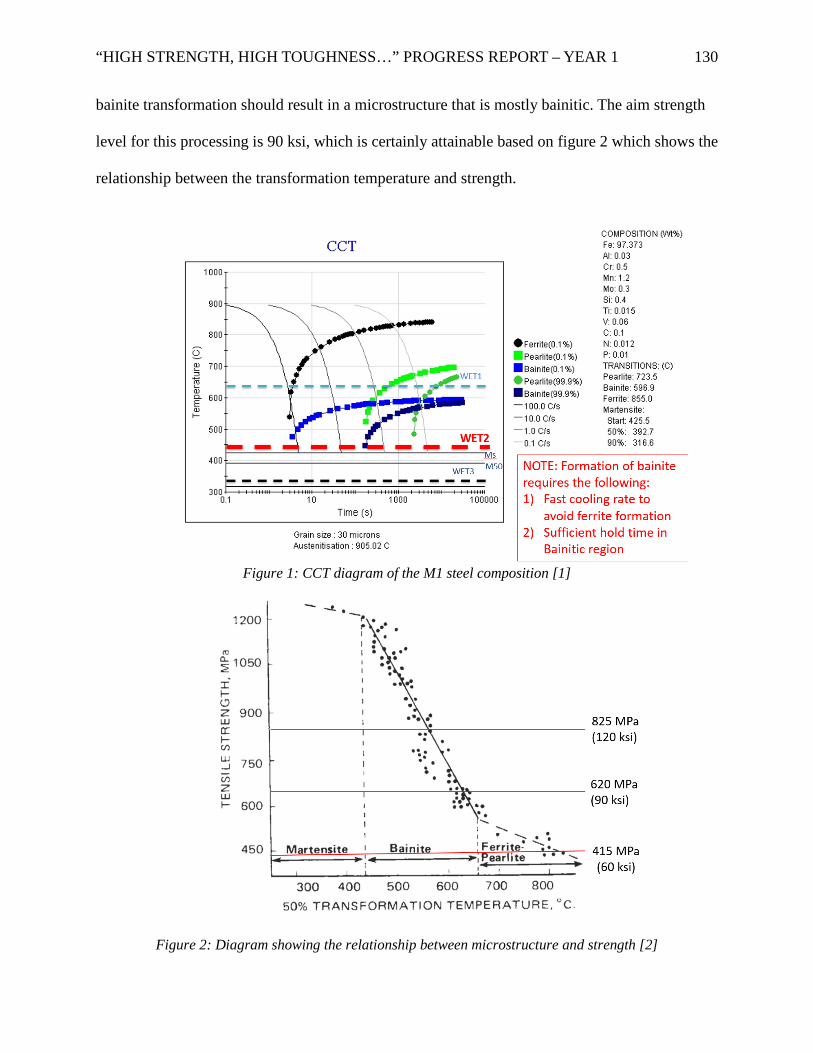
“HIGH STRENGTH, HIGH TOUGHNESS…” PROGRESS REPORT – YEAR 1 130
bainite transformation should result in a microstructure that is mostly bainitic. The aim strength
level for this processing is 90 ksi, which is certainly attainable based on figure 2 which shows the
relationship between the transformation temperature and strength.
Figure 1: CCT diagram of the M1 steel composition [1]
Figure 2: Diagram showing the relationship between microstructure and strength [2]
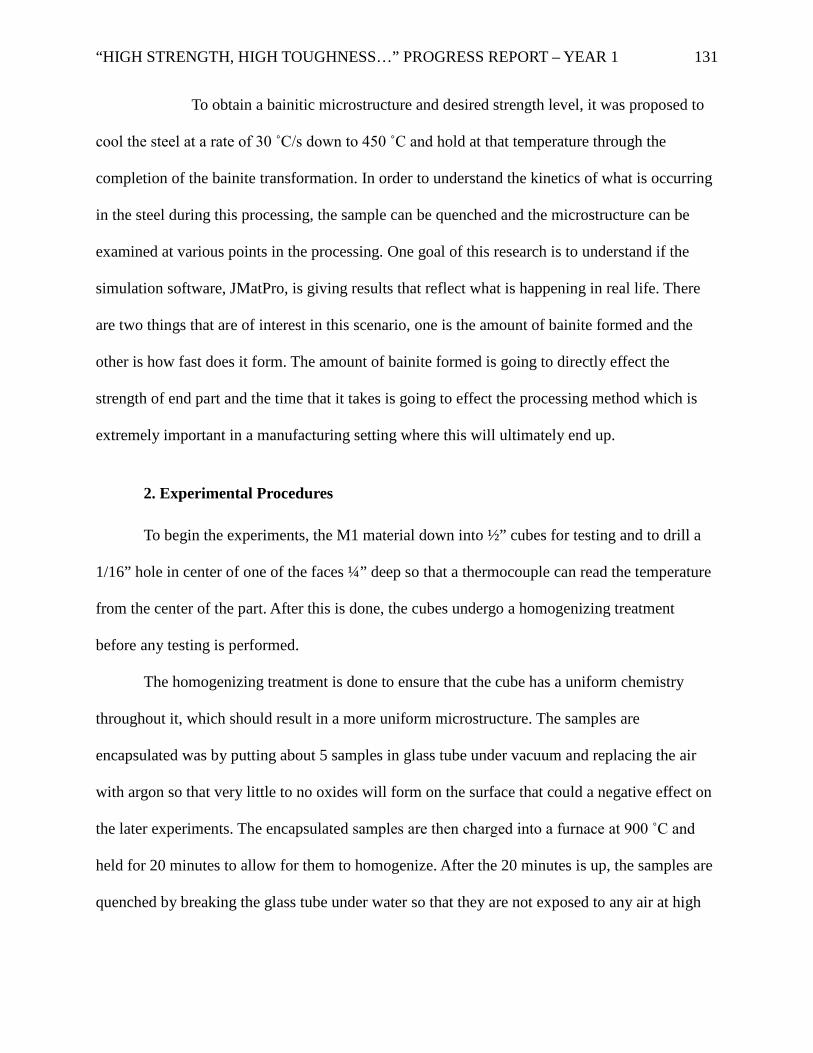
“HIGH STRENGTH, HIGH TOUGHNESS…” PROGRESS REPORT – YEAR 1 131
To obtain a bainitic microstructure and desired strength level, it was proposed to
cool the steel at a rate of 30 ˚C/s down to 450 ˚C and hold at that temperature through the
completion of the bainite transformation. In order to understand the kinetics of what is occurring
in the steel during this processing, the sample can be quenched and the microstructure can be
examined at various points in the processing. One goal of this research is to understand if the
simulation software, JMatPro, is giving results that reflect what is happening in real life. There
are two things that are of interest in this scenario, one is the amount of bainite formed and the
other is how fast does it form. The amount of bainite formed is going to directly effect the
strength of end part and the time that it takes is going to effect the processing method which is
extremely important in a manufacturing setting where this will ultimately end up.
2. Experimental Procedures To begin the experiments, the M1 material down into ½” cubes for testing and to drill a
1/16” hole in center of one of the faces ¼” deep so that a thermocouple can read the temperature
from the center of the part. After this is done, the cubes undergo a homogenizing treatment
before any testing is performed.
The homogenizing treatment is done to ensure that the cube has a uniform chemistry
throughout it, which should result in a more uniform microstructure. The samples are
encapsulated was by putting about 5 samples in glass tube under vacuum and replacing the air
with argon so that very little to no oxides will form on the surface that could a negative effect on
the later experiments. The encapsulated samples are then charged into a furnace at 900 ˚C and
held for 20 minutes to allow for them to homogenize. After the 20 minutes is up, the samples are
quenched by breaking the glass tube under water so that they are not exposed to any air at high
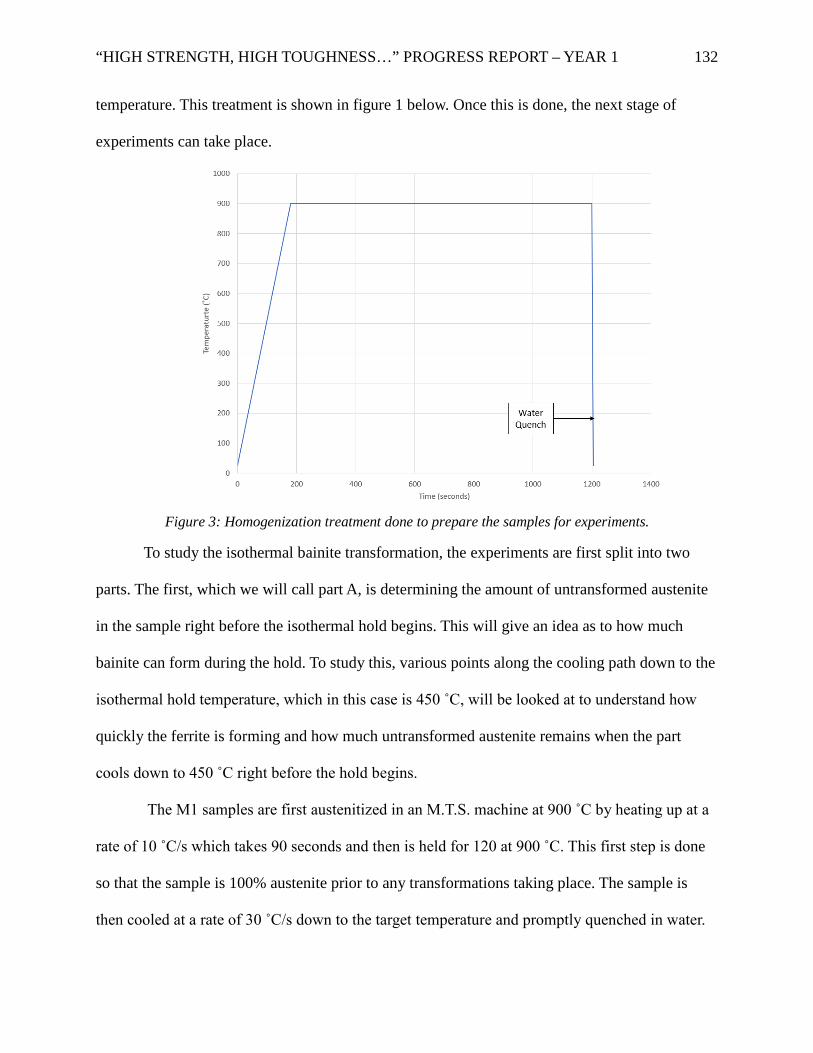
“HIGH STRENGTH, HIGH TOUGHNESS…” PROGRESS REPORT – YEAR 1 132
temperature. This treatment is shown in figure 1 below. Once this is done, the next stage of
experiments can take place.
Figure 3: Homogenization treatment done to prepare the samples for experiments.
To study the isothermal bainite transformation, the experiments are first split into two
parts. The first, which we will call part A, is determining the amount of untransformed austenite
in the sample right before the isothermal hold begins. This will give an idea as to how much
bainite can form during the hold. To study this, various points along the cooling path down to the
isothermal hold temperature, which in this case is 450 ˚C, will be looked at to understand how
quickly the ferrite is forming and how much untransformed austenite remains when the part
cools down to 450 ˚C right before the hold begins.
The M1 samples are first austenitized in an M.T.S. machine at 900 ˚C by heating up at a
rate of 10 ˚C/s which takes 90 seconds and then is held for 120 at 900 ˚C. This first step is done
so that the sample is 100% austenite prior to any transformations taking place. The sample is
then cooled at a rate of 30 ˚C/s down to the target temperature and promptly quenched in water.
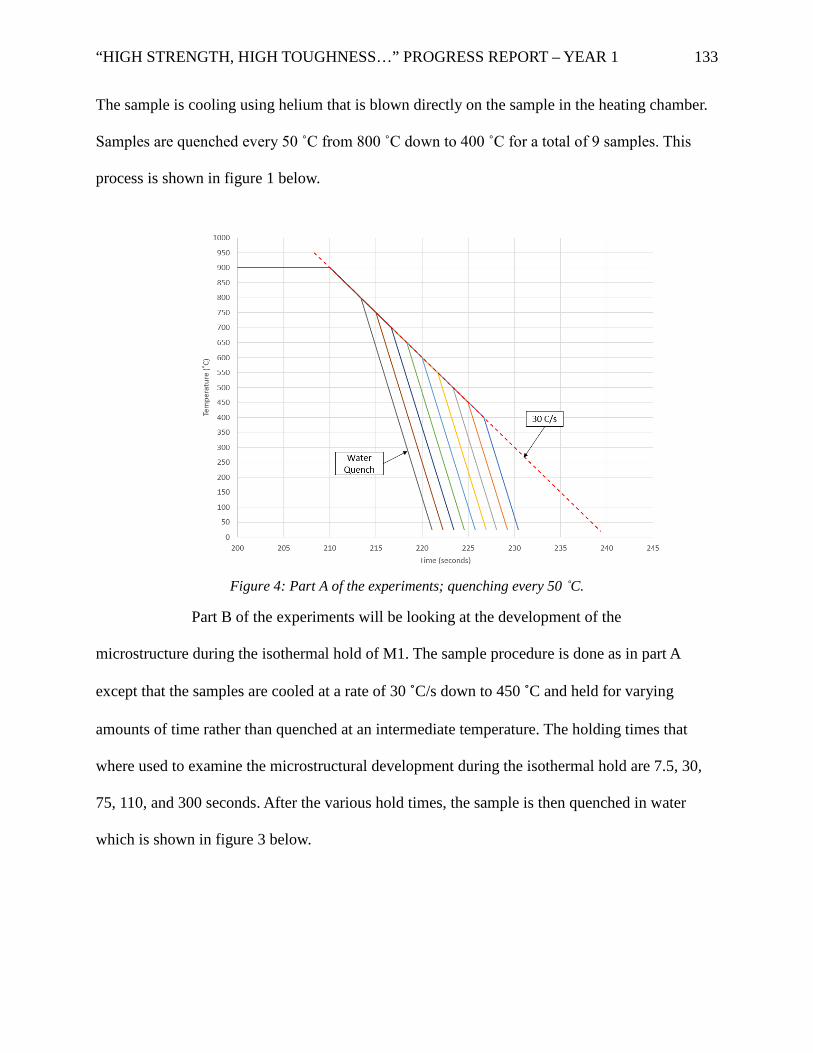
“HIGH STRENGTH, HIGH TOUGHNESS…” PROGRESS REPORT – YEAR 1 133
The sample is cooling using helium that is blown directly on the sample in the heating chamber.
Samples are quenched every 50 ˚C from 800 ˚C down to 400 ˚C for a total of 9 samples. This
process is shown in figure 1 below.
Figure 4: Part A of the experiments; quenching every 50 ˚C.
Part B of the experiments will be looking at the development of the
microstructure during the isothermal hold of M1. The sample procedure is done as in part A
except that the samples are cooled at a rate of 30 ˚C/s down to 450 ˚C and held for varying
amounts of time rather than quenched at an intermediate temperature. The holding times that
where used to examine the microstructural development during the isothermal hold are 7.5, 30,
75, 110, and 300 seconds. After the various hold times, the sample is then quenched in water
which is shown in figure 3 below.
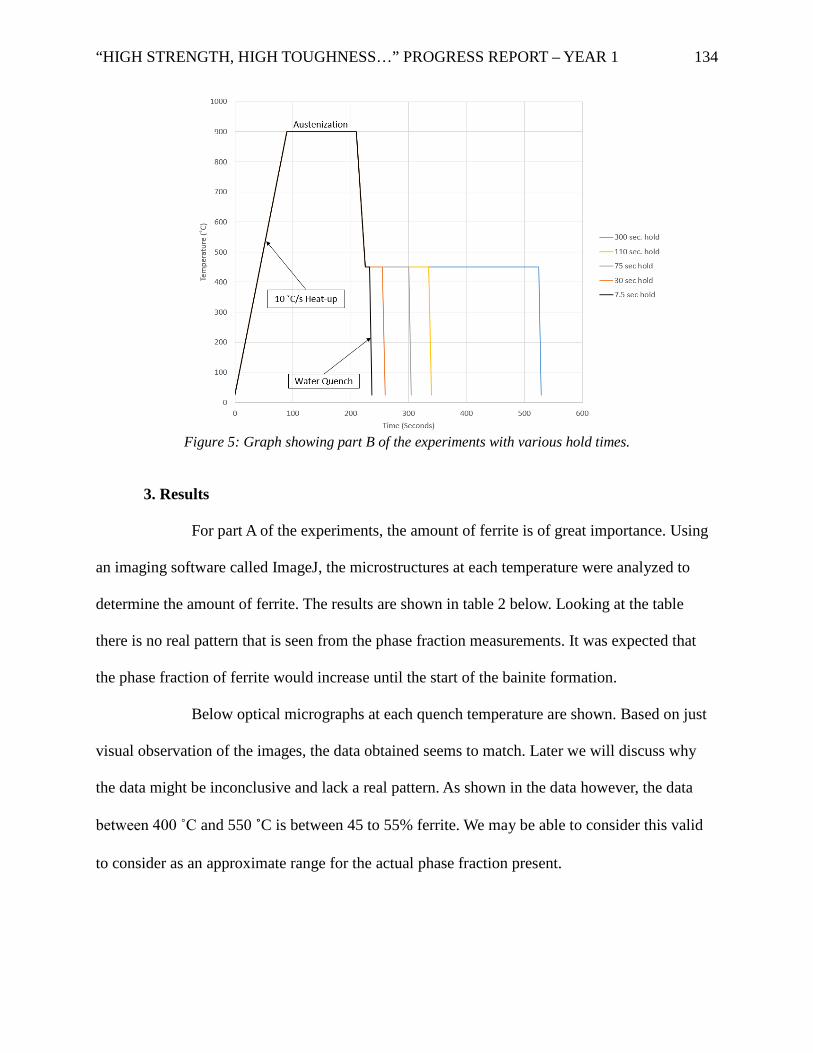
“HIGH STRENGTH, HIGH TOUGHNESS…” PROGRESS REPORT – YEAR 1 134
Figure 5: Graph showing part B of the experiments with various hold times.
3. Results
For part A of the experiments, the amount of ferrite is of great importance. Using
an imaging software called ImageJ, the microstructures at each temperature were analyzed to
determine the amount of ferrite. The results are shown in table 2 below. Looking at the table
there is no real pattern that is seen from the phase fraction measurements. It was expected that
the phase fraction of ferrite would increase until the start of the bainite formation.
Below optical micrographs at each quench temperature are shown. Based on just
visual observation of the images, the data obtained seems to match. Later we will discuss why
the data might be inconclusive and lack a real pattern. As shown in the data however, the data
between 400 ˚C and 550 ˚C is between 45 to 55% ferrite. We may be able to consider this valid
to consider as an approximate range for the actual phase fraction present.
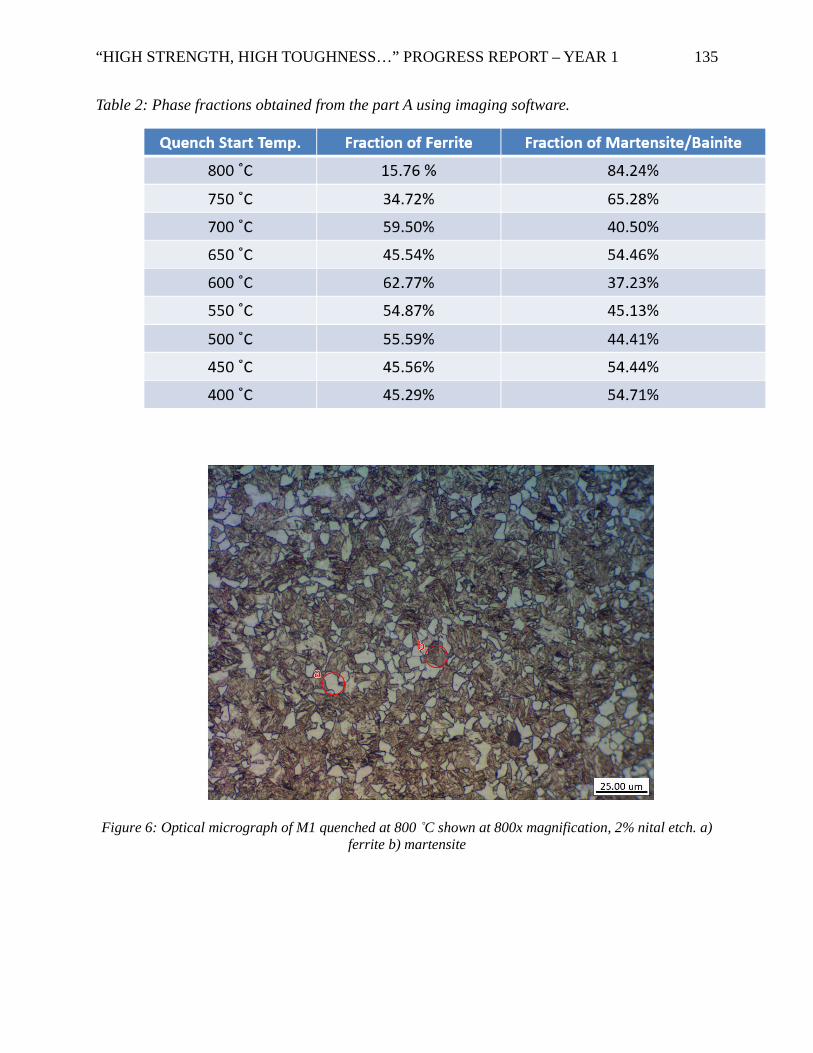
“HIGH STRENGTH, HIGH TOUGHNESS…” PROGRESS REPORT – YEAR 1 135
Table 2: Phase fractions obtained from the part A using imaging software.
Figure 6: Optical micrograph of M1 quenched at 800 ˚C shown at 800x magnification, 2% nital etch. a) ferrite b) martensite
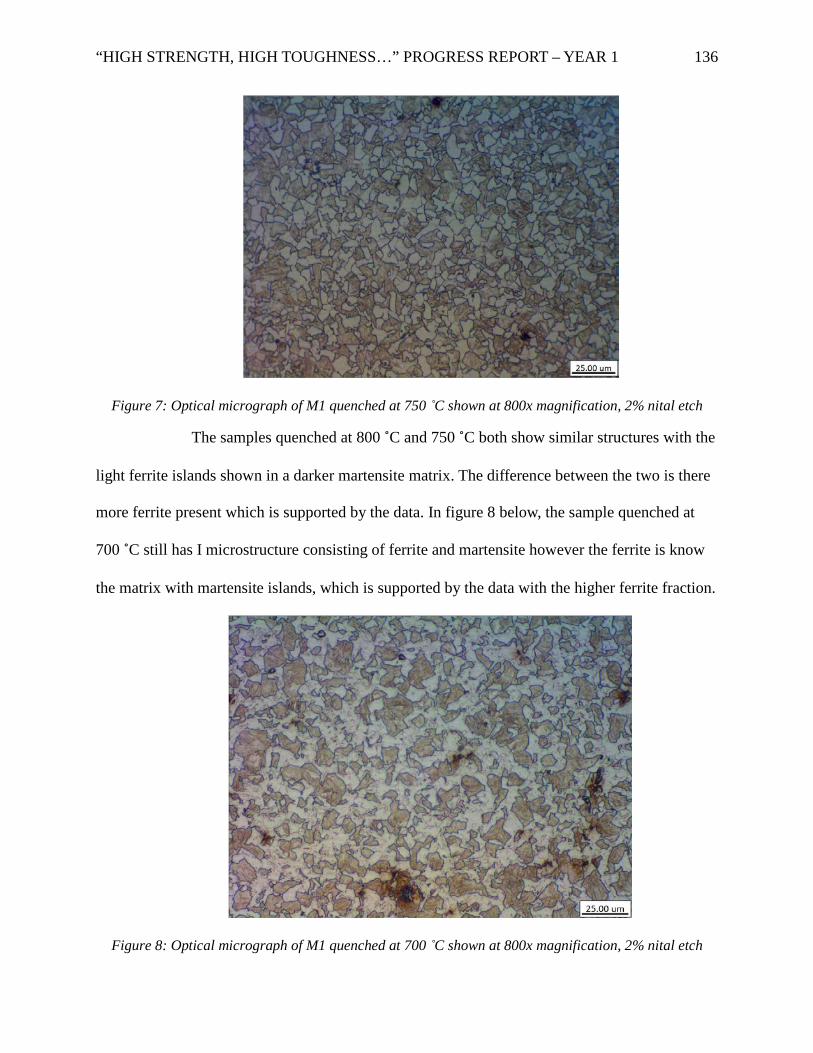
“HIGH STRENGTH, HIGH TOUGHNESS…” PROGRESS REPORT – YEAR 1 136
Figure 7: Optical micrograph of M1 quenched at 750 ˚C shown at 800x magnification, 2% nital etch
The samples quenched at 800 ˚C and 750 ˚C both show similar structures with the
light ferrite islands shown in a darker martensite matrix. The difference between the two is there
more ferrite present which is supported by the data. In figure 8 below, the sample quenched at
700 ˚C still has I microstructure consisting of ferrite and martensite however the ferrite is know
the matrix with martensite islands, which is supported by the data with the higher ferrite fraction.
Figure 8: Optical micrograph of M1 quenched at 700 ˚C shown at 800x magnification, 2% nital etch
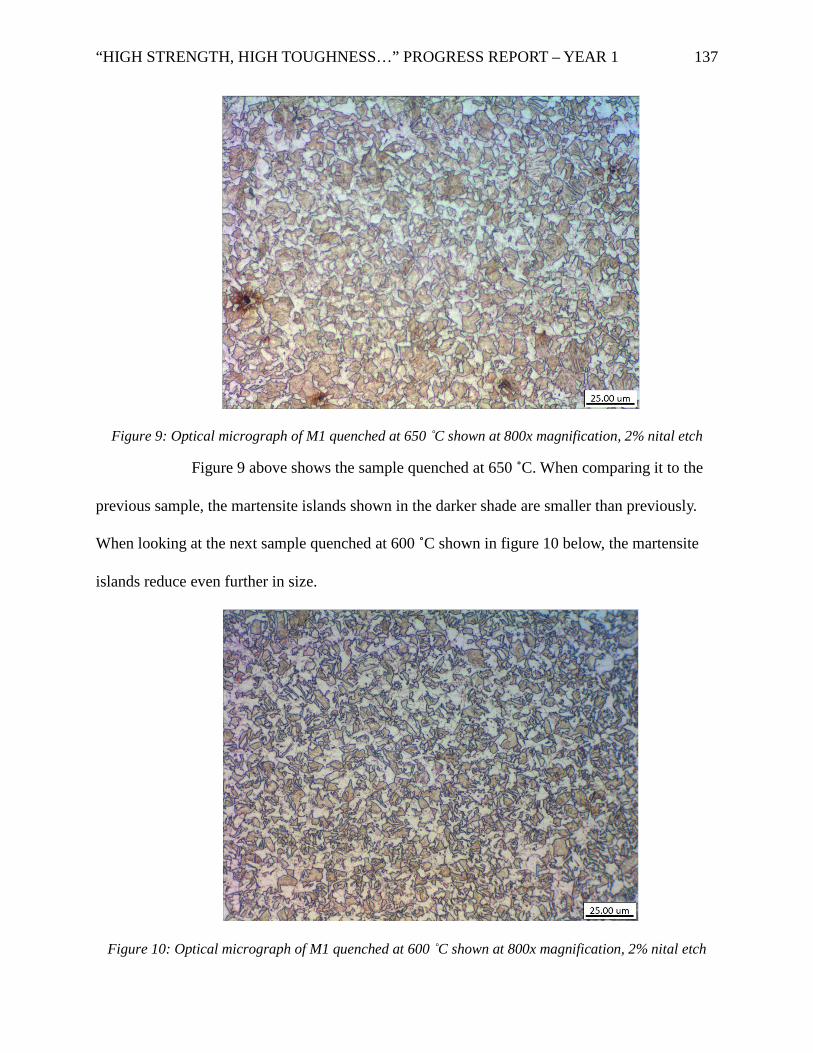
“HIGH STRENGTH, HIGH TOUGHNESS…” PROGRESS REPORT – YEAR 1 137
Figure 9: Optical micrograph of M1 quenched at 650 ˚C shown at 800x magnification, 2% nital etch
Figure 9 above shows the sample quenched at 650 ˚C. When comparing it to the
previous sample, the martensite islands shown in the darker shade are smaller than previously.
When looking at the next sample quenched at 600 ˚C shown in figure 10 below, the martensite
islands reduce even further in size.
Figure 10: Optical micrograph of M1 quenched at 600 ˚C shown at 800x magnification, 2% nital etch
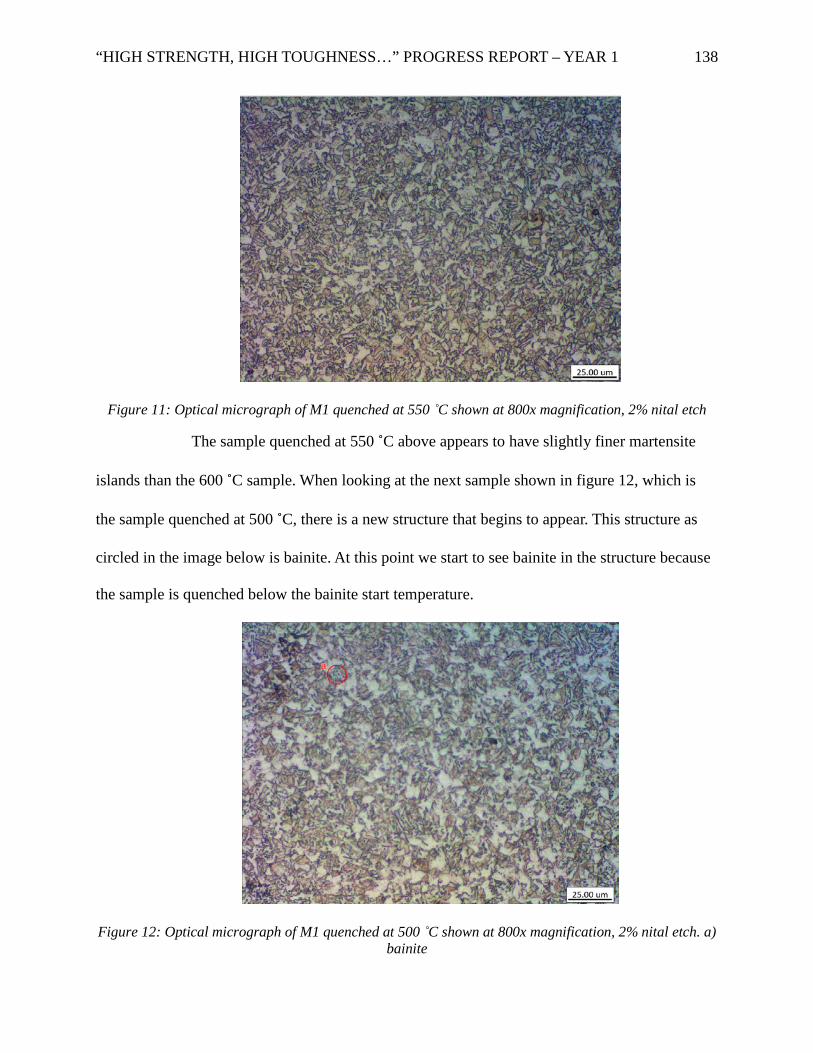
“HIGH STRENGTH, HIGH TOUGHNESS…” PROGRESS REPORT – YEAR 1 138
Figure 11: Optical micrograph of M1 quenched at 550 ˚C shown at 800x magnification, 2% nital etch
The sample quenched at 550 ˚C above appears to have slightly finer martensite
islands than the 600 ˚C sample. When looking at the next sample shown in figure 12, which is
the sample quenched at 500 ˚C, there is a new structure that begins to appear. This structure as
circled in the image below is bainite. At this point we start to see bainite in the structure because
the sample is quenched below the bainite start temperature.
Figure 12: Optical micrograph of M1 quenched at 500 ˚C shown at 800x magnification, 2% nital etch. a) bainite
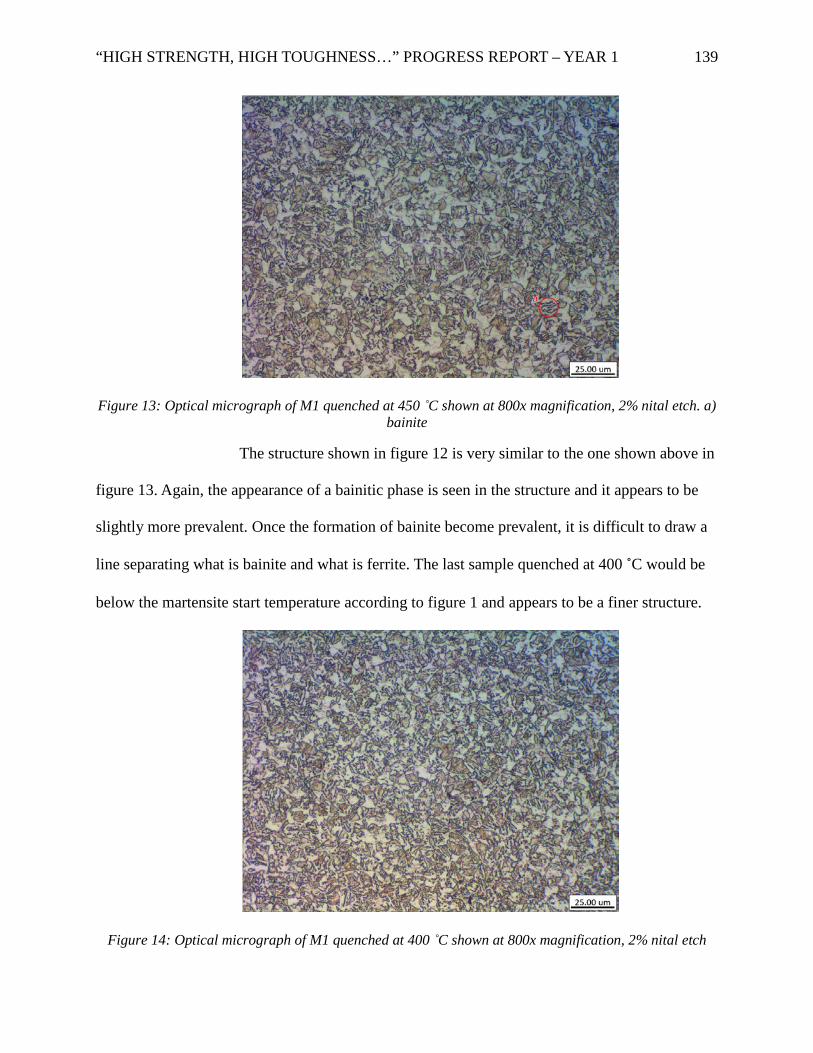
“HIGH STRENGTH, HIGH TOUGHNESS…” PROGRESS REPORT – YEAR 1 139
Figure 13: Optical micrograph of M1 quenched at 450 ˚C shown at 800x magnification, 2% nital etch. a) bainite
The structure shown in figure 12 is very similar to the one shown above in
figure 13. Again, the appearance of a bainitic phase is seen in the structure and it appears to be
slightly more prevalent. Once the formation of bainite become prevalent, it is difficult to draw a
line separating what is bainite and what is ferrite. The last sample quenched at 400 ˚C would be
below the martensite start temperature according to figure 1 and appears to be a finer structure.
Figure 14: Optical micrograph of M1 quenched at 400 ˚C shown at 800x magnification, 2% nital etch
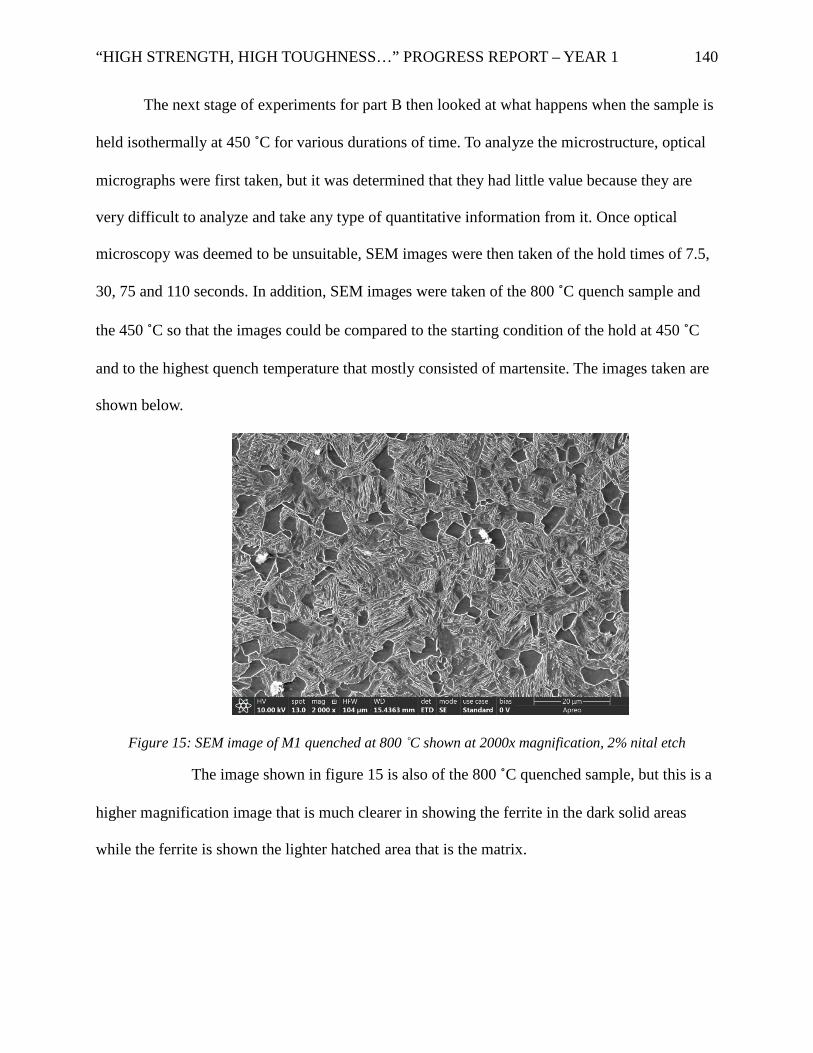
“HIGH STRENGTH, HIGH TOUGHNESS…” PROGRESS REPORT – YEAR 1 140
The next stage of experiments for part B then looked at what happens when the sample is
held isothermally at 450 ˚C for various durations of time. To analyze the microstructure, optical
micrographs were first taken, but it was determined that they had little value because they are
very difficult to analyze and take any type of quantitative information from it. Once optical
microscopy was deemed to be unsuitable, SEM images were then taken of the hold times of 7.5,
30, 75 and 110 seconds. In addition, SEM images were taken of the 800 ˚C quench sample and
the 450 ˚C so that the images could be compared to the starting condition of the hold at 450 ˚C
and to the highest quench temperature that mostly consisted of martensite. The images taken are
shown below.
Figure 15: SEM image of M1 quenched at 800 ˚C shown at 2000x magnification, 2% nital etch
The image shown in figure 15 is also of the 800 ˚C quenched sample, but this is a
higher magnification image that is much clearer in showing the ferrite in the dark solid areas
while the ferrite is shown the lighter hatched area that is the matrix.
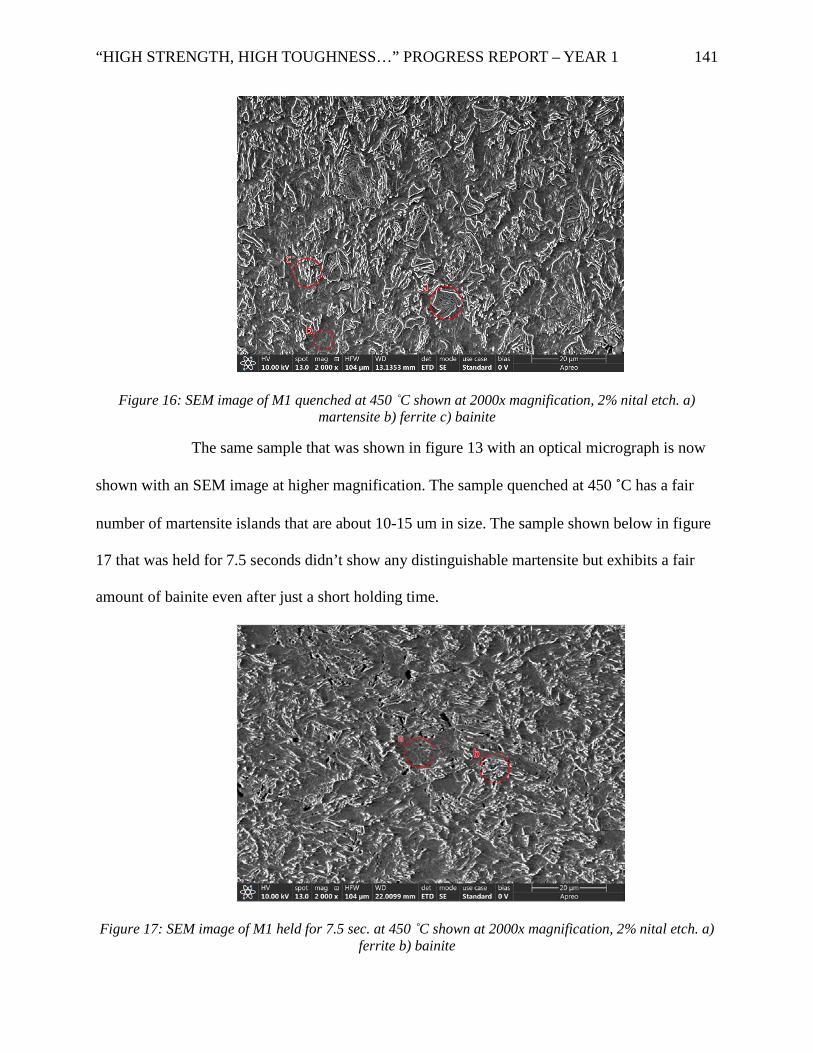
“HIGH STRENGTH, HIGH TOUGHNESS…” PROGRESS REPORT – YEAR 1 141
Figure 16: SEM image of M1 quenched at 450 ˚C shown at 2000x magnification, 2% nital etch. a) martensite b) ferrite c) bainite
The same sample that was shown in figure 13 with an optical micrograph is now
shown with an SEM image at higher magnification. The sample quenched at 450 ˚C has a fair
number of martensite islands that are about 10-15 um in size. The sample shown below in figure
17 that was held for 7.5 seconds didn’t show any distinguishable martensite but exhibits a fair
amount of bainite even after just a short holding time.
Figure 17: SEM image of M1 held for 7.5 sec. at 450 ˚C shown at 2000x magnification, 2% nital etch. a) ferrite b) bainite
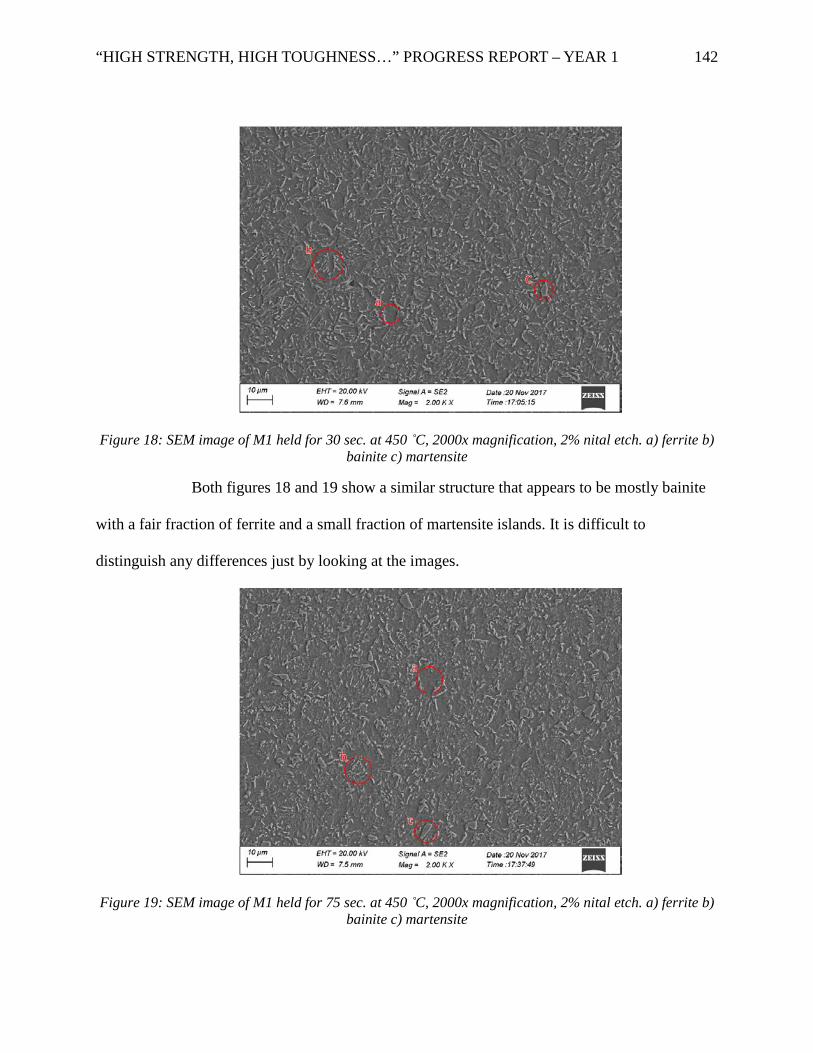
“HIGH STRENGTH, HIGH TOUGHNESS…” PROGRESS REPORT – YEAR 1 142
Figure 18: SEM image of M1 held for 30 sec. at 450 ˚C, 2000x magnification, 2% nital etch. a) ferrite b) bainite c) martensite
Both figures 18 and 19 show a similar structure that appears to be mostly bainite
with a fair fraction of ferrite and a small fraction of martensite islands. It is difficult to
distinguish any differences just by looking at the images.
Figure 19: SEM image of M1 held for 75 sec. at 450 ˚C, 2000x magnification, 2% nital etch. a) ferrite b) bainite c) martensite
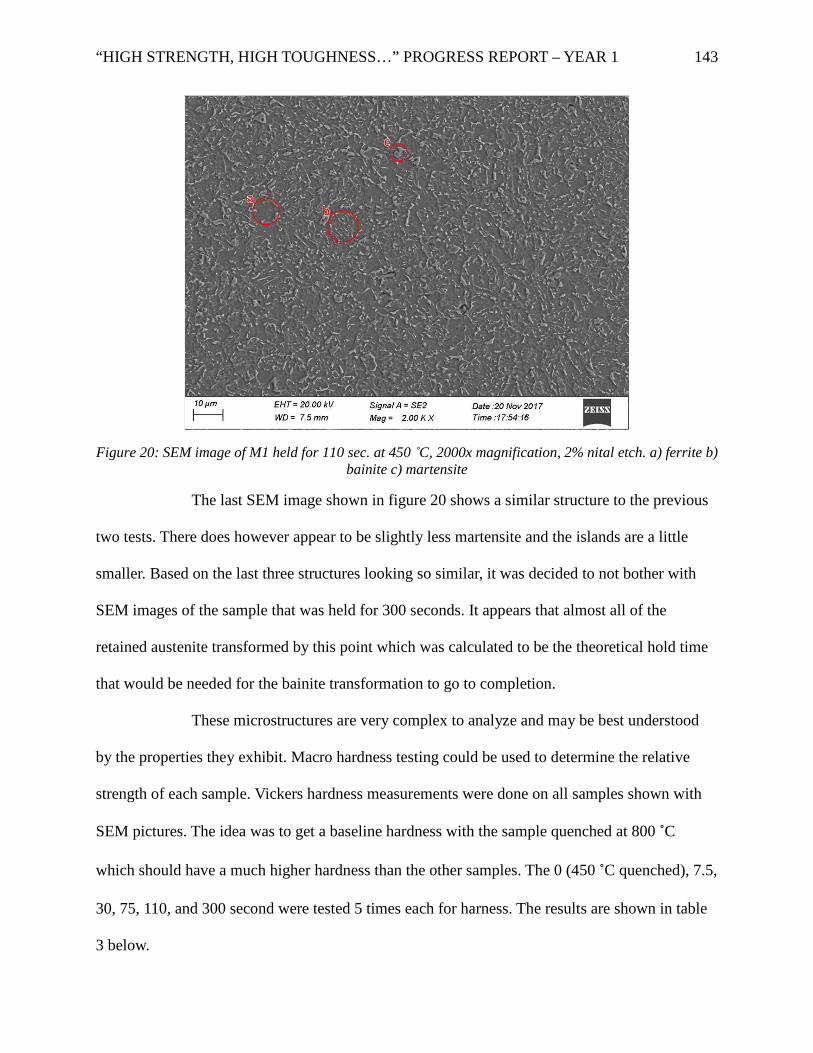
“HIGH STRENGTH, HIGH TOUGHNESS…” PROGRESS REPORT – YEAR 1 143
Figure 20: SEM image of M1 held for 110 sec. at 450 ˚C, 2000x magnification, 2% nital etch. a) ferrite b) bainite c) martensite
The last SEM image shown in figure 20 shows a similar structure to the previous
two tests. There does however appear to be slightly less martensite and the islands are a little
smaller. Based on the last three structures looking so similar, it was decided to not bother with
SEM images of the sample that was held for 300 seconds. It appears that almost all of the
retained austenite transformed by this point which was calculated to be the theoretical hold time
that would be needed for the bainite transformation to go to completion.
These microstructures are very complex to analyze and may be best understood
by the properties they exhibit. Macro hardness testing could be used to determine the relative
strength of each sample. Vickers hardness measurements were done on all samples shown with
SEM pictures. The idea was to get a baseline hardness with the sample quenched at 800 ˚C
which should have a much higher hardness than the other samples. The 0 (450 ˚C quenched), 7.5,
30, 75, 110, and 300 second were tested 5 times each for harness. The results are shown in table
3 below.
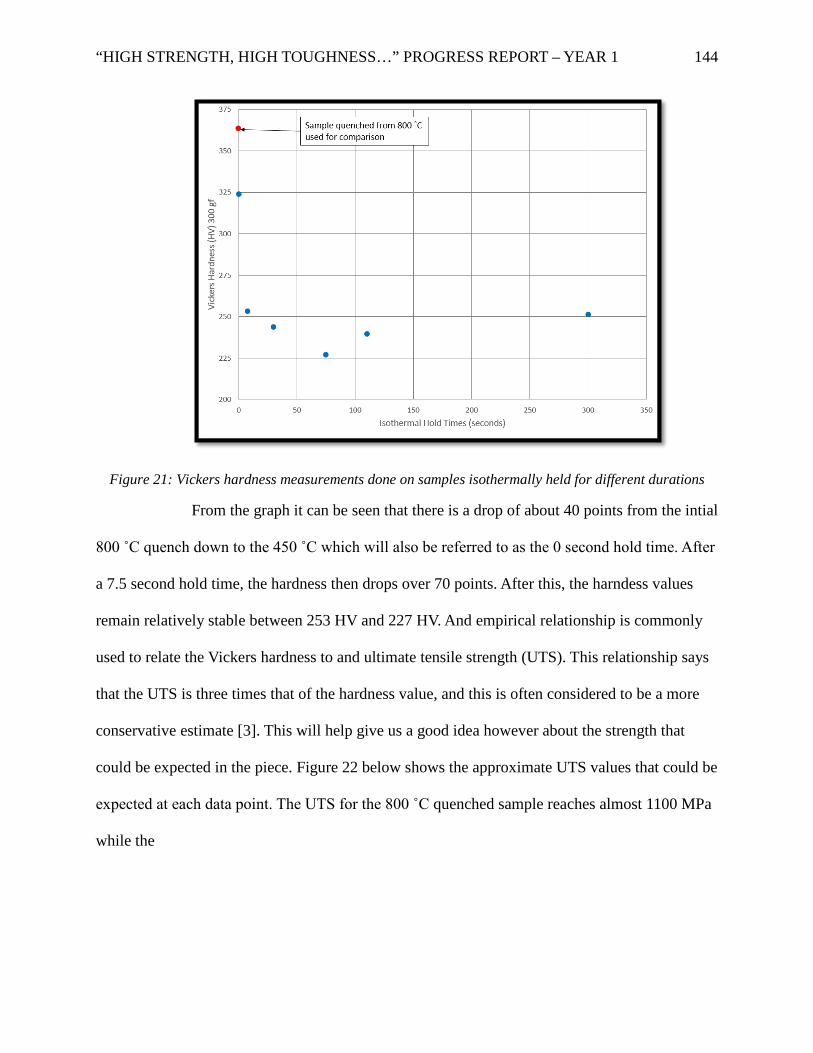
“HIGH STRENGTH, HIGH TOUGHNESS…” PROGRESS REPORT – YEAR 1 144
Figure 21: Vickers hardness measurements done on samples isothermally held for different durations
From the graph it can be seen that there is a drop of about 40 points from the intial
800 ˚C quench down to the 450 ˚C which will also be referred to as the 0 second hold time. After
a 7.5 second hold time, the hardness then drops over 70 points. After this, the harndess values
remain relatively stable between 253 HV and 227 HV. And empirical relationship is commonly
used to relate the Vickers hardness to and ultimate tensile strength (UTS). This relationship says
that the UTS is three times that of the hardness value, and this is often considered to be a more
conservative estimate [3]. This will help give us a good idea however about the strength that
could be expected in the piece. Figure 22 below shows the approximate UTS values that could be
expected at each data point. The UTS for the 800 ˚C quenched sample reaches almost 1100 MPa
while the
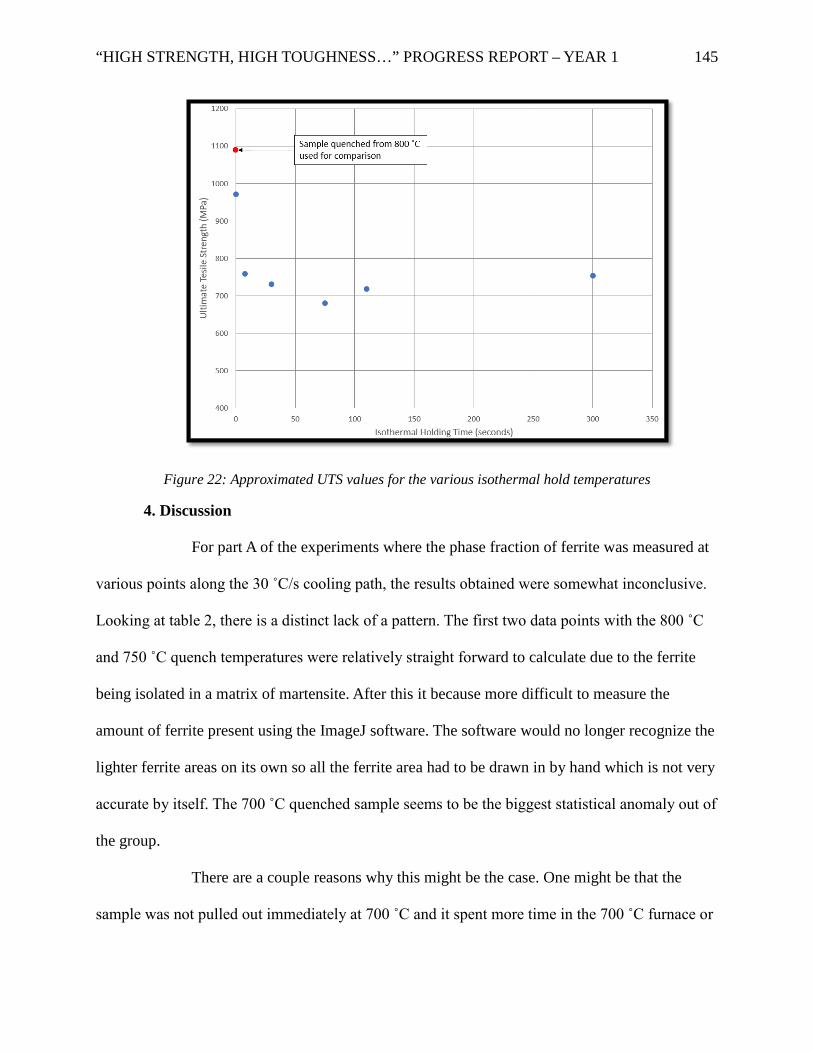
“HIGH STRENGTH, HIGH TOUGHNESS…” PROGRESS REPORT – YEAR 1 145
Figure 22: Approximated UTS values for the various isothermal hold temperatures
4. Discussion
For part A of the experiments where the phase fraction of ferrite was measured at
various points along the 30 ˚C/s cooling path, the results obtained were somewhat inconclusive.
Looking at table 2, there is a distinct lack of a pattern. The first two data points with the 800 ˚C
and 750 ˚C quench temperatures were relatively straight forward to calculate due to the ferrite
being isolated in a matrix of martensite. After this it because more difficult to measure the
amount of ferrite present using the ImageJ software. The software would no longer recognize the
lighter ferrite areas on its own so all the ferrite area had to be drawn in by hand which is not very
accurate by itself. The 700 ˚C quenched sample seems to be the biggest statistical anomaly out of
the group.
There are a couple reasons why this might be the case. One might be that the
sample was not pulled out immediately at 700 ˚C and it spent more time in the 700 ˚C furnace or
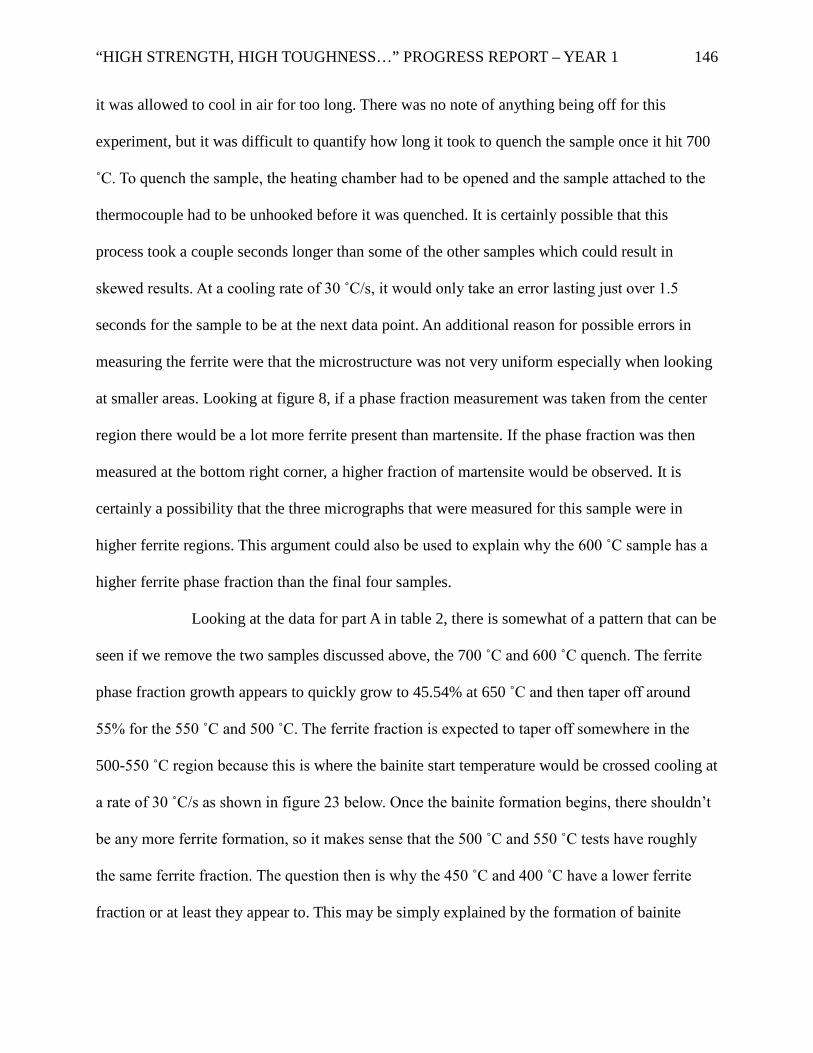
“HIGH STRENGTH, HIGH TOUGHNESS…” PROGRESS REPORT – YEAR 1 146
it was allowed to cool in air for too long. There was no note of anything being off for this
experiment, but it was difficult to quantify how long it took to quench the sample once it hit 700
˚C. To quench the sample, the heating chamber had to be opened and the sample attached to the
thermocouple had to be unhooked before it was quenched. It is certainly possible that this
process took a couple seconds longer than some of the other samples which could result in
skewed results. At a cooling rate of 30 ˚C/s, it would only take an error lasting just over 1.5
seconds for the sample to be at the next data point. An additional reason for possible errors in
measuring the ferrite were that the microstructure was not very uniform especially when looking
at smaller areas. Looking at figure 8, if a phase fraction measurement was taken from the center
region there would be a lot more ferrite present than martensite. If the phase fraction was then
measured at the bottom right corner, a higher fraction of martensite would be observed. It is
certainly a possibility that the three micrographs that were measured for this sample were in
higher ferrite regions. This argument could also be used to explain why the 600 ˚C sample has a
higher ferrite phase fraction than the final four samples.
Looking at the data for part A in table 2, there is somewhat of a pattern that can be
seen if we remove the two samples discussed above, the 700 ˚C and 600 ˚C quench. The ferrite
phase fraction growth appears to quickly grow to 45.54% at 650 ˚C and then taper off around
55% for the 550 ˚C and 500 ˚C. The ferrite fraction is expected to taper off somewhere in the
500-550 ˚C region because this is where the bainite start temperature would be crossed cooling at
a rate of 30 ˚C/s as shown in figure 23 below. Once the bainite formation begins, there shouldn’t
be any more ferrite formation, so it makes sense that the 500 ˚C and 550 ˚C tests have roughly
the same ferrite fraction. The question then is why the 450 ˚C and 400 ˚C have a lower ferrite
fraction or at least they appear to. This may be simply explained by the formation of bainite
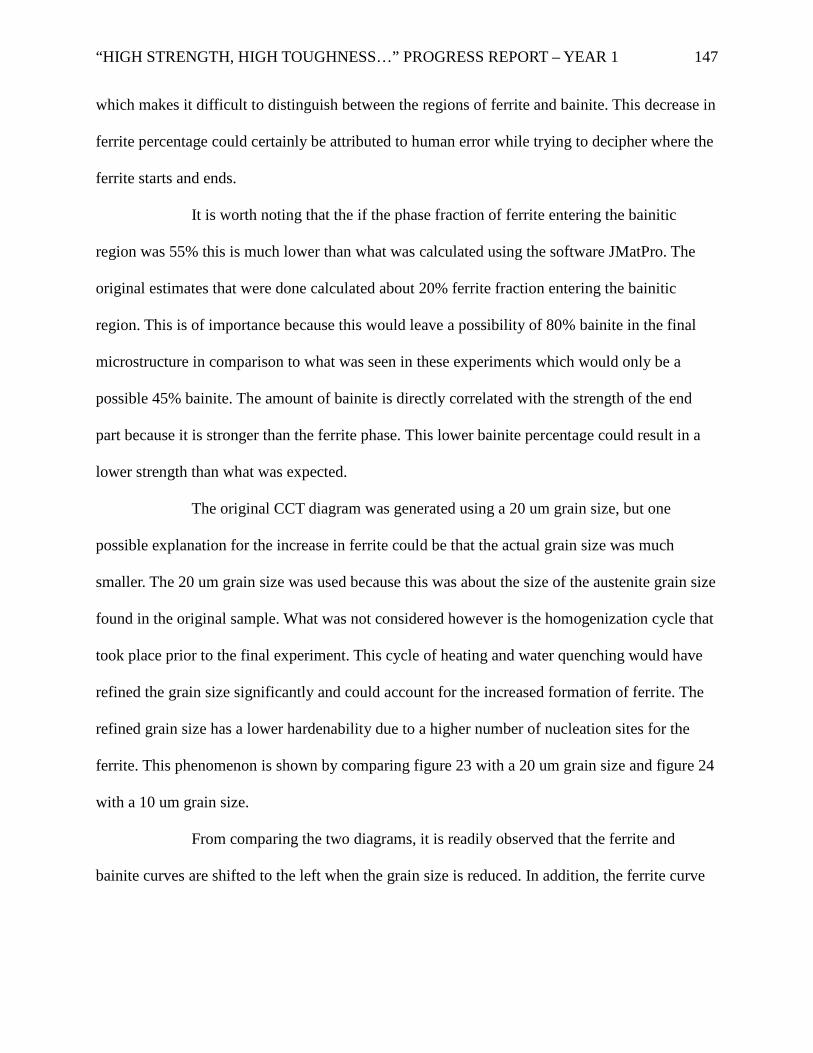
“HIGH STRENGTH, HIGH TOUGHNESS…” PROGRESS REPORT – YEAR 1 147
which makes it difficult to distinguish between the regions of ferrite and bainite. This decrease in
ferrite percentage could certainly be attributed to human error while trying to decipher where the
ferrite starts and ends.
It is worth noting that the if the phase fraction of ferrite entering the bainitic
region was 55% this is much lower than what was calculated using the software JMatPro. The
original estimates that were done calculated about 20% ferrite fraction entering the bainitic
region. This is of importance because this would leave a possibility of 80% bainite in the final
microstructure in comparison to what was seen in these experiments which would only be a
possible 45% bainite. The amount of bainite is directly correlated with the strength of the end
part because it is stronger than the ferrite phase. This lower bainite percentage could result in a
lower strength than what was expected.
The original CCT diagram was generated using a 20 um grain size, but one
possible explanation for the increase in ferrite could be that the actual grain size was much
smaller. The 20 um grain size was used because this was about the size of the austenite grain size
found in the original sample. What was not considered however is the homogenization cycle that
took place prior to the final experiment. This cycle of heating and water quenching would have
refined the grain size significantly and could account for the increased formation of ferrite. The
refined grain size has a lower hardenability due to a higher number of nucleation sites for the
ferrite. This phenomenon is shown by comparing figure 23 with a 20 um grain size and figure 24
with a 10 um grain size.
From comparing the two diagrams, it is readily observed that the ferrite and
bainite curves are shifted to the left when the grain size is reduced. In addition, the ferrite curve
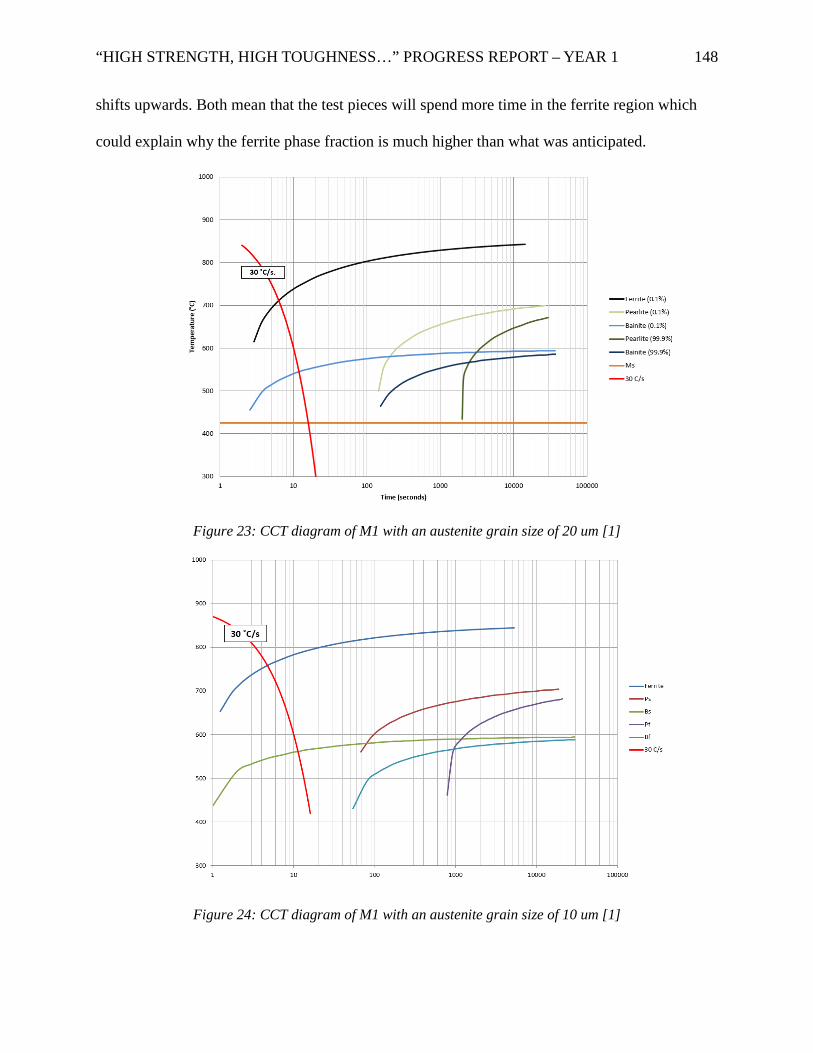
“HIGH STRENGTH, HIGH TOUGHNESS…” PROGRESS REPORT – YEAR 1 148
shifts upwards. Both mean that the test pieces will spend more time in the ferrite region which
could explain why the ferrite phase fraction is much higher than what was anticipated.
Figure 23: CCT diagram of M1 with an austenite grain size of 20 um [1]
Figure 24: CCT diagram of M1 with an austenite grain size of 10 um [1]
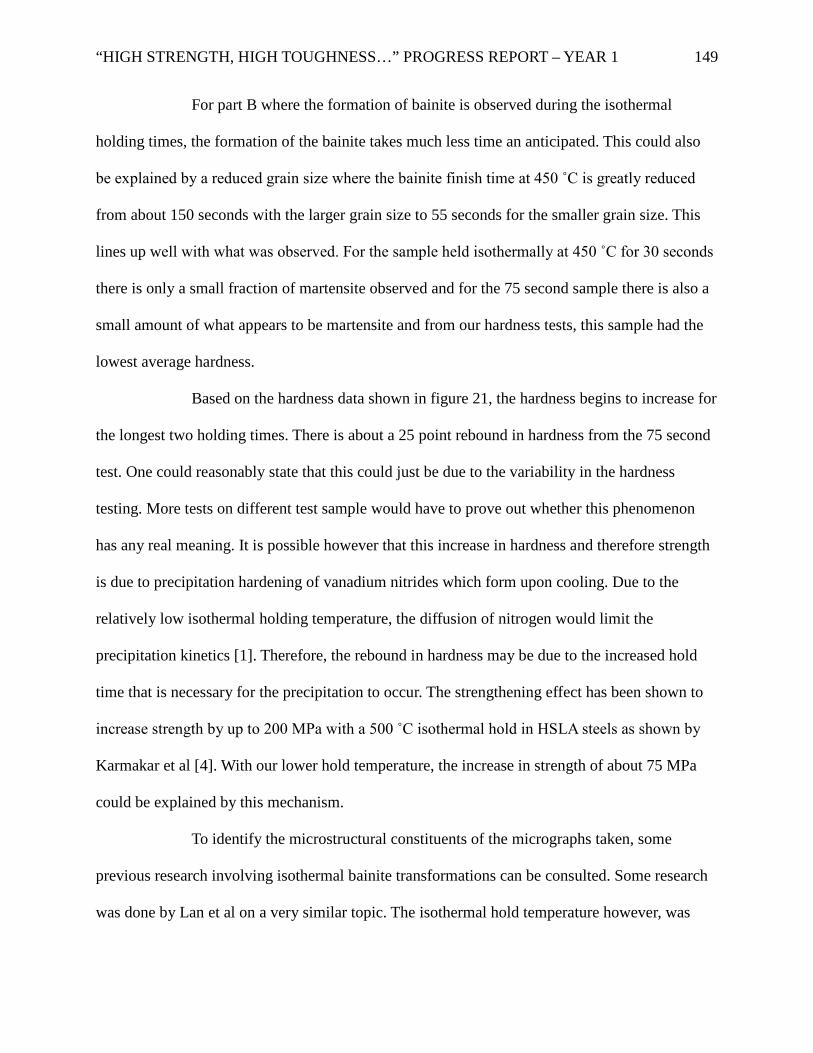
“HIGH STRENGTH, HIGH TOUGHNESS…” PROGRESS REPORT – YEAR 1 149
For part B where the formation of bainite is observed during the isothermal
holding times, the formation of the bainite takes much less time an anticipated. This could also
be explained by a reduced grain size where the bainite finish time at 450 ˚C is greatly reduced
from about 150 seconds with the larger grain size to 55 seconds for the smaller grain size. This
lines up well with what was observed. For the sample held isothermally at 450 ˚C for 30 seconds
there is only a small fraction of martensite observed and for the 75 second sample there is also a
small amount of what appears to be martensite and from our hardness tests, this sample had the
lowest average hardness.
Based on the hardness data shown in figure 21, the hardness begins to increase for
the longest two holding times. There is about a 25 point rebound in hardness from the 75 second
test. One could reasonably state that this could just be due to the variability in the hardness
testing. More tests on different test sample would have to prove out whether this phenomenon
has any real meaning. It is possible however that this increase in hardness and therefore strength
is due to precipitation hardening of vanadium nitrides which form upon cooling. Due to the
relatively low isothermal holding temperature, the diffusion of nitrogen would limit the
precipitation kinetics [1]. Therefore, the rebound in hardness may be due to the increased hold
time that is necessary for the precipitation to occur. The strengthening effect has been shown to
increase strength by up to 200 MPa with a 500 ˚C isothermal hold in HSLA steels as shown by
Karmakar et al [4]. With our lower hold temperature, the increase in strength of about 75 MPa
could be explained by this mechanism.
To identify the microstructural constituents of the micrographs taken, some
previous research involving isothermal bainite transformations can be consulted. Some research
was done by Lan et al on a very similar topic. The isothermal hold temperature however, was
“HIGH STRENGTH, HIGH TOUGHNESS…” PROGRESS REPORT – YEAR 1 150
higher however, but the observed microstructures look similar. Figure 25 shows some of the
micrographs of their testing. The cooling rate used to get down to the holding temperature was
twice as fast as what was used in the experiments in this paper. There doesn’t appear to be the
large amount off ferrite that was observed in the microstructures above, but the regions of bainite
and martensite look very similar, with the addition of a martensite/austenite constituent which
also appears to be present in our samples.
Figure 25: Lan et al. optical micrographs showing isothermal bainite microstructures. [5]
5. Conclusion
The isothermal transformation of bainite in a HSLA steel used for the closed-die
forging industry was studied in the set of experiments outlined in the paper. The first set of
experiments, part A, looked at the transformation kinetics of ferrite upon cooling down from the
austenization temperature at a rate of 30 ˚C/s. The real area of interest here was to determine the
amount of untransformed austenite that is present once the isothermal holding temperature of
450 ˚C is reached. The phase fraction was determined to be about 55% however it was difficult

“HIGH STRENGTH, HIGH TOUGHNESS…” PROGRESS REPORT – YEAR 1 151
to distinguish between the regions of ferrite and bainite that had formed. Regardless, this high
phase fraction was much higher than anticipated. This was most likely due to underestimating the
grain size due to the refinement during the homogenization process. The reduced austenite grain
size would increase the nucleation of ferrite grains upon cooling.
The second part that was observed was the isothermal transformation of bainite.
This was also different than what was predicted due to the refined grain size. There was less
available austenite that could transform to bainite and the finer grain size also sped of the
kinetics of the bainitic transformation. Little changes in the microstructure were observed after
the 30 second hold time. Hardness measurements were taken to try and distinguish any
differences between the isothermal holding times. There is a rapid decrease in hardness from the
sample with no hold time at 450 ˚C to the sample that is held for 7.5 seconds and another small
decline at 30 seconds. The micrographs reveal that the large martensite islands have disappeared
during the short hold time and bainite has transformed.
The research that was carried out in this paper was done to better understand what
is happening to the microstructure during the isothermal hold which is being looked into to being
used as a possible processing method. Due to the slower cooling rate down to the isothermal hold
temperature, which simulated the expected cooling rate for manufacturing, and the very fine
grain size, there was not enough hardenability to form the type of microstructure that was
expected. On the contrary, the hardness measurements suggest that the tensile strength from this
processing method could exceed 700 MPa. Further testing would need to be conducted to
determine if this strength is feasible on a larger scale part and additional testing of the toughness
should be performed before using this method in a manufacturing environment. The idea behind
this type of processing is that it is uses the existing stored energy in the part as heat to form and
“HIGH STRENGTH, HIGH TOUGHNESS…” PROGRESS REPORT – YEAR 1 152
ideal set of mechanical properties without the need for additional heat treatments. Therefore, full
scale testing and additional types of mechanical testing should be performed to determine if the
microstructure that is obtain is acceptable for parts that will be used in engineering applications.
References
[1] Liangyun Lan, Chunlin Qiu, Dewen Zhao. Kinetics Modelling of Isothermal Bainite
Transformation in Low Carbon Multi-Microalloyed Steel. The 8th Pacific Rim International
Congress on Advanced Materials and Processing. TMS, 2013.
[2] JMatPro 4.0.
[3] DeArdo, A. Accelerated Cooling. Applications of Steel Processing and Design (2017).
[4] Zhang, P. General Relationship Between Strength and Hardness. Materials Science
and Engineering A. A 529 (2011) 62-73.
[5] Karmakar et al. Effect of isothermal holding temperature on the precipitation
hardening in Vanadium-microalloyed steels with varying carbon and nitrogen levels. Department
of Metallurgical and Materials Engineering, Indian Institute of Technology Kharagpur,
Kharagpur, 721 302, India.
[6] L Y Lan, C L Qiu, D W Zhao, X H Gao & L X Du (2011) Effect of austenite grain
size on isothermal bainite transformation in low carbon microalloyed steel, Materials
Science and Technology, 27:11, 1657-1663
Related Documents