Section 8.4 - Section 8.4 - Decision Making Decision Making with Data with Data NOT ALL DATA IS GOOD DATA! NOT ALL DATA IS GOOD DATA! “ “ Do not put faith in what Do not put faith in what statisticians say statisticians say until you have carefully until you have carefully considered what considered what they do not say.” ---William W. they do not say.” ---William W. Watt Watt

Section 8.4 - Decision Making with Data NOT ALL DATA IS GOOD DATA! “Do not put faith in what statisticians say until you have carefully considered.
Dec 20, 2015
Welcome message from author
This document is posted to help you gain knowledge. Please leave a comment to let me know what you think about it! Share it to your friends and learn new things together.
Transcript

Section 8.4 - Decision Section 8.4 - Decision Making with DataMaking with Data
NOT ALL DATA IS GOOD DATA!NOT ALL DATA IS GOOD DATA!
““Do not put faith in what statisticians say Do not put faith in what statisticians say until you have carefully considered what until you have carefully considered what
they do not say.” ---William W. Wattthey do not say.” ---William W. Watt
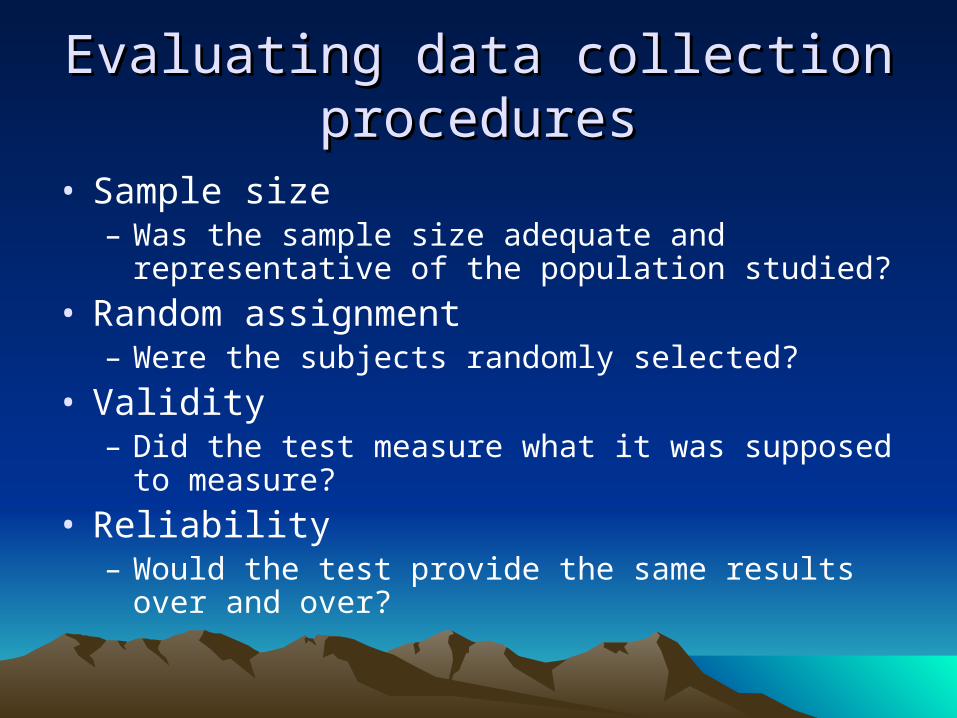
Evaluating data collection Evaluating data collection proceduresprocedures
• Sample size– Was the sample size adequate and representative of
the population studied?
• Random assignment– Were the subjects randomly selected?
• Validity– Did the test measure what it was supposed to
measure?
• Reliability– Would the test provide the same results over and
over?
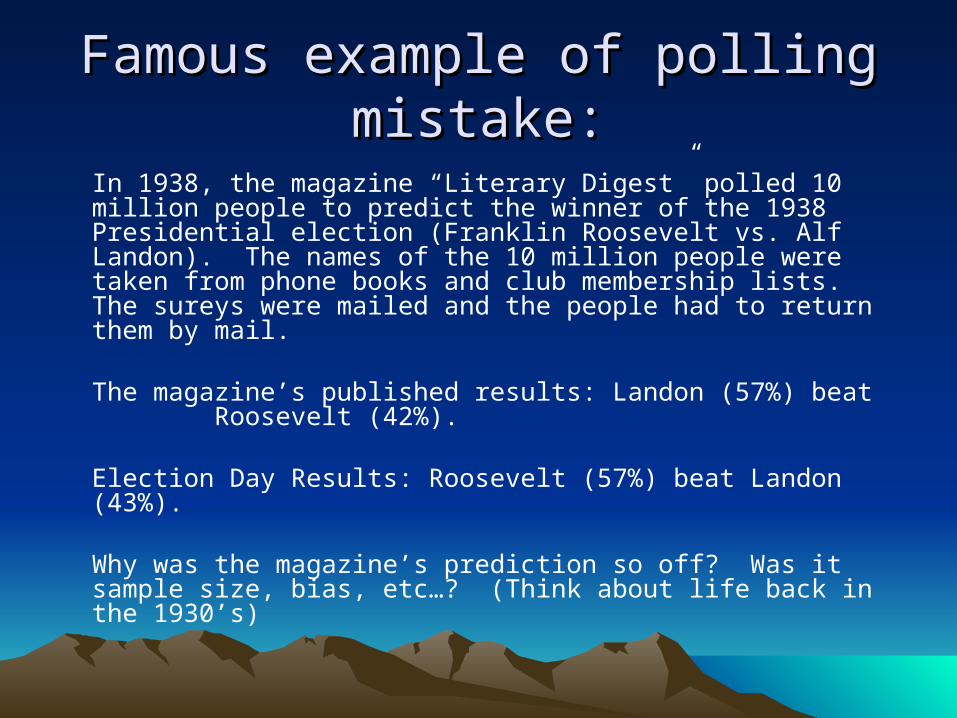
Famous example of polling Famous example of polling mistake:mistake:
In 1938, the magazine “Literary Digest” polled 10 million people to predict the winner of the 1938 Presidential election (Franklin Roosevelt vs. Alf Landon). The names of the 10 million people were taken from phone books and club membership lists. The sureys were mailed and the people had to return them by mail.
The magazine’s published results: Landon (57%) beat Roosevelt (42%).
Election Day Results: Roosevelt (57%) beat Landon (43%).
Why was the magazine’s prediction so off? Was it sample size, bias, etc…? (Think about life back in the 1930’s)
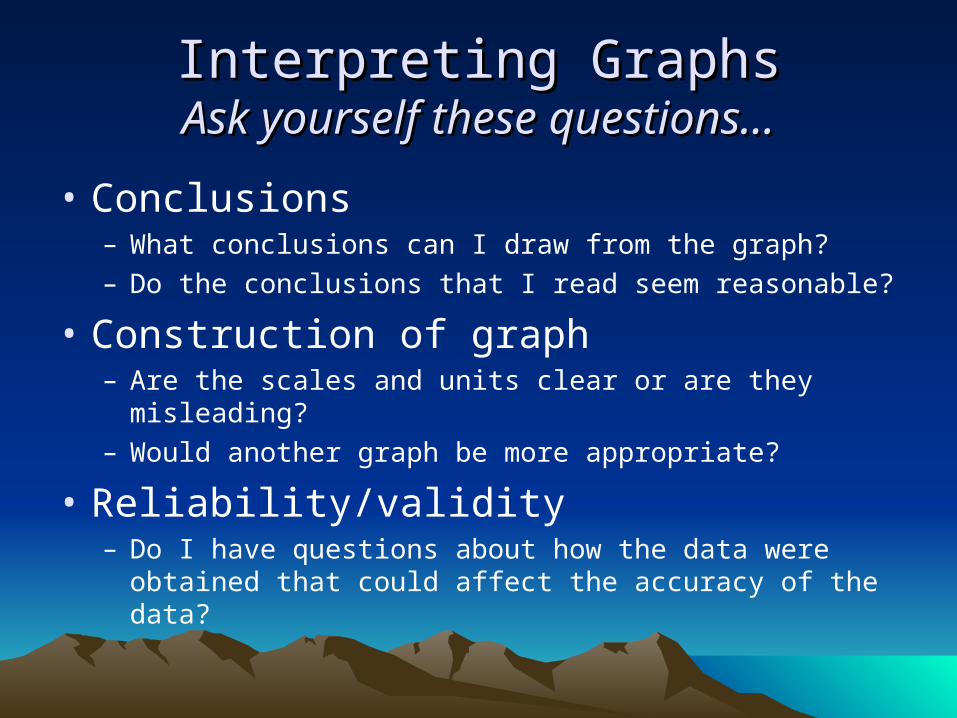
Interpreting GraphsInterpreting GraphsAsk yourself these questions…Ask yourself these questions…
• Conclusions– What conclusions can I draw from the graph?
– Do the conclusions that I read seem reasonable?
• Construction of graph– Are the scales and units clear or are they misleading?
– Would another graph be more appropriate?
• Reliability/validity– Do I have questions about how the data were obtained that
could affect the accuracy of the data?
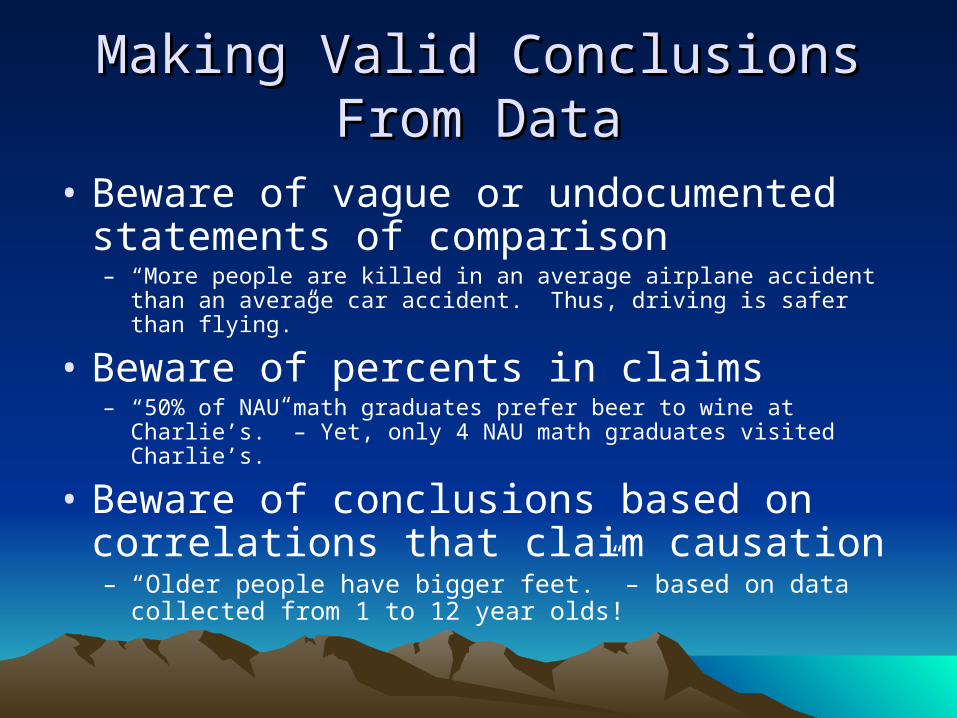
Making Valid Conclusions From Making Valid Conclusions From DataData
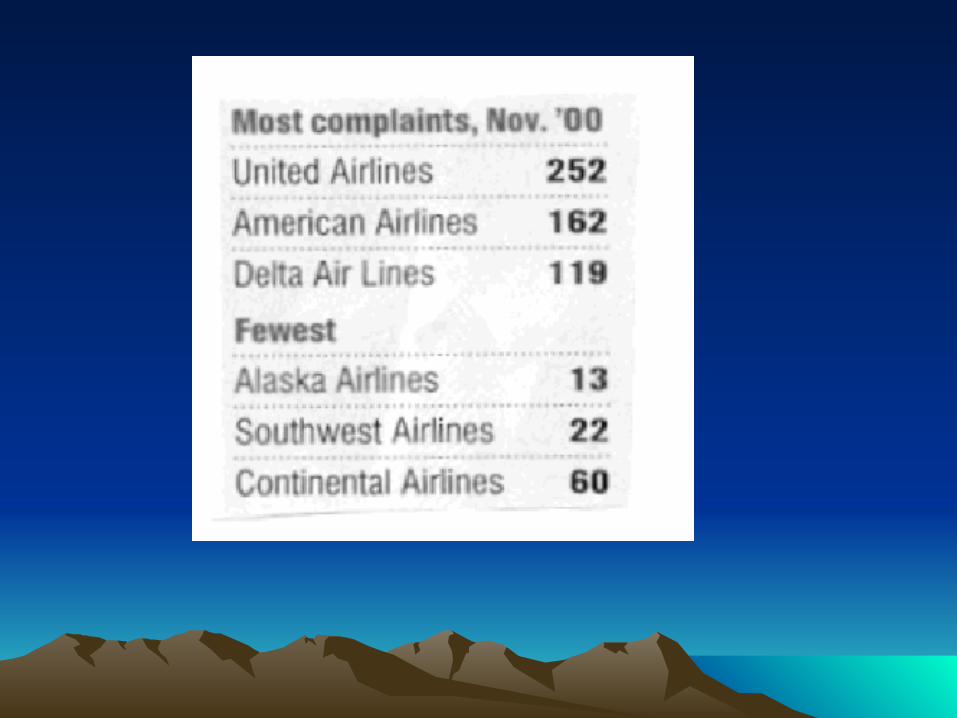
• Beware of vague or undocumented statements of comparison– “More people are killed in an average airplane accident than an average
car accident. Thus, driving is safer than flying.”
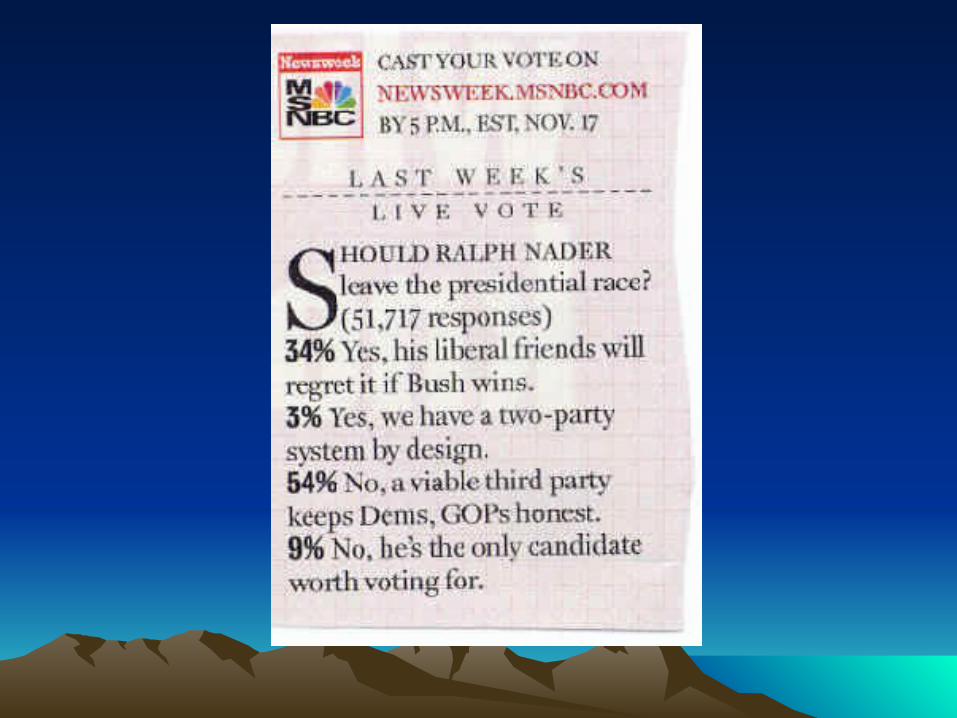
• Beware of percents in claims– “50% of NAU math graduates prefer beer to wine at Charlie’s.” – Yet,
only 4 NAU math graduates visited Charlie’s.
• Beware of conclusions based on correlations that claim causation– “Older people have bigger feet.” – based on data collected from
1 to 12 year olds!
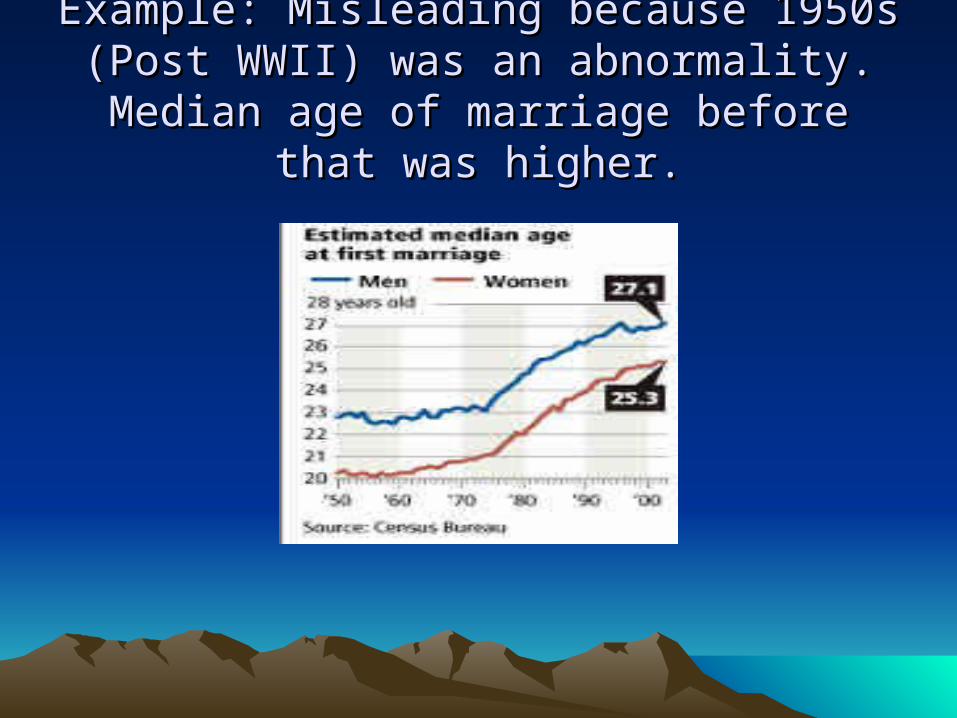
Example: Misleading because 1950s (Post Example: Misleading because 1950s (Post WWII) was an abnormality. Median age of WWII) was an abnormality. Median age of
marriage before that was higher.marriage before that was higher.


What is missing?What is missing?

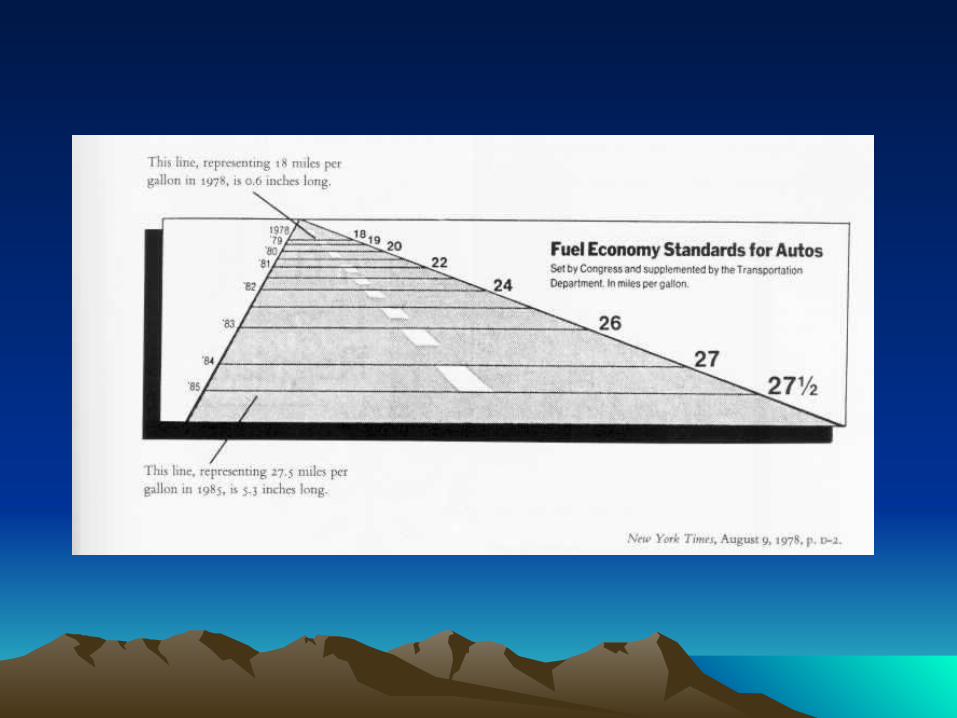
Misleading Conclusions from Misleading Conclusions from GraphsGraphs
• Make sure comparing LIKE UNITS.
• Make sure the graph is scaled correctly.
• Make sure visual area and volume are increased correctly (i.e. doubled, not quadrupled)


The US uses more oil than any The US uses more oil than any other country…other country…
Japan USA
5.6 million
20 million
Barrels per day

Connecting data analysis and Connecting data analysis and problem solvingproblem solving
• Understand the question/problem– Is it qualitative or quantitative?
• Develop a plan– What data is needed? How to collect it?– Sample (randomness and size)
• Implement the plan– Does data collection technique match data needed?– What kind of data? What kind of plot and/or statistics?
• Analyze results– Analyze the statistics; draw conclusions only from what data tells you– Remember: correlation ≠ causation
Related Documents