© 2012 Mathematics Vision Project | MV P In partnership with the Utah State Office of Education Licensed under the Creative Commons AttributionNonCommercialShareAlike 3.0 Unported license. Secondary Mathematics I: An Integrated Approach Module 4 Honors Linear and Exponential Functions By The Mathematics Vision Project: Scott Hendrickson, Joleigh Honey, Barbara Kuehl, Travis Lemon, Janet Sutorius www.mathematicsvisionproject.org In partnership with the Utah State Office of Education 1 Linear and Exponential Functions 1

Welcome message from author
This document is posted to help you gain knowledge. Please leave a comment to let me know what you think about it! Share it to your friends and learn new things together.
Transcript

© 2012 Mathematics Vision Project | MVP In partnership with the Utah State Office of Education
Licensed under the Creative Commons Attribution-‐NonCommercial-‐ShareAlike 3.0 Unported license.
Secondary Mathematics I: An Integrated Approach
Module 4 Honors Linear and Exponential
Functions
By
The Mathematics Vision Project: Scott Hendrickson, Joleigh Honey,
Barbara Kuehl, Travis Lemon, Janet Sutorius www.mathematicsvisionproject.org
In partnership with the Utah State Office of Education
1
Linear and Exponential Functions 1

© 2012 Mathematics Vision Project | MVP
In partnership with the Utah State Office of Education Licensed under the Creative Commons Attribution-NonCommercial-ShareAlike 3.0 Unported license.
Module 4H – Linear and Exponential Functions
4.1 Classroom Task: Connecting the Dots: Piggies and Pools – A Develop Understanding Task Introducing continuous linear and exponential functions (F.IF.3) Ready, Set, Go Homework: Linear and Exponential Functions 4.1 4.2 Classroom Task: Sorting Out the Change – A Solidify Understanding Task Defining linear and exponential functions based upon the pattern of change (F.LE.1, F.LE.2) Ready, Set, Go Homework: Linear and Exponential Functions 4.2 4.3 Classroom Task: Where’s My Change – A Practice Understanding Task Identifying rates of change in linear and exponential functions (F.LE.1, F.LE.2) Ready, Set, Go Homework: Linear and Exponential Functions 4.3 4.4 Classroom Task: Linear, Exponential or Neither – A Practice Understanding Task Distinguishing between linear and exponential functions using various representations (F.LE.3, F.LE.5) Ready, Set, Go Homework: Linear and Exponential Functions 4.4 4.5 Classroom Task: Getting Down to Business – A Solidify Understanding Task Comparing the growth of linear and exponential functions (F.LE.2, F.LE.3, F.LE.5, F.IF.7) Ready, Set, Go Homework: Linear and Exponential Functions 4.5 4.6 Classroom Task: Growing, Growing, Gone – A Solidify Understanding Task Comparing linear and exponential models of population (F.BF.1, F.BF.2, F.LE.1, F.LE.2, F.LE.3) Ready, Set, Go Homework: Linear and Exponential Functions 4.6 4.6H Classroom Task: I Can See—Can’t You? – A Solidify Understanding Task Using secant lines to find the average rate of change (F.IF.6) Ready, Set, Go Homework: Linear and Exponential Functions 4.6H 4.7 Classroom Task: Making My Point – A Solidify Understanding Task Interpreting equations that model linear and exponential functions (A.SSE.1, A.CED.2, F.LE.5) Ready, Set, Go Homework: Linear and Exponential Functions 4.7 4.8 Classroom Task: Efficiency Experts – A Solidify Understanding Task Evaluating the use of various forms of linear and exponential equations (A.SSE.1, A.SSE.3, A.CED.2, F.LE.5) Ready, Set, Go Homework: Linear and Exponential Functions 4.8 4.9 Classroom Task: Up a Little, Down a Little – A Solidify Understanding Task Understanding and interpreting formulas for exponential growth and decay (A.SSE.1, A.CED.2, F.LE.5, F.IF.7) Ready, Set, Go Homework: Linear and Exponential Functions 4.9
2
Linear and Exponential Functions 2

© 2012 Mathematics Vision Project | MVP
In partnership with the Utah State Office of Education Licensed under the Creative Commons Attribution-NonCommercial-ShareAlike 3.0 Unported license.
4.10 Classroom Task: X Marks the Spot – A Practice Understanding Task Solving exponential and linear equations (A.REI.3) Ready, Set, Go Homework: Linear and Exponential Functions 4.10
3
Linear and Exponential Functions 3

© 2012 Mathematics Vision Project | MVP
In partnership with the Utah State Office of Education Licensed under the Creative Commons Attribution-NonCommercial-ShareAlike 3.0 Unported license
4.1 Connecting the Dots: Piggies and Pools A Develop Understanding Task
1. My little sister, Savannah, is three years old. She has a piggy bank that she wants to fill. She started with five pennies and each day when I come home from school, she is excited when I give her three pennies that are left over from my lunch money. Create a mathematical model for the number of pennies in the piggy bank on day n.
2. Our family has a small pool for relaxing in the summer that holds 1500 gallons of water. I decided to fill the pool for the summer. When I had 5 gallons of water in the pool, I decided that I didn’t want to stand outside and watch the pool fill, so I had to figure out how long it would take so that I could leave, but come back to turn off the water at the right time. I checked the flow on the hose and found that it was filling the pool at a rate of 2 gallons every minute. Create a mathematical model for the number of gallons of water in the pool at t minutes.
3. I’m more sophisticated than my little sister so I save my money in a bank account that pays me 3% interest on the money in the account at the end of each month. (If I take my money out before the end of the month, I don’t earn any interest for the month.) I started the account with $50 that I got for my birthday. Create a mathematical model of the amount of money I will have in the account after m months.
4. At the end of the summer, I decide to drain the swimming pool. I noticed that it drains faster when there is more water in the pool. That was interesting to me, so I decided to measure the rate at which it drains. I found that it was draining at a rate of 3% every minute. Create a mathematical model of the gallons of water in the pool at t minutes.
5. Compare problems 1 and 3. What similarities do you see? What differences do you notice?
6. Compare problems 1 and 2. What similarities do you see? What differences do you notice?
7. Compare problems 3 and 4. What similarities do you see? What differences do you notice?
ww
w.f
lickr
.co
m/p
ho
tos/
teeg
ard
in
4
Linear and Exponential Functions 4

Name: Linear and Exponential Functions 4.1
© 2012 Mathematics Vision Project| MVP In partnership with the Utah State Office of Education
Licensed under the Creative Commons Attribution-‐NonCommercial-‐ShareAlike 3.0 Unported license.
Ready, Set, Go!
Ready Topic: Recognizing arithmetic and geometric sequences
Predict the next 2 terms in the sequence. State whether the sequence is arithmetic, geometric, or neither. Justify your answer.
1. 4 , -‐20 , 100 , -‐500 , . . . 2. 3 , 5 , 8 , 12 , . . .
3. 64 , 48 , 36 , 27 , . . . 4. 1.5 , 0.75 , 0 , -‐0.75 , . . .
5. 40 , 10 , !! , !! , … 6. 1, 11, 111, 1111, . . .
7. -‐3.6, -‐5.4, -‐8.1, -‐12.15, . . . 8. -‐64, -‐47, -‐30, -‐13, . . .
9. Create a predictable sequence of at least 4 numbers that is NOT arithmetic or geometric.
www.flickr.com/photos/teegardin
5
Linear and Exponential Functions 5

Name: Linear and Exponential Functions 4.1
© 2012 Mathematics Vision Project| MVP In partnership with the Utah State Office of Education
Licensed under the Creative Commons Attribution-‐NonCommercial-‐ShareAlike 3.0 Unported license.
Set Topic: Discrete and continuous relationships
Identify whether the following statements represent a discrete or a continuous relationship.
10. The hair on your head grows ½ inch per month.
11. For every ton of paper that is recycled, 17 trees are saved.
12. Approximately 3.24 billion gallons of water flow over Niagara Falls daily.
13. The average person laughs 15 times per day.
14. The city of Buenos Aires adds 6,000 tons of trash to its landfills every day.
15. During the Great Depression, stock market prices fell 75%.
Go Topic: Slopes of lines
Determine the slope of the line that passes through the following points.
16. (-‐15 , 9) , (-‐10 , 4) 17. (0.5 , 4 ) , (3 , 3.5 ) 18. (50 , 85 ) , (60 , 80 )
19. 20. 21.
Need Help? Check out these related videos and internet sites:
Discrete vs. continuous: http://www.mathsisfun.com/data/data-‐discrete-‐continuous.html
Arithmetic and geometric sequences: http://home.windstream.net/okrebs/page131.html
Slope: http://www.khanacademy.org/math/algebra/linear-‐equations-‐and-‐inequalitie/v/slope-‐of-‐a-‐line
Linear relationships: http://www.mathsteacher.com.au/year7/ch15_linear/04_modelling/linear.htm
x y -‐1 0 1
-‐1 ½ 2
x y -‐5 -‐4 -‐3
-‐20 -‐17 -‐14
x y -‐5 0 5
33 30 27
6
Linear and Exponential Functions 6

© 2012 Mathematics Vision Project | MVP
In partnership with the Utah State Office of Education Licensed under the Creative Commons Attribution-NonCommercial-ShareAlike 3.0 Unported license
4.2 Sorting Out the Change
A Solidify Understanding Task
A. Identify the pattern of change in each of the relations and sort
each relation into the following categories:
Equal differences over equal intervals
Equal factors over equal intervals
Neither
B. Be prepared to describe the pattern of change and to tell how
you found it.
1.
𝑥 𝑓(𝑥) -30 -57 -25 -47 -20 -37 -15 -27 -10 -17 -5 -7 0 3
2.
𝑓(0) = −3, 𝑓(𝑛 + 1) =5
3𝑓(𝑛)
Type of pattern of change ___________________________________
How I found the pattern of change:
_______________________________________________________
_______________________________________________________
_______________________________________________________
© 2
01
2 w
ww
.flic
kr.c
om
/ph
oto
s/ 4
01
(K)
20
12
Type of pattern of change ___________________________________
How I found the pattern of change:
_______________________________________________________
_______________________________________________________
_______________________________________________________
7
Linear and Exponential Functions 7

© 2012 Mathematics Vision Project | MVP
In partnership with the Utah State Office of Education Licensed under the Creative Commons Attribution-NonCommercial-ShareAlike 3.0 Unported license
Step 1 Step 2 Step 3 Step 4
3. The pattern of change in the perimeter of the figures from one step to the next.
4. The pattern of change in the area of the figures from one step to the next.
5. 𝑦 = 𝑎𝑥 − 3
Type of pattern of change ___________________________________
How I found the pattern of change:
_______________________________________________________
_______________________________________________________
_______________________________________________________
Type of pattern of change ___________________________________
How I found the pattern of change:
_______________________________________________________
_______________________________________________________
_______________________________________________________
Type of pattern of change ___________________________________
How I found the pattern of change:
_______________________________________________________
_______________________________________________________
_______________________________________________________
8
Linear and Exponential Functions 8

© 2012 Mathematics Vision Project | MVP
In partnership with the Utah State Office of Education Licensed under the Creative Commons Attribution-NonCommercial-ShareAlike 3.0 Unported license
6.
𝑥 𝑓(𝑥) -10 7 -5 7 -0 7 5 7
10 7 15 7 20 7
7. The height from the ground of a person on a ferris wheel that is rotating at a constant
speed.
8. 𝑦 = 𝑥
Type of pattern of change ___________________________________
How I found the pattern of change:
_______________________________________________________
_______________________________________________________
_______________________________________________________
Type of pattern of change ___________________________________
How I found the pattern of change:
_______________________________________________________
_______________________________________________________
_______________________________________________________
Type of pattern of change ___________________________________
How I found the pattern of change:
_______________________________________________________
_______________________________________________________
_______________________________________________________
9
Linear and Exponential Functions 9

© 2012 Mathematics Vision Project | MVP
In partnership with the Utah State Office of Education Licensed under the Creative Commons Attribution-NonCommercial-ShareAlike 3.0 Unported license
9.
𝑥 𝑓(𝑥) 0 -5 4 -2 -4 -8 8 1 -8 -11
10. The algae population in a pond increases by 3% each year until it depletes its food
supply and then maintains a constant population.
11.
𝑥 𝑓(𝑥) -5 238 -4 76 -3 22 -2 4 -1 -2 0 -4
Type of pattern of change ___________________________________
How I found the pattern of change:
_______________________________________________________
_______________________________________________________
_______________________________________________________
Type of pattern of change ___________________________________
How I found the pattern of change:
_______________________________________________________
_______________________________________________________
_______________________________________________________
Type of pattern of change ___________________________________
How I found the pattern of change:
_______________________________________________________
_______________________________________________________
_______________________________________________________
10
Linear and Exponential Functions 10
© 2012 Mathematics Vision Project | MVP
In partnership with the Utah State Office of Education Licensed under the Creative Commons Attribution-NonCommercial-ShareAlike 3.0 Unported license
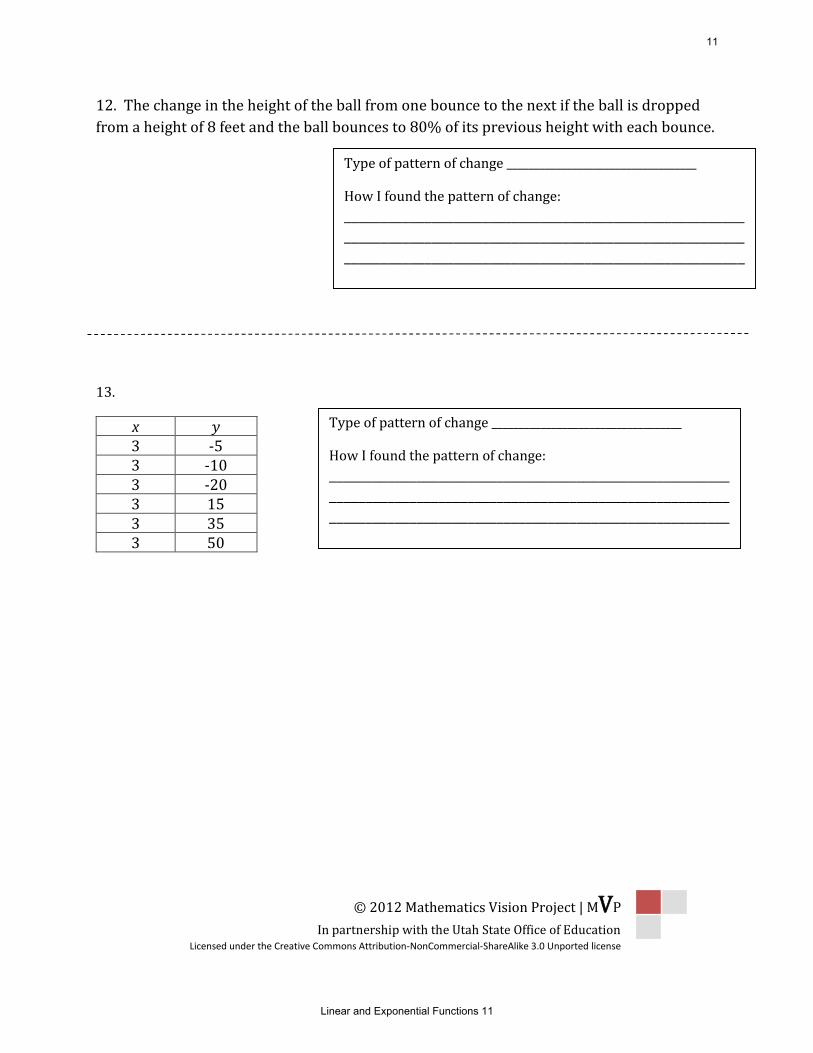
12. The change in the height of the ball from one bounce to the next if the ball is dropped
from a height of 8 feet and the ball bounces to 80% of its previous height with each bounce.
13.
x 𝑦 3 -5 3 -10 3 -20 3 15 3 35 3 50
Type of pattern of change ___________________________________
How I found the pattern of change:
_______________________________________________________
_______________________________________________________
_______________________________________________________
Type of pattern of change ___________________________________
How I found the pattern of change:
_______________________________________________________
_______________________________________________________
_______________________________________________________
11
Linear and Exponential Functions 11

Name: Linear and Exponential Functions 4.2
© 2012 Mathematics Vision Project| MVP In partnership with the Utah State Office of Education
Licensed under the Creative Commons Attribution-‐NonCommercial-‐ShareAlike 3.0 Unported license.
© 2012 www.flickr.com/photos/ 401(K) 2012
Ready, Set, Go!
Ready Topic: Rates of change in linear models
Say which situation has the greatest rate of change
1. The amount of stretch in a short bungee cord stretches 6 inches when stretched by a 3 pound weight. A slinky stretches 3 feet when stretched by a 1 pound weight. 2. A sunflower that grows 2 inches every day or an amaryllis that grows 18 inches in one week. 3. Pumping 25 gallons of gas into a truck in 3 minutes or filling a bathtub with 40 gallons of water in 5 minutes. 4. Riding a bike 10 miles in 1 hour or jogging 3 miles in 24 minutes.
Set Topic: linear rates of change
Determine the rate of change in each table below.
5. 6. 7.
12
Linear and Exponential Functions 12

Name: Linear and Exponential Functions 4.2
© 2012 Mathematics Vision Project| MVP In partnership with the Utah State Office of Education
Licensed under the Creative Commons Attribution-‐NonCommercial-‐ShareAlike 3.0 Unported license.
Go Topic: Graphing linear equations in slope-‐intercept form.
Graph the following equations
8. y = 3x – 1 9. y = -‐5x + 4
10. y = x 11. y = -‐4
12. y = ½x – 6 13. x = 3
Need Help? Check out these related videos:
http://www.algebra-‐class.com/rate-‐of-‐change.html
http://www.khanacademy.org/math/algebra/linear-‐equations-‐and-‐inequalitie/v/graphs-‐using-‐slope-‐intercept-‐form
-5
-5
5
5
-5
-5
5
5
-5
-5
5
5
-5
-5
5
5
-5
-5
5
5
-5
-5
5
5
13
Linear and Exponential Functions 13

© 2012 Mathematics Vision Project | MVP
In partnership with the Utah State Office of Education Licensed under the Creative Commons Attribution-NonCommercial-ShareAlike 3.0 Unported license
4.3 Where’s My Change? A Practice Understanding Task
Look through the problems that you worked with in the “Sorting Out the
Change” task.
Choose two problems from your linear category (equal differences over equal intervals) and two
problems from your exponential category (equal factors over equal intervals).
Add as many representations as you can to the problem you selected. For instance, if you choose
problem #1 which is a table, you should try to represent the function with a graph, an explicit
equation, a recursive equation, and a story context.
Identify the rate of change in the function. If the function is linear, identify the constant rate of
change. If the function is exponential, identify the factor of change.
How does the rate of change appear in each of your representations?
© 2
01
2 w
ww
.flic
kr.c
om
/ph
oto
s/Je
nn
uin
eCap
ture
s
14
Linear and Exponential Functions 14
Name: Linear and Exponential Functions 4.3
© 2012 Mathematics Vision Project| MVP In partnership with the Utah State Office of Education
Licensed under the Creative Commons Attribution-‐NonCommercial-‐ShareAlike 3.0 Unported license.
Ready, Set, Go!
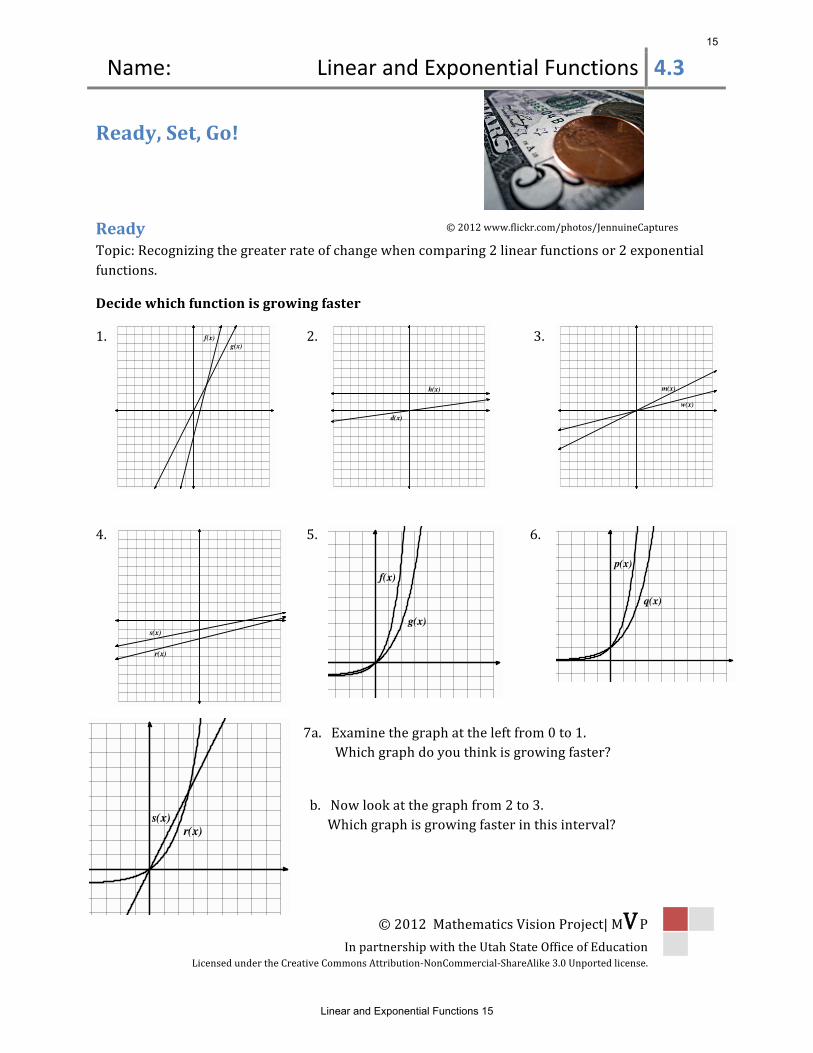
Ready Topic: Recognizing the greater rate of change when comparing 2 linear functions or 2 exponential functions.
Decide which function is growing faster
1. 2. 3.
4. 5. 6.
7a. Examine the graph at the left from 0 to 1. Which graph do you think is growing faster?
b. Now look at the graph from 2 to 3. Which graph is growing faster in this interval?
g(x)f(x)
w(x)
m(x)
1
© 2012 www.flickr.com/photos/JennuineCaptures
g(x)
f(x)
2
d(x)
h(x)
r(x)
s(x)
q(x)
p(x)
r(x)s(x)
15
Linear and Exponential Functions 15

Name: Linear and Exponential Functions 4.3
© 2012 Mathematics Vision Project| MVP In partnership with the Utah State Office of Education
Licensed under the Creative Commons Attribution-‐NonCommercial-‐ShareAlike 3.0 Unported license.
Set Topic: Representations of linear and exponential functions.
In each of the following problems, you are given one of the representations of a function. Complete the remaining 3 representations. Identify the rate of change for the relation.
9. Equation: Graph
Table
Rides Cost
Create a context
You and your friends go to the state fair. It costs $5 to get into the fair and $3 each time
you go on a ride.
10. Equation: Graph
Table
Time Amount 1 2 3 4 5 6
18 53 162 486 1458 4374
Create a context
16
Linear and Exponential Functions 16

Name: Linear and Exponential Functions 4.3
© 2012 Mathematics Vision Project| MVP In partnership with the Utah State Office of Education
Licensed under the Creative Commons Attribution-‐NonCommercial-‐ShareAlike 3.0 Unported license.
Go Topic: Recursive and explicit equations of geometric sequences.
Write the recursive and explicit equations for each geometric sequence.
10. Marissa has saved $1000 in a jar. She plans to withdraw half of what’s remaining in the jar at the end of each month.
11. 12.
13. 1024, 256, 64, 16, . . . 14. 3, 9, 27, 81, . . .
Need Help? Check out these related videos:
http://www.khanacademy.org/math/algebra/ck12-‐algebra-‐1/v/identifying-‐exponential-‐models
http://www.khanacademy.org/math/algebra/ck12-‐algebra-‐1/v/linear-‐-‐quadratic-‐-‐and-‐exponential-‐models
Folds in paper
Number of rectangles
0 1 2 3
1 2 4 8
Time (Days)
Number of Bacteria
1 2 3 4
10 100 1000 10000
17
Linear and Exponential Functions 17

© 2012 Mathematics Vision Project | MVP
In partnership with the Utah State Office of Education Licensed under the Creative Commons Attribution-NonCommercial-ShareAlike 3.0 Unported license
4.4 Linear, Exponential or Neither? A Solidify Understanding Task
For each representation of a function, decide if the function is linear,
exponential, or neither. Give at least 2 reasons for your answer.
1. 2.
Tennis Tournament
Rounds 1 2 3 4 5
Number of
Players left
64 32 16 8 4
There are 4 players remaining after 5 rounds.
3. 𝑦 = 4𝑥
4. This function is decreasing at a constant rate
5.
.
6. A person's height as a function of a person's age (from age 0 to 100)
©2
01
2 w
ww
.flic
kr.c
om
/ph
oto
s/sc
enes
fro
mam
emo
ry
18
Linear and Exponential Functions 18

© 2012 Mathematics Vision Project | MVP
In partnership with the Utah State Office of Education Licensed under the Creative Commons Attribution-NonCommercial-ShareAlike 3.0 Unported license
7. −3𝑥 = 4𝑦 + 7
8. x y -2 23
0 5
2 -13
4 -31
6 -49
9. Height in Inches Shoe Size
62 6 74 13 70 9 67 11 53 4 58 7
10. The number of cell phone users in Centerville as a function of years, if the number of users is increasing by 75% each year.
11. 12. The time it takes you to get to work as a function the speed at which you drive
19
Linear and Exponential Functions 19

© 2012 Mathematics Vision Project | MVP
In partnership with the Utah State Office of Education Licensed under the Creative Commons Attribution-NonCommercial-ShareAlike 3.0 Unported license
13. 𝑦 = 7𝑥2
14. Each point on the graph is exactly 1/3 of the previous point.
15. 𝑓(1) = 7, 𝑓(2) = 7, 𝑓(𝑛) = 𝑓(𝑛 − 1) + 𝑓(𝑛 − 2)
16.
𝑓(0) = 1, 𝑓(𝑛 + 1) =2
3𝑓(𝑛)
20
Linear and Exponential Functions 20

Name: Linear and Exponential Functions 4.4
© 2012 Mathematics Vision Project| MVP In partnership with the Utah State Office of Education
Licensed under the Creative Commons Attribution-‐NonCommercial-‐ShareAlike 3.0 Unported license.
Ready, Set, Go!
Ready Topic: Comparing rates of change in both linear and exponential situations.
Identify whether situation “a” or situation “b” has the greater rate of change.
1. x y
-‐10 -‐48
-‐9 -‐43
-‐8 -‐38
-‐7 -‐33
a.
b.
2. a.
b.
3. a. Lee has $25 withheld each week from his salary to pay for his subway pass.
b. Jose owes his brother $50. He has promised to pay half of what he owes each week until the debt is paid.
©2012 www.flickr.com/photos/scenesfromamemory
-5
-5
5
5
21
Linear and Exponential Functions 21

Name: Linear and Exponential Functions 4.4
© 2012 Mathematics Vision Project| MVP In partnership with the Utah State Office of Education
Licensed under the Creative Commons Attribution-‐NonCommercial-‐ShareAlike 3.0 Unported license.
Set Topic: Recognizing linear and exponential functions.
For each representation of a function, decide if the function is linear, exponential, or neither.
6. The population of a town is decreasing at a rate of 1.5% per year.
7. Joan earns a salary of $30,000 per year plus a 4.25% commission on sales.
8. 3x +4y = -‐3
9. The number of gifts received each day of ”The 12 Days of Christmas” as a function of the day. (“On the 4th day of Christmas my true love gave to me, 4 calling birds, 3 French hens, 2 turtledoves, and a partridge in a pear tree.”)
10.
11.
Side of a square Area of a square 1 inch 1 in2 2 inches 4 in2 3 inches 9 in2 4 inches 16 in2
4. a.
x 6 10 14 18 y 13 15 17 19
b. The number of rhombi in each shape. Figure 1 Figure 2 Figure 3
5. a. 𝑦 = 2(5)! b. In the children's book, The Magic Pot, every time you put one object into the pot, two of the same object come out. Imagine that you have 5 magic pots.
22
Linear and Exponential Functions 22

Name: Linear and Exponential Functions 4.4
© 2012 Mathematics Vision Project| MVP In partnership with the Utah State Office of Education
Licensed under the Creative Commons Attribution-‐NonCommercial-‐ShareAlike 3.0 Unported license.
Go Topic: Geometric means
For each geometric sequence below, find the missing terms in the sequence.
12.
13.
14.
15.
16.
Need Help? Check out these related videos and internet sites:
Sequences http://www.youtube.com/watch?v=THV2Wsf8hro
x 1 2 3 4 5
y 2 162
x 1 2 3 4 5
y 1/9 -‐3
x 1 2 3 4 5
y 10 0.625
x 1 2 3 4 5
y g gz4
x 1 2 3 4 5
y -‐3 -‐243
23
Linear and Exponential Functions 23

© 2012 Mathematics Vision Project | MVP
In partnership with the Utah State Office of Education Licensed under the Creative Commons Attribution-NonCommercial-ShareAlike 3.0 Unported license
4.5 Getting Down to Business A Solidify Understanding Task
Calcu-rama had a net income of 5 million dollars in 2010, while a small
competing company, Computafest, had a net income of 2 million dollars. The
management of Calcu-rama develops a business plan for future growth that
projects an increase in net income of 0.5 million per year, while the
management of Computafest develops a plan aimed at increasing its net
income by 15% each year.
a. Express the projected net incomes in these two business plans as recursive formulas.
b. Write an explicit equation for the net income as a function of time for each company’s
business plan.
c. Compare your answers in a and b. How are the two representations similar? How do they
differ? What relationships are highlighted in each representation?
d. Explain why if both companies are able to meet their net income growth goals, the net
income of Computafest will eventually be larger than that of Calcu-rama. In what year will
the net income of Computafest be larger than that of Calcu-rama?
©2
01
2 w
ww
.flic
kr.c
om
/ph
oto
s/p
retp
riem
ac
24
Linear and Exponential Functions 24

Name: Linear and Exponential Functions 4.5
© 2012 Mathematics Vision Project| MVP In partnership with the Utah State Office of Education
Licensed under the Creative Commons Attribution-‐NonCommercial-‐ShareAlike 3.0 Unported license.
Ready, Set, Go!
Ready Topic: Comparing arithmetic and geometric sequences
The first and 5th terms of a sequence are given. Fill in the missing numbers for an arithmetic sequence. Then fill in the numbers for a geometric sequence.
1.
Arithmetic 4 324
Geometric 4 324 2.
Arithmetic 3 48
Geometric 3 48 3.
Arithmetic -‐6250 -‐10
Geometric -‐6250 -‐10
4.
Arithmetic -‐12 -‐0.75
Geometric -‐12 -‐0.75
5.
Arithmetic -‐1377 -‐17
Geometric -‐1377 -‐17
©2012 www.flickr.com/photos/pretpriemac
25
Linear and Exponential Functions 25

Name: Linear and Exponential Functions 4.5
© 2012 Mathematics Vision Project| MVP In partnership with the Utah State Office of Education
Licensed under the Creative Commons Attribution-‐NonCommercial-‐ShareAlike 3.0 Unported license.
Set Topic: comparing the rates of change of linear and exponential functions.
Compare the rates of change of each pair of functions by identifying the interval where it appears that f(x) is changing faster and the interval where it appears that g(x) is changing faster. Verify your conclusions by making a table of values for each equation and exploring the rates of change in your tables.
6. 𝑓(𝑥) = (1.5)!
𝑔(𝑥) = ½ 𝑥 + 2
x f (x) g (x)
7. 𝑓(𝑥) = −3! + 1
𝑔(𝑥) = −2𝑥 – 2
x f (x) g (x)
8. 𝑓 𝑥 = 2!
𝑔 𝑥 = 8𝑥
x f (x) g (x)
g(x)
f(x)
g(x)
f(x)
g(x)
f(x)
26
Linear and Exponential Functions 26

Name: Linear and Exponential Functions 4.5
© 2012 Mathematics Vision Project| MVP In partnership with the Utah State Office of Education
Licensed under the Creative Commons Attribution-‐NonCommercial-‐ShareAlike 3.0 Unported license.
Go Topic: Writing explicit equations for linear and exponential models.
Write the explicit equation for the tables and graphs below.
9. x f (x) 2 3 4 5
-‐4 -‐11 -‐18 -‐25
10. x f (x) -‐1 0 1 2
2/5 2 10 50
11. x f (x) 2 3 4 5
-‐24 -‐48 -‐96 -‐192
12. x f (x) -‐4 -‐3 -‐2 -‐1
81 27 9 3
13.
14.
15.
16.
17.
18.
Need Help? Check out these related videos:
http://www.khanacademy.org/math/algebra/solving-‐linear-‐equations/v/equations-‐of-‐sequence-‐patterns
http://www.khanacademy.org/math/algebra/ck12-‐algebra-‐1/v/geometric-‐sequences-‐-‐introduction
http://www.khanacademy.org/math/algebra/ck12-‐algebra-‐1/v/exponential-‐growth-‐functions
http://www.khanacademy.org/math/algebra/ck12-‐algebra-‐1/v/exponential-‐decay-‐functions?v=AXAMVxaxjDg
27
Linear and Exponential Functions 27

© 2012 Mathematics Vision Project | MVP
In partnership with the Utah State Office of Education Licensed under the Creative Commons Attribution-NonCommercial-ShareAlike 3.0 Unported license
4.6 Growing, Growing, Gone A Solidify Understanding Task
1. The U.S. population in 1910 was 92 million people. In
1990 the population was 250 million. Create both a linear and an exponential model of the
population from 1910 to 2030, with projected data points at least every 20 years, starting in
1910.
2. The actual U.S. population data (in millions) was: 1930: 122.8 1950: 152.3 1970: 204.9
Which model provides a better forecast of the U.S. population for the year 2030? Explain your answer.
©w
ww
.flic
kr.c
om
/ph
oto
s/ar
enam
on
tan
us
28
Linear and Exponential Functions 28

Name: Linear and Exponential Functions 4.6
© 2012 Mathematics Vision Project| MVP In partnership with the Utah State Office of Education
Licensed under the Creative Commons Attribution-‐NonCommercial-‐ShareAlike 3.0 Unported license.
Ready, Set, Go!
Ready Topic: Comparing Linear and Exponential Models
Compare different characteristics of each type of function by filling in the cells of each table as completely as possible.
y = 4 + 3x y = 4( 3x )
1. Type of growth
2. What kind of sequence corresponds to each model?
3. Make a table of values
x y
x y
4. Find the rate of change
5. Graph each equation.
Compare the graphs.
What is the same?
What is different?
6. Find the y-‐intercept for each function.
20
18
16
14
12
10
8
6
4
2
5 10 15 20
20
18
16
14
12
10
8
6
4
2
5 10 15 20
©www.flickr.com/photos/arenamontanus
29
Linear and Exponential Functions 29

Name: Linear and Exponential Functions 4.6
© 2012 Mathematics Vision Project| MVP In partnership with the Utah State Office of Education
Licensed under the Creative Commons Attribution-‐NonCommercial-‐ShareAlike 3.0 Unported license.
7. Find the y-‐intercepts for the following equations
a) y = 3x
b) y = 3x
8. Explain how you can find the y-‐intercept of a linear equation and how that is different from finding the y-‐intercept of a geometric equation.
Set Topic: Finding patterns
Use the picture below to answer questions 9-‐12
9. Graph.
10. Table
Stage # of small triangles
1 2 3 4 5 ⋮ 10
11. Write an explicit function to describe the pattern
20
18
16
14
12
10
8
6
4
2
5 10 15 20
30
Linear and Exponential Functions 30
Name: Linear and Exponential Functions 4.6
© 2012 Mathematics Vision Project| MVP In partnership with the Utah State Office of Education
Licensed under the Creative Commons Attribution-‐NonCommercial-‐ShareAlike 3.0 Unported license.
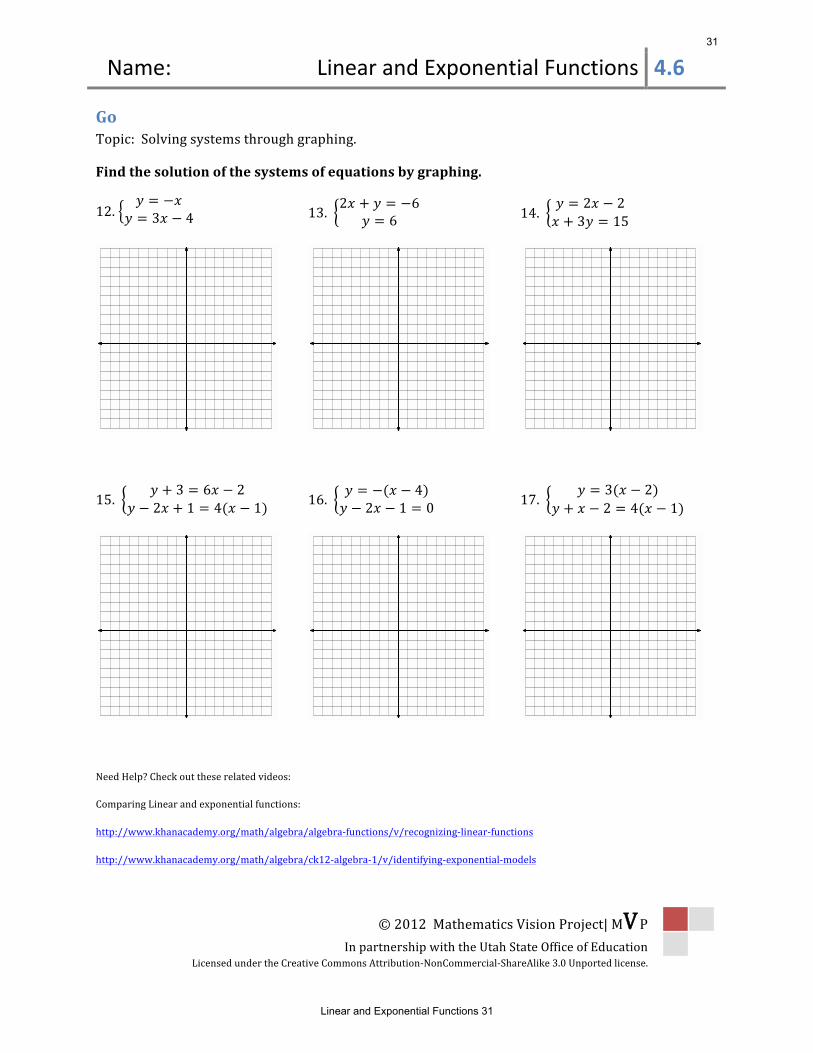
Go Topic: Solving systems through graphing.
Find the solution of the systems of equations by graphing.
12. 𝑦 = −𝑥
𝑦 = 3𝑥 − 4 13. 2𝑥 + 𝑦 = −6𝑦 = 6 14.
𝑦 = 2𝑥 − 2𝑥 + 3𝑦 = 15
15. 𝑦 + 3 = 6𝑥 − 2
𝑦 − 2𝑥 + 1 = 4(𝑥 − 1) 16. 𝑦 = −(𝑥 − 4)𝑦 − 2𝑥 − 1 = 0 17.
𝑦 = 3(𝑥 − 2)𝑦 + 𝑥 − 2 = 4(𝑥 − 1)
Need Help? Check out these related videos:
Comparing Linear and exponential functions:
http://www.khanacademy.org/math/algebra/algebra-‐functions/v/recognizing-‐linear-‐functions
http://www.khanacademy.org/math/algebra/ck12-‐algebra-‐1/v/identifying-‐exponential-‐models
31
Linear and Exponential Functions 31
© 2012 Mathematics Vision Project | MVP
In partnership with the Utah State Office of Education Licensed under the Creative Commons Attribution-NonCommercial-ShareAlike 3.0 Unported license
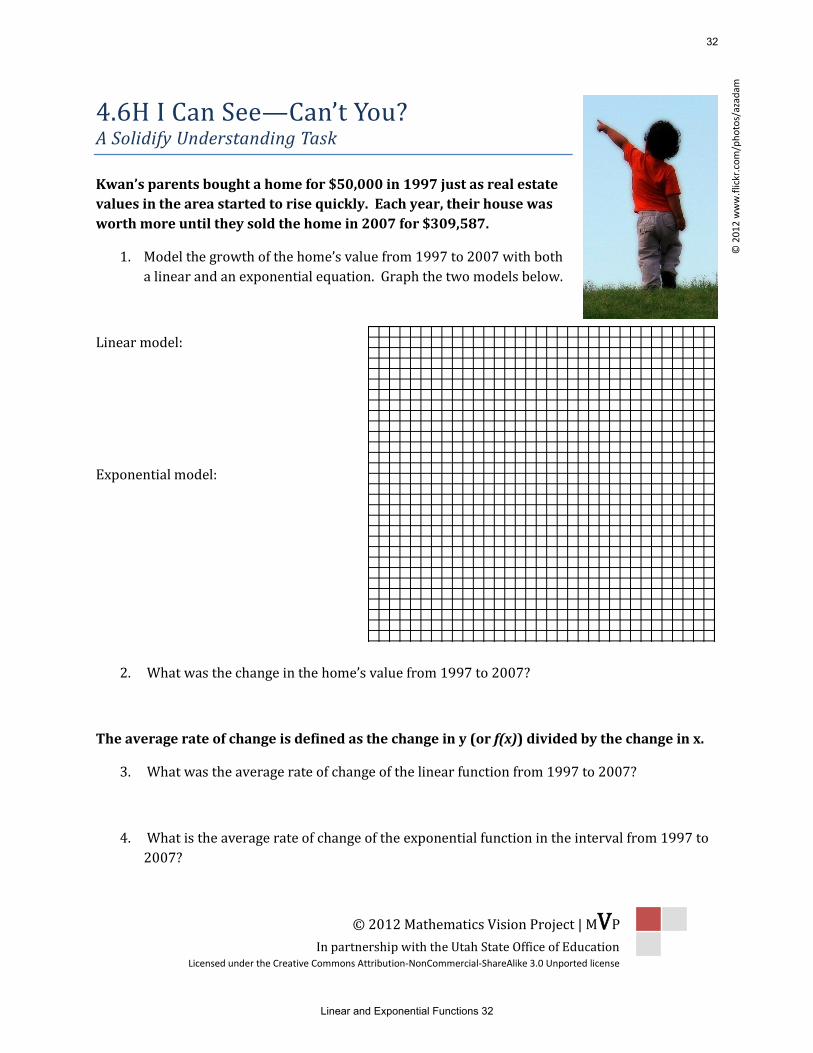
4.6H I Can See—Can’t You? A Solidify Understanding Task
Kwan’s parents bought a home for $50,000 in 1997 just as real estate
values in the area started to rise quickly. Each year, their house was
worth more until they sold the home in 2007 for $309,587.
1. Model the growth of the home’s value from 1997 to 2007 with both
a linear and an exponential equation. Graph the two models below.
Linear model:
Exponential model:
2. What was the change in the home’s value from 1997 to 2007?
The average rate of change is defined as the change in y (or f(x)) divided by the change in x.
3. What was the average rate of change of the linear function from 1997 to 2007?
4. What is the average rate of change of the exponential function in the interval from 1997 to
2007?
© 2
01
2 w
ww
.flic
kr.c
om
/ph
oto
s/az
adam
32
Linear and Exponential Functions 32

© 2012 Mathematics Vision Project | MVP
In partnership with the Utah State Office of Education Licensed under the Creative Commons Attribution-NonCommercial-ShareAlike 3.0 Unported license
5. How do the average rates of change from 1997 to 2007 compare for the two functions?
Explain.
6. What was the average rate of change of the linear function from 1997 to 2002?
7. What is the average rate of change of the exponential function in the interval from 1997 to
2002?
8. How do the average rates of change from 1997 to 2002 compare for the two functions?
Explain.
9. How can you use the equation of the exponential function to find the average rate of change
over a given interval?
How does this process compare to finding the slope of the line through the endpoints of the
interval?
33
Linear and Exponential Functions 33

© 2012 Mathematics Vision Project | MVP
In partnership with the Utah State Office of Education Licensed under the Creative Commons Attribution-NonCommercial-ShareAlike 3.0 Unported license
Consider the following graph:
10. What is the equation of the graph shown?
11. What is the average rate of change of this function on the interval from x = -3 to x = 1?
12. What is the average rate of change of this function in the interval from x = -3 to x = 0?
13. What is the average rate of change of this function in the interval from x = -3 to x = -1?
14. What is the average rate of change of this function in the interval from x = -3 to x = -1.5?
15. Draw the line through the point at the beginning and end of each of the intervals in 11, 12,
13 and 14. What is the slope of each of these lines?
34
Linear and Exponential Functions 34

© 2012 Mathematics Vision Project | MVP
In partnership with the Utah State Office of Education Licensed under the Creative Commons Attribution-NonCommercial-ShareAlike 3.0 Unported license
16. Which of these average rates of change best represents the change at the point (-2, 4)?
Explain your answer.
17. How does the average rate of change compare to the change factor for an exponential
function? What is described by each of these quantities?
35
Linear and Exponential Functions 35

Name: Linear and Exponential Functions 4.6H
© 2012 Mathematics Vision Project | MVP In partnership with the Utah State Office of Education
Licensed under the Creative Commons Attribution-‐NonCommercial-‐ShareAlike 3.0 Unported license
© 2012 www.flickr.com/photos/azadam
Ready, Set, Go!
Ready Topic: Finding an appropriate viewing window.
When viewing the secant line of an exponential function on a calculator, you want a window that shows the two points on the curve that are being connected. Since exponential functions get very large or small in just a few steps, you may want to change the scale as well as the dimensions of the window. Don’t be afraid to experiment until you are satisfied with what you see. The graphs below depict an exponential function and a secant line. The equations are given. Identify the dimensions of the viewing window. Include the scale for both the x and y values. Check your answer by matching your calculator screen to the one displayed here. 1. 𝑌! = 4(0.2)! and 𝑌! = −1.92𝑥 + 4
WINDOW
a. X min = ____________________________
b. X max = ____________________________
c. X scl = ______________________________
d. Y min = ____________________________
e. Y max = ____________________________
f. Y scl = ______________________________
2. 𝑌! = 1.5! and 𝑌! = 1.5𝑥 + 1
WINDOW
a. X min = ____________________________
b. X max = ____________________________
c. X scl = ______________________________
d. Y min = ____________________________
e. Y max = ____________________________
f. Y scl = ______________________________
36
Linear and Exponential Functions 36

Name: Linear and Exponential Functions 4.6H
© 2012 Mathematics Vision Project | MVP In partnership with the Utah State Office of Education
Licensed under the Creative Commons Attribution-‐NonCommercial-‐ShareAlike 3.0 Unported license
3. 𝑌! = 150 (10)! and 𝑌! = 9500𝑥 – 7500
WINDOW
a. X min = ____________________________
b. X max = ____________________________
c. X scl = ______________________________
d. Y min = ____________________________
e. Y max = ____________________________
f. Y scl = ______________________________
Set Topic: Using slope to compare change in linear and exponential models. The tables below show the values for a linear model and an exponential model. Use the slope formula between each set of 2 points to calculate the rate of change. Example: Find the slope between the points (30 , 1) and (630 , 2) then between (630 , 2) and (1230 , 3). Do the same between each pair of points in the table for the exponential model. 4a. Linear Model
x y 1 2 3 4 5
30 630 1230 1830 2430
b. Exponential Model
x y 1 2 3 4 5
30 90 270 810 2430
5. Compare the change between each pair of points in the linear model to the change between each pair of points in the exponential model. Describe your observations and conclusions.
6. Find the average of the 4 rates of change of the exponential model. How does the average of the rates of change of the exponential model compare to the rates of change of the linear model?
37
Linear and Exponential Functions 37

Name: Linear and Exponential Functions 4.6H
© 2012 Mathematics Vision Project | MVP In partnership with the Utah State Office of Education
Licensed under the Creative Commons Attribution-‐NonCommercial-‐ShareAlike 3.0 Unported license
7. Without using a graphing calculator, make a rough sketch on the same set of axes of what you think the linear model and the exponential model would look like.
8. How did your observations in #5 influence your sketch?
9. Explain how a table of 5 consecutive values can begin and end with the same y-‐values and be so different in the middle 3 values. How does this idea connect to the meaning of a secant line?
Go Topic: Developing proficiency on a calculator by using the slope formula
Use your calculator and the slope formula to find the slope of the line that passes through the 2 points.
10. A (-‐10, 17) , B (10, 97) 11. P (57, 5287) , Q (170, 4948)
12. R (6.055, 23.1825) , S (5.275, 12.0675) 13. G (0.0012, 0.125) , H ( 2.5012, 6.375)
Need Assistance? Check out these additional resources:
Slope formula: 𝑚 = !!!!!!!!!!
Selecting a viewing window:
http://www.online.math.uh.edu/GraphCalc/Graping-‐and-‐Windows-‐Examples/Graping-‐and-‐Windows-‐Examples.htm
38
Linear and Exponential Functions 38

© 2012 Mathematics Vision Project | MVP
In partnership with the Utah State Office of Education Licensed under the Creative Commons Attribution-NonCommercial-ShareAlike 3.0 Unported license
4.7 Making My Point A Solidify Understanding Task
Zac and Sione were working on predicting the number of quilt blocks in this
pattern:
When they compared their results, they had an interesting discussion:
Zac: I got 𝑦 = 6𝑛 + 1 because I noticed that 6 blocks were added each time so the pattern must
have started with 1 block at n = 0.
Sione: I got 𝑦 = 6(𝑛 − 1) + 7 because I noticed that at n = 0 there were 7 blocks and at n = 1 there
were 13, so I used my table to see that I could get the number of blocks by taking one less than the
n, multiplying by 6 (because there are 6 new blocks in each figure) and then adding 7 because that’s
how many blocks in the first figure. Here’s my table:
0 1 2 n 7 13 19 6(n-1) +7
1. What do you think about the strategies that Zac and Sione used? Are either of them
correct? Why or why not? Use as many representations as you can to support your answer.
© 2
01
2 w
ww
.flic
kr.c
om
/ph
oto
s/te
dd
ylam
be
c
39
Linear and Exponential Functions 39
© 2012 Mathematics Vision Project | MVP
In partnership with the Utah State Office of Education Licensed under the Creative Commons Attribution-NonCommercial-ShareAlike 3.0 Unported license
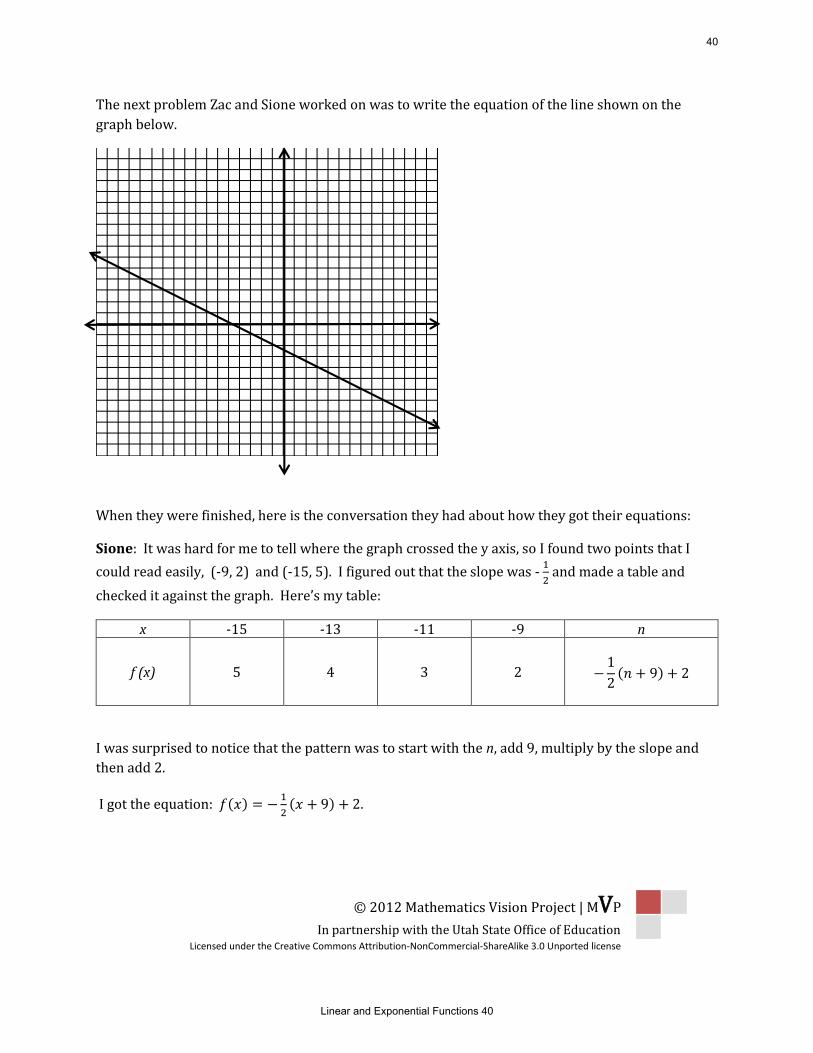
The next problem Zac and Sione worked on was to write the equation of the line shown on the
graph below.
When they were finished, here is the conversation they had about how they got their equations:
Sione: It was hard for me to tell where the graph crossed the y axis, so I found two points that I
could read easily, (-9, 2) and (-15, 5). I figured out that the slope was - 1
2 and made a table and
checked it against the graph. Here’s my table:
x -15 -13 -11 -9 n
f (x) 5 4 3 2
−1
2(𝑛 + 9) + 2
I was surprised to notice that the pattern was to start with the n, add 9, multiply by the slope and
then add 2.
I got the equation: 𝑓(𝑥) = −1
2(𝑥 + 9) + 2.
40
Linear and Exponential Functions 40
© 2012 Mathematics Vision Project | MVP
In partnership with the Utah State Office of Education Licensed under the Creative Commons Attribution-NonCommercial-ShareAlike 3.0 Unported license
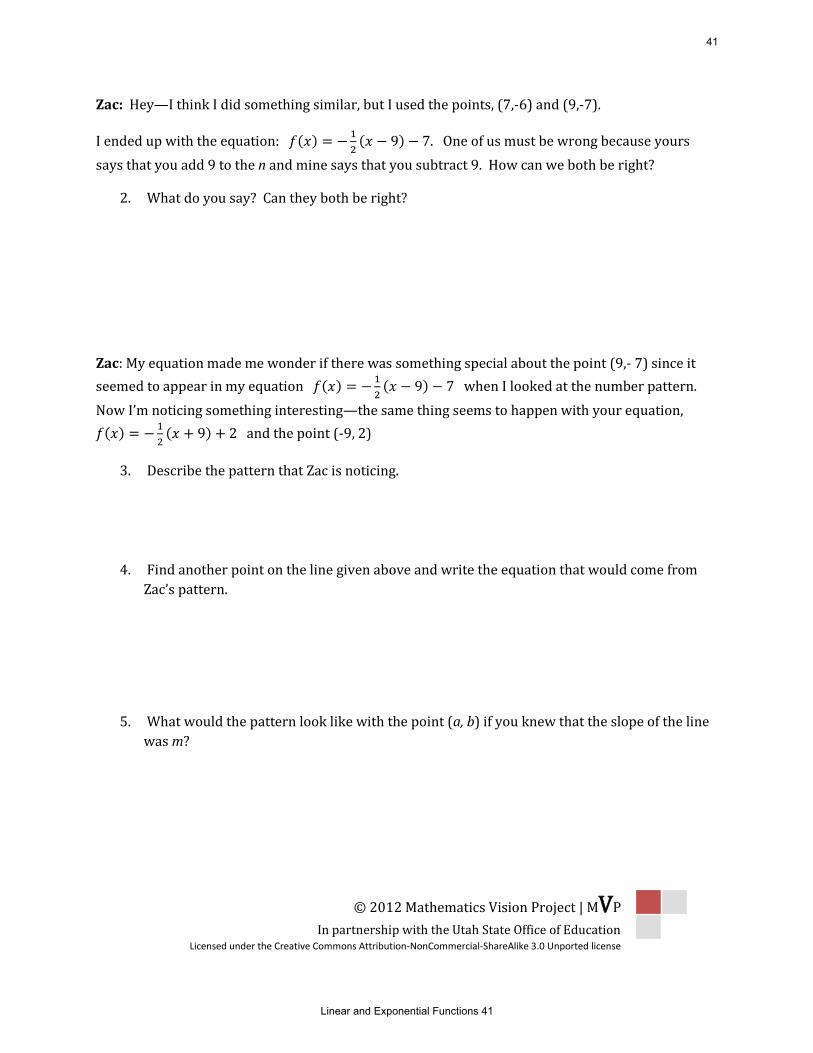
Zac: Hey—I think I did something similar, but I used the points, (7,-6) and (9,-7).
I ended up with the equation: 𝑓(𝑥) = −1
2(𝑥 − 9) − 7. One of us must be wrong because yours
says that you add 9 to the n and mine says that you subtract 9. How can we both be right?
2. What do you say? Can they both be right?
Zac: My equation made me wonder if there was something special about the point (9,- 7) since it
seemed to appear in my equation 𝑓(𝑥) = −1
2(𝑥 − 9) − 7 when I looked at the number pattern.
Now I’m noticing something interesting—the same thing seems to happen with your equation,
𝑓(𝑥) = −1
2(𝑥 + 9) + 2 and the point (-9, 2)
3. Describe the pattern that Zac is noticing.
4. Find another point on the line given above and write the equation that would come from
Zac’s pattern.
5. What would the pattern look like with the point (a, b) if you knew that the slope of the line
was m?
41
Linear and Exponential Functions 41

© 2012 Mathematics Vision Project | MVP
In partnership with the Utah State Office of Education Licensed under the Creative Commons Attribution-NonCommercial-ShareAlike 3.0 Unported license
6. Could you use this pattern to write the equation of any linear function? Why or why not?
Zac and Sione went back to work on an extension of the quilt problem they were working on before.
Now they have this pattern:
Zac: This one works a lot like the last quilt pattern to me. The only difference is that the pattern is
doubling, so I knew it was exponential. I thought that it starts with 7 blocks and doubles, so the
equation must be 𝑓(𝑥) = 7(2)𝑥.
Sione: I don’t know about that. I agree that it is an exponential function—just look at that growth
pattern. But, I made this table:
x 1 2 3 n f(x) 7 14 28 7(2)𝑛−1
42
Linear and Exponential Functions 42

© 2012 Mathematics Vision Project | MVP
In partnership with the Utah State Office of Education Licensed under the Creative Commons Attribution-NonCommercial-ShareAlike 3.0 Unported license
I used the numbers in the table and got this equation: 𝑓(𝑥) = 7(2)𝑥−1.
This seems just like all that stuff we were doing with the lines, but I think that the graphs of these
two equations would be different. There is something definitely wrong here.
7. What is different about the thinking that Zac and Sione used to come to different equations?
8. How are their results similar to their results on the linear quilt pattern above? How are
they different?
Zac: I know! Let’s try doing the same thing with your exponential function as the linear function.
What if we took the point (1, 7) and wrote the equation this way:
𝑓(𝑥) = 2(𝑥−1) + 7
See what I did? I did the subtract 1 thing with the x and then added on the 7 from the y value of the
point. I’ll bet this is a really good shortcut trick.
9. What do you think of Zac’s equation and his strategy? Does it always work? Why or why
not?
43
Linear and Exponential Functions 43

Name: Linear and Exponential Functions 4.7
© 2012 Mathematics Vision Project| MVP In partnership with the Utah State Office of Education
Licensed under the Creative Commons Attribution-‐NonCommercial-‐ShareAlike 3.0 Unported license.
Ready, Set, Go!
Ready Topic: Writing equations of lines.
Write the equation of a line in slope-‐intercept form: y = mx + b, using the given information.
1. m = -‐7, b = 4 2. m = 3/8, b = -‐3 3. m = 16, b = -‐1/5
Write the equation of the line in point-‐slope form: y – y1= m(x – x1), using the given information.
4. m = 9, ( 0. -‐7) 5. m = 2/3, (-‐6, 1) 6. m = -‐5, (4, 11)
7. (2,-‐5) (-‐3, 10) 8. (0, -‐9) (3, 0) 9. (-‐4, 8) (3, 1)
© 2012 www.flickr.com/photos/teddylambec
44
Linear and Exponential Functions 44

Name: Linear and Exponential Functions 4.7
© 2012 Mathematics Vision Project| MVP In partnership with the Utah State Office of Education
Licensed under the Creative Commons Attribution-‐NonCommercial-‐ShareAlike 3.0 Unported license.
Set Topic: Graphing linear and exponential functions
Make a graph of the function based on the following information. Add your axes. Choose an appropriate scale and label your graph. Then write the equation of the function.
10. The beginning value of the function is 5 and its value is 3 units smaller at each stage.
Equation:
11. The beginning value is 16 and its value is ¼ smaller at each stage.
Equation:
12. The beginning value is 1 and its value is 10 times as big at each stage.
Equation:
13. The beginning value is -‐8 and its value is 2 units larger at each stage.
Equation:
45
Linear and Exponential Functions 45

Name: Linear and Exponential Functions 4.7
© 2012 Mathematics Vision Project| MVP In partnership with the Utah State Office of Education
Licensed under the Creative Commons Attribution-‐NonCommercial-‐ShareAlike 3.0 Unported license.
Go Topic: Slope-‐Intercept Form
Rewrite the equations in slope-‐intercept form.
14. 2y + 10 = 6x + 12 15. 5x + y = 7x + 4 16. (y – 13) = ½ (8x – 14)
17. (y + 11) = -‐7(x – 2) 18. (y – 5) = 3(x +2) 19. 3(2x – y) = 9x + 12
20. y – 2 = 1/5 (10x – 25) 21. y + 13 = -‐1(x + 3) 22. y + 1 = ¾(x + 3)
Need Help? Check out these related videos:
Equations in slope-‐intercept form: http://www.khanacademy.org/math/algebra/linear-‐equations-‐and-‐inequalitie/v/linear-‐equations-‐in-‐slope-‐intercept-‐form Equations in point-‐slope form: http://www.khanacademy.org/math/algebra/linear-‐equations-‐and-‐inequalitie/v/linear-‐equations-‐in-‐point-‐slope-‐form
46
Linear and Exponential Functions 46

© 2012 Mathematics Vision Project | MVP
In partnership with the Utah State Office of Education Licensed under the Creative Commons Attribution-NonCommercial-ShareAlike 3.0 Unported license
4.8 Efficiency Experts A Solidify Understanding Task
In our work so far, we have worked with linear and exponential equations in
many forms. Some of the forms of equations and their names are:
Equation Name
𝑦 =1
2𝑥 + 1
Slope Intercept Form 𝑦 = 𝑚𝑥 + 𝑏, where m is the slope and b is the y-
intercept
𝑦 − 3 =1
2 (𝑥 − 4)
Point Slope Form 𝑦 − 𝑦1 = 𝑚(𝑥 − 𝑥1), where m is the slope and (x1, y1) the coordinates of a point on the line
𝑥 − 2𝑦 = −2
Standard Form 𝑎𝑥 + 𝑏𝑦 = 𝑐
𝑓(0) = 1, 𝑓(𝑛) = 𝑓(𝑛 − 1) +1
2
Recursion Formula 𝑓(𝑛) = 𝑓(𝑛 − 1) + D,
Given an initial value f(a) D = constant difference in consecutive terms
1. Verify that the four equations above are equivalent.
2. Explain how you know that the four equations are linear.
You have been appointed as a mathematics efficiency expert. Your job is to compare these four forms of
equations for different uses and decide which form is most efficient and effective for each use. The
investigation will be conducted in four parts with a report to be written at the end.
©2
01
2 w
ww
.flic
kr.c
om
/ph
oto
s/ca
nn
on
god
47
Linear and Exponential Functions 47
© 2012 Mathematics Vision Project | MVP
In partnership with the Utah State Office of Education Licensed under the Creative Commons Attribution-NonCommercial-ShareAlike 3.0 Unported license
Linear Investigation Part A: Which form best tells the story?
1. In his job selling vacuums, Joe makes $500 each month plus $20 for each vacuum he sells. Which
equation best describes Joe’s monthly income?
20𝑥 − 𝑦 = 500 𝑦 = 20𝑥 + 500
2. The Tree Hugger Granola Company makes trail mix with candies and nuts. The cost of candies for
a trail mix is $2 per pound and the cost of the nuts is $1.50 per pound. The total cost of a batch of
trail mix is $540. Which equation best models the quantities of candies and nuts in the mix?
2𝑥 + 1.5 𝑦 = 540 𝑦 =4
3𝑥 + 360
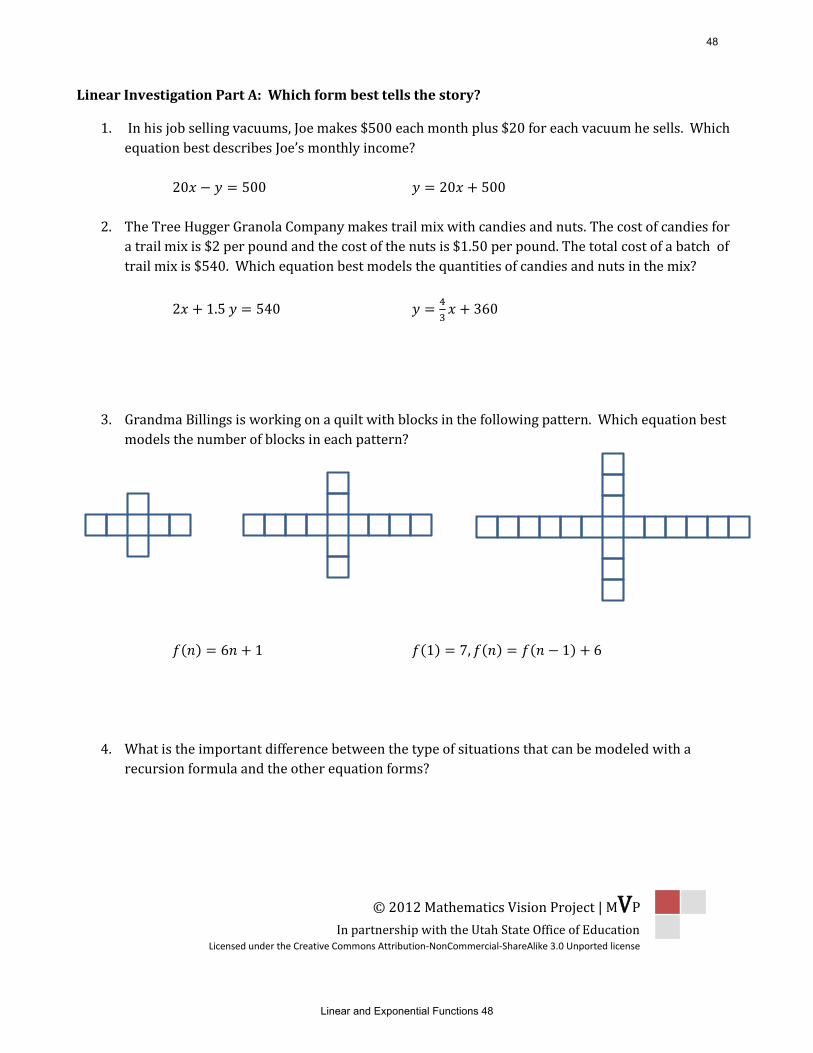
3. Grandma Billings is working on a quilt with blocks in the following pattern. Which equation best
models the number of blocks in each pattern?
𝑓(𝑛) = 6𝑛 + 1 𝑓(1) = 7, 𝑓(𝑛) = 𝑓(𝑛 − 1) + 6
4. What is the important difference between the type of situations that can be modeled with a
recursion formula and the other equation forms?
48
Linear and Exponential Functions 48

© 2012 Mathematics Vision Project | MVP
In partnership with the Utah State Office of Education Licensed under the Creative Commons Attribution-NonCommercial-ShareAlike 3.0 Unported license
Linear Investigation Part B: Which is the best form for writing equations?
1. Write the equation of the line with a slope of -2 through the point (-2, 5)
2. Write the equation of the line through the points (1, -2) and (4, 1)
3. Write the equation of the arithmetic sequence that starts with -7 and each term decreases by 3.
Linear Investigation Part C: Which is the best form for graphing?
Graph the following equations:
1. 𝑦 =3
4𝑥 + 5 2. 3𝑥 − 5𝑦 = 15
49
Linear and Exponential Functions 49

© 2012 Mathematics Vision Project | MVP
In partnership with the Utah State Office of Education Licensed under the Creative Commons Attribution-NonCommercial-ShareAlike 3.0 Unported license
3. 𝑓(𝑛) = −4(𝑛 + 6) + 5 4. 𝑓(0) = −2, 𝑓(𝑛) = 𝑓(𝑛 − 1) − 5
Linear Investigation Part D: What about tables?
1. Create a table for each equation.
a. −𝑥 + 2𝑦 = 6 b. 𝑦 = −1
2𝑥 − 4
2. Write an equation for the relation described in this table.
x y 12 -3 9 -8 6 -13 3 -18 0 -23
50
Linear and Exponential Functions 50

© 2012 Mathematics Vision Project | MVP
In partnership with the Utah State Office of Education Licensed under the Creative Commons Attribution-NonCommercial-ShareAlike 3.0 Unported license
Your Efficiency Analysis Report, Part 1
Using the results of your investigation, describe the best uses for each form of an equation of a line, with
sections for standard form, slope intercept form, point slope form and recursion formulas. Be sure to
include a discussion of tables, graphs, and story contexts as part of your report.
Investigating Exponential Forms
During the course of the year, we have also worked with forms of exponential equations, with a few more
coming before the end of the module. The forms of exponential equations that we have seen so far:
Equation Name
𝑦 = 10(3)𝑥 Explicit Form
𝑦 = 𝑎(𝑏)𝑥
𝑓(0) = 10, 𝑓(𝑛 + 1) = 3𝑓(𝑛)
Recursion Formula 𝑓(𝑛 + 1) = 𝑅𝑓(𝑛)
Given an initial value f(a) R = constant ratio between consecutive terms
Test out the efficiency of these two exponential equation types for these tasks.
Exponential Investigation Part A: Which form tells the story best?
1. Grandma Billings has started piecing her quilt together and has created the following growth
pattern:
Block 1 Block 2 Block 3
Which equation best models the number of squares in each block?
𝑓(𝑛) = 7(2)𝑛−1 𝑓(1) = 7, 𝑓(𝑛) = 2𝑓(𝑛 − 1)
51
Linear and Exponential Functions 51

© 2012 Mathematics Vision Project | MVP
In partnership with the Utah State Office of Education Licensed under the Creative Commons Attribution-NonCommercial-ShareAlike 3.0 Unported license
2. The population of the resort town of Java Hot Springs in 2003 was estimated to be 35,000 people
with an annual rate of increase of about 2.4%. Which equation best models the number of people
in Java Hot Springs, with t = the number of years from 2003?
𝑓(𝑡) = 35,000(1.024)𝑡 𝑓(0) = 35,000, 𝑓(𝑡) = 1.024 ∙ 𝑓(𝑡 − 1)
3. How would you have to change the definition of t in the recursive formula to model the situation?
Exponential Investigation Part B: Which is the best form for graphing?
Graph each equation:
1. 𝑦 = 2( 1.8)𝑥 2. 𝑓(0) = 5, 𝑓(𝑛) = 0.6 ∙ 𝑓(𝑛 − 1)
Your Efficiency Analysis Report, Part 2
Using the results of your investigation, describe the best uses for each form of an exponential equation,
with sections for standard form and recursion formulas. Be sure to include a discussion of tables, graphs,
and story contexts as part of your report.
52
Linear and Exponential Functions 52

Name: Linear and Exponential Functions 4.8
© 2012 Mathematics Vision Project| MVP In partnership with the Utah State Office of Education
Licensed under the Creative Commons Attribution-‐NonCommercial-‐ShareAlike 3.0 Unported license.
Ready, Set, Go!
Ready Topic: Simple interest When a person borrows money, the lender usually charges “rent” on the money. This “rent” is called interest. Simple interest is a percent “r” of the original amount borrowed “p” multiplied by the time “t”, usually in years. The formula for calculating the interest is i = prt.
Calculate the simple interest owed on the following loans.
1. p = $1000 r = 11% t = 2 years i = _________________________
2. p = $6500 r = 12.5% t = 5 years i = _________________________
3. p = $20,000 r = 8.5% t = 6 years i = _________________________
4. p = $700 r = 20% t = 6 months i = _________________________
Juanita borrowed $1,000 and agreed to pay 15% interest for 5 years. Juanita did not have to make any payments until the end of the 5 years, but then she had to pay back the amount borrowed “P” plus all of the interest “i” for the 5 years “t.” Below is a chart that shows how much money Juanita owed the lender at the end of each year of the loan.
5. Look for the pattern you see in the chart above for the amount (A) owed to the lender. Write an function that best describes A with respect to time (in years).
6. At the end of year 5, the interest was calculated at 15% of the original loan of $1000. But by that time Juanita owed $1600 (before the interest was added.) What percent of $1600 is $150?
7. Consider if the lender charged 15% of the amount owed instead of 15% of the amount of the original loan. Make a fourth column on the chart and calculate the interest owed each year if the lender required 15% of the amount owed at the end of each year. Note that the interest owed at the end of the first year would still be $150. Fill in the 4th column.
End of year
Interest owed for the year
Total Amount owed to the lender to pay back the loan.
1 $1000 X .15 = $150 A = Principal + interest = $1150 2 $1000 X .15 = $150 A = P + i + i = $1300 3 $1000 X .15 = $150 A = P + i + i + i = $1450 4 $1000 X .15 = $150 A = P + i + i + i + i = $1600 5 $1000 X .15 = $150 A = P + i + i + i + i + i = $1750
©2012 www.flickr.com/photos/cannongod
53
Linear and Exponential Functions 53

Name: Linear and Exponential Functions 4.8
© 2012 Mathematics Vision Project| MVP In partnership with the Utah State Office of Education
Licensed under the Creative Commons Attribution-‐NonCommercial-‐ShareAlike 3.0 Unported license.
Set Topic: The 4 forms of a linear equation 8. Below are the 4 forms of the same linear equation. For each equation, do the following
(a) Circle the rate of change (b) Name the point that describes the y-‐intercept (c) Name the point that describes the x-‐intercept
Slope-‐intercept Point-‐slope Standard Recursive formula (b) (c)
8. y = 3x – 2 y – 13 = 3(x – 5) 3x – y = 2 𝑓 0 = −2 𝑓(𝑛) = 𝑓(𝑛 − 1) + 3
9. y = ¼ x +7 y – 5 = ¼ (x + 8) x – 4y = -‐28 𝑓 0 = 7 𝑓(𝑛) = 𝑓(𝑛 − 1) + ¼
10. y = -‐⅔x + 3 y + 1 = -‐⅔(x – 6) 2x + 3y = 9 𝑓 0 = 3 𝑓(𝑛) = 𝑓(𝑛 − 1) − ⅔
Go Topic: Solving multi-‐step equations
Solve the following equations
11. 12 + 6𝑥 – 4 = 5 + 2(3𝑥 – 1) 12. 5(2𝑥 + 4) = 3(𝑥 + 5) – 19
13. 7 – 3(4𝑥 + 2) = 6(2𝑥 + 3) – 17 14. 2(𝑥 + 1) = 6 (𝑥 – 3)
15. What does it mean when you have solved an equation?
16. Explain how a linear equation can have more than one solution.
Need Help? Check out these related videos:
Solving equations: http://www.purplemath.com/modules/solvelin4.htm
Interest: http://www.khanacademy.org/finance-‐economics/core-‐finance/v/introduction-‐to-‐interest
54
Linear and Exponential Functions 54

© 2012 Mathematics Vision Project | MVP
In partnership with the Utah State Office of Education Licensed under the Creative Commons Attribution-NonCommercial-ShareAlike 3.0 Unported license
4.9 Up a Little, Down a Little A Solidify Understanding Task
One of the most common applications of exponential growth is compound interest. For example, Mama Bigbucks puts $20,000 in a bank savings account that pays 3% interest compounded annually. “Compounded annually” means that at the end of the first year, the bank pays Mama 3% of $20,000, so they add $600 to the account. Mama leaves her original money ($20000) and the interest ($600) in the account for a year. At the end of the second year the bank will pay interest on the entire amount, $20600. Since the bank is paying interest on a previous interest amount, this is called “compound interest”. Model the amount of money in Mama Bigbucks’ bank account after t years.
Use your model to find the amount of money that Mama has in her account after 20 years.
A formula that is often used for calculating the amount of money in an account that is compounded annually is:
𝐴 = 𝑃(1 + 𝑟)𝑡 Where: A = amount of money in the account after t years P = principal, the original amount of the investment r = the annual interest rate t = the time in years Apply this formula to Mama’s bank account and compare the result to the model that you created. Based upon the work that you did in creating your model, explain the (1 + r) part of the formula.
© 2
01
2 w
ww
.flic
kr.c
om
/ph
oto
s/ci
visi
55
Linear and Exponential Functions 55

© 2012 Mathematics Vision Project | MVP
In partnership with the Utah State Office of Education Licensed under the Creative Commons Attribution-NonCommercial-ShareAlike 3.0 Unported license
Another common application of exponential functions is depreciation. When the value of something you buy goes down a certain percent each year, it is called depreciation. For example, Mama Bigbucks buys a car for $20,000 and it depreciates at a rate of 3% per year. At the end of the first year, the car loses 3% of its original value, so it is now worth $19,400. Model the value of Mama’s car after t years. Use your model to find how many years will it take for Mama’s car to be worth less than $500? How is the situation of Mama’s car similar to Mama’s bank account? What differences do you see in the two situations? Consider your model for the value of Mama’s car and develop a general formula for depreciation.
56
Linear and Exponential Functions 56

Name: Linear and Exponential Functions 4.9
© 2012 Mathematics Vision Project| MVP In partnership with the Utah State Office of Education
Licensed under the Creative Commons Attribution-‐NonCommercial-‐ShareAlike 3.0 Unported license.
Ready, Set, Go!
Ready Topic: Evaluating equations
Fill out the table of values for the given equations.
1. y = 17x – 28
x y
-‐3
1
4
5
2. y = -‐8x – 3
x y
-‐10
-‐6
2
9
3. y = ½ x + 15
x y
-‐26
-‐14
-‐1
9
4. y = 6x
x y
-‐3
-‐1
1
2
5
5. y = 10x
x y
-‐3
-‐1
0
2
6
.
6. 𝑦 = !!
!
x y
-‐4
-‐2
0
3
5
© 2012 www.flickr.com/photos/civisi
57
Linear and Exponential Functions 57

Name: Linear and Exponential Functions 4.9
© 2012 Mathematics Vision Project| MVP In partnership with the Utah State Office of Education
Licensed under the Creative Commons Attribution-‐NonCommercial-‐ShareAlike 3.0 Unported license.
Set Topic: Evaluate using the formulas for simple interest or compound interest.
Given the formula for simple interest: i = Prt, calculate the simple interest paid. (Remember, i = interest, P = the principal, r = the interest rate per year as a decimal, t = time in years )
7. Find the simple interest you will pay on a 5 year loan of $7,000 at 11% per year.
8. How much interest will you pay in 2 years on a loan of $1500 at 4.5% per year?
Use i = Prt to complete the table. All interest rates are annual.
i = P × r × t 9. $11,275 12% 3 years 10. $1428 $5100 4% 11. $93.75 $1250 6 months 12. $54 8% 9 months
Given the formula for compound interest: 𝐴 = 𝑃(1 + 𝑟)! , write a compound interest function to model each situation. Then calculate the balance after the given number of years.
(Remember: A = the balance after t years, P = the principal, t =the time in years, r = the annual interest rate expressed as a decimal)
13. $22,000 invested at a rate of 3.5% compounded annually for 6 years.
14. $4300 invested at a rate of 2.8% compounded annually for 15 years.
15. Suppose that when you are 15 years old, a magic genie gives you the choice of investing $10,000 at a rate of 7% or $5,000 at a rate of 12%. Either choice will be compounded annually. The money will be yours when you are 65 years old. Which investment would be the best? Justify your answer.
58
Linear and Exponential Functions 58

Name: Linear and Exponential Functions 4.9
© 2012 Mathematics Vision Project| MVP In partnership with the Utah State Office of Education
Licensed under the Creative Commons Attribution-‐NonCommercial-‐ShareAlike 3.0 Unported license.
Go Topic: Using order of operations when evaluating equations
Evaluate the equations for the given values of the variables.
16. pq ÷ 6 + 10; when p = 7 and q = -‐3 17. m + n(m – n); when m = 2, and n = 6
18. (b – 1)2 + ba2 ; when a = 5, and b = 3 19. y(x − (9 – 4y)); when x = 4, and y = -‐5
20. x – (x – (x – y3)); when x = 7, and y = 2 21. an4 + a(n – 7)2 + 2n; when a = -‐2, and n = 4
Need Help? Check out these related videos:
http://www.basic-‐mathematics.com/simple-‐vs-‐compound-‐interest.html
http://www.khanacademy.org/finance-‐economics/core-‐finance/v/introduction-‐to-‐interest
59
Linear and Exponential Functions 59

© 2012 Mathematics Vision Project | MVP
In partnership with the Utah State Office of Education Licensed under the Creative Commons Attribution-NonCommercial-ShareAlike 3.0 Unported license
4.10 X Marks the Spot A Practice Understanding Task
Table Puzzles
1. Use the tables to find the missing values of x:
Graph Puzzles
Use the graph to find the value of x.
c. What equations could be written, in terms of x only, for each of the rows that are missing the x
in the two tables above?
f. What equations could be written, in terms of x only, for each of the rows that are missing the x in
the two tables above?
©2
01
2 w
ww
.flic
kr.c
om
/ph
oto
s/b
furl
on
g
a.
x 𝒚 = 𝟎. 𝟕𝒙 − 𝟑 -2 -4.4
-10 10 -8.6
4 -0.2 1.2
b.
x 𝒚 = −𝟐
𝟑𝒙 + 𝟒
10 −102
3
-3 6
5 2
3
0 10
d.
x 𝒚 = 𝟑𝒙
5 243 81
-3 1
27
1
3
2 9
e.
x 𝒚 = (𝟏
𝟐)
𝒙
-5 32 8 1
2 1
4
1
16
60
Linear and Exponential Functions 60

© 2012 Mathematics Vision Project | MVP
In partnership with the Utah State Office of Education Licensed under the Creative Commons Attribution-NonCommercial-ShareAlike 3.0 Unported license
2. What strategy did you use to find the solutions to equations generated by the tables that
contained linear functions?
3. What strategy did you use to find the solutions to equations generated by the tables that
contained exponential functions?
Graph Puzzles
4. The graph of y= -1
2x+3 is given below. Use the graph to solve the equations for x and label the
solutions.
a. 5 = −1
2𝑥 + 3
x = _____ Label the solution with an
A on the graph.
b. −1
2𝑥 + 3 = 1
x = _____ Label the solution with a B
on the graph.
c. −0.5𝑥 + 3 = −1
x = _____ Label the solution with a C on the graph.
61
Linear and Exponential Functions 61

© 2012 Mathematics Vision Project | MVP
In partnership with the Utah State Office of Education Licensed under the Creative Commons Attribution-NonCommercial-ShareAlike 3.0 Unported license
5. The graph of y= 3𝑥 is given below. Use the graph to solve the equations for x and label the
solutions.
a. 3𝑥 =1
9
x = _____ Label the solution with an A on the graph.
b. 3𝑥 = 9
x = _____ Label the solution with a B on the graph.
c. 3√3 = 3𝑥
x = _____ Label the solution with a C on the graph.
d. 1 = 3𝑥
x = _____ Label the solution with a D on the graph.
e. 6 = 3𝑥
x = _____ Label the solution with an E on the graph.
6. How does the graph help to find solutions for x?
Equation Puzzles:
Solve each equation for x:
7. 5𝑥=125 8. 7 = −6𝑥 + 9 9. 10𝑥 = 10,000
10. 2.5 − 0.9𝑥 = 1.3 11. 6𝑥 =1
36 12. (
1.
4)
𝑥= 16
62
Linear and Exponential Functions 62

Name: Linear and Exponential Functions 4.10
© 2012 Mathematics Vision Project | MVP In partnership with the Utah State Office of Education
Licensed under the Creative Commons Attribution-‐NonCommercial-‐ShareAlike 3.0 Unported license
Ready, Set, Go!
Ready 1. Give an example of a discrete function.
2. Give an example of a continuous function.
3. The first and 5th terms of a sequence are given. Fill in the missing numbers for an arithmetic sequence. Then fill in the numbers for a geometric sequence.
Arithmetic -‐6250 -‐10
Geometric -‐6250 -‐10
4. Compare the rate of change in the pair of functions in the graph by identifying the interval where it appears that f (x) is changing faster and the interval where it appears that g (x) is changing faster. Verify your conclusions by making a table of values for each function and exploring the rates of change in your tables.
5. Identify the following sequences as linear, exponential, or neither.
a. -‐23, -‐6. 11, 28, . . . b. 49, 36, 25, 16, . . . c. 5125, 1025, 205, 41, . . .
d. 2, 6, 24, 120, . . . e. 0.12, 0.36, 1.08, 3.24, . . . f. 21, 24.5, 28, 31.5, . . .
4
3
2
1
–1
–6 –4 –2 2 4 6
g(x)f(x)
©2012 www.flickr.com/photos/bfurlong
63
Linear and Exponential Functions 63

Name: Linear and Exponential Functions 4.10
© 2012 Mathematics Vision Project | MVP In partnership with the Utah State Office of Education
Licensed under the Creative Commons Attribution-‐NonCommercial-‐ShareAlike 3.0 Unported license
Set Describe the defining characteristics of each type of function by filling in the cells of each table as completely as possible.
y = 6 + 5x
y = 6( 5x )
6. Type of growth
7. What kind of sequence corresponds to each model?
8. Make a table of values
x y
x y
9. Find the rate of change
10. Graph each equation. Compare the graphs. What is the same? What is different?
11. Find the y-‐intercept for each function.
12. Write the recursive form of each equation.
20
18
16
14
12
10
8
6
4
2
5 10 15 20
20
18
16
14
12
10
8
6
4
2
5 10 15 20
64
Linear and Exponential Functions 64

Name: Linear and Exponential Functions 4.10
© 2012 Mathematics Vision Project | MVP In partnership with the Utah State Office of Education
Licensed under the Creative Commons Attribution-‐NonCommercial-‐ShareAlike 3.0 Unported license
There were 2 girls in my grandmother’s family, my mother and my aunt. They each had 3 daughters. My two sisters, 3 cousins, and I each had 3 daughters. Each one of our 3 daughters have had 3 daughters...
13. If the pattern of each girl having 3 daughters continues for 2 more generations (my mom and aunt being the 1st generation, I want to know about the 5th generation), how many daughters will be born then?
14. Write the explicit equation for this pattern.
15. Create a table and a graph describing this pattern. Is this situation discrete or continuous?
Go Solve the following equations.
16. 5𝑥 + 3 = 2(𝑥 − 6) 17. 6𝑥 − 12𝑥 + 10 = 2(−3𝑥 − 6) 18. 13𝑥 − 12𝑥 + !!= 𝑥 + !
!
Write the equation of the line in slope-‐intercept form given the following information. (P and Q are points on the line)
19. 𝑓 0 = 6, 𝑓( 𝑛) = 𝑓(𝑛– 1) + !! 20. m = -‐3, P : (-‐5, 8) 21. 14𝑥 – 2𝑦 + 9 = 0
22. P : ( 17, -‐4 ) , Q : (-‐5, -‐26) 23. 𝑦 – 9 = !!𝑥 + 6 24. P : (11, 8) , Q : (-‐1, 8)
65
Linear and Exponential Functions 65

Name: Linear and Exponential Functions 4.10
© 2012 Mathematics Vision Project | MVP In partnership with the Utah State Office of Education
Licensed under the Creative Commons Attribution-‐NonCommercial-‐ShareAlike 3.0 Unported license
Recall the following formulas: Simple interest i =prt Compound interest A=P(1+r)t
Using the formulas for simple interest or compound interest, calculate the following.
25. The simple interest on a loan of $12,000 at an interest rate of 17% for 6 years.
26. The simple interest on a loan of $20,000 at an interest rate of 11% for 5 years.
27. The amount owed on a loan of $20,000, at 11%, compounded annually for 5 years.
28. Compare the interest paid in #26 to the interest paid in #27. Which kind of interest do you want if you have to take out a loan?
29. The amount in your savings account at the end of 30 years, if you began with $2500 and earned an interest rate of 7% compounded annually.
66
Linear and Exponential Functions 66
Related Documents


