UNIT 2 • LINEAR AND EXPONENTIAL RELATIONSHIPS Station Activities Set 2: Relations Versus Functions/Domain and Range NAME: CCSS IP Math I Teacher Resource U2-570 © Walch Education Station 2 You will be given a ruler and graph paper. As a group, use your ruler to determine whether or not each relation below is a function. Beside each graph, write your answer and reasoning. 1. x y –5 –4 –3 –2 –1 1 2 3 4 5 5 4 3 2 1 0 –1 –2 –3 –4 –5 y = 2x 2. x y –5 –4 –3 –2 –1 1 2 3 4 5 5 4 3 2 1 0 –1 –2 –3 –4 –5 x 2 + y 2 = 4 continued

Welcome message from author
This document is posted to help you gain knowledge. Please leave a comment to let me know what you think about it! Share it to your friends and learn new things together.
Transcript

UNIT 2 • LINEAR AND EXPONENTIAL RELATIONSHIPSStation Activities Set 2: Relations Versus Functions/Domain and Range
NAME:
CCSS IP Math I Teacher Resource U2-570
© Walch Education
Station 2You will be given a ruler and graph paper. As a group, use your ruler to determine whether or not each relation below is a function. Beside each graph, write your answer and reasoning.
1.
x
y
–5 –4 –3 –2 –1 1 2 3 4 5
5
4
3
2
1
0
–1
–2
–3
–4
–5
y = 2x
2.
x
y
–5 –4 –3 –2 –1 1 2 3 4 5
5
4
3
2
1
0
–1
–2
–3
–4
–5
x2 + y 2 = 4
continued
UNIT 2 • LINEAR AND EXPONENTIAL RELATIONSHIPSStation Activities Set 2: Relations Versus Functions/Domain and Range
NAME:
CCSS IP Math I Teacher Resource © Walch EducationU2-571
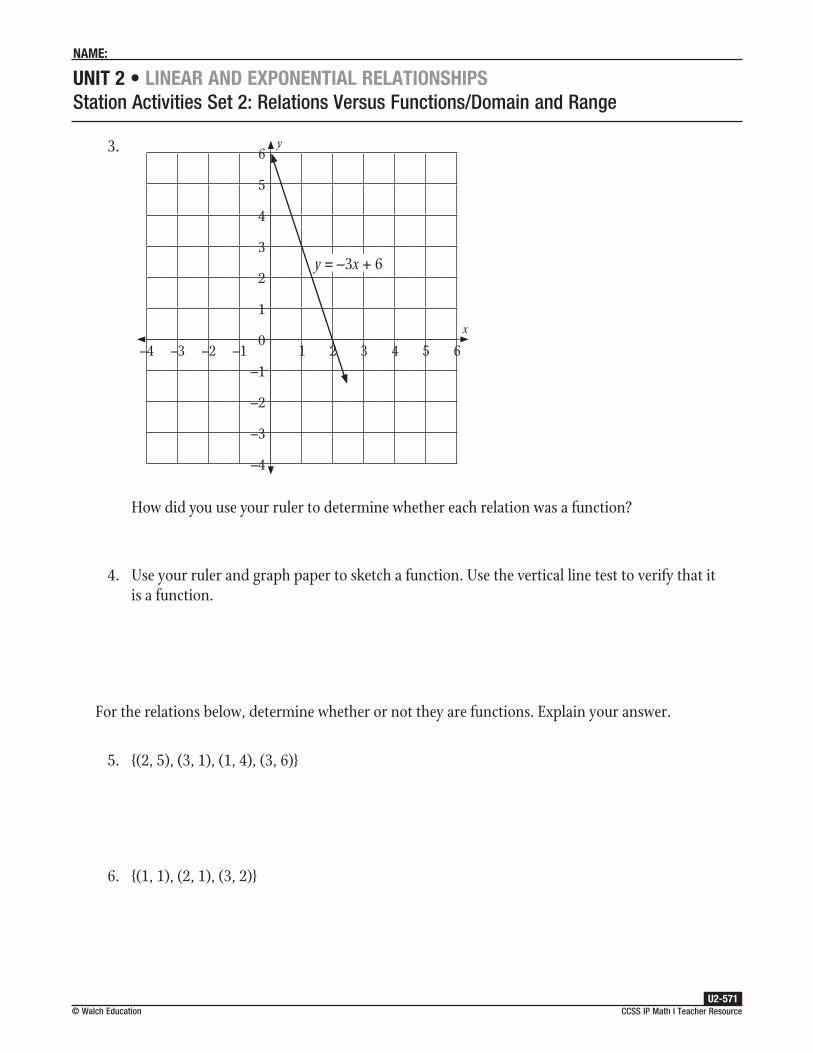
3.
x
y
–4 –3 –2 –1 1 2 3 4 5 6
6
5
4
3
2
1
0
–1
–2
–3
–4
y = –3x + 6
How did you use your ruler to determine whether each relation was a function?
4. Use your ruler and graph paper to sketch a function. Use the vertical line test to verify that it is a function.
For the relations below, determine whether or not they are functions. Explain your answer.
5. {(2, 5), (3, 1), (1, 4), (3, 6)}
6. {(1, 1), (2, 1), (3, 2)}

UNIT 2 • LINEAR AND EXPONENTIAL RELATIONSHIPSStation Activities Set 3: Comparing Exponential Models
Instruction
CCSS IP Math I Teacher Resource U2-574
© Walch Education
Goal: To provide opportunities for students to develop concepts and skills related to creating and interpreting exponential graphs representing real-world situations
Common Core State Standards
F–IF.2 Use function notation, evaluate functions for inputs in their domains, and interpret statements that use function notation in terms of a context.
F–IF.7 Graph functions expressed symbolically and show key features of the graph, by hand in simple cases and using technology for more complicated cases. ★
d. (+) Graph rational functions, identifying zeros and asymptotes when suitable factorizations are available, and showing end behavior.
e. Graph exponential and logarithmic functions, showing intercepts and end behavior, and trigonometric functions, showing period, midline, and amplitude.
Student Activities Overview and Answer KeyStation 1
Working with groups, students determine the y-intercepts and solutions to exponential functions using their graphs. Then, students are given a pair of points and asked to determine the exponential function that passes through those points.
Answers
1.
-10 -9 -8 -7 -6 -5 -4 -3 -2 -1 0 1 2 3 4 5 6 7 8 9 10
-10
-9
-8
-7
-6
-5
-4
-3
-2
-1
1
2
3
4
5
6
7
8
9
10
y-intercept: (0, –2)
1 < x < 2
UNIT 2 • LINEAR AND EXPONENTIAL RELATIONSHIPSStation Activities Set 3: Comparing Exponential Models
Instruction
CCSS IP Math I Teacher Resource © Walch EducationU2-575
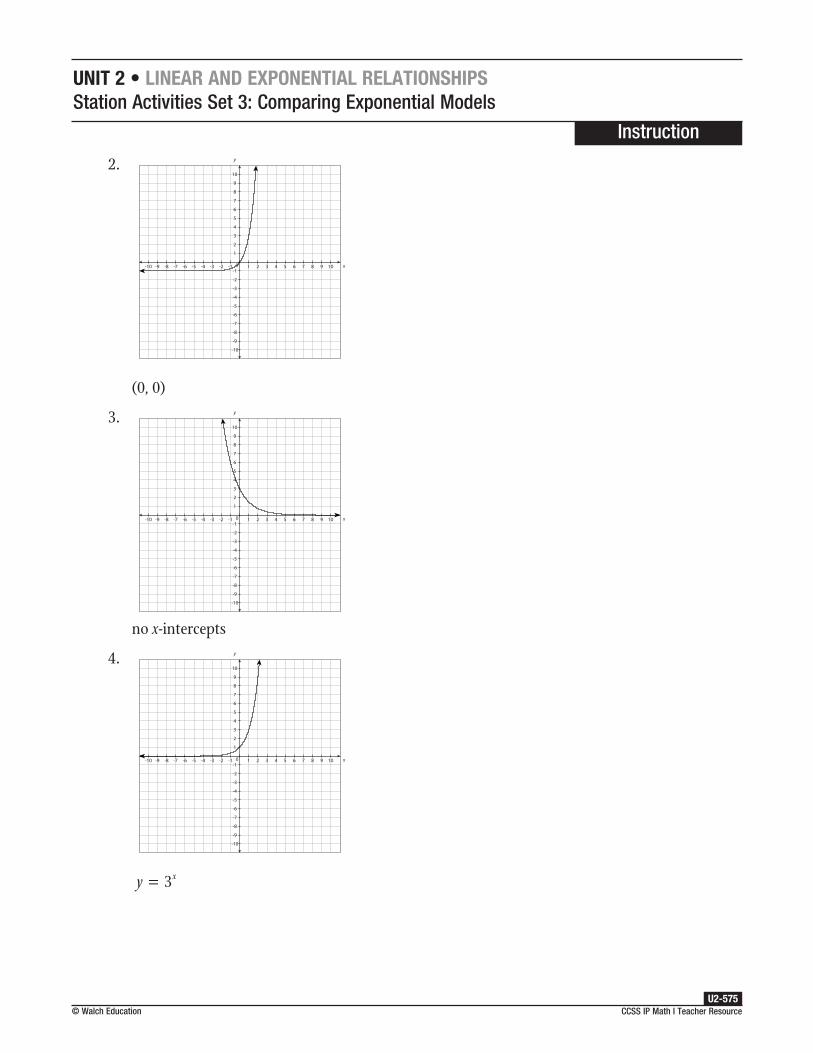
2.
-10 -9 -8 -7 -6 -5 -4 -3 -2 -1 1 2 3 4 5 6 7 8 9 10
-10
-9
-8
-7
-6
-5
-4
-3
-2
-1
1
2
3
4
5
6
7
8
9
10
0
(0, 0)
3.
-10 -9 -8 -7 -6 -5 -4 -3 -2 -1 1 2 3 4 5 6 7 8 9 10
-10
-9
-8
-7
-6
-5
-4
-3
-2
-1
1
2
3
4
5
6
7
8
9
10
0
no x-intercepts
4.
-10 -9 -8 -7 -6 -5 -4 -3 -2 -1 1 2 3 4 5 6 7 8 9 10
-10
-9
-8
-7
-6
-5
-4
-3
-2
-1
1
2
3
4
5
6
7
8
9
10
0
y x= 3
UNIT 2 • LINEAR AND EXPONENTIAL RELATIONSHIPSStation Activities Set 3: Comparing Exponential Models
Instruction
CCSS IP Math I Teacher Resource U2-576
© Walch Education
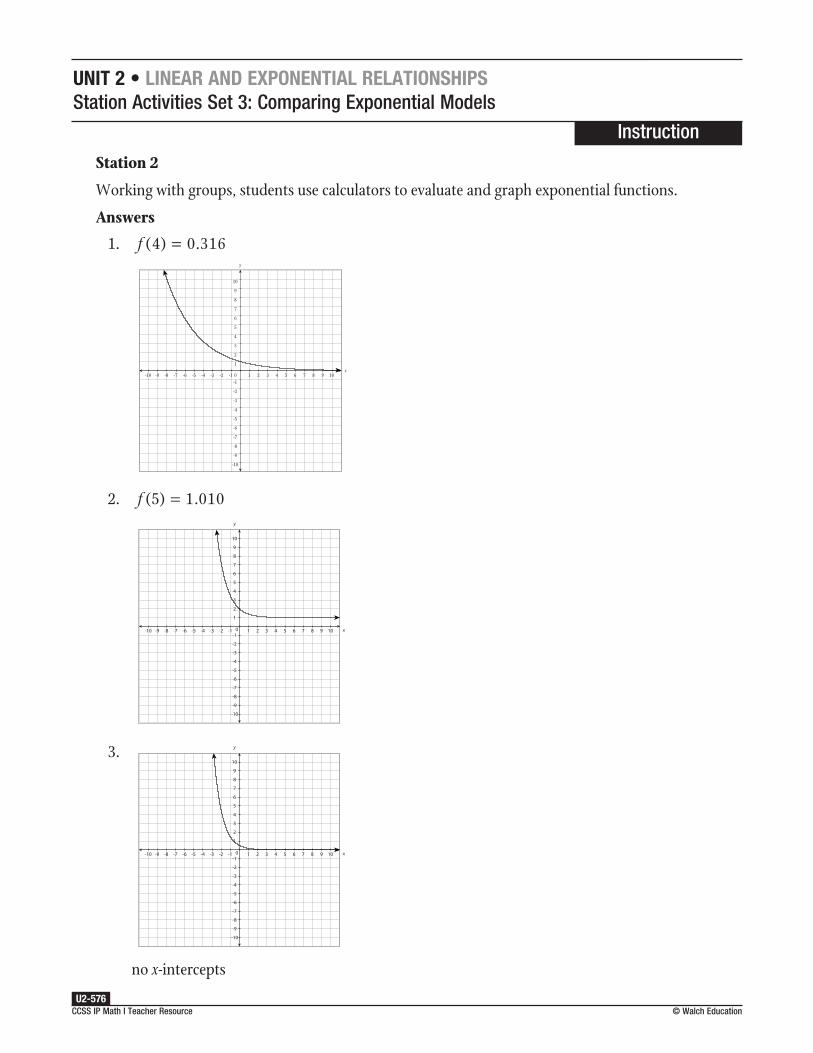
Station 2
Working with groups, students use calculators to evaluate and graph exponential functions.
Answers
1. f ( ) .4 0 31640625=
-10 -9 -8 -7 -6 -5 -4 -3 -2 -1 0 1 2 3 4 5 6 7 8 9 10
-10
-9
-8
-7
-6
-5
-4
-3
-2
-1
1
2
3
4
5
6
7
8
9
10
y
x
2. f ( ) .5 1 01024=
-10 -9 -8 -7 -6 -5 -4 -3 -2 -1 1 2 3 4 5 6 7 8 9 10
-10
-9
-8
-7
-6
-5
-4
-3
-2
-1
1
2
3
4
5
6
7
8
9
10
0
3.
-10 -9 -8 -7 -6 -5 -4 -3 -2 -1 1 2 3 4 5 6 7 8 9 10
-10
-9
-8
-7
-6
-5
-4
-3
-2
-1
1
2
3
4
5
6
7
8
9
10
0
no x-intercepts

UNIT 2 • LINEAR AND EXPONENTIAL RELATIONSHIPSStation Activities Set 3: Comparing Exponential Models
Instruction
CCSS IP Math I Teacher Resource © Walch EducationU2-577
4.
-10 -9 -8 -7 -6 -5 -4 -3 -2 -1 0 1 2 3 4 5 6 7 8 9 10
-10
-9
-8
-7
-6
-5
-4
-3
-2
-1
1
2
3
4
5
6
7
8
9
10
y
x
no x-intercepts
5.
-10 -9 -8 -7 -6 -5 -4 -3 -2 -1 1 2 3 4 5 6 7 8 9 10
-10
-9
-8
-7
-6
-5
-4
-3
-2
-1
1
2
3
4
5
6
7
8
9
10
0
no x-intercepts
6.
-10 -9 -8 -7 -6 -5 -4 -3 -2 -1 0 1 2 3 4 5 6 7 8 9 10
-10
-9
-8
-7
-6
-5
-4
-3
-2
-1
1
2
3
4
5
6
7
8
9
10
y
x
x-intercept at (–1, 0)
7. The graph must cross the x-axis, so the equation must include an addition or subtraction operation in addition to the exponential operation.
UNIT 2 • LINEAR AND EXPONENTIAL RELATIONSHIPSStation Activities Set 3: Comparing Exponential Models
Instruction
CCSS IP Math I Teacher Resource U2-578
© Walch Education
Station 3
Working with groups, students use exponential functions to calculate compound interest according
to the formula A Prn
tn
1= +
.
Answers
1. A = +
⋅
2500 10 035
4
4 4
.
A = $ .2873 93
2. A = +
⋅
5000 10 027
12
2 12
.
A = $ .5277 10
3. A = +
⋅
500 10 04
6
5 6.
A = $610.30
4. A = +
⋅
6000 10 045
12
3 12
.
A = $ .6865 49
5. A = +
≈⋅
1000 10 05
41104 49
2 4
..= $1104.49
A = +
≈⋅
1000 10 046
121096 17
2 12
..= $1096.17
The account with 5% interest has the better yield since that account will yield approximately $1104.49 and the account with the 4.6% interest rate will yield approximately $1096.17.
Station 4
Students will be given an exponential function and asked to generate a table of values and the graph. Then students will examine the equation, table of values, and graph for defining characteristics of exponential functions.
Answers
1. Answers will vary. See sample answer on the following page.
UNIT 2 • LINEAR AND EXPONENTIAL RELATIONSHIPSStation Activities Set 3: Comparing Exponential Models
Instruction
CCSS IP Math I Teacher Resource © Walch EducationU2-579
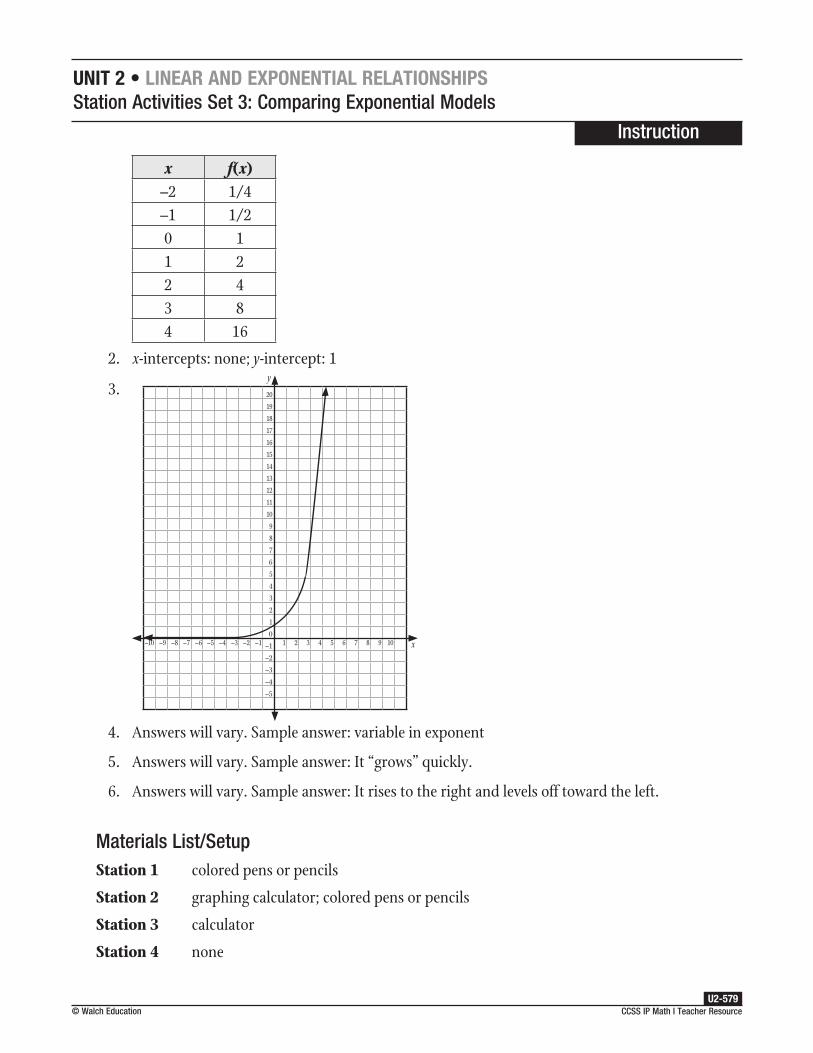
x f(x)–2 1/4–1 1/20 11 22 43 84 16
2. x-intercepts: none; y-intercept: 1
3.
–10 –9 –8 –7 –6 –5 –4 –3 –2 –1 1 2 3 4 5 6 7 8 9 10
20
19
18
17
16
15
14
13
12
11
10
9
8
7
6
5
4
3
2
1
0
–1
–2
–3
–4
–5
y
x
4. Answers will vary. Sample answer: variable in exponent
5. Answers will vary. Sample answer: It “grows” quickly.
6. Answers will vary. Sample answer: It rises to the right and levels off toward the left.
Materials List/SetupStation 1 colored pens or pencils
Station 2 graphing calculator; colored pens or pencils
Station 3 calculator
Station 4 none

UNIT 2 • LINEAR AND EXPONENTIAL RELATIONSHIPSStation Activities Set 3: Comparing Exponential Models
Instruction
CCSS IP Math I Teacher Resource U2-580
© Walch Education
Discussion GuideTo support students in reflecting on the activities and to gather some formative information about student learning, use the following prompts to facilitate a class discussion to “debrief” the station activities.
Prompts/Questions
1. What is an exponential function?
2. When does a function have an x-intercept?
3. What is compound interest?
4. Why can it be difficult to estimate compound interest?
5. How do you determine if an equation is exponential?
6. What is the general shape of the graph of an exponential function?
Think, Pair, Share
Have students jot down their own responses to questions, then discuss with a partner (who was not in their station group), and then discuss as a whole class.
Suggested Appropriate Responses
1. An exponential function is a function in which the variable is in the exponent.
2. A function has an x-intercept when its graph crosses the x-axis.
3. Compound interest is interest that accumulates according to the total (principal plus interest) already in the account, not just according to the principal.
4. The amount on which the percentage is based keeps changing.
5. An exponential equation has a variable in the exponent.
6. The general shape is a curve that extends toward infinity on one side and approaches the x-axis on the other side.

UNIT 2 • LINEAR AND EXPONENTIAL RELATIONSHIPSStation Activities Set 3: Comparing Exponential Models
Instruction
CCSS IP Math I Teacher Resource © Walch EducationU2-581
Possible Misunderstandings/Mistakes
• Incorrectly manipulating numbers, variables, or exponents
• Not understanding the laws of exponents
• Assuming that all functions have zeros
• Incorrectly calculating squares, cubes, etc., of integers between 1 and 10
• Confusing a negative exponent with a fractional exponent
• Incorrectly using the exponent function of a calculator
• Incorrectly applying the formula of compound interest
• Not understanding the relationship between an exponential function and its graph
• Not generating the table of values correctly
• Plotting points incorrectly
• Miscalculating the x- and y-intercepts

UNIT 2 • LINEAR AND EXPONENTIAL RELATIONSHIPSStation Activities Set 3: Comparing Exponential Models
NAME:
CCSS IP Math I Teacher Resource U2-582
© Walch Education
Station 1Work with your group to answer each question.
1. Graph y x= −2 3 .
–10 –9 –8 –7 –6 –5 –4 –3 –2 –1 1 2 3 4 5 6 7 8 9 10
10
9
8
7
6
5
4
3
2
1
0
–1
–2
–3
–4
–5
–6
–7
–8
–9
–10
y
x
Where is the y-intercept?
What are the roots of this function?
2. Graph y x= −4 1 .
–10 –9 –8 –7 –6 –5 –4 –3 –2 –1 1 2 3 4 5 6 7 8 9 10
10
9
8
7
6
5
4
3
2
1
0
–1
–2
–3
–4
–5
–6
–7
–8
–9
–10
y
x
Does this function have an x-intercept? If so, estimate where it is.continued

UNIT 2 • LINEAR AND EXPONENTIAL RELATIONSHIPSStation Activities Set 3: Comparing Exponential Models
NAME:
CCSS IP Math I Teacher Resource © Walch EducationU2-583
3. Graph yx
=
312
.
–10 –9 –8 –7 –6 –5 –4 –3 –2 –1 1 2 3 4 5 6 7 8 9 10
10
9
8
7
6
5
4
3
2
1
0
–1
–2
–3
–4
–5
–6
–7
–8
–9
–10
y
x
Does this function have an x-intercept? If so, estimate where it is.
4. An exponential function passes through the points (0, 1) and (2, 9). What is the function? Graph your answer.
–10 –9 –8 –7 –6 –5 –4 –3 –2 –1 1 2 3 4 5 6 7 8 9 10
10
9
8
7
6
5
4
3
2
1
0
–1
–2
–3
–4
–5
–6
–7
–8
–9
–10
y
x
UNIT 2 • LINEAR AND EXPONENTIAL RELATIONSHIPSStation Activities Set 3: Comparing Exponential Models
NAME:
CCSS IP Math I Teacher Resource U2-584
© Walch Education
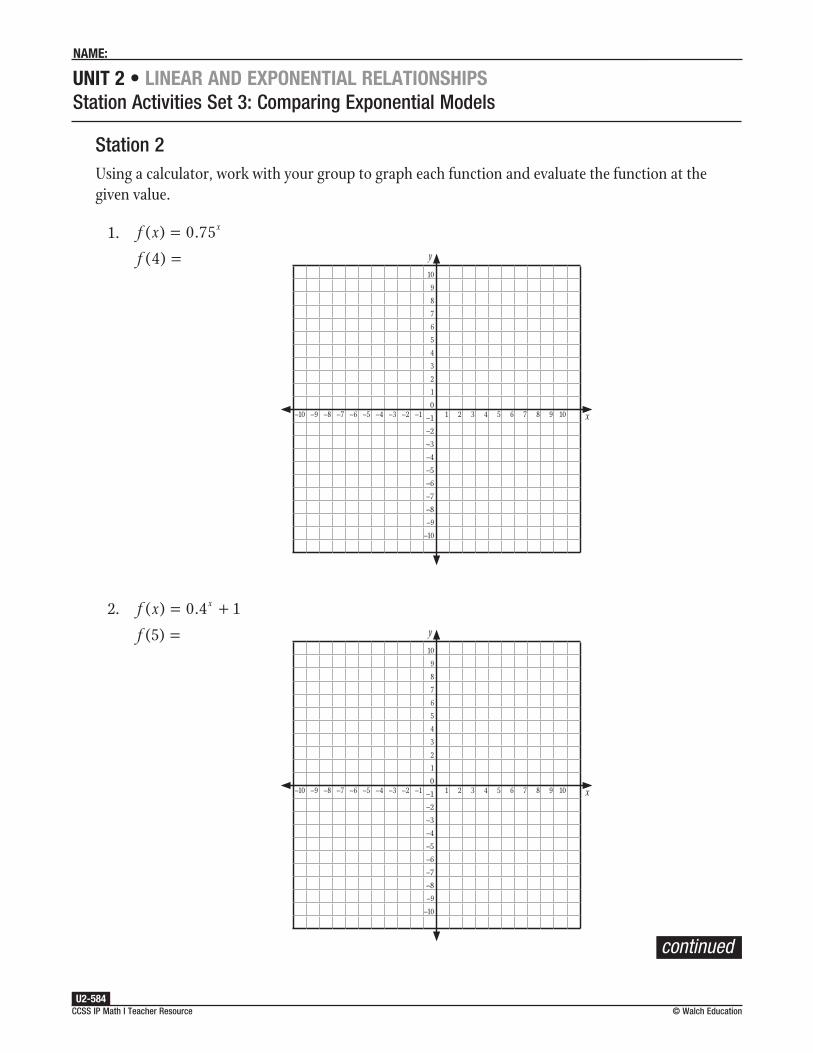
Station 2Using a calculator, work with your group to graph each function and evaluate the function at the given value.
1. f x
f
x( ) .
( )
==
0 75
4
–10 –9 –8 –7 –6 –5 –4 –3 –2 –1 1 2 3 4 5 6 7 8 9 10
10
9
8
7
6
5
4
3
2
1
0
–1
–2
–3
–4
–5
–6
–7
–8
–9
–10
y
x
2. f x
f
x( ) .
( )
= +=
0 4 1
5
–10 –9 –8 –7 –6 –5 –4 –3 –2 –1 1 2 3 4 5 6 7 8 9 10
10
9
8
7
6
5
4
3
2
1
0
–1
–2
–3
–4
–5
–6
–7
–8
–9
–10
y
x
continued

UNIT 2 • LINEAR AND EXPONENTIAL RELATIONSHIPSStation Activities Set 3: Comparing Exponential Models
NAME:
CCSS IP Math I Teacher Resource © Walch EducationU2-585
3. Graph yx
=
12
13
. If there is an x-intercept, what is it?
–10 –9 –8 –7 –6 –5 –4 –3 –2 –1 1 2 3 4 5 6 7 8 9 10
10
9
8
7
6
5
4
3
2
1
0
–1
–2
–3
–4
–5
–6
–7
–8
–9
–10
y
x
4. Graph y x= 4 . If there is an x-intercept, what is it?
–10 –9 –8 –7 –6 –5 –4 –3 –2 –1 1 2 3 4 5 6 7 8 9 10
10
9
8
7
6
5
4
3
2
1
0
–1
–2
–3
–4
–5
–6
–7
–8
–9
–10
y
x
continued
UNIT 2 • LINEAR AND EXPONENTIAL RELATIONSHIPSStation Activities Set 3: Comparing Exponential Models
NAME:
CCSS IP Math I Teacher Resource U2-586
© Walch Education
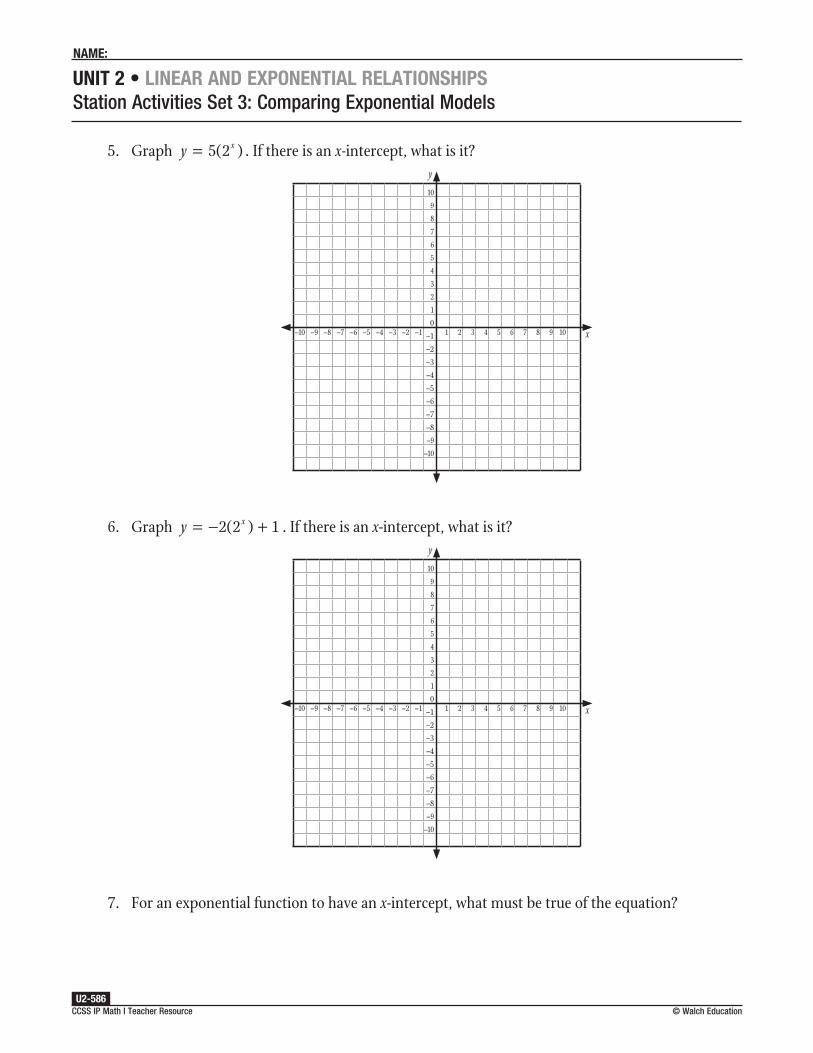
5. Graph y x= 5 2( ) . If there is an x-intercept, what is it?
–10 –9 –8 –7 –6 –5 –4 –3 –2 –1 1 2 3 4 5 6 7 8 9 10
10
9
8
7
6
5
4
3
2
1
0
–1
–2
–3
–4
–5
–6
–7
–8
–9
–10
y
x
6. Graph y x= − +2 2 1( ) . If there is an x-intercept, what is it?
–10 –9 –8 –7 –6 –5 –4 –3 –2 –1 1 2 3 4 5 6 7 8 9 10
10
9
8
7
6
5
4
3
2
1
0
–1
–2
–3
–4
–5
–6
–7
–8
–9
–10
y
x
7. For an exponential function to have an x-intercept, what must be true of the equation?

UNIT 2 • LINEAR AND EXPONENTIAL RELATIONSHIPSStation Activities Set 3: Comparing Exponential Models
NAME:
CCSS IP Math I Teacher Resource © Walch EducationU2-587
Station 3
The formula for compound interest is A Prn
tn
1= +
, where A is the final total (principal plus
interest), P is the initial amount (principal), r is the interest rate, t is the amount of time in years, and
n is the number of times the interest compounds per year. Work with your group to set up and then
solve each equation. Round answers to the nearest penny.
1. An account with an initial balance of $2,500 has interest of 3.5% that compounds quarterly over four years. What is the balance at the end of the fourth year?
2. An account with an initial balance of $5,000 has interest of 2.7% that compounds monthly over two years. What is the balance at the end of the second year?
3. An account with an initial balance of $500 has interest of 4% that compounds every other month over five years. What is the balance at the end of the fifth year?
4. An account with an initial balance of $6,000 has interest of 4.5% that compounds monthly over three years. What is the balance at the end of the third year?
5. If you have $1,000 to invest for two years, which account has the better yield: an account that compounds quarterly at 5%, or one that compounds monthly at 4.6%?

UNIT 2 • LINEAR AND EXPONENTIAL RELATIONSHIPSStation Activities Set 3: Comparing Exponential Models
NAME:
CCSS IP Math I Teacher Resource U2-588
© Walch Education
Station 4You will work with an exponential function at this station.
Use the exponential function below for the following problems.
f(x) = 2x
1. Create a table of values for your function.
x f(x)
2. Find the x- and y-intercepts.
3. Graph your function below.
–10 –9 –8 –7 –6 –5 –4 –3 –2 –1 1 2 3 4 5 6 7 8 9 10
20
19
18
17
16
15
14
13
12
11
10
9
8
7
6
5
4
3
2
1
0
–1
–2
–3
–4
–5
y
x
continued
UNIT 2 • LINEAR AND EXPONENTIAL RELATIONSHIPSStation Activities Set 3: Comparing Exponential Models
NAME:
CCSS IP Math I Teacher Resource © Walch EducationU2-589
4. Looking at the equation, what are some defining characteristics of an exponential function?
5. Looking at the table of values, what are some defining characteristics of an exponential function’s table of values?
6. Looking at the graph, what are some defining characteristics of an exponential function’s graph?
UNIT 2 • LINEAR AND EXPONENTIAL RELATIONSHIPSStation Activities Set 4: Interpreting Exponential Functions
Instruction
CCSS IP Math I Teacher Resource © Walch EducationU2-591
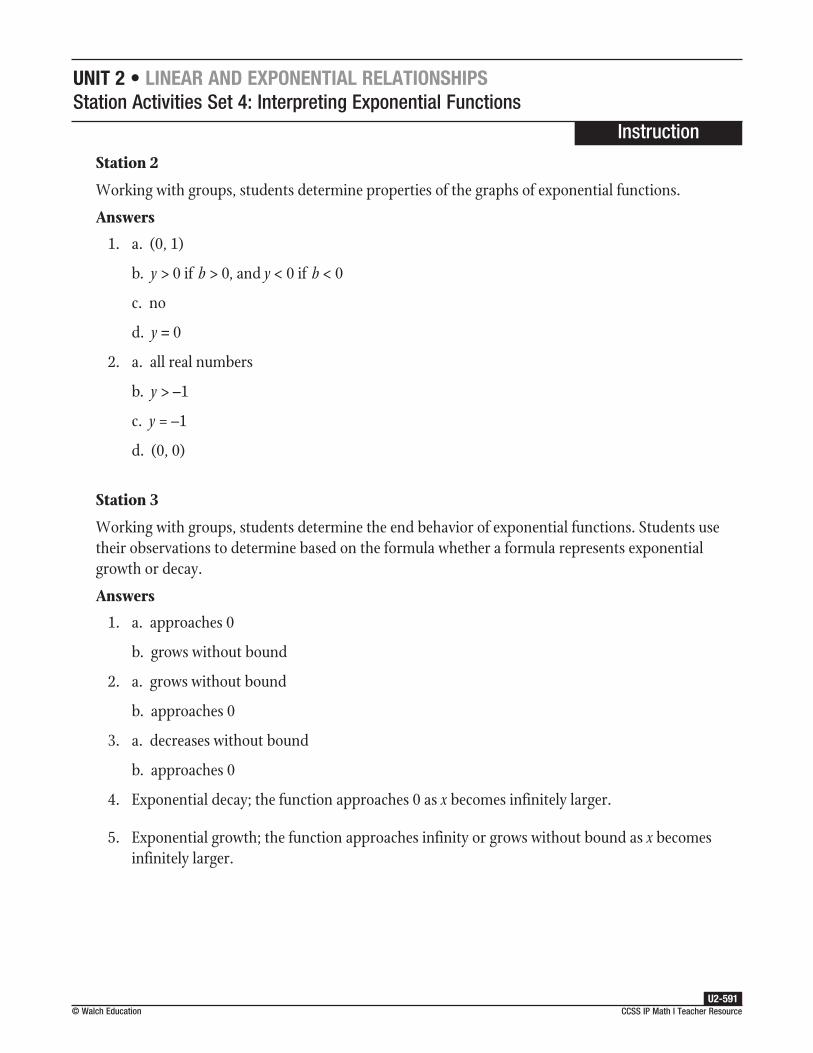
Station 2
Working with groups, students determine properties of the graphs of exponential functions.
Answers
1. a. (0, 1)
b. y > 0 if b > 0, and y < 0 if b < 0
c. no
d. y = 0
2. a. all real numbers
b. y > –1
c. y = –1
d. (0, 0)
Station 3
Working with groups, students determine the end behavior of exponential functions. Students use their observations to determine based on the formula whether a formula represents exponential growth or decay.
Answers
1. a. approaches 0
b. grows without bound
2. a. grows without bound
b. approaches 0
3. a. decreases without bound
b. approaches 0
4. Exponential decay; the function approaches 0 as x becomes infinitely larger.
5. Exponential growth; the function approaches infinity or grows without bound as x becomes infinitely larger.

UNIT 2 • LINEAR AND EXPONENTIAL RELATIONSHIPSStation Activities Set 4: Interpreting Exponential Functions
Instruction
CCSS IP Math I Teacher Resource U2-592
© Walch Education
Station 4
Student pairs graph exponential functions, checking their work with a graphing calculator.
Answers
1. 3.
-10 -9 -8 -7 -6 -5 -4 -3 -2 -1 1 2 3 4 5 6 7 8 9 10
-10
-9
-8
-7
-6
-5
-4
-3
-2
-1
1
2
3
4
5
6
7
8
9
10
0
-10 -9 -8 -7 -6 -5 -4 -3 -2 -1 1 2 3 4 5 6 7 8 9 10
-10
-9
-8
-7
-6
-5
-4
-3
-2
-1
1
2
3
4
5
6
7
8
9
10
0
2. 4.
-10 -9 -8 -7 -6 -5 -4 -3 -2 -1 1 2 3 4 5 6 7 8 9 10
-10
-9
-8
-7
-6
-5
-4
-3
-2
-1
1
2
3
4
5
6
7
8
9
10
0
-10 -9 -8 -7 -6 -5 -4 -3 -2 -1 1 2 3 4 5 6 7 8 9 10
-10
-9
-8
-7
-6
-5
-4
-3
-2
-1
1
2
3
4
5
6
7
8
9
10
0
Materials List/SetupStation 1 graphing calculator
Station 2 graphing calculator
Station 3 graphing calculator
Station 4 graphing calculator; graph paper

UNIT 2 • LINEAR AND EXPONENTIAL RELATIONSHIPSStation Activities Set 4: Interpreting Exponential Functions
Instruction
CCSS IP Math I Teacher Resource © Walch EducationU2-593
Discussion GuideTo support students in reflecting on the activities and to gather some formative information about student learning, use the following prompts to facilitate a class discussion to “debrief” the station activities.
Prompts/Questions
1. What is an exponent?
2. What is an exponential function?
3. What are the differences among the graphs of exponential functions when the base is negative, when the base is a fraction, and when the base is a negative fraction?
Think, Pair, Share
Have students jot down their own responses to questions, then discuss with a partner (who was not in their station group), and then discuss as a whole class.
Suggested Appropriate Responses
1. An exponent is a number that tells the number of times the base is to be multiplied by itself.
2. An exponential function is a function in which the variable is in the exponent.
3. A base that is negative will be reflected over the x-axis, and a base that is a fraction will be reflected over the y-axis. If the base is a negative fraction, then it will be reflected over both the x- and y-axes.
Possible Misunderstandings/Mistakes
• Incorrectly manipulating numbers, variables, or exponents
• Not understanding the laws of exponents
• Assuming that all functions have zeros
• Assuming that an exponential function has a vertical asymptote as it tends toward unbounded growth
• Not understanding the difference between growth and decay
• Incorrectly calculating squares, cubes, etc., of integers between 1 and 10
• Confusing a negative exponent with a fractional exponent
UNIT 2 • LINEAR AND EXPONENTIAL RELATIONSHIPSStation Activities Set 4: Interpreting Exponential Functions
NAME:
CCSS IP Math I Teacher Resource U2-594
© Walch Education
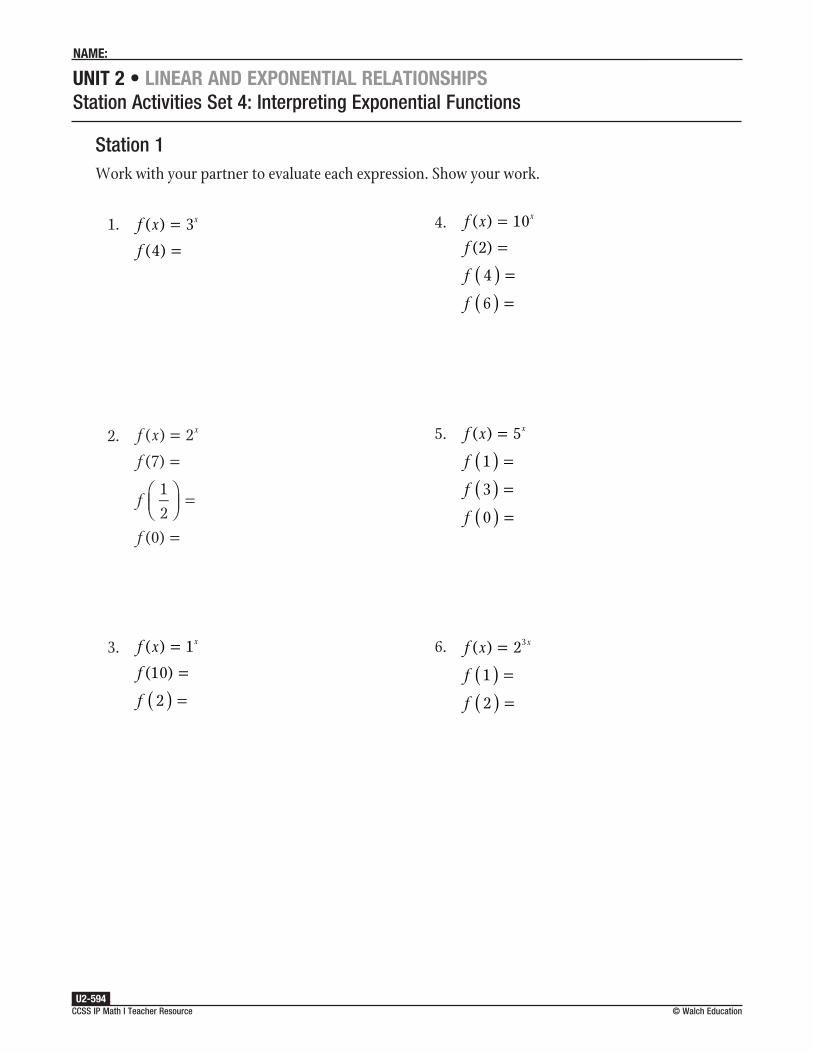
Station 1Work with your partner to evaluate each expression. Show your work.
1.
f (x) = 3x
f (4) =
2. ( ) 2
(7)
12
(0)
f x
f
f
f
x==
=
=
3.
f (x) = 1x
f (10) =f 2( ) =
4.
f (x) = 10x
f (2) =f 4( ) =f 6( ) =
5.
f (x) = 5x
f 1( ) =f 3( ) =f 0( ) =
6.
f (x) = 23 x
f 1( ) =f 2( ) =
UNIT 2 • LINEAR AND EXPONENTIAL RELATIONSHIPSStation Activities Set 4: Interpreting Exponential Functions
NAME:
CCSS IP Math I Teacher Resource © Walch EducationU2-595
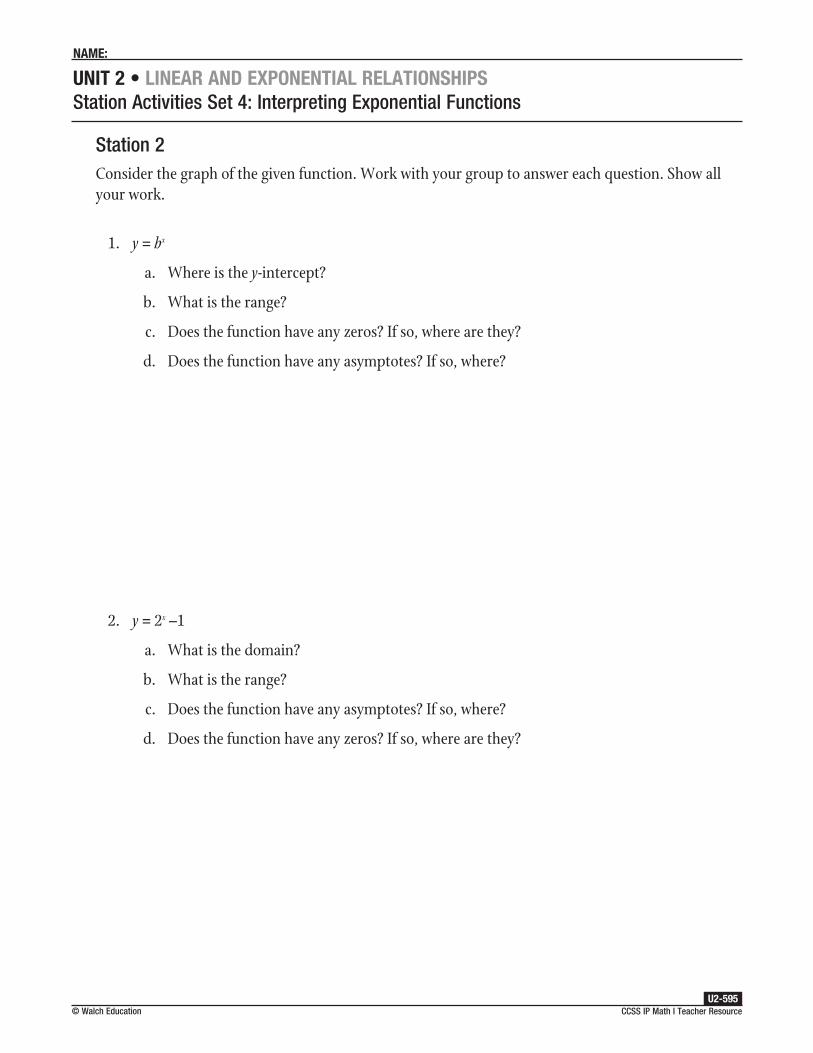
Station 2Consider the graph of the given function. Work with your group to answer each question. Show all your work.
1. y = bx
a. Where is the y-intercept?
b. What is the range?
c. Does the function have any zeros? If so, where are they?
d. Does the function have any asymptotes? If so, where?
2. y = 2x –1
a. What is the domain?
b. What is the range?
c. Does the function have any asymptotes? If so, where?
d. Does the function have any zeros? If so, where are they?
UNIT 2 • LINEAR AND EXPONENTIAL RELATIONSHIPSStation Activities Set 4: Interpreting Exponential Functions
NAME:
CCSS IP Math I Teacher Resource U2-596
© Walch Education
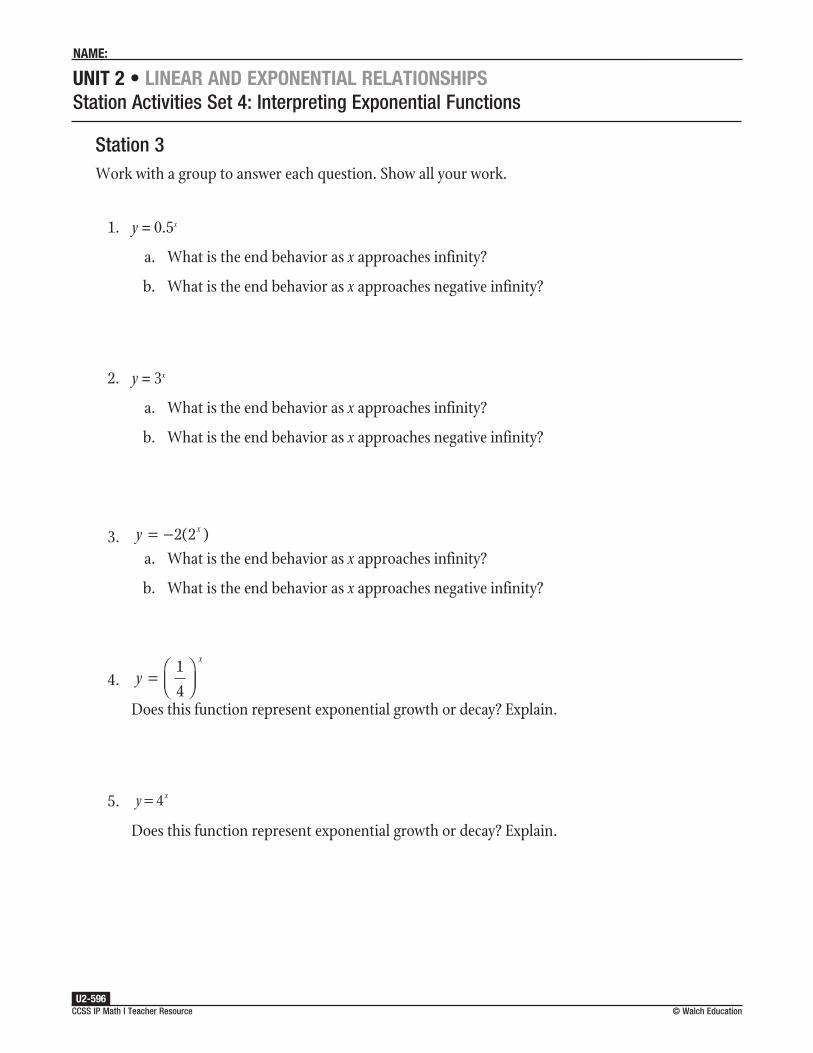
Station 3Work with a group to answer each question. Show all your work.
1. y = 0.5x
a. What is the end behavior as x approaches infinity?
b. What is the end behavior as x approaches negative infinity?
2. y = 3x
a. What is the end behavior as x approaches infinity?
b. What is the end behavior as x approaches negative infinity?
3. y x= −2 2( )a. What is the end behavior as x approaches infinity?
b. What is the end behavior as x approaches negative infinity?
4. yx
=
14
Does this function represent exponential growth or decay? Explain.
5. y x= 4
Does this function represent exponential growth or decay? Explain.

UNIT 2 • LINEAR AND EXPONENTIAL RELATIONSHIPSStation Activities Set 5: Sequences
Instruction
CCSS IP Math I Teacher Resource U2-602
© Walch Education
Discussion GuideTo support students in reflecting on the activities and to gather some formative information about student learning, use the following prompts to facilitate a class discussion to “debrief” the station activities.
Prompts/Questions
1. What is an arithmetic sequence?
2. What is a series?
3. Is a sequence finite or infinite?
4. What is a geometric sequence?
5. How is a geometric sequence different from an arithmetic sequence?
6. How could a geometric sequence be related to exponential functions?
Think, Pair, Share
Have students jot down their own responses to questions, then discuss with a partner (who was not in their station group), and then discuss as a whole class.
Suggested Appropriate Responses
1. An arithmetic sequence is an ordered group of numbers separated by a common difference.
2. A series is the partial sum of a sequence.
3. A sequence can be bounded (finite) or infinite.
4. A geometric sequence is an ordered set of numbers that increase or decrease by a common ratio, r.
5. An arithmetic sequence is an ordered set of numbers that increase or decrease at a common difference, d. The terms in an arithmetic sequence are defined by addition or subtraction; the terms in a geometric sequence increase or decrease by a common factor.
6. To find the terms of a geometric sequence, we use an exponential calculation.

UNIT 2 • LINEAR AND EXPONENTIAL RELATIONSHIPSStation Activities Set 5: Sequences
NAME:
CCSS IP Math I Teacher Resource © Walch EducationU2-605
Station 2Work with your group to answer each question. Show all your work. Use the calculator if you need help.
For problems 1–3, let a1 = 4t and d = 2t.
1. What is an?
2. What is a10
?
3. What is the sum of the first 10 terms in the sequence?
For problems 4–6, let a1 = 5 and d = 10.
4. What is an?
5. What is a15
?
6. What is S15
?
Answer the following questions about sequences.
7. Look at the sequence x x x x, , , , ...3 5 7 What is S
9?
8. Look at the sequence 0, 1, 4, 9, 16, 25, ... Is it arithmetical? Explain.
9. Think of the sequence of positive odd integers. What is the 35th term of that sequence?
10. What is S35
of the sequence of positive odd integers?
UNIT 2 • LINEAR AND EXPONENTIAL RELATIONSHIPSStation Activities Set 5: Sequences
NAME:
CCSS IP Math I Teacher Resource © Walch EducationU2-607
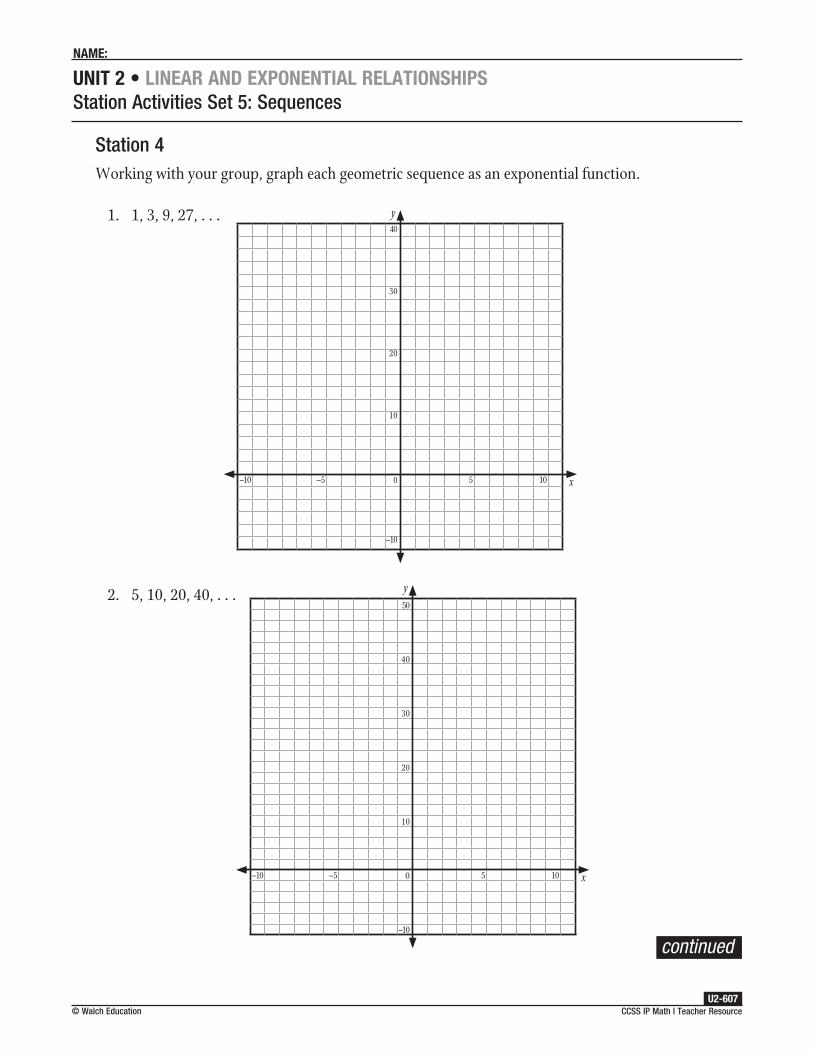
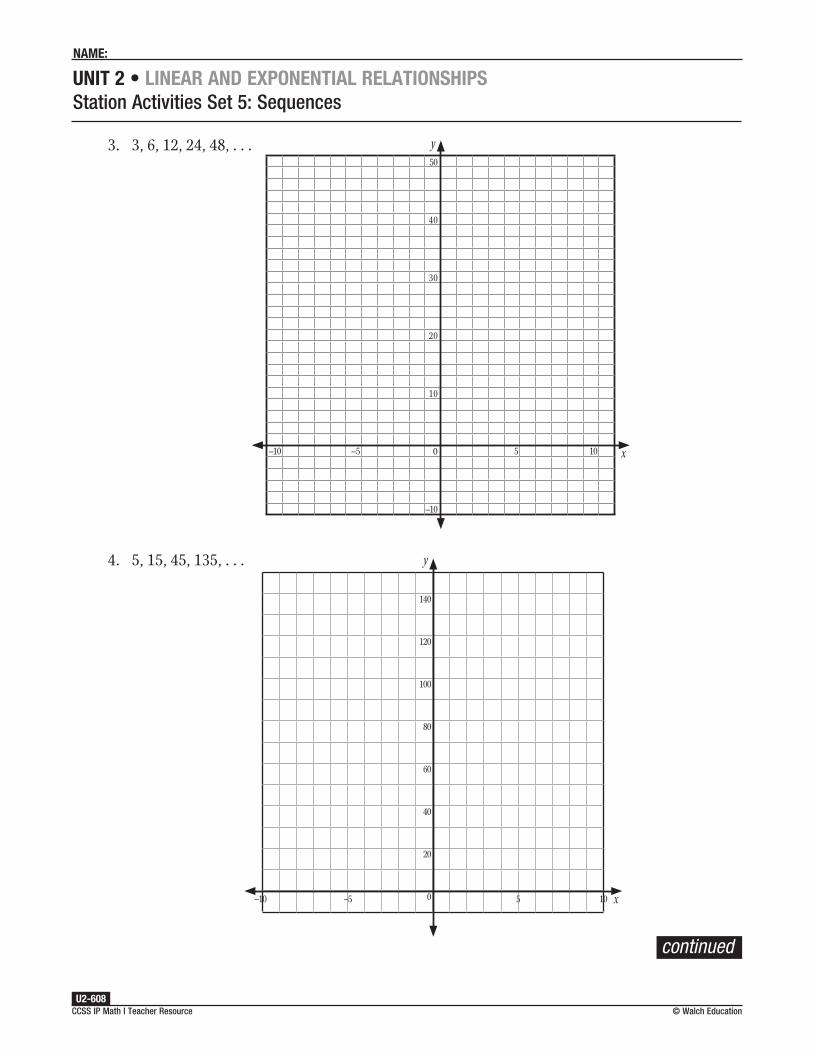
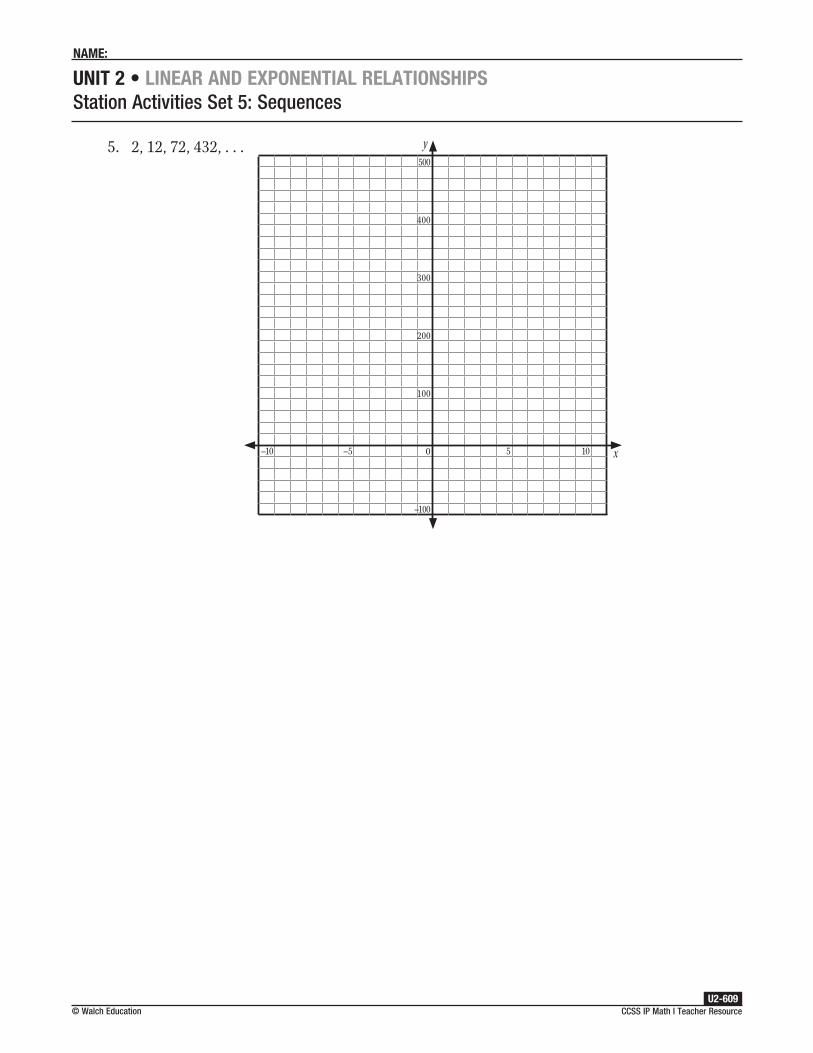
Station 4Working with your group, graph each geometric sequence as an exponential function.
1. 1, 3, 9, 27, . . .
–10 –5 5 10
40
30
20
10
0
–10
y
x
2. 5, 10, 20, 40, . . .
–10 –5 5 10
50
40
30
20
10
0
–10
y
x
continued
UNIT 2 • LINEAR AND EXPONENTIAL RELATIONSHIPSStation Activities Set 5: Sequences
NAME:
CCSS IP Math I Teacher Resource U2-608
© Walch Education
3. 3, 6, 12, 24, 48, . . .
–10 –5 5 10
50
40
30
20
10
0
–10
y
x
4. 5, 15, 45, 135, . . . y
x–10 –5 5 10
140
120
100
80
60
40
20
0
continued
UNIT 2 • LINEAR AND EXPONENTIAL RELATIONSHIPSStation Activities Set 5: Sequences
NAME:
CCSS IP Math I Teacher Resource © Walch EducationU2-609
5. 2, 12, 72, 432, . . .
–10 –5 5 10
500
400
300
200
100
0
–100
y
x

UNIT 3 • REASONING WITH EQUATIONSStation Activities Set 2: Solving Systems by Graphing
NAME:
CCSS IP Math I Teacher ResourceU3-143
© Walch Education
Station 2At this station, you will find four index cards with the following linear systems of equations written on them:
10 2 10
5 5
x y
x y
− =− =
; 5 3
7 5
x y
x y
+ = −+ = −
; y
x y
=− + =
4
10;
y x
x y
= +− + =
2 5
2 8
Work together to match each system of linear equations with the appropriate graph below. Write the appropriate system of linear equations beside each graph.
1.
–10 –9 –8 –7 –6 –5 –4 –3 –2 –1 1 2 3 4 5 6 7 8 9 10
10
9
8
7
6
5
4
3
2
1
0
–1
–2
–3
–4
–5
–6
–7
–8
–9
–10
y
x
2.
–10 –9 –8 –7 –6 –5 –4 –3 –2 –1 1 2 3 4 5 6 7 8 9 10
10
9
8
7
6
5
4
3
2
1
0
–1
–2
–3
–4
–5
–6
–7
–8
–9
–10
y
x
continued

UNIT 3 • REASONING WITH EQUATIONSStation Activities Set 2: Solving Systems by Graphing
NAME:
CCSS IP Math I Teacher ResourceU3-144
© Walch Education
3.
–10 –9 –8 –7 –6 –5 –4 –3 –2 –1 1 2 3 4 5 6 7 8 9 10
10
9
8
7
6
5
4
3
2
1
0
–1
–2
–3
–4
–5
–6
–7
–8
–9
–10
y
x
4.
–20 –18 –16 –14 –12 –10 –8 –6 –4 –2 2 4 6 8 10 12 14 16 18 20
20
18
16
14
12
10
8
6
4
2
0
–2
–4
–6
–8
–10
–12
–14
–16
–18
–20
y
x
5. What strategy did you use to match the systems of linear equations with the appropriate graph?
UNIT 4 • DESCRIPTIVE STATISTICSStation Activities Set 1: Displaying and Interpreting Data
Instruction
CCSS IP Math I Teacher Resource© Walch EducationU4-277
2. yes
3. Answers will vary but should be in the form y = mx + b.
4. Answers will vary.
5. 292827262524232221
01 2 3 4 5 6 7 8
BMI
Hours
6. No. There are too many other factors involved (such as activity level and diet). There seems to be a correlation, but we can’t prove causation.
7. Yes; (5, 28) and (7, 28.2)
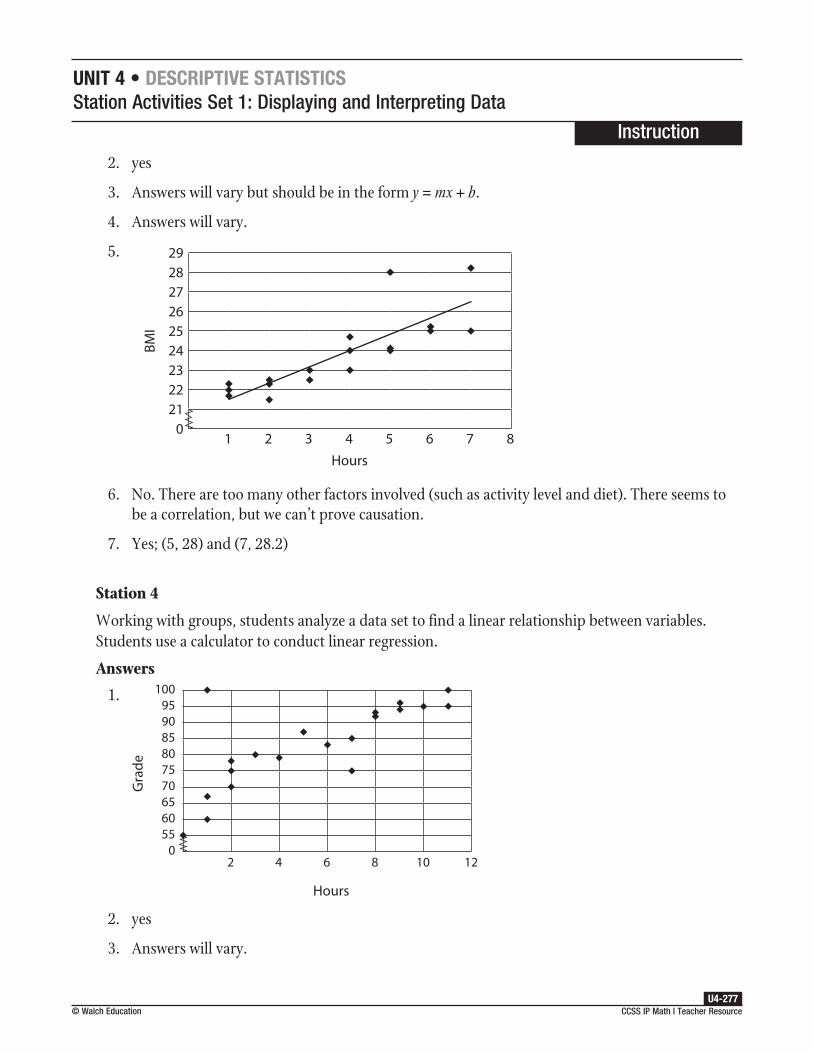
Station 4
Working with groups, students analyze a data set to find a linear relationship between variables. Students use a calculator to conduct linear regression.
Answers
1.
Gra
de
Hours
100959085807570656055
02 4 6 8 10 12
2. yes
3. Answers will vary.
UNIT 4 • DESCRIPTIVE STATISTICSStation Activities Set 1: Displaying and Interpreting Data
Instruction
CCSS IP Math I Teacher ResourceU4-278
© Walch Education
4. (1, 100)
5. y = 2.67x + 68.64
6. Yes. The linear relationship is very close.
7. We can’t prove causation from this data. As the outlier shows, some people may not study because they already know the material well. However, the data suggests that the more time spent studying, the higher the test grade will be.
Materials List/SetupStation 1 graph paper; nine index cards with the following numbers written on them:
52, 49, 69, 44, 88, 80, 68, 49, 90
Station 2 graph paper; ruler
Station 3 calculator; colored pens or pencils; graph paper
Station 4 calculator; colored pens or pencils

UNIT 4 • DESCRIPTIVE STATISTICSStation Activities Set 1: Displaying and Interpreting Data
NAME:
CCSS IP Math I Teacher Resource© Walch EducationU4-289
Station 4Work with your group to answer each question about the data set. Use the calculator to calculate medians and create your graphs.
A class wants to find out if there is a correlation between the number of hours studied and grades on the midterm exam. The 20 students log their hours and their grades, as follows.
Studying (hours) Grade Studying (hours) Grade10 95 2 781 60 2 757 75 8 92
11 100 3 801 100 0 552 70 4 799 94 9 967 85 6 835 87 1 678 93 11 95
1. Enter the numbers into your calculator to graph the results on a scatter plot. Sketch your plot below.
Gra
de
Hours
100959085807570656055
02 4 6 8 10 12
continued

UNIT 4 • DESCRIPTIVE STATISTICSStation Activities Set 2: Line of Best Fit
Instruction
CCSS IP Math I Teacher Resource© Walch EducationU4-291
Goal: To provide opportunities for students to develop concepts and skills related to creating and analyzing scatter plots and lines of best fit to represent a real-world situation
Common Core State Standards
S–ID.6 Represent data on two quantitative variables on a scatter plot, and describe how the variables are related.★
a. Fit a function to the data; use functions fitted to data to solve problems in the context of the data. Use given functions or choose a function suggested by the context. Emphasize linear, quadratic, and exponential models.
b. Informally assess the fit of a function by plotting and analyzing residuals.
c. Fit a linear function for a scatter plot that suggests a linear association.
S–ID.7 Interpret the slope (rate of change) and the intercept (constant term) of a linear model in the context of the data.★
Student Activities Overview and Answer KeyStation 1
Students will be given graph paper and a ruler to help them create a scatter plot. Then they will analyze the scatter plot to determine the correlation between the data and describe the slope.
Answers
1. Graph:
120100
806040
00 2 4 6 8 10
Math Test Score
Hours studied
T
est s
core
(%)
The graph is a scatter plot.
2. The test scores increase as the amount of time she studies for each test increases.
3. Positive correlation; the longer she studied for the test, the higher her test score; positive slope because the line increases from left to right.

UNIT 5 • CONGRUENCE, PROOF, AND CONSTRUCTIONSStation Activities Set 2: Corresponding Parts, Transformations, and Proof
CCSS IP Math I Teacher ResourceU5-399
Instruction
© Walch Education
Answers
1. (–4, 2), (–7, 2), (–7, 7); (–4, –2), (–7, –2); (–7, –7). Yes, because the size and shape remained the same.
2. A and B, because corresponding sides and angles are congruent.
3. Yes, because the size and shape remained the same.
4. They have the same size and shape.
Station 4
Students will be given four index cards with the following written on them: SSS; SAS; ASA; AAS. Students will work together to match the index cards to real-world examples of SSS, SAS, ASA, and AAS. Then they will explain how SSS, SAS, ASA, and AAS relate to congruent triangles.
Answers
1. ASA
2. AAS
3. SSS
4. SAS
5. Answers will vary.
6. side-side-side; side-angle-side; angle-side-angle; angle-angle-side. These are ways to prove two triangles are congruent.
Materials List/SetupStation 1 ruler; protractor
Station 2 graph paper; ruler; push pins; rubber bands
Station 3 graph paper; ruler; cardboard triangle created from a triangle with vertices (4, 4), (10, 4), and (6, 12) in the coordinate plane
Station 4 four index cards with the following written on them: SSS; SAS; ASA; AAS
UNIT 6 • CONNECTING ALGEBRA AND GEOMETRY THROUGH COORDINATESStation Activities Set 1: Parallel Lines, Slopes, and Equations
NAME:
CCSS IP Math I Teacher Resource© Walch EducationU6-105
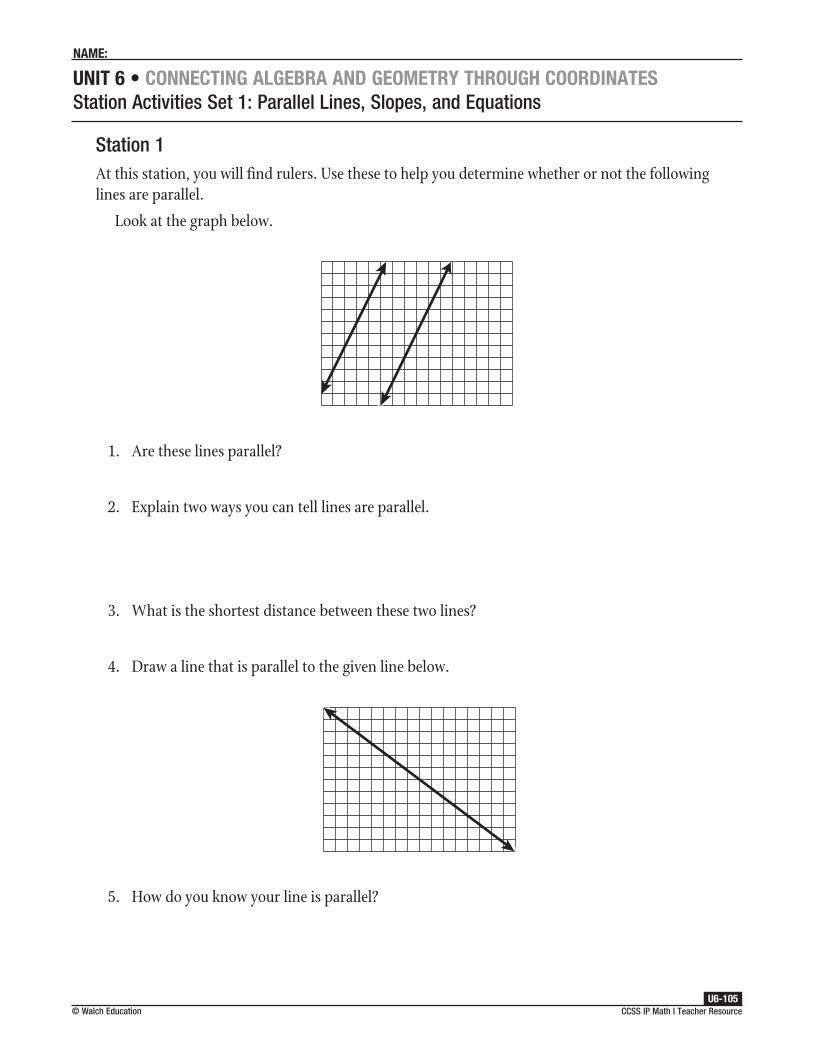
Station 1At this station, you will find rulers. Use these to help you determine whether or not the following lines are parallel.
Look at the graph below.
1. Are these lines parallel?
2. Explain two ways you can tell lines are parallel.
3. What is the shortest distance between these two lines?
4. Draw a line that is parallel to the given line below.
5. How do you know your line is parallel?
Related Documents