This article appeared in a journal published by Elsevier. The attached copy is furnished to the author for internal non-commercial research and education use, including for instruction at the authors institution and sharing with colleagues. Other uses, including reproduction and distribution, or selling or licensing copies, or posting to personal, institutional or third party websites are prohibited. In most cases authors are permitted to post their version of the article (e.g. in Word or Tex form) to their personal website or institutional repository. Authors requiring further information regarding Elsevier’s archiving and manuscript policies are encouraged to visit: http://www.elsevier.com/copyright

Welcome message from author
This document is posted to help you gain knowledge. Please leave a comment to let me know what you think about it! Share it to your friends and learn new things together.
Transcript

This article appeared in a journal published by Elsevier. The attachedcopy is furnished to the author for internal non-commercial researchand education use, including for instruction at the authors institution
and sharing with colleagues.
Other uses, including reproduction and distribution, or selling orlicensing copies, or posting to personal, institutional or third party
websites are prohibited.
In most cases authors are permitted to post their version of thearticle (e.g. in Word or Tex form) to their personal website orinstitutional repository. Authors requiring further information
regarding Elsevier’s archiving and manuscript policies areencouraged to visit:
http://www.elsevier.com/copyright
Author's personal copy
Seasonality of 137Cs in roe deer from Austria and Germany
U. Fielitz a, E. Klemt b, F. Strebl c, F. Tataruch d, G. Zibold b,*
a Environmental Studies, Thomasberg 33, D-37115 Duderstadt, Germanyb Hochschule Ravensburg-Weingarten, University of Applied Sciences, Doggenried Str., D-88250 Weingarten, Germanyc Div. Radiation Safety and Applications, Austrian Research Centers GmbH – ARC, A-2444 Seibersdorf, Austriad Research Institute of Wildlife Ecology, University of Veterinary Medicine Vienna, Savoyenstr. 1, A-1160 Wien, Austria
a r t i c l e i n f o
Article history:Received 26 April 2007Received in revised form14 September 2008Accepted 15 December 2008Available online 21 January 2009
Keywords:RadiocaesiumRoe deerMushroomChernobylModellingSeasonality
a b s t r a c t
Empirical data on the 137Cs activity concentration in meat of roe deer (Capreolus capreolus) roaming in 3spruce forest areas and one peat bog area are presented and compared. They cover time series of nearly20 years after a spike contamination in 1986 originating from Chernobyl. A model is presented whichconsiders three soil compartments to describe the change of the availability of 137Cs with time.The time-dependency of the 137Cs activity concentration in meat of roe deer is a combination of twocomponents: (1) an exponential decay and (2) a peak in the second half of each year during themushroom season. The exponential decay over the years can be described by a sum of two exponentialfunctions. The additional transfer of 137Cs into roe deer during the mushroom season depends onprecipitation. On the peat bog the 137Cs activity concentration in roe deer is higher and more persistentthan in spruce forest.
� 2008 Elsevier Ltd. All rights reserved.
1. Introduction
The contamination of the meat of roe deer (Capreolus capreolus)with 137Cs and its seasonality has been reported by several authorsrecently (Avila et al., 1999; Fielitz, 2005; Strebl and Tataruch, 2007;Zibold et al., 2001, 2005). Relevant characteristics of roe deerbiology and some general information on size and use of habitat aregiven in these publications and references therein. In Germanyadult roe deer are quite sedentary, with home range sizes scarcelyover a couple of hundred hectares (Ellenberg, 1978). Their dietvaries with the seasons and includes leaves of deciduous trees andshrubs, buds, herbs, ferns, heather, grasses and fungal fruitbodies(Cederlund et al., 1980). The idea of the present publication is togive an overview of the existing data sets for complete time seriesavailable and to compare the different sites. In addition to modelthe seasonality of 137Cs contamination in roe deer and interpret thesite-specific differences with respect to the following parameters:ecosystem, e.g. spruce forest versus peat bog, different fixationrates of 137Cs in the soils and, therefore, different ecological half-lives for the sites, and influence of precipitation on mushroom
growth and roe deer contamination. The same dynamic model isused for the 4 data sets presented. Characteristic features of theareas studied are given in Table 1.
2. Materials and methods
2.1. Study area
2.1.1. Weinsberger Forest, AustriaThe investigation area Weinsberger Forest extends to 6500 ha. The typical highland
landscape encompasses altitudes between 700 m and 1041 m. It is situated north of theriver Danube, in the south-western part of Waldviertel which belongs to the CrystallineBohemian Massif (e.g. Gutenbrunn, 48� 220 N, 15� 070 E, WGS 84; altitude 868 m).
2.1.1.1. Geology and soils. The geological underground consists of WeinsbergerGranite, and partly gneiss. The investigation area is dominated by loamy brown-earth soils (Dystric cambisol). The high permeability and the cool-humid climatefavour podsolization; therefore, all stages from brown-earth and podsolic brown-earth to semipodsols can be found. The soils are carbonate-free, soil reaction is acidicto very acidic. In valleys due to slope-parallel waterflow one can find gley-podsols,and peaty soils as well as holo-organic sphagnum soils. Mean values of soilparameters in B-horizons of forest soils: pH (CaCl2): 3.8; texture (sand:silt:clay in %):41:34:25; Corg (%): 6.3; CEC (meq/kg): 205 (Strebl et al., 1999).
2.1.1.2. Hydrology. On average 100 days a year the Weinsberger Forest is covered bysnow. The long-term annual mean of precipitation amounts to 914 mm.
The hydrologic situation of the area especially the groundwater level is notuniform, depending on the thickness of the sand and gravel layers. This leads toa high infiltration velocity of precipitation (locally more than 30 mm per hour).During dry periods the water content of A and B soil horizons can decrease to less
* Corresponding author. Tel.: þ49 751 94011; fax: þ49 751 501 9876.E-mail addresses: [email protected] (U. Fielitz), klemt@hs-wein-
garten.de (E. Klemt), [email protected] (F. Strebl), [email protected] (F. Tataruch), [email protected] (G. Zibold).
Contents lists available at ScienceDirect
Journal of Environmental Radioactivity
journal homepage: www.elsevier .com/locate/ jenvrad
0265-931X/$ – see front matter � 2008 Elsevier Ltd. All rights reserved.doi:10.1016/j.jenvrad.2008.12.005
Journal of Environmental Radioactivity 100 (2009) 241–249
Author's personal copy
than 20%. On hill-foots wet areas with high groundwater level between 0.3 and0.8 m are found.
2.1.1.3. Vegetation. The climax vegetation has developed as mixed forest (spruce–beech–fir). Due to timber production the actual vegetation is dominated by spruce.The species composition of the understorey is dependent on the small scale (positionon the slope of hills) hydrologic and light conditions. The most abundant understoreyspecies are (137Cs median values from 1996). Vaccinium myrtillus (leaves, n¼17: 900 Bqkg�1 F.M.), Oxalis acetosella (n¼7: 200 Bq kg�1 F.M.), Calamogrostis sp.,(n¼8: 350 Bqkg�1 F.M.), Dryopteris dilatata, (n¼17: 5000 Bq kg�1 F.M.), Polytrichum sp. (n¼8: 900 Bqkg�1 F.M.) and other mosses (F.M. derived from Strebl et al. 1999).
In meadow sites within the forest the most abundant species, besides grasses,are: Alchemilla vulgaris (n¼6: 120 Bq kg�1 F.M.), Trifolium sp., (n¼6: 100 Bq kg�1
F.M.), Rumex sp. and Ranunculus acris (n¼6: 40 Bq kg�1 F.M.) (F.M. derived from datain Belli, 2000).
Radiocaesium content of mushrooms is very variable, e.g. in 1993 Xerocomusbadius contained 3700 Bq kg�1 F.M. median, n ¼ 5 (Strebl et al., 2000).
2.1.2. Bodenmais, GermanyThe study area is a mountain forest ecosystem in South-East Bavaria, near the
small tourist village Bodenmais (49� 040 N, 13� 060 , WGS 84; altitude 654 m).
2.1.2.1. Geology and soils. The soil is a podsolic Braun earth soil with a 4 cm thickhumus layer. The pH (CaCl2) is 3.4, and the CEC is 144 meq/kg in the upper 0–5 cmmineral soil layer (Fielitz, 2001).
2.1.2.2. Hydrology. The mean annual precipitation is about 1200 mm, the meanannual temperature is 5 �C. In winter the snow often is deeper than 1 m.
2.1.2.3. Vegetation. The dominating trees are Norway spruce (Picea abies) and beech(Fagus sylvatica). The ground vegetation is sparse and the main species areV. myrtillus, Dryopteris carthusiana, Athyrium felix-femina, Rubus fruticosus andPolytrichum sp. Since 1988, within the scope of several research projects, in about10 000 samples of soil, plants, fungal fruitbodies and game from the forestecosystems, the 137Cs activity concentration had been measured, in order to inves-tigate the dynamics of this nuclide (Fielitz, 1994, 2001). Unfavourable locationconditions cause a relative high transfer of 137Cs into plants and game. All soil andplant samples are taken exclusively from 100 � 100 m2 permanent study plots. Allexamined plant types showed a pronounced decrease of the 137Cs activity from 1987until 2004. The deceleration of the decrease, which can be observed since 1995 formost plant types, continues. The mean 137Cs activity of many plant types is below1000 Bq kg�1 in the fresh mass (FM). Only few plant types, such as the spinulosewoodfern (D. carthusiana) and bilberry (V. myrtillus), showed higher activities. Thecontamination of above ground fungal fruitbodies varies from 24 Bq kg�1 FM(Macrolepiota procera) to 2800 Bq kg�1 FM (X. badius). In 2005, with an average of26 800 Bq kg�1 (FM) the contamination of deer truffles (Elaphomyces granulatus) ismore than an order of magnitude greater than the contamination of all otherpotential food types of the considered roe deer (Fielitz, 2005).
2.1.3. Ochsenhausen, GermanyThe study area is located north of Lake Constance in the south of Germany and is
characterized in detail in Zibold et al. (2001).State forest district Ochsenhausen (48� 040 N, 09� 570 E, WGS 84; altitude 577 m),
situated near the city of Biberach, comprises 16 km2 of forest populated by about600 roe deer. Since 1987 about 200 roe deer are shot per year, and more than 50% ofthose are younger than 1 year. The dominant tree of the region is spruce, P. abies,with a fraction of about 80%. The mean tree age is about 100 years.
2.1.3.1. Geology and soils. The main type of soil is Stagnosol, and Luvisol belongingto the soil family mottled loam. The geology of the bedrock is mainly moraine. At
a typical site the humus deposit has a thickness of 5.5 cm and is of mor type. Thegrain size distribution is (17–30) % clay, (40–50) % silt, and (0–33) % of sand. The pHvalue of Of, Oh, and Ah ranges between 2.9 and 2.5 (CaCl2 method).
2.1.3.2. Hydrology. At weather station Bad Schussenried, situated about half-waybetween Pfrunger Ried and Ochsenhausen, the following average values for theyears 1980–2005 were recorded: maximum temperature: 17.8 �C in July, minimumtemperature: �1.1 �C in January, maximum precipitation: 116 mm in July, minimumprecipitation: 49 mm in February, and a mean precipitation of 916 mm per year. Theannual precipitation varies locally between 700 and 1400 mm.
2.1.3.3. Vegetation. The time-dependency of the aggregated transfer factor Tag
soil-plant has been studied for the prevailing plant species in the neighbourhood ofareas mentioned and results were published (Klemt et al., 1999; Prohl et al., 2006)showing, that since 1992 for the grazing plant spinulose woodfern, D. carthusiana,and other plants ecological half-lives between 2 and 11 years were observed. Smallercontamination values and a longer ecological half-life are measured in mixed forestas compared to spruce forest (Drissner et al., 1998).
Geometric means of aggregated transfer factor of samples of X. badius fromOchsenhausen and surrounding forests as measured for each year after 1987–2002decrease with an ecological half-life of about 4 years (Prohl et al., 2006). Since 1987in about 1058 samples of various fungi species from Ochsenhausen, Pfrunger Ried,and surrounding forests the 137Cs activity concentration has been determined,prevailing species determined and those with highest contaminations are Lactarius,Paxillus involutus, and X. badius. The contamination of these fungi is decreasing withan ecological half-life of 9.3 � 1.4 years, Klemt and Zibold (2005).
2.1.4. Pfrunger Ried, GermanyThe study area is located north of Lake Constance in the south of Germany and is
characterized in more detail in Zibold et al. (2001). Pfrunger Ried (47� 540 N, 09� 230
E, WGS 84; altitude 610 m) situated about 45 km south west of Ochsenhausen isa peat bog of about 5.2 km2 populated by about 200 roe deer.
2.1.4.1. Geology and soils. Pfrunger Ried comprises about 1.3 km2 of high moordominated by pine, Pinus mugo, enclosing about 0.3 km2 of low and intermediatemoor. The high moor is surrounded by boggy forest (about 3.6 km2), lakes (1 km2)and agricultural land (20 km2). The geology of the bedrock is mainly moraine.
2.2. Model to describe the time-dependency of the roe deer 137Cs activityconcentrations
First order processes, where the change of a compartment with time isproportional to the contents of the model compartments, lead to a set of first ordercommon differential equations for the compartments. The equations were imple-mented in Model Maker (AP Benson Ltd., UK).
The main idea of our model is the following: the time-dependency of our data(Figs. 3–6) is interpreted as a sum of two exponential functions. This means thatthree different soil compartments are necessary in order to describe the time-dependency of the roe deer activity concentration with different time constants forfixation and redissolution processes between two different soil compartments[soil 1] and [soil 2] and final fixation in a third compartment [soil 3] includingmigration out of the rooting zone. The sum of the three soil compartments repre-sents the total inventory in the soil.
In Fig. 1 the outline of the model is shown. The compartments [soil 1], [soil 2],[soil 3], and [deer] contain the average activity of the whole forest soil and theactivity of the whole roe deer population, respectively, in Bq. The activity concen-tration of roe deer in Bq kg�1 is obtained by dividing the compartment [deer] by thenumber of roe deer in the forest and by the average weight of the roe deer as given inTable 1. In the model, hunting of roe deer (about one third of the population peryear) is assumed to lead to negligible loss of activity from the forest ecosystem.
Table 1Characteristic data of the forest districts studied as given by the local forest authorities.
Forest district Bodenmais,Germany
Weinsberger Forest,Austria
Ochsenhausen,Germany
Pfrunger Ried,Germany
Population of roe deeruncertainty 10%
2200 1900 600 200
Forest area in km2 75 65 16 5137Cs soil inventory at 1.05.86 in kBq/m2
(geo mean and range)47 � 57% (n ¼ 59) 52.2 � 27% (n ¼ 218) 39 � 79% (n ¼ 18) 21 � 5% (n ¼ 4)
Annual bag; uncertainty z 10% 80 <177 200 60Mean live-mass of roe deer (kg) 18 18 17 17Hunting season male 1.05–15.10 1.06–15.10 15.05–15.10
1 year old male – 1.05–15.10 –Female 1.09–15.01 16.08–31.12 1.09–31.011 year old female 1.09–15.01 May and 16.08–31.12 1.09–28.02
U. Fielitz et al. / Journal of Environmental Radioactivity 100 (2009) 241–249242

Author's personal copy
To optimize the model the only data used are the roe dear activity concentrationdata and average inventory which is assigned initially to compartment [soil 1] plusprecipitation data.
In order to achieve an analytical solution the model is reduced to the soilcompartments because they contain the relevant activity outside the mushroomseason. In this approximation, the roe deer activity concentration is proportional tocompartment [soil 1]. This reduction allows to determine ecological decay constantsleco1 and leco2 which describe the time-dependence of the activity in soil and in roedeer.
After the fallout of the Chernobyl accident 137Cs was deposited into [soil 1] fromwhere it was available for the uptake via plants into [deer] with the rate r1. Initially,about 68% of the total inventory was deposited on the canopy surface, and 32% onthe litter surface and this radiocaesium reached the soil mainly within one year byweathering processes (Bachhuber et al., 1982). For simplification it is assumed thatall radiocaesium was deposited directly in compartment [soil 1]. From [soil 1] it canbe reversibly fixed with the rate r3 into [soil 2]. There, it is still available formushrooms due to their fine structured mycelium and enzyme exudates. Moreover,there exist litter-decomposing fungi which degrade dead organic material, espe-cially lignin (Olsen et al., 1990). Furthermore, from [soil 1] radiocaesium can bestrongly fixed or transported out of the rooting zone with rate r5 into [soil 3] so thatit is not available anymore. r2 and r4 are the corresponding excretion and redis-solution rates.
Peaks in the roe deer activity concentration in fall are probably due to theconsumption of mushroom and the impact of other factors, like the increase of foodintake and the consumption of ferns.
The variability of these peaks throughout the years is large, but there is anoverall decrease in the height of these peaks which is not as fast as the decrease ofactivity concentration in the rest of the year. Therefore, it is assumed that mush-rooms have access to a larger portion of the total soil activity than green plants.
Thus, the model consists of the following set of differential equations:
d½deer�dt
¼ ðr1 þ r6Þ$½soil 1� þ r6$½soil 2� þ��r2 � lphys
�$½deer�
d½soil 1�dt
¼�� r1 � r3 � r5 � r6 � lphys
�$½soil 1� þ r4$½soil 2� þ r2$½deer�
d½soil 2�dt
¼ r3$½soil 1� þ�� r4 � r6 � lphys
�$½soil 2�
d½soil 3�dt
¼ r5$½soil 1� � lphys$½soil 3�
where lphys is the physical decay constant of 137Cs.The parameter ‘‘Precipitation’’ (see Fig. 1) is the sum of the precipitation of July,
August and September of the respective years in mm, in the case of the forest districtOchsenhausen. Data on precipitation in the area of the forest district Ochsenhausenwere obtained as reported by Zibold et al. (2001) from Deutscher Wetterdienst andWetterwarte Bad Schussenried. For the other forest districts the parameter‘‘Precipitation’’ is the mean of the precipitation values of July, August and Septemberof the site averaged over the time span considered.
The favorable influence of precipitation during the summer period on mush-room yield is reported by Krieglsteiner (1977). For a certain mushroom season eachyear the additional rate r6 which transfers 137Cs from [soil 1] and [soil 2] through theunknown mushroom compartment into [deer] is assumed to be equal to a param-eter A times the amount of precipitation:
r6 ¼ A$Precipitation
‘‘A’’ is a free parameter, which is optimized; precipitation values are taken for eachforest district. The mushroom compartment itself is conceptual and does not appear
in the calculation. Earlier, Zibold et al. (2001) estimated that up to 50% of the 137Cs inthe soil is accumulated in the mycelia and fruitbodies of fungal fruitbodies whichmeans in the mushroom compartment.
Due to the lack of sufficient data only one common length of the mushroomseason is optimized for each forest, but the position of this ‘‘period’’ of time withinthe year is optimized separately for each year if enough data are available. Outside ofthis period r6 is equal to 0. Within this mushroom season r1 is assumed to be reducedby 30% because green plant grazing is replaced by mushroom grazing. Actually, in114 rumens of roe deer an average fraction of fungi of 3.3% was found for the periodJune to December, and a maximum of 15% for October (Fielitz, 1997). In some indi-vidual roe deer, Cederlund et al. (1980) found the fraction of fungi in the rumen to beup to 76% of the total content. As a rough approximation of the replacement ofquantities of green plants by mushrooms as reported by these authors it is assumedthat a reduction by 30 % of the rate of activity transfer r1 is justified.
To solve the model the measured soil activity (decay corrected for May 1st, 1986)is taken as the initial condition for [soil 1]. The initial content of all the othercompartments is zero. The rates r1;.; r5 and (for the determination of r6) theparameters A, ‘‘period’’, and the positions of the period within each year are opti-mized in a common least squares fit. In this way the model should describe theaverage activity concentration of roe deer in dependence of time.
It can be assumed that also the rates ri are averages of distributed values, e.g. r1
represents the uptake of radiocaesium from the soil by grazing different plants. Inthis way probabilities are multiplied and a log-normal distribution of the roe deeractivity is reasonable.
The system of differential equations can be simplified in order to get ananalytical solution if it is assumed that 137Cs in the forest ecosystem is mainly foundin the soil and that the roe deer activity concentration outside of the mushroomseason is in equilibrium via the plants grazed by roe deer with the compartment[soil 1]:
d½soil 1�dt
¼ ð�r3 � r5Þ$½soil 1� þ r4$½soil 2�
d½soil 2�dt
¼ r3$½soil 1� þ ð�r4Þ$½soil 2�
Now, these two differential equations focus on the main transport- andtransfer processes and, in order to calculate ecological and not effective decayconstants also the radioactive decay is taken out. Thus, the compartments inthese differential equations are now decay corrected. For this simplified systemof linear differential equations of 1st order with constant coefficients the char-acteristic equations give exponential functions with the ecological decayconstants leco1,2 as particular solutions of the characteristic equations (Bronsteinet al., 2005):
leco1;2 ¼ 1=2$
�� ðr3 þ r4 þ r5Þ �
ffiffiffiffiffiffiffiffiffiffiffiffiffiffiffiffiffiffiffiffiffiffiffiffiffiffiffiffiffiffiffiffiffiffiffiffiffiffiffiffiffiffiffiffiffiffiðr3 þ r4 þ r5Þ2�4r4r5
q �(1)
In this way neglecting the mushroom peak in autumn, the ecological decayconstants leco1 and leco2 determined from the optimized rates r3, r4, and r5 describethe time-dependency of the compartment [soil 1] as well as that of the compart-ment [deer] which is in this approximation proportional to the compartment[soil 1]:
½deer�f½soil 1� ¼ a1$exp���
leco1 þ lphys
�$t�þ a2$exp
���
leco2 þ lphys
�$t�
(2)
This sum of two exponential functions can be interpreted as the time-depen-dency of our data (Figs. 3–6), and for the aggregated transfer factor Tag soil–roe deerwhere lphys cancels as plotted in Fig. 7.
The amplitudes a1 and a2 could be determined by a system of linear equationscontaining the rates ri and the decay constants lecoi and the initial conditions. Anumerical method is chosen by fitting Eq. (2) to the empirical Tag values for themonths January–June with (a1, a2) as free parameters which are optimized usingnon-weighted least squares fits. The result is shown in Fig. 7.
In this way a1 and a2 as well as leco1 and leco2 are determined independently ofthe Tag-maxima in autumn.
2.3. Statistical analysis
To describe the time-dependency of and to demonstrate seasonal variations ofthe roe deer contamination 14 days running geometric means are calculated bytaking at each date of shooting the geometric mean of all samples shot 7 days beforeand after this date. In this way the variance of data, which is largest during the fungiseason, is reduced.
The compartment models are solved with the software package Model Maker(AP Benson Ltd., UK) using the 4th order Runge–Kutta algorithm. For optimizing anordinary least squares fit is used. To assess the goodness of fit of our model we use R2
is used, the fraction of the total variation explained by the model. In case of half-years geometric mean values 68% confidence limits are used. The variability of singlevalues can be more than 100% of the geometric mean value in case of peak valuesduring the fungi season.
soil 2 soil 1 soil 3
deerPrecipitation
Mushroom
r1
r2r5r4r3
r6
Fig. 1. Scheme of the forest model describing the 137Cs activity concentration of roedeer.
U. Fielitz et al. / Journal of Environmental Radioactivity 100 (2009) 241–249 243

Author's personal copy
3. Results and discussion
3.1. Time series of the single values of 137Cs activity concentration ofroe deer meat
Fig. 2 gives an overview of empirical single values of the 137Csactivity concentration of roe deer and fungal fruitbodies. In Fig. 2 isshown that the activity concentration values are highest in roedeer from Bodenmais and lowest for those from Ochsenhausenand Pfrunger Ried. From the different magnitudes of the 137Csinventories of the respective forest soils given in Table 1 roe deerfrom Weinsberger Forest should be most contaminated, which isactually not the case. The general trend is similar for all sitesstudied: an increase after the spike contamination in 1986 and
a seasonal peak in autumn every year. The activity concentration ofroe deer meat is substantially higher in autumn than in spring andsummer. This seasonal peak correlates in time with the mushroomseason in autumn, as can be seen in Fig. 2 in the upmost graph ofthe 137Cs activity concentration of fungal fruitbodies collected inthe districts Ochsenhausen and Pfrunger Ried and in neighbouringforests. This sudden increase in the activity of roe deer in autumnmust have to do with a change in diet. It can be due to theconsumption of fungal fruitbodies and an increased intake of fernduring this period.
The quantity of food intake may play an important role. Roe deerfood consumption is not uniform over the year, but lowest inwinter, increasing in spring and becoming maximal in autumn,parallel to the maximum of the 137Cs activity burden.
The intake of fern is also very important. At the Bodenmaisforest in autumn, roe deer preferentially select the fern species A.felix-femina and D. carthusiana in addition to fungal fruitbodies(Fielitz and Albers, 1996). In all investigation sites D. carthusiana isthe autotrophic plant with highest 137Cs activities. Stomachcontent analyses (n ¼ 114) of roe deer from Bodenmais delivermean values of 19.8% fern and 15.4% fungal fruitbodies in October(relative volume percent) (Fielitz, 1997). Because roe deer feedsfresh plants, the 137Cs activity of the fresh nutrition has to beconsidered. Based on fresh weight, the 137Cs activity concentrationof D. carthusiana is nearly similar to that of the higher contami-nated fungal fruitbodies like X. badius. That is why fernconsumption delivers a significant 137Cs input into roe deer meat inautumn.
3.2. Modelling of the 137Cs activity concentration of roe deer meat
Results using the dynamic model described in Fig. 1 are given inFigs. 3–6 for the four forest districts considered. The parameter‘‘precipitation’’ is the mean precipitation values of July, August andSeptember of the site averaged over the time span considered, onlyin the case of Ochsenhausen it contains the mean precipitation ofJuly, August and September separately for each year. For the peatbog district Pfrunger Ried compartment [soil 2] is not of impor-tance, because the rate r3 is negligible (Table 2), which indicatesthat radiocaesium in the soil is available for mushroom and greenplants in a similar way.
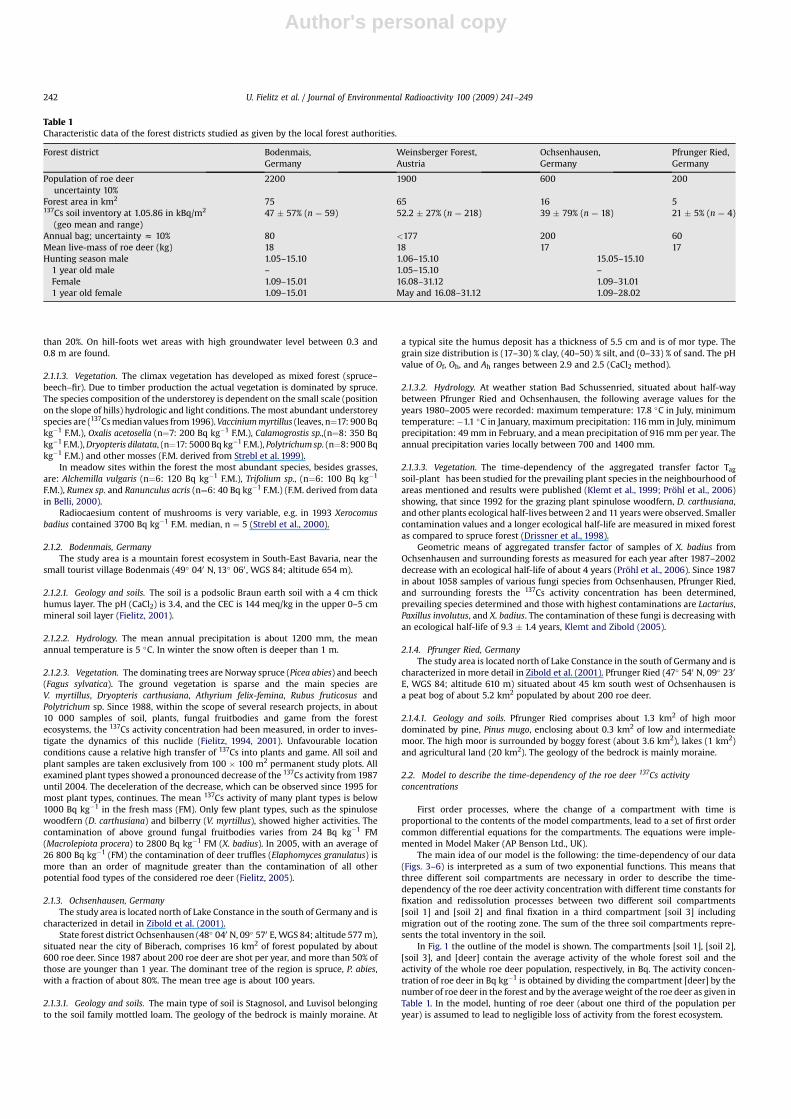
In Fig. 3 data points (n ¼ 1748) are 14 days geometric meanvalues (see Section 2.3) of our empirical data from Bodenmais. Thefraction of the total variation of data explained by the model isR2 ¼ 0.68 as given in Table 2. For the fitting procedure non-weighted least squares is used.
For Weinsberger Forest (Fig. 4) the number of data points(14 days geometric mean values, n ¼ 790) is smaller than forBodenmais and the variability of data points during some years isonly poorly described by the model. Due to the uneven distri-bution of data over the years the fit, where all rates are opti-mized, is unsatisfactory. Therefore rate r6 is taken as an average ofthe respective fit values from Bodenmais and Ochsenhausen.Then the total variation of data explained by the model isR2 ¼ 0.32.
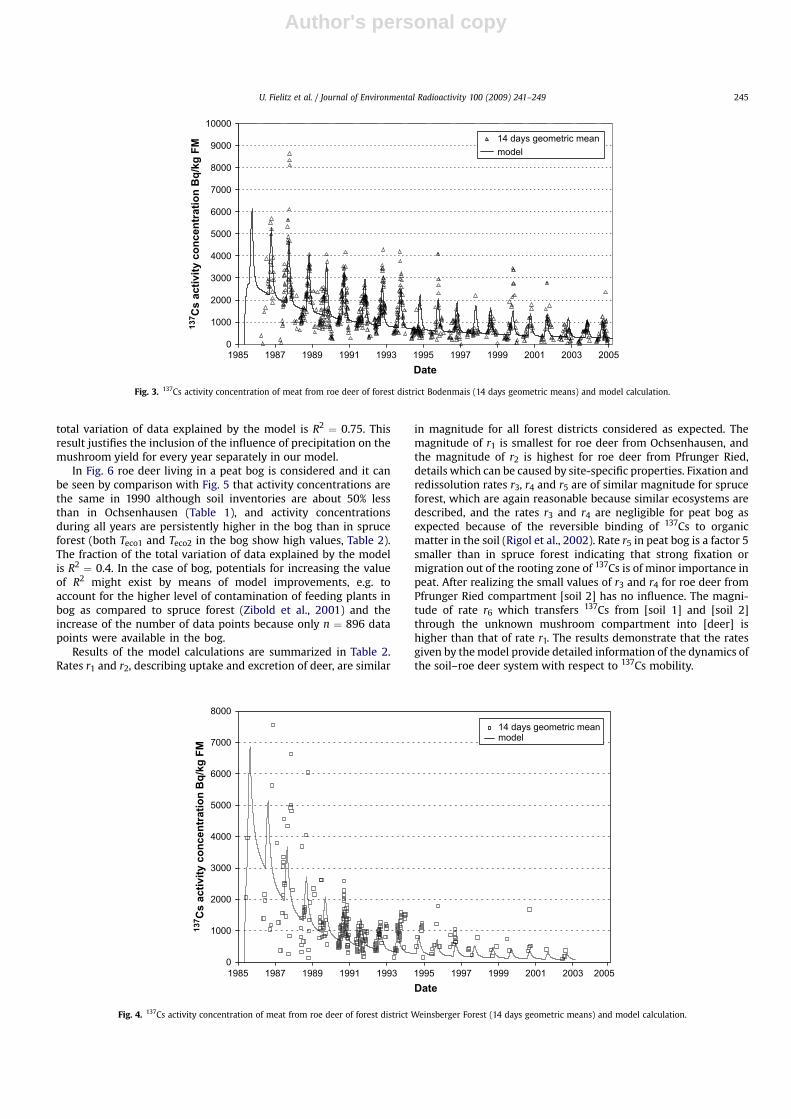
For roe deer from Ochsenhausen (Fig. 5) the fraction of the totalvariation of data explained by the model is R2¼ 0.80. One reason forthis agreement is the large number n ¼ 4038 of data points whichprovides a representative statistical sample. In contrast to Figs. 3and 4 precipitation during July, August and September and itsinfluence on the mushroom yield is taken into account in the modelfor every year separately. If the influence of precipitation on themushroom yield in Ochsenhausen is included by taking the meanprecipitation values of July, August and September of the siteaveraged over the time span considered, then the fraction of the
0
2000
4000
6000
8000
10000
1986 1990 1994 1998 2002 2006Date
Roe deer Weinsberger Forest, n = 790
0
2000
4000
6000
8000
10000
12000Roe deer Bodenmais, n = 1748
0
2000
4000
6000Roe deer Ochsenhausen, n = 4038
0
2000
4000
6000Roe deer Pfrunger Ried, n = 957
0
4000
8000
12000
16000
20000
24000
Mushrooms, n = 1058
137C
s activity co
ncen
tratio
n B
q/kg
F
M
Fig. 2. Time-dependency of the empirical 137Cs activity concentration of roe deer meatfrom spruce forest: Weinsberger Forest (,); Bodenmais (6); Ochsenhausen (B);Pfrunger Ried (>). For comparison the 137Cs activity concentration of fungal fruit-bodies (all species available) from Ochsenhausen, Pfrunger Ried and neighbouringforests is shown (�).
U. Fielitz et al. / Journal of Environmental Radioactivity 100 (2009) 241–249244
Author's personal copy
total variation of data explained by the model is R2 ¼ 0.75. Thisresult justifies the inclusion of the influence of precipitation on themushroom yield for every year separately in our model.
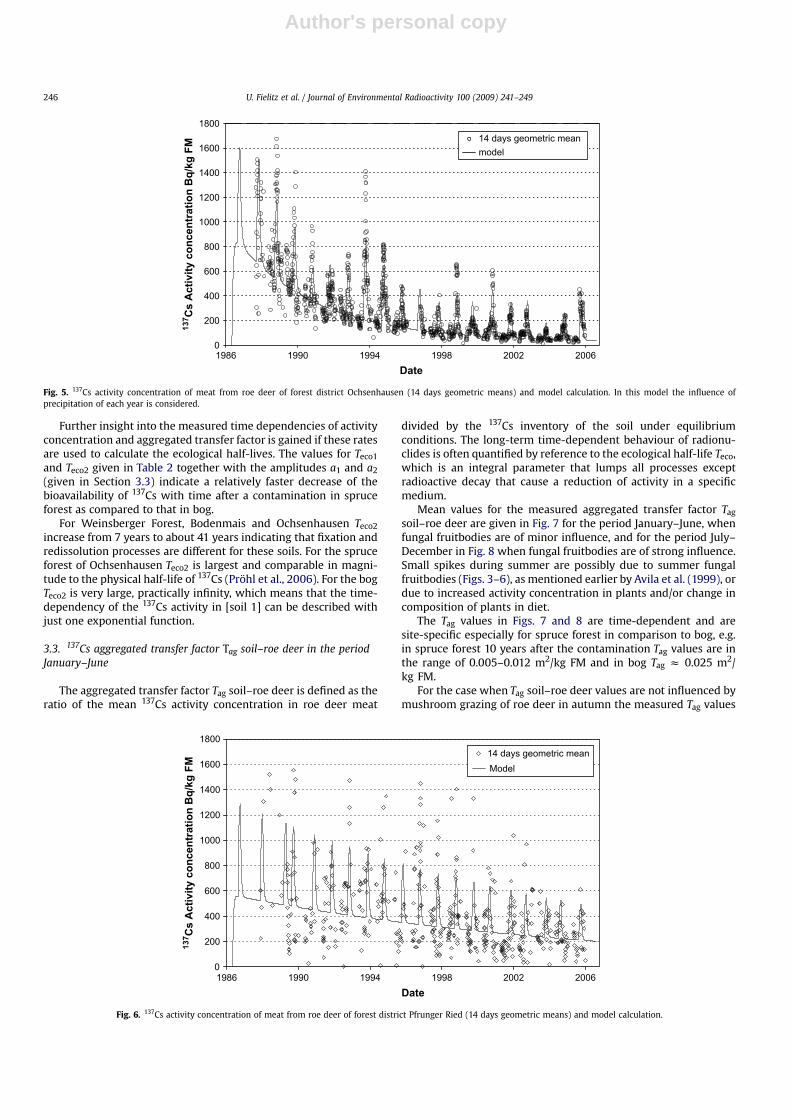
In Fig. 6 roe deer living in a peat bog is considered and it canbe seen by comparison with Fig. 5 that activity concentrations arethe same in 1990 although soil inventories are about 50% lessthan in Ochsenhausen (Table 1), and activity concentrationsduring all years are persistently higher in the bog than in spruceforest (both Teco1 and Teco2 in the bog show high values, Table 2).The fraction of the total variation of data explained by the modelis R2 ¼ 0.4. In the case of bog, potentials for increasing the valueof R2 might exist by means of model improvements, e.g. toaccount for the higher level of contamination of feeding plants inbog as compared to spruce forest (Zibold et al., 2001) and theincrease of the number of data points because only n ¼ 896 datapoints were available in the bog.
Results of the model calculations are summarized in Table 2.Rates r1 and r2, describing uptake and excretion of deer, are similar
in magnitude for all forest districts considered as expected. Themagnitude of r1 is smallest for roe deer from Ochsenhausen, andthe magnitude of r2 is highest for roe deer from Pfrunger Ried,details which can be caused by site-specific properties. Fixation andredissolution rates r3, r4 and r5 are of similar magnitude for spruceforest, which are again reasonable because similar ecosystems aredescribed, and the rates r3 and r4 are negligible for peat bog asexpected because of the reversible binding of 137Cs to organicmatter in the soil (Rigol et al., 2002). Rate r5 in peat bog is a factor 5smaller than in spruce forest indicating that strong fixation ormigration out of the rooting zone of 137Cs is of minor importance inpeat. After realizing the small values of r3 and r4 for roe deer fromPfrunger Ried compartment [soil 2] has no influence. The magni-tude of rate r6 which transfers 137Cs from [soil 1] and [soil 2]through the unknown mushroom compartment into [deer] ishigher than that of rate r1. The results demonstrate that the ratesgiven by the model provide detailed information of the dynamics ofthe soil–roe deer system with respect to 137Cs mobility.
0
1000
2000
3000
4000
5000
6000
7000
8000
9000
10000
1985 1987 1989 1991 1993 1995 1997 1999 2001 2003 2005Date
137C
s activity co
ncen
tratio
n B
q/kg
F
M
14 days geometric meanmodel
Fig. 3. 137Cs activity concentration of meat from roe deer of forest district Bodenmais (14 days geometric means) and model calculation.
0
1000
2000
3000
4000
5000
6000
7000
8000
1985 1987 1989 1991 1993 1995 1997 1999 2001 2003 2005Date
13
7C
s activity co
ncen
tratio
n B
q/kg
F
M
14 days geometric meanmodel
Fig. 4. 137Cs activity concentration of meat from roe deer of forest district Weinsberger Forest (14 days geometric means) and model calculation.
U. Fielitz et al. / Journal of Environmental Radioactivity 100 (2009) 241–249 245
Author's personal copy
Further insight into the measured time dependencies of activityconcentration and aggregated transfer factor is gained if these ratesare used to calculate the ecological half-lives. The values for Teco1
and Teco2 given in Table 2 together with the amplitudes a1 and a2
(given in Section 3.3) indicate a relatively faster decrease of thebioavailability of 137Cs with time after a contamination in spruceforest as compared to that in bog.
For Weinsberger Forest, Bodenmais and Ochsenhausen Teco2
increase from 7 years to about 41 years indicating that fixation andredissolution processes are different for these soils. For the spruceforest of Ochsenhausen Teco2 is largest and comparable in magni-tude to the physical half-life of 137Cs (Prohl et al., 2006). For the bogTeco2 is very large, practically infinity, which means that the time-dependency of the 137Cs activity in [soil 1] can be described withjust one exponential function.
3.3. 137Cs aggregated transfer factor Tag soil–roe deer in the periodJanuary–June
The aggregated transfer factor Tag soil–roe deer is defined as theratio of the mean 137Cs activity concentration in roe deer meat
divided by the 137Cs inventory of the soil under equilibriumconditions. The long-term time-dependent behaviour of radionu-clides is often quantified by reference to the ecological half-life Teco,which is an integral parameter that lumps all processes exceptradioactive decay that cause a reduction of activity in a specificmedium.
Mean values for the measured aggregated transfer factor Tag
soil–roe deer are given in Fig. 7 for the period January–June, whenfungal fruitbodies are of minor influence, and for the period July–December in Fig. 8 when fungal fruitbodies are of strong influence.Small spikes during summer are possibly due to summer fungalfruitbodies (Figs. 3–6), as mentioned earlier by Avila et al. (1999), ordue to increased activity concentration in plants and/or change incomposition of plants in diet.
The Tag values in Figs. 7 and 8 are time-dependent and aresite-specific especially for spruce forest in comparison to bog, e.g.in spruce forest 10 years after the contamination Tag values are inthe range of 0.005–0.012 m2/kg FM and in bog Tag z 0.025 m2/kg FM.
For the case when Tag soil–roe deer values are not influenced bymushroom grazing of roe deer in autumn the measured Tag values
0
200
400
600
800
1000
1200
1400
1600
1800
1986 1990 1994 1998 2002 2006Date
137C
s A
ctivity co
ncen
tratio
n B
q/kg
F
M
14 days geometric meanmodel
Fig. 5. 137Cs activity concentration of meat from roe deer of forest district Ochsenhausen (14 days geometric means) and model calculation. In this model the influence ofprecipitation of each year is considered.
0
200
400
600
800
1000
1200
1400
1600
1800
1986 1990 1994 1998 2002 2006Date
137C
s A
ctivity co
ncen
tratio
n B
q/kg
F
M
14 days geometric meanModel
Fig. 6. 137Cs activity concentration of meat from roe deer of forest district Pfrunger Ried (14 days geometric means) and model calculation.
U. Fielitz et al. / Journal of Environmental Radioactivity 100 (2009) 241–249246

Author's personal copy
are plotted together with their uncertainties in Fig. 7 and graphs ofthe sum of 2 exponential functions as given by Eq. (2) in Section 2.2for the case where the physical half-live is not involved as it cancelsin the expression of Tag soil–roe deer. The values of the ecologicalhalf-lives Teco1 and Teco2 are taken from Table 2 as calculated fromthe rates of our model.
In Fig. 7 the amplitudes (a1, a2 in m2/kg FM) used for the graphsof the sum of two exponentials of Tag soil–roe deer are for Bod-enmais: (0.027 � 0.003 and 0.0016 � 0.001); for Ochsenhausen:(0.023 � 0.002 and 0.0012 � 0.0005); for Weinsberger Forest:(0.031 � 0.021 and 0.026 � 0.006). For Pfrunger Ried, where onlyone exponential function is used in the fit the amplitude isa1 ¼ 0.037 � 0.004. In the model applied to data of Pfrunger Riedfixation/redissolution of 137Cs from soil is negligible and this is thereason why only one exponential function is sufficient to describethe time-dependency.
For roe deer in spruce forest the fits in Fig. 7 demonstrate thatour model to describe the time-dependency with a sum of 2exponential functions is a good approximation because in this caseredissolution and fixation of 137Cs are important. From Fig. 7 can bededuced that Tag values soil–roe deer in the studied spruce forests
in central Europe vary roughly by a factor smaller than 5 site-specifically during the first five years after deposition, and theydecline within 20 years after contamination by about a factor of 10or less. In peat bog Tag values are about the same as in spruce forestjust after contamination and within 20 years they decline by lessthan a factor of 2.
3.4. 137Cs aggregated transfer factor Tag soil–roe deer in the periodJuly–December
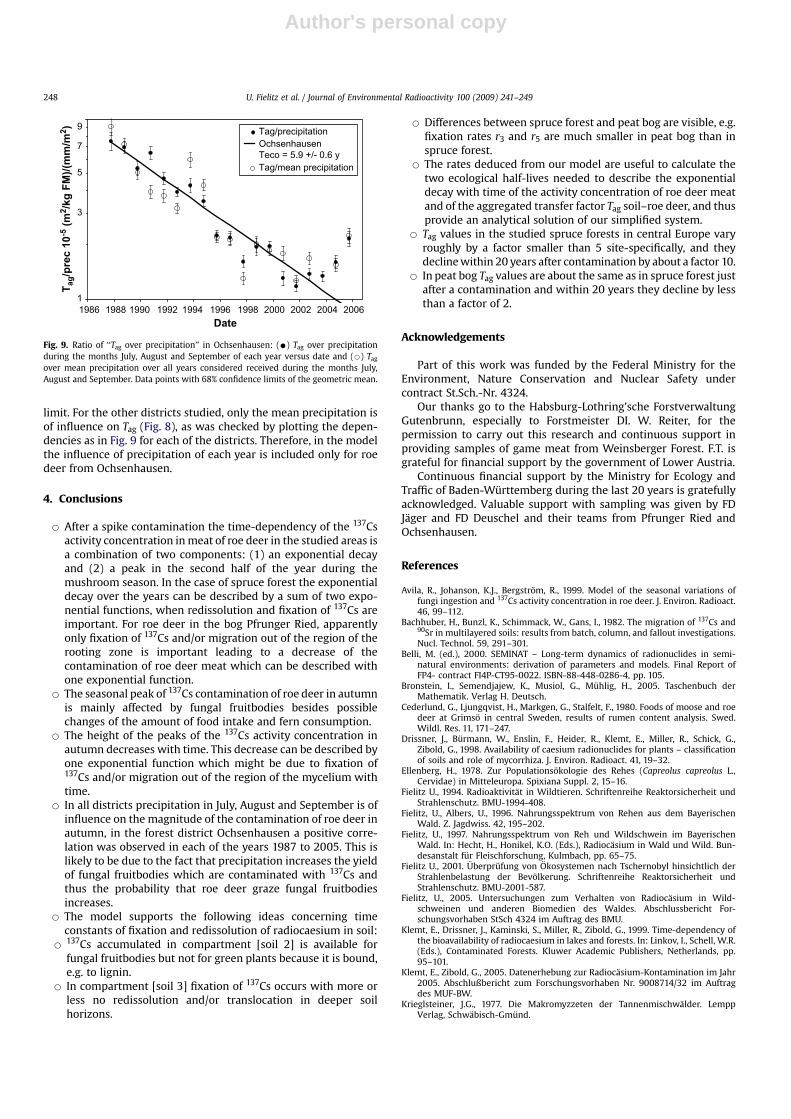
To understand the time-dependency of roe deer contaminationin the second half of the year and the influence of precipitation onthe height of the autumn maxima the mean measured 137Csaggregated transfer factor Tag soil–roe deer versus time is plottedand the amount of precipitation during July, August andSeptember is used as a weighting factor. The weighting improvedthe statistical quality (R2) of the fit only in the case of Ochsen-hausen (Fig. 9) but not in the other 3 districts. Results are shown inFigs. 8 and 9.
In Fig. 8 we observe that in the period July–December theaggregated transfer factor Tag soil–roe deer is exponentiallydecreasing with time for peat bog (Pfrunger Ried) and spruce forest(Weinsberger Forest, Bodenmais and Ochsenhausen). The ecolog-ical half-life of 137Cs in peat bog is more than twice as high as inspruce forest. The observed decrease of Tag soil–roe deer corre-sponds to a decrease in the 137Cs uptake with fungal fruitbodies andgreen plants over time. In our model this fraction of 137Cs is flowinginto compartment [soil 3] and is either strongly fixed or it ismigrating out of the region of the mycelium of fungal fruitbodiesand that of the roots of green plants.
In Fig. 9 the dependence of Tag soil–roe deer on the amount ofprecipitation in the growing season of fungal fruitbodies (July,August and September) is tested. The values of Tag divided by theprecipitation of each year is shown as full dots and Tag valuesdivided by the mean precipitation (averaged over all yearsconsidered) are shown as open dots.
It can be seen in Fig. 9 that the values represented by open dotsare less correlated to the calculated line than the full dots. Thismeans that the amount of precipitation of each year before themushroom season is important to describe radiocaesium in roedeer from Ochsenhausen and Tag soil–roe deer is proportional tothe precipitation multiplied by an exponential decay factor. Theecological half-life of 137Cs in forest district Ochsenhausen asdeduced from Fig. 8 or Fig. 9 is the same within the uncertainty
Table 2Results of the model calculation: R2 the weighted sum of squares to assess thegoodness of fit of our model and rates to characterize 137Cs uptake of roe deer fromsoil r1 and excretion r2, fixation of 137Cs in soil (r3 and r5), redissolution of 137Cs in soil(r4), and uptake of fungal fruitbodies (r6). Mean precipitation in July, August andSeptember during the years 1987–2005 in mm. Ecological half-lives are calculatedfrom rates r3, r4 and r5 to describe the time-dependency of roe deer activityconcentration as a sum of 2 exponentials with ecological half-lives Teco1 and Teco2.
Forest district Bodenmais WeinsbergerForest
Ochsenhausen Pfrunger Ried
R2 0.68 0.32 0.8 0.4Rate$r1 (10�6 d�1) 1.27 � 0.05 0.99 � 0.06 0.56 � 0.02 1.1 � 0.06Rate$r2 (10�2 d�1) 3.83 � 1.73 2.1 � 0.16 3.82 � 0.11 6.4 � 0.31Rate$r3 (10�4 d�1) 2.61 � 0.25 3.13 � 0.2 2.07 � 0.12 10�9 � 3.73 � 10�7
Rate$r4 (10�4 d�1) 3.68 � 0.58 4.6 � 1.2 0.83 � 0.14 10�9 � 2.2 � 10�3
Rate$r5 (10�4 d�1) 2.75 � 0.13 8.4 � 0.4 3.16 � 0.07 0.76 � 0.09Rate$r6 (10�6 d�1) 2.2 � 0.09 1.32b 0.73 � 0.02 1.9 � 0.1
Precipitation in mm 373 332 280c 281Teco1 in aa 2.5 � 0.2 1.44 � 0.08 3.4 � 0.1 25.1 � 3.1Teco2 in aa 14.5 � 1.6 6.47 � 1.43 40.6 � 6.6 Non-significant
a With Eq. (1) Teco1,2 ¼ ln(2)/leco1,2.b Fixed value, average of values from Bodenmais and Ochsenhausen.c In Ochsenhausen precipitation varied between 165 mm in 2003 and 388 mm in
1993.
0,001
0,01
0,1
1986 1988 1990 1992 1994 1996 1998 2000 2002 2004 2006Date
Tag m
2/kg
F
M
4
3
1
2
Fig. 7. Measured aggregated transfer factor Tag soil–roe deer (geometric mean valuesof the months January–June in m2/kg FM) for Bodenmais 1 (6), Weinsberger Forest 2(,), Ochsenhausen 3 (B), and Pfrunger Ried 4 (>); 68% confidence limits of thegeometric mean of Tag, and best fits using the sum of 2 exponential functions with Teco1
and Teco2 as parameters (Eq. (2) with Tphys cancelled).
0,001
0,01
0,1
1986 1988 1990 1992 1994 1996 1998 2000 2002 2004 2006Date
Tag m
2/kg
F
M
Weinsberger Forest Teco = 6.6 +/- 1.2 yPfrunger Ried Teco = 16.3 +/- 4 yBodenmais Teco = 7.5 +/- 1.9 yOchsenhausen Teco = 5.5 +/- 0.8 y
Fig. 8. The aggregated 137Cs transfer factor soil–roe deer Tag (geometric mean values ofthe months July–December in m2/kg FM) versus date for 4 roe deer populations with68% confidence limits of the geometric mean.
U. Fielitz et al. / Journal of Environmental Radioactivity 100 (2009) 241–249 247
Author's personal copy
limit. For the other districts studied, only the mean precipitation isof influence on Tag (Fig. 8), as was checked by plotting the depen-dencies as in Fig. 9 for each of the districts. Therefore, in the modelthe influence of precipitation of each year is included only for roedeer from Ochsenhausen.
4. Conclusions
B After a spike contamination the time-dependency of the 137Csactivity concentration in meat of roe deer in the studied areas isa combination of two components: (1) an exponential decayand (2) a peak in the second half of the year during themushroom season. In the case of spruce forest the exponentialdecay over the years can be described by a sum of two expo-nential functions, when redissolution and fixation of 137Cs areimportant. For roe deer in the bog Pfrunger Ried, apparentlyonly fixation of 137Cs and/or migration out of the region of therooting zone is important leading to a decrease of thecontamination of roe deer meat which can be described withone exponential function.
B The seasonal peak of 137Cs contamination of roe deer in autumnis mainly affected by fungal fruitbodies besides possiblechanges of the amount of food intake and fern consumption.
B The height of the peaks of the 137Cs activity concentration inautumn decreases with time. This decrease can be described byone exponential function which might be due to fixation of137Cs and/or migration out of the region of the mycelium withtime.
B In all districts precipitation in July, August and September is ofinfluence on the magnitude of the contamination of roe deer inautumn, in the forest district Ochsenhausen a positive corre-lation was observed in each of the years 1987 to 2005. This islikely to be due to the fact that precipitation increases the yieldof fungal fruitbodies which are contaminated with 137Cs andthus the probability that roe deer graze fungal fruitbodiesincreases.
B The model supports the following ideas concerning timeconstants of fixation and redissolution of radiocaesium in soil:
B137Cs accumulated in compartment [soil 2] is available forfungal fruitbodies but not for green plants because it is bound,e.g. to lignin.
B In compartment [soil 3] fixation of 137Cs occurs with more orless no redissolution and/or translocation in deeper soilhorizons.
B Differences between spruce forest and peat bog are visible, e.g.fixation rates r3 and r5 are much smaller in peat bog than inspruce forest.
B The rates deduced from our model are useful to calculate thetwo ecological half-lives needed to describe the exponentialdecay with time of the activity concentration of roe deer meatand of the aggregated transfer factor Tag soil–roe deer, and thusprovide an analytical solution of our simplified system.
B Tag values in the studied spruce forests in central Europe varyroughly by a factor smaller than 5 site-specifically, and theydecline within 20 years after contamination by about a factor 10.
B In peat bog Tag values are about the same as in spruce forest justafter a contamination and within 20 years they decline by lessthan a factor of 2.
Acknowledgements
Part of this work was funded by the Federal Ministry for theEnvironment, Nature Conservation and Nuclear Safety undercontract St.Sch.-Nr. 4324.
Our thanks go to the Habsburg-Lothring’sche ForstverwaltungGutenbrunn, especially to Forstmeister DI. W. Reiter, for thepermission to carry out this research and continuous support inproviding samples of game meat from Weinsberger Forest. F.T. isgrateful for financial support by the government of Lower Austria.
Continuous financial support by the Ministry for Ecology andTraffic of Baden-Wurttemberg during the last 20 years is gratefullyacknowledged. Valuable support with sampling was given by FDJager and FD Deuschel and their teams from Pfrunger Ried andOchsenhausen.
References
Avila, R., Johanson, K.J., Bergstrom, R., 1999. Model of the seasonal variations offungi ingestion and 137Cs activity concentration in roe deer. J. Environ. Radioact.46, 99–112.
Bachhuber, H., Bunzl, K., Schimmack, W., Gans, I., 1982. The migration of 137Cs and90Sr in multilayered soils: results from batch, column, and fallout investigations.Nucl. Technol. 59, 291–301.
Belli, M. (ed.), 2000. SEMINAT – Long-term dynamics of radionuclides in semi-natural environments: derivation of parameters and models. Final Report ofFP4- contract FI4P-CT95-0022. ISBN-88-448-0286-4, pp. 105.
Bronstein, I., Semendjajew, K., Musiol, G., Muhlig, H., 2005. Taschenbuch derMathematik. Verlag H. Deutsch.
Cederlund, G., Ljungqvist, H., Markgen, G., Stalfelt, F., 1980. Foods of moose and roedeer at Grimso in central Sweden, results of rumen content analysis. Swed.Wildl. Res. 11, 171–247.
Drissner, J., Burmann, W., Enslin, F., Heider, R., Klemt, E., Miller, R., Schick, G.,Zibold, G., 1998. Availability of caesium radionuclides for plants – classificationof soils and role of mycorrhiza. J. Environ. Radioact. 41, 19–32.
Ellenberg, H., 1978. Zur Populationsokologie des Rehes (Capreolus capreolus L.,Cervidae) in Mitteleuropa. Spixiana Suppl. 2, 15–16.
Fielitz U., 1994. Radioaktivitat in Wildtieren. Schriftenreihe Reaktorsicherheit undStrahlenschutz. BMU-1994-408.
Fielitz, U., Albers, U., 1996. Nahrungsspektrum von Rehen aus dem BayerischenWald. Z. Jagdwiss. 42, 195–202.
Fielitz, U., 1997. Nahrungsspektrum von Reh und Wildschwein im BayerischenWald. In: Hecht, H., Honikel, K.O. (Eds.), Radiocasium in Wald und Wild. Bun-desanstalt fur Fleischforschung, Kulmbach, pp. 65–75.
Fielitz U., 2001. Uberprufung von Okosystemen nach Tschernobyl hinsichtlich derStrahlenbelastung der Bevolkerung. Schriftenreihe Reaktorsicherheit undStrahlenschutz. BMU-2001-587.
Fielitz, U., 2005. Untersuchungen zum Verhalten von Radiocasium in Wild-schweinen und anderen Biomedien des Waldes. Abschlussbericht For-schungsvorhaben StSch 4324 im Auftrag des BMU.
Klemt, E., Drissner, J., Kaminski, S., Miller, R., Zibold, G., 1999. Time-dependency ofthe bioavailability of radiocaesium in lakes and forests. In: Linkov, I., Schell, W.R.(Eds.), Contaminated Forests. Kluwer Academic Publishers, Netherlands, pp.95–101.
Klemt, E., Zibold, G., 2005. Datenerhebung zur Radiocasium-Kontamination im Jahr2005. Abschlußbericht zum Forschungsvorhaben Nr. 9008714/32 im Auftragdes MUF-BW.
Krieglsteiner, J.G., 1977. Die Makromyzzeten der Tannenmischwalder. LemppVerlag, Schwabisch-Gmund.
1986 1988 1990 1992 1994 1996 1998 2000 2002 2004 2006Date
Ta
g/p
rec 10
-5 (m
2/kg
F
M)/(m
m/m
2) Tag/precipitation
OchsenhausenTeco = 5.9 +/- 0.6 yTag/mean precipitation
1
3
5
7
9
Fig. 9. Ratio of ‘‘Tag over precipitation’’ in Ochsenhausen: (C) Tag over precipitationduring the months July, August and September of each year versus date and (B) Tag
over mean precipitation over all years considered received during the months July,August and September. Data points with 68% confidence limits of the geometric mean.
U. Fielitz et al. / Journal of Environmental Radioactivity 100 (2009) 241–249248

Author's personal copy
Olsen, R.A., Joner, E., Bakken, L.R., 1990. Soil fungi and the fate of radiocaesium inthe soil ecosystem – a discussion of possible mechanisms involved in theradiocaesium accumulation in fungi, and the role of fungi as a Cs-sink in thesoil. In: Desmet, G., Nassimbeni, P., Belli, M. (Eds.), Transfer of Radionuclides inNatural and Semi-natural Environments. Elsevier, New York, pp. 657–663.
Prohl, G., Ehlken, S., Fiedler, I., Kirchner, G., Klemt, E., Zibold, G., 2006. Ecologicalhalf-lives of 90Sr and 137Cs in terrestrial and aquatic ecosystems. J. Environ.Radioact. 91, 41–72.
Rigol, A., Vidal, M., Rauret, G., 2002. An overview of the effect of organic matter onsoil–radiocaesium interaction: implications in root uptake. J. Environ. Radioact.58, 191–216.
Strebl, F., Gerzabek, M.H., Bossew, P., Kienzl, K., 1999. Distribution of radio-caesium in an Austrian forest stand. The Science of the Total Environment226, 75–83.
Strebl, F., Bossew, P., Kienzl, K., Hiesel, E., 2000. Radionuklide in Waldokosystemen.Monographien, Band 59 (M-059). Umweltbundesamt, Wien 2000. pp. 73. (ref.p. 38) Online available: http://www.umweltbundesamt.at/fileadmin/site/publi-kationen/M059z.pdf
Strebl,F.,Tataruch,F.,2007. Timetrends(1986–2003)ofradiocesium transfertoroedeerand wild boar in two Austrian forest regions. J. Environ. Radioact. 98,137–152.
Zibold, G., Drissner, J., Kaminski, S., Klemt, E., Miller, R., 2001. Time-dependency ofthe radiocaesium contamination of roe deer: measurement and modelling. J.Environ. Radioact. 55, 5–27.
Zibold, G., Klemt, E., Putyrskaya, V., 2005. Seasonality of the radiocaesiumcontamination of roe deer from southern Germany in the years 1987 to 2005.In: Strand, P., Borretzen, P., Jolle, T. (Eds.), Proceedings from the 2nd Interna-tional Conference on Radioactivity in the Environment, Nice, France, ISBN82-90362-21-8, pp. 345–348.
U. Fielitz et al. / Journal of Environmental Radioactivity 100 (2009) 241–249 249
Related Documents