Vol. 80: 237-248, 1992 i MARINE ECOLOGY PROGRESS SERIES Mar. Ecol. Prog. Ser. Published March 3 Seasonal changes in specific growth rates, production and biomass of a bacterial community in the water column above a Mediterranean seagrass system Branko Velimirov, Martha Walenta-Simon* Institut fiir Allgerneine Biologic, Abt. Mikrobiologie. Universitat Wien, SchwarzspanierstraDe 17, A-1090 Wien, Austria ABSTRACT: Bacterial abundance, biomass and production rates were determined at 3 depths (5, 10 & 15 m) in the water column above a Mediterranean seagrass bed in the Gulf of Calvi (west coast of Corsica, France) from 1988 to 1990. We used dialysis bags for in s~tu incubation of 2 pm prefiltered seawater sampled from the respective depths to determine bactenal growth parameters and conducted light- and dark-bottle incubations to estimate planktonic primary production by O2 measurements. Bacterial density and biomass was subject to marked seasonal changes. Bacterial density varied clearly over the seasons and between the 3 depths, with maximum values being recorded in Aug and Oct 1988 at the 10 and 15 m depths. Differences in bacterial biomass and density patterns were mainly attributed to changes of abundance and biovolume of rod-shaped bacteria. Highest carbon values were recorded during the summer months in 1989 and 1990 at the 3 depths and ranged from 32 to 65 pg C I-' Bacterial growth rates were closely correlated to temperature, with highest specific growth rates (0.075 to 0.125 h-') found in summer, when chlorophyll a concentrations were at a minimum during this season. Dur~ng Jan and Feb 1989 and 1990, when chl a concentrations were at a maximum, bacterial growth rates were below 0.001 h-' Doubling times (g) ranged from 5.2 to 23 h in summer, being lowest at the 5 m depth. Highest g values were recorded in Jan 1989 at 10 m (259 h). Dunng this period we observed an increase bacterial numbers within the dialysis bags, but a decrease in biovolume of the 4 morpho- types. We hypothesize that the observed growth strategy is necessary for bacteria to resist starvation and to obtain a competitive advantage for nutrient scavanging under oligotrophic conditions. In Jan, bacterial production corresponded to 7.6 % of gross primary production. In summer, bacterial produc- tion ranged from 18.5 to 48.4 % of gross primary production. Carbon requirements of the bacterial population in the water column were discussed in view of various carbon conversion efficiencies. The range of our bacterial production values is compared with values from other systems and seen in the context of the n~ethodological approaches. INTRODUCTION It is established knowledge that in aquatic systems dominated by vascular plants, most of the primary production is not utilized directly by macroconsumers (Thayer et al. 1975, Ott & Maurer 1977, Zimmermann et al. 1979, Morgan 1980, Phillips & McRoy 1980, Traer 1980, Ott 1981, Velimirov 1986, Mann 1988). The bulk of plant material undergoes fragmentation and chemi- cal modification (Velimirov et al. 1981, Morgan & Kit- ting 1984, Velimirov 1987) before entering the food ' Present address: Bundesanstalt fur Wassergiite, A-1220 Wien, Austria O Inter-Research/Printed in Germany chain, or is transferred to the higher trophic levels by first being changed into bacterial biomass which is subsequently consumed by bacterivores. Since bac- teria are involved in both decomposition processes (Newel1 et al. 1983) and the transfer of energy to meio- and macrofauna (Newel1 et al. 1982), reliable data on biomass and growth rates of bacteria are needed to understand and quantify the carbon cycle in seagrass- dominated ecosystems. However, bacterial degrada- tion in such systems is not restricted to seagrass- derived particles; the presence of phytoplanktonic par- ticulate organic carbon (Murray & Wetzel 1987) and exudates in the water column (Chrost 1981, Chrost & Faust 1983, Miinster & Chrost 1990) represents easily degradable organic matter compared to the structural

Welcome message from author
This document is posted to help you gain knowledge. Please leave a comment to let me know what you think about it! Share it to your friends and learn new things together.
Transcript
Vol. 80: 237-248, 1992 i MARINE ECOLOGY PROGRESS SERIES Mar. Ecol. Prog. Ser.
Published March 3
Seasonal changes in specific growth rates, production and biomass of a bacterial community
in the water column above a Mediterranean seagrass system
Branko Velimirov, Martha Walenta-Simon*
Institut fiir Allgerneine Biologic, Abt. Mikrobiologie. Universitat Wien, SchwarzspanierstraDe 17, A-1090 Wien, Austria
ABSTRACT: Bacterial abundance, biomass and production rates were determined at 3 depths (5, 10 & 15 m) in the water column above a Mediterranean seagrass bed in the Gulf of Calvi (west coast of Corsica, France) from 1988 to 1990. We used dialysis bags for in s ~ t u incubation of 2 pm prefiltered seawater sampled from the respective depths to determine bactenal growth parameters and conducted light- and dark-bottle incubations to estimate planktonic primary production by O2 measurements. Bacterial density and biomass was subject to marked seasonal changes. Bacterial density varied clearly over the seasons and between the 3 depths, with maximum values being recorded in Aug and Oct 1988 at the 10 and 15 m depths. Differences in bacterial biomass and density patterns were mainly attributed to changes of abundance and biovolume of rod-shaped bacteria. Highest carbon values were recorded during the summer months in 1989 and 1990 at the 3 depths and ranged from 32 to 65 pg C I-' Bacterial growth rates were closely correlated to temperature, with highest specific growth rates (0.075 to 0.125 h-') found in summer, when chlorophyll a concentrations were at a minimum during this season. Dur~ng Jan and Feb 1989 and 1990, when chl a concentrations were at a maximum, bacterial growth rates were below 0.001 h-' Doubling times (g) ranged from 5.2 to 23 h in summer, being lowest at the 5 m depth. Highest g values were recorded in Jan 1989 at 10 m (259 h). Dunng this period we observed an increase bacterial numbers within the dialysis bags, but a decrease in biovolume of the 4 morpho- types. We hypothesize that the observed growth strategy is necessary for bacteria to resist starvation and to obtain a competitive advantage for nutrient scavanging under oligotrophic conditions. In Jan, bacterial production corresponded to 7.6 % of gross primary production. In summer, bacterial produc- tion ranged from 18.5 to 48.4 % of gross primary production. Carbon requirements of the bacterial population in the water column were discussed in view of various carbon conversion efficiencies. The range of our bacterial production values is compared with values from other systems and seen in the context of the n~ethodological approaches.
INTRODUCTION
It is established knowledge that in aquat ic systems dominated by vascular plants, most of the primary production is not utilized directly by macroconsumers (Thayer e t al. 1975, Ott & Maurer 1977, Zimmermann e t al. 1979, Morgan 1980, Phillips & McRoy 1980, Traer 1980, Ott 1981, Velimirov 1986, M a n n 1988). T h e bulk of plant material undergoes fragmentation a n d chemi- cal modification (Velimirov e t al. 1981, Morgan & Kit- ting 1984, Velimirov 1987) before enter ing the food
' Present address: Bundesanstalt fur Wassergiite, A-1220 Wien, Austria
O Inter-Research/Printed in Germany
chain, or is transferred to t h e higher trophic levels by first being changed into bacterial biomass which is subsequently consumed by bacterivores. Since bac- teria a r e involved in both decomposition processes (Newel1 e t al. 1983) a n d the transfer of energy to meio- a n d macrofauna (Newel1 e t al. 1982), reliable d a t a o n biomass a n d growth rates of bacteria a r e n e e d e d to understand a n d quantify the carbon cycle i n seagrass- dominated ecosystems. However , bacterial degrada- tion in such systems is not restricted to seagrass- derived particles; the presence of phytoplanktonic par- ticulate organic carbon (Murray & Wetzel 1987) a n d exuda tes in the water column (Chrost 1981, Chrost & Faust 1983, Miinster & Chrost 1990) represents easily degradable organic matter compared to the structural

Mar. Ecol. Prog. Ser. 80: 237-248, 1992
carbohydrates from vascular plants (Benner et al. 1986, Moran & Hodson 1989) or their epiphytes. Therefore bacterial biomass and growth dynamics in the water column above the seagrass bed may be different from those within the meadow.
Most information on bacterial biomass and produc- tion in seagrass systems is available for Zostera cap- ncorni beds (Moriarty & Pollard 1981, 1982) and a multi-species seagrass community (Moriarty et al. 1990) in Australia. In general, less information is avail- able for temperate seagrass systems and more specifi- cally, for those of the Mediterranean Sea. Density data relating to bacteria on seagrass debris and leaves of Posidonia oceanica (Velimirov et al. 1981, Novak 1984) as well as in the water column above and within a Posidonia bed (Velimirov 1986a, Velimirov 1987) have been published, but only limited data on bacterial growth rates from a site near the Gulf of Naples, Italy (Velimirov 1989) can be found.
In the following study we report on bacterial biomass as well as on growth rates and production obtained at a site in the Gulf of Calvi (west coast of Corsica, France) which is characterized by an extensive seagrass bed. We investigated seasonal variations of the bacteria populations in the water column above the seagrass bed and integrated estimations on chlorophyll a con- centrations and phytoplanktonic primary production into the study. As an alternative to the methods of Fuhrman & Azam (1980), Moriarty & Pollard (1981) and Moriarty et al. (1990) using thymidine incorporation into DNA to estimate bacterial productivity, we chose to follow growth of microbial populations by direct observation using in situ incubations in dialysis bags (Lochte & Turley 1985, Turley & Lochte, 1985).
MATERIALS AND METHODS
The investigation site was located 300 m off the research station STARES0 in the Gulf of Calvi. A dense Posidonia oceanica bed characterizes the shallow benthos of the gulf, extending from 4 to 35 m depth, and is adjacent to a deeper sand and mud bottom ecosystem. A detailed description of the site is given by Bay (1984). Data on wind, main current directions and speed are available from Djenedi (1985). Highest shoot density is found between depths of 10 and 20 m, with an average of 408 shoots m-2 (Bay 1984). All measure- ments, water sampling and in situ incubations took place at 3 depths (5, 10 & 15 m) at a permanent station marked by a surface buoy. Depth at this station was 20 m.
Temperature was measured at least twice a month at the 3 depths by SCUBA divers. Multiple water samples for the determination of bacterial density, incubation
experiments and chlorophyll a measurements were col- lected at each of the 3 depths between 1988 and 1990 using 1.4 1 IRO bottles. All containers were acid- washed and rinsed with distilled water prior to use. Glassware used for storage of pooled water samples was autoclaved after being cleaned as described above. Two 20 m1 aliquots of each pooled sample per depth were preserved with 800 p1 of 35% formal- dehyde for enumeration and sizing of bacterial cells.
To determine bacterial secondary production, each pooled water sample was taken to the laboratory and gravity-filtered through 2 ,um pore size Nuclepore poly- carbonate filters (45 mm diameter) to eliminate most bacterial predators. Each filtered water sample was split into two 1.2 1 subsamples and poured into separate pretreated dialysis bags (Union Carbide, 65mm inflated diameter, molecular weight cutoff 12000 to 14 000 D), modifying the method of Turley & Lochte (1985). Pretreatment consisted of washing the strips of seamless regenerated cellulose tubing in boiling water for 2 h, rinsing in running tap water overnight, fol- lowed by washing for l h in boiling water and further rinsing in distilled water. Each end was sealed by 2 knots, 3 cm apart. The filtration and filling procedure took approximately 45 min per depth. During transport the bags were kept in a light-tight cooling box. One end was then connected with a polypropylene rope to a bottom weight, while the other end was connected to a small subsurface buoy which kept the bag in an upright position without exerting tension stress on it. SCUBA- divers positioned each pair of dialysis bags at 5. 10 and 15 m, respectively, by adjusting the length of the bot- tom rope. The lowest bag (at the 15 m depth) was located approximately 5 m above the seagrass meadow. Each pair of bags, situated l m apart, was incubated for 24 h.
All bags were collected 24 to 26 h after immersion (at 45 min intervals) by SCUBA divers and brought to the laboratory within 5 min. Three 20 m1 aliquots were taken from each bag to conduct replicate bacterial counts. The acridine orange epifluorescence direct counting technique (Hobbie et al. 1977) was applied to estimate total bacterial number, using a Leitz Diaplan microscope fitted with a Leitz Orthomat E Photosystem (excitation wavelength 450 to 490 nm, cutoff filter 515 nm).
Bacteria were sized by eyepiece micrometer, clas- sifying bacteria into cocci, rods, curved rods and spinl- lae. We counted all cells in a minimum of 30 eyefields per sample and measured between 100 and 180 cells per subsample. Cells were operationally defined as rods if their length and width differed by more than 0.1 p m Volume estimations were based on the assump- tion that all bacteria are spheres or rods (i.e. cylinders with 2 hemispherical caps). The difficulties of obtaining

Velimirov & tvalenta-Simon: Seasonal changes of a bacterial commumty 239
reliable size estimates during direct observation in the epifluorescence microscope are demonstrated by Krambeck & Krambeck (1984). Bratback (1985), Lee & Fuhrman (1987) and Krambeck et al. (1990). Fluores- cent latex beads with diameters of 0.11, 0.22, 0.6 and 0.88 pm (Polyscience Lim.) were used for calibration of the sizing procedure. Our estimates by eye were con- trolled using both an automatic image analyzer (Leitz- ASBA 111) and a semi-automatic image analyzer (Leitz- ASM 68 K) on magnifications of epifluorescence photo- n~icrographs (Lee & Fuhrman 1987). We overestimated the diameter of spheres with 0.11 and 0.22 pm diame- ters by 16 %, 0.6 pm diameter by l 1 O/O and 0.88 pm diameter by 6 %.
The frequency of dividing cells (FDC) was deter- mined by the method of Hagstrom et al. (1979), and cellular carbon was calculated from the estimated total bacterial volume, using the conversion factor 380 fg C pm-3 cell volume after Lee & Fuhrman (1987). Bacterial growth rate was calculated by the equation for expo- nential growth: p = (In N2 - In N,)/( t2 - t l ) where NI and N2 = bacterial abundance at the beginning and the end of an incubation interval; tl and t2 = beginning and ending incubation times. The doubling time g was calculated by: g = In 2/,u. Estimation of bacterial pro- duction was obtained by: (total bacterial carbon at t2 - total bacterial carbon at tl)/(t2 - t,).
For chlorophyll measurements we filtered a minimum of 5 to 7 l water onto one or several Whatmann GF/F filters using low vacuum ((0.2 atm). The filters were stored at -18 "C in the dark until extraction in 9O0/0 acetone and spectrophotometric determination accord- ing to Parsons et al. (1985). Estimates of primary produc- tion in the water column were obtained by monitoring the evolution of dissolved oxygen in capacity calibrated light and dark Winkler flasks according to the modified classical Winkler procedures (Parsons et al. 1985). Duplicate light and dark bottles were incubated for 4 h, usually between 10:OO and 14:OO h, at 1, 5, 10 and 15 m depth and always using the same set of bottles for the same depth. Although the incubations were started in August 1988 we only used data from experiments from July 1989 on, which were run at the same time or close to the 24 h incubation experiments of dialysis bags to determine bacterial growth rates. Temperature read- ings were performed at the beginning and the end of both types of incubation experiments. To convert O2 values into carbon equivalents, a photosynthetic quo- tient of 1.36 (Williams & Robertson 1991) and a respirat- ory quotient of 1.0 (Holligan et al. 1984, Bender e t al. 1987) were used. We used a Metrohm titration sytem (Oudet et al. 1988) consisting of a digital Titroprocessor 686 and a Multidosimat (Dosimat 665) with automatic burette and digital display combined with platinum electrode. Each titration was preceded by a control of
the system, using water which was supersaturated with oxygen and water boiled for 40 min and subsequently flushed with nitrogen.
RESULTS
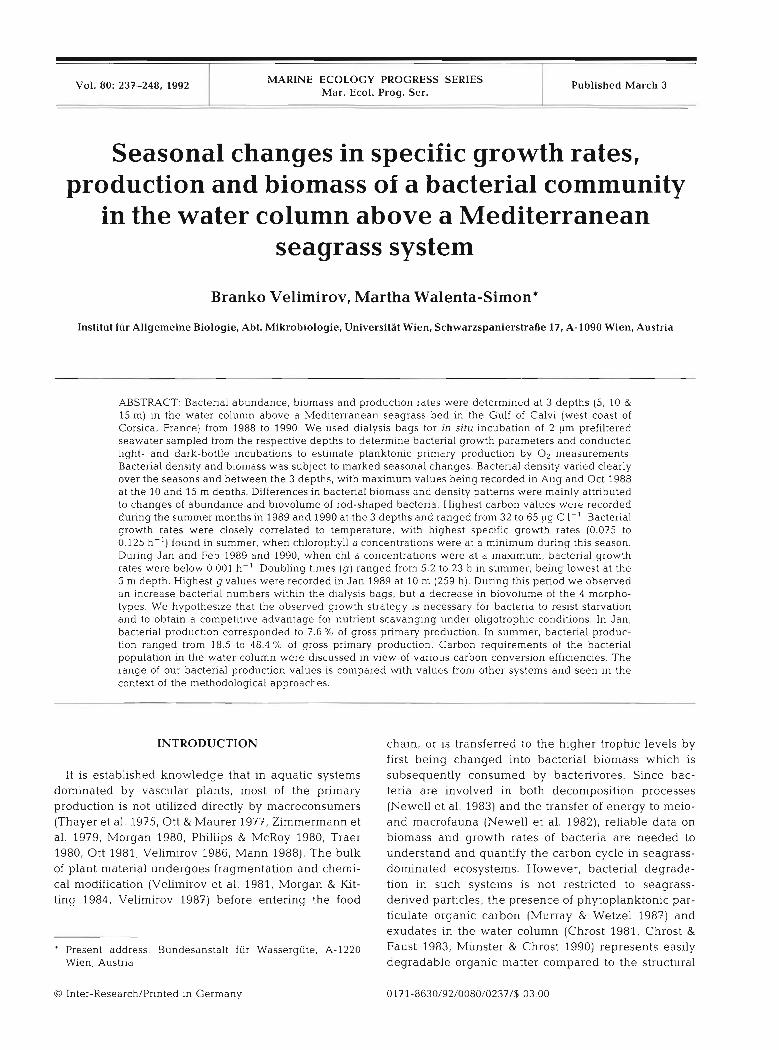
The bacterial density pattern from July 1988 to 1990 at 5 m (Fig. 1) varied substantially from density patterns at the 10 and 15 m deeper depths. This difference was due to high densities at the 10 m depth in Aug 1988 (11.5 X lo5 cells ml-l) and at the 15 m depth in Oct 1988 and Jul 1990 with 26 X 105 and 11.23 X 10⁵ cells ml-' respectively. In contrast, the 5 m depth showed a density peak in Jun and Jul1989 (9.60 and 10.89 X 10' cells ml-l) as well as in Apr 1990 (8.36 X 10⁵ cells ml-l). Although a smaller peak was also noticed from Jan to Jul1989 for the 10 and 15 m depths, no such clear peak could be detected at 5 m.
- Total
+ Total
20
J A S O N D J F M A M J J A S O N D J F M A M J J
1 988 1989 1990
Fig. 1. Variations in total bacterial number and rod-shaped bacteria at 5, 10 and 15 m depths from 1988 to 1990
240 Mar. Ecol. Prog. Ser. 80: 237-248, 1992
Total bacterial abundance and the number of rod- shaped bacteria showed similar variation patterns over the 2 years with the exception of Aug 1988 at 10 m and Oct 1988 at 15 m. However, for most of the samples from 1989 and 1990, cocci and curved rods were the dominant bacterial morphotype. At the 5 m depth, the numerical importance of rods was only noticed in samples from 1988 and for Jan 1990. The density peak a t 10 m in Aug 1988 was due to the dominance of cocci, amounting to 89.2 % of the total cell number. Again, high number of rods were only noticed in Jul and Oct; during the remainder of the sampling period, their contribution was below 40 % of total cell number. The peak in Oct 1988 a t 15 m was also due to a dominance of cocci (82.4 %), and with the exception of Jul and Aug 1988, the contribution of rods to the total cell number was comparable to that at 10 m.
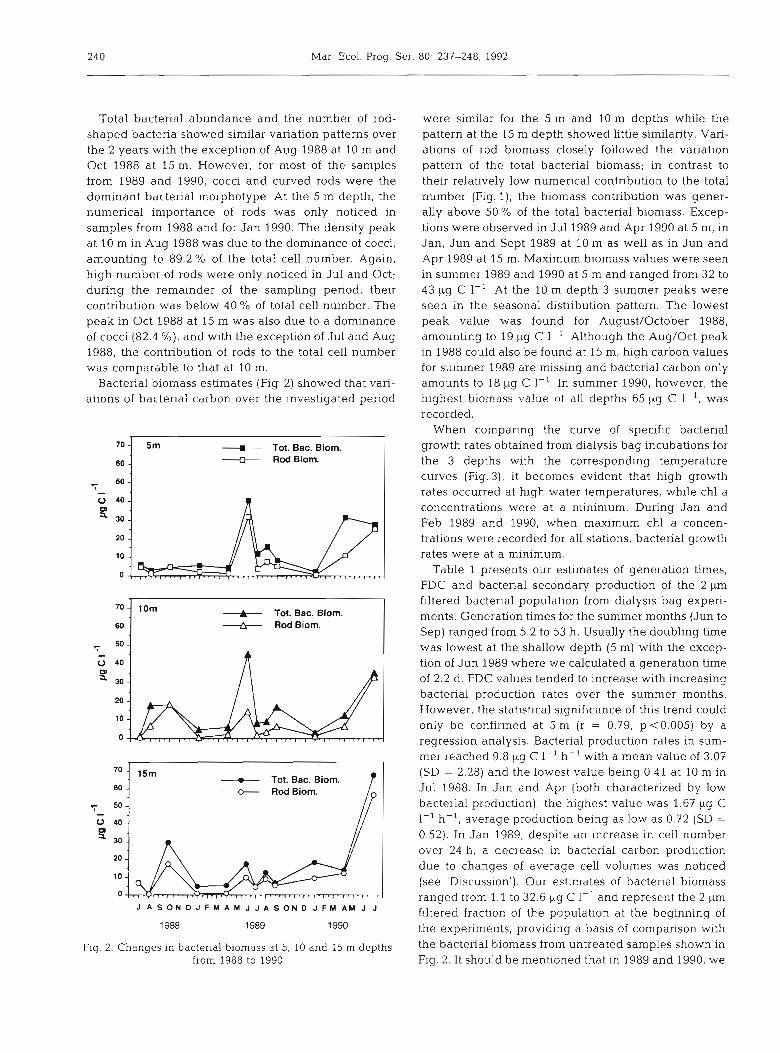
Bacterial biomass estimates (Fig. 2) showed that vari- ations of bacterial carbon over the investigated period
Tot. Bac. Biom.
60 " Rod Biom.
Tot. Bac. Biom. D 4 Rinm l l
7 0 -
60-
J A S O N D J F M A M J J A S O N D J F M A M J J
10rn + Tot. Bac. Biom. -A- Rod Biom.
Fig. 2. Changes in bacterial biomass at 5, 10 and 15 m depths from 1988 to 1990
were similar for the 5 m and 10 m depths while the pattern at the 15 m depth showed little similarity. Vari- ations of rod biomass closely followed the variation pattern of the total bacterial biomass; in contrast to their relatively low numerical contribution to the total number (Fig. l), the biomass contribution was gener- ally above 50 % of the total bacterial biomass. Excep- tions were observed in Jul 1989 and Apr 1990 at 5 m, in Jan, Jun and Sept 1989 at 10 m as well as in Jun and Apr 1989 at 15 m. Maximum biomass values were seen in summer 1989 and 1990 at 5 m and ranged from 32 to 4 3 pg C 1-l . At the 10 m depth 3 summer peaks were seen in the seasonal distribution pattern. The lowest peak value was found for August/October 1988, amounting to 19 pg C 1-l. Although the Aug/Oct peak in 1988 could also be found at 15 m, high carbon values for summer 1989 are missing and bacterial carbon only amounts to 18 pg C 1-l . In summer 1990, however, the highest biomass va!ue of all depths 65 pg C 1 ', was recorded.
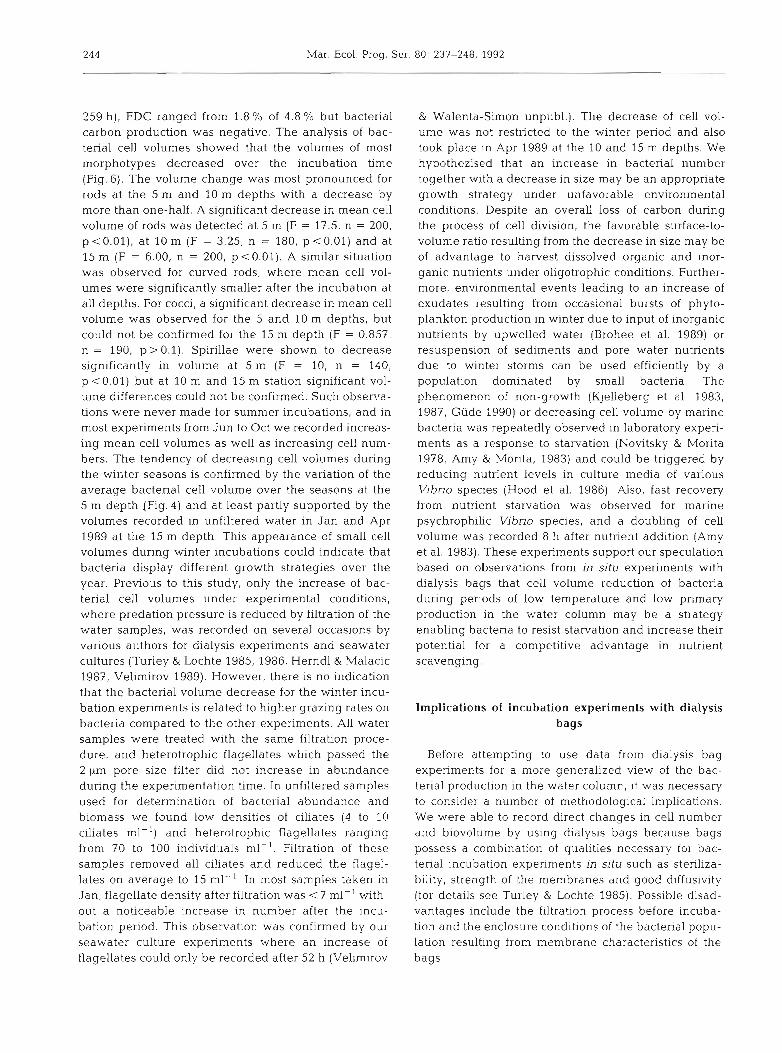
When comparing the curve of specific bacterial growth rates obtained from dialysis bag incubations for the 3 depths with the corresponding temperature curves (Fig.3), it becomes evident that high growth rates occurred at high water temperatures, while chl a concentrations were at a minimum. During Jan and Feb 1989 and 1990, when maximum chl a concen- trations were recorded for all stations, bacterial growth rates were at a minimum.
Table 1 presents our estimates of generation times, FDC and bacterial secondary production of the 2 pm filtered bacterial population from dialysis bag experi- ments. Generation times for the summer months (Jun to Sep) ranged from 5.2 to 53 h. Usually the doubling time was lowest at the shallow depth (5 m) with the excep- tion of Jun 1989 where we calculated a generation time of 2.2 d. FDC values tended to increase with increasing bacterial production rates over the summer months. However, the statistical significance of this trend could only be confirmed at 5 m (r = 0.79, p<0.005) by a regression analysis. Bacterial production rates in sum- mer reached 9.8 lig C I-' h-' with a mean value of 3.07 (SD = 2.28) and the lowest value being 0.41 at 10 m in Jul 1988. In Jan and Apr (both characterized by low bacterial production), the highest value was 1.67 pg C 1-' h- ' , average production being as low as 0.72 (SD =
0.52). In Jan 1989, despite an increase in cell number over 24 h, a decrease in bacterial carbon production due to changes of average cell volumes was noticed (see 'Discussion'). Our estimates of bacterial biomass ranged from 1.1 to 32.6 pg C 1-' and represent the 2 pm filtered fraction of the population at the beginning of the expenments, providing a basis of comparison with the bacterial biomass from untreated samples shown in Fig. 2. It should be mentioned that in 1989 and 1990, we

Velin~irov & Walenta-S~mon Seasonal changes of a bacterial community 24 1
r- -
We also compared variations of the average cell ence in the variations of the mean cell volume could be volume over the seasons at all depths for prefiltered detected at 5 m (F = 1.12, p>0.01) , 10 m (F = 0.90, and unfiltered samples (Fig. 4). No significant dffer- p>0.01) or 15 m (F = 2.22, p>0.01) .
0.5 Table 1. Generation time (g) , frequency of dividing cells
Chl-a lOm (FDC), standing stocks (biomass), and production of bacterial
0.4 U Chl-a 15m populations in 2 pm filtered water from 3 depths in the water column above a seagrass bed in Calvi (Corsica) from July 1988
0.3 to July 1990. Values are the mean of 2 experiments per month.
t - g 0.2
0.1
0.0
26
& 10m 0 24 U 15m
22
S 1 20 e S 18
14
12
0.150 - - 0.125 --t 10m - U 1sm
0.100
5 g 0.075 m 0 E 0.050
! V) 0.025
0.000
J A S O N D J F M A M J J A S O N D J F M A M J J
1988 1989 1990
Fig. 3. Variations in chlorophyll a, temperature and specific growth rate (h-') of water column bacteria a t 3 depths from
1988 to 1990
had time intervals of over 24 h between prefiltration of water for dialysis bag experiments and sampling for determination of seasonal bacteria biomass determina- tion. Despite these time intervals, little difference was observed between bacterial biomass from filtered and untreated samples. A significant difference between filtered and unfiltered bacterial biomass variation over the seasons could only be detected for the 15 m depth (F = 6.67, p <0.01), where higher values were noted for unfiltered samples in Jun 1989, Jan 1990 and Jul 1990. Although relatively high biomass values were also observed in Jan and Jun 1989 for the untreated sam- ples at the other depths, no significant differences in seasonal biomass variations were detected for the 5 m depth (F = 2.00, p > 0.01), or the 10 m depth (F = 2.49, n > O O l l
NP = negative production after 24 h of incubation; nd = not determined
Month/ 9 FDC Biomass Production depth (h) (%) (pg C I-') (pg C 1-' h-l)
Jul 1988 5 m 5.69 2.24 5.93 3.07
10 m 8.87 4.94 1.10 0.41 15 m nd nd 7.13 nd
Aug 1988 5 m 5.28 3.16 3.80 2.24
10 m 5.95 2.31 3.20 1.57 15 m 5.49 2.64 6.28 1.34
Oct 1988 5 m 24.70 2.50 4.78 4.03
10 m 7.18 1.23 18.10 2.96 15 m 74.60 1.58 29.40 1.30
Jan 1989 5 m 83.73 3.40 6.93 NP
10 m 259.06 1.86 32.62 NP 15 m 36.08 4.80 2.02 0.12
Apr 1989 5 m NP 3.21 4.05 N P
10 m 30.76 6.08 5.76 0.17 15 m 31.46 5.40 5.34 0.61
Jun 1989 5 m 53.27 10.15 7.86 2.22
10 m 15.41 15.35 5.92 2.79 15 m 14.84 23.74 6.31 1.29
Jul 1989 5 m 10.54 25.81 12.61 9.84
10 m 8.38 16.37 9.44 3.75 15 m 10.72 21.66 8.39 3.38
Aug 1989 5 m 11.63 13.11 31.42 4.91
10 m 14.02 17.08 8.33 3.68 15 m 18.33 16.13 8.00 2.49
sep 1989 5 m 13.56 13.59 6.19 1.61
10 m 14.98 29.00 6.42 2.53 15 m 23.33 17.16 9.61 0.81
Jan 1990 5 m 49.81 3.62 4.32 0.16
10 m 63.18 11.04 5.10 0.99 15 m 58.92 6.07 6.61 0.28
Apr 1990 5 m 167.69 0.49 25.96 0.99
l 0 m 37.21 5.10 9.74 0.91 15 m 26.56 4.07 13.80 1.67
Jul 1990 5 m 14.04 14.46 12.09 3.95
10 m 12.90 12.55 12.45 4.86 15 m 9.51 19.16 4.93 3.34

242 Mar Ecol. Prog. Ser 80: 237-248, 1992
Measurements of O2 production and consumption for the 3 depths in Fig. 5 revealed a similarity in production and respiration values over the 2 years for the 5 and 10 m depths. The average summer values for 1989 at the 5 and 10 m depths 133.2 (SD = 4.27) and 25.86 pg O2 1-' h-"SD = 6.89) respectively] were higher than those found in summer 1990 i21.25 (SD = 8.42) and 18.89 kg O2 l-' h-' (SD = 11.46)). The production values at 15 m ranged from 15 to 46 pg O2 1-' h-', the highest value being recorded in Apr 1990. The average production value for summer 1989 was 25.71 pg 0 2 1-I h-' (SD =
7.32). comparable to the 10 m depth, while the mean summer value for 1990 was 11.60 pg 0 2 1-' h-' (SD = 3.85), the lowest summer average of all stations.
To relate bacterial production to primary production in the water column, we expressed hourly production rates of bacteria as percentage of gross primary pro- duction from parallel incubation experiments with Light
0.40
0.36
032 - untiltered - 028
b 0.24
E Om 0.16
g 0.12
0.08
0.04
0.00
- filtered - untiltered
o.sj 15m - filtered T I - untiltered
J A S O N D J F M A M J J A S O N D J F M A M J J
Fig. 4. Mean bacteria cell volume in 2 vm filtered and unfil- tered water samples from the 5, 10 and 15 m depth (Mean +
SD) from 1988 to 1990
1 977 U NPP - RESP
20
80 10rn - NPP 1 - RESP
60 p NPP TT - RESP A
J A S O N D J F M A M J J A
1989 1990
Fig. 5. Oxygen production and consumption in the water col- umn at the 5 m, 10 m and 15 m depth station (Mean ? SD). NPP: Oxygen evolution in light bottle. RESP: Oxygen evolu-
tion in dark bottles
and dark bottles (Table 2). In Jan and Apr bacterial production corresponded at most to 7.6 % of the gross primary production, with the lowest bacterial produc- tion representing only 1.3 %. A different situation was noticeable in summer; in Jul and Aug 1989 bacterial production ranged from 15.2 to 48.4 % of gross primary production. The highest bacterial production value for Jul 1990 was measured at the 10 m depth and corre- sponded to 36 % of the gross primary production.
DISCUSSION
Comparison of seasonal bacterial growth rates (Fig. 3) with the temperature curve indicates that high growth rates mostly occur above 16 "C. At least on a seasonal basis, it seems that bacterial growth rates are

Velimirov & Walenta-Simon. Season a1 changes of a bacterial community 243
Table 2. Gross primary production (GPP) and bacterial secon- dary production (BP), expressed a s percentage of GPP for the investigation periods between July 1989 and 1990. Data are mean values of all incubation experiments within the month of investigation a s follows: GPP: 11, 13 and 17 Jul, 9 and 20 Aug, 25 and 26 Sep 1989; 29 and 30 Jan, 16 and 17 Apr, 14, 17, 21 and 27 Jul 1990. BPP: 7 , 8, 15 and 16 Jul, 7, 8, 18 and 19 Aug, 23, 24, 26 and 27 Sep 1989: 29 and 30 Jan, 13, 14, 17 and 18
Apr, 14, 15, 19 and 20 Jul 1990
Month Depth Gross primary Bacterial (m) production (GPP) production
( g C l h (% of GPP)
Jul 1989 5 m 20.33 48.40 10 m 20.18 18.53 15 m 10.85 31.15
Aug 1989 5 m 20.16 24.35 10 m 10.52 34.98 15 m 16.29 15.28
Sep 1989 5 m 23.77 6.77 10 m 19.27 13.12 15 m 19.58 4.13
Jan 1990 5 m 12.20 1.31 10 m 12.89 7.68 15 m 9.25 3.02
Apr 1990 5 m 20.97 4.72 10 m 18.06 5.03 15 m 27.40 6.09
Jul 1990 5 m 13.55 29.15 10 m 13.21 36.79 15 m 8 59 38.88
not related to the phytoplankton biomass maxima, which occur when bacterial growth rates are lowest. Our data on chl a concentrations obtained during winter and spring are in agreement with those recorded by Brohee e t al. (1989) in the Gulf of Calvi from Mar to Apr 1986. With the exception of 2 peaks of chl a amounting to 1.5 pg 1 - l (Brohee et al. 1989) and being recorded during a daily sampling program in Mar 1986, their values are in close agreement with our findings, showing a similar concentration decrease in chl a (0.15 pg I-') for April 1986 as we recorded in April 1989. A point deserving attention is that lowest rates of primary production (Table 2) were measured in Jan, when chl a values were at a maximum, while in summer, with the exception of Jul 1990, primary production rates were high. As mentioned by other authors (Larsson & Hagstrom 1982, Hagstrom & Lars- son 1984, Lancelot & Billen 1984) phytoplanktonic exudate release occurs mainly in summer, thus stimulating bacterial growth but being generally lower in winter when phytoplanktonic biomass may be high but production rates are low. We speculate that the strong seasonal effect on bacterial growth is not mainly due to the effect of changing temperature but
rather to seasonal peaks of phytoplankton exudation occumng in summer.
Changes of bacterial cell volumes under low tempera- ture conditions
A contrasting situation with respect to growth rates and corresponding changes in bacterial carbon produc- tion was noted in Jan 1989. Despite an increase in cell number at all 3 depths we calculated a decrease of bacterial carbon production over the 24 h incubation period. Generation times in Jan were long (from 36 to
- 0 n
0.0192 Volume rod t o 15m F 0.0127 Volume rod t l
- 0.0461 E. lom r
B n E Volume cocci t o
15m 0.01B3 Volume cocci t 0.0204
P 0,018 W Volume curv.rod t o 15m
0.0124 Volume C U N . ~ O ~ t l "
n
g l am 0.0178
r Volume spirillae to K Volume spirillae t l
0.02 0.04 0.06 0.08 0.10 0.12
Mean volume (p?)
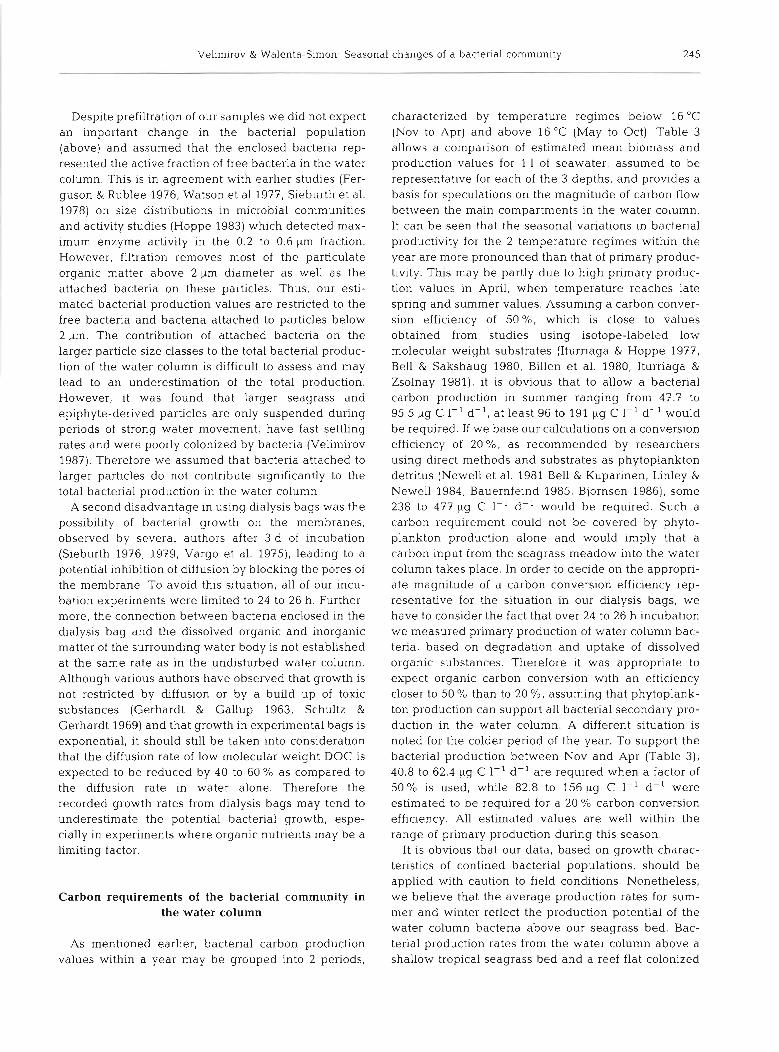
Fig. 6. Comparison of cell volumes for the bacteria morpho- types at beginning and at end of dalysis incubation experi- ments at 3 depths in January 1989. to: bacterial volume at beginning of incubation experiment; t l : bacterial volume at
end of incubation experiment; tl-to =24 h
244 Mar. Ecol. Prog. Ser.
259 h), FDC ranged from 1.8?/0 of 4.8 % but bacterial carbon production was negative. The analysis of bac- terial cell volumes showed that the volumes of most morphotypes decreased over the incubation time (Fig. 6). The volume change was most pronounced for rods at the 5 m and 10 m depths with a decrease by more than one-half. A significant decrease in mean cell volume of rods was detected at 5 m (F = 17.5, n = 200, p<0.01) , at 10 m (F = 3.25, n = 180, pC0.01) and at 15 m (F = 6.00, n = 200. p <0.01). A similar situation was observed for curved rods, where mean cell vol- umes were significantly smaller after the incubation a t all depths. For cocci, a significant decrease in mean cell volume was observed for the 5 and 10 m depths, but could not be confirmed for the 15 m depth (F = 0.857, n = 190, p>0.1). Spirillae were shown to decrease significantly in volume at 5 m (F = 10, n = 140, p t 0 . 0 1 ) but at 10 m and 15 m station significant vol- ume differences could not be confirmed. Such observa- tions were never made for summer incubations, and in most experiments from Jun to Oct we recorded increas- ing mean cell volumes a s well a s increasing cell num- bers. The tendency of decreasing cell volumes during the winter seasons is confirmed by the variation of the average bacterial cell volume over the seasons at the 5 m depth (Fig. 4) and at least partly supported by the volumes recorded in unfiltered water in Jan and Apr 1989 at the 15 m depth. This appearance of small cell volumes during winter incubations could indicate that bacteria display different growth strategies over the year. Previous to this study, only the increase of bac- terial cell volumes under experimental conditions, where predation pressure is reduced by filtration of the water samples, was recorded on several occasions by various authors for dialysis experiments and seawater cultures (Turley & Lochte 1985, 1986, Herndl & Malacic 1987, Velimirov 1989). However, there is no indication that the bacterial volume decrease for the winter incu- bation experiments is related to higher grazing rates on bacteria compared to the other experiments. All water samples were treated with the same filtration proce- dure, and heterotrophic flagellates which passed the 2 wm pore size filter did not increase in abundance during the experimentation time. In unfiltered samples used for determination of bacterial abundance and biomass we found low densities of ciliates (4 to 10 ciliates ml-l) and heterotrophic flagellates ranging from 70 to 100 individuals ml-l. Filtration of these samples removed all ciliates and reduced the flagel- lates on average to 15 ml-' In most samples taken in Jan, flagellate density after filtration was < 7 ml-' with- out a noticeable increase in number after the incu- bation period. This observation was confirmed by our seawater culture experiments where an increase of flagellates could only be recorded after 52 h (Velimirov
& Walenta-Simon unpubl.). The decrease of cell vol- ume was not restricted to the winter period and also took place in Apr 1989 at the 10 and 15 m depths. We hypothezised that an increase in bacterial number together with a decrease in size may be an appropriate growth strategy under unfavorable environmental conditions. Despite an overall loss of carbon during the process of cell division, the favorable surface-to- volume ratio resulting from the decrease in size may be of advantage to harvest dissolved organic and inor- ganic nutrients under oligotrophic conditions. Further- more, environmental events leading to an increase of exudates resulting from occasional bursts of phyto- plankton production in winter due to input of inorganic nutrients by upwelled water (Brohee et al. 1989) or resuspension of sediments and pore water nutrients due to winter storms can be used efficiently by a population dominated by small bacteria. The phenomenon of non-growth (Kjelleberg et a.1. 1983, 1987, Giide 1990) or decreasing cell volume by marine bacteria was repeatedly observed in laboratory experi- ments as a response to starvation (Novitsky & Morita 1978, Amy & Morita, 1983) and could be triggered by reducing nutrient levels in culture media of various Vibno species (Hood et al. 1986). Also, fast recovery from nutnent starvation was observed for marine psychrophilic Vibrio species, and a doubling of cell volume was recorded 8 h after nutrient addition (Amy et al. 1983). These experiments support our speculation based on observations from in sifu experiments with dialysis bags that cell volume reduction of bacteria during periods of low temperature and low primary production in the water column may be a strategy enabling bacteria to resist starvation and increase their potential for a competitive advantage in nutrient scavenging.
Implications of incubation experiments with dialysis bags
Before attempting to use data from dialysis bag experlrnents for a more generalized view of the bac- terial production in the water column, it was necessary to consider a number of methodological implications. We were able to record direct changes in cell number and biovolume by using dialysis bags because bags possess a combination of qualities necessary for bac- terial incubation experlments in situ such as steriliza- bility, strength of the membranes and good diffusivity (for details see Turley & Lochte 1985). Possible disad- vantages include the filtration process before incuba- tion and the enclosure conditions of the bacterial popu- lation resulting from membrane characteristics of the bags.
Velimirov & Walenta-Simon: Season a1 changes of a bacterial community 24 5
Despite prefiltration of our samples we did not expect an important change in the bacterial population (above) and assumed that the enclosed bacteria rep- resented the active fraction of free bacteria in the water column. This is in agreement with earlier studies (Fer- guson & Rublee 1976, Watson et al 1977, Sieburth et al. 1978) on size distributions in microbial communities and activity studies (Hoppe 1983) which detected max- imum enzyme activity in the 0.2 to 0.6 pm fraction. However, filtration removes most of the particulate organic matter above 2 ,pm diameter as well as the attached bacteria on these particles. Thus, our esti- mated bacterial production values are restricted to the free bacteria and bacteria attached to particles below 2 pm. The contribution of attached bacteria on the larger particle size classes to the total bacterial produc- tion of the water column is difficult to assess and may lead to an underestimation of the total production. However, it was found that larger seagrass and epiphyte-derived particles are only suspended during periods of strong water movement, have fast settling rates and were poorly colonized by bacteria (Velimirov 1987). Therefore we assumed that bacteria attached to larger particles do not contribute significantly to the total bacterial production in the water column.
A second disadvantage in using dialysis bags was the possibility of bacterial growth on the membranes, observed by several authors after 3 d of incubation (Sieburth 1976, 1979, Vargo et al. 1975), leading to a potential inhibition of diffusion by blocking the pores of the membrane. To avoid this situation, all of our incu- bation experiments were limited to 24 to 26 h. Further- more, the connection between bacteria enclosed in the dialysis bag and the dissolved organic and inorganic matter of the surrounding water body is not established at the same rate as in the undisturbed water column. Although various authors have observed that growth is not restricted by diffusion or by a build up of toxic substances (Gerhardt & Gallup 1963, Schultz & Gerhardt 1969) and that growth in experimental bags is exponential, it should still be taken into consideration that the diffusion rate of low molecular weight DOC is expected to be reduced by 40 to 60 O/O as compared to the diffusion rate in water alone. Therefore the recorded growth rates from dialysis bags may tend to underestimate the potential bacterial growth, espe- cially in experiments where organic nutrients may be a limiting factor.
Carbon requirements of the bacterial community in the water column
As mentioned earlier, bacterial carbon production values within a year may be grouped into 2 periods,
characterized by temperature regimes below 16 "C (Nov to Apr) and above 16°C (May to Oct). Table 3 allows a comparison of estimated mean biomass and production values for 1 1 of seawater, assumed to be representative for each of the 3 depths, and provides a basis for speculations on the magnitude of carbon flow between the main compartments in the water column. It can be seen that the seasonal variations in bacterial productivity for the 2 temperature regimes within the year are more pronounced than that of primary produc- tivity. This may be partly due to high primary produc- tion values in April, when temperature reaches late spring and summer values. Assuming a carbon conver- sion efficiency of 50 %, which is close to values obtained from studies using isotope-labeled low molecular weight substrates (Iturriaga & Hoppe 1977, Bell & Sakshaug 1980, Billen e t al. 1980, Iturriaga & Zsolnay 1981), it is obvious that to allow a bacterial carbon production in summer ranging from 47.7 to 95.5 pg C 1-l d- ' , at least 96 to 191 pg C 1-' d-' would be required. If we base our calculations on a conversion efficiency of 20°/0, as recommended by researchers using direct methods and substrates as phytoplankton detritus (Newel1 et al. 1981 Bell & Kuparinen, Linley & Newel1 1984, Bauernfeind 1985, Bjornsen 1986), some 238 to 477 pg C 1-' d-l would be required. Such a carbon requirement could not be covered by phyto- plankton production alone and would imply that a carbon input from the seagrass meadow into the water column takes place. In order to decide on the appropri- ate magnitude of a carbon conversion efficiency rep- resentative for the situation in our dialysis bags, we have to consider the fact that over 24 to 26 h incubation we measured primary production of water column bac- teria, based on degradation and uptake of dissolved organic substances. Therefore it was appropriate to expect organic carbon conversion with a n efficiency closer to 50 % than to 20 %, assuming that phytoplank- ton production can support all bacterial secondary pro- duction in the water column. A different situation is noted for the colder period of the year. To support the bacterial production between Nov and Apr (Table 3), 40.8 to 62.4 pg C 1-' d- ' are required when a factor of 50% is used, while 82.8 to 156 pg C 1-' d- ' were estimated to be required for a 20 % carbon conversion efficiency. All estimated values are well within the range of primary production during this season.
It is obvious that our data, based on growth charac- teristics of confined bacterial populations, should be applied with caution to field conditions. Nonetheless, we believe that the average production rates for sum- mer and winter reflect the production potential of the water column bacteria above our seagrass bed. Bac- terial production rates from the water column above a shallow tropical seagrass bed and a reef flat colonized

246 Mar. Ecol. Prog. Ser. 80: 237-248, 1992
Table 3. Comparison of averaged values for heterotrophic bacteria biomass (HBB), bacterial secondary production (BSP) and primary production for periods of high (> 16 "C) and low (< 16 "C) temperature regimes over a year at the 3 depths
Depth HBB (pg C I-') BSP (pg C I-' d-l) PP' (pg C I-' d-') Mean Range Mean Range Mean Range
May to October (Temperature > 16 "C) 5 m 14.47 3.08 - 40.54 95.52 38.64 - 236.16 229.48 94.76 - 324.31
10 m 13.72 1.10 - 45.17 67.69 9.84 - 116.64 192.07 113.45 - 345.02 15 m 13.55 0.59 - 67.55 47.76 19.44 - 81.12 164.08 94.60 - 222.88
November to April (Temperature < 16 "C) 5 m 11.29 2.12 - 31.32 31.20 23.76 - 38.64 172.72 101.84 - 244.30
10 m 10.41 2.74 - 32.62 16.20 4.08 - 23.76 158.91 109.95 - 213.74 15 m 8.66 2.74 - 18.40 20.40 6.72 - 40.08 197.17 76.89 - 317.58
Daily primary productivity was estimated assuming that mean rates measured over the incubation interval are representative for the photoperiod of the day (Murray & Wetzel 1987), which we defined as 90 % of daylight hours, ranging from 8.53 h in Jan to 12.44 h in Jul. Information on total dayhght hours for the northwest coast of Corsica was obtained from the meteorological station-airport St. CathrineKalvi
b y seagrass (Moriarty et a l . 1990) r a n g e d from 12 to
72 p g C 1-' day- ' , which is i n a g r e e m e n t with a v e r a g e d ra tes ob ta ined from dialysis b a g exper iments , wi th t h e
except ion of t h e h igher values a t 5 m, moni tored dur ing
t h e s u m m e r t empera tu re reg ime . Also, t h e bacter ia l product ion r a n g e from a sal tmarsh sys tem domina ted
b y Spartina w a s 36 to 242.4 p g C 1-' day- ' (Newel1 et al. 1983), similar to t h e product ion r a n g e s from our s u m m e r exper iments . A comparison of our da ta with
bacter ia l product ion r a n g e s ob ta ined in o t h e r ecosys-
t e m s s h o w s t h a t h i g h rates w e r e a lso reported b y
Vyshkvartsev (1980) w h o monitored t h e inc rease i n biovolume, b y Newell & Christian (1981) w h o u s e d
f requency of dividing cells to es t imate product ion ra tes ,
a n d S iebur th et al. (1977) w h o recorded ATP increase
i n diffusion cultures. Preliminary results f rom o u r sea- w a t e r cul ture exper iments (unpubl . da ta ) seem to con- firm o u r product ion es t imates for bo th t h e s u m m e r a n d
winter season .
Acknowledgements. This work was supported by the Fonds zur Forderung der wissenschaftlichen Forschung Projekt Nr. P 6559 B. We thank R. J. Chrost and 3 anonymous referees for comments and constructive criticism on the manuscript, STARES0 SA. for providing laboratory facilities, A. Thlry, F. Wernerus and D. Bay for boat and diving assistance and K. Hallmann for help in preparing the manuscript.
LITERATURE CITED
Amy, P. S., Morita, R. Y. (1983). Starvation-survival patterns of sixteen freshly isolated open-ocean bacteria. Appl. envi- ron. Microbiol. 45: 1109-1115
Amy. P. S., Pauling, C., Morita, R. Y (1983). Recovery from nutrient starvation by a marine Vibno sp. Appl. environ. Microbiol. 45: 1685-1690
Bauerfeind, S. (1985) Degradation of phytoplankton detntus by bacteria: estimation of bacterial consumption and respira- tion in an oxygen chamber. Mar. Ecol. Prog. Ser. 10: 257-263
Bay, D. (1984). A field study of the growth dynamics and productivity of Posidonia oceanica (L) DELILE in Calvi Bay, Corsica. Aquat Bot 20: 42-64
Bell, R. T., Kuparinen, J (1984). Assessing phytoplankton and bacterioplankton production during early spring in Lake Erken, Sweden. Appl. environ. Microbiol. 48: 1221-1230
Bell, W. H., Sakshaug, E. (1980). Bacterial utilization of algal extracellular products. 2. A kinetic study on natural popu- la t ion~. Limnol. Oceanogr. 25: 1021-1033
Bender, M., Grande, K., Johnson, K . , Marra, J . , Williams, P. J. leB., Sieburth, J., P~lson, M., Langdon. C , Hitchcock, G . , Orchado, J., Hunt, C., Donaghay, P., Heinemann. K. (1987). A comparison of four methods for determining planktonic community production. Limnol. Oceanogr. 32: 1085-1098
Benner, R., Moran, M. A., Hodson, R. E (1986). Biogeochemi- cal cycling of lignocellulosic carbon in marine and fresh- water ecosystems: relat~ve contribution of procaryotes and eucaryotes. Limnol. Oceanogr. 31: 89-100
Billen, G., Joiris, C., Wijnant, J., Gillian, G. (1980). Concen- trations and microbiological utdization of small organic molecules in Scheldt Estuary, the Belgian Coastal zone and the English Channel. Estuar, coast. mar. Sci. 11: 279-294
Bjornsen, P. K. (1986). Bacterioplankton growth yield in con- tinuous seawater cultures. Mar. Ecol. Prog. Ser. 30: 191-196
Bratbak, G. (1985). Bacterial biolvolume and biomass estima- tions Appl. environ. Microbiol. 49: 1488-1493
Brohee, M , , Goffard, A., Franlugnoulle, M, , Henrl V , Mouchet, A. Hecq, J. H. (1989). Variations printanieres des communautes planctoniques en baie de Calvi (Corse) en relation avec les contraintes physiques locales. Cah. Biol. Mar. 30: 321-328
Chrost, R. J. (1981). The composition and bacterial utilization of DOC released by phytoplankton. Kieler Meeresforsch., Sonderh. 5: 325-332
Chrost, R. J., Faust, M. (1983). Organ~c carbon release by phytoplankton: its composition and utilization by bacterio- plankton. J. Plankton Res. 5: 477-493
Djenedi. S. (1985). Observations au large de Calvi (Corse) en regime d'ete. Bull. Soc. R. Sci. Liege 54: 287-300
Ferguson, R . , Rublee, P. (1976). Contr~but~on of bactena to standing crop of coastal plankton. Limnol. Oceanogr. 21 141-145
Velimirov & Walenta-Simon: Seasonal changes of a bacterial community 247
Fuhrman, J., Azam, F. (1980). Bacterioplankton secondary production estimates for coastal waters of British Colum- bia, Antarctica and California Appl environ. Microbiol 39: 1085-1091
Gerhardt, P., Gallup, D. M (1963) Dialysis flask for concen- trated culture of microorganisms J Bacterial 86: 919-929
Gude, H. (1990). Bacterial net production approaching zero - a frequent phenomenon In pelagic environments? Arch. Hydrobiol. Beih Ergeb Limnol 34. 165-169
Hagstrom, A., Larsson, U., Horstedt, P,, Normark, S. (1979). Frequency of dividing cells, a new approach to the deter- mination of bacterial growth rates in aquatic environ- ments. Appl. environ. Microbiol. 37: 805-812
Hagstrom, A., Larsson, U. (1984). Diel and seasonal variation in growth rates of pelagic bacteria. In. Hobbie, J. E., Wil- liams, P. J . leB. (eds.) Heterotrophic processes in the sea Plenum Press, New York, p. 249-262
Herndl, G . J., Malacic, V. (1987). Impact of the pycnocline layer on bacterioplancton: dial and spatlal variations in microbial parameters in the stratified water column of the Gulf of Tneste. Mar. Ecol. Prog. Ser. 38: 295-303
Hobbie, J. E., Daley, R. J , Jasper, S. (1977). Use of nuclepore filters for counting bacteria by fluorescence microscopy. Appl environ. Microblol. 33: 1225-1228
Holligan, P. M, , Wilhams, P. J. leB., Purdie, D , Harns, R. P. (1984) Photosynthesis, respiration and nitrogen supply of plankton populations In stratifled, frontal and t~dally m ~ x e d shelf waters. Mar. Ecol Prog Ser. 17: 201-213
Hood, M. A., Guckert, J B., White, D C., Deck, F. (1986) Effect of nutrlent deprivation on lipid, carbohydrate, DNA, RNA, and protein levels in Vibno cholerae Appl. environ. Microbiol. 52: 788-793
Hoppe, H. G. (1983). Significance of exoenzymatic activities in the ecology of brackish water. measurements by means of methylumbelliferylsubstrates. Mar. Ecol Prog. Ser. 11: 299-308
Iturriaga, R., Hoppe, H -G (1977). Observations of hetero- trophic activ~ty on photoassimilated matter. Mar. Biol. 40: 101-108
Iturriaga, R , Zsolny, A. (1981). Transformation of some dissol- ved organic compounds by a natural heterotrophic popula- tion. Mar. Biol. 62: 125-129
Kjelleberg, S. , Humprey, B. A., Marshall, K C. (1983). Initial phase of starvahon and activity of bacteria at surfaces Appl. environ. Microbiol. 46: 978-984
Kjelleberg, S., Hermannsson, M., Marden, P., Jones, G. W (1987) The transient phase between growth and non- growth of heterotrophic bacteria, with emphasis on the marine environment. Ann. Rev. Microbiol. 41 2 5 4 9
Krambeck, C . , Krambeck, H. J . (1984). Morphometric analysis of cell-cycle responses in bacterioplankton. Arch. Hy- droblol. 19: 11 1-118
Krambeck, C . , Krambeck, H J . , Schroder, D., Newell, Y. (1990). Sizing bacterioplankton: a juxtaposihon of bias due to shrinkage, halos, subjectivity in Image interpretation and asymetric distributions. inRetrospect 2: 5-14
Lancelot, C., Billen, G. (1984). Activity of heterotrophic bac- teria and its coupling to primary production during the spring phytoplankton bloom in the southern bight of the North Sea. L~mnol. Oceanogr 29: 721-730
Larsson, U,, Hagstrom, A. (1982). Fractionated phytopklank- ton primary produchon, exudate release, and bacterial production in a Baltic eutrophication g rad~en t . Mar. Biol. 67: 57-70
Lee, S. , Fuhrman, J . A . (1987). Relationships between biovolume and biomass of naturally derived marine bac- terioplankton. Appl. environ. Microbiol. 53: 1298-1303
Linley, E. A. S . Newell, R. C. (1984) Estimates of bacterial growth yields based on plant detritus. Bull. mar. Sci. 35. 4 0 9 4 2 5
Lochte, K., Turley, C. M. (1985). Heterotrophic activity and carbon flow via bacteria in water associated with a tidal mixing front. In: Gibbs, P. E (ed.) Proc. 19th Eur mar blol Symp Cambridge Univ. Press, Cambridge, p. 73-85
Mann, K H. (1988). Production and use of detritus in various freshwater, estuarine and coastal marine ecosystems Lim- nol. Oceanogr. 33: 910-930
Morgan, M D (1980). Grazing and predation of the grass shrimp Palaemonetes puglo. Limnol Oceanogr 25. 896-902
Morgan, M. D., Kitting, C. L. (1984) Productivity and utiliza- tion of seagrass Halodule wrightii and its attached epiphy- tes. Limnol. Oceanogr 33. 1066-1076
Moran, M. A., Hodson, R. E. (1989). Formation and bacterial utilization of dissolved organic carbon denved from detri- tal lignocellulose. L~mnol Oceanogr. 34: 1034-1047
Moriarty, D. J. W., Pollard, P. C. (1981). DNA synthesis as a measure of bacterial produchvity in seagrass sediments Mar. Ecol. Prog. Ser 5 . 151-156
Moriarty, D. J. W., Pollard, P. C (1982). Diel vanation of bac- terial productivlty In seagrass (Zostera capncorni) beds measured by rate of thymidine incorporation into DNA. Mar. Biol 72: 165-173
Moriarty, D. J. W., Roberts, D. G , Pollard, P C. (1990). Prim- ary and bacterial productivity of tropical seagrass com- munihes in the Gulf of Carpentana, Australia Mar Ecol. Prog. Ser. 61: 145-157
Munster, U., Chrost, R J (1990) Origin, composition and microbial uhlization of dissolved organic matter In: Over- beck, J . , Chrost, R. J. (eds.) Aquatic microbial ecology: biochemical and molecular approaches. Springer Verlag, New York, p. 8 4 6
Murray, L., Wetzel, L. R. (1987). Oxygen production and con- sumption associated w t h the major autotrophic compo- nents in two temperate seagrass communities. Mar. Ecol. Prog Ser 38: 231-239
Newell, R. C., Lucas, M. I , Linley, E. A. S. (1981) Rate of degradation and efficiency of conversion of phytoplankton debris by marine microorganisms. Mar Ecol. Prog. Ser. 6. 123-136
Newell, R C., Fleld, J. G . Griffiths, C. L. (1982). Energy balance and significance of microorganisms in a kelp bed community. Mar Ecol. Prog. Ser. 8 : 103-113
Newell, R. C., Linley, E. A S . , Lucas, M. I. (1983). Bacterial production and carbon conversion based on saltmarsh plant debris. Estuar coast. Shelf Sci. 17: 405-419
Newell, S. Y., Chnstian, R. R. (1981). Frequency of dlvidlng cells as a n estimator of bacterial productivity. Appl. envi- ron. M~crobiol. 42: 23-31
Novak, R. (1984). A study in ultra-ecology: microorgarusms on the seagrass Posidonia oceanica (L.) Dellle P.S.Z.N.1 Mar. Ecol. 5: 143-190
Novitsky, J. , Morita, R. Y (1978). Possible strategy for the survival of marine bacteria under starvation conditions. Mar. Biol. 48. 289-295
Ott, J. A. (1981). Adaptive strategies at the ecosystem level: examples from two benthic marine systems. P.S Z.N.I. Mar. Ecol. 2: 113-158
Ott, J., Maurer, L. (1977). Strategies on energy transfer from manne macrophytes to consumer levels: the Posidonia oceanica example. In: Keegan, B. F., Ceidigh, P. O., Boaden, P S. (eds.) Biology of b e n t h ~ c organisms. Perga- mon Press, Oxford, p. 493-502
Oudet, C., Gerard, R . , Morin, P , Gnlngue, I. (1988). Precise
Mar. Ecol. Prog. Ser. 80: 237-248, 1992
shipboard determination of dissolved oxygen (Winkler procedure) for productivity studies with a commercial sys- tem. Limnol. Oceanogr. 33: 146-150
Parsons, T R., Maita, Y., Lalli, C. M. (1985). A manual of chemical and biological methods for seawater analysis. Pergamon Press, Oxford, p. 173
Phillips, R . C., McRoy, C. P. (1980). Handbook of seagrass biology - a n ecosystem perspective. Garland STPM Press, New York
Schultz, J. S., Gerhardt, P. (1969). Dialysis culture of micro- organisms: design, theory and results. Bact. Rev. 33: 1-47
Sieburth, J . McN. (1976). Bacterial substrates and productivity in marine ecosystems. A. Rev. Ecol. Syst. 7: 259-285
Sieburth. J. McN. (1979). Sea microbes. Univ. Press. New York, p. 491
Sieburth, J . McN., Johnson, K. N., Burney, C. M. , Lavoie, D. M. (1977). Estimation of in situ rates of heterotrophy using diurnal changes in organic matter and growth rates of picoplankton in diffusion culture. Helgolander wiss. Meeresunters. 30: 565-574
Sieburth, J. McN., Smetacek, V., Lenz , J. (1978). Pelagic ecosystem structure: heterotrophic compartments of the plankton and their relationship to plankton size fractions. Limnol. Oceanogr 23: 125&1263
Traer, K.(1980). The consumption of Posidonia oceanica (L.) Delile by echinoids at the isle of Ischia. In: Jangoux, M. (ed.) Echinoderms: present and past. Balkema. Rotterdam, p. 241-244
Thayer, G. W., Adams, S. M., La Croix, M. W. (1975). Struc- tural and functional aspects of a recently established Zost- era marina community. In: Cronin, L. E. (ed.) Estuarine research, Vol. 1. Academic Press. New York, p. 518-546
Turley. C. M,. Lochte, K. (1985). Direct measurement of bac-
This manuscript was presented by G. Rheinheimer, kiel, Germany
terial productivity in stratified waters close to a front in the Irish Sea. Mar Ecol. Prog. Ser. 23. 209-219
Turley, C., Lochte, K. (1986). Die1 changes in specific growth rates and mean cell volume of natural bacterial com- munities in two different water masses in the Irish Sea. Microb. Ecol. 12: 271-282
Vargo, G. A . , Hargravees, P. E., Johnson, P. (1975). Scanning electron mlcroscopy of dialysis tubes incubated in flowing seawater. Mar Biol. 31. 113-120
Velimirov. B. (1986a). DOC dynamics in a Mediterranean seagrass system. Mar. Ecol. Prog. Ser. 28: 21-41
Velimirov, B. (1986). Plant-herbivore relationships. Mono- grafias Biologicas 4: 129-144
Velimirov, B. (1987). Organic matter derived from a seagrass meadow: Origin, properties and quality of particles. P.S.Z.N.I. Mar. Ecol. 8: 143-173
Velimirov, B. (1989). I1 ruolo dei batteri nei flussi di energia: un approccio ecosistemico. CEbalia 15: 25-46
Velimirov, B., Ott, J. A., Novak, R. (1981). Microorganisms on macrophyte debris: biodegradation and its implication in the food web. Kieler Meeresforsch., Sonderh. 5 . 333-344
Vyshkvartsev, D. I . (1980). Bacterioplankton in shallow inlets of Posyeta Bay. Microbiology 48: 603-609
Watson, S. W., Novitsky, T. J., Quinby, H. L.,Valois, F. W. (1977). Determination of bacterial number and biomass in the marine environment. Appl. environ. Microbiol 33: 940-954
Williams, P. J. LeB., Robertson, J. E. (1991). Overall planktonic oxygen and carbon dioxide metabolisms: The problem of reconciling observations and calculations of photosynthe- tic quotients. J. Plankton Res. 13: 153-169
Zimmermann, R . , Gibson, R., Harrington, J . (1979). Herbivory and detritivory among gammaridean amphipods from a Florida seagrass community. Mar. Biol. 54: 41-47
~Llanuscript first received: August 30, 1991 Revised version accepted: January 8, 1992
Related Documents