Search for Galactic PeV Gamma Rays with the IceCube Neutrino Observatory M. G. Aartsen, 2 R. Abbasi, 27 Y. Abdou, 22 M. Ackermann, 41 J. Adams, 15 J. A. Aguilar, 21 M. Ahlers, 27 D. Altmann, 9 K. Andeen, 27 J. Auffenberg, 27 X. Bai, 31, * M. Baker, 27 S. W. Barwick, 23 V. Baum, 28 R. Bay, 7 K. Beattie, 8 J. J. Beatty, 17, 18 S. Bechet, 12 J. Becker Tjus, 10 K.-H. Becker, 40 M. Bell, 38 M. L. Benabderrahmane, 41 S. BenZvi, 27 J. Berdermann, 41 P. Berghaus, 41 D. Berley, 16 E. Bernardini, 41 D. Bertrand, 12 D. Z. Besson, 25 D. Bindig, 40 M. Bissok, 1 E. Blaufuss, 16 J. Blumenthal, 1 D. J. Boersma, 39, 1 S. Bohaichuk, 20 C. Bohm, 34 D. Bose, 13 S. B¨ oser, 11 O. Botner, 39 L. Brayeur, 13 A. M. Brown, 15 R. Bruijn, 24 J. Brunner, 41 S. Buitink, 13, † M. Carson, 22 J. Casey, 5 M. Casier, 13 D. Chirkin, 27 B. Christy, 16 K. Clark, 38 F. Clevermann, 19 S. Cohen, 24 D. F. Cowen, 38, 37 A. H. Cruz Silva, 41 M. Danninger, 34 J. Daughhetee, 5 J. C. Davis, 17 C. De Clercq, 13 S. De Ridder, 22 F. Descamps, 27 P. Desiati, 27 G. de Vries-Uiterweerd, 22 T. DeYoung, 38 J. C. D´ ıaz-V´ elez, 27 J. Dreyer, 10 J. P. Dumm, 27 M. Dunkman, 38 R. Eagan, 38 J. Eisch, 27 R. W. Ellsworth, 16 O. Engdeg˚ ard, 39 S. Euler, 1 P. A. Evenson, 31 O. Fadiran, 27 A. R. Fazely, 6 A. Fedynitch, 10 J. Feintzeig, 27 T. Feusels, 22 K. Filimonov, 7 C. Finley, 34 T. Fischer-Wasels, 40 S. Flis, 34 A. Franckowiak, 11 R. Franke, 41 K. Frantzen, 19 T. Fuchs, 19 T. K. Gaisser, 31 J. Gallagher, 26 L. Gerhardt, 8, 7 L. Gladstone, 27 T. Gl¨ usenkamp, 41 A. Goldschmidt, 8 G. Golup, 13 J. A. Goodman, 16 D. G´ ora, 41 D. Grant, 20 A. Groß, 30 S. Grullon, 27 M. Gurtner, 40 C. Ha, 8, 7 A. Haj Ismail, 22 A. Hallgren, 39 F. Halzen, 27 K. Hanson, 12 D. Heereman, 12 P. Heimann, 1 D. Heinen, 1 K. Helbing, 40 R. Hellauer, 16 S. Hickford, 15 G. C. Hill, 2 K. D. Hoffman, 16 R. Hoffmann, 40 A. Homeier, 11 K. Hoshina, 27 W. Huelsnitz, 16, ‡ P. O. Hulth, 34 K. Hultqvist, 34 S. Hussain, 31 A. Ishihara, 14 E. Jacobi, 41 J. Jacobsen, 27 G. S. Japaridze, 4 O. Jlelati, 22 A. Kappes, 9 T. Karg, 41 A. Karle, 27 J. Kiryluk, 35 F. Kislat, 41 J. Kl¨ as, 40 S. R. Klein, 8, 7 J.-H. K¨ ohne, 19 G. Kohnen, 29 H. Kolanoski, 9 L. K¨ opke, 28 C. Kopper, 27 S. Kopper, 40 D. J. Koskinen, 38 M. Kowalski, 11 M. Krasberg, 27 G. Kroll, 28 J. Kunnen, 13 N. Kurahashi, 27 T. Kuwabara, 31 M. Labare, 13 H. Landsman, 27 M. J. Larson, 36 R. Lauer, 41 M. Lesiak-Bzdak, 35 J. L¨ unemann, 28 J. Madsen, 33 R. Maruyama, 27 K. Mase, 14 H. S. Matis, 8 F. McNally, 27 K. Meagher, 16 M. Merck, 27 P. M´ esz´ aros, 37, 38 T. Meures, 12 S. Miarecki, 8, 7 E. Middell, 41 N. Milke, 19 J. Miller, 13 L. Mohrmann, 41 T. Montaruli, 21, § R. Morse, 27 R. Nahnhauer, 41 U. Naumann, 40 S. C. Nowicki, 20 D. R. Nygren, 8 A. Obertacke, 40 S. Odrowski, 30 A. Olivas, 16 M. Olivo, 10 A. O’Murchadha, 12 S. Panknin, 11 L. Paul, 1 J. A. Pepper, 36 C. P´ erez de los Heros, 39 D. Pieloth, 19 N. Pirk, 41 J. Posselt, 40 P. B. Price, 7 G. T. Przybylski, 8 L. R¨ adel, 1 K. Rawlins, 3 P. Redl, 16 E. Resconi, 30 W. Rhode, 19 M. Ribordy, 24 M. Richman, 16 B. Riedel, 27 J. P. Rodrigues, 27 F. Rothmaier, 28 C. Rott, 17 T. Ruhe, 19 B. Ruzybayev, 31 D. Ryckbosch, 22 S. M. Saba, 10 T. Salameh, 38 H.-G. Sander, 28 M. Santander, 27 S. Sarkar, 32 K. Schatto, 28 M. Scheel, 1 F. Scheriau, 19 T. Schmidt, 16 M. Schmitz, 19 S. Schoenen, 1 S. Sch¨ oneberg, 10 L. Sch¨ onherr, 1 A. Sch¨ onwald, 41 A. Schukraft, 1 L. Schulte, 11 O. Schulz, 30 D. Seckel, 31 S. H. Seo, 34 Y. Sestayo, 30 S. Seunarine, 33 C. Sheremata, 20 M. W. E. Smith, 38 M. Soiron, 1 D. Soldin, 40 G. M. Spiczak, 33 C. Spiering, 41 M. Stamatikos, 17, ¶ T. Stanev, 31 A. Stasik, 11 T. Stezelberger, 8 R. G. Stokstad, 8 A. St¨ oßl, 41 E. A. Strahler, 13 R. Str¨ om, 39 G. W. Sullivan, 16 H. Taavola, 39 I. Taboada, 5 A. Tamburro, 31 S. Ter-Antonyan, 6 S. Tilav, 31 P. A. Toale, 36 S. Toscano, 27 M. Usner, 11 D. van der Drift, 8, 7 N. van Eijndhoven, 13 A. Van Overloop, 22 J. van Santen, 27 M. Vehring, 1 M. Voge, 11 M. Vraeghe, 22 C. Walck, 34 T. Waldenmaier, 9 M. Wallraff, 1 M. Walter, 41 R. Wasserman, 38 Ch. Weaver, 27 C. Wendt, 27 S. Westerhoff, 27 N. Whitehorn, 27 K. Wiebe, 28 C. H. Wiebusch, 1 D. R. Williams, 36 H. Wissing, 16 M. Wolf, 34 T. R. Wood, 20 K. Woschnagg, 7 C. Xu, 31 D. L. Xu, 36 X. W. Xu, 6 J. P. Yanez, 41 G. Yodh, 23 S. Yoshida, 14 P. Zarzhitsky, 36 J. Ziemann, 19 S. Zierke, 1 A. Zilles, 1 and M. Zoll 34 (IceCube Collaboration) 1 III. Physikalisches Institut, RWTH Aachen University, D-52056 Aachen, Germany 2 School of Chemistry & Physics, University of Adelaide, Adelaide SA, 5005 Australia 3 Dept. of Physics and Astronomy, University of Alaska Anchorage, 3211 Providence Dr., Anchorage, AK 99508, USA 4 CTSPS, Clark-Atlanta University, Atlanta, GA 30314, USA 5 School of Physics and Center for Relativistic Astrophysics, Georgia Institute of Technology, Atlanta, GA 30332, USA 6 Dept. of Physics, Southern University, Baton Rouge, LA 70813, USA 7 Dept. of Physics, University of California, Berkeley, CA 94720, USA 8 Lawrence Berkeley National Laboratory, Berkeley, CA 94720, USA 9 Institut f¨ ur Physik, Humboldt-Universit¨at zu Berlin, D-12489 Berlin, Germany 10 Fakult¨atf¨ ur Physik & Astronomie, Ruhr-Universit¨ at Bochum, D-44780 Bochum, Germany 11 Physikalisches Institut, Universit¨at Bonn, Nussallee 12, D-53115 Bonn, Germany 12 Universit´ e Libre de Bruxelles, Science Faculty CP230, B-1050 Brussels, Belgium 13 Vrije Universiteit Brussel, Dienst ELEM, B-1050 Brussels, Belgium 14 Dept. of Physics, Chiba University, Chiba 263-8522, Japan arXiv:1210.7992v1 [astro-ph.HE] 30 Oct 2012

Welcome message from author
This document is posted to help you gain knowledge. Please leave a comment to let me know what you think about it! Share it to your friends and learn new things together.
Transcript

Search for Galactic PeV Gamma Rays with the IceCube Neutrino Observatory
M. G. Aartsen,2 R. Abbasi,27 Y. Abdou,22 M. Ackermann,41 J. Adams,15 J. A. Aguilar,21 M. Ahlers,27
D. Altmann,9 K. Andeen,27 J. Auffenberg,27 X. Bai,31, ∗ M. Baker,27 S. W. Barwick,23 V. Baum,28 R. Bay,7
K. Beattie,8 J. J. Beatty,17, 18 S. Bechet,12 J. Becker Tjus,10 K.-H. Becker,40 M. Bell,38 M. L. Benabderrahmane,41
S. BenZvi,27 J. Berdermann,41 P. Berghaus,41 D. Berley,16 E. Bernardini,41 D. Bertrand,12 D. Z. Besson,25
D. Bindig,40 M. Bissok,1 E. Blaufuss,16 J. Blumenthal,1 D. J. Boersma,39, 1 S. Bohaichuk,20 C. Bohm,34 D. Bose,13
S. Boser,11 O. Botner,39 L. Brayeur,13 A. M. Brown,15 R. Bruijn,24 J. Brunner,41 S. Buitink,13, † M. Carson,22
J. Casey,5 M. Casier,13 D. Chirkin,27 B. Christy,16 K. Clark,38 F. Clevermann,19 S. Cohen,24 D. F. Cowen,38, 37
A. H. Cruz Silva,41 M. Danninger,34 J. Daughhetee,5 J. C. Davis,17 C. De Clercq,13 S. De Ridder,22 F. Descamps,27
P. Desiati,27 G. de Vries-Uiterweerd,22 T. DeYoung,38 J. C. Dıaz-Velez,27 J. Dreyer,10 J. P. Dumm,27
M. Dunkman,38 R. Eagan,38 J. Eisch,27 R. W. Ellsworth,16 O. Engdegard,39 S. Euler,1 P. A. Evenson,31
O. Fadiran,27 A. R. Fazely,6 A. Fedynitch,10 J. Feintzeig,27 T. Feusels,22 K. Filimonov,7 C. Finley,34
T. Fischer-Wasels,40 S. Flis,34 A. Franckowiak,11 R. Franke,41 K. Frantzen,19 T. Fuchs,19 T. K. Gaisser,31
J. Gallagher,26 L. Gerhardt,8, 7 L. Gladstone,27 T. Glusenkamp,41 A. Goldschmidt,8 G. Golup,13 J. A. Goodman,16
D. Gora,41 D. Grant,20 A. Groß,30 S. Grullon,27 M. Gurtner,40 C. Ha,8, 7 A. Haj Ismail,22 A. Hallgren,39
F. Halzen,27 K. Hanson,12 D. Heereman,12 P. Heimann,1 D. Heinen,1 K. Helbing,40 R. Hellauer,16 S. Hickford,15
G. C. Hill,2 K. D. Hoffman,16 R. Hoffmann,40 A. Homeier,11 K. Hoshina,27 W. Huelsnitz,16, ‡ P. O. Hulth,34
K. Hultqvist,34 S. Hussain,31 A. Ishihara,14 E. Jacobi,41 J. Jacobsen,27 G. S. Japaridze,4 O. Jlelati,22 A. Kappes,9
T. Karg,41 A. Karle,27 J. Kiryluk,35 F. Kislat,41 J. Klas,40 S. R. Klein,8, 7 J.-H. Kohne,19 G. Kohnen,29
H. Kolanoski,9 L. Kopke,28 C. Kopper,27 S. Kopper,40 D. J. Koskinen,38 M. Kowalski,11 M. Krasberg,27 G. Kroll,28
J. Kunnen,13 N. Kurahashi,27 T. Kuwabara,31 M. Labare,13 H. Landsman,27 M. J. Larson,36 R. Lauer,41
M. Lesiak-Bzdak,35 J. Lunemann,28 J. Madsen,33 R. Maruyama,27 K. Mase,14 H. S. Matis,8 F. McNally,27
K. Meagher,16 M. Merck,27 P. Meszaros,37, 38 T. Meures,12 S. Miarecki,8, 7 E. Middell,41 N. Milke,19 J. Miller,13
L. Mohrmann,41 T. Montaruli,21, § R. Morse,27 R. Nahnhauer,41 U. Naumann,40 S. C. Nowicki,20 D. R. Nygren,8
A. Obertacke,40 S. Odrowski,30 A. Olivas,16 M. Olivo,10 A. O’Murchadha,12 S. Panknin,11 L. Paul,1 J. A. Pepper,36
C. Perez de los Heros,39 D. Pieloth,19 N. Pirk,41 J. Posselt,40 P. B. Price,7 G. T. Przybylski,8 L. Radel,1 K. Rawlins,3
P. Redl,16 E. Resconi,30 W. Rhode,19 M. Ribordy,24 M. Richman,16 B. Riedel,27 J. P. Rodrigues,27 F. Rothmaier,28
C. Rott,17 T. Ruhe,19 B. Ruzybayev,31 D. Ryckbosch,22 S. M. Saba,10 T. Salameh,38 H.-G. Sander,28
M. Santander,27 S. Sarkar,32 K. Schatto,28 M. Scheel,1 F. Scheriau,19 T. Schmidt,16 M. Schmitz,19 S. Schoenen,1
S. Schoneberg,10 L. Schonherr,1 A. Schonwald,41 A. Schukraft,1 L. Schulte,11 O. Schulz,30 D. Seckel,31 S. H. Seo,34
Y. Sestayo,30 S. Seunarine,33 C. Sheremata,20 M. W. E. Smith,38 M. Soiron,1 D. Soldin,40 G. M. Spiczak,33
C. Spiering,41 M. Stamatikos,17, ¶ T. Stanev,31 A. Stasik,11 T. Stezelberger,8 R. G. Stokstad,8 A. Stoßl,41
E. A. Strahler,13 R. Strom,39 G. W. Sullivan,16 H. Taavola,39 I. Taboada,5 A. Tamburro,31 S. Ter-Antonyan,6
S. Tilav,31 P. A. Toale,36 S. Toscano,27 M. Usner,11 D. van der Drift,8, 7 N. van Eijndhoven,13 A. Van Overloop,22
J. van Santen,27 M. Vehring,1 M. Voge,11 M. Vraeghe,22 C. Walck,34 T. Waldenmaier,9 M. Wallraff,1 M. Walter,41
R. Wasserman,38 Ch. Weaver,27 C. Wendt,27 S. Westerhoff,27 N. Whitehorn,27 K. Wiebe,28 C. H. Wiebusch,1
D. R. Williams,36 H. Wissing,16 M. Wolf,34 T. R. Wood,20 K. Woschnagg,7 C. Xu,31 D. L. Xu,36 X. W. Xu,6
J. P. Yanez,41 G. Yodh,23 S. Yoshida,14 P. Zarzhitsky,36 J. Ziemann,19 S. Zierke,1 A. Zilles,1 and M. Zoll34
(IceCube Collaboration)1III. Physikalisches Institut, RWTH Aachen University, D-52056 Aachen, Germany
2School of Chemistry & Physics, University of Adelaide, Adelaide SA, 5005 Australia3Dept. of Physics and Astronomy, University of Alaska Anchorage,
3211 Providence Dr., Anchorage, AK 99508, USA4CTSPS, Clark-Atlanta University, Atlanta, GA 30314, USA5School of Physics and Center for Relativistic Astrophysics,Georgia Institute of Technology, Atlanta, GA 30332, USA
6Dept. of Physics, Southern University, Baton Rouge, LA 70813, USA7Dept. of Physics, University of California, Berkeley, CA 94720, USA8Lawrence Berkeley National Laboratory, Berkeley, CA 94720, USA
9Institut fur Physik, Humboldt-Universitat zu Berlin, D-12489 Berlin, Germany10Fakultat fur Physik & Astronomie, Ruhr-Universitat Bochum, D-44780 Bochum, Germany
11Physikalisches Institut, Universitat Bonn, Nussallee 12, D-53115 Bonn, Germany12Universite Libre de Bruxelles, Science Faculty CP230, B-1050 Brussels, Belgium
13Vrije Universiteit Brussel, Dienst ELEM, B-1050 Brussels, Belgium14Dept. of Physics, Chiba University, Chiba 263-8522, Japan
arX
iv:1
210.
7992
v1 [
astr
o-ph
.HE
] 3
0 O
ct 2
012

2
15Dept. of Physics and Astronomy, University of Canterbury, Private Bag 4800, Christchurch, New Zealand16Dept. of Physics, University of Maryland, College Park, MD 20742, USA17Dept. of Physics and Center for Cosmology and Astro-Particle Physics,
Ohio State University, Columbus, OH 43210, USA18Dept. of Astronomy, Ohio State University, Columbus, OH 43210, USA
19Dept. of Physics, TU Dortmund University, D-44221 Dortmund, Germany20Dept. of Physics, University of Alberta, Edmonton, Alberta, Canada T6G 2G7
21Departement de physique nucleaire et corpusculaire,Universite de Geneve, CH-1211 Geneve, Switzerland
22Dept. of Physics and Astronomy, University of Gent, B-9000 Gent, Belgium23Dept. of Physics and Astronomy, University of California, Irvine, CA 92697, USA
24Laboratory for High Energy Physics, Ecole Polytechnique Federale, CH-1015 Lausanne, Switzerland25Dept. of Physics and Astronomy, University of Kansas, Lawrence, KS 66045, USA
26Dept. of Astronomy, University of Wisconsin, Madison, WI 53706, USA27Dept. of Physics and Wisconsin IceCube Particle Astrophysics Center,
University of Wisconsin, Madison, WI 53706, USA28Institute of Physics, University of Mainz, Staudinger Weg 7, D-55099 Mainz, Germany
29Universite de Mons, 7000 Mons, Belgium30T.U. Munich, D-85748 Garching, Germany
31Bartol Research Institute and Department of Physics and Astronomy,University of Delaware, Newark, DE 19716, USA
32Dept. of Physics, University of Oxford, 1 Keble Road, Oxford OX1 3NP, UK33Dept. of Physics, University of Wisconsin, River Falls, WI 54022, USA
34Oskar Klein Centre and Dept. of Physics, Stockholm University, SE-10691 Stockholm, Sweden35Department of Physics and Astronomy, Stony Brook University, Stony Brook, NY 11794-3800, USA
36Dept. of Physics and Astronomy, University of Alabama, Tuscaloosa, AL 35487, USA37Dept. of Astronomy and Astrophysics, Pennsylvania State University, University Park, PA 16802, USA
38Dept. of Physics, Pennsylvania State University, University Park, PA 16802, USA39Dept. of Physics and Astronomy, Uppsala University, Box 516, S-75120 Uppsala, Sweden
40Dept. of Physics, University of Wuppertal, D-42119 Wuppertal, Germany41DESY, D-15735 Zeuthen, Germany
(Dated: October 31, 2012)
Gamma-ray induced air showers are notable for their lack of muons, compared to hadronic showers.Hence, air shower arrays with large underground muon detectors can select a sample greatly enrichedin photon showers by rejecting showers containing muons. IceCube is sensitive to muons withenergies above ∼500 GeV at the surface, which provides an efficient veto system for hadronic airshowers with energies above 1 PeV. One year of data from the 40-string IceCube configuration wasused to perform a search for point sources and a Galactic diffuse signal. No sources were found,resulting in a 90% C.L. upper limit on the ratio of gamma rays to cosmic rays of 1.2 × 10⁻³ for theflux coming from the Galactic Plane region ( −80◦ <∼ l <∼ −30◦; −10◦ <∼ b <∼ 5◦) in the energy range
1.2 – 6.0 PeV. In the same energy range, point source fluxes with E−2 spectra have been excluded ata level of (E/TeV)2dΦ/dE ∼ 10−12 − 10−11 cm−2s−1TeV−1 depending on source declination. Thecomplete IceCube detector will have a better sensitivity, due to the larger detector size, improvedreconstruction and vetoing techniques. Preliminary data from the nearly-final IceCube detectorconfiguration has been used to estimate the 5 year sensitivity of the full detector. It is found tobe more than an order of magnitude better, allowing the search for PeV extensions of known TeVgamma-ray emitters.
I. INTRODUCTION
Gamma-rays are an important tool for studying thecosmos; unlike cosmic rays (CRs), they point back to
∗ Physics Department, South Dakota School of Mines and Tech-nology, Rapid City, SD 57701, USA† corresponding author: [email protected], University of Groningen, Zernikelaan 25, 9747 AA Gronin-gen, Netherlands‡ Los Alamos National Laboratory, Los Alamos, NM 87545, USA§ also Sezione INFN, Dipartimento di Fisica, I-70126, Bari, Italy¶ NASA Goddard Space Flight Center, Greenbelt, MD 20771, USA
their sources and can identify remote acceleration re-gions. Air Cherenkov telescopes have identified numer-ous sources of high-energy (E > 1 TeV) gamma-rays (seee.g. [1]): within our galaxy, gamma-rays have been ob-served coming from supernova remnants (SNRs), pulsarwind nebulae (PWNe), binary systems, and the GalacticCenter. Extra-galactic sources include starburst galaxiesand Active Galactic Nuclei (AGNs). Surface air-showerarrays like Milagro have performed all-sky searches forTeV gamma-rays. Although these detectors are less sen-sitive to point sources than Air Cherenkov telescopes,they have identified several Galactic pointlike and ex-tended sources [2]. Interactions of CRs with interstellar

3
matter and radiation in the Galaxy produce a diffuse flux.Hadrons interacting with matter produce neutral pions,which decay into gamma rays, while CR electrons pro-duce gamma-rays via inverse Compton scattering on theradiation field. Milagro has measured this diffuse Galac-tic flux in the TeV energy range with a median energyof 15 TeV and reported an excess in the Cygnus region,which might originate from CRs from local sources inter-acting with interstellar dust clouds [3]. IceCube’s prede-cessor AMANDA-II has also looked for TeV photons froma giant flare from SGR 1806-20, using 100 GeV muons.AMANDA’s large muon collection area compensated forthe small cross-section for photons to produce muons [4].
At higher energies, extra-galactic sources are unlikelyto be visible, because more energetic photons are pre-dicted to interact with cosmic microwave background ra-diation (CMBR), and with infrared starlight from earlygalaxies, producing e+e− pairs [5]. At 1 PeV, for exam-ple, photon propagation is limited to a range of about 10kpc. It is unknown whether Galactic accelerators existthat can produce gamma rays of such high energy, butan expected flux results from interaction of (extragalac-tic) CRs with the interstellar medium (ISM) and densemolecular clouds.
To date, the best statistics on photons with energiesin the range from ∼300 TeV to several PeVs come fromthe Chicago Air Shower Array - Michigan Muon Array(CASA-MIA), built at the Dugway Proving Ground inUtah. CASA consisted of 1089 scintillation detectorsplaced on a square array with 15 m spacing. MIA con-sisted of 1024 scintillation counters buried under about3 m of earth, covering an area of 2500 m2. It served as amuon veto, with a threshold of about 0.8 GeV.
CASA-MIA set a limit on the fraction of photons inthe cosmic-ray flux of 10−4 at energies above 600 TeV[6]. The experiment also sets a limit of 2.4× 10⁻⁵ on thefraction of photons in the CR flux coming from within 5◦
of the galactic disk [7] at 310 TeV. This is near the the-oretical expectation due to cosmic-ray interactions withthe interstellar medium. For a Northern hemisphere sitelike CASA-MIA, Ref. [8] predicts a gamma-ray fractionof 2 × 10⁻⁵ for the average gas column density.
In this work, we present a new approach for detect-ing astrophysical PeV gamma rays, based on data ofthe surface component, IceTop, and the in-ice array ofIceCube. IceTop measures the electromagnetic compo-nent of air showers, while the in-ice array is sensitiveto muons that penetrate the ice with energies above500 GeV. While most CR showers above 1 PeV containmany muons above this threshold, only a small fraction ofPeV gamma-ray showers carry muons that are energeticenough to reach the in-ice array. Therefore, gamma-raycandidates are selected among muon-poor air showers de-tected with IceTop and whose axis is reconstructed aspassing through the in-ice array.
This approach of selecting muon-poor showers asgamma-ray candidates is fundamentally different fromthe earlier AMANDA-II gamma-ray search described
FIG. 1. IceCube consists of a ∼km2 surface air showerarray and 86 strings holding 60 optical modules each, fillinga physical volume of a km3. The region in the center of theburied detector is more densely instrumented. See text fordetails.
above, which was only sensitive to gamma-ray showersthat do contain high energy muons (> 100 GeV).
We present a limit on the gamma-ray flux coming fromthe Galactic Plane, based on one year of data with halfof the IceCube strings and surface stations installed. Wealso discuss the sensitivity of the completed detector.
II. THE ICECUBE DETECTOR
IceCube (see Fig. 1) is a particle detector located atthe geographic South Pole. The in-ice portion consistsof 86 strings that reach 2450 m deep into the ice. Mostof the strings are arranged in a hexagonal grid, sepa-rated by ∼125 m. Each of these strings holds 60 digitaloptical modules (DOMs) separated by ∼ 17 m coveringthe range from 1,450 m to 2,450 m depth. Eight stringsform a denser instrumented area called DeepCore. TheDOMs detect Cherenkov light produced by downward-going muons in cosmic-ray air showers and from chargedparticles produced in neutrino interactions. The dataused in this analysis was collected in 2008/9, when the40 strings shown in Fig. 2 were operational.
Each DOM is a complete detector system, comprisinga 25 cm diameter Hamamatsu R7081-02 phototube [9],shaping and digitizing electronics [10], calibration hard-ware, plus control electronics and power supply. Most ofthe buried PMTs are run at a gain of 107. Digitization is

4
initiated by a discriminator, with a threshold set to 0.25times the typical peak amplitude of a single photoelec-tron waveform. Each DOM contains two separate digi-tizing systems; the Analog Transient Waveform Digitizer(ATWD) records 400 ns of data at 300 Megasamples/s,with a 14 bit dynamic range (divided among 3 paral-lel channels), while the fast Analog-to-Digital Converter(fADC) records 6.4 µs of data at 40 Megasamples/s, with10 bits of dynamic range. A system transmits timingsignals between the surface and each DOM, providingtiming calibrations across the entire array of about 2 ns[11, 12].
The IceTop surface array [13] is located on the surfacedirectly above the in-ice detectors. It consists of 81 sta-tions, each consisting of two ice-filled tanks, about 5 mapart. For the 2008 data used here, 40 stations were op-erational (IC40, see Fig. 2). Each tank is 1.8 m in diam-eter, filled with ice to a depth of about 90 cm. The tanksare initially filled with water, and the freezing of the wa-ter is controlled to minimize air bubbles and preservethe optical clarity of the ice. Each tank is instrumentedwith two DOMs, a high-gain DOM run at a PMT gainof 5 × 10⁶, and a low-gain DOM, with a PMT gain of5×105. The two different gains were chosen to maximizedynamic range; the system is quite linear over a rangefrom 1 to 105 photoelectrons. A station is considered hitwhen a low-gain DOM in one tank fires in coincidencewith a high-gain DOM in the other; the thresholds areset to about 20 photoelectrons.
When an in-ice DOM is triggered it sends a Local Coin-cidence (LC) message to its nearest two neighbors aboveand nearest two neighbors below. If the DOM also re-ceives an LC message from one of its neighbors within 1µs it is in Hard Local Coincidence (HLC). In that casethe full waveform information of both the ATWD andfADC chip is stored. For IC40 and earlier configurations,isolated or Soft Local Coincidence (SLC) hits were dis-carded. In newer configurations, the SLC hits are storedalbeit with limited information. Keeping the full wave-forms would require too much bandwidth, since the rateof isolated hits per DOM due to noise is ∼500 Hz. In-stead, only the three fADC bins with the highest valuesand their hit times are stored.
In Sec. IV we present a gamma-ray analysis of the IC40dataset. In Sec. VI we study the expected sensitivity ofthe full IceCube detector, and discuss how the inclusionof SLC hits increases the background rejection.
III. DETECTION PRINCIPLE
We create a sample of gamma-ray candidates by select-ing air showers that have been successfully reconstructedby IceTop and have a shower axis that passes throughthe IceCube instrumented volume. The geometry limitsthis sample to showers having a maximum zenith angle of∼30 degrees. Since IceCube is located at the geographicSouth Pole, the Field of View (FOV) is roughly con-
– 7 –
tronics for waveform digitization (Abbasi et al. 2009d), and a spherical, pressure-resistant
glass housing. A single Cherenkov photon arriving at a DOM and producing a photoelectron
is defined as a hit. A trigger threshold equivalent to 0.25 of the average single photoelec-
tron signal is applied to the analog output of the PMT. The waveform of the PMT total
charge is digitized and sent to the surface if hits are in coincidence with at least one other
hit in the nearest or next-to-nearest neighboring DOMs within ±1000 ns. Hits that satisfy
this condition are called local coincidence hits. The waveforms can contain multiple hits.
The total number of photoelectrons and their arrival times are extracted with an iterative
Bayesian-based unfolding algorithm. This algorithm uses the template shape representing
an average hit.
Forty strings of IceCube were in operation from 2008 April 5 to 2009 May 20. The
layout of these strings in relation to the final 86-string IceCube configuration is shown in
Fig. 1. Over the entire period the detector ran with an uptime of 92%, yielding 375.5 days of
total exposure. Deadtime is mainly due to test runs during and after the construction season
dedicated to calibrating the additional strings and upgrading data acquisition systems.
X (Grid East) [m]-600 -400 -200 0 200 400 600
Y (G
rid N
orth
) [m
]
-600
-400
-200
0
200
400
60040-string Configuration
86-string Configuration
Fig. 1.— Overhead view of the 40-string configuration, along with additional strings that
will make up the complete IceCube detector.
IceCube uses a simple multiplicity trigger, requiring local coincidence hits in eight DOMs
within 5 µs. Once the trigger condition is met, local coincidence hits within a readout win-
dow ±10 µs are recorded, and overlapping readout windows are merged together. IceCube
triggers primarily on down-going muons at a rate of about 950 Hz in this (40-string) config-
FIG. 2. Map of location of all 86 strings of the completedIceCube detector. The blue dots represent the 40 string con-figuration that is used for this analysis. At surface level eachof these 40 strings is complemented by an IceTop station con-sisting of two tanks. The large (red) circles indicate the ‘innerstrings’ of the IC40 configuration.
strained to the declination range of −60 to −90 degrees,as shown in Fig. 3. This FOV includes the MagellanicClouds and part of the Galactic Plane. Gamma-rays atPeV energies are strongly attenuated over extra-galacticdistances, thus limiting the observable sources to thoselocalized in our galaxy. At distances of ∼ 50 kpc and∼60 kpc, the PeV gamma-ray flux from the Large andSmall Magellanic Cloud is suppressed by several ordersof magnitude.
The contours in the background of Fig. 3 are the in-tegrated neutral atomic hydrogen (HI) column densitiesunder the assumption of optical transparency based ondata from the Leiden/Argentine/Bonn survey [14]. Thesedensities are not incorporated into the analysis and areonly plotted to indicate the Galactic Plane. We do ex-pect, however, that gamma-ray sources are correlatedwith the HI column density. Firstly, Galactic CR acceler-ators are more abundant in the high density regions of theGalaxy. Secondly, the gamma-ray flux of (extra-)galacticCRs interacting with the ISM naturally correlates withthe column density. However, it has to be noticed thatthis correlation is not linear, because of the attenuation ofgamma-rays over a 10 kpc distance scale. Furthermore,the column densities do not include molecular hydrogenwhich can also act as a target for CRs.
The gamma-ray candidate events are searched for ina background of CR showers that have exceptionally fewmuons or are directionally misreconstructed. In the lattercase the muon bundle reaches kilometers deep into the icebut misses the instrumented volume. This backgroundis hard to predict with Monte Carlo (MC) simulations.Cosmic-ray showers at PeV energies and with a low num-ber of energetic muons are rare. For example, at 1 PeV

5
Galactic longitude (degrees)-150 -100 -50 0 50 100 150
Gal
actic
latit
ude
(deg
rees
)
-80
-60
-40
-20
0
20
40
60
80
- - -
FIG. 3. Contours of integrated neutral atomic hydrogen(HI) column densities [14], in Galactic coordinates (flat pro-jection). The blue circle indicates the gamma-ray FOV forIceCube in the present IC40 analysis. The red rectangle in-dicate the regions for which CASA-MIA [6] has set an upperlimit on the Galactic diffuse photon flux in the 100 TeV −1 PeV energy range. IceCube’s FOV is smaller but coversa different part of the Galactic Plane, close to the GalacticCenter.
less than 0.1% of the simulated showers contain no muonswith an energy above 500 GeV, approximately what isneeded to reach the detector in the deep ice when trav-eling vertically. Determining how many hadronic show-ers produce a signal in a buried DOM would require anenormous amount of MC data to reach sufficient statis-tics, plus very strong control of the systematic uncer-tainties due to muon production, propagation of muonsand Cherenkov photons through the ice, and the abso-lute detector efficiencies. It would also have to be able toaccurately predict the errors in air shower reconstructionparameters. For example, this analysis is very sensitiveto the tails of the distribution of the error on the an-gular reconstruction of IceTop. Even MC sets that arelarge enough to populate these tails are not expected toproperly describe them.
To avoid these issues, we determine the background di-rectly from data. As a result, we are not able to measurea possible isotropic contribution to the gamma-ray flux,because these gamma-rays would be regarded as back-ground. Instead, we search for localized excesses in thegamma-ray flux.
We search for a correlation of the arrival directions ofthe candidate events with the Galactic Plane, and scanfor point sources. The acceptance of IceTop-40 is a com-plex function of azimuth and zenith due to its elongatedshape and the requirement that the axis of the detectedshower passes through IC40 (with the same elongatedshape). However, since the arrival time is random (thereare no systematic gaps in detector uptime w.r.t. side-real time) the reconstructed right ascension (RA) of anisotropic flux of CR showers is uniform. The correct dec-lination distribution of the background is very sensitive to
the number of background showers introduced by errorsin the IceTop angular reconstruction of the air showeras a function of the zenith angle, and is taken to be un-known. However, the flat distribution of background overRA is enough to allow for a search for gamma-ray sources.
Recently, IceCube found an anisotropy in the arrivaldirection of CRs on the southern hemisphere [15]. Thesedeviations with RA have been established for samplesof CRs with median energies of 20 TeV and 400 TeV.The two energy ranges show a very different shape of theanisotropy, but the level of the fractional variations influx is at a part-per-mil level for both [16]. An anisotropywith comparable magnitude in the PeV energy range istoo small to affect this analysis (the IC40 final samplecontains 268 events).
IV. IC40 ANALYSIS
A. Event selection
Between April 5 2008 and May 20 2009, IceCube tookdata with a configuration of 40 strings and 40 surfacestations (IC40), using several trigger conditions based ondifferent signal topologies. This analysis uses the 8 sta-tion surface trigger, which requires a signal above thresh-old in both tanks of at least 8 IceTop stations. An ad-ditional signal in IceCube is not required for this trig-ger, but all HLC hits in the deep detector within a timewindow of 10 µs before and after the surface trigger arerecorded.
The air shower parameters are reconstructed fromthe IceTop hits with a series of likelihood maximizationmethods. The core position is found by fitting the lateraldistribution of the signal, using
S(r) = Sref
(r
Rref
)−β−κ log10
(r
Rref
)(1)
where S is the signal strength, r is the distance to theshower axis, Sref is the fitted signal strength at the ref-erence distance Rref = 125 m, β is the slope parameterreflecting the shower age, and κ = 0.303 is a constant de-termined from simulation [13, 23]. Signal times are usedto find the arrival direction of the air shower. The timedelay due to the shape of the shower plane is described bythe sum of a Gaussian function and a parabola, both cen-tered at the shower core, which yields a resolution of 1.5◦
for IC40. The relationship between the reconstructed en-ergy Ereco and Sref is based on MC simulations for protonshowers and depends on the zenith angle.
IceCube data is processed in different stages: in thefirst two levels the raw data is calibrated and filtered,and various fitting algorithms are applied, of which onlythe IceTop reconstruction described above is used in thisanalysis. In the selection of photon shower candidatesfrom the data sample we distinguish two more steps: levelthree (L3) and level four (L4). Level three includes all the

6
conditions on reconstruction quality, geometry and en-ergy that make no distinction between gamma-ray show-ers and CR showers. The L4 cut is designed to separategamma rays from CRs.
Two parameters are used to constrain the geometryand ensure the shower axis passes through the instru-mented volume of IceCube. The IceTop containment pa-rameter CIT is a measure for how centralized the corelocation is in IceTop. When the core is exactly in thecenter of the array CIT = 0, while CIT = 1 means thatit is exactly on the edge of the array. More precisely,CIT = x means that the core would have been on theedge of the array if the array would be x times its actualsize. The string distance parameter dstr is the distancebetween the point where the shower reaches the depthof the first level of DOMs and the closest inner string.Inner string, in this sense, means a string which is noton the border of the detector configuration. IC40 has 17inner strings (see Fig. 2). The L3 cuts are:
• Quality cut on lateral distribution fit: 1.55 < β <4.95 (cf. Eq. 1)
• Geometry cut: CIT < Cmax
• Geometry cut: dstr < dmax
• Energy cut: Ereco > Emin
The energy and geometry cuts are optimized in a laterstage (Sec. IV C).
The L4 stage imposes only one extra criterion to theevent: there should be no HLC hits in IceCube. Thisremoves most of the CR showers, if Emin is chosen suffi-ciently high. The remaining background consists of CRshowers with low muon content and mis-reconstructedshowers, the high energy muons from which do not actu-ally pass through IceCube.
The event sample after the L4 cut might be dominatedby remaining background but it can be used to set anupper limit to the number of gamma-rays in the sample.Since the event sample after L3 cuts is certainly domi-nated by CRs, the ratio between the number of eventsafter L4 and L3 cuts can be used to calculate an upperlimit to the ratio of gamma-ray-to-CR showers.
The remaining set of candidate gamma ray eventsis tested for a correlation with the Galactic Plane(Sec. IV C) and the presence of point like sources(Sec. IV D). First, the results of simulations are pre-sented, which provide several quantities needed for sen-sitivity calculations.
B. Simulation
Although we determine the background from data only,simulations are needed to investigate systematic differ-ences in the detector response to gamma-ray showers andcosmic-ray showers. More specifically, we are interestedin the energy reconstruction of gamma-ray showers, the
(PeV)trueE1 1.5 2 2.5 3
)tr
ue
/Ere
colo
g(E
-1
-0.5
0
0.5
1
0
10
20
30
40
50
FIG. 4. Ratio between reconstructed and true energy of sim-ulated gamma-ray showers as a function of their true energy.At low energies the overestimation of the gamma-ray energyis largely due to a bias effect of the eight-station filter. Athigher energies, this overestimation decreases.
fraction of gamma-ray showers that is rejected by themuon veto system, and a possible difference in effectivedetector area between both types of showers.
Gamma-ray and proton showers are simulated withCORSIKA v6.900, using the interaction models FLUKA2008 and SYBILL 2.1 for low and high energy hadronicinteractions, respectively. For both primaries 10,000showers are generated within an energy range of 800 TeVto 3 PeV with a E−1 spectrum. Because the shower axesare required to pass through IceCube, the zenith angleis restricted to a maximum of 35 degrees. The observa-tion altitude for IceTop is 2835 m. Atmospheric modelMSIS-90-E is used, which is South Pole atmosphere forJuly 01, 1997. Seasonal variations in the event rate areof the order of 10% [19].
The detector simulation is done with the IceTray soft-ware package. Each simulated shower is fed into the de-tector simulation ten times with different core positionsand azimuthal arrival direction, for a total of 100,000events for both gamma rays and protons. This resam-pling of showers is a useful technique for increasing thestatistics when examining quantities like the resolutionof the energy reconstruction of IceTop. However, it can-not be used for quantities with large shower-to-showervariations, such as the number of high energy muons.
The energy of gamma-ray showers is overestimated bythe reconstruction algorithm. Fig. 4 shows the distri-bution of the logarithm of the ratio between the recon-structed and true primary energy as function of true en-ergy, weighted to a E−2.7 spectrum. There are two rea-sons for the energy offset. First, there is a selection ef-fect of the eight-station filter, which has a bias (below afew PeV) towards showers that produce relatively largesignals in the IceTop tanks. This also affects the recon-structed energy of CR showers. At higher energies, theoffset decreases but the reconstructed energy of gamma-

7
(PeV)trueE1 1.5 2 2.5 3
# en
trie
s (w
eig
hte
d)
10
210
FIG. 5. Distribution of true energy of gamma-ray (red,solid) and proton (blue, dotted) showers for an energy cut atEreco > 1.4 PeV, weighted to a E−2.7 spectrum.
ray showers is still slightly overestimated because the en-ergy calibration of IceTop is performed with respect toproton showers.
Figure 5 shows the distribution of true energies ofgamma-ray and proton showers for the energy cutEreco > 1.4 PeV (which will be adopted in Sec. IV C).After this cut, 95% of the gamma-ray showers have a trueenergy above 1.2 PeV, while 95% of the proton showershave an energy above 1.3 PeV.
The fraction of gamma-ray showers that is falsely re-jected because the showers contain muons that producea signal in IceCube is found by applying the cuts to theMC simulation.
After applying the L3 cuts (defined in Sec. IV C) to thesimulated gamma-ray sample there are 737 events left inthe sample, of which 121 produce a signal in IceCube.Taking into account an energy weighting of E−2.7, thiscorresponds to 16%.
Showers that have no energetic muons can still be re-jected if an unrelated signal is detected by IceCube. Thiscould be caused by noise hits or unrelated muon tracksthat fall inside the time window. This noise rate is de-termined directly from the data and leads to 14% signalloss. The total fraction of gamma-ray showers that isfalsely rejected is therefore 28%.
Finally, because the composition, shower size and evo-lution of gamma-ray and CR showers are different, onemight expect a difference in the number of triggered sta-tions and the quality of the reconstruction, which couldlead to different effective areas. Such an effect would beof importance when calculating the relative contributionof gamma-rays to the total received flux. We comparethe effective area for gamma rays and protons by count-ing the number of events that are present at L3. Wecompensate for the energy reconstruction offset by re-ducing the reconstructed gamma-ray energy by a factor1.16. The ratio of the effective area for gamma-rays tothat for protons is then found to be 0.99.
It should be emphasized that we do not use the sim-ulation to determine the number of muons and their en-ergy distribution from CR showers. This would require asimulation set that includes heavier nuclei instead of pro-tons only. Moreover, various hadronic interaction modelsgenerate significantly different muon fluxes [18]. Instead,this analysis estimates the rate of CR showers that donot trigger IceCube using the data itself.
C. Galactic Plane test
The IC40 data set consists of 368 days of combinedIceCube and IceTop measurements. The data from Au-gust 2009 is used as a burn sample, which means that itis used to tune the parameters of the analysis. After thistuning the burn sample is discarded and the remainingdata is used for the analysis.
IceCube is sensitive to gamma rays above 1 PeV. Ear-lier searches by CASA-MIA in a slightly lower energyrange (100 TeV – 1 PeV) with better sensitivity have notestablished a correlation of gamma-rays with the Galac-tic Plane (see Fig. 14). For a Galactic diffuse flux belowthe CASA-MIA limit [6] no gamma rays are expected inthe IC40 burn sample. However, IceCube observes a dif-ferent part of the Galactic Plane (see Fig. 3), close to theGalactic Center, so the possibility exists that previouslyundetected sources or local enhancements in CR and dustdensities create an increase in the flux from that part ofthe sky.
In order to find a possible correlation of candidateevents in our burn sample to the Galactic Plane, differentsets of L3 cut parameters are applied to find a set thatproduces the most significant correlation. Afterwards,the cut parameters are fixed and the burn sample is dis-carded. The fixed cut parameters are then used in theanalysis of the rest of the IC40 data set to test whetherthe correlation is still present. Note that these cuts areapplied at L3, so they affect both the event samples af-ter L3 and L4 cuts. This is important because the ratiobetween the number of events after L4 and L3 cuts isused to calculate the ratio between gamma ray and CRshowers.
There are three cut parameters that are optimized byusing the burn sample: Emin, Cmax and dmax. This isdone by scanning through all combination of parameterswithin the following range: 600 TeV ≤ Emin ≤ 2 PeVwith steps of 100 TeV, 0.5 ≤ Cmax ≤ 1.0 with steps of0.1, and 50 m ≤ dmax ≤ 90 m with steps of 10 m. Foreach combination, the number of events NS in the burnsample after the L4 cut, located in the source region, iscounted. The source region is defined as within 10 de-grees of the Galactic Plane. Then, the data set is scram-bled multiple times by randomizing the RA of each datapoint. For each scrambled data set the number of eventsin the source region is again counted. The best combi-nation of cut parameters is the set which has the lowestfraction of scrambled data sets for which this number is

8
equal to or higher than NS .
The result of the scan is given in the three panels ofFig. 6. For each cut parameter the fraction of scrambleddata sets that has a number of events in the source regionequal to or exceeding the amount in the original dataset is plotted for different cut values. For each plot thevalues of the other two cut parameters are kept constantat their optimal value. The actual search is done in threedimensions. The ratio is lowest for E > 1.4 PeV, CIT <0.8 and dstr < 60 m. With this combination of cuts only0.011% of the scrambled data sets produce an equal orhigher number of events in the source region.
Note that while this procedure of optimizing cutsshould be effective in the presence of sufficient signal,the small fraction obtained here and its erratic behaviorwith changing cut values are consistent with fluctuationsof the background CR distribution alone, given the largenumber of possible cut combinations which were scanned.Nonetheless, the cut parameter values found with thisprocedure seem very reasonable (similar values are foundwith an alternative method, see Sec. VI).
The optimized cuts are applied to the complete IC40data set minus the burn sample. There are 268 candi-date events of which 28 are located in the source region.Figure 7 is a map of the sky showing all 268 events. Thecolors in the background indicate the integrated HI col-umn densities, cf. Fig. 3 (see discussion Sec. III). Theseare meant to guide the eye and are not part of the anal-ysis.
The significance of the correlation with the GalacticPlane is tested by producing data sets with scrambledRA. An equal or higher number of source region eventsis found in 21% of the scrambled data sets, correspondingto a non-significant excess of +0.9σ.
We follow the procedure of Feldman & Cousins [20] toconstruct an upper limit for the ratio of gamma rays toCRs. The background is determined by selecting a rangeof RA that does not contain the source region. Withinthis range the data points are scrambled multiple timesand for each scrambled set the number of events in a pre-defined region of the same shape and size as the sourceregion is counted. This yields a mean background of24.13 events for the source region. Using a 90% confi-dence interval, the upper limit on the number of excessgamma rays from this region is 14.
Since 28% of gamma-ray showers are rejected by theveto from the buried detector, the maximum number ofexcess gamma-rays from the Galactic Plane is 14/0.72 =19.4. From Fig. 5, it is known that the energy cut cor-responds to a threshold of 1.2 PeV for gamma-rays, and1.3 PeV for protons. Given that at L3 the sample is dom-inated by CR showers, and assuming a CR and gamma-ray power law of γ = −2.7, a 90% C.L. upper limit of1.2 × 10−3 on the ratio of gamma-ray showers to CRshowers in the source region can be derived in the en-ergy range 1.2 – 6.0 PeV. The upper bound of 6.0 PeV isthe value for which 90% of the events are inside the en-ergy range. This value falls outside the range for which
gamma-ray showers were simulated. However, there isno indication that the energy relation plotted in Fig. 4behaves erratically above 3 PeV.
This is a limit on the average excess of the ratio ofgamma-rays to CRs in the source region with respect tothe rest of the sky, i.e. a limit on the Galactic componentof the total gamma-ray flux. A possible isotropic compo-nent is not included. Systematic uncertainties lead to a18% variation of the upper limit, as determined in Sec. V.
D. Unbinned point source search
An additional search for point-like sources tests thepossibility that a single source dominates the PeVgamma-ray sky. This source does not necessarily lie closeto the Galactic Plane. An unbinned point source searchis performed on the sky within the declination range of−85◦ to −60◦, using a method that follows [21]. Theregion within 5 degrees around the zenith is omitted, be-cause the method relies on scrambled data sets that areproduced by randomizing the RA of the events. Closeto the zenith this randomization scheme fails due to thesmall number of events.
The data is described by an unknown amount of signalevents on top of a flat distribution of background events.In an unbinned search, a dense grid of points in the skyis scanned. For each point a maximum likelihood fit isperformed for the relative contribution of source eventsover background events.
For a particular event i the probability density function(PDF) is given by
Pi(nS) =nSNSi +
(1 − nS
N
)Bi (2)
where nS is the number of events that is associated tothe source, Bi is the background PDF, and
Si =1
2πσ2exp
(−∆Ψ2
2σ2
)(3)
is the two-dimensional Gaussian source PDF, in which∆Ψ is the space angle between the event and the sourcetest location, and σ = 1.5◦ is the angular resolution ofIceTop. The background PDF Bi is only dependent onthe zenith angle, and is derived from the zenith distri-bution of the data. For each point in the sky there is alikelihood function
L(nS) = ΠiPi(nS), (4)
and associated test statistic
λ = −2 (log(L(0)) − log(L(nS)) , (5)
which is maximized for nS . In the optimization proce-dure, nS is allowed to have a negative value, which math-ematically corresponds to a local flux deficit.
The procedure is similar to the search method for theneutrino point sources with IceCube [22], except that the

9
Reconstructed Energy (GeV)600 800 1000 1200 1400 1600 1800 2000
310!
Rat
io e
qual
or b
ette
r
-410
-310
-210
Distance from inner string (m)50 55 60 65 70 75 80 85 90
Rat
io e
qual
or b
ette
r
-410
-310
Icetop Size0.5 0.6 0.7 0.8 0.9 1
Rat
io e
qual
or b
ette
r
-410
-310
-210
-110
1
FIG. 6. Optimization scans for cut parameters Emin, dmax, and Cmax. The fraction of scrambled data sets that perform equalor better than the real data set is plotted against cut value. For each plot, the other 2 parameters are kept constant at theiroptimal value. The actual scan was done three dimensionally. For each plot, the shaded region indicates the parameter spacethat is excluded by the optimized cuts.
Right Ascension (degrees)0 50 100 150 200 250 300 350
Dec
linat
ion
(d
egre
es)
-90
-85
-80
-75
-70
-65
-60
)-2
HI c
olu
mn
den
sity
(cm
2110
2210
FIG. 7. Equatorial map of the 268 candidate gamma-ray events of the IC40 data set superimposed on HI column densitiesbased on [14]. The dotted black curve encloses the source region, defined as within 10 degrees of the Galactic Plane.
source and background PDF do not contain an energyterm. Because the range of energies in the event sam-ple is relatively small (90% of the events have an energybetween 1 and 6 PeV), an energy PDF is unlikely to im-prove the sensitivity.
Figure 8 displays a map of the sky with declinationbetween −85◦ and −60◦ showing the events in this regionand contours of the test statistic λ. The maximum valueis λ = 2.1 at δ = −65.4◦ and RA= 28.7◦, correspondingto a fit of ns = 3.5 signal events. The overall significanceof this value for λ is found by producing 10, 000 scrambleddata sets by randomizing the RA of each event. Figure 9shows the distribution of λ associated to the hottest spotin each scrambled data set. The median test statisticvalue for the hottest spot in the scrambled data sets isλ = 2.7, so the actual data set is consistent with a flatbackground.
Upper limits on the gamma-ray flux can be derivedfor each point in the sky by assuming that all events aregamma-rays. Since many events are in fact muon-pooror misreconstructed showers, this leads to a conservativeupper limit. Because the acceptance of IC40 decreases asa function of declination (see Fig. 13), the limit is moreconstraining at lower declination. Figure 10 is a sky map
of the 90% C.L. upper limit in the energy range E =1.2−6.0 PeV for E−2 source spectra. Point source fluxesare excluded at a level of (E/TeV)2dΦ/dE ∼ 10−12 −10−11 cm−2s−1TeV−1 depending on source declination.Corrections for signal efficiency and detector noise aretaken into account. Systematic uncertainties lead to a18% variation of the upper limit.
V. SYSTEMATIC ERRORS
Since this analysis derives the background from data,the systematic uncertainties due to the background esti-mation are small. The previously discussed cosmic-rayanisotropy measurement (see Sec. III and [16]) is toosmall to have an impact on this analysis. Since thereare no systematic gaps in detector uptime with respectto sidereal time-of-day in our sample, the coverage of RAis homogeneous.
Therefore, we focus on the systematic uncertainties inthe signal efficiency, due to uncertainties in the surfacedetector sensitivity, and in the muon production rate forphoton showers.
The uncertainty in the surface detector sensitivity is

10
Right Ascension (degrees)0 50 100 150 200 250 300 350
dec
linat
ion
(d
egre
es)
-85
-80
-75
-70
-65
-60
-210
-110
1
FIG. 8. Equatorial map of the part of the sky for which an unbinned point source search is performed. The contours indicatethe value of λ and the black dots are the candidate events.
lambda0 2 4 6 8 10
# en
trie
s
1
10
210
310
λ
FIG. 9. Distribution of the largest value of λ observed ineach scrambled data set. The red dotted line indicated thevalue for λ that corresponds to the hottest spot in the data.
studied in Ref. [23]; Table 2 there gives the uncertain-ties for hadronic showers as a function of shower energyand zenith angle. Although there are differences be-tween hadronic and electromagnetic showers, most fac-tors that contribute to this figure apply to both typesof showers. Strongly contributing factors include atmo-spheric fluctuations, calibration stability and uncertain-ties in response of detector electronics (PMT saturationand droop). The contribution from the uncertainty inmodeling the hadronic interaction is clearly different forelectromagnetic showers, and is discussed below. ForE < 10 PeV, and zenith angle less than 30◦, there isa 6.0% systematic uncertainty in energy, and a 3.5% sys-tematic uncertainty in flux. For an E−2.7 spectrum, a6.0% uncertainty in energy translates into a 17.0% un-certainty in flux, or, adding in quadrature, 17.4% fluxuncertainty.
The uncertainty in the muon production from hadronicshowers emerges from theoretical uncertainties. It de-pends on the hadronic photoproduction and electropro-duction cross-sections for energies between 10 TeV and6 PeV. Figure 1 of [24] compares two cross-sections from
two different photoproduction models, and finds (for wa-ter with a similar atomic number and mass number asair), a difference that rises from about 20% at 10 TeV to60% at 1 PeV. The bulk of the particles in the shower areat lower energies, so we adopt a 20% uncertainty on themuon production rate via photoproduction. In addition,there is also a contribution of muon pair creation. Toreach the in-ice DOMs, muons need at least 500 GeV.At 1 TeV, the fractional contribution of muon pair cre-ation is ∼ 10% [25]. Since muon pair production is notincluded in SYBILL 2.1, we arrive at 30% uncertainty intotal muon production rate. This uncertainty is appliedto the 16% of photon showers that are lost because theycontain muons for a final 4.8% uncertainty in sensitivitydue to the unknown muon production cross-section.
We add the uncertainties due to detector response andmuon production in quadrature, and arrive at an overall18 % uncertainty in sensitivity.
VI. ICECUBE 5-YEAR SENSITIVITY
The sensitivity of the full IceCube detector to agamma-ray flux from the Galactic Plane benefits frommultiple improvements that can be made with respectto the analysis presented above. In this section we usepreliminary data from the IC79 configuration (79 strings,73 surface stations, 2010/2011) to estimate the sensitiv-ity that the full IceCube detector can reach in 5 years.Since the full detector (IC86: 86 strings and 81 surfacestations) is slightly larger than the IC79 configuration,the predicted sensitivity will be slightly underestimated.Also, the new cuts proposed below are not yet optimized,as this would require the actual IC86 data set.
A. Air shower reconstruction
This analysis is very sensitive to the quality of the corereconstruction. If the shower core is not reconstructedaccurately, a muon bundle that passes outside the in-icearray might be incorrectly assumed to be aimed at the

11
Right Ascension (degrees)0 50 100 150 200 250 300 350
dec
linat
ion
(d
egre
es)
-85
-80
-75
-70
-65
-60
-1210
-1110
FIG. 10. Sky map of 90% C.L. upper limits on point source flux (E/TeV)2dΦ/dE in cm−2s−1TeV−1 for E−2 source spectrain the energy range E = 1.2 − 6.0 PeV. The limit is typically more constraining at low declinations where the effective area islargest.
detector. Because of the absence of a signal in the in-iceDOMs, the event is then misinterpreted as a gamma-raycandidate. A more accurate core reconstruction algo-rithm has been developed for IceTop and will improvethe CR rejection in post-IC40 analyses. In addition, theangular resolution of the larger array is improved, in-creasing the sensitivity to point sources.
B. Isolated hits
The SLC mode (which is available since IC59, seeSec. II) increases the sensitivity to CR showers with lowmuon content. A muon with just enough energy to reachIceCube, might not emit enough Cherenkov light to trig-ger multiple neighboring DOMs. By tightening the L4cut so that no SLC hits are allowed to be present in thedata, the efficiency with which CR showers can be re-jected increases. At the same time, actual gamma-rayshowers may be rejected in case of a noise hit in a singleDOM. To keep this chance low, SLC hits only count asveto hits if they can be associated to the shower muonbundle both spatially and temporally.
Figure 11 shows the distribution of isolated hits in thecomplete detector as a function of time relative to thearrival time of the air shower as measured by IceTop.The plots show data at L3 level, applying the same cutvalues as in the IC40 analysis. The left plot shows thedistribution of SLC hits for all events, while the rightplot shows the same distribution but restricted to thesubset of events which contain only SLC hits, i.e. eventswith no HLC hits. Hits associated with the muon bundleare seen throughout the detector, although the number ofhits varies with depth because of variations in the opticalproperties of the ice due to naturally varying levels ofcontaminants such as dust, which attenuate Cherenkovphotons The large number of isolated hits in the twobottom rows is an edge effect: the DOMs have fewerneighbors, so the chance for a hit to be isolated increases.In principle, the same effect could occur at the top tworows. However, the muon bundle deposits more energy
in this region and the probability for any hit to haveneighbor hits is larger here.
The muon-poor showers that produce no HLC hits(right-hand plot) can still cause some isolated hits in thetop of the detector. These events can be removed withan additional cut on SLC hits. Because isolated hits canalso be produced by noise, only a small area is selected inwhich SLC hits are used as a veto. A simple additionalL4 cut is that all events are removed that have an SLChit meeting the following three criteria:
• it is within 200 m from the reconstructed showeraxis,
• it is within a time window of 4.8–7.5 µs after theshower arrival time, and
• it is in one of the six top layers of DOMs (spanninga vertical extend of 85 m).
Note that the lower bound of the time window (4.8 µs)corresponds to the time it takes for a muon travelingvertically to reach the top layer of in-ice DOMs startingfrom the surface. Muons from an inclined shower willarrive even later. The number of background events thatare discarded in the L4 cut is increased by ∼30%, whilethe SLC noise rate in the data implies a decrease in signalefficiency of ∼5%.
With the completed detector it will be possible to op-timize the SLC cuts further by making the time windowdependent on zenith angle and DOM depth. The effectof this optimization was not yet studied here.
C. Re-optimization of cuts
For the IC40 analysis the cut parameters were opti-mized to increase the detection probability of a possi-ble correlation of gamma rays with the Galactic Plane.To increase the sensitivity of future searches with thecompleted IC86 configuration, the cut values were re-evaluated to increase the number of candidate events

12
showerT-T0 2000 4000 6000 8000 10000
dept
h (m
)
-400
-200
0
200
400
50
100
150
200
250
(ns) showerT-T0 2000 4000 6000 8000 10000
dept
h (m
)
-400
-200
0
200
400
0
2
4
6
8
10
12
14
16
18
(ns)
FIG. 11. Observed time of isolated hits (SLC) relative to the arrival time of the air shower front measured by IceTop. Theleft plot shows the distribution of SLC hits for all events; the right plot is the same but restricted to the subset of events whichhave only SLC hits and no HLC hits. There is an excess of SLC hits in the region were a muon signal associated to the showeris expected. This allows an additional cut to separate gamma-ray showers from hadronic showers. The black box indicates theregion in which an SLC hit counts as a veto (see text for details). The variation in the number of hits as a function of depthin the left plot is due to variations in the optical properties of the ice.
Energy (GeV)500 1000 1500 2000 2500 3000 3500 4000 4500 5000
310×
even
tsN
10
210
310
410
510
610
Rat
io L
4 / L
3
-510
-410
-310
-210
-110
Distance from inner string (m)0 10 20 30 40 50 60 70 80 90
even
tsN
10
210
310
410
510
610
Rat
io L
4 / L
3
-510
-410
-310
-210
-110
Icetop Containment0 0.2 0.4 0.6 0.8 1 1.2 1.4
even
tsN
10
210
310
410
510
610
Rat
io L
4 / L
3
-510
-410
-310
-210
-110
FIG. 12. The number of L3 (red) and L4 (blue) events in the data as a function of the three main cut parameters. The ratioof the number of L4 to L3 events is given by the black dotted line, for which the corresponding axis is drawn on the right-handside of the plot.
without losing background rejection power. This wasachieved by evaluating the ratio between the number ofevents after L3 and L4 cuts.
While the L3 event sample is completely dominatedby CRs, the L4 sample is a combination of possiblegamma-ray showers, muon-poor CR showers and mis-reconstructed CR showers. The fraction of gamma-raysand muon-poor CRs in the detected events is independentfrom the cuts on geometry parameters dstr and CIT. Thenumber of misreconstructed CR showers, on the otherhand, will increase if the geometry cut values are cho-sen too loosely. Therefore, the ratio between the numberof L4 and L3 events as a function of the cut parametershould be flat up to some maximum value after which itstarts to increase. This maximum value is the preferredcut value since it maximizes the number of candidateevents without lowering the background rejection power.It also maximizes the FOV, as looser geometry cuts implya larger maximum zenith angle.
Figure 12 shows the number of L3 (red) and L4 (blue)events together with their ratio (black dotted line; right-hand axis) as a function of the three main cut parameters(with the other cut parameters kept constant at theirfinal value).
The rejection efficiency for dstr is fairly stable up to60 m. The number of events rapidly decreases above thisvalue, while the rejection becomes worse. In this case,the alternative method of optimization yields the sameresult as the method used in the IC40 analysis. For thecontainment size CIT the ratio remains stable up to theedge of the array (CIT = 1) after which it starts to rise.It appears the cut can be relaxed with respect to theIC40 analysis. In the following we will use dstr < 60 mand CIT < 1.0.
The efficiency of the energy cut increases, as expected,with increasing energy, leveling off around ∼ 2.0 PeV.Since the total number of events falls off rapidly for in-creasing energy, the most sensitive region will be ∼ 2− 3
13
Zenith (degrees)0 5 10 15 20 25 30 35 40
sr)
2
Acc
epta
nce
(m
2000
4000
6000
8000
10000
12000
FIG. 13. Acceptance (effective area integrated over solidangle) for showers with an axis through both IceTop and Ice-Cube for IC40, CIT=0.8 (black), and IC86, CIT=1.0 (blue).
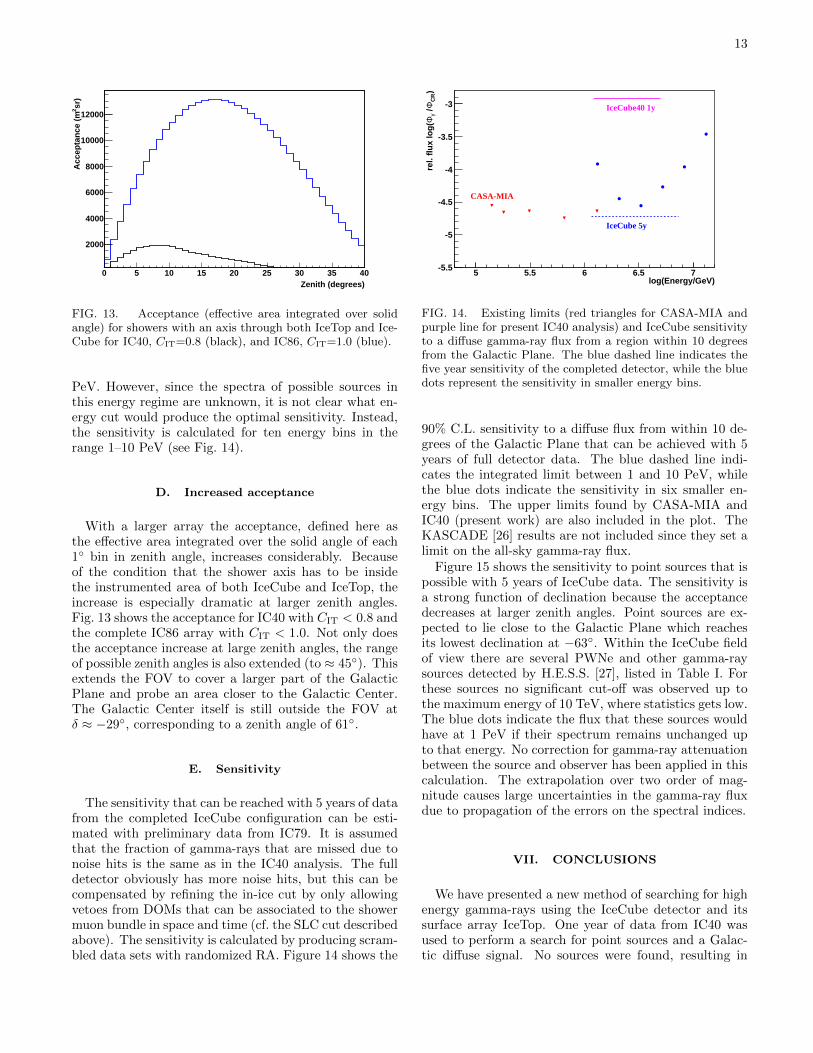
PeV. However, since the spectra of possible sources inthis energy regime are unknown, it is not clear what en-ergy cut would produce the optimal sensitivity. Instead,the sensitivity is calculated for ten energy bins in therange 1–10 PeV (see Fig. 14).
D. Increased acceptance
With a larger array the acceptance, defined here asthe effective area integrated over the solid angle of each1◦ bin in zenith angle, increases considerably. Becauseof the condition that the shower axis has to be insidethe instrumented area of both IceCube and IceTop, theincrease is especially dramatic at larger zenith angles.Fig. 13 shows the acceptance for IC40 with CIT < 0.8 andthe complete IC86 array with CIT < 1.0. Not only doesthe acceptance increase at large zenith angles, the rangeof possible zenith angles is also extended (to ≈ 45◦). Thisextends the FOV to cover a larger part of the GalacticPlane and probe an area closer to the Galactic Center.The Galactic Center itself is still outside the FOV atδ ≈ −29◦, corresponding to a zenith angle of 61◦.
E. Sensitivity
The sensitivity that can be reached with 5 years of datafrom the completed IceCube configuration can be esti-mated with preliminary data from IC79. It is assumedthat the fraction of gamma-rays that are missed due tonoise hits is the same as in the IC40 analysis. The fulldetector obviously has more noise hits, but this can becompensated by refining the in-ice cut by only allowingvetoes from DOMs that can be associated to the showermuon bundle in space and time (cf. the SLC cut describedabove). The sensitivity is calculated by producing scram-bled data sets with randomized RA. Figure 14 shows the
log(Energy/GeV)5 5.5 6 6.5 7
)C
RΦ
/ γΦ
rel.
flu
x lo
g(
-5.5
-5
-4.5
-4
-3.5
-3 IceCube40 1y
CASA-MIA
IceCube 5y
FIG. 14. Existing limits (red triangles for CASA-MIA andpurple line for present IC40 analysis) and IceCube sensitivityto a diffuse gamma-ray flux from a region within 10 degreesfrom the Galactic Plane. The blue dashed line indicates thefive year sensitivity of the completed detector, while the bluedots represent the sensitivity in smaller energy bins.
90% C.L. sensitivity to a diffuse flux from within 10 de-grees of the Galactic Plane that can be achieved with 5years of full detector data. The blue dashed line indi-cates the integrated limit between 1 and 10 PeV, whilethe blue dots indicate the sensitivity in six smaller en-ergy bins. The upper limits found by CASA-MIA andIC40 (present work) are also included in the plot. TheKASCADE [26] results are not included since they set alimit on the all-sky gamma-ray flux.
Figure 15 shows the sensitivity to point sources that ispossible with 5 years of IceCube data. The sensitivity isa strong function of declination because the acceptancedecreases at larger zenith angles. Point sources are ex-pected to lie close to the Galactic Plane which reachesits lowest declination at −63◦. Within the IceCube fieldof view there are several PWNe and other gamma-raysources detected by H.E.S.S. [27], listed in Table I. Forthese sources no significant cut-off was observed up tothe maximum energy of 10 TeV, where statistics gets low.The blue dots indicate the flux that these sources wouldhave at 1 PeV if their spectrum remains unchanged upto that energy. No correction for gamma-ray attenuationbetween the source and observer has been applied in thiscalculation. The extrapolation over two order of mag-nitude causes large uncertainties in the gamma-ray fluxdue to propagation of the errors on the spectral indices.
VII. CONCLUSIONS
We have presented a new method of searching for highenergy gamma-rays using the IceCube detector and itssurface array IceTop. One year of data from IC40 wasused to perform a search for point sources and a Galac-tic diffuse signal. No sources were found, resulting in

14
TABLE I. List of H.E.S.S. sources in IceCube gamma-ray FOV. For those values that have two error margins, the first indicatesthe statistical error, while the second indicates the systematic error.
Source RA decl. Flux at 1 TeV (cm−2s−1TeV)−1) Γ Classification
HESS J1356-645 13h56m00s −64◦30′00′′ (2.7 ± 0.9 ± 0.4) × 10−12 2.2 ± 0.2 ± 0.2 PWN [28]
HESS J1303-631 13h03m00s −63◦11′55′′ (4.3 ± 0.3) × 10−12 2.44 ± 0.05 ± 0.2 PWN [30]
RCW 86 14h42m43s −62◦28′48′′ (3.72 ± 0.5 ± 0.8) × 10−12 2.54 ± 0.12 ± 0.2 shell-type SNR [31]
HESS J1507-622 15h06m53s −62◦21′00′′ (1.5 ± 0.4 ± 0.3) × 10−12 2.24 ± 0.16 ± 0.2 no ID [32]
Kookaburra (Rabbit) 14h18m04s −60◦58′31′′ (2.64 ± 0.2 ± 0.53) × 10−12 2.22 ± 0.08 ± 0.1 PWN [33]
HESS J1427-608 14h27m52s −60◦51′00′′ (1.3 ± 0.4) × 10−12 2.2 ± 0.1 ± 0.2 no ID [34]
Kookaburra (PWN) 14h20m09s −60◦45′36′′ (3.48 ± 0.2 ± 0.7) × 10−12 2.17 ± 0.06 ± 0.1 PWN [33]
MSH 15-52 15h14m07s −59◦09′27′′ (5.7 ± 0.2 ± 1.4) × 10−12 2.27 ± 0.03 ± 0.2 PWN [35]
HESS J1503-582 15h03m38s −58◦13′45′′ (1.6 ± 0.6) × 10−12 2.4 ± 0.4 ± 0.2 dark (FWV?) [36]
HESS J1026-582 10h26m38s −58◦12′00′′ (0.99 ± 0.34) × 10−12 1.94 ± 0.2 ± 0.2 PWN [37]
Westerlund 2 10h23m24s −57◦47′24′′ (3.25 ± 0.5) × 10−12 2.58 ± 0.19 ± 0.2 MSC [37]
declination (deg)-80 -75 -70 -65 -60 -55 -50
)-1
TeV
-1 s-2
flu
x @
1 P
eV (
cm
-2010
-1910
-1810
-1710
FIG. 15. IceCube 5 year sensitivity to point sources as afunction of declination. The solid (dashed) black line indicatesthe sensitivity to an E−2(E−2.5) flux. The dashed red lineindicates the lowest declination reached by the Galactic Plane.The blue points indicate the flux at 1 PeV with extrapolateduncertainties of the sources listed in Table I in the absence ofa cut-off.
a 90% C.L. upper limit on the ratio of gamma raysto cosmic rays of 1.2 × 10⁻³ for the flux coming fromthe Galactic Plane region ( −80◦ <∼ l <∼ −30◦;−10◦ <∼b <∼ 5◦) in the energy range 1.2 – 6.0 PeV. Point sourcefluxes with E−2 spectra have been excluded at a level of(E/TeV)2dΦ/dE ∼ 10−12 − 10−11 cm−2s−1TeV−1 de-pending on source declination. The full detector wasshown to be much more sensitive, because of its largersize, improved reconstruction techniques and the possi-bility to record isolated hits.
This analysis offers interesting observation possibili-ties. IceCube can search for a diffuse Galactic gamma-rayflux with a sensitivity comparable to CASA-MIA, but athigher energies. This sensitivity is reached, however, bystudying a much smaller part of the Galactic Plane thanCASA-MIA. IceCube is therefore especially sensitive to
localized sources, which might be Galactic acceleratorsor dense targets for extragalactic CRs.
The H.E.S.S. and CANGAROO-III [38] telescopeshave found several high energy gamma-ray sources inIceCube’s FOV. Most of these sources are identified asor correlated with PWNe. Their energy spectrum hasbeen measured up to a couple of tens of TeV. At thisenergy, statistics become low and for most sources nocut-off has been established. If these spectra extend toPeV energies without a break, IceCube will be able todetect them. It is also possible that an additional spec-tral component in the PeV energy range is present if anearby dense molecular cloud acts as a target for thePWN beam [39]. IceCube will be able to study thesesystems and place constraints on their behavior at veryhigh energies, or possibly detect PeV gamma-rays for thefirst time.
ACKNOWLEDGMENTS
We acknowledge the support from the following agen-cies: U.S. National Science Foundation-Office of PolarPrograms, U.S. National Science Foundation-Physics Di-vision, University of Wisconsin Alumni Research Foun-dation, the Grid Laboratory Of Wisconsin (GLOW)grid infrastructure at the University of Wisconsin -Madison, the Open Science Grid (OSG) grid infrastruc-ture; U.S. Department of Energy, and National EnergyResearch Scientific Computing Center, the LouisianaOptical Network Initiative (LONI) grid computing re-sources; National Science and Engineering ResearchCouncil of Canada; Swedish Research Council, SwedishPolar Research Secretariat, Swedish National Infrastruc-ture for Computing (SNIC), and Knut and Alice Wal-lenberg Foundation, Sweden; German Ministry for Ed-ucation and Research (BMBF), Deutsche Forschungs-gemeinschaft (DFG), Research Department of Plasmaswith Complex Interactions (Bochum), Germany; Fund

15
for Scientific Research (FNRS-FWO), FWO Odysseusprogramme, Flanders Institute to encourage scientificand technological research in industry (IWT), BelgianFederal Science Policy Office (Belspo); University of Ox-
ford, United Kingdom; Marsden Fund, New Zealand;Australian Research Council; Japan Society for Promo-tion of Science (JSPS); the Swiss National Science Foun-dation (SNSF), Switzerland.
[1] F. Aharonian, J. Buckley, T. Kifune, and G. Sinnis, Rep.Prog. Phys. 71 096901 (2008).
[2] A. A. Abdo et al. [ Milagro Collaboration ], ApJ 700,L127 (2009).
[3] A. A. Abdo et al. [ Milagro Collaboration ], ApJ 688,1078 (2008).
[4] A. Achterberg et al. [ IceCube Collaboration ], Phys. Rev.Lett. 97, 221101 (2006).
[5] R.J. Gould and G. Schreder, Phys. Rev. Lett. 16, 252(1966).
[6] M. C. Chantell et al. [ CASA-MIA Collaboration ], Phys.Rev. Lett. 79, 1805-1808 (1997).
[7] A. Borione, M. A. Catanese, M. C. Chantell, C. E. Cov-ault, J. W. Cronin, B. E. Fick, L. F. Fortson, J. Fowleret al., Astrophys. J. 493, 175-179 (1998).
[8] F. A. Aharonian, Astrophysics & Space Science 180, 305(1991).
[9] R. Abbasi et al. [ IceCube Collaboration ], Nucl. Instrum.Meth. A618, 139-152 (2010).
[10] R. Abbasi et al. [ IceCube Collaboration ], Nucl. Instrum.Meth. A601, 294-316 (2009).
[11] A. Achterberg et al. [ IceCube Collaboration ], Astropart.Phys. 26, 155-173 (2006).
[12] F. Halzen and S. R. Klein, Rev. Sci. Instrum. 81, 081101(2010)
[13] R. Abbasi et al. [ IceCube Collaboration ], [astro-ph/1207.6326]
[14] P. M. Kalberla et al. Astron. & Astrophys. 440, 775(2005).
[15] R. Abbasi et al. [ IceCube Collaboration ], ApJ 740, 16(2011).
[16] R. Abbasi et al. [ IceCube Collaboration ], ApJ 746, 33(2012).
[17] Amenomori, M. et al. [Tibet Array Collaboration ], ApJ626 L29 (2005)
[18] T. Pierog and K. Werner, Phys. Rev. Lett. 101 171101(2008)
[19] S. Tilav et al. [ IceCube Collaboration ], Proc. 31st ICRC,Lodz (2009).
[20] G. Feldman and D. Cousins, Phys. Rev. D 57, 3873(1998)
[21] J. Braun et al. Astropart. Phys. 29, 299 (2008).[22] R. Abbasi et al. [ IceCube Collaboration ], ApJ 732, 18
(2011).[23] R. Abbasi, et al. [IceCube Collaboration], [astro-
ph/1202.3039][24] E. Couderc and S. Klein, Phys. Rev. Lett. 103, 062504
(2009) L. Gerhardt and S. Klein, Phys. Rev. D82, 074017(2010).
[25] T. Stanev, Ch. Vankov, and F. Halzen, Phys. Let. B 158,75 (1985).
[26] G. Schatz et al. Proc. of 28th Int. Cosmic Ray Conf. 4,2293 (2003)
[27] G. Rowell et al. [ HESS Collaboration ], JPhCS 47, 21(2006)
[28] A. Abramowski et al. [ HESS Collaboration ], Astron. &Astrophys. 533, A103 (2011)
[29] F. Aharonian et al. [ HESS Collaboration ], Astron. &Astrophys. 507, 389 (2009)
[30] F. Aharonian et al. [ HESS Collaboration ], Astron. &Astrophys. 439, 1013 (2005)
[31] F. Aharonian et al. [ HESS Collaboration ], ApJ 692,1500 (2009)
[32] F. Acero et al. [ HESS Collaboration ], Astron. & Astro-phys. 525, A45 (2011)
[33] F. Aharonian et al. [ HESS Collaboration ], Astron. &Astrophys. 456, 245 (2006)
[34] F. Aharonian et al. [ HESS Collaboration ], Astron. &Astrophys. 477, 353 (2008)
[35] F. Aharonian et al. [ HESS Collaboration ], Astron. &Astrophys. 435, L17 (2005)
[36] M. Renaud et al. [ HESS Collaboration ], AIPC 1085,281 (2008)
[37] A. Abramowski et al. [ HESS Collaboration ], Astron. &Astrophys. 525, A46 (2011)
[38] T. Mizukami et al. ApJ 740, 78 (2011)[39] H. Bartko and W. Bednarek, MNRAS 385, 1105 (2008)
Related Documents