P OLICY R ESEARCH WORKING P APER 4901 Sea-Level Rise and Storm Surges A Comparative Analysis of Impacts in Developing Countries Susmita Dasgupta Benoit Laplante Siobhan Murray David Wheeler The World Bank Development Research Group Environment and Energy Team April 2009 WPS4901

Welcome message from author
This document is posted to help you gain knowledge. Please leave a comment to let me know what you think about it! Share it to your friends and learn new things together.
Transcript

Policy ReseaRch WoRking PaPeR 4901
Sea-Level Rise and Storm Surges
A Comparative Analysis of Impacts in Developing Countries
Susmita DasguptaBenoit LaplanteSiobhan MurrayDavid Wheeler
The World BankDevelopment Research GroupEnvironment and Energy TeamApril 2009
WPS4901

Produced by the Research Support Team
Abstract
The Policy Research Working Paper Series disseminates the findings of work in progress to encourage the exchange of ideas about development issues. An objective of the series is to get the findings out quickly, even if the presentations are less than fully polished. The papers carry the names of the authors and should be cited accordingly. The findings, interpretations, and conclusions expressed in this paper are entirely those of the authors. They do not necessarily represent the views of the International Bank for Reconstruction and Development/World Bank and its affiliated organizations, or those of the Executive Directors of the World Bank or the governments they represent.
Policy ReseaRch WoRking PaPeR 4901
An increase in sea surface temperature is evident at all latitudes and in all oceans. The current understanding is that ocean warming plays a major role in intensified cyclone activity and heightened storm surges. The vulnerability of coastlines to intensified storm surges can be ascertained by overlaying Geographic Information System information with data on land, population
This paper—a product of the Environment and Energy Team, Development Research Group—is part of a larger effort in the department to understand potential impacts of climate change. Policy Research Working Papers are also posted on the Web at http://econ.worldbank.org. The author may be contacted at [email protected].
density, agriculture, urban extent, major cities, wetlands, and gross domestic product for inundation zones likely to experience more intense storms and a 1 meter sea-level rise. The results show severe impacts are likely to be limited to a relatively small number of countries and a cluster of large cities at the low end of the international income distribution.
Sea-Level Rise and Storm Surges: A Comparative Analysis of
Impacts in Developing Countries
Susmita Dasgupta*
Benoit Laplante**
Siobhan Murray*
David Wheeler***
* Development Research Group, World Bank. ** Independent consultant, Canada. *** Center for Global Development.
Acknowledgements Financial support for this study was provided by the Research Department of the World Bank, and the Economics of Adaptation to Climate Change study administered by the Environment Department of the World Bank. Funding for the Economics of Adaptation to Climate Change study has been provided by the governments of the United Kingdom, the Netherlands, and Switzerland. We would like to extend our special thanks to Mr. Uwe Deichmann and Mr. Zahirul Haque Khan for their guidance and to Ms. Henrike Brecht for urban risk index. We are also grateful to Ms. Polly Means for her help with the composition of graphics and to Ms. Hedy Sladovich for editorial suggestions. The views expressed here are the authors’, and do not necessarily reflect those of the World Bank, its Executive Directors, or the countries they represent. Address correspondence to: Dr. Susmita Dasgupta, World Bank, 1818 H Street, NW, Mailstop MC 3-300, Washington, DC 20433, [email protected].
I. Introduction
An increase in sea surface temperature is strongly evident at all latitudes and in all
oceans. The scientific evidence indicates that increased surface temperature will intensify
cyclone activity and heighten storm surges.1 These surges2 will, in turn, create more
damaging flood conditions in coastal zones and adjoining low-lying areas. The
destructive impact will generally be greater when storm surges are accompanied by
strong winds and large onshore waves. The historical evidence highlights the danger
associated with storm surges.
During the past 200 years, 2.6 million people may have drowned during surge events
(Nicholls 2003). More recently tropical cyclone Sidr3 in Bangladesh (November 2007)
and cyclone Nargis4 in the Irrawady delta of Myanmar (May 2008) provide examples of
devastating storm-surge impacts in developing countries.
Recent scientific studies suggest that increases in the frequency and intensity of tropical
cyclones in the last 35 years can be attributed in part to global climate change (Emanuel
2005; Webster et al. 2005; Bengtsson, Rogers, and Roeckner 2006). Others have
challenged this conclusion, citing problems with data reliability, regional variability, and
appropriate measurement of sea-surface temperature and other climate variables (e.g.,
Landsea et al. 2006). Although the science is not yet conclusive (IWTC 2006: Pielke et
al. 2005), the International Workshop on Tropical Cyclones (IWTC) has recently noted
that “[i]f the projected rise in sea level due to global warming occurs, then the
vulnerability to tropical cyclone storm surge flooding would increase” and “[i]t is likely
1 A sea-surface temperature of 28o C is considered an important threshold for the development of major hurricanes of categories 3, 4 and 5 (Michaels, Knappenberger, and Davis 2005; Knutson and Tuleya 2004). 2 Storm surge refers to the temporary increase, at a particular locality, in the height of the sea due to extreme meteorological conditions: low atmospheric pressure and/or strong winds (IPCC AR4 2007). 3 According to Bangladesh Disaster Management Information Centre (report dated Nov 26, 2007) 3,243 people were reported to have died and the livelihoods of 7 millions of people were affected by Sidr (http://www.reliefweb.int/rw/RWB.NSF/db900SID/EDIS-79BQ9Z?OpenDocument ). 4 In Mayanmar, 100,000 people were reported to have died and the livelihoods of 1.5 million people were affected by Nargis (http://www.dartmouth.edu/%7Efloods/Archives/2008sum.htm )
2

that some increase in tropical cyclone peak wind-speed and rainfall will occur if the
climate continues to warm. Model studies and theory project a 3-5% increase in wind-
speed per degree Celsius increase of tropical sea surface temperatures.”
The Intergovernmental Panel on Climate Change (IPCC 2007) cites a trend since the
mid-1970s toward longer duration and greater intensity of storms, and a strong
correlation with the upward trend in tropical sea surface temperature. In addition, it notes
that hurricanes/cyclones are occurring in places where they have never been experienced
before.5 Overall, using a range of model projections, the report asserts a probability
greater than 66% that continued sea-surface warming will lead to tropical cyclones that
are more intense, with higher peak wind speeds and heavier precipitation (IPCC 2007;
see also Woodworth and Blackman 2004; Woth, Weisse, and von Storch 2006; and
Emanuel et al. 2008).6
The consensus among projections by the global scientific community points to the need
for greater disaster preparedness in countries vulnerable to storm surges. Fortunately,
significant adaptation has already occurred, and many lives have been saved by improved
disaster forecasting, and evacuation and emergency shelter procedures (Shultz, Russell,
and Espinel 2005; Keim 2006). At the same time, as recent disasters in Bangladesh and
Myanmar have demonstrated, storm-surge losses remain huge in many areas. Such losses
could be further reduced by allocating resources to increased disaster resilience,
especially given the expected intensification of storms and storm surges along
particularly vulnerable coastlines. However, setting a new course requires better
understanding of expected changes in storm surge patterns in the future.
5 The first recorded tropical cyclone in the South Atlantic occurred in March 2004 off the coast of Brazil. 6 Cyclones get their power from rising moisture which releases heat during condensation. As a result, cyclones depend on warm sea temperatures and the difference between temperatures at the ocean and in the upper atmosphere. If global warming increases temperatures at the earth’s surface but not the upper atmosphere, it is likely to provide tropical cyclones with more power (Emmanuel et al. 2008).
3
Research to date has been confined to relatively limited sets of impacts7 and locations.8
In this paper, we broaden the assessment to 84 coastal developing countries in five
regions.9 We consider the potential impact of a large (1-in-100-year) storm surge by
contemporary standards, and then compare it with intensification which is expected to
occur in this century. In modeling the future climate, we take account of changes in sea-
level rise (SLR), geological uplift and subsidence along the world’s coastlines. Our
analysis includes impact indicators for the following: affected territory, population,
economic activity (GDP), agricultural land, wetlands, major cities and other urban areas.
As far as we know, this is the first such exercise for developing countries.
Our analysis is based on the best available data for estimating the relative vulnerability of
various coastal segments to increased storm surge. However, several gaps in the data
limit our analysis. First and foremost, the absence of a global database on shoreline
protection has prevented us from incorporating the effect of existing man-made
protection measures (e.g., sea dikes) and natural underwater coastal protective features
(e.g., mangroves) on exposure estimates. Second, lack of sub-national data on impact
indicators has prevented us from including small islands in our analysis. Third, in the
absence of reliable spatially disaggregated projections of population and socioeconomic
conditions for 84 developing countries included in this analysis, we have assessed the
impacts of storm surges using existing populations, socioeconomic conditions and
patterns of land use. Human activity is generally increasing more rapidly in coastal areas,
so our estimates are undoubtedly conservative on this score. On the other hand, we also
have not attempted to estimate the countervailing effects of planned adaptation measures
related to infrastructure (e.g., coastal embankments) and coastal-zone management (e.g.,
land-use planning, regulations, relocation). Fourth, among the 84 developing countries
included in this analysis, we restrict our analysis to coastal segments where historical
storm surges have been documented. Fifth, we did not assess the relative likelihoods of
alternative storm surge scenarios. Following Nicholls et al. 2007, we assume a
7 For example, Nicholls et al. (2007) assess the impacts of climate extremes on port cities of the world. 8 For example, the impacts of storm surges have been assessed for Copenhagen (Hallegatte et al., 2008); Southern Australia (McInnes et al. 2008); and the Irish Sea (Wang et al. 2008). 9 We have employed the five World Bank regions: East Asia & Pacific, Middle East & North Africa, Latin America & Caribbean, South Asia, Sub-Saharan Africa.
4

homogeneous future increase of 10% in extreme water levels during tropical storms. In
all likelihood, some regions of the world may experience a smaller increase and others a
larger increase. Better local modeling of the impact of climate change on storm intensities
will further fine tune future forecasts.
In the next section, we describe the methodology and data sources used to estimate the
impact of storm surges in developing countries. Results are presented in Section III first
at the global level, and then for each of the five regions. The above 6 indicators are
further presented individually for each country comprising each of the five regions.
Section IV concludes.
II. Methodology and data sources
This section briefly discusses the methodology and data sources pertaining to the
delineation of storm surge zones, and then discusses the methodology and data sources
for the impact indicators used in this paper.
II.1 Storm surge zones
(i) Methodology
Recently released hydrologically conditioned version of SRTM data (part of the
HydroSHEDS dataset) was used for elevation in this analysis. All 5ºx5º coastal tiles of
hydrologically conditioned version of 90 m SRTM data were downloaded from
http://gisdata.usgs.net/Website/HydroSHEDS/viewer.php. Conditioning of the SRTM
data refers to a series of processing steps that alter elevation values in order to produce a
surface that drains to the coast (except in cases of known internal drainages). These steps
include filtering, lowering of stream courses and adjacent pixels, and carving out barriers
to stream flow. Despite known limitations, SRTM represents the best available high
resolution global elevation model and, to our knowledge, there is no global dataset of
shoreline protection.
5
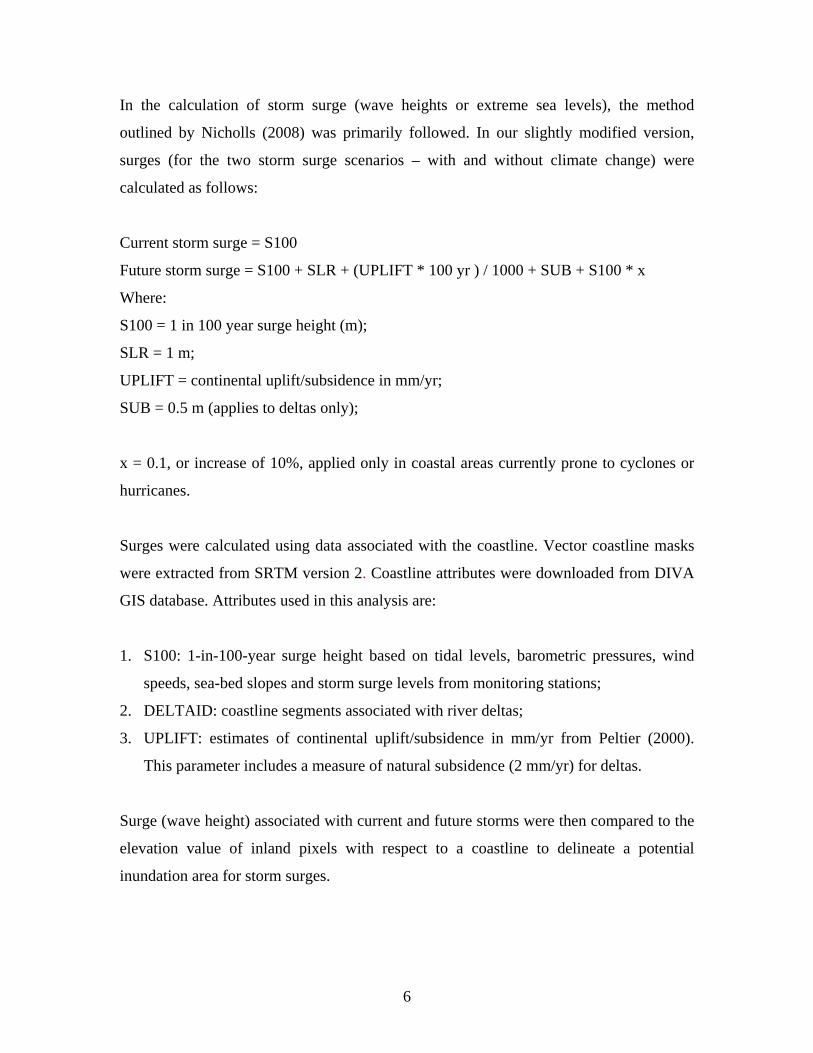
In the calculation of storm surge (wave heights or extreme sea levels), the method
outlined by Nicholls (2008) was primarily followed. In our slightly modified version,
surges (for the two storm surge scenarios – with and without climate change) were
calculated as follows:
Current storm surge = S100
Future storm surge = S100 + SLR + (UPLIFT * 100 yr ) / 1000 + SUB + S100 * x
Where:
S100 = 1 in 100 year surge height (m);
SLR = 1 m;
UPLIFT = continental uplift/subsidence in mm/yr;
SUB = 0.5 m (applies to deltas only);
x = 0.1, or increase of 10%, applied only in coastal areas currently prone to cyclones or
hurricanes.
Surges were calculated using data associated with the coastline. Vector coastline masks
were extracted from SRTM version 2. Coastline attributes were downloaded from DIVA
GIS database. Attributes used in this analysis are:
1. S100: 1-in-100-year surge height based on tidal levels, barometric pressures, wind
speeds, sea-bed slopes and storm surge levels from monitoring stations;
2. DELTAID: coastline segments associated with river deltas;
3. UPLIFT: estimates of continental uplift/subsidence in mm/yr from Peltier (2000).
This parameter includes a measure of natural subsidence (2 mm/yr) for deltas.
Surge (wave height) associated with current and future storms were then compared to the
elevation value of inland pixels with respect to a coastline to delineate a potential
inundation area for storm surges.
6

Each inland pixel could be associated with the nearest coastline segment, in a straight-
line distance. However, in order to better capture the movement of water inland, in this
analysis hydrological drainage basins have been used instead. The wave height calculated
for the coastline segment closest to the basin outlet was applied to inland areas within
that basin.
As a wave moves inland the height is diminished. The rate of decay depends largely on
terrain and surface features, as well as factors specific to the storm generating the wave.
In a case study on storm surges, Nicholls (2006) refers to a distance decay factor of 0.2-
0.4 m per 1 km that can be applied to wave heights in relatively flat coastal plains. For
this analysis, we used 0.3 m per 1 km distance from coastline to estimate the reduction in
wave height applied to each inland cell.
The delineation of surge zones was then based on a simple comparison of the calculated
wave height, taking into account distance decay, to the SRTM value. If the elevation
value of any location is less than the wave height, then the location is part of the surge
zone. Low-elevation “coastal zone” was delineated from inland pixels with less than
10m elevation- near the coastline, following McGranahan, Balk, and Anderson (2007).
All processing was done by 5º x 5º tile, using aml (ArcInfo Macro Language) for
automation.
(ii) Datasets
The following datasets were used to delineate inundation areas:
1) Hydrosheds conditioned 90m DEM
Hydrologically conditioned version of 90 m SRTM data, conditioned to produce a
surface that drains to the coast (except in cases of known internal drainages).
7

2) Hydroshed basins
The unofficial version of drainage basins derived from conditioned DEM in regional
subsets downloaded from http://gisdata.usgs.net/Website/HydroSHEDS/viewer.php.
3) SRTM coastline
Vector coastline mask derived by National Geospatial-Intelligence Agency during editing
of SRTM version 2.
4) DIVA GIS database
A segmented linear representation of the coastline and a wide range of attributes
associated with each segment from the DIVA GIS database -downloaded from
http://diva.demis.nl/files/.
II.2 Indicators of impacts
(i) Methodology
Estimates for each indicator were calculated by overlaying the inundation zone with the
appropriate exposure surface dataset (land area, GDP, population, urban extent,
agriculture extent, and wetland).10 Exposure surface data were collected from various
public sources. Unless otherwise indicated, latitude and longitude are specified in
decimal degrees. The horizontal datum used is the World Geodetic System 1984. For area
calculation, grids representing cell area in square kilometers were created at different
resolutions, using length of a degree of latitude and longitude at cell center.
For the exposure surfaces, two GIS models were built for calculating the exposed value.
Since the units for GDP and population are in millions of U.S. dollars and number of
people, respectively, the exposure was calculated by multiplying the exposure surface
10 The delineated surge zones and coastal zone are at a resolution of 3 arc seconds (approximately 90 m). The resolution of indicator datasets ranges from 9 arc seconds to 30 arc seconds. Due to this difference in resolution, a surge zone area may occupy only a portion of a single cell in an indicator dataset. In this case, the surge zone is allocated only a proportion of the indicator cell value.
8
with the inundation zone and then summing to a country total. Exposure indicators, such
as land surface, urban extent, agriculture extent and wetlands were measured in square
kilometers.
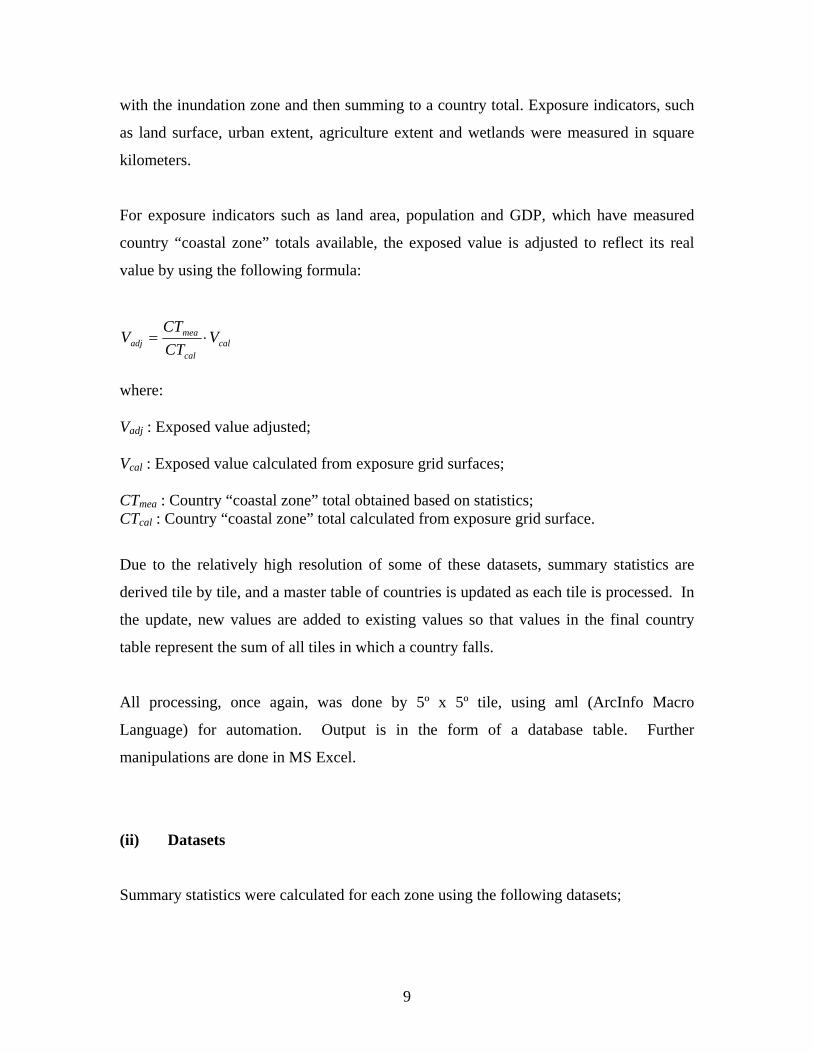
For exposure indicators such as land area, population and GDP, which have measured
country “coastal zone” totals available, the exposed value is adjusted to reflect its real
value by using the following formula:
calcal
meaadj V
CT
CTV
where: Vadj : Exposed value adjusted;
Vcal : Exposed value calculated from exposure grid surfaces;
CTmea : Country “coastal zone” total obtained based on statistics; CTcal : Country “coastal zone” total calculated from exposure grid surface.
Due to the relatively high resolution of some of these datasets, summary statistics are
derived tile by tile, and a master table of countries is updated as each tile is processed. In
the update, new values are added to existing values so that values in the final country
table represent the sum of all tiles in which a country falls.
All processing, once again, was done by 5º x 5º tile, using aml (ArcInfo Macro
Language) for automation. Output is in the form of a database table. Further
manipulations are done in MS Excel.
(ii) Datasets
Summary statistics were calculated for each zone using the following datasets;
9

5) GRUMP 2005 (pre-release) gridded population dataset
A global gridded population dataset of approximately 1 km resolution produced by the
Center for Earth Science Information Network (CIESIN) at Columbia University. Sub-
national urban and rural population are allocated to grid cells using an urban extents mask
and most recent census data adjusted to reflect U.N. projections for 2005. Data for the
year 2005 were provided by ftp upon special request. The GRUMP alpha version for the
year 2000 is available for download at: http://sedac.ciesin.columbia.edu/gpw/global.jsp.
6) 2005 gridded GDP surface
A global gridded dataset in which shares of GDP, in 2000 USD, are allocated to 1 km
grid cells, using GRUMP 2005 population data, urban/rural extents mask, and, where
available, regional accounts data for countries. Regional shares of GDP were
standardized using 2005 estimated GDP in 2000 USD and allocated to cells on a rural or
urban per capita basis. Data are not currently available for download.
7) Globcover 2.1
A global land cover dataset of approximately 300 m resolution produced by the European
Space Agency (ESA). Globcover 2.1 was based on imagery acquired between December
2004 and June 2006 by ENVISAT’s Medium Resolution Imaging Spectrometer
(MERIS). The 22 general land cover categories derived by automatic and regionally
specific classification include four agricultural classes which are used in this analysis.
Data are available for download at: http://www.esa.int/due/ionia/globcover.
Note that the Globcover database covers three different types of agricultural land use
indicator. A first indicator includes areas which most of the coverage is
rainfed/irrigated/post-flooding cropland. A second indicator includes areas for which 50-
70% is made of mosaic cropland and the rest is made of grassland, shrubland, and forest.
A third indicator includes areas for which 20-50% is made of mosaic cropland and the
rest is made of grassland, shrubland, and forest. For purpose of identifying impacted
agricultural extent, in this research we have retained solely the agricultural land identified
10
as rainfed/irrigated/post-flooding cropland (the first indicator above). As a result, our
calculations are likely to underestimate the impacts on agricultural extent.
8) GLWD-3
A global gridded dataset of wetland areas of approximately 1 km resolution, developed
by the World Wildlife Fund in partnership with Center for Environmental Systems
Research, University of Kassel, Germany. In the dataset wetlands are differentiated by
type, but for the purposes of this analysis all wetlands are considered equal. Data are
available for download at: http://www.worldwildlife.org/science/data/item1877.html.
9) GRUMP urban area
A global gridded dataset of urban extents compiled by the CIESIN GRUMP project from
built-up areas polygons (DCW) and the NOAA-NGDC Nighttime Lights dataset derived
from satellite imagery. Nighttime Lights is a dataset of visible light detected by the
DMSP-OLS system. It is known to somewhat exaggerate the extent of lit areas due to
spatial resolution and other characteristics of the sensor. A revised version of the
GRUMP alpha urban extents dataset was provided by ftp upon request, but is not
currently publicly available.
10) City Polygons from Urban Risk Index
A subset of urban extent polygons from the GRUMP urban extents layer was linked to
the urban population growth dataset compiled by Henderson 2002. Decision rules
describing point-to-polygon linking are described in detail in the dataset documentation.
In general, a polygon was assigned to a city based on the city affiliation of the center of
the polygon. In cases of merging urban extents, thiessen polygons were created to divide
urban extents from one another.
A summary of the various datasets used in this analysis is presented in Table 1.
11

Table 1. Summary of data sources
Dimension Dataset Name Unit Resolution Source(s)
Coastline SRTM v2 Surface Water Body Data
NASA
Elevation Hydrosheds conditioned SRTM 90m DEM
Km2 90m http://gisdata.usgs.net/Website/HydroSHEDS/viewer.php.
Watersheds Hydrosheds Drainage Basins
Km2 http://gisdata.usgs.net/Website/HydroSHEDS/viewer.php.
Coastline Attributes DIVA GIS database
http://diva.demis.nl/files/
Population GRUMP 2005 (pre-release) gridded population dataset
Population counts 1km CIESIN
GDP 2005 GDP Surface Million USD 1km World Bank , 2008
Agricultural Land Globcover 2.1 Km2 300m http://www.esa.int/due/ionia/globcover
Urban areas Grump, revised Km2 1km CIESIN
Wetlands GLWD-3 Km2 1km http://www.worldwildlife.org/science/data/item1877.html
Cities City Polygons with Population Time Series
Urban Risk Index*
*Urban extents from GRUMP (alpha) (http://sedac.ciesin.org/gpw/ ) joined with World Cities Data (J. Vernon Henderson 2002). http://www.econ.brown.edu/faculty/henderson/worldcities.html
III. Results
This section first presents global results across regions. Then it examines country results
for each of the following five regions: Sub-Saharan Africa, East Asia, Latin America &
Caribbean, Middle East & North Africa, and South Asia, and presents a summary of
results by most impacted countries for each indicator used in this paper.
12

III.1 Global results
As shown in Table 2, the impacts of SLR and the intensification of storm surges will
significantly increase over time compared to existing 1-in-100-year storm surges. At
present, approximately 19.5% (391,812 km2) of the combined coastal territory of 84
countries considered in this analysis is vulnerable to inundation from a 1-in-a-100-year
storm surge. A 10% future intensification of storm surges will increase the potential
inundation zone to 25.7% (517,255 km2) of coastal territory, taking into account sea-level
rise. This translates to a potential inundation for an additional population of 52 million;
29,164 km2 of agricultural area; 14,991 km2 of urban area; 9% of coastal GDP and 29.9%
of wetlands.
Table 2: Impacts of intensification of storm surges across indicators at the global level
Current Storm
Surge With Intensification
Coastal Land Area (Total= 2,012,753 km2 ) Exposed area 391,812 517,255 % of total coastal area 19.5 25.7 Coastal Population (Total= 707,891,627) Exposed population 122,066,082 174,073,563 % of total coastal population 17.2 24.6 Coastal GDP (Total =1,375,030 million USD) Exposed GDP (USD) 268,685 390,794 % of total coastal GDP 19.5 28.4 Coastal Urban area (Total=206,254 km2 ) Exposed area 40,189 55,180 % of total coastal urban area 19.5 26.8 Coastal Agricultural area (Total = 505,265 km2) Exposed area 59,336 88,500 % of total coastal agricultural area 11.7 17.5 Coastal Wetlands Area (Total = 663,930 km2) Exposed area 152,767 198,508 % of total coastal wetlands area 23.0 29.9
13
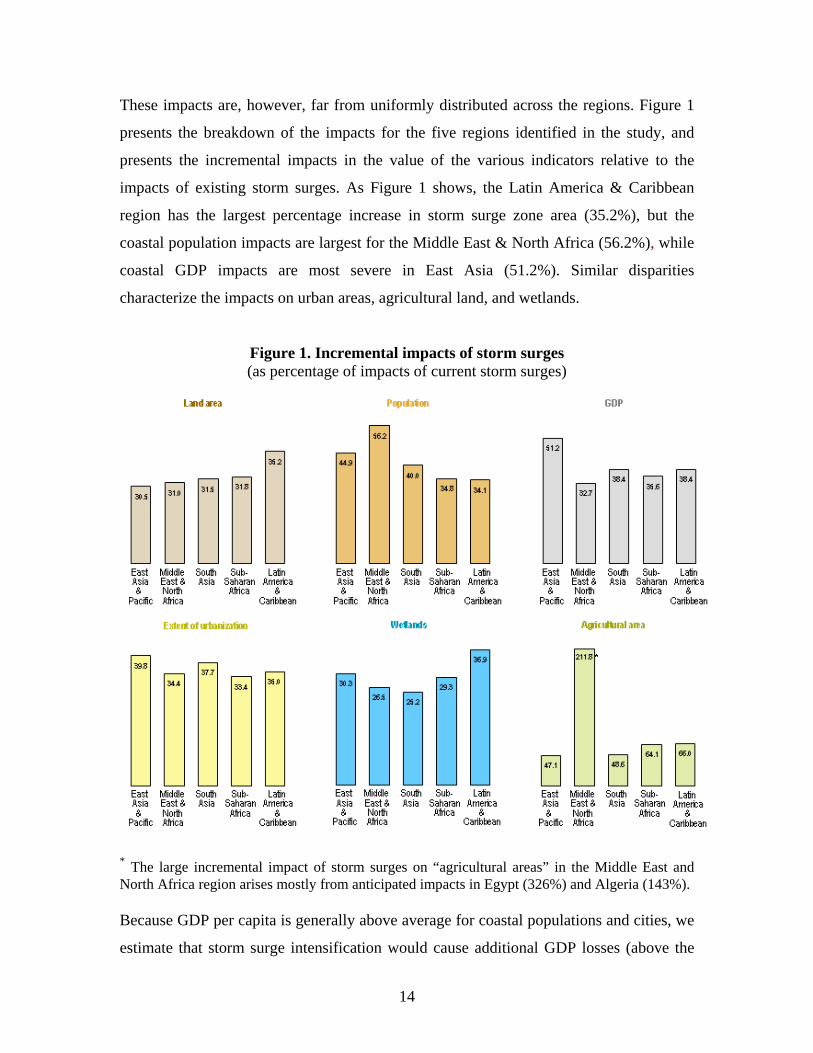
These impacts are, however, far from uniformly distributed across the regions. Figure 1
presents the breakdown of the impacts for the five regions identified in the study, and
presents the incremental impacts in the value of the various indicators relative to the
impacts of existing storm surges. As Figure 1 shows, the Latin America & Caribbean
region has the largest percentage increase in storm surge zone area (35.2%), but the
coastal population impacts are largest for the Middle East & North Africa (56.2%), while
coastal GDP impacts are most severe in East Asia (51.2%). Similar disparities
characterize the impacts on urban areas, agricultural land, and wetlands.
Figure 1. Incremental impacts of storm surges (as percentage of impacts of current storm surges)
* The large incremental impact of storm surges on “agricultural areas” in the Middle East and North Africa region arises mostly from anticipated impacts in Egypt (326%) and Algeria (143%). Because GDP per capita is generally above average for coastal populations and cities, we
estimate that storm surge intensification would cause additional GDP losses (above the
14
current 1-in-100-year reference standard) of $84.9 billion in the East Asia & Pacific
region, $12.7 billion in the Middle East & North Africa, $8.4 billion in South Asia, $14.4
billion in Latin America & the Caribbean and $1.8 billion in Sub-Saharan Africa.
The increase of impact on agricultural areas is significant for the Middle East & North
Africa Region, mainly because Egyptian and Algerian cropland in surge zones would
increase from the existing estimated 212 km2 to approximately 900 km2 with SLR and
intensified storm surges.
III.2 Country specific results
This subsection examines country specific results for each of the five regions. To
facilitate the reading of these results, we follow a similar structure of presentation for all
regions, recognizing that readers may examine results for specific regions of interest, as
opposed to specific indicators across all regions. For comparative absolute values of
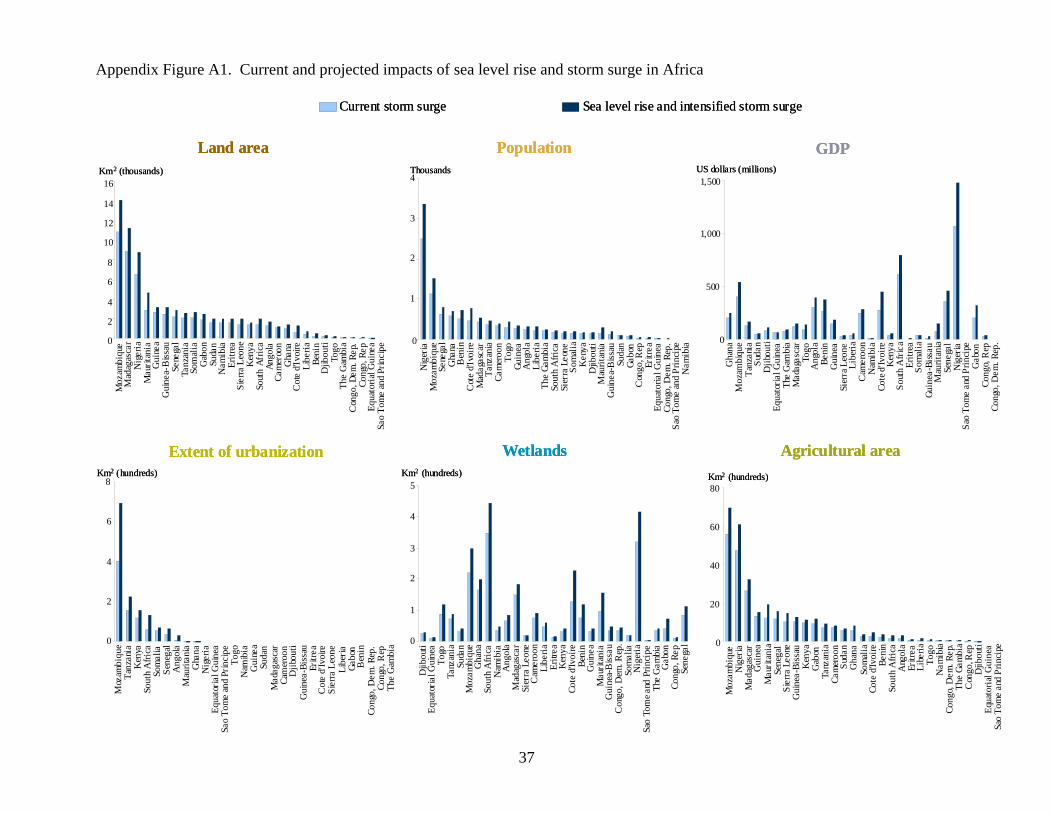
storm surge impacts, see Appendix Figure A1-A5 starting on page 39.
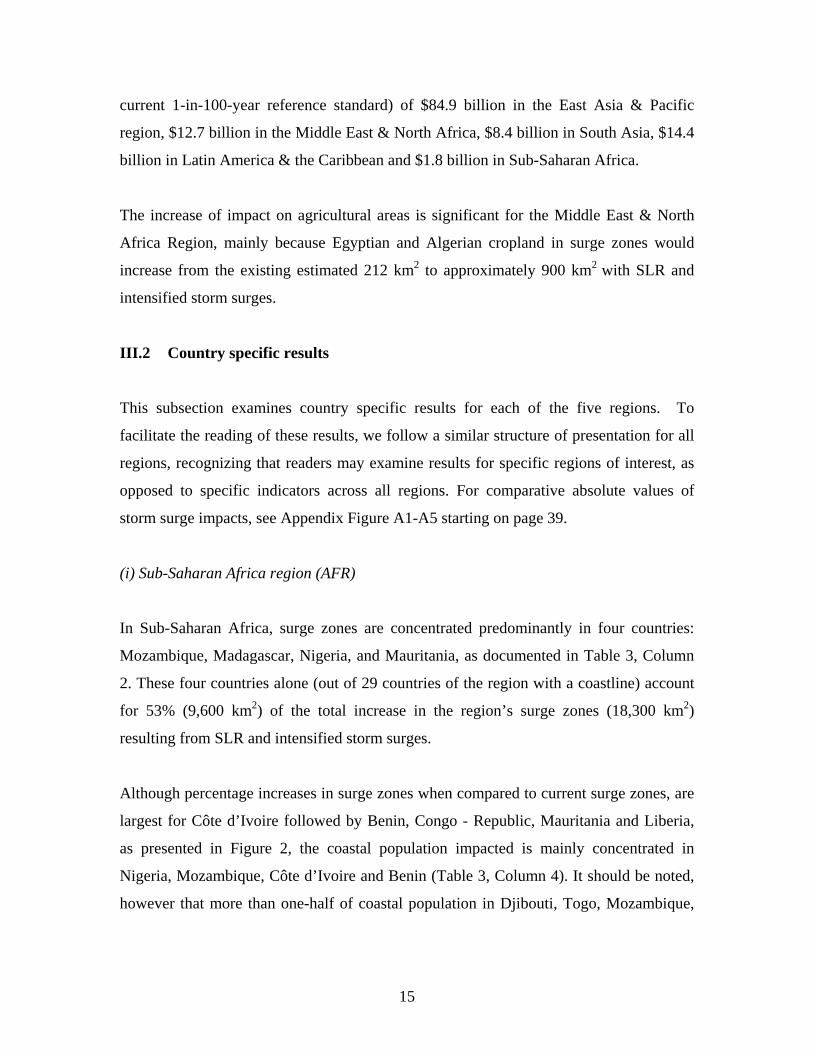
(i) Sub-Saharan Africa region (AFR)
In Sub-Saharan Africa, surge zones are concentrated predominantly in four countries:
Mozambique, Madagascar, Nigeria, and Mauritania, as documented in Table 3, Column
2. These four countries alone (out of 29 countries of the region with a coastline) account
for 53% (9,600 km2) of the total increase in the region’s surge zones (18,300 km2)
resulting from SLR and intensified storm surges.
Although percentage increases in surge zones when compared to current surge zones, are
largest for Côte d’Ivoire followed by Benin, Congo - Republic, Mauritania and Liberia,
as presented in Figure 2, the coastal population impacted is mainly concentrated in
Nigeria, Mozambique, Côte d’Ivoire and Benin (Table 3, Column 4). It should be noted,
however that more than one-half of coastal population in Djibouti, Togo, Mozambique,
15

Tanzania, and Sudan would be subject to inundation risks from intensification of storm
surges and SLR (Table 3, Column 5).
Figure 2: Percentage increase in storm surge zone, AFR Region
0.0
20.0
40.0
60.0
80.0
100.0
120.0
Co
te d
'Ivo
ire
Ben
in
Co
ng
o, R
ep
Mau
rita
nia
Lib
eria
To
go
Co
ng
o, D
em. R
ep.
So
uth
Afr
ica
Gh
ana
Sie
rra
Leo
ne
An
go
la
Nig
eria
Djib
ou
ti
Gab
on
Sen
egal
Mo
zam
biq
ue
Nam
ibia
Eq
uat
ori
al G
uin
ea
Th
e G
amb
ia
Eri
trea
Gu
inea
-Bis
sau
So
mal
ia
Mad
agas
car
Su
dan
Tan
zan
ia
Ken
ya
Cam
ero
on
Gu
inea
Sao
To
me
and
Pri
nci
pe
% In
crea
se
Mozambique, Ghana and Togo may lose more than 50% of their coastal GDP, while
GDP loss in absolute terms will be highest in Nigeria ($407.61 million) (Table 3,
Columns 6 and 7). Coastal agriculture, in terms of extent of croplands, will be affected
100% in Nigeria and 66.67% in Ghana, 50% in Togo and Equatorial Guinea (Table 3,
Column 9).
Numerous countries of the Sub-Saharan Africa region: Djibouti, Togo, Mozambique,
Tanzania, Equatorial Guinea, Côte d’Ivoire, Namibia and Sudan will experience
significant increases in the percentage of their coastal urban extent falling within surge
zones with SLR and intensified storm surges (Table 3, Column 11).
As far as coastal wetlands are concerned, absolute impacts will be largest in Nigeria
(1,365 km2), Mozambique (1,318 km2) and Madagascar (617 km2). Although small in
terms of area measured in square km, up to 82% of the coastal wetlands of Namibia, 62%
of Guinea, 59% of Sudan, and 53% of Kenya would be susceptible to significant damages
from SLR and intensified storm surges.
16
Table 3: Sub-Saharan Africa
Country
Incremental Impact: Land Area (sq. km)
Projected Impact as a % of Coastal Total
Incremental Impact: Population
Projected Impact as a % of Coastal Total
Incremental Impact: GDP (mil. USD)
Projected Impact as a % of Coastal Total
Incremental Impact: Agr. Area (sq. km)
Projected Impact as a % of Coastal Total
Incremental Impact: Urban Extent (sq. km)
Projected Impact as a % of Coastal Total
Incremental Impact: Wetlands (sq. km)
Projected Impact as a % of Coastal Total
Mozambique 3,268 41.21 380,296 51.73 140.73 55.02 291 23.58 78 55.06 1,318 47.07Madagascar 2,312 44.69 102,439 42.69 27.89 44.17 0 36 44.12 617 51.32Nigeria 2,264 30.89 870,276 25.40 407.61 21.96 0 100.00 94 28.51 1,365 38.84Mauritania 1,754 21.39 149,576 32.93 74.21 34.89 0 1.60 59 42.70 710 33.39Senegal 677 16.50 190,690 20.68 111.66 21.15 29 2.01 27 16.09 395 22.04Guinea-Bissau 670 35.71 61,314 32.94 10.01 32.51 0 12 34.06 278 40.01Cote d'Ivoire 668 29.21 315,609 48.36 176.27 43.17 0 99 53.16 162 38.07Gabon 630 25.64 34,500 28.43 120.95 24.08 0 30 30.38 253 27.33South Africa 607 43.09 48,143 32.91 174.30 30.98 70 34.48 93 48.10 132 46.23Somalia 555 28.21 33,756 31.04 8.90 25.86 15 16.46 1 25.00 94 24.81Sierra Leone 549 28.88 39,080 34.62 5.69 38.34 0 1 37.25 451 33.50Namibia 470 60.20 957 42.24 2.31 37.01 0 13 50.00 18 81.55Angola 457 29.10 72,448 45.76 88.54 45.39 23 13.89 19 46.20 129 14.81Eritrea 452 32.15 8,238 31.19 0.97 28.55 0 0.00 4 42.86 31 31.79Tanzania 426 46.71 75,493 49.90 34.45 49.22 64 22.47 15 53.37 177 42.20Guinea 420 58.58 58,967 43.68 37.99 40.21 0 8 33.33 193 62.22Ghana 400 39.16 137,206 49.16 45.04 51.07 0 66.67 35 48.53 268 47.83Sudan 370 49.67 18,762 49.49 10.77 48.04 0 0.00 7 50.00 107 58.69Kenya 274 41.93 27,453 40.23 10.12 32.05 40 22.13 9 38.89 177 52.51Liberia 269 26.62 88,535 44.63 16.77 41.11 0 15 42.96 44 46.32Benin 260 19.50 221,029 38.99 107.35 46.75 0 0.00 44 44.24 164 21.26Cameroon 172 39.57 57,214 34.76 44.53 32.32 0 14 40.36 111 42.97Togo 95 34.18 147,274 54.18 48.20 54.47 1 50.00 28 59.79 52 26.62Djibouti 82 37.98 28,559 60.12 22.87 49.34 0 5 60.42 7 19.31Congo 65 15.29 10,361 22.14 13.14 21.92 0 3 21.15 20 10.68Dem. Rep. of Congo 51 17.33 1,812 7.63 0.17 11.93 0 9 31.85 21 23.29The Gambia 39 4.40 47,233 39.95 18.54 46.89 0 0.00 8 23.86 21 4.21Equatorial Guinea 22 17.28 892 38.45 6.32 41.46 0 50.00 1 52.63 4 8.49Sπo Tome and Principe 2 44.44 1,053 24.01 0.30 20.37 0 33.33 1 30.00 0

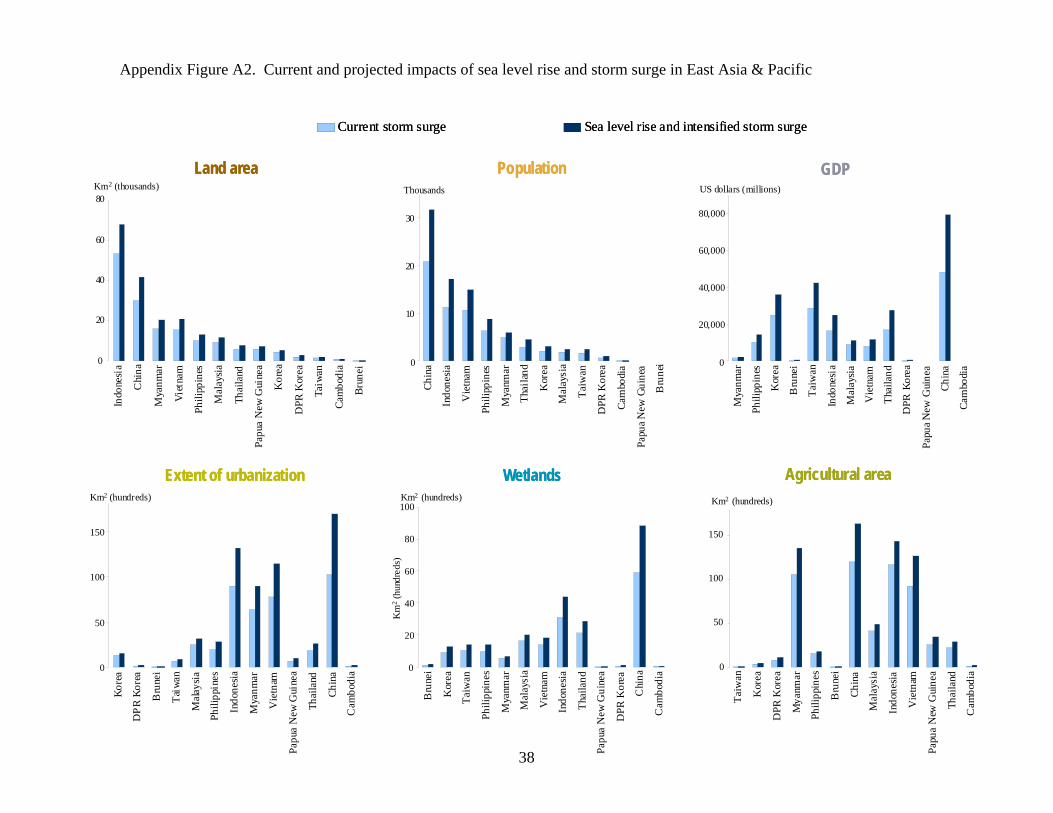
(ii) East Asia & Pacific region (EAP)
In the EAP region, the percentage increase in surge zones when compared to current
surge zones, are largest for China (39.4%), followed by Vietnam (35.1%), Thailand
(32.7%) and Democratic Republic of Korea (31.9%) as documented in Figure 3.
Figure 3: Percentage increase in storm surge zone, EAP Region
0.0
5.0
10.0
15.0
20.0
25.0
30.0
35.0
40.0
45.0
Ch
ina
Vie
tna
m
Th
aila
nd
DP
R K
ore
a
My
an
ma
r
Bru
ne
i
Ca
mb
od
ia
Ph
ilip
pin
es
Pa
pu
a N
ew
Gu
ine
a
Ta
iwa
n
Ind
on
es
ia
Ma
lay
sia
Ko
rea
% In
crea
se
As expected, absolute impacts of SLR and intensified storm surges on land area and
coastal population are largest in Indonesia (14,407 km2 and 5.84 million), China (11,827
km2 and 10.83 million) and Vietnam (5,432 km2 and 4.4 million). Surge prone areas as a
percentage of country coastal totals, however, will be highest in Republic of Korea
(61.73%) followed by Taiwan, China (49.95%); and exposed population as a percentage

19
of coastal totals will exceed 50% in the Republic of Korea (Table 3, Columns 2, 3, 4 and
5).
A similar disparity between absolute and relative impacts emerges with respect to
impacted coastal GDP, agricultural croplands, urban extent, and wetlands. While a
potential loss of GDP for China is $31.2 billion, Taiwan, China $13.8 billion, Republic of
Korea $10.7 billion, Thailand $10.2 billion; Philippines and Myanmar are likely to lose
52.29% and 48.89% of their coastal GDP respectively (Table 3, Columns 6 and 7). Areas
of croplands along the coast exposed to intensified storm surges are heavily concentrated
in China (6,642 km2), Indonesia (4,114 km2), Vietnam (3,612 km2) and Myanmar (2,512
km2 ; storm-prone cropland as a percentage of coastal cropland, on the other hand is large
in Republic of Korea (67%) and the Democratic Republic of Korea (58%) (Table 3,
Columns 8 and 9). Urban extent of 2,901 km2 in China and 1,285 km2 in Indonesia will
be vulnerable to storm surges but these areas account for relatively small percentages of
their respective coastal urban extent. Approximately, 95% of coastal wetlands in Taiwan,
China, 79% of Republic of Korea, 59% of Democratic Republic of Korea and 50% of
Myanmar will be susceptible although areas measured in square km are small in number
(Table 3, Columns 12 and 13).

Table 4: East Asia & Pacific
Country
Incremental Impact: Land Area (sq. km)
Projected Impact as a % of Coastal Total
Incremental Impact: Population
Projected Impact as a % of Coastal Total
Incremental Impact: GDP (mil. USD)
Projected Impact as a % of Coastal Total
Incremental Impact: Agr. Area (sq. km)
Projected Impact as a % of Coastal Total
Incremental Impact: Urban Extent (sq. km)
Projected Impact as a % of Coastal Total
Incremental Impact: Wetlands (sq. km)
Projected Impact as a % of Coastal Total
Indonesia 14,407 26.64 5,835,462 32.75 7993.67 38.71 4,114 26.12 1,285 33.25 2,686 26.97China 11,827 17.52 10,830,658 16.67 31243.13 17.15 6,642 11.66 2,901 15.70 4,360 39.77Vietnam 5,432 28.41 4,371,059 27.27 3653.64 31.66 3,612 23.79 466 35.84 3,528 29.43Myanmar 4,641 33.45 1,106,570 40.85 361.86 48.89 2,512 22.88 158 39.93 3,001 50.23Philippines 2,913 40.93 2,393,411 46.59 4264.22 52.29 851 30.71 363 42.93 255 44.98Malaysia 2,238 29.09 522,430 33.54 2430.28 32.67 677 29.74 386 34.35 850 34.91Thailand 1,956 19.21 1,564,403 24.82 10204.60 31.55 827 11.64 766 24.59 720 14.65Papua New Guinea 1,623 19.46 18,340 21.72 14.47 22.32 245 20.82 14 26.67 907 15.87Rep. of Korea 902 61.73 863,427 50.48 10669.87 47.86 237 66.75 335 48.15 77 78.81Dem. People's Rep. of Korea 694 42.90 370,209 28.87 177.78 27.59 27 58.28 42 20.96 258 58.98Taiwan, China 446 49.95 780,109 45.43 13755.95 44.17 274 39.78 374 44.06 2 95.24Cambodia 248 3.26 41,691 2.44 18.85 2.69 79 1.04 19 13.17 44 1.50Brunei 64 39.48 10,304 42.18 127.32 39.87 13 38.06 33 45.36 15 38.35
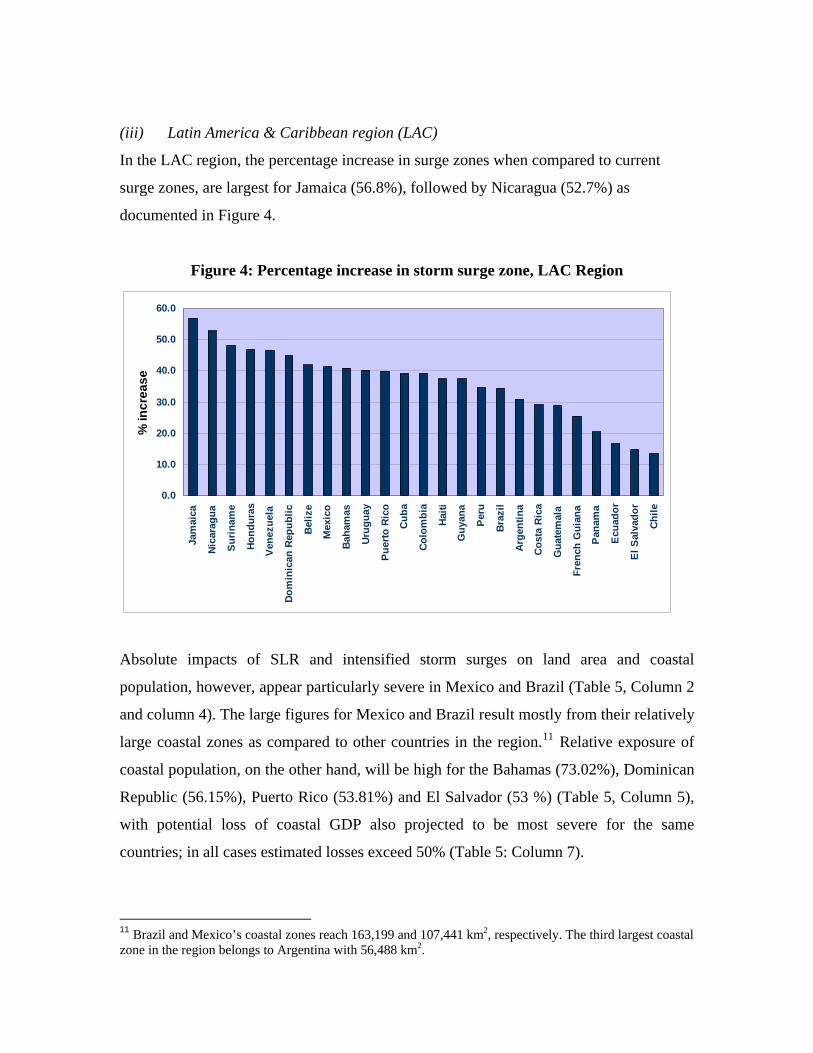
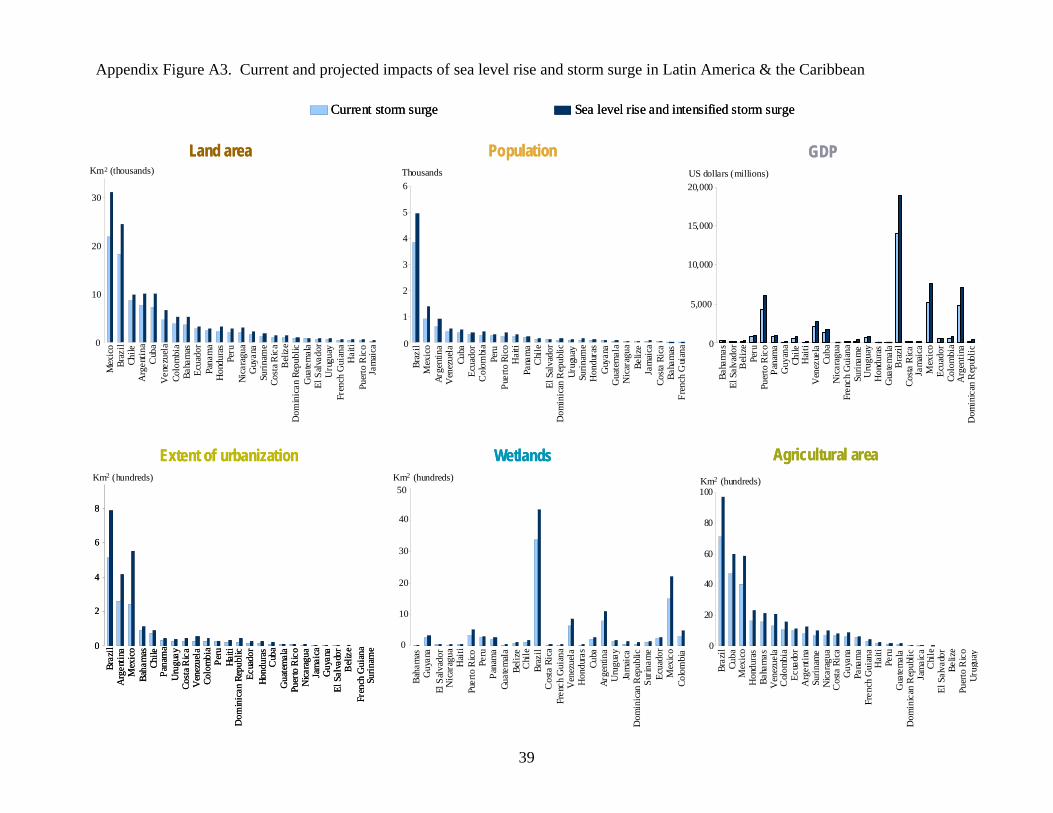
(iii) Latin America & Caribbean region (LAC)
In the LAC region, the percentage increase in surge zones when compared to current
surge zones, are largest for Jamaica (56.8%), followed by Nicaragua (52.7%) as
documented in Figure 4.
Figure 4: Percentage increase in storm surge zone, LAC Region
0.0
10.0
20.0
30.0
40.0
50.0
60.0
Jam
aica
Nic
arag
ua
Su
rin
ame
Ho
nd
ura
s
Ven
ezu
ela
Do
min
ican
Rep
ub
lic
Bel
ize
Mex
ico
Bah
amas
Uru
gu
ay
Pu
erto
Ric
o
Cu
ba
Co
lom
bia
Hai
ti
Gu
yan
a
Per
u
Bra
zil
Arg
enti
na
Co
sta
Ric
a
Gu
atem
ala
Fre
nch
Gu
ian
a
Pan
ama
Ecu
ado
r
El
Sal
vad
or
Ch
ile
% in
cre
as
e
Absolute impacts of SLR and intensified storm surges on land area and coastal
population, however, appear particularly severe in Mexico and Brazil (Table 5, Column 2
and column 4). The large figures for Mexico and Brazil result mostly from their relatively
large coastal zones as compared to other countries in the region.11 Relative exposure of
coastal population, on the other hand, will be high for the Bahamas (73.02%), Dominican
Republic (56.15%), Puerto Rico (53.81%) and El Salvador (53 %) (Table 5, Column 5),
with potential loss of coastal GDP also projected to be most severe for the same
countries; in all cases estimated losses exceed 50% (Table 5: Column 7).
11 Brazil and Mexico’s coastal zones reach 163,199 and 107,441 km2, respectively. The third largest coastal zone in the region belongs to Argentina with 56,488 km2.

22
Coastal agriculture, in terms of extent of croplands, will be affected 100% in Guyana and
66.67% in El Salvador (Table 5: Column 9). Urban extent along the coast will be highly
vulnerable to inundation from storm surges in Bahamas (94.12%), Suriname (66.41%),
Puerto Rico (51.23%) and El Salvador (49.64%) (Table 5, Column 11).
Finally, inundation risk from storm surges will cover 100% of coastal wetlands in
Dominican Republic and El Salvador followed by 71.4% in Bahamas, 67.34% in Belize,
54.26% in Ecuador and 52.25% in Mexico (Table 5, Column 13).

Table 5: Latin America & Caribbean
Country
Incremental Impact: Land Area (sq. km)
Projected Impact as a % of Coastal Total
Incremental Impact: Population
Projected Impact as a % of Coastal Total
Incremental Impact: GDP (mil. USD)
Projected Impact as a % of Coastal Total
Incremental Impact: Agr. Area (sq. km)
Projected Impact as a % of Coastal Total
Incremental Impact: Urban Extent (sq. km)
Projected Impact as a % of Coastal Total
Incremental Impact: Wetlands (sq. km)
Projected Impact as a % of Coastal Total
Mexico 9,136 29.04 463,833 20.56 2571.55 21.22 310 10.89 701 18.35 1,765 52.25Brazil 6,281 15.08 1,151,493 30.37 4889.48 28.48 275 16.47 960 33.67 2,597 11.48Cuba 2,876 37.22 131,272 34.89 463.78 34.47 8 25.97 81 29.55 1,301 49.46Argentina 2,407 18.03 278,155 19.52 2242.71 16.42 157 9.93 313 27.47 459 11.30R.B. de Venezuela 2,142 14.19 119,215 33.83 619.73 33.92 28 9.30 202 29.90 763 19.99Bahamas, The 1,517 54.67 3,711 73.02 48.92 65.69 24 47.39 1 94.12 553 71.40Colombia 1,473 17.88 124,875 19.07 263.18 18.14 16 5.62 199 17.68 483 23.21Chile 1,180 54.67 31,309 38.49 152.64 37.50 16 27.60 46 38.44 20 18.71Honduras 1,055 36.07 25,592 31.03 20.84 28.56 8 22.33 8 25.97 701 39.19Nicaragua 1,048 15.11 12,912 32.12 10.26 31.84 4 9.88 7 46.46 353 36.86Peru 727 36.69 61,009 46.90 177.12 46.18 5 26.92 54 42.72 20 37.91Guyana 640 20.35 29,491 37.49 43.22 46.38 0 100.00 93 66.41 234 13.75Suriname 637 15.43 51,427 36.63 136.49 37.44 0 53 23.70 343 12.52Panama 501 40.71 39,998 45.17 184.87 43.26 12 20.79 54 44.33 78 54.26Ecuador 476 28.73 36,905 16.69 54.68 15.42 12 13.53 31 15.03 93 67.34Belize 419 26.93 22,274 56.15 113.29 61.14 1 5.56 50 52.61 1 100.00Dominican Republic 349 28.19 71,861 17.98 189.59 16.94 23 19.71 42 25.87 9 41.24Costa Rica 343 35.85 12,939 28.95 48.29 28.16 15 33.06 15 34.39 164 41.16Uruguay 273 10.03 17,572 27.56 118.88 27.83 12 10.03 29 22.45 0 0.00Guatemala 213 20.97 16,365 29.51 22.26 28.08 1 26.67 9 39.68 24 29.17Haiti 190 38.49 89,906 40.40 35.38 38.78 10 26.27 14 48.63 73 40.55Puerto Rico (US) 173 51.84 104,692 53.81 1783.45 52.71 3 36.00 151 51.23 0Jamaica 137 37.54 31,029 28.49 100.95 26.62 2 26.32 56 32.60 37 36.55French Guiana (Fr.) 130 20.98 2,491 27.93 28.55 28.02 0 0.00 6 27.22 85 20.67El Salvador 102 55.32 17,654 53.00 28.32 49.77 0 66.67 10 49.64 0 100.00

(iv) Middle East & North Africa region (MENA)
In the MENA region, the percentage increase in surge zones when compared to current
surge zones is largest for Egypt (83.6%), followed by Algeria (56.9%) and Libya (54.3%)
as documented in Figure 5. The surge zones of Egypt would almost double as a result of
SLR and intensified storm surges, increasing from 7.4% of the coastal area at present to
13.6%.
Figure 5: Percentage increase in storm surge zone, MENA Region
0.0
10.0
20.0
30.0
40.0
50.0
60.0
70.0
80.0
90.0
Eg
ypt
Alg
eria
Lib
ya
Mo
rocc
o
Iran
Qat
ar
Tu
nis
ia
Wes
tern
Sah
ara
Sau
di A
rab
ia
UA
E
Om
an
Yem
en
Ku
wai
t
% I
ncr
ease
While Egypt, Iran, Saudi Arabia, and Libya would experience large increases in the
extent of their respective surge zones, ranging from 1,183 km2 – 2,290 km2, the surge
prone area as a percentage of country coastal zone total will be highest in Kuwait
(81.07%), followed by Yemen (50.20%) and Oman (50.06%) (Table 6, Columns 2 and
3).

25
Absolute impact of SLR and intensified storm surges on coastal population will be
particularly severe in Egypt with potential inundation risk for additional 2.67 million
people (Table 6, Column 4). Relative exposure of coastal population, on the other hand,
will be high in Kuwait (69.86%), United Arab Emirates (59.89%), and Yemen (55.65%).
Estimates further indicate that increase in inundation exposure from storm surges
translates to a potential loss of 65.27% coastal GDP in Kuwait, 58.08% in United Arab
Emirates, 52.58% in Morocco and 51.98% in Yemen. Nearly all coastal cropland of
United Arab Emirates and 85.71% in Qatar will be prone to inundation (Table 6, Column
9); and urban extent along the coast will be highly vulnerable in United Arab Emirates
(60.21%), Kuwait (56.42%), and Yemen (55.35%) (Table 6, Column 11).
Coastal wetlands of the MENA region will also be affected by storm surges. In terms of
percentage of coastal total, impacts will be particularly severe in Kuwait (95.75%), Qatar
(74.97%), Tunisia (63.50%), Yemen (62.22%), and Saudi Arabia (51.04%).

Table 6: Middle East & North Africa
Country
Incremental Impact: Land Area (sq. km)
Projected Impact as a % of Coastal Total
Incremental Impact: Population
Projected Impact as a % of Coastal Total
Incremental Impact: GDP (mil. USD)
Projected Impact as a % of Coastal Total
Incremental Impact: Agr. Area (sq. km)
Projected Impact as a % of Coastal Total
Incremental Impact: Urban Extent (sq. km)
Projected Impact as a % of Coastal Total
Incremental Impact: Wetlands (sq. km)
Projected Impact as a % of Coastal Total
Arab Rep. of Egypt 2,290 13.61 2,673,036 14.68 4604.69 16.67 692 5.23 627 15.30 640 28.36Islamic Republic of Iran 2,189 27.75 56,336 19.28 218.25 18.33 11 8.59 58 13.81 1,038 48.94Saudi Arabia 1,368 41.58 243,839 42.92 2425.25 40.60 0 0.00 390 45.85 715 51.04Libya 1,183 23.49 75,504 31.12 545.22 30.42 1 23.81 230 32.75 539 26.58Tunisia 543 45.45 189,241 51.12 510.44 47.61 41 32.53 179 48.25 199 63.50United Arab Emirates 532 47.37 88,327 59.89 2310.72 58.08 0 100.00 181 60.21 305 44.51Oman 417 50.06 32,971 46.40 316.70 44.27 1 40.00 85 47.72 74 59.24Rep. of Yemen 321 50.20 37,445 55.65 21.69 51.98 0 0.00 19 55.35 115 62.22Qatar 294 43.06 26,842 41.29 749.40 31.43 2 85.71 25 29.18 138 74.97Morocco 293 28.65 130,094 49.05 210.58 52.58 15 15.85 67 51.16 84 24.55Algeria 181 28.79 69,553 31.49 155.06 28.91 10 14.91 53 28.31 78 19.88Western Sahara 148 30.47 2,827 10.90 2.23 6.31 0 2 8.33 40 43.80Kuwait 91 81.07 47,925 69.86 586.23 65.27 0 41 56.42 26 95.75

(v) South Asia region (SAR)
The percentage increase in storm surge zone among the countries of the South Asia
region is less than the other regions. Approximately 23% to 33% of the countries’ coastal
zones will be subjected to inundation risk with SLR and intensified storm surges, and
Bangladesh will be worst affected (33.4%).
Figure 6: Percentage increase in storm surge zone, SAR Region
0.0
5.0
10.0
15.0
20.0
25.0
30.0
35.0
40.0
Bangladesh Sri Lanka India Pakistan
% I
ncr
ease
As expected, in absolute numbers, exposure estimates of all indicators—coastal
population, GDP12, agricultural area, urban extent and wetlands—are larger for India and
Bangladesh (Table 7). However, the relative impacts: percentage of coastal population
and GDP exposed will be most severe in Pakistan (35.72% and 38.57%, respectively),
and the percentage of vulnerable coastal croplands and urban extent will be most acute in
Sri Lanka (43.03% and 37.42%, respectively) (Table 7, Columns 5, 7, 9 and 11).
12 It is estimated that storm surge intensification would cause additional GDP losses (above the current 1-in-100-year reference standard) of $5.2 billion in India and $2.2 billion in Bangladesh.
28
Our estimates further indicate nearly 61.38% of coastal wetlands of Pakistan and 55.46%
of wetlands in Sri Lanka will be prone to storm surges (Table 7, Column 13).
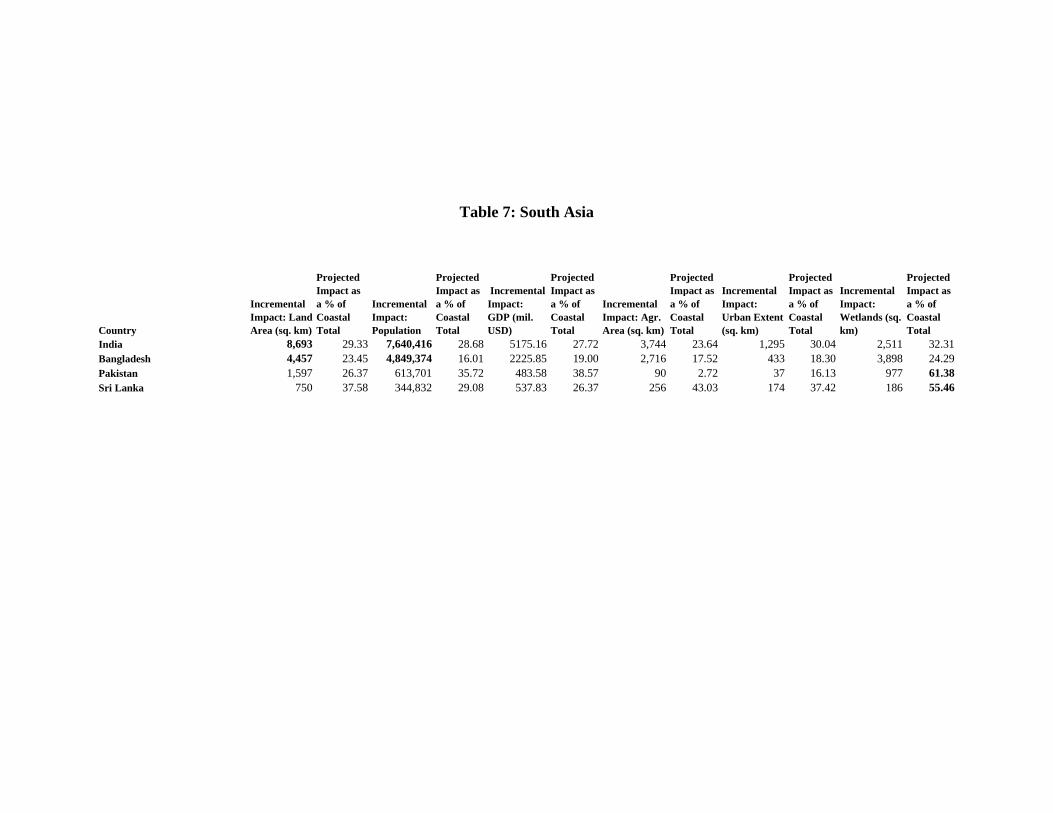
Table 7: South Asia
Country
Incremental Impact: Land Area (sq. km)
Projected Impact as a % of Coastal Total
Incremental Impact: Population
Projected Impact as a % of Coastal Total
Incremental Impact: GDP (mil. USD)
Projected Impact as a % of Coastal Total
Incremental Impact: Agr. Area (sq. km)
Projected Impact as a % of Coastal Total
Incremental Impact: Urban Extent (sq. km)
Projected Impact as a % of Coastal Total
Incremental Impact: Wetlands (sq. km)
Projected Impact as a % of Coastal Total
India 8,693 29.33 7,640,416 28.68 5175.16 27.72 3,744 23.64 1,295 30.04 2,511 32.31Bangladesh 4,457 23.45 4,849,374 16.01 2225.85 19.00 2,716 17.52 433 18.30 3,898 24.29Pakistan 1,597 26.37 613,701 35.72 483.58 38.57 90 2.72 37 16.13 977 61.38Sri Lanka 750 37.58 344,832 29.08 537.83 26.37 256 43.03 174 37.42 186 55.46

III.3 Summary of results
This section summarizes the results of world and regional results. It then summarizes
results for each of the six indicators used in this analysis by presenting the most (top 10)
impacted countries (as a percentage of national parameters).
Table 8 summarizes our results for each indicator by presenting the top-10 impacted
countries and/or territories (as a percentage of their own coastal values). Results suggest
that numerous low-income countries are susceptible to significant coastal damage. For
land area, the most vulnerable low-income countries are Namibia, Guinea, El Salvador
and Yemen, with more than 50% of their coastal areas at risk.
For impacted population, the top five low-income countries and/or territories worldwide
are Djibouti, Yemen, Togo, El Salvador, and Mozambique. More than 50% of the coastal
urban areas lie within the potential impact zones in Guyana, Djibouti, Togo, Yemen,
Mozambique, Tanzania, Côte d’Ivoire, Equatorial Guinea, and Morocco.
Coastal agriculture would be significantly affected in Guyana, Nigeria, North Korea, El
Salvador, Ghana, Togo and Equatorial Guinea. Our estimates indicate that areas prone to
storm surge in Mozambique, Togo, Morocco, Philippines, Yemen, Djibouti, El Salvador
and Ghana account for more than 50% of GDP generated in their coastal regions. Finally,
nearly 100% of the coastal wetlands in El Salvador and more than 60% of the wetlands of
Namibia, Ecuador, Tunisia, Guinea, Yemen and Pakistan will be subject to inundation
risk. In sum, for the majority of indicators used in this research, El Salvador, Yemen,
Djibouti, Mozambique, and Togo are projected to experience the most severe impacts.

Table 8. Top 10 countries at risk with intensification of storm surges*
Rank Coastal
Land Area Coastal
Population Coastal GDP Coastal
Agricultural Land
Coastal Urban Areas
Coastal Wetlands
1 Kuwait (81.1)
Bahamas (73.0)
Bahamas (65.7)
Guyana (100.0)
Bahamas (94.1)
El Salvador (100.0)
2 Korea (61.7)
Kuwait (70.0)
Kuwait (65.3)
UAE (100.0)
Guyana (66.4)
Belize (100.0)
3 Namibia (60.2)
Djibouti (60.1)
Belize (61.1)
Nigeria (100.0)
Djibouti (60.4)
Kuwait (95.8)
4 Guinea (58.6)
UAE (60.0)
UAE (58.1)
Qatar (85.7)
UAE (60.2)
Taiwan, China (95.2)
5 El Salvador (55.3)
Belize (56.2)
Mozambique (55.0)
Korea (66.8)
Togo (59.8)
Namibia (81.6)
6 Chile (54.7)
Yemen (55.7)
Togo (54.5)
El Salvador (66.7)
Kuwait (56.4)
Korea (78.8)
7 Bahamas (54.7)
Togo (54.2)
Puerto Rico (52.7)
Ghana (66.7)
Yemen (55.4)
Qatar (75.0)
8 Puerto Rico (51.8)
Puerto Rico (53.8)
Morocco (52.6)
DPR Korea (58.3)
Mozambique (55.1)
Bahamas (71.4)
9 Yemen (50.2)
El Salvador (53.0)
Philippines (52.3)
Togo (50.0)
Tanzania (53.4)
Ecuador (67.3)
10 Oman (50.0)
Mozambique (51.7)
Yemen (52.0)
Equatorial Guinea (50.0)
Cote d'Ivoire (53.2)
Tunisia (63.5)
* Numbers in parentheses indicate percentage impact in “coastal zone”.

Finally, we examine the impact of SLR and intensified storm surges on specific urban
centers of the developing world. Table 4 lists the top-10 major cities worldwide that are
located in storm-surge zones. Alarmingly, most of these cities are in low-income
countries. This highlights the potentially deadly exposure of their inhabitants, since storm
water drainage infrastructure is often outdated and inadequate in such low-income urban
centers.13 The risks may be particularly severe in poor neighborhoods and slums, where
infrastructure is often nonexistent or poorly designed and ill-maintained. Eight out of the
10 most impacted cities in the East Asia and Pacific region are located in Vietnam and
the Philippines. In the South Asia region, three of five most impacted cities are located in
Bangladesh. In the Sub-Saharan Africa and in the Middle East and North Africa regions,
four cities out of the 10 most impacted cities of the region are in Mozambique and
Morocco, respectively.
13 For port cities vulnerable to storm surge, see Nicholls et al. (2007).

Table 4. Major cities at risk from intensification of storm surges Indicator: Percent of coastal area exposed*
Rank EAP SAR AFR LAC MENA
1 Hai Phong (Vietnam)
Barisal (Bangladesh)
Bugama (Nigeria)
Ciudad del Carmen
(Mexico)
Port Said (Egypt)
2 San Jose (Philippines)
Mumbai (India)
Okrika (Nigeria)
Manzanillo (Cuba)
Dubai (UAE)
3 Vung Tau (Vietnam)
Cox’s Bazar (Bangladesh)
George (South Africa)
Georgetown (Guyana)
Rabat (Morocco)
4 Manila (Philippines)
Khulna (Bangladesh)
Quelimane (Mozambique)
Bahia Blanca (Argentina)
Kenitra (Morocco)
5 Roxas (Philippines)
Bhaunagar (India)
Mahajanga (Mozambique)
Cienfuegos (Cuba)
Aden (Yemen)
6 Cotabato (Philippines)
Karachi (Pakistan)
Nacala (Mozambique)
Vina del Mar incl. Concon
(Chile)
Abu Dhabi (UAE)
7 Ansan (Korea)
Jamnagar (India)
Bathurst (Gambia)
Aracaju ♦ (Brazil)
Al Ain (UAE)
8 Poryong (Korea)
Surat (India)
Beira (Mozambique)
Puerto la Cruz incl. Pozuelos (Venezuela)
Ajman (UAE)
9 Rach Gia (Vietnam)
Thane (India)
Tanga (Tanzania)
La Plata (Argentina)
Mohammedia (Morocco)
10 Hue (Vietnam)
Vadodara (India)
Free Town (Sierra Leone)
Acapulco de Juarez (Mexico)
Nador (Morocco)
* In the Urban Risk Index database allocation of urban extent to adjacent city limits may sometimes have a margin of error due to potential inaccuracies associated with the thiessen polygon technique. ♦Aracaju in Brazil has been identified as one such example of allocation error.
IV. Conclusions
Coastal areas of the world face a range of risks related to climate change (IPCC 2007).
Anticipated risks include an accelerated rise in sea level, an intensification of cyclones,
and larger storm surges among others. This paper assesses the vulnerability of the world’s
coastal zones to intensification of storm surges. A detailed GIS analysis is used to
estimate the impact of future storm surge increases associated with more intense storms
and a 1 m sea-level rise. After delineating future inundation zones, this information is
overlaid with indicators for coastal populations, settlements, economic activity, and
33
wetlands. Our results indicate very heavy potential losses that are much more
concentrated in some regions and countries than others. A particularly striking finding is
the concentration of highly vulnerable large cities at the low end of the international
income distribution. We believe that these large, globally pervasive potential impacts
further strengthen the case for rapid action to protect endangered coastal populations.
34
References Bengtsson, L., K. I. Hodges, and E. Roeckner, 2006. Storm tracks and climate change.
Journal of Climate 19: 3518-43. Emanuel, K., 2005. Increasing destructiveness of tropical cyclones over the past 30 years.
Nature: 436, 686-688. Emanuel, K., R. Sundararajan, J. Williams. 2008. Hurricanes and Global warming:
Results from Downscaling IPCC AR4 Simulations. Available at ftp://texmex.mit.edu/pub/emanuel/PAPERS/Emanuel_etal_2008.pdf
Hallegatte, S., N. Patmore, O. Maestre, P. Dumas, J. C. Morlot, C. Herweijer, and R. M.
Wood. 2008. Assessing climate change impacts, sea level rise, and storm surge risk in port cities: A case study of Copenhagen, OECD Environment Directorate, Environment Working Papers No. 3, Paris.
International Workshop on Tropical Cyclones (IWTC). 2006. Statement on tropical
cyclones and climate change. November, 2006, 13 pp. Available at: http://www.gfdl.noaa.gov/~tk/glob_warm_hurr.html
Intergovernmental Panel on Climate Change (IPCC). 2007. Climate Change 2007: The
Physical Science Basis, Summary for Policymakers. Keim, M. E. 2006. Cyclones, Tsunamis and Human Health. Oceanography 19(2): 40-49. Knutson, T. R., and R. E. Tuleya. 2004. Impact of CO2-induced Warming on Simulated
Hurricane Intensity and Precipitation Sensitivity to the Choice of Climate Model and Convective Parameterization. Journal of Climate 17: 3477-95.
Landsea, C.W., B.A. Harper, K. Hoarau, and J.A. Knaff. 2006. Climate Change: Can We
Detect Trends in Extreme Tropical Cyclones? Science: 313(5786): 452-54. McGranahan, G., D. Balk and B. Anderson. 2007. The rising tide: assessing the risks of
climate change and human settlements in low elevation coastal zones. Environment & Urbanization 19(1): 17-37. International Institute for Environment and Development (IIED). http://eau.sagepub.com/cgi/content/abstract/19/1/17
McInnes, K. L., G. D. Hubbert, I. Macadam, and J. G. O’Grady. 2007. Assessing the
impact of climate change on storm surges in Southern Australia. Available at http://www.mssanz.org.au/MODSIM07/papers/26_s32/AssessingTheImpact_s32_McInnes_.pdf
Michaels, P. J., P. C. Knappenberger, and R. E. Davis. 2005. Sea-Surface Temperatures
and Tropical Cyclones: Breaking the Paradigm. Presented at 15th Conference of
35

36
Applied Climatology. Available at http://ams.confex.com/ams/15AppClimate/techprogram/paper_94127.htm
Nicholls, R. J. 2003. An Expert Assessment of Storm Surge “Hotspots”. Final Report
(Draft Version) to Center for Hazards and Risk Research, Lamont-Dohert Observatory, Columbia University.
Nicholls, R. J. 2006. “Storm Surges in Coastal Areas” in Natural Disaster Hot Spots
Case Studies: AGlobal Risk Analysis, The World Bank Disaster Risk Management Series Report #5. Washington, DC: World Bank.
Nicholls, R. J., S. Hanson, C. Herweijer, N. Patmore, S. Hallegatte, J. Corfee-Morlot, J.
Chateau, R. Muir-Wood. 2007. Ranking Port Cities with High Exposure and Vulnerability to Climate Extremes. OECD Environment Directorate, Environment Working Papers No. 1, Paris.
Peltier, W.R. 2000. ICE4G (VM2) Glacial isostatic Adjustment Corrections, in Sea
Level Rise: History and Consequences, Douglas, B.C., Kearney, M.S., and S.P. Leatherman (Eds.) Academic Press, San Diego.
Pielke, R. A., C. Landsea, M. Mayfield, J. Laver, and R. Pasch. 2005. Hurricanes and
Global Warming. Bulletin of American Meteorological Society, November, pp.1571-75.
Shultz, J. M., J. Russell, and Z. Espinel, 2005. Epidemiology of Tropical Cyclones: The
Dynamics of Disaster, Disease, and Development. Epidemiologic Reviews 27: 21-35. Wang, S., R. McGrath, J. Hanafin, P. Lynch, T. Semmler, and P. Nolan. 2008. The
impact of climate change on storm surges over Irish waters. Ocean Modelling 25(1-2): 83-94.
Webster, P. J., G .J. Holland, J.A. Curry, and H-R. Chang. 2005. Changes in tropical
cyclone number, duration and intensity in a warming environment. Science 309: 1844-46.
Woodworth, P. L., and D. L. Blackman, 2004. Evidence for systematic changes in
extreme high waters since the mid-1970s. Journal of Climate 17(6), 1190-97. Woth, K., R. Weisse, and H. von Storch. 2006. Climate change and North Sea storm
surge extremes: An ensemble study of storm surge extremes expected in a changed climate projected by four different regional climate models. Ocean Dynamics 56(1): 3-15.
Appendix Figure A1. Current and projected impacts of sea level rise and storm surge in Africa
Land area Population GDP
Extent of urbanization Wetlands Agricultural area
Land area Population GDP
Extent of urbanization Wetlands Agricultural area
Current storm surge Sea level rise and intensified storm surgeCurrent storm surge Sea level rise and intensified storm surge
Thousands US dollars (millions)Km2 (thousands)
Km2 (hundreds)Km2 (hundreds) Km2 (hundreds)
Thousands US dollars (millions)Km2 (thousands)
Km2 (hundreds)Km2 (hundreds) Km2 (hundreds)
0
2
4
6
8
10
12
14
16
Moz
ambi
que
Mad
agas
car
Nig
eria
Mau
rita
nia
Gui
nea
Gui
nea-
Bis
sau
Sene
gal
Tanz
ania
Som
alia
Gab
onSu
dan
Nam
ibia
Eri
trea
Sie
rra
Leo
neK
enya
Sout
h A
fric
aA
ngol
aC
amer
oon
Gha
naC
ote
d'Iv
oire
Lib
eria
Ben
inD
jibou
tiTo
goT
he G
ambi
aC
ongo
, Dem
. Rep
.C
ongo
, Rep
Equ
ator
ial G
uine
aSa
o T
ome
and
Prin
cipe
0
1
2
3
4
Nig
eria
Moz
ambi
que
Sene
gal
Gha
naB
enin
Cot
e d'
Ivoi
reM
adag
asca
rT
anza
nia
Cam
eroo
nT
ogo
Gui
nea
Ang
ola
Lib
eria
The
Gam
bia
Sout
h A
fric
aSi
erra
Leo
neS
omal
iaK
enya
Djib
outi
Mau
rita
nia
Gui
nea-
Bis
sau
Suda
nG
abon
Con
go, R
epEr
itrea
Equ
ator
ial G
uine
aC
ongo
, Dem
. Rep
.S
ao T
ome
and
Pri
ncip
eN
amib
ia
0
500
1,000
1,500
Gha
naM
ozam
biqu
eT
anza
nia
Sud
anD
jibo
uti
Equ
ator
ial G
uine
aT
he G
ambi
aM
adag
asca
rTo
goA
ngol
aB
enin
Gui
nea
Sier
ra L
eone
Lib
eria
Cam
eroo
nN
amib
iaC
ote
d'Iv
oire
Ken
yaS
outh
Afr
ica
Eri
trea
Som
alia
Gui
nea-
Bis
sau
Mau
rita
nia
Sene
gal
Nig
eria
Sao
Tom
e an
d P
rinc
ipe
Gab
onC
ongo
, Rep
Con
go, D
em. R
ep.
0
20
40
60
80
Moz
ambi
que
Nig
eria
Mad
agas
car
Gui
nea
Mau
rita
nia
Sene
gal
Sie
rra
Leon
eG
uine
a-B
issa
uK
enya
Gab
onTa
nzan
iaC
amer
oon
Sud
anG
hana
Som
alia
Cot
e d'
Ivoi
reB
enin
Sout
h A
fric
aA
ngol
aEr
itrea
Lib
eria
Tog
oN
amib
iaC
ongo
, Dem
. Rep
.T
he G
ambi
aC
ongo
, Rep
Djib
outi
Equ
ator
ial G
uine
aSa
o T
ome
and
Pri
ncip
e0
1
2
3
4
5
Djib
outi
Equ
ator
ial G
uine
aT
ogo
Tanz
ania
Suda
nM
ozam
biqu
eG
hana
Sout
h A
fric
aN
amib
iaA
ngol
aM
adag
asca
rSi
erra
Leo
neC
amer
oon
Lib
eria
Eri
trea
Ken
yaC
ote
d'Iv
oire
Ben
inG
uine
aM
auri
tani
aG
uine
a-B
issa
uC
ongo
, Dem
. Rep
.So
mal
iaN
iger
iaSa
o To
me
and
Prin
cipe
The
Gam
bia
Gab
onC
ongo
, Rep
Sene
gal0
2
4
6
8
Moz
ambi
que
Tan
zani
aK
enya
Sout
h A
fric
aSo
mal
iaS
eneg
alA
ngol
aM
auri
tani
aG
hana
Nig
eria
Equ
ator
ial G
uine
aSa
o T
ome
and
Prin
cipe
Tog
oN
amib
iaG
uine
aSu
dan
Mad
agas
car
Cam
eroo
nD
jibo
uti
Gui
nea-
Bis
sau
Eritr
eaC
ote
d'Iv
oire
Sie
rra
Leo
neL
iber
iaG
abon
Ben
inC
ongo
, Dem
. Rep
.C
ongo
, Rep
The
Gam
bia
37
Appendix Figure A2. Current and projected impacts of sea level rise and storm surge in East Asia & Pacific
38
Indo
nesi
a
Chi
na
Mya
nmar
Vie
tnam
Phili
ppin
es
Mal
aysi
a
Thai
land
Papu
a N
ew G
uine
a
Kor
ea
DPR
Kor
ea
Taiw
an
Cam
bodi
a
Bru
nei
Chi
na
Indo
nesi
a
Vie
tnam
Phili
ppin
es
Mya
nmar
Tha
ilan
d
Kor
ea
Mal
aysi
a
Tai
wan
DPR
Kor
ea
Cam
bodi
a
Papu
a N
ew G
uine
a
Bru
nei
Mya
nmar
Phili
ppin
es
Kor
ea
Bru
nei
Tai
wan
Indo
nesi
a
Mal
aysi
a
Vie
tnam
Tha
iland
DPR
Kor
ea
Papu
a N
ew G
uine
a
Chi
na
Cam
bodi
a0
20,000
40,000
60,000
80,000
Kor
ea
DP
R K
orea
Bru
nei
Tai
wan
Mal
aysi
a
Phili
ppin
es
Indo
nesi
a
Mya
nmar
Vie
tnam
apua
New
Gui
nea
Thai
land
Chi
na
Cam
bodi
a
P
0
50
100
150
Bru
nei
Kor
ea
Tai
wan
Phili
ppin
es
Mya
nmar
Mal
aysi
a
Vie
tnam
Indo
nesi
a
Tha
iland
apua
New
Gui
nea
DPR
Kor
ea
Chi
na
Cam
bodi
a
P
0
20
40
60
80
100
Km
2(h
undr
eds)
Tai
wan
Kor
ea
DPR
Kor
ea
Mya
nmar
Phili
ppin
es
Bru
nei
Chi
na
Mal
aysi
a
Indo
nesi
a
Vie
tnam
apua
New
Gui
nea
Thai
land
Cam
bodi
a
P
0
50
100
150
Km2 (hundreds)
Land area Population GDP
Extent of urbanization Wetlands Agricultural area
Land area Population GDP
Extent of urbanization Wetlands Agricultural area
0
10
20
30
0
20
40
60
80Km2 (thousands) US dollars (millions)Thousands
Km2 (hundreds) Km2 (hundreds)
Current storm surge Sea level rise and intensified storm surgeCurrent storm surge Sea level rise and intensified storm surge
Appendix Figure A3. Current and projected impacts of sea level rise and storm surge in Latin America & the Caribbean
0
10
20
30
Mex
ico
Bra
zil
Chi
leA
rgen
tina
Cub
aV
enez
uela
Col
ombi
aB
aham
asE
cuad
orPa
nam
aH
ondu
ras
Peru
Nic
arag
uaG
uyan
aSu
rina
me
Cos
ta R
ica
Bel
ize
Dom
inic
an R
epub
licG
uate
mal
aE
l Sal
vado
rU
rugu
ayFr
ench
Gui
ana
Hai
tiPu
erto
Ric
oJa
mai
ca
0
2
4
6
8
Bra
zil
Arg
enti
naM
exic
oB
aham
asC
hile
Pan
ama
Uru
guay
Cos
ta R
ica
Ven
ezue
laC
olom
bia
Per
uH
aiti
Dom
inic
an R
epub
licE
cuad
orH
ondu
ras
Cub
aG
uate
mal
aPu
erto
Ric
oN
icar
agua
Jam
aica
Guy
ana
El S
alva
dor
Bel
ize
Fren
ch G
uian
aSu
rina
me0
2
4
6
8
Bra
zil
Arg
enti
naM
exic
oB
aham
asC
hile
Pan
ama
Uru
guay
Cos
ta R
ica
Ven
ezue
laC
olom
bia
Per
uH
aiti
Dom
inic
an R
epub
licE
cuad
orH
ondu
ras
Cub
aG
uate
mal
aPu
erto
Ric
oN
icar
agua
Jam
aica
Guy
ana
El S
alva
dor
Bel
ize
Fren
ch G
uian
aSu
rina
me 0
10
20
30
40
50
Bah
amas
Guy
ana
El S
alva
dor
Nic
arag
uaH
aiti
Puer
to R
ico
Peru
Pan
ama
Gua
tem
ala
Bel
ize
Chi
leB
razi
lC
osta
Ric
aFr
ench
Gui
ana
Ven
ezue
laH
ondu
ras
Cub
aA
rgen
tina
Uru
guay
Jam
aica
Dom
inic
an R
epub
licS
urin
ame
Ecu
ador
Mex
ico
Col
ombi
a
0
1
2
3
4
5
6
Bra
zil
Mex
ico
Arg
entin
aV
enez
uela
Cub
aE
cuad
orC
olom
bia
Peru
Pue
rto
Ric
oH
aiti
Pana
ma
Chi
leE
l Sal
vado
rD
omin
ican
Rep
ublic
Uru
guay
Suri
nam
eH
ondu
ras
Guy
ana
Gua
tem
ala
Nic
arag
uaB
eliz
eJa
mai
caC
osta
Ric
aB
aham
asF
renc
h G
uian
a 0
5,000
10,000
15,000
20,000
Bah
amas
El S
alva
dor
Bel
ize
Peru
Puer
to R
ico
Pan
ama
Guy
ana
Chi
leH
aiti
Ven
ezue
laC
uba
Nic
arag
uaFr
ench
Gui
ana
Suri
nam
eU
rugu
ayH
ondu
ras
Gua
tem
ala
Bra
zil
Cos
ta R
ica
Jam
aica
Mex
ico
Ecu
ador
Col
ombi
aA
rgen
tina
Dom
inic
an R
epub
lic
Bra
zil
Cub
aM
exic
oH
ondu
ras
Bah
amas
Ven
ezue
laC
olom
bia
Ecu
ador
Arg
enti
naSu
rina
me
Nic
arag
uaC
osta
Ric
aG
uyan
aPa
nam
aFr
ench
Gui
ana
Hai
tiPe
ruG
uate
mal
aD
omin
ican
Rep
ubli
cJa
mai
caC
hile
El S
alva
dor
Bel
ize
Puer
to R
ico
Uru
guay
0
20
40
60
80
100
Land area Population GDP
Extent of urbanization Wetlands Agricultural area
Land area Population GDP
Extent of urbanization Wetlands Agricultural area
Thousands US dollars (millions)Km2 (thousands)
Km2 (hundreds)Km2 (hundreds) Km2 (hundreds)
Current storm surge Sea level rise and intensified storm surgeCurrent storm surge Sea level rise and intensified storm surge
39
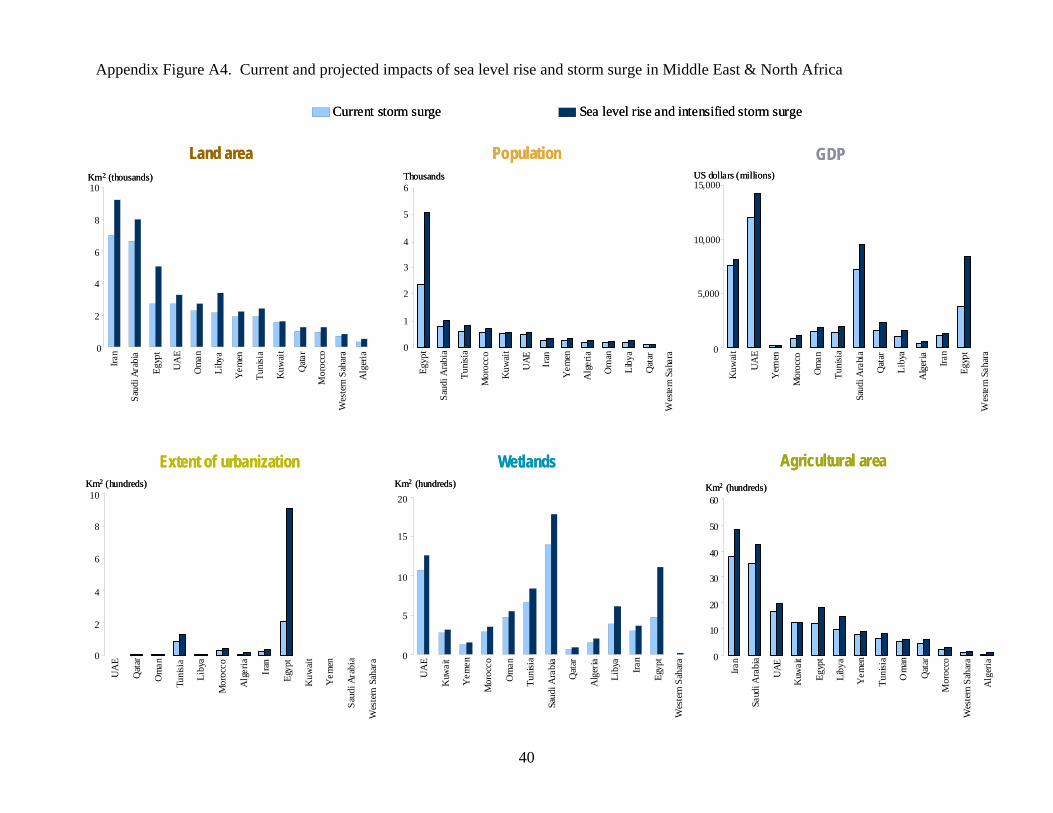
Appendix Figure A4. Current and projected impacts of sea level rise and storm surge in Middle East & North Africa
Land area Population GDP
Extent of urbanization Wetlands Agricultural area
Land area Population GDP
Extent of urbanization Wetlands Agricultural area
Current storm surge Sea level rise and intensified storm surgeCurrent storm surge Sea level rise and intensified storm surge
Thousands US dollars (millions)Km2 (thousands)
Km2 (hundreds)Km2 (hundreds) Km2 (hundreds)
Thousands US dollars (millions)Km2 (thousands)
Km2 (hundreds)Km2 (hundreds) Km2 (hundreds)
0
2
4
6
8
10
UA
E
Qat
ar
Om
an
Tuni
sia
Lib
ya
Mor
occo
Alg
eria
Iran
Egy
pt
Kuw
ait
Yem
en
Sau
di A
rabi
a
Wes
tern
Sah
ara
0
2
4
6
8
10
Iran
Sau
di A
rabi
a
Egy
pt
UA
E
Om
an
Lib
ya
Yem
en
Tun
isia
Kuw
ait
Qat
ar
Mor
occo
Wes
tern
Sah
ara
Alg
eria
0
1
2
3
4
5
6
Egy
pt
Sau
di A
rabi
a
Tun
isia
Mor
occo
Kuw
ait
UA
E
Iran
Yem
en
Alg
eria
Om
an
Lib
ya
Qat
ar
Wes
tern
Sah
ara 0
5,000
10,000
15,000
Kuw
ait
UA
E
Yem
en
Mor
occo
Om
an
Tun
isia
Saud
i Ara
bia
Qat
ar
Lib
ya
Alg
eria
Iran
Egy
pt
Wes
tern
Sah
ara
0
5
10
15
20
UA
E
Kuw
ait
Yem
en
Mor
occo
Om
an
Tun
isia
Saud
i Ara
bia
Qat
ar
Alg
eria
Lib
ya
Iran
Egy
pt
Wes
tern
Sah
ara 0
10
20
30
40
50
60
Iran
Saud
i Ara
bia
UA
E
Kuw
ait
Egy
pt
Lib
ya
Yem
en
Tun
isia
Om
an
Qat
ar
Mor
occo
Wes
tern
Sah
ara
Alg
eria
40

41
Appendix Figure A5. Current and projected impacts of sea level rise and storm surge in South Asia
Land area Population GDP
Extent of urbanization Wetlands Agricultural area
Land area Population GDP
Extent of urbanization Wetlands Agricultural area
Thousands US dollars (millions)Km2 (thousands)
Km2 (hundreds)Km2 (hundreds) Km2 (hundreds)
0
10
20
30
40
50
60
Sri Lanka India Pakistan Bangladesh0
20
40
60
80
100
120
India Bangladesh Sri Lanka Pakistan
0
10
20
30
40
India Bangladesh Pakistan Sri Lanka0
10
20
30
India Bangladesh Pakistan Sri Lanka
0
50
100
150
200
Pakistan Sri Lanka India Bangladesh
0
5,000
10,000
15,000
20,000
25,000
Pakistan India Sri Lanka Bangladesh
Current storm surge Sea level rise and intensified storm surgeCurrent storm surge Sea level rise and intensified storm surge
Related Documents