Devastating storm surges of Typhoon Haiyan Alfredo Mahar Francisco Lagmay a,b , Rojelee P. Agaton b , Mark Allen C. Bahala b , Jo Brianne Louise T. Briones b , Krichi May C. Cabacaba b , Carl Vincent C. Caro b , Lea L. Dasallas b , Lia Anne L. Gonzalo b,n , Christine N. Ladiero b , John Phillip Lapidez b , Maria Theresa Francia Mungcal b , Jose Victor R. Puno b , Michael Marie Angelo C. Ramos b , Joy Santiago b , John Kenneth Suarez b , Judd P. Tablazon b a National Institute of Geological Sciences, University of the Philippines, Room 020, C.P. Garcia Corner Velasquez Street, Diliman, Quezon City 1101, Philippines b Department of Science and Technology (DOST), Nationwide Operational Assessment of Hazards (Project NOAH), Philippines article info Article history: Received 12 August 2014 Received in revised form 20 October 2014 Accepted 20 October 2014 Available online 22 October 2014 Keywords: Storm surge Typhoon Haiyan Forecast Disaster preparedness abstract On 8th November 2013, Typhoon Haiyan, local name Yolanda, made landfall in the central Philippine islands region. Considered one of the most powerful typhoons ever to make landfall in recorded history, the 600 km diameter Typhoon Haiyan crossed the Philippine archipelago, bringing widespread devastation in its path. Strong winds, heavy rainfall, and storm surges caused extreme loss of lives and widespread damage to property. Storm surges were primarily responsible for the 6300 dead, 1061 missing and 28,689 injured in Haiyan's aftermath. Here, we document the storm surge simulations which were used as basis for the warnings provided to the public 2 days prior to the howler's landfall. We then validate the accounts based on field data and accounts provided in the news. The de- vastating Haiyan storm surges are one of the biggest in several decades, which exacted a high death toll despite its early prediction. There were many lessons learned from this calamity, and information contained in this work may serve as useful reference to mitigate the heavy impact of future storm surge events in the Philippines and elsewhere. & 2014 Elsevier Ltd. All rights reserved. 1. Introduction Haiyan is one of the most powerful typhoons to have made landfall in recorded history, with maximum sustained winds reaching 315 kph (170 knots) with gusts up to 379 kph (205 knots) just before landfall. This makes it equivalent to a Ca- tegory 5 typhoon on the Saffir–Simpson hurricane scale, which has the capacity to cause catastrophic damage, a high percentage of destruction of framed homes, total roof failure and wall collapse, isolation of residential areas due to fallen trees and power poles, and power outages that could last for weeks and possibly months [23]. It started as a region of low pressure in the West Pacific Ocean early on 2nd November 2013 and was upgraded to a tropical storm (TS) with the name Haiyan after subsequent intensification. Upon entry of the typhoon into the Philippine Area of Responsibility (PAR), the Philippine Atmospheric Geophysical Astronomical Services Administration [17] gave it a Contents lists available at ScienceDirect journal homepage: www.elsevier.com/locate/ijdrr International Journal of Disaster Risk Reduction http://dx.doi.org/10.1016/j.ijdrr.2014.10.006 2212-4209/& 2014 Elsevier Ltd. All rights reserved. n Corresponding author. E-mail address: [email protected] (L.A.L. Gonzalo). International Journal of Disaster Risk Reduction 11 (2015) 1–12

Welcome message from author
This document is posted to help you gain knowledge. Please leave a comment to let me know what you think about it! Share it to your friends and learn new things together.
Transcript

Contents lists available at ScienceDirect
International Journal of Disaster Risk Reduction
International Journal of Disaster Risk Reduction 11 (2015) 1–12
http://d2212-42
n CorrE-m
journal homepage: www.elsevier.com/locate/ijdrr
Devastating storm surges of Typhoon Haiyan
Alfredo Mahar Francisco Lagmay a,b, Rojelee P. Agaton b, Mark Allen C. Bahala b,Jo Brianne Louise T. Briones b, Krichi May C. Cabacaba b, Carl Vincent C. Caro b,Lea L. Dasallas b, Lia Anne L. Gonzalo b,n, Christine N. Ladiero b,John Phillip Lapidez b, Maria Theresa Francia Mungcal b, Jose Victor R. Puno b,Michael Marie Angelo C. Ramos b, Joy Santiago b, John Kenneth Suarez b,Judd P. Tablazon b
a National Institute of Geological Sciences, University of the Philippines, Room 020, C.P. Garcia Corner Velasquez Street, Diliman, QuezonCity 1101, Philippinesb Department of Science and Technology (DOST), Nationwide Operational Assessment of Hazards (Project NOAH), Philippines
a r t i c l e i n f o
Article history:Received 12 August 2014Received in revised form20 October 2014Accepted 20 October 2014Available online 22 October 2014
Keywords:Storm surgeTyphoon HaiyanForecastDisaster preparedness
x.doi.org/10.1016/j.ijdrr.2014.10.00609/& 2014 Elsevier Ltd. All rights reserved.
esponding author.ail address: [email protected] (L.
a b s t r a c t
On 8th November 2013, Typhoon Haiyan, local name Yolanda, made landfall in the centralPhilippine islands region. Considered one of the most powerful typhoons ever to makelandfall in recorded history, the 600 km diameter Typhoon Haiyan crossed the Philippinearchipelago, bringing widespread devastation in its path. Strong winds, heavy rainfall, andstorm surges caused extreme loss of lives and widespread damage to property. Stormsurges were primarily responsible for the 6300 dead, 1061 missing and 28,689 injured inHaiyan's aftermath. Here, we document the storm surge simulations which were used asbasis for the warnings provided to the public 2 days prior to the howler's landfall. We thenvalidate the accounts based on field data and accounts provided in the news. The de-vastating Haiyan storm surges are one of the biggest in several decades, which exacted ahigh death toll despite its early prediction. There were many lessons learned from thiscalamity, and information contained in this work may serve as useful reference to mitigatethe heavy impact of future storm surge events in the Philippines and elsewhere.
& 2014 Elsevier Ltd. All rights reserved.
1. Introduction
Haiyan is one of the most powerful typhoons to have made landfall in recorded history, with maximum sustained windsreaching 315 kph (170 knots) with gusts up to 379 kph (205 knots) just before landfall. This makes it equivalent to a Ca-tegory 5 typhoon on the Saffir–Simpson hurricane scale, which has the capacity to cause catastrophic damage, a highpercentage of destruction of framed homes, total roof failure and wall collapse, isolation of residential areas due to fallentrees and power poles, and power outages that could last for weeks and possibly months [23].
It started as a region of low pressure in the West Pacific Ocean early on 2nd November 2013 and was upgraded to atropical storm (TS) with the name Haiyan after subsequent intensification. Upon entry of the typhoon into the PhilippineArea of Responsibility (PAR), the Philippine Atmospheric Geophysical Astronomical Services Administration [17] gave it a
A.L. Gonzalo).
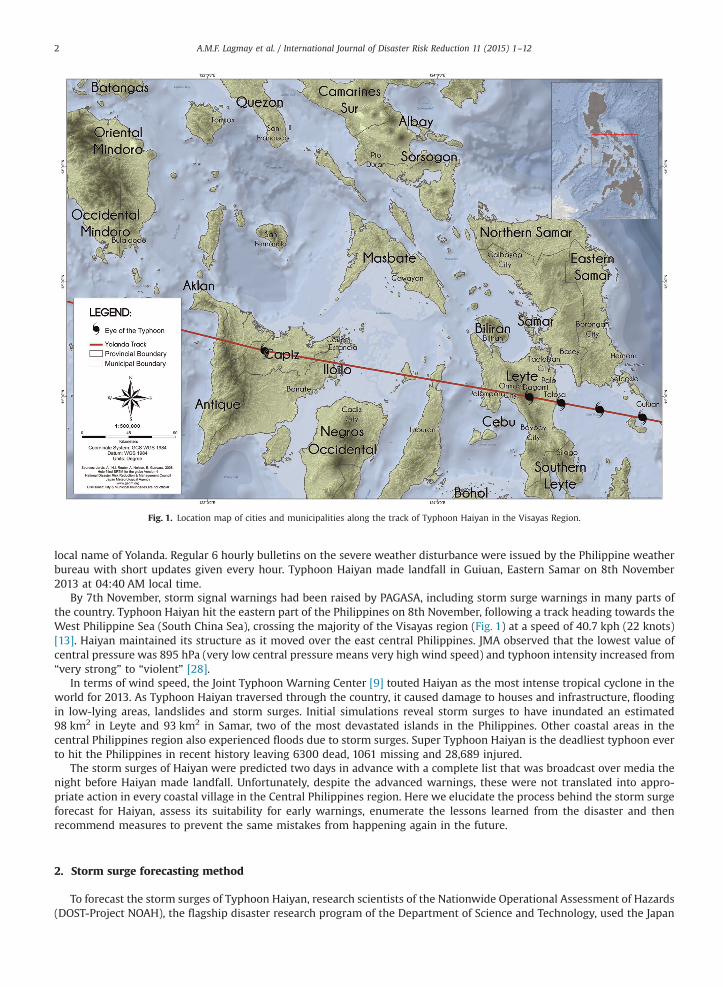
Fig. 1. Location map of cities and municipalities along the track of Typhoon Haiyan in the Visayas Region.
A.M.F. Lagmay et al. / International Journal of Disaster Risk Reduction 11 (2015) 1–122
local name of Yolanda. Regular 6 hourly bulletins on the severe weather disturbance were issued by the Philippine weatherbureau with short updates given every hour. Typhoon Haiyan made landfall in Guiuan, Eastern Samar on 8th November2013 at 04:40 AM local time.
By 7th November, storm signal warnings had been raised by PAGASA, including storm surge warnings in many parts ofthe country. Typhoon Haiyan hit the eastern part of the Philippines on 8th November, following a track heading towards theWest Philippine Sea (South China Sea), crossing the majority of the Visayas region (Fig. 1) at a speed of 40.7 kph (22 knots)[13]. Haiyan maintained its structure as it moved over the east central Philippines. JMA observed that the lowest value ofcentral pressure was 895 hPa (very low central pressure means very high wind speed) and typhoon intensity increased from“very strong” to “violent” [28].
In terms of wind speed, the Joint Typhoon Warning Center [9] touted Haiyan as the most intense tropical cyclone in theworld for 2013. As Typhoon Haiyan traversed through the country, it caused damage to houses and infrastructure, floodingin low-lying areas, landslides and storm surges. Initial simulations reveal storm surges to have inundated an estimated98 km2 in Leyte and 93 km2 in Samar, two of the most devastated islands in the Philippines. Other coastal areas in thecentral Philippines region also experienced floods due to storm surges. Super Typhoon Haiyan is the deadliest typhoon everto hit the Philippines in recent history leaving 6300 dead, 1061 missing and 28,689 injured.
The storm surges of Haiyan were predicted two days in advance with a complete list that was broadcast over media thenight before Haiyan made landfall. Unfortunately, despite the advanced warnings, these were not translated into appro-priate action in every coastal village in the Central Philippines region. Here we elucidate the process behind the storm surgeforecast for Haiyan, assess its suitability for early warnings, enumerate the lessons learned from the disaster and thenrecommend measures to prevent the same mistakes from happening again in the future.
2. Storm surge forecasting method
To forecast the storm surges of Typhoon Haiyan, research scientists of the Nationwide Operational Assessment of Hazards(DOST-Project NOAH), the flagship disaster research program of the Department of Science and Technology, used the Japan
A.M.F. Lagmay et al. / International Journal of Disaster Risk Reduction 11 (2015) 1–12 3
Meteorological Agency (JMA) Storm Surge Model. At that time, the storm surge component of Project NOAH had only justbeen established and the Typhoon Haiyan event was the first time it released storm surge forecasts publicly. The JMA StormSurge Model that was used is a numerical code based on two-dimensional shallow water equations and is used to simulateand predict storm surges mainly caused by tropical cyclones. Storm surge values are calculated from the wind set up due tothe strong onshore winds above the sea surface and the inverse barometer effect associated with the sudden decrease ofpressure in the atmosphere. Storm surge height predictions can be made up to 72 h ahead of landfall [7]. Each calculationtakes about 20 min, and storm surge distribution maps are created using the results. Parameters used as input for the stormsurge model include bathymetry, storm track, central atmospheric pressure, and maximum wind speed. These inputs de-termine the accuracy of simulation results.
The model only accepts 2-min or 5-min grid resolution for bathymetry, as such; ETOPO2 data with grid postings every 2′was used. Bathymetry was a necessary parameter input in the JMA model since the slope of the sea floor influences theheight of the storm surge. Wide and gently-sloping sea floor produces higher storm surge heights, while narrow andsteeply-sloping shelves produce lower storm surge heights [16].
The predicted storm track used was from JMA, freely available to the public and available for download at http://www.wis-jma.go.jp/. JMA releases tropical cyclone forecasts every 3 h. Apart from the storm track, atmospheric pressure andmaximum wind speed were also derived from JMA. Generated storm surge height values within the swath of the 600 kmwide typhoon for pre-selected coastal sites of the Philippines, were then added to the data from WXTide – software thatcontains a catalog of worldwide astronomical tides. Addition of the storm surge height to WXTide generates the storm tidevalues. These were used by DOST-Project NOAH to warn the public through PAGASA, of this type of hazard associated withTyphoon Haiyan.
3. Storm surge model results
96-h storm surge forecasts were generated for Typhoon Haiyan covering 2013-11-06 00:00:00 to 2013-11-10 00:00:00UTC (Fig. 2). The simulations were updated three times using the forecasted tracks from JMA. The forecasts had to becontinuously updated as predicted storm tide heights and peak surge times change depending on the forecasted tropicalcyclone track data.
The first simulation used JMA's forecasted track data from 2013-11-06 11:00:00 UTC. The time series plots for 149 coastalsites were released to the public on the same day via the Project NOAH website. The plots show the predicted time of thepeak surge and the trend of the water level changes every 10 min for the duration of the simulation. Ormoc City in Leyte hadthe highest predicted storm tide height at 5.04 m (Fig. 3a), but in the succeeding simulation became 10th in the list with aheight of 3.8 m.
Fig. 2. Plot of the predicted maximum storm surge heights (in cm) for Typhoon Haiyan.

Fig. 3. Time series outputs from 3 JMA Storm Surge Model simulations. These are the highest predicted storm tides heights from the (a) first simulation,(b) second simulation, and (c) third simulation.
A.M.F. Lagmay et al. / International Journal of Disaster Risk Reduction 11 (2015) 1–124
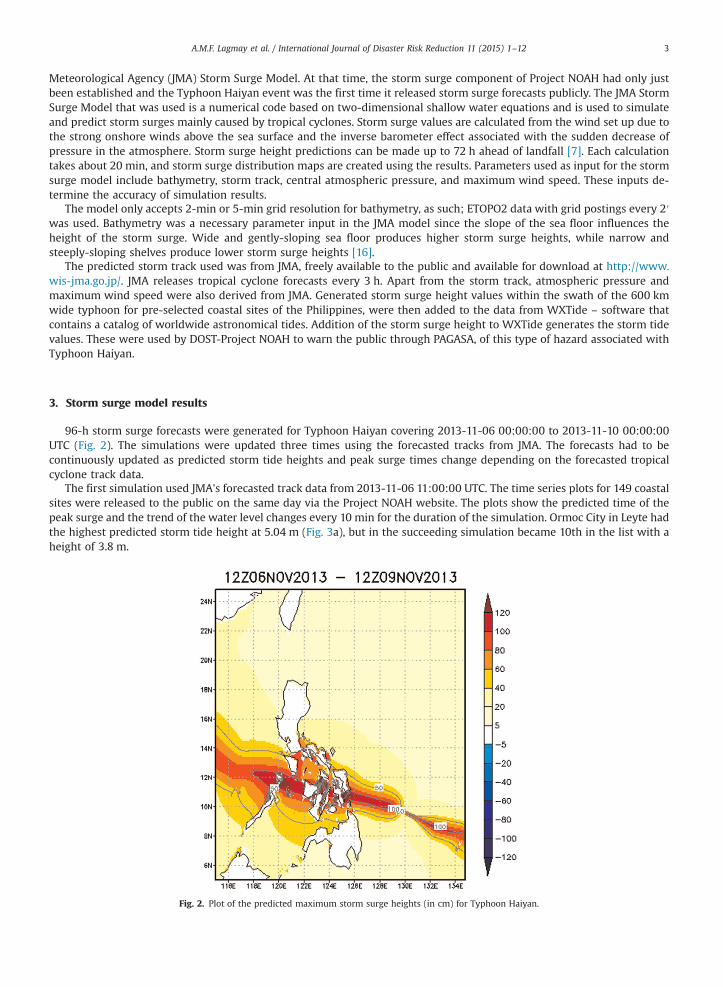
The second simulation made with 2013-11-07 11:00:00 UTC data was used for the official list of the highest predictedstorm surge and tide values. This was also released on 7th November and sent to the Office of Civil Defense (OCD) and theNDRRMC. The time series plots for the localities with the highest peak storm tide heights are shown in Fig. 3b. The highestpredicted storm tide height was 5.3 m for Matarinao Bay, Eastern Samar, which covers the towns of Salcedo, Quinapondan,Gen. MacArthur and Hernani. The official list of 68 localities provided to the NDRRMC is shown in Table 1. No less than thePresident of the Republic of the Philippines announced the severity of the impacts of the storm surges on primetimetelevision. Included in his speech was reference to the DOST-Project NOAH website (http://www.noah.dost.gov.ph), wherethe list of storm surge heights can be found.
A third simulation was made using 2013-11-06 17:00:00Z JMA data and the time series plots on the website wereupdated using these results (Fig. 3c). Places in the list of 10 highest predicted storm tide are consistent in the three si-mulations, with the highest storm tides found mostly in Leyte and Eastern Samar, where the typhoon was expected to makelandfall (Fig. 1). Storm surge events during Typhoon Haiyan have also been recorded in many of these areas. After thetyphoon, inundation models and field surveys were done to assess the coastal flooding (see Section 4.4 Assessment of StormSurge Inundation).
4. Discussion
4.1. Storm surge inundation Maps
Aside from the storm tide height forecasts, existing storm surge hazard maps were already available at the time of thedisaster. These maps were from the READY Project, which is a joint effort in risk mapping among government and donoragencies. The aim of the project is to reduce the problem of disaster risk management (DRR) at the local level by
Table 1Predicted storm tide for Typhoon Haiyan, 2 m and above.
Province Location Storm tide (m) Date Time of peak height
Eastern Samar Matarinao Bay 5.3 11/8/2013 09:50:00Biliran Poro Island, Biliran Strait 4.7 11/8/2013 12:10:00Leyte Tacloban, San Juanico Strait 4.5 11/8/2013 11:00:00Quezon Port Pusgo 4.4 11/9/2013 02:20:00Eastern Samar Andis Island, Port Borongan 4.3 11/8/2013 09:30:00Quezon Santa Cruz Harbor 4.2 11/9/2013 02:20:00Palawan Port Barton 3.9 11/9/2013 02:00:00Iloilo Banate 3.9 11/9/2013 02:10:00Leyte Palompon 3.9 11/8/2013 12:40:00Leyte Ormoc 3.8 11/8/2013 13:20:00Northern Samar Helm Harbor, Gamay Bay 3.7 11/8/2013 09:10:00Cebu Tuburan 3.2 11/8/2013 12:20:00Negros Occidental Himugaan River Entrance 3.1 11/8/2013 14:00:00Negros Occidental Cadiz 3.0 11/8/2013 03:10:00Masbate Bogo Bay 3.0 11/8/2013 12:50:00Camarines Sur Cabgan Island, San Miguel Bay 2.9 11/8/2013 08:10:00Camarines Norte Lamon Bay:Apat Bay 2.9 11/8/2013 09:00:00Oriental Mindoro Port Concepcion, Maestre de CampoI 2.8 11/9/2013 01:20:00Palawan Ulugan Bay 2.8 11/9/2013 01:30:00Samar Talalora 2.8 11/8/2013 12:00:00Albay Tabaco, Tabaco Bay 2.7 11/8/2013 09:20:00Masbate Masbate 2.7 11/8/2013 13:10:00Oriental Mindoro Calapan Bay 2.7 11/9/2013 01:30:00Quezon Torrijos 2.7 11/9/2013 02:00:00Leyte Canauay Island, Janabatas Ch 2.7 11/8/2013 12:00:00Quezon Aguasa Bay 2.6 11/9/2013 01:50:00Negros Occidental Danao River Entrance 2.6 11/8/2013 14:30:00Camarines Sur Tabgon Bay 2.5 11/8/2013 10:20:00Negros Occidental Carcar Bay 2.5 11/8/2013 14:40:00Aklan Aclan River Entrance 2.5 11/9/2013 01:40:00Quezon Atimonan 2.4 11/8/2013 08:50:00Masbate Port Barrera 2.4 11/9/2013 01:40:00Capiz Libas (Capiz Landing) 2.4 11/8/2013 15:30:00Camarines Norte Port Jose Panganiban 2.3 11/8/2013 08:50:00Occidental Mindoro Mangarin 2.3 11/9/2013 00:20:00Camarines Norte Lamon Bay:Capalonga 2.3 11/8/2013 08:40:00Occidental Mindoro Apo Island, Mindoro Strait 2.2 11/9/2013 01:10:00Batangas Anilao, Balayan Bay 2.2 11/9/2013 01:10:00Occidental Mindoro Sablayan 2.1 11/9/2013 01:10:00EasternSamar Hilaban Island 2.0 11/8/2013 08:50:00Cebu Carmen 2.0 11/7/2013 00:30:00Samar Uban Point, San Juanico Strait 2.0 11/8/2013 09:00:00Iloilo Miagao 2.0 11/9/2013 01:10:00Camarines Norte Guintinua Island, Calagua Islands 2.0 11/8/2013 09:20:00Bohol Maribojoc 2.0 11/8/2013 02:20:00
A.M.F. Lagmay et al. / International Journal of Disaster Risk Reduction 11 (2015) 1–12 5
empowering the most vulnerable cities and municipalities in the country and enable them to prepare disaster risk man-agement plans. The project hopes to develop a systematic approach to community disaster risk management. Supported bythe United Nations Development Program (UNDP) and the Government of Australia Australian Aid (AusAID), storm surgehazards maps are among the outputs of the project, shared with the sub-national government units or communities andintegrated into their local comprehensive development or land use plans [18]. READY hazard maps are made available tocommunities through the preparation of printed maps and also online through the National Mapping and Resource In-formation Agency (NAMRIA) Geoportal, among others. Fig. 4 shows the READY map for Tacloban. The purple color refers toan inundation height of 1–4 m. Based on reported storm tide heights and field data, this range is an underestimation of themaximum storm surge levels and extent.
Whether or not reference to these maps was made in the pre-emptive evacuation action is unknown. However, sincethere were information, education campaigns (IECs) made in Leyte where disaster officials learn how to use these maps forpreparedness and mitigation, it is assumed that they were at least aware of the hazard map's existence. The proponents ofthis study conducted interviews in Tacloban City, where the aforementioned relevant personnel had claimed that they hadat least seen and had knowledge of the hazard map's existence. Under Republic Act 10121 or the Philippine Disaster RiskReduction and Management Act [21], the local government should “identify, assess, and manage the hazards vulnerabilitiesand risks that may occur in their locality; and disseminate information and raise public awareness about those hazards,vulnerabilities and risks, their nature, effects, early warning signs and counter-measures”.

Fig. 4. Storm surge inundation map prepared for the city of Tacloban by the READY project team. This map was accessed on 19 November 2013 from theNAMRIA geoportal (http://www.geoportal.gov.ph/viewer/). (For interpretation of the references to color in this figure, the reader is referred to the webversion of this article.).
A.M.F. Lagmay et al. / International Journal of Disaster Risk Reduction 11 (2015) 1–126
4.2. Pre-emptive action
Because of the weather bulletins issued by PAGASA, work and classes were suspended on 7–8 November in severalprovinces in the path of the typhoon. Each city and municipality has the authority to declare suspensions and base theirdecisions mainly on bulletins provided by the Philippine Weather Bureau, supplemented by information from other in-ternational and local sources, including those posted by DOST-Project NOAH on its website and mobile applications.
Regional offices of the Department of Public Works and Highways (DPWH) conducted assessments of structural integrityof schools, cleaning of waterways and drainages, clearing of roads and pruning of trees. Response teams and heavyequipment were put on standby. The Department of Health (DOH) prepositioned medicine, and first aid kits and placedhospitals on alert [14]. The Armed Forces of the Philippines had the Naval Forces Southern Luzon (NAVFORSOL) dispatchtrucks, relief goods, diving gear, rubber boats, portable generators and squad tents in Albay. The Philippine Navy was placedon alert and directed all its floating assets to prepare and take necessary precautionary measures for the typhoon [1].
The Tacloban local government unit also evacuated people near the coast and had food packs ready [6]. The DOH inTacloban also augmented their stock of medicine and body bags. In Eastern Samar, Governor Conrado Nicart Jr., said theyhad rescuers and rescue boats on standby before Typhoon Haiyan hit the province [22]. In the provinces of Capiz and Iloiloon Panay Island, forced evacuation of residents in coastal villages was implemented up to 2 days before the typhoon madelandfall. The newly installed Doppler radar station in Guiuan, where the typhoon first made landfall, provided images of theincoming typhoon and was used as part-basis for the issuance of warnings given 2 days prior to landfall. The mayor ofGuiuan informed all barangay (village) officials to evacuate. Some residents evacuated, some did not [21]. In Manicani Islandin Guiuan, pre-emptive evacuation was implemented and barangay officials also explained to residents what a storm surgewas and could do. Later it was learned that out of 3000 residents, the island only had 1 casualty [4]. Furthermore, suc-ceeding field surveys reveal that the provinces of Capiz and Oriental Mindoro issued forced evacuation orders at least a daybefore the typhoon. Calapan City in Oriental Mindoro also issued evacuation orders based on PAGASA and Project NOAH'swarnings (see Fig. 1 – location map). In Iloilo province, municipality of Carles, with a total population of 62,690, experiencedstorm surges 4–5 m high. These storm surge heights were about the same as those that hit Tacloban and Tanauan, Leyte butonly 32 people died in this municipality [15].
4.3. News accounts
Coverage of Haiyan's aftermath was in both local and international news. Although the devastation was widespread inthe central Philippines region, attention was focused in Tacloban City, where national government officials and many of theweather news crews tasked to cover the Super typhoon positioned themselves.
According to the provincial government of Leyte, the storm surge was estimated to reach as high as the equivalent ofthree floors of a building [27]. Others estimated the waves that flattened Tacloban, destroyed most of the houses, upturned
A.M.F. Lagmay et al. / International Journal of Disaster Risk Reduction 11 (2015) 1–12 7
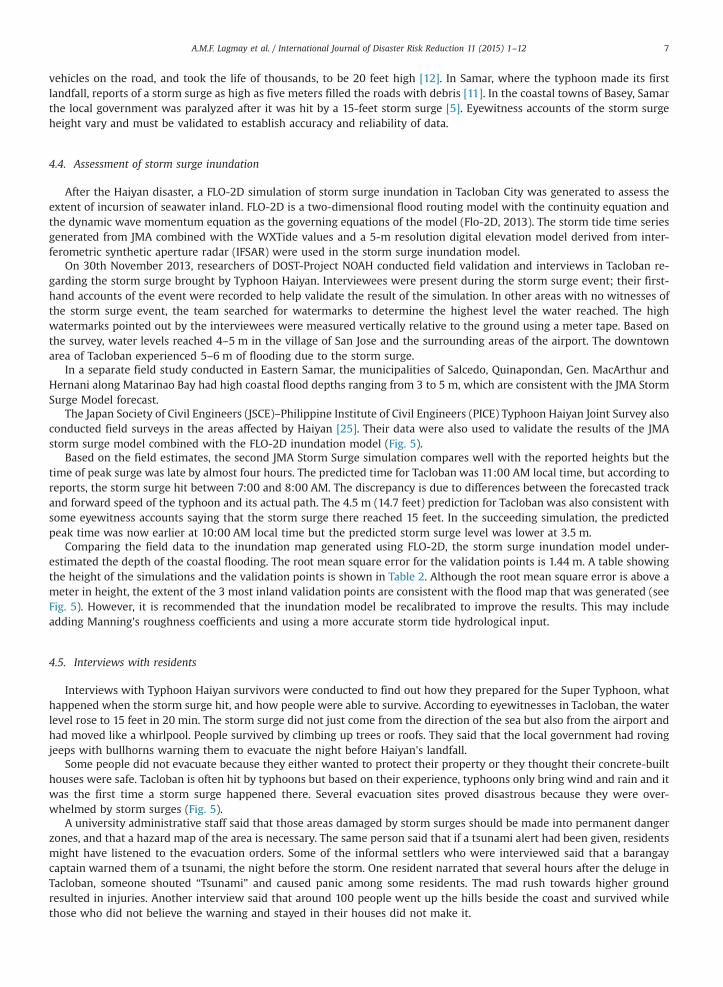
vehicles on the road, and took the life of thousands, to be 20 feet high [12]. In Samar, where the typhoon made its firstlandfall, reports of a storm surge as high as five meters filled the roads with debris [11]. In the coastal towns of Basey, Samarthe local government was paralyzed after it was hit by a 15-feet storm surge [5]. Eyewitness accounts of the storm surgeheight vary and must be validated to establish accuracy and reliability of data.
4.4. Assessment of storm surge inundation
After the Haiyan disaster, a FLO-2D simulation of storm surge inundation in Tacloban City was generated to assess theextent of incursion of seawater inland. FLO-2D is a two-dimensional flood routing model with the continuity equation andthe dynamic wave momentum equation as the governing equations of the model (Flo-2D, 2013). The storm tide time seriesgenerated from JMA combined with the WXTide values and a 5-m resolution digital elevation model derived from inter-ferometric synthetic aperture radar (IFSAR) were used in the storm surge inundation model.
On 30th November 2013, researchers of DOST-Project NOAH conducted field validation and interviews in Tacloban re-garding the storm surge brought by Typhoon Haiyan. Interviewees were present during the storm surge event; their first-hand accounts of the event were recorded to help validate the result of the simulation. In other areas with no witnesses ofthe storm surge event, the team searched for watermarks to determine the highest level the water reached. The highwatermarks pointed out by the interviewees were measured vertically relative to the ground using a meter tape. Based onthe survey, water levels reached 4–5 m in the village of San Jose and the surrounding areas of the airport. The downtownarea of Tacloban experienced 5–6 m of flooding due to the storm surge.
In a separate field study conducted in Eastern Samar, the municipalities of Salcedo, Quinapondan, Gen. MacArthur andHernani along Matarinao Bay had high coastal flood depths ranging from 3 to 5 m, which are consistent with the JMA StormSurge Model forecast.
The Japan Society of Civil Engineers (JSCE)–Philippine Institute of Civil Engineers (PICE) Typhoon Haiyan Joint Survey alsoconducted field surveys in the areas affected by Haiyan [25]. Their data were also used to validate the results of the JMAstorm surge model combined with the FLO-2D inundation model (Fig. 5).
Based on the field estimates, the second JMA Storm Surge simulation compares well with the reported heights but thetime of peak surge was late by almost four hours. The predicted time for Tacloban was 11:00 AM local time, but according toreports, the storm surge hit between 7:00 and 8:00 AM. The discrepancy is due to differences between the forecasted trackand forward speed of the typhoon and its actual path. The 4.5 m (14.7 feet) prediction for Tacloban was also consistent withsome eyewitness accounts saying that the storm surge there reached 15 feet. In the succeeding simulation, the predictedpeak time was now earlier at 10:00 AM local time but the predicted storm surge level was lower at 3.5 m.
Comparing the field data to the inundation map generated using FLO-2D, the storm surge inundation model under-estimated the depth of the coastal flooding. The root mean square error for the validation points is 1.44 m. A table showingthe height of the simulations and the validation points is shown in Table 2. Although the root mean square error is above ameter in height, the extent of the 3 most inland validation points are consistent with the flood map that was generated (seeFig. 5). However, it is recommended that the inundation model be recalibrated to improve the results. This may includeadding Manning's roughness coefficients and using a more accurate storm tide hydrological input.
4.5. Interviews with residents
Interviews with Typhoon Haiyan survivors were conducted to find out how they prepared for the Super Typhoon, whathappened when the storm surge hit, and how people were able to survive. According to eyewitnesses in Tacloban, the waterlevel rose to 15 feet in 20 min. The storm surge did not just come from the direction of the sea but also from the airport andhad moved like a whirlpool. People survived by climbing up trees or roofs. They said that the local government had rovingjeeps with bullhorns warning them to evacuate the night before Haiyan's landfall.
Some people did not evacuate because they either wanted to protect their property or they thought their concrete-builthouses were safe. Tacloban is often hit by typhoons but based on their experience, typhoons only bring wind and rain and itwas the first time a storm surge happened there. Several evacuation sites proved disastrous because they were over-whelmed by storm surges (Fig. 5).
A university administrative staff said that those areas damaged by storm surges should be made into permanent dangerzones, and that a hazard map of the area is necessary. The same person said that if a tsunami alert had been given, residentsmight have listened to the evacuation orders. Some of the informal settlers who were interviewed said that a barangaycaptain warned them of a tsunami, the night before the storm. One resident narrated that several hours after the deluge inTacloban, someone shouted “Tsunami” and caused panic among some residents. The mad rush towards higher groundresulted in injuries. Another interview said that around 100 people went up the hills beside the coast and survived whilethose who did not believe the warning and stayed in their houses did not make it.
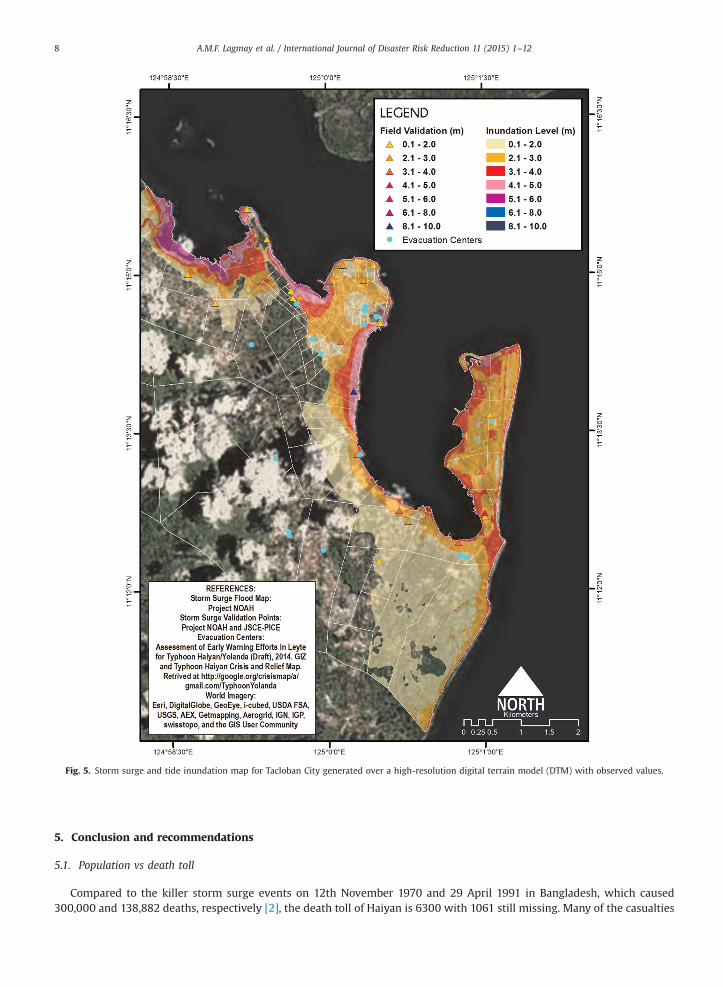
Fig. 5. Storm surge and tide inundation map for Tacloban City generated over a high-resolution digital terrain model (DTM) with observed values.
A.M.F. Lagmay et al. / International Journal of Disaster Risk Reduction 11 (2015) 1–128
5. Conclusion and recommendations
5.1. Population vs death toll
Compared to the killer storm surge events on 12th November 1970 and 29 April 1991 in Bangladesh, which caused300,000 and 138,882 deaths, respectively [2], the death toll of Haiyan is 6300 with 1061 still missing. Many of the casualties

Table 2Measured height vs modeled inundation depth.
Location Measured heightfrom ground (m)
Model (m)
Brgy 69, Tacloban 0.80 2.030LY 891Brgy Tigbao 1.7 0.090LY 891Brgy Tigbao 2.5 0.030Brgy 69/70, Tacloban 1.3 2.980Brgy 1 & 4 Trece Martires(Port of Tacloban)
3.6 1.930
Leyte Park Hotel Brgy 1 & 4,Tacloban City
0.3 2.340
Brgy 1 & 4 Trece Martires 2.4 1.910Brgy 74 Lola Tula 3.1 2.280Brgy 74 Lola Tula 0.9 2.190Brgy 1 City Proper, Tacloban 2.6 2.630Tacloban 2.9 4.340Brgy 91 Abucay, Tacloban 1.3 2.310Brgy 38 & 65, Tacloban 1.3 2.310BM 889 Brgy 71 1.8 0.210Philhealth Office Brgy 25 CityProper, Tacloban
1.1 0.770
Brgy 54A, Tacloban 8.60 (?) 4.660Brgy 88 D. Z. RomualdezAirport, Tacloban
4.20 2.360
Covention Center, Brgy 62Sagkaan, Tacloban
3.1 2.860
Brgy 77 Fatima Village,Tacloban
3.9 2.620
Brgy hall Brgy 88 San Jose,Tacloban
4.20 2.960
Brgy 85 San Jose, Tacloban 3.3 2.880Brgy Marasbaras, Tacloban 0.7 0.160Philippine Port Authority,Tacloban Port
3.44 3.420
Security Gate of TESDA, Ta-cloban Port
2.98 2.310
TESDA, Tacloban Port 2.74 1.540Barangay 83-A, Tacloban 4.00 2.400Barangay 88, Tacloban 4.60 2.840Barangay 78, Tacloban 3.00 1.790Barangay 45, Tacloban 3.50 2.250Barangay 6A, Tacloban 2.00 2.100
RMSE 1.4434
Data from JSCE–PICE Typhoon Haiyan Joint Survey Team and Project NOAH [8]. The question mark for the 8.6 m value points to an outlier in the data.
Table 3Top ten cities/municipalities with fatalities caused by Typhoon Haiyan.
Municipality/City Number of deaths [15] Actual population[20]
Percentage of death relativeto total population
Province
Tacloban City 2678 221,174 1.21% LeyteTanauan 1375 50,119 2.74% LeytePalo 902 62,727 1.44% LeyteBasey 194 50,423 0.38% SamarGuiuan 107 47,037 0.23% Eastern SamarHernani 72 8070 0.89% Eastern SamarEstancia 52 42,666 0.12% IloiloDagami 49 31,490 0.15% LeyteOrmoc City 37 191,200 0.02% LeyteTolosa 32 17,921 0.18% Leyte
A.M.F. Lagmay et al. / International Journal of Disaster Risk Reduction 11 (2015) 1–12 9
of Typhoon Haiyan are from Tacloban City and its adjacent southern municipalities of Palo and Tanauan (Table 3). Theseareas rank among the top 3 highest percentage number of fatalities relative to the population. Based on these metrics, it isclear that the number of deaths is not only related to the landscape of the affected areas and proximity to where the eye ofthe typhoon made its initial impact but also with the population.
A.M.F. Lagmay et al. / International Journal of Disaster Risk Reduction 11 (2015) 1–1210
5.2. Storm surge forecasting
Meteorological factors that affect storm surge models include wind speed, pressure, and storm track. Physical factors, onthe other hand, are near-shore bathymetry, coastal shape, and topography. The height of the surge highly depends on thestrength of the winds carrying it. However, physical factors are also important to consider. For example, a storm surge ismore dangerous in areas with a gently sloping seafloor, as there is no barrier for the waves to stop the surge from goingfurther inland. Storm surge prediction requires the input of all the abovementioned factors in the storm surge model tocreate accurate hazard maps.
The JMA Storm Surge Model was convenient and practical to use before Typhoon Haiyan's landfall because it was easy toset up and had a quick runtime. The storm surge forecast was made 2 days before Haiyan's impact, enough time to warnaffected areas for appropriate response. The 4.5 m (14.7 feet) prediction for Tacloban was also consistent with some eye-witness accounts saying that the storm surge there reached 15 feet. The number one in the list of predicted storm surgeheights was Matarinao Bay, Eastern Samar. In the municipality of Hernani, Eastern Samar, at the mouth of Matarinao Bay,the highest storm surge height validated by our team was 5 m.
Based on the comparison of the field validation of Project NOAH staff and JSCE–PICE with the simulated inundation map,the flood depth and extent was underestimated in some areas of Tacloban. However, the forecast was still able to determinethe areas likely be affected by storm surges. Although the accuracy of the results depended on the predicted typhoon trackand bathymetric data, which was not that exact, the forecasting process was nevertheless suitable for use as a tool for earlywarning.
5.3. Hazard exceeding precedent
Even with the warnings, the typhoon was simply too powerful and the storm surge that levelled many communities wasunprecedented. Tacloban City, one of the hardest hit places by the typhoon, accounted for 2500 of the over 6000 totaldeaths. Tacloban's location, its low elevation, its urbanization, and its dense population are factors that contribute to itssusceptibility to storm surges. It is bordered on the east by the San Juanico Strait that stretches to the Pacific Ocean and onthe south by the San Pedro Bay that stretches to the Leyte Gulf. Tacloban is also bordered on its north and the west bymountains, effectively trapping the storm surges that swept inland. From field surveys, the extent of the storm surgesreached at least 2 km inland, which was not reflected in earlier storm surge hazard maps. A plot of the evacuation centers inTacloban show how they positioned relative to the storm surge hazard map (see Fig. 5).
5.4. Communication challenges and Poor local response
The storm surges of Typhoon Haiyan were predicted 2 days in advance with a complete list that was broadcast over tri-media and social media. DOST-Project NOAH hosted the list of areas that were to be affected by storm surges, whichidentified specific places and heights. That warning was echoed by no less than the President of the Philippines over pri-metime television on the eve of Haiyan's landfall. Unfortunately, despite the advanced warnings, these were not translatedinto appropriate action in every coastal village in the Central Philippines region.
Storm surge hazard maps from the READY project, which existed 7 years prior to the impact of Typhoon Haiyan did notreflect the actual storm surge flood extent. This is due to the difficulty in predicting a Haiyan strength scenario, which wasan extreme event in the historical record. The discrepancy in the depiction of storm surge inundation is due to limits in themethodology used in generating the hazard map. Since high-resolution topography derived from airborne LiDAR (verticalaccuracy of 0.15 cm) and IfSAR (vertical accuracy of 0.5 m) surveys were not available then, base maps were too crude tocreate hazard maps with good accuracy in terms of flood distribution, height and extent [24]. With ample warning of stormsurges, it is necessary that the community have reliable hazard maps to base appropriate action upon. The last thing that wewant to happen is for residents in the warned community to move from one unsafe place to another unsafe place. And it isonly with a reliable storm surge hazard map that anyone can really determine where safe areas from storm surges arelocated. The Philippine government invested heavily in LiDAR and IfSAR for flood and storm surge simulations (see Fig. 5)and were already being utilized [10]. However, the Haiyan catastrophe got ahead of the detailed hazard mapping effortsusing LiDAR and IfSAR as base topography.
Also, not everyone knew what a storm surge was and what it could do. People were more familiar with the term tsunamiand the word storm surge was new to them. Although disaster responders encouraged people to leave the coastal villages ofTacloban, there was still difficulty in getting everyone out of harm's way. There are many reasons that compound thesituation, making complete evacuation of residents hard to implement: The coastal towns hit by the storm surge have largecommunities of informal settlers, and they are some of the most vulnerable to disasters due to their high population densityand flimsy-built housing. In some communities, there is a local belief that they know their sea better than anyone else,which also hindered evacuation. The clear skies the night prior to the typhoon also made it appear that a catastrophe wasnot imminent. There were also news reports that men in some areas had stayed behind to guard their houses. Two historicalstorm surge events had previously devastated Tacloban—one in 1897 which killed up to 1500 [3] and another in 1912 whichkilled 15,000 people [26]—but the residents were not aware of these and had not learned from history. Further, there is alsothe assumption that common folk are generally disinterested in learning about hazards because daily concerns are more

A.M.F. Lagmay et al. / International Journal of Disaster Risk Reduction 11 (2015) 1–12 11
important and at that time, political issues related to corruption had diverted media attention. For the people that didevacuate, some of them still fell victims to the typhoon as 68% of evacuation centers were overwhelmed by storm surges(Fig. 5). In the final analysis, even if the people knew exactly what a storm surge was, if they did not know the location ofsafe evacuation sites due to the absence of detailed and accurate maps, loss of lives would still be inevitable.
5.5. Recommendations
To prevent an impending disaster, there are two important points to consider: (1) Warning and (2) Action (Response).The warning must be accompanied by knowledge by the people on what to do in case the alarm is raised. For Haiyanaffected areas, the storm surge warning was raised days in advance but incomplete action was made to prevent the loss oflives by the thousands. This was complicated by a variety of reasons as mentioned above. However, it is important to notethat there must have been preparedness action made by the communities since the extremely devastated places are coastalareas which had on average about 99% of their population survive.
To achieve a much lower fatality count, there is a need to strengthen hazards education at the barangay (village) leveland develop a culture of preparedness. Although this is already embodied in section 12 articles 9 and 10 of Republic Act no.10121 [19], its actual implementation leaves much to be desired.
Moreover, reference to more detailed maps that depict the scenario of inundation for any given storm surge warning isimperative. Maps that are low resolution and developed through field interviews are insufficient or too crude becauseanecdotal accounts can be incomplete. Detailed maps can only be created through highly accurate digital terrain models(DTMs), surveyed through Light Detection and Ranging (LIDAR) or equivalent survey instruments. Computer models ofstorm surge inundation are made on these high-resolution DTMs, printed out for display for each barangay or shownthrough the internet for reference by the public to know the action to take when there is a warning. The public will want tomove from an unsafe place to a place that is safe based on the detailed storm surge hazard maps.
The Philippines is visited by 20 cyclones each year and storm surges are common. The one that happened in the centralPhilippine region during Haiyan is perhaps the most powerful in recent history and it will not be the last of its kind. Thesooner the detailed and high-resolution storm surge hazard maps are created, the better the people can respond to anywarning of an impending storm surge hazard.
Acknowledgments
We wish to acknowledge the Department of Science and Technology (DOST) for funding the project (Grant no. 6234),Philippine Atmospheric Geophysical and Astronomical Services Administration (PAGASA), Nationwide Operational Assess-ment of Hazards (Project NOAH) and the University of the Philippines National Institute of Geological Sciences (UP NIGS) fortheir support, the Japan Meteorological Agency (JMA) for the use of their software, and the JSCE-PICE Typhoon Haiyan JointSurvey Team for their field data.
References
[1] Armed Forces of the Philippines, Updates on AFP Efforts in Preparation for Typhoon Yolanda, Official Gazette, ⟨http://www.gov.ph/2013/11/07/updates-on-afp-efforts-in-preparation-for-typhoon-yolanda/⟩, 2013 (retrieved 14.11.13).
[2] Bangladesh Department of Disaster Management, Cyclones and Storm Surges, ⟨http://www.ddm.gov.bd/cyclone.php⟩, 2012 (retrieved 29.11.13).[3] G. Bankoff, Storms of history—water, hazard and society in the Philippines, in: P. Boomgaard (Ed.), AWorld of Water, KITLV Press, Leiden, Netherlands,
2007, p. 170.[4] J. Canoy, Evacuation Saves Guiuan Islanders' Lives, ABS-CBN News, ⟨http://www.abs-cbnnews.com/nation/regions/11/18/13/evacuation-saves-guiua
n-islanders-lives⟩, 2013, November 19 (retrieved 24.09.14).[5] L. Cuevas-Miel, Survivors Hid in Caves but Yolanda Still Left More than 300 Dead in Two Samar Towns, InterAksyon, ⟨http://www.interaksyon.com/
article/74569/survivors-hid-in-caves-but-Haiyan-still-left-more-than-300-dead-in-two-samar-towns⟩, 2013 (retrieved 13.11.13).[6] L. Dalangin-Fernandez, ‘Tacloban Prepared for Yolanda but its Strength was Overwhelming,’ local officials say, InterAksyon, ⟨http://www.interaksyon.
com/article/74581/tacloban-prepared-for-Haiyan-but-its-strength-was-overwhelming-local-officials-say⟩, 2013 (retrieved 13.11.13).[7] H. Hasegawa, N. Kohno, H. Hayashibara, JMA's Storm Surge Prediction for the WMO Storm Surge Watch Scheme (SSWS), RSMC Tokyo-Typhoon Center
Technical Review No. 14 (2012) 13–24.[8] Japan International Cooperation Agency (JICA), Typhoon Yolanda Disaster Emergency Recovery Reconstruction Assistance Project in the Philippines.[9] JTWC, Prognostic Reasoning for Super Typhoon 31 W (Haiyan), ⟨http://weather.noaa.gov/pub/data/raw/wd/wdpn33.pgtw..txt⟩, 2013 (retrieved
06.11.13).[10] A.M. Lagmay, Disseminating Near Real-Time Hazards Information and Flood Maps in the Philippines Through Web-GIS, ⟨http://blog.noah.dost.gov.ph/
2014/01/06/disseminating-near-real-time-hazards-information-and-flood-maps-in-the-philippines-through-web-gis/⟩, 2012.[11] P. Liljas, Supertyphoon Haiyan Smashes into the Philippines, Time, ⟨http://world.time.com/2013/11/07/supertyphoon-haiyan-smashes-into-the-philippines/⟩,
2013 (retrieved 08.11.13).[12] V.B. Lopez, Storm Surge: Biggest Threat from Tropical Cyclone, Sun Star, ⟨http://www.sunstar.com.ph/breaking-news/2013/11/11/storm-surge-
biggest-threat-tropical-cyclone-313195⟩, 2013 (retrieved 13.11.13).[13] NASA, Haiyan (Northwestern Pacific Ocean), ⟨http://www.nasa.gov/content/goddard/haiyan-northwestern-pacific-ocean/#.U7JSMfmSwk4⟩, 2013,
November 20 (retrieved 30.11.13).[14] NDRRMC, Report on Actions Taken by the Government in the Wake of Typhoon Haiyan, Official Gazette, ⟨http://www.gov.ph/2013/11/11/ndrrmc-re
port-on-actions-taken-by-government-in-the-wake-of-typhoon-yolanda-november-11-2013/⟩, 2013, November 11.

A.M.F. Lagmay et al. / International Journal of Disaster Risk Reduction 11 (2015) 1–1212
[15] NDRRMC, Update re the Effects of Typhoon Yolanda (Haiyan), National Disaster Risk Reduction and Management Council, ⟨http://www.ndrrmc.gov.ph/attachments/article/1177/Update%20Effects%20TY%20YOLANDA%2017%20April%202014.pdf⟩, 2014, April 20 (retrieved 27.06.14).
[16] NOAA, Storm Surge Overview. Retrieved from National Weather Service—National Hurrican Center: ⟨http://www.nhc.noaa.gov/surge/⟩, 2013, June 3.[17] PAGASA, Typhoon “YOLANDA”, ⟨http://www.pagasa.dost.gov.ph/wb/tcupdate.shtml⟩, 2013, November 6 (retrieved 6.11.13).[18] A. Palacio, Emergency Preparedness in the Philippines: A Country Perspective, Asian Development Bank, Manila, 2007.[19] Philippine Congress. Philippine Disaster Risk Reduction and Management Act of 2010, Republic of the Philippines, Congress of the Philippines, Metro
Manila, Fourteenth Congress Third Regular Session, July 27, 2009.[20] Philippine Statistics Authority, Retrieved from National Statistical Coordination Board, ⟨http://www.nscb.gov.ph/⟩, 2010.[21] P. Ranada, No Food for 4 Days in Guiuan Islands, Rappler, ⟨http://www.rappler.com/move-ph/issues/disasters/typhoon-yolanda/43665-food-guiua
n-islands-haiyan⟩, 2013 (retrieved 15.11.13).[22] Rappler.com, Eastern Samar resid$ents not Ready for Storm Surge, from ⟨http://www.rappler.com/video/reports/43739-eastern-samar-
residents-not-ready-for-storm-surge⟩, 2013, November 15 (retrieved 19.11.13).[23] Schott, Timothy; Landsea, Chris; Hafele, Gene; Lorens, Jeffrey; Taylor, Arthur; Thurm, Harvey; Ward, Bill; Willis, Mark; Zal, Walt, The Saffir–Simpson
Hurricane Wind Scale. Retrieved from National Weather Service—National Hurricane Center, ⟨http://www.nhc.noaa.gov/pdf/sshws.pdf⟩, 2012, Feb-ruary 1.
[24] G.J.-P. Schumann, P.D. Bates, J.C. Neal, K.M. Andreadis, Technology: fight floods on a global scale, Nature 507 (2014) 169.[25] Yoshimitsu Tajima, Tomohiro Yasuda, Benito M. Pacheco, Eric C. Cruz, Koji Kawasaki, Hisamichi Nobuoka, Mamoru Miyamoto, Yuji Asano,
Taro Arikawa, Noel M. Ortigas, Ronwaldo Aquino, William Mata, Justin Valdez, Ferdinand Briones, Initial Report of Jsce-Pice Joint Survey on the StormSurge Disaster Caused by Typhoon Haiyan, Coast. Eng. J. 56 (2014). 1450006 [12 pages], ⟨http://dx.doi.org/10.1142/S0578563414500065⟩.
[26] The Washington Herald, 15,000 Die in Philippine Storm. The Washington Herald, ⟨http://chroniclingamerica.loc.gov/lccn/sn83045433/1912-11-30/ed-1/seq-1/⟩ 1912, November 30, p. 1.
[27] T.C. Valderama, What have you done, Yolanda? The Manila Times, ⟨http://www.manilatimes.net/what-have-you-done-yolanda/52057/⟩ 2013 (re-trieved 30.11.13).
[28] WIS-JMA, Typhoon Best Track 2013-12-18T00:00:00Z, WMO Information System—Tokyo Global Information System Centre, ⟨http://www.wis-jma.go.jp/cms/warning/2013/12/18/typhoon-best-track-2013-12-18t000000z/⟩ 2013, December 18.
Related Documents