Bridging the Gap is a program of the Robert Wood Johnson Foundation. nationwide evaluation results August 2010 School District Wellness Policies: Evaluating Progress and Potential for Improving Children’s Health Three Years After the Federal Mandate VOLUME 2 SCHOOL YEARS

Welcome message from author
This document is posted to help you gain knowledge. Please leave a comment to let me know what you think about it! Share it to your friends and learn new things together.
Transcript
Bridging the Gap is a program of the Robert Wood Johnson Foundation.
nationwide evaluation results
August 2010
School District Wellness Policies: Evaluating Progress and Potential for Improving Children’s Health Three Years After the Federal Mandate
volume 2
school yeArs
About Bridging the Gap
Bridging the Gap is a nationally recognized research program of the Robert Wood Johnson Foundation dedicated to improving the understanding of how policies and environmental factors affect diet, physical activity and obesity among youth, as well as youth tobacco use. The program identifies and tracks information at the state, community and school levels; measures change over time; and shares find-ings that will help advance effective solutions for reversing the childhood obesity epidemic and preventing young people from smoking. Bridging the Gap is a joint project of the University of Illinois at Chicago’s Institute for Health Research and Policy and the University of Michigan’s Institute for Social Research. For more information, visit www.bridgingthegapresearch.org.
University of Illinois at ChicagoInstitute for Health Research and Policy1747 West Roosevelt Road, 5th floor (M/C 275)Chicago, IL 60608(866) 757-4507www.bridgingthegapresearch.org
This report was written by the Bridging the Gap program at the University of Illinois at Chicago with support from the Robert Wood Johnson Foundation. The opinions expressed in this report are those of the authors and do not necessarily reflect the views of the Foundation.
Suggested Citation
Chriqui JF, Schneider L, Chaloupka FJ, Gourdet C, Bruursema A, Ide K and Pugach O. School District Wellness Policies: Evaluating Progress and Potential for Improving Children’s Health Three Years after the Federal Mandate. School Years 2006–07, 2007–08 and 2008–09. Vol. 2. Chicago, IL: Bridging the Gap Program, Health Policy Center, Institute for Health Re-search and Policy, University of Illinois at Chicago, 2010, www.bridgingthegapresearch.org.
About the Authors
Jamie Chriqui, Ph.D., M.H.S., directs all policy research for the Bridging the Gap program and is a research associate professor in Political Science and senior research scientist within the Health Policy Center in the Institute for Health Research and Policy at the University of Illinois at Chicago.
Linda Schneider, D.C., M.S., Camille Gourdet, J.D., M.A., Amy Bruursema, Kristen Ide and Oksana Pugach, M.S. are with the Bridging the Gap program located within the Health Policy Center in the Institute for Health Research and Policy at the University of Illinois at Chicago.
Frank Chaloupka, Ph.D., co-directs the Bridging the Gap program and is a distinguished professor of Economics and director of the Health Policy Center in the Institute for Health Research and Policy at the University of Illinois at Chicago.
This report, or part of, may be reproduced without prior permission provided
the above citation is listed.
Copyright 2010 Bridging the Gap
For questions about the content of the report, contact:
Jamie F. Chriqui, Ph.D., M.H.S.Bridging the GapHealth Policy CenterInstitute for Health Research and PolicyUniversity of Illinois at ChicagoTel.: (312) 996-6410E-mail: [email protected]
Support for this publication was provided by the Robert Wood Johnson
Foundation.
The Robert Wood Johnson Foundation focuses on the pressing health
and health care issues facing our country. As the nation’s largest
philanthropy devoted exclusively to improving the health and health
care of all Americans, the Foundation works with a diverse group of
organizations and individuals to identify solutions and achieve
comprehensive, meaningful and timely change. For more information,
visit www.rwjf.org.
3
Introduction page 4
Report Overview page 5
Major Findings and Trends page 6
Summary of Key Findings page 9
Competitive Foods and Beverages page 9
Access and Content Restrictions page 9
Vending Contracts and Marketing Practices page 10
School Meals page 10
Nutrition Education page 11
Physical Activity and Physical Education page 12
Requirements for Implementation and Evaluation of Wellness Policies page 13
Next Steps page 14
Wellness Policy Data page 15
Table 1: Percentage of Students in Districts Nationwide with Wellness Policy Provisions, School Years 2006–07, 2007–08 and 2008–09
Competitive Food and Beverage Content Restriction Data page 22
Table 2: Percentage of Students in Districts Nationwide with Wellness Policies Addressing Competitive Food and Beverage Content Restrictions by Grade Level and Location of Sale, School Year 2008–09
Study Methods page 29
Acknowledgements page 29
References page 30
4 Introduction
Introduction
In the United States, obesity rates among children of all ages are dramatically higher than they were a genera-tion ago, and there are significant ethnic and racial disparities.1 Obese children are at increased risk for serious health problems, including heart disease, type 2 diabetes and asthma.2 Each year the United States spends $14 billion in direct health expenses attributed to childhood obesity.3
Schools play an important role in the lives of our chil-dren. Past research has shown that overweight and obese children tend to miss more school,4 which may affect academic performance.5 In contrast, strong evidence links healthy nutrition and physical activity behaviors with improved academic performance and classroom behavior.6,7 And there is growing evidence that school-based policies regulating foods and bever-ages and required levels and types of physical activity are significantly related to calories consumed and expended by school-age children, and to their weight and body mass index levels.8–11
Federal Requirement for School District Wellness Policies
Schools serve as a fundamental setting for providing children and adolescents with a healthy environment where they can consume nutritious meals, snacks and beverages; get regular physical activity; and learn about the importance of lifelong healthy behaviors.12,13 Recognizing this, Congress included language in the Child Nutrition and WIC Reauthorization Act of
a In the United States, public schools are governed by local education agencies at the school-board, town or district level. Local education agencies adopt policies that apply to all schools within their jurisdiction.
2004 (P.L. 108-265, Section 204) that required school districtsa participating in the National School Lunch Program (NSLP; [42 U.S.C.1751 et seq.]) or other child nutrition programs (42 U.S.C. 1771 et seq.), such as the School Breakfast Program, to adopt and implement a wellness policy by the first day of the 2006–07 school year.
According to the Act, the wellness policies were required to include:
goals for nutrition education;•an assurance that school meal nutrition guidelines •meet the minimum federal school meal standards;guidelines for foods and beverages sold outside of •school meal programs (i.e., “competitive foods and beverages”);goals for physical activity and other school-based •activities; andimplementation plans.•
Although the federal mandate did not authorize funding for school districts to implement these poli-cies, it does have significant potential for improving school nutrition and physical activity environments for millions of students nationwide. For example, during school year 2008–09, more than 31 million students participated in the National School Lunch Program, and more than 10 million students partici-pated in the School Breakfast Program.14,15

5www.bridgingthegapresearch.org
Report Overview
This report provides updated results from the most comprehensive analysis of written wellness policies to date, and includes data from the first three years following the required adoption date for wellness poli-cies. The major findings and trends presented in this report identify areas where progress has been made in strengthening the written policies, as well as opportu-nities for improvement.
The report also highlights key findings most critical for informing efforts to make the school environment healthier for students and to prevent childhood obesity. These data are especially relevant to the upcoming federal reauthorization of both the Child Nutrition Act and the Elementary and Secondary Education Act, and they provide specific guidance for recommendations included in the 2010 White House Task Force report on childhood obesity.16
This report concludes with Table 1, which summa-rizes all data analyzed from the 2006–07, 2007–08 and 2008–09 school years, and Table 2, which pro- vides details about competitive food and beverage content restrictions by location of sale for the 2008–09 school year.
Findings are based on nationally representative samples of school districts each year. A brief over-view of the study methodology is included at the end of this report. More information, including complete data for the three years studied, is available at www.bridgingthegapresearch.org.
This report serves as an update to our first report on district wellness policies, which was released in July 2009.17 New data presented in this report:
highlight district policies for competitive products by location of sale—and identify policy gaps that fail to restrict student’s •access to unhealthy foods and beverages during the school day.
examine how closely district policies aligned with the Institute of Medicine’s 2007 nutritional standards for competitive •products sold in schools, which called for increasing the availability of fruits, vegetables and whole grains; decreasing saturated fat, trans fat, added sugars, salt and calories; prohibiting sugar-sweetened beverages; limiting milk to 1% or nonfat options; limiting the sugar and calorie content of flavored milk; and limiting caffeine content and beverage serving sizes.18
explore provisions that go beyond the current federal wellness policy requirements to specifically address physical education •and other topics, such as joint use of school facilities, safe routes to school, and marketing of foods and beverages on campus.
For each policy provision analyzed in this study, data are presented on the percentage of students in a district with: 1) a strong
policy; 2) a weak policy; or 3) no policy. We defined STRonG PoLICy PRovISIonS as those that required action and speci-
fied an implementation plan or strategy. They included language such as shall, must, will, require, comply and enforce. WEak
PoLICy PRovISIonS included vague terms, suggestions or recommendations, and some required action, but only for certain
grade levels or times of day. They included language such as should, might, encourage, some, make an effort to, partial and try.
6 Major Findings and Trends
Major Findings and Trends
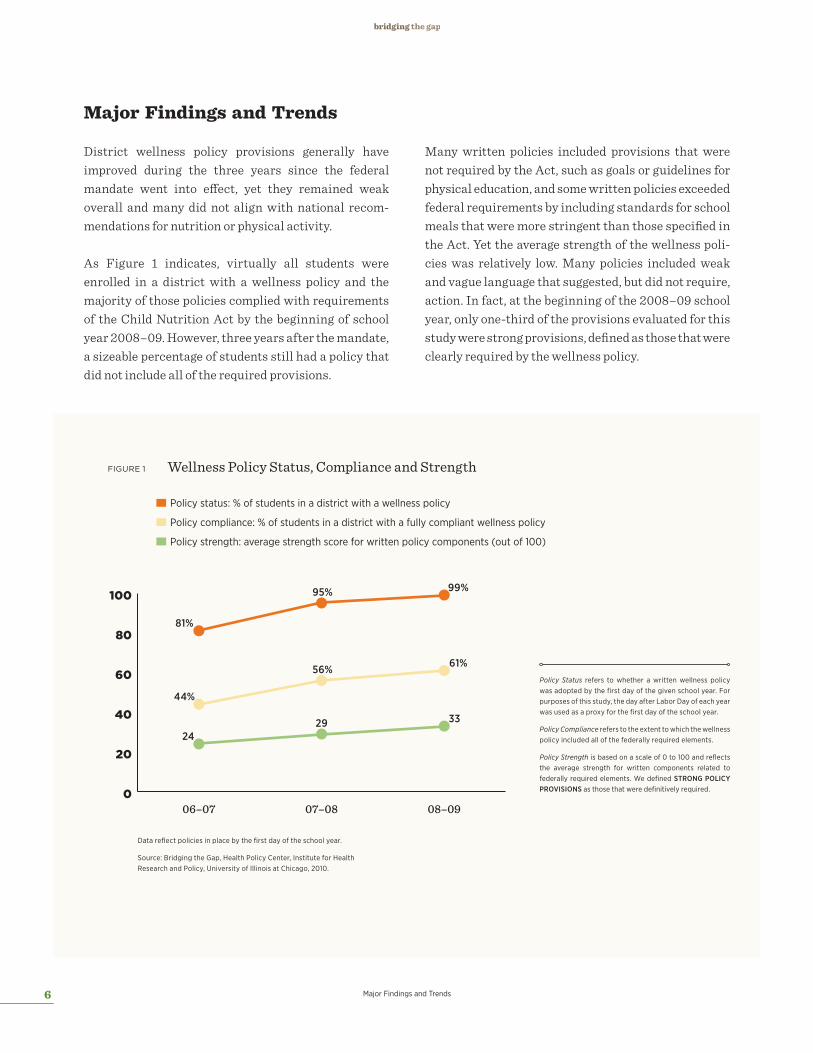
District wellness policy provisions generally have improved during the three years since the federal mandate went into effect, yet they remained weak overall and many did not align with national recom-mendations for nutrition or physical activity.
As Figure 1 indicates, virtually all students were enrolled in a district with a wellness policy and the majority of those policies complied with requirements of the Child Nutrition Act by the beginning of school year 2008–09. However, three years after the mandate, a sizeable percentage of students still had a policy that did not include all of the required provisions.
Many written policies included provisions that were not required by the Act, such as goals or guidelines for physical education, and some written policies exceeded federal requirements by including standards for school meals that were more stringent than those specified in the Act. Yet the average strength of the wellness poli-cies was relatively low. Many policies included weak and vague language that suggested, but did not require, action. In fact, at the beginning of the 2008–09 school year, only one-third of the provisions evaluated for this study were strong provisions, defined as those that were clearly required by the wellness policy.
06–07 07–08 08–09
Policy strength: average strength score for written policy components (out of 100)
Policy compliance: % of students in a district with a fully compliant wellness policy
Policy status: % of students in a district with a wellness policy
81%
44%
24
95%
56%
29
99%
61%
33
FIGURE 1 Wellness Policy Status, Compliance and Strength
0
20
40
60
80
100
Policy Status refers to whether a written wellness policy was adopted by the first day of the given school year. For purposes of this study, the day after Labor Day of each year was used as a proxy for the first day of the school year.
Policy Compliance refers to the extent to which the wellness policy included all of the federally required elements.
Policy Strength is based on a scale of 0 to 100 and reflects the average strength for written components related to federally required elements. We defined STRonG PoLICy PRovISIonS as those that were definitively required.
Data reflect policies in place by the first day of the school year.
Source: Bridging the Gap, Health Policy Center, Institute for Health Research and Policy, University of Illinois at Chicago, 2010.
7www.bridgingthegapresearch.org
06–07 07–08 08–09
Wellness policy
Nutrition education goals
Physical activity goals
School meal guidelines
Implementation plans
Competitive food guidelines
81%
63%
51%
77%74%
73%
99%95%
90%
86%
77%
62%
88%
95%
90%
82%
66%
FIGURE 2 Progress Made by Districts to Adopt Required Wellness Policy Components
0
20
40
60
80
100
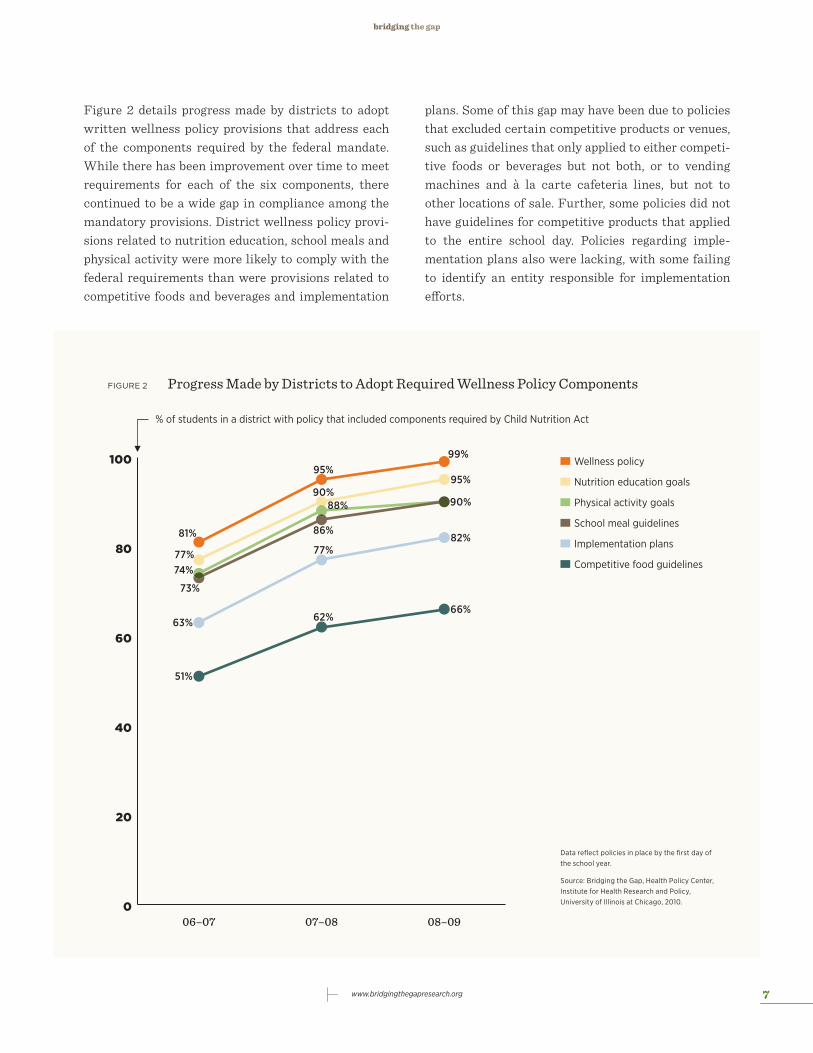
% of students in a district with policy that included components required by Child Nutrition Act
Data reflect policies in place by the first day of the school year.
Source: Bridging the Gap, Health Policy Center, Institute for Health Research and Policy, University of Illinois at Chicago, 2010.
Figure 2 details progress made by districts to adopt written wellness policy provisions that address each of the components required by the federal mandate. While there has been improvement over time to meet requirements for each of the six components, there continued to be a wide gap in compliance among the mandatory provisions. District wellness policy provi-sions related to nutrition education, school meals and physical activity were more likely to comply with the federal requirements than were provisions related to competitive foods and beverages and implementation
plans. Some of this gap may have been due to policies that excluded certain competitive products or venues, such as guidelines that only applied to either competi-tive foods or beverages but not both, or to vending machines and à la carte cafeteria lines, but not to other locations of sale. Further, some policies did not have guidelines for competitive products that applied to the entire school day. Policies regarding imple-mentation plans also were lacking, with some failing to identify an entity responsible for implementation efforts.
8 Major Findings and Trends
The following section describes areas where major progress has been made to strengthen the written well-ness policies as well as areas where improvement is still needed. Methods are described on page 29.
Nutrition
While districts have strengthened provisions for competitive products, school meals and nutrition education since the federal mandate took effect, poli-cies remained weak overall, and many did not align with requirements of the federal mandate or with current nutritional recommendations. Major findings from the 2008–09 school year include:
wellness policies did not address all requirements •included in the federal mandate for competitive foods and beverages, primarily because the policies set guidelines for some, but not all, competitive prod-ucts or venues on campus or because the guidelines applied only to certain times of day. although it was not required by the federal mandate, •many wellness policies reflected some of the 2007 IOM nutritional standards for competitive foods and beverages,20 but no district had a policy that met all of the IOM standards. Provisions regarding the availability of sugar-sweetened beverages, limits on sodium content of snacks and restrictions on items sold in some competitive venues were especially weak.provisions describing nutritional standards for •competitive foods and beverages were markedly stronger in elementary schools than in middle or high schools.few wellness policies prohibited the marketing of •unhealthy foods and beverages at school, which was not surprising given that it was not required by the mandate. progress has been made to strengthen nutritional •guidelines for school meals, but many policies did not require school meals to meet the 2005 Dietary Guidelines,21 which are based on current nutrition science.nutrition education policies tended to be stronger in •districts where state laws and curricula frameworks had stronger requirements for nutrition education.
Physical Activity
Overall, the provisions adopted to boost in-school and after-school levels of physical activity have improved since the Act took effect, yet many policies still did not comply with national recommendations for in-school physical activity levels. Major findings from the 2008–09 school year include:
provisions related to physical activity were weaker •and much less prominent in the written wellness policies than were provisions related to nutrition.most district policies addressed physical education, •although it was not required by the federal mandate. physical education provisions generally were not •aligned with evidence-based guidelines for time spent in physical education or recommendations for engaging students in moderate-to-vigorous physical activity.districts generally have not used the wellness poli-•cies to address community use of school facilities for physical activity (i.e., “joint use”) or safe routes to school, which was likely because the federal mandate did not require districts to address these issues.
Wellness Policy Provisions for Implementation
Written provisions for wellness policy implementa-tion have been strengthened since the federal mandate went into effect, yet they remained weak overall, and evaluation components were especially lacking. Major findings from the 2008–09 school year include:
the vast majority of districts did not identify a source •of funding to support implementation of wellness policy provisions.there was little emphasis on evaluating implementa-•tion efforts or reporting on schools’ compliance with the district wellness policy.there was an increase in the percentage of districts •that required ongoing health advisory councils to be established and responsible for wellness policy over-sight and implementation efforts.
9www.bridgingthegapresearch.org
Summary of Key Findings
Competitive Foods and Beverages
The Child Nutrition and WIC Reauthorization Act of 2004 required wellness policies to include guidelines for competitive foods and beverages. The following key findings and policy opportunities highlight areas where districts’ written policies exceeded federal requirements—by setting more stringent standards or addressing issues that were not required by the mandate—as well as areas where more progress is needed.
For example, the federal mandate did not require districts to align with the 2007 IOM nutritional stan-dards for competitive foods and beverages,22 yet some districts did incorporate various IOM standards into their written policies, and, consequently, exceeded the minimal guidelines required by the Act. Because of this, we expanded our evaluation for the 2008–09 school year to explore alignment between the wellness policies and the 2007 IOM standards for competitive foods and beverages.23 Detailed data on all provisions related to competitive foods and beverages that were examined in the study are available in Tables 1 and 2.
Competitive Food and Beverages: Access and Content Restrictions
Key FindingsBy the beginning of the 2008–09 school year, the majority of students were in a district with a written wellness policy that included nutrition guidelines for competitive foods and beverages, but the scope of the guidelines varied greatly and they were markedly weaker for middle and high schools than they were for elementary schools. For example:
no policies banned competitive foods and beverages •at the middle or high school levels and only 7 percent banned such products at the elementary school level.nutritional content restrictions on vending •machines, à la carte sales in the cafeteria and school
stores were more common than restrictions on in-school fundraisers or, at the elementary school level, classroom parties or the use of food as a reward.
Some districts had wellness policies that incorporated some of the 2007 IOM standards for competitive foods and beverages,24 although none met all of the standards. At the beginning of the 2008–09 school year:
written wellness policy provisions for sugar-sweet-•ened beverages were especially weak compared with IOM standards, and were markedly weaker for middle and high school students compared with elementary school students.
Fewer than 15 percent of middle school students °and only 5 percent of high school students were in a district that either banned competitive beverage sales or banned the sale of regular soda and other sugar-sweetened beverages through vending machines, school stores or à la carte in the cafeteria. More than three-quarters of all high school °students were in a district that did not address many types of sugar-sweetened beverages (excluding regular sodas) in its wellness policy.
limits on sodium also were lacking. •With the exception of students in a district that °banned competitive food sales, no students were in a district with a wellness policy that met the 2007 IOM standard for limiting the sodium content of snacks sold in competitive venues to ≤200 mg per portion.
some wellness policies did include guidelines that •aligned with the 2007 IOM standards for sugar, fat and calorie content; completely banned competitive foods and/or beverages; or prohibited competitive products from being sold in certain venues.few policies limited competitive products to healthy •options.
Only 1 percent of elementary school students and °no middle or high school students were enrolled in a district that suggested or required limiting competitive foods to fruits and vegetables and/or whole grains, as recommended by the IOM in 2007.25
10 Key Findings
Policy opportunitiesUpdate Nutritional Standards for Competitive Foods and Beverages Sold in Schools Nutritional standards for competitive foods and bever-ages are weak and out of date. While some districts have set nutritional standards that align with some of the 2007 IOM standards for competitive foods and beverages, sales of competitive products are largely unregulated in many districts. Congress should give USDA the authority to update national nutrition stan-dards for foods and beverages sold outside of the school meal programs and apply them to the entire campus for the full school day. States and school districts also have the opportunity to update nutrition standards to bring them into greater compliance with the 2007 IOM standards as they review and refine competitive food and beverage policies.
Competitive Foods and Beverages: Vending Contracts and Marketing Practices
Key FindingsBecause the federal mandate did not address vending contracts or marketing practices for foods and bever-ages on campus, it is not surprising that relatively few districts included wellness policy provisions that focused on these issues. At the beginning of the 2008–09 school year:
most district policies did not set strict nutritional •guidelines for future vending contracts.
Only 22 percent of students were enrolled °in a district that required competitive food and/or beverage contracts to comply with the district’s nutrition standards upon renewal or renegotiation.
district policies for marketing of foods and beverages •varied greatly.
About 25 percent of students were enrolled °in a district that discouraged or prohibited marketing of unhealthy foods and beverages in schools. Few students were in a district that required °healthy foods and beverages to be promoted on campus.
Policy opportunitiesEnsure That Competitive Food and/or Beverage Contracts Align with District Nutrition StandardsWhen renewing or renegotiating competitive food and beverage contracts, districts have an opportunity to ensure that their nutrition standards for competi-tive foods and beverages are consistently applied 1) to contracted items and 2) across all grade levels.
Restrict Food Marketing and AdvertisingWellness policies provide a vehicle for addressing marketing practices in schools to ensure promotion of healthy foods and beverages.
School meals
The Child Nutrition and WIC Reauthorization Act of 2004 required wellness policies to include an assurance that school meal nutrition guidelines meet the minimum federal school meal standards. The following key findings and policy opportunities highlight areas where districts’ written policies exceeded federal requirements—by setting more stringent standards or addressing issues that were not required by the mandate—as well as areas where more progress is needed. Detailed data on all provisions related to school meals that were examined in the study are available in Table 1.
Key FindingsWhile the vast majority of students were enrolled in a district that complied with the federal mandate and required school meals to meet the U.S. Department of Agriculture (USDA) standards, these standards are outdated and based on the 1995 Dietary Guidelines for Americans,26 which do not reflect current nutrition science.27 Because many policies were more stringent, we also assessed whether districts: 1) met or exceeded the 2005 Dietary Guidelines,28 which are based on the most current nutrition science; or 2) met the school meal standards recommended in 2009 by the IOM,29 such as increasing the availability of fruits, vegetables or whole grains and limiting milk to 1% or skim options.
11www.bridgingthegapresearch.org
During the first three years of the requirement, nutri-tional guidelines for school meals that were included in the written wellness policies improved, yet they remained relatively weak overall. For example:
slightly more than one-half of students were enrolled •in a district with a wellness policy that required nutritional guidelines for school meals to meet the 2005 Dietary Guidelines, which exceeds standards set by the federal mandate.from the 2006–07 to the 2008–09 school year, the •percentage of students in a district with a wellness policy that required school meals to exceed the 2005 Dietary Guidelines or meet the 2009 IOM stan-dards increased from 10 percent to 20 percent at the elementary school level and from 10 percent to 17 percent at the middle and high school levels.fewer than 15 percent of students were in a district •with a wellness policy that required providing 20 minutes for lunch and 10 minutes for breakfast, which are recommended by the USDA as adequate for meal periods.30
Policy opportunitiesImprove Nutritional Quality of School MealsThe USDA should expeditiously update school meal regulations to be consistent with the 2005 Dietary Guidelines and 2009 IOM nutritional standards for school meals. In addition, school districts should ensure that meals provided are consistent with both the most current Dietary Guidelines and the IOM standards.
Nutrition education
The Child Nutrition and WIC Reauthorization Act of 2004 required wellness policies to include goals for nutrition education. The following key findings and policy opportunities highlight areas where districts’ written policies exceeded federal requirements—by setting more stringent standards or addressing issues that were not required by the mandate—as well as areas where more progress is needed. Detailed data on all provisions related to nutrition education that were examined in the study are available in Table 1.
Key FindingsThree years after the wellness policy requirement went into effect, there was great inconsistency in how the policies addressed goals for nutrition education. At the beginning of the 2008–09 school year:
nearly one-half of students were enrolled in a district •with a wellness policy that only suggested a nutrition education curriculum or did not indicate whether nutrition education was a component of the school health education curriculum.nearly one-half of students were enrolled in a district •with a wellness policy that did not address inte-grating nutrition education into core subjects. provisions for teaching behavior-focused nutrition •skills, such as understanding food labels and caloric balance, were more suggestive than prescriptive.
More than three-quarters of students were °enrolled in a district with a wellness policy that addressed teaching behavior-focused nutrition skills, yet about one-third of those students had a wellness policy that encouraged but did not require this.
the vast majority of students were in a district with a •wellness policy that did not require nutrition-related training for teachers or for food service staff.
Policy opportunitiesEnsure That Nutrition Education and Promotion are Core Components of a Comprehensive Health Education ProgramThe health education curricula for all students should include nutrition-specific elements that focus on teaching lifelong behavior-focused nutrition skills. School districts also should adopt a comprehensive nutrition education and promotion initiative as part of the health education curricula that reaches students in the classroom, the cafeteria and throughout the school.
Provide Training and Support for Food Service Staff Districts should ensure that food service staff receive proper training and technical assistance on meal prep-aration and other nutrition-related issues.
12 Key Findings
Physical Activity and Physical education
The Child Nutrition and WIC Reauthorization Act of 2004 required wellness policies to include goals for physical activity. The following key findings and policy opportunities highlight areas where districts’ written policies exceeded federal requirements by setting more stringent standards or by addressing issues that were not required by the mandate, such as physical educa-tion, joint use or safe routes to school. Areas where more progress is needed also are described. Detailed data on all provisions related to physical activity and physical education that were examined in the study are available in Table 1.
Key FindingsWhile most students were in a district with a written wellness policy that included goals for physical activity, the strength of the provisions related to physical activity varied greatly. For example, three years after the wellness policy requirement took effect:
the majority of students were enrolled in a district •with a wellness policy that neither required physical activity opportunities outside of physical education nor required breaks throughout the school day, and only 20 percent of elementary school students were enrolled in a district that required daily recess.fewer than 15 percent of all students were in a district •with a wellness policy that required making school facilities available for community use (“joint use”) and fewer than 10 percent were in a district that required safe routes to school. most districts went beyond the requirements of the •federal mandate to address physical education in their wellness policies, but very few met national standards for quality physical education programs as recommended by the National Alliance for Sport & Physical Education (NASPE) or the U.S. Department of Health and Human Services (USDHHS).
Fewer than 10 percent of students were enrolled °in a district with a wellness policy that met the
USDHHS Healthy People 2010 recommenda-tions for time devoted to moderate-to-vigorous physical activity (i.e., devoting at least 50% of physical education time to moderate-to-vigorous physical activity).31 Only 6 percent of elementary school students °and 2 percent of middle and high school students were in a district with a wellness policy that met NASPE recommendations for physical educa-tion (i.e., 150 minutes per week at the elementary school level and 225 minutes per week at the middle and high school levels).32
Evidence from two major studies indicates that °the quantity and quality of physical education improves when classes were taught by certified physical education specialists or by classroom teachers trained in physical education.33–35 Yet, the vast majority of students were enrolled in a district with a wellness policy that neither required physical education to be taught by a state-authorized physical educator nor required formal, physical education training to be pro-vided for persons teaching physical education.
Policy opportunitiesContinue to Strengthen In-School Physical Activity ProvisionsDistricts should include additional strategies in their wellness policies to increase time spent in moderate-to-vigorous physical activity during the school day, either in physical education classes or in recess or brief physical activity breaks. Such changes could help more children meet the USDHHS recommendation for at least 60 minutes of daily physical activity.36
Expand Policies to Address Physical EducationCongress, states and school districts should encourage and support efforts to ensure that active physical education remains a priority, and to establish specific goals that are more closely aligned with evidence-based guidelines, such as the minimum amount of physical education time during which students are engaged in moderate-to-vigorous physical activity.
13www.bridgingthegapresearch.org
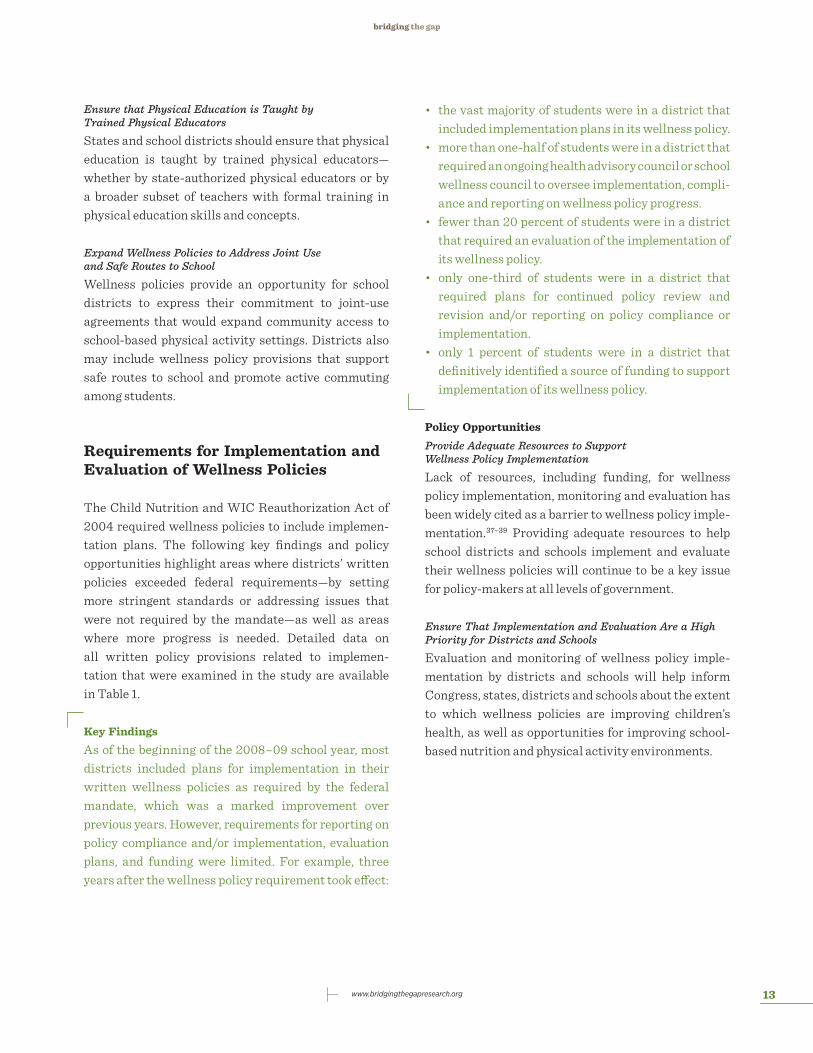
Ensure that Physical Education is Taught by Trained Physical EducatorsStates and school districts should ensure that physical education is taught by trained physical educators—whether by state-authorized physical educators or by a broader subset of teachers with formal training in physical education skills and concepts.
Expand Wellness Policies to Address Joint Use and Safe Routes to SchoolWellness policies provide an opportunity for school districts to express their commitment to joint-use agreements that would expand community access to school-based physical activity settings. Districts also may include wellness policy provisions that support safe routes to school and promote active commuting among students.
Requirements for Implementation and evaluation of Wellness Policies
The Child Nutrition and WIC Reauthorization Act of 2004 required wellness policies to include implemen-tation plans. The following key findings and policy opportunities highlight areas where districts’ written policies exceeded federal requirements—by setting more stringent standards or addressing issues that were not required by the mandate—as well as areas where more progress is needed. Detailed data on all written policy provisions related to implemen- tation that were examined in the study are available in Table 1.
Key FindingsAs of the beginning of the 2008–09 school year, most districts included plans for implementation in their written wellness policies as required by the federal mandate, which was a marked improvement over previous years. However, requirements for reporting on policy compliance and/or implementation, evaluation plans, and funding were limited. For example, three years after the wellness policy requirement took effect:
the vast majority of students were in a district that •included implementation plans in its wellness policy.more than one-half of students were in a district that •required an ongoing health advisory council or school wellness council to oversee implementation, compli-ance and reporting on wellness policy progress.fewer than 20 percent of students were in a district •that required an evaluation of the implementation of its wellness policy. only one-third of students were in a district that •required plans for continued policy review and revision and/or reporting on policy compliance or implementation. only 1 percent of students were in a district that •definitively identified a source of funding to support implementation of its wellness policy.
Policy opportunitiesProvide Adequate Resources to Support Wellness Policy ImplementationLack of resources, including funding, for wellness policy implementation, monitoring and evaluation has been widely cited as a barrier to wellness policy imple-mentation.37–39 Providing adequate resources to help school districts and schools implement and evaluate their wellness policies will continue to be a key issue for policy-makers at all levels of government.
Ensure That Implementation and Evaluation Are a High Priority for Districts and SchoolsEvaluation and monitoring of wellness policy imple-mentation by districts and schools will help inform Congress, states, districts and schools about the extent to which wellness policies are improving children’s health, as well as opportunities for improving school-based nutrition and physical activity environments.
14 Next Steps
Next Steps
The Bridging the Gap team has been collecting nation-ally representative data on written district policies and on school practices in elementary, middle and high schools on an annual basis since the 2006–07 school year, which was the first year of the federal wellness policy mandate. Future district-level studies will examine changes to written policies that result from reauthorizations of federal child nutrition programs and the Elementary and Secondary Education Act. Data from future reports also will highlight progress and innovations at the state and district levels; identify opportunities for making wellness policy provisions stronger and more effective; and help document how districts address recommendations of the White House Task Force on Childhood Obesity.40
Companion studies examine school-level implementa-tion of the wellness policies, as well as other practices and school environments related to student health in U.S. elementary, middle and high schools. Future Bridging the Gap studies will examine the effects of district wellness policies and environments, and related community policies and environments, on secondary school students’ self-reported diet, physical activity levels and body mass index. This research is critical for assessing the nation’s progress in creating healthier school environments to help reverse the childhood obesity epidemic. More information about these studies and the companion reports are available at www.bridgingthegapresearch.org.
15www.bridgingthegapresearch.org
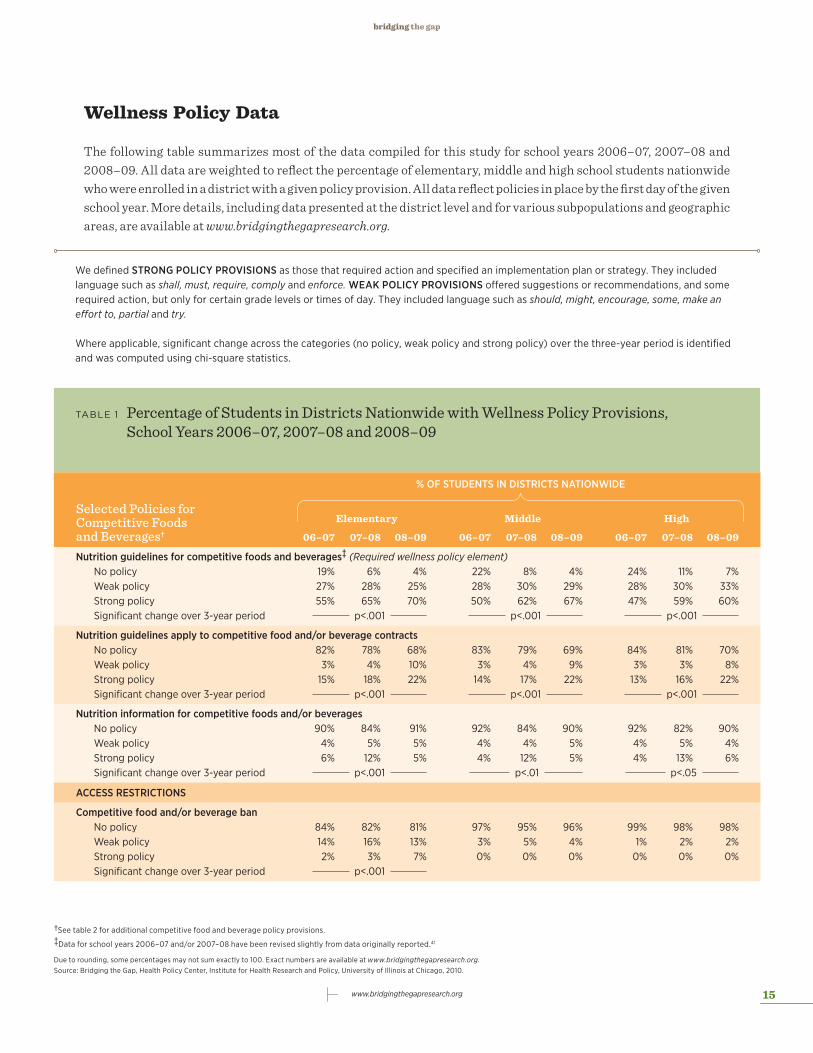
We defined STRonG PoLICy PRovISIonS as those that required action and specified an implementation plan or strategy. They included language such as shall, must, require, comply and enforce. WEak PoLICy PRovISIonS offered suggestions or recommendations, and some required action, but only for certain grade levels or times of day. They included language such as should, might, encourage, some, make an effort to, partial and try.
Where applicable, significant change across the categories (no policy, weak policy and strong policy) over the three-year period is identified and was computed using chi-square statistics.
†See table 2 for additional competitive food and beverage policy provisions.
‡Data for school years 2006–07 and/or 2007–08 have been revised slightly from data originally reported.41
Due to rounding, some percentages may not sum exactly to 100. Exact numbers are available at www.bridgingthegapresearch.org. Source: Bridging the Gap, Health Policy Center, Institute for Health Research and Policy, University of Illinois at Chicago, 2010.
Wellness Policy Data
The following table summarizes most of the data compiled for this study for school years 2006–07, 2007–08 and 2008–09. All data are weighted to reflect the percentage of elementary, middle and high school students nationwide who were enrolled in a district with a given policy provision. All data reflect policies in place by the first day of the given school year. More details, including data presented at the district level and for various subpopulations and geographic areas, are available at www.bridgingthegapresearch.org.
table 1 Percentage of Students in Districts Nationwide with Wellness Policy Provisions, School Years 2006–07, 2007–08 and 2008–09
Selected Policies for Competitive Foods and Beverages†
% oF STUDEnTS In DISTRICTS naTIonWIDE
elementary middle High
06–07 07–08 08–09 06–07 07–08 08–09 06–07 07–08 08–09
nutrition guidelines for competitive foods and beverages‡ (Required wellness policy element)No policy 19% 6% 4% 22% 8% 4% 24% 11% 7%Weak policy 27% 28% 25% 28% 30% 29% 28% 30% 33%Strong policy 55% 65% 70% 50% 62% 67% 47% 59% 60%Significant change over 3-year period p<.001 p<.001 p<.001
nutrition guidelines apply to competitive food and/or beverage contractsNo policy 82% 78% 68% 83% 79% 69% 84% 81% 70%Weak policy 3% 4% 10% 3% 4% 9% 3% 3% 8%Strong policy 15% 18% 22% 14% 17% 22% 13% 16% 22%Significant change over 3-year period p<.001 p<.001 p<.001
nutrition information for competitive foods and/or beveragesNo policy 90% 84% 91% 92% 84% 90% 92% 82% 90%Weak policy 4% 5% 5% 4% 4% 5% 4% 5% 4%Strong policy 6% 12% 5% 4% 12% 5% 4% 13% 6%Significant change over 3-year period p<.001 p<.01 p<.05
aCCESS RESTRICTIonS
Competitive food and/or beverage banNo policy 84% 82% 81% 97% 95% 96% 99% 98% 98%Weak policy 14% 16% 13% 3% 5% 4% 1% 2% 2%Strong policy 2% 3% 7% 0% 0% 0% 0% 0% 0%Significant change over 3-year period p<.001

16 Wellness Policy Data
Selected Policies for Competitive Foods and Beverages† (continued)
% oF STUDEnTS In DISTRICTS naTIonWIDE
elementary middle High
06–07 07–08 08–09 06–07 07–08 08–09 06–07 07–08 08–09
aCCESS RESTRICTIonS (continued)
vending machine restrictions during the school day‡No policy 30% 17% 11% 34% 19% 12% 36% 22% 16%Weak policy 32% 34% 32% 50% 52% 50% 52% 55% 63%Strong policy 39% 50% 56% 16% 29% 38% 12% 23% 21%Significant change over 3-year period p<.001 p<.001 p<.001
À la carte restrictions during meal times‡No policy 31% 19% 11% 35% 21% 11% 37% 24% 16%Weak policy 43% 45% 41% 51% 51% 50% 52% 54% 60%Strong policy 26% 36% 48% 14% 28% 39% 11% 22% 25%Significant change over 3-year period p<.001 p<.001 p<.001
School store restrictions during the school dayNo policy 37% 25% 21% 41% 28% 23% 43% 30% 26%Weak policy 31% 32% 31% 46% 46% 45% 47% 49% 56%Strong policy 32% 42% 47% 14% 26% 33% 10% 21% 18%Significant change over 3-year period p<.001 p<.001 p<.001
Fundraisers during the school day (comparable data not available for SY 2006–07 and 2007–08)No policy N/A N/A 27% N/A N/A 27% N/A N/A 31%Weak policy 37% 48% 56%Strong policy 36% 24% 14%
Policies governing classroom parties at the elementary school levelNo policy 46% 35% 33% N/A N/A N/A N/A N/A N/AWeak policy 53% 59% 65%Strong policy 1% 6% 2%Significant change over 3-year period p<.001
Policies governing food as a reward at the elementary school levelNo policy 68% 64% 61% N/A N/A N/A N/A N/A N/AWeak policy 23% 28% 29%Strong policy 9% 8% 11%Significant change over 3-year period p<.05
Policies governing evening and/or community eventsNo policy 84% 83% 84% 86% 84% 85% 87% 85% 84%Weak policy 15% 16% 16% 14% 15% 15% 12% 14% 15%Strong policy 1% 1% 0% 1% 1% 0% 1% 1% 0%
availability of free drinking water throughout the school day‡No policy 88% 87% 87% 89% 88% 88% 89% 89% 87%Weak policy 3% 4% 4% 3% 4% 4% 3% 4% 4%Strong policy 9% 9% 9% 8% 8% 9% 8% 8% 9%
†See table 2 for additional competitive food and beverage policy provisions.
‡Data for school years 2006–07 and/or 2007–08 have been revised slightly from data originally reported.41
Due to rounding, some percentages may not sum exactly to 100. Exact numbers are available at www.bridgingthegapresearch.org. Source: Bridging the Gap, Health Policy Center, Institute for Health Research and Policy, University of Illinois at Chicago, 2010.
table 1 , continued

17www.bridgingthegapresearch.org
Selected Policies for Competitive Foods and Beverages† (continued)
% oF STUDEnTS In DISTRICTS naTIonWIDE
elementary middle High
06–07 07–08 08–09 06–07 07–08 08–09 06–07 07–08 08–09
aDvERTISInG anD MaRkETInG oF FooDS anD BEvERaGES In SCHooLS
Promotion of healthy foods and beverages‡No policy 78% 76% 71% 78% 77% 70% 78% 77% 69%Weak policy 17% 19% 22% 16% 18% 23% 16% 18% 24%Strong policy 6% 5% 7% 6% 5% 7% 6% 5% 7%Significant change over 3-year period p<.05 p<.01 p<.01
Restrictions on marketing of unhealthy foods and beveragesNo policy 81% 75% 75% 83% 75% 75% 84% 73% 78%Weak policy 8% 9% 10% 8% 8% 10% 9% 10% 9%Strong policy 10% 16% 15% 10% 17% 15% 7% 17% 13%Significant change over 3-year period p<.05
Policies Governing School Meals
% oF STUDEnTS In DISTRICTS naTIonWIDE
elementary middle High
06–07 07–08 08–09 06–07 07–08 08–09 06–07 07–08 08–09
School meal nutrition guidelines must meet the federal school meal requirements (Required wellness policy element)No policy 24% 11% 9% 27% 12% 8% 28% 14% 9%Weak policy 2% 2% 1% 2% 2% 1% 1% 2% 2%Strong policy 75% 87% 90% 72% 86% 90% 71% 84% 90%Significant change over 3-year period p<.001 p<.001 p<.001
nutrition guidelines for school meals that met or exceeded the 2005 Dietary GuidelinesNo policy 57% 47% 46% 60% 48% 48% 59% 47% 48%Weak policy 32% 35% 34% 30% 33% 35% 31% 33% 35%Strong policy 10% 18% 20% 10% 19% 17% 10% 20% 17%Significant change over 3-year period p<.001 p<.01 p<.05
adequate time to eat meals (at least 20 minutes for lunch; at least 10 minutes for breakfast)No policy 49% 37% 34% 51% 38% 35% 52% 39% 36%Weak policy 41% 51% 53% 40% 52% 53% 39% 52% 51%Strong policy 10% 11% 13% 9% 9% 12% 9% 9% 13%Significant change over 3-year period p<.001 p<.001 p<.001
nutrition information for school mealsNo policy 80% 72% 72% 81% 72% 72% 82% 72% 72%Weak policy 8% 9% 13% 8% 9% 13% 7% 8% 12%Strong policy 12% 19% 15% 11% 19% 15% 11% 20% 15%Significant change over 3-year period p<.001 p<.05 p<.05
School Breakfast ProgramNo policy 39% 28% 27% 42% 29% 27% 44% 31% 28%Weak policy 18% 19% 17% 17% 18% 17% 16% 16% 17%Strong policy 43% 53% 57% 40% 53% 57% 40% 52% 55%Significant change over 3-year period p<.001 p<.001 p<.001
table 1 , continued
†See table 2 for additional competitive food and beverage policy provisions.
‡Data for school years 2006–07 and/or 2007–08 have been revised slightly from data originally reported.41
Due to rounding, some percentages may not sum exactly to 100. Exact numbers are available at www.bridgingthegapresearch.org. Source: Bridging the Gap, Health Policy Center, Institute for Health Research and Policy, University of Illinois at Chicago, 2010.

18 Wellness Policy Data
Policies Governing School Meals (continued)
% oF STUDEnTS In DISTRICTS naTIonWIDE
elementary middle High
06–07 07–08 08–09 06–07 07–08 08–09 06–07 07–08 08–09
Farm-to-school and/or farm-to-cafeteria programNo policy 94% 92% 91% 94% 92% 91% 95% 93% 91%Weak policy 6% 7% 8% 5% 7% 8% 5% 6% 8%Strong policy 1% 1% 1% 1% 1% 0% 1% 1% 1%Significant change over 3-year period p<.05
nutrition-related training for food service staffNo policy 76% 67% 63% 77% 65% 63% 76% 64% 64%Weak policy 18% 22% 27% 18% 21% 28% 18% 20% 28%Strong policy 6% 12% 9% 5% 13% 9% 6% 16% 8%Significant change over 3-year period p<.001 p<.01 p<.01
Recess before lunch for elementary school students (added in SY 2008–09)No policy N/A N/A 77% N/A N/A N/A N/A N/A N/AWeak policy 19%Strong policy 3%
Policies Governing Nutrition Education
% oF STUDEnTS In DISTRICTS naTIonWIDE
elementary middle High
06–07 07–08 08–09 06–07 07–08 08–09 06–07 07–08 08–09
nutrition education goals (Required wellness policy element)No policy 19% 6% 2% 22% 7% 2% 22% 9% 3%Weak policy 2% 2% 2% 2% 3% 2% 2% 2% 2%Strong policy 79% 92% 95% 76% 90% 95% 76% 89% 95%Significant change over 3-year period p<.001 p<.001 p<.001
nutrition education curriculum for all grades‡No policy 35% 28% 20% 37% 32% 20% 38% 34% 22%Weak policy 31% 34% 39% 30% 33% 39% 31% 32% 41%Strong policy 35% 38% 41% 33% 36% 42% 32% 34% 38%Significant change over 3-year period p<.001 p<.001 p<.001
nutrition education integrated into other subjectsNo policy 54% 50% 46% 56% 52% 46% 58% 53% 47%Weak policy 19% 22% 20% 18% 21% 20% 17% 20% 20%Strong policy 27% 28% 34% 26% 27% 34% 25% 27% 33%Significant change over 3-year period p<.01 p<.01 p<.05
nutrition education teaches behavior-focused skillsNo policy 34% 23% 18% 36% 24% 17% 37% 24% 17%Weak policy 22% 30% 25% 21% 31% 25% 20% 31% 27%Strong policy 44% 47% 57% 43% 45% 57% 42% 45% 56%Significant change over 3-year period p<.001 p<.001 p<.001
School gardens (added in SY 2008–09)No policy N/A N/A 88% N/A N/A 88% N/A N/A 88%Weak policy 12% 12% 12%Strong policy 0% 0% 0%
table 1 , continued
‡Data for school years 2006–07 and/or 2007–08 have been revised slightly from data originally reported.41
Due to rounding, some percentages may not sum exactly to 100. Exact numbers are available at www.bridgingthegapresearch.org. Source: Bridging the Gap, Health Policy Center, Institute for Health Research and Policy, University of Illinois at Chicago, 2010.
19www.bridgingthegapresearch.org
Policies Governing Nutrition Education (continued)
% oF STUDEnTS In DISTRICTS naTIonWIDE
elementary middle High
06–07 07–08 08–09 06–07 07–08 08–09 06–07 07–08 08–09
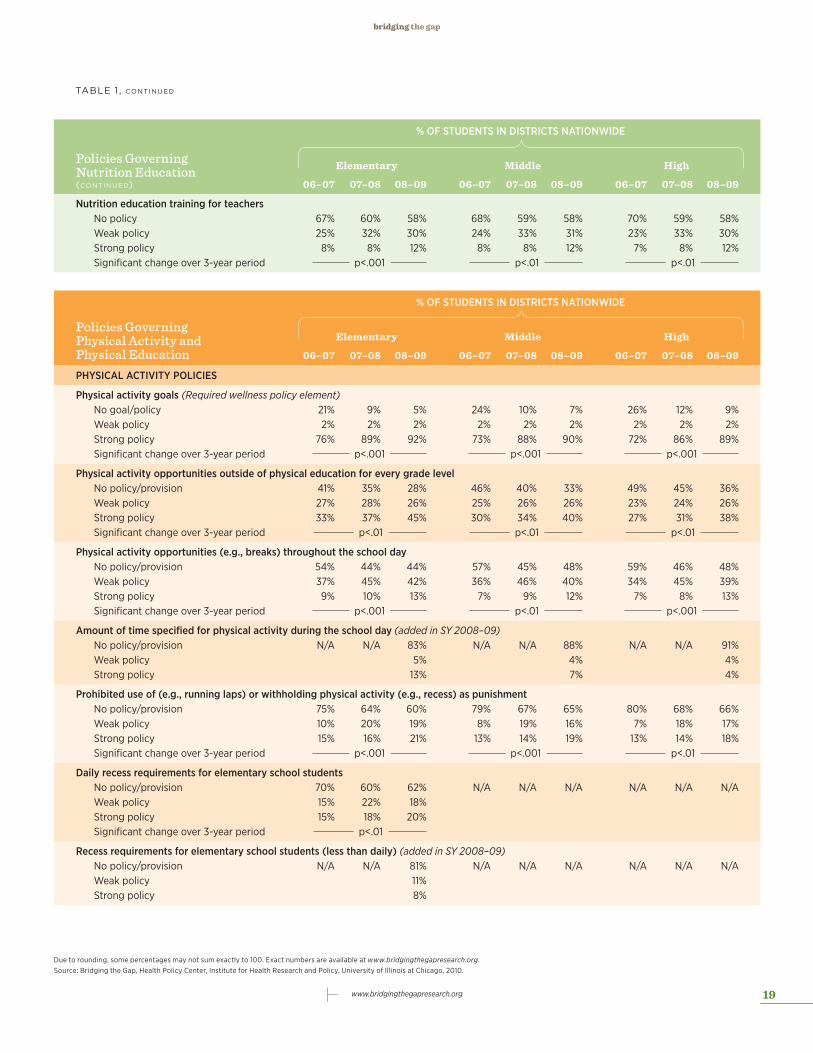
nutrition education training for teachersNo policy 67% 60% 58% 68% 59% 58% 70% 59% 58%Weak policy 25% 32% 30% 24% 33% 31% 23% 33% 30%Strong policy 8% 8% 12% 8% 8% 12% 7% 8% 12%Significant change over 3-year period p<.001 p<.01 p<.01
Policies Governing Physical Activity and Physical Education
% oF STUDEnTS In DISTRICTS naTIonWIDE
elementary middle High
06–07 07–08 08–09 06–07 07–08 08–09 06–07 07–08 08–09
PHySICaL aCTIvITy PoLICIES
Physical activity goals (Required wellness policy element)No goal/policy 21% 9% 5% 24% 10% 7% 26% 12% 9%Weak policy 2% 2% 2% 2% 2% 2% 2% 2% 2%Strong policy 76% 89% 92% 73% 88% 90% 72% 86% 89%Significant change over 3-year period p<.001 p<.001 p<.001
Physical activity opportunities outside of physical education for every grade levelNo policy/provision 41% 35% 28% 46% 40% 33% 49% 45% 36%Weak policy 27% 28% 26% 25% 26% 26% 23% 24% 26%Strong policy 33% 37% 45% 30% 34% 40% 27% 31% 38%Significant change over 3-year period p<.01 p<.01 p<.01
Physical activity opportunities (e.g., breaks) throughout the school dayNo policy/provision 54% 44% 44% 57% 45% 48% 59% 46% 48%Weak policy 37% 45% 42% 36% 46% 40% 34% 45% 39%Strong policy 9% 10% 13% 7% 9% 12% 7% 8% 13%Significant change over 3-year period p<.001 p<.01 p<.001
amount of time specified for physical activity during the school day (added in SY 2008–09)No policy/provision N/A N/A 83% N/A N/A 88% N/A N/A 91%Weak policy 5% 4% 4%Strong policy 13% 7% 4%
Prohibited use of (e.g., running laps) or withholding physical activity (e.g., recess) as punishmentNo policy/provision 75% 64% 60% 79% 67% 65% 80% 68% 66%Weak policy 10% 20% 19% 8% 19% 16% 7% 18% 17%Strong policy 15% 16% 21% 13% 14% 19% 13% 14% 18%Significant change over 3-year period p<.001 p<.001 p<.01
Daily recess requirements for elementary school studentsNo policy/provision 70% 60% 62% N/A N/A N/A N/A N/A N/AWeak policy 15% 22% 18%Strong policy 15% 18% 20%Significant change over 3-year period p<.01
Recess requirements for elementary school students (less than daily) (added in SY 2008–09)No policy/provision N/A N/A 81% N/A N/A N/A N/A N/A N/AWeak policy 11%Strong policy 8%
table 1 , continued
Due to rounding, some percentages may not sum exactly to 100. Exact numbers are available at www.bridgingthegapresearch.org. Source: Bridging the Gap, Health Policy Center, Institute for Health Research and Policy, University of Illinois at Chicago, 2010.
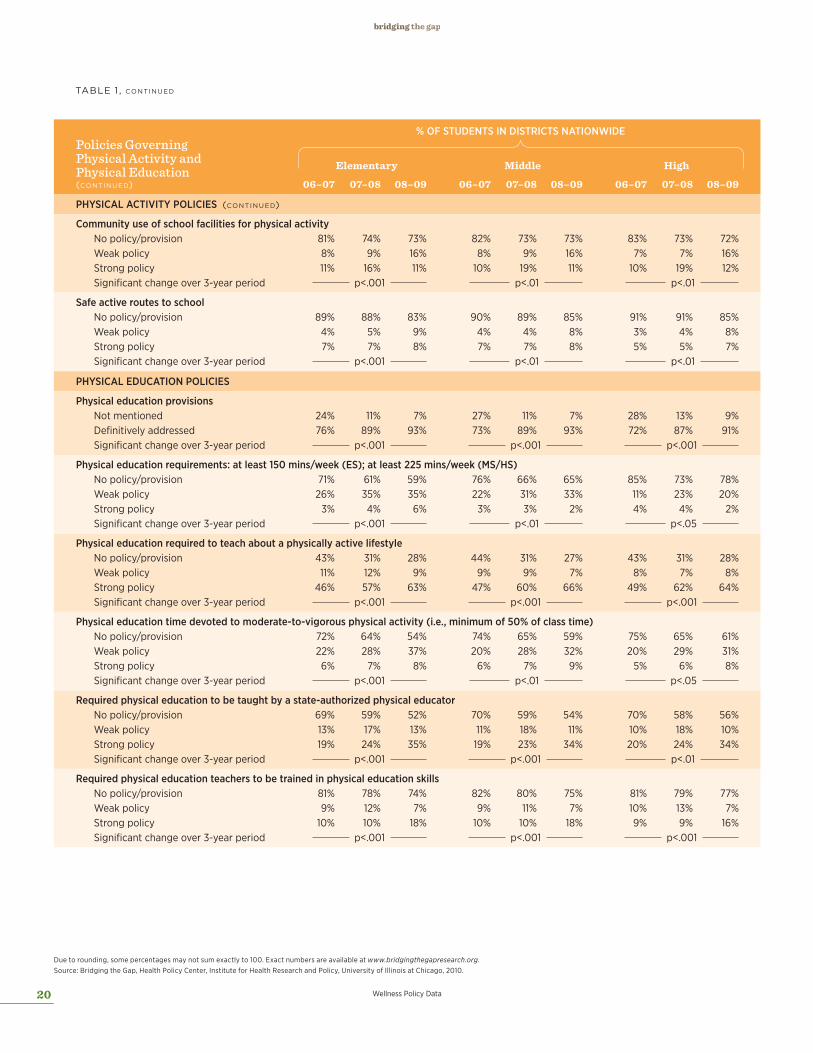
20 Wellness Policy Data
Policies Governing Physical Activity and Physical Education (continued)
% oF STUDEnTS In DISTRICTS naTIonWIDE
elementary middle High
06–07 07–08 08–09 06–07 07–08 08–09 06–07 07–08 08–09
PHySICaL aCTIvITy PoLICIES (continued)
Community use of school facilities for physical activityNo policy/provision 81% 74% 73% 82% 73% 73% 83% 73% 72%Weak policy 8% 9% 16% 8% 9% 16% 7% 7% 16%Strong policy 11% 16% 11% 10% 19% 11% 10% 19% 12%Significant change over 3-year period p<.001 p<.01 p<.01
Safe active routes to schoolNo policy/provision 89% 88% 83% 90% 89% 85% 91% 91% 85%Weak policy 4% 5% 9% 4% 4% 8% 3% 4% 8%Strong policy 7% 7% 8% 7% 7% 8% 5% 5% 7%Significant change over 3-year period p<.001 p<.01 p<.01
PHySICaL EDUCaTIon PoLICIES
Physical education provisionsNot mentioned 24% 11% 7% 27% 11% 7% 28% 13% 9%Definitively addressed 76% 89% 93% 73% 89% 93% 72% 87% 91%Significant change over 3-year period p<.001 p<.001 p<.001
Physical education requirements: at least 150 mins/week (ES); at least 225 mins/week (MS/HS)No policy/provision 71% 61% 59% 76% 66% 65% 85% 73% 78%Weak policy 26% 35% 35% 22% 31% 33% 11% 23% 20%Strong policy 3% 4% 6% 3% 3% 2% 4% 4% 2%Significant change over 3-year period p<.001 p<.01 p<.05
Physical education required to teach about a physically active lifestyleNo policy/provision 43% 31% 28% 44% 31% 27% 43% 31% 28%Weak policy 11% 12% 9% 9% 9% 7% 8% 7% 8%Strong policy 46% 57% 63% 47% 60% 66% 49% 62% 64%Significant change over 3-year period p<.001 p<.001 p<.001
Physical education time devoted to moderate-to-vigorous physical activity (i.e., minimum of 50% of class time)No policy/provision 72% 64% 54% 74% 65% 59% 75% 65% 61%Weak policy 22% 28% 37% 20% 28% 32% 20% 29% 31%Strong policy 6% 7% 8% 6% 7% 9% 5% 6% 8%Significant change over 3-year period p<.001 p<.01 p<.05
Required physical education to be taught by a state-authorized physical educatorNo policy/provision 69% 59% 52% 70% 59% 54% 70% 58% 56%Weak policy 13% 17% 13% 11% 18% 11% 10% 18% 10%Strong policy 19% 24% 35% 19% 23% 34% 20% 24% 34%Significant change over 3-year period p<.001 p<.001 p<.01
Required physical education teachers to be trained in physical education skillsNo policy/provision 81% 78% 74% 82% 80% 75% 81% 79% 77%Weak policy 9% 12% 7% 9% 11% 7% 10% 13% 7%Strong policy 10% 10% 18% 10% 10% 18% 9% 9% 16%Significant change over 3-year period p<.001 p<.001 p<.001
table 1 , continued
Due to rounding, some percentages may not sum exactly to 100. Exact numbers are available at www.bridgingthegapresearch.org. Source: Bridging the Gap, Health Policy Center, Institute for Health Research and Policy, University of Illinois at Chicago, 2010.
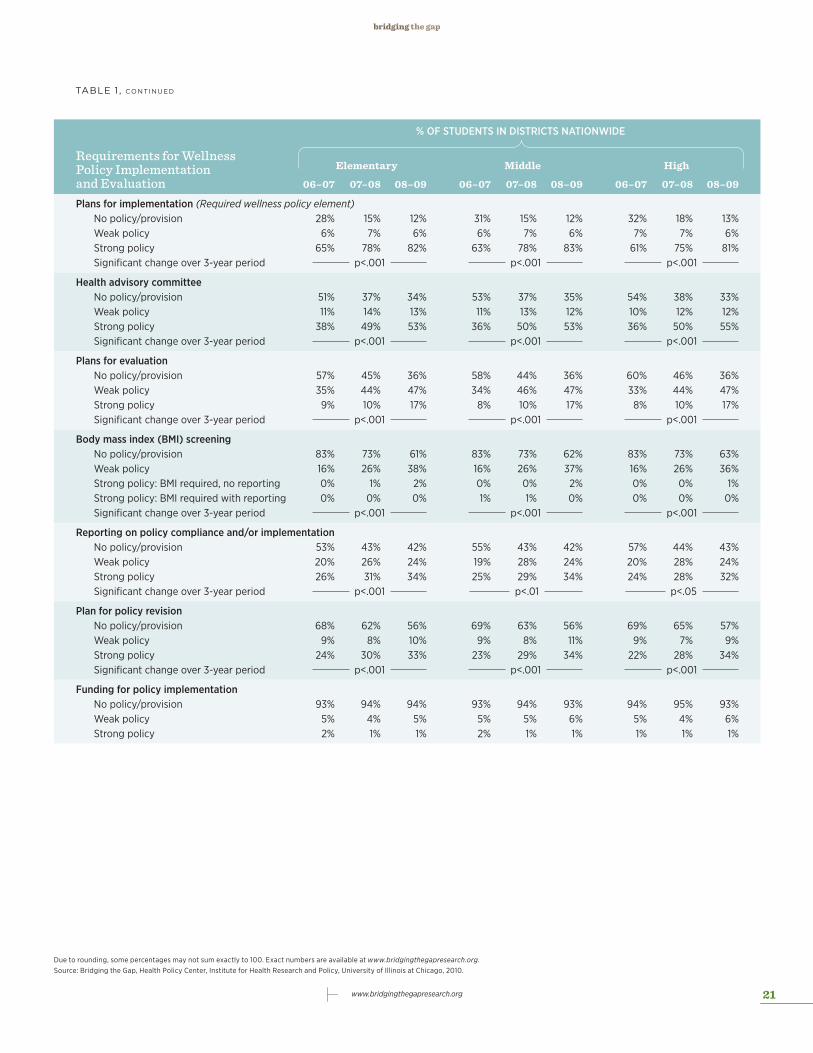
21www.bridgingthegapresearch.org
Requirements for Wellness Policy Implementation and Evaluation
% oF STUDEnTS In DISTRICTS naTIonWIDE
elementary middle High
06–07 07–08 08–09 06–07 07–08 08–09 06–07 07–08 08–09
Plans for implementation (Required wellness policy element)No policy/provision 28% 15% 12% 31% 15% 12% 32% 18% 13%Weak policy 6% 7% 6% 6% 7% 6% 7% 7% 6%Strong policy 65% 78% 82% 63% 78% 83% 61% 75% 81%Significant change over 3-year period p<.001 p<.001 p<.001
Health advisory committeeNo policy/provision 51% 37% 34% 53% 37% 35% 54% 38% 33%Weak policy 11% 14% 13% 11% 13% 12% 10% 12% 12%Strong policy 38% 49% 53% 36% 50% 53% 36% 50% 55%Significant change over 3-year period p<.001 p<.001 p<.001
Plans for evaluationNo policy/provision 57% 45% 36% 58% 44% 36% 60% 46% 36%Weak policy 35% 44% 47% 34% 46% 47% 33% 44% 47%Strong policy 9% 10% 17% 8% 10% 17% 8% 10% 17%Significant change over 3-year period p<.001 p<.001 p<.001
Body mass index (BMI) screeningNo policy/provision 83% 73% 61% 83% 73% 62% 83% 73% 63%Weak policy 16% 26% 38% 16% 26% 37% 16% 26% 36%Strong policy: BMI required, no reporting 0% 1% 2% 0% 0% 2% 0% 0% 1%Strong policy: BMI required with reporting 0% 0% 0% 1% 1% 0% 0% 0% 0%Significant change over 3-year period p<.001 p<.001 p<.001
Reporting on policy compliance and/or implementationNo policy/provision 53% 43% 42% 55% 43% 42% 57% 44% 43%Weak policy 20% 26% 24% 19% 28% 24% 20% 28% 24%Strong policy 26% 31% 34% 25% 29% 34% 24% 28% 32%Significant change over 3-year period p<.001 p<.01 p<.05
Plan for policy revisionNo policy/provision 68% 62% 56% 69% 63% 56% 69% 65% 57%Weak policy 9% 8% 10% 9% 8% 11% 9% 7% 9%Strong policy 24% 30% 33% 23% 29% 34% 22% 28% 34%Significant change over 3-year period p<.001 p<.001 p<.001
Funding for policy implementationNo policy/provision 93% 94% 94% 93% 94% 93% 94% 95% 93%Weak policy 5% 4% 5% 5% 5% 6% 5% 4% 6%Strong policy 2% 1% 1% 2% 1% 1% 1% 1% 1%
table 1 , continued
Due to rounding, some percentages may not sum exactly to 100. Exact numbers are available at www.bridgingthegapresearch.org. Source: Bridging the Gap, Health Policy Center, Institute for Health Research and Policy, University of Illinois at Chicago, 2010.
22 Competitive Food and Beverage Content Restriction Data
* “Any Location” means the extent to which the policy provisions apply to at least one of the competitive food/beverage locations examined for this study: vending machines, school stores, à la carte, class parties, fundraisers, and/or evening/community events.
Due to rounding, some percentages may not sum to exactly 100. Exact numbers are available at www.bridgingthegapresearch.org. Source: Bridging the Gap, Health Policy Center, Institute for Health Research and Policy, University of Illinois at Chicago, 2010
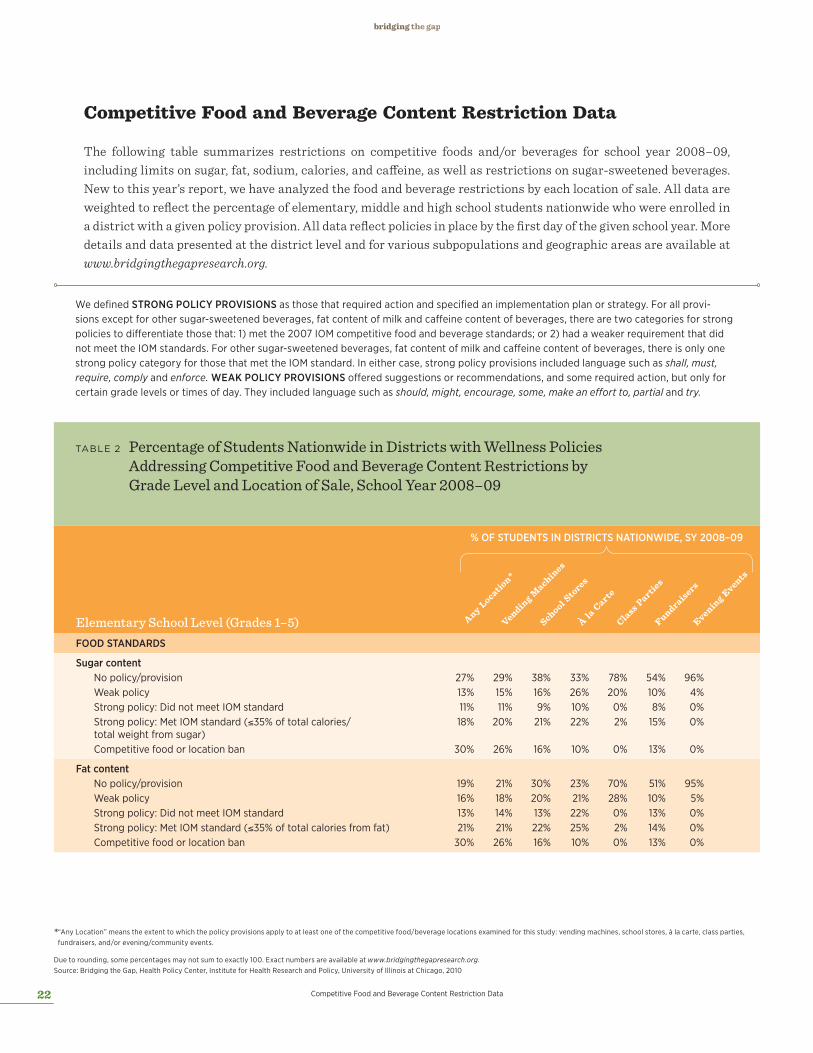
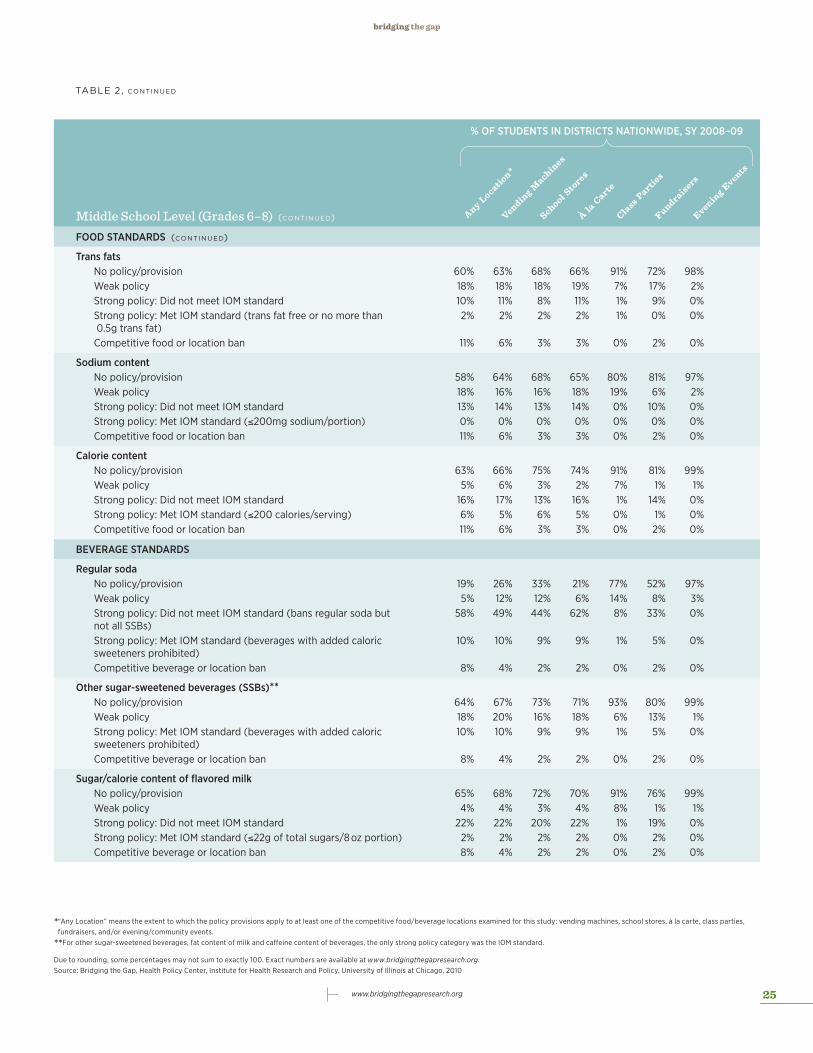
We defined STRonG PoLICy PRovISIonS as those that required action and specified an implementation plan or strategy. For all provi-sions except for other sugar-sweetened beverages, fat content of milk and caffeine content of beverages, there are two categories for strong policies to differentiate those that: 1) met the 2007 IOM competitive food and beverage standards; or 2) had a weaker requirement that did not meet the IOM standards. For other sugar-sweetened beverages, fat content of milk and caffeine content of beverages, there is only one strong policy category for those that met the IOM standard. In either case, strong policy provisions included language such as shall, must, require, comply and enforce. WEak PoLICy PRovISIonS offered suggestions or recommendations, and some required action, but only for certain grade levels or times of day. They included language such as should, might, encourage, some, make an effort to, partial and try.
Competitive Food and Beverage Content Restriction Data
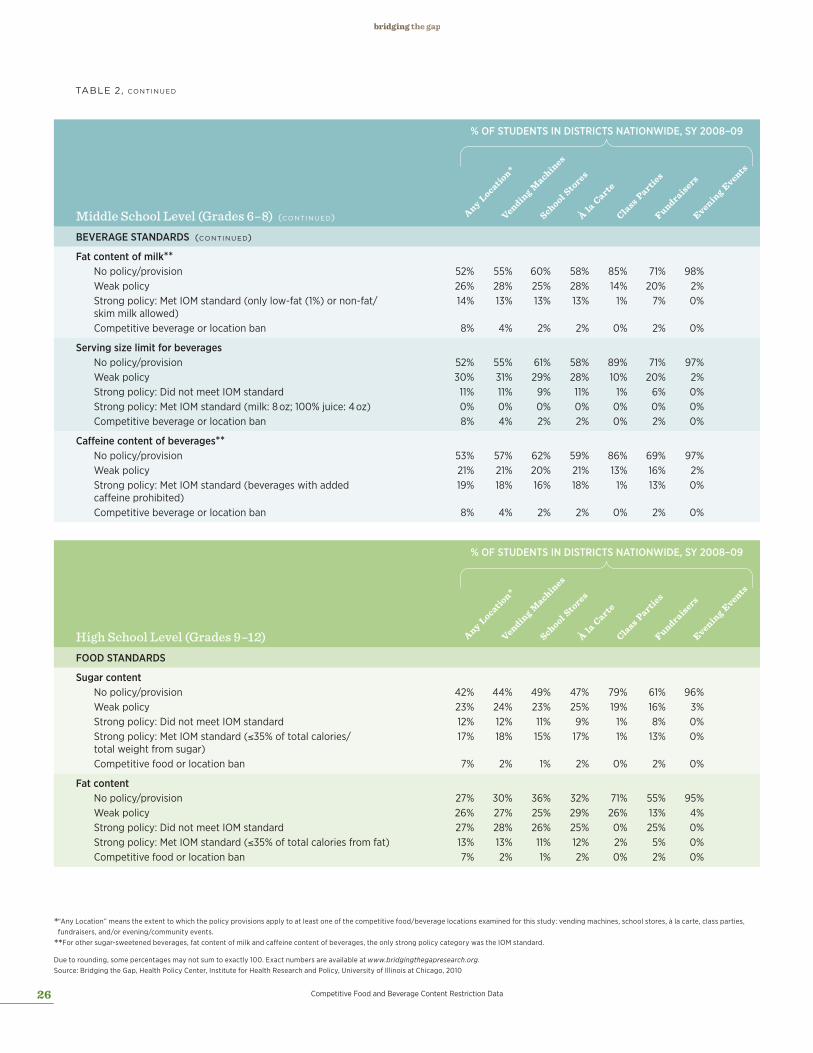
The following table summarizes restrictions on competitive foods and/or beverages for school year 2008–09, including limits on sugar, fat, sodium, calories, and caffeine, as well as restrictions on sugar-sweetened beverages. New to this year’s report, we have analyzed the food and beverage restrictions by each location of sale. All data are weighted to reflect the percentage of elementary, middle and high school students nationwide who were enrolled in a district with a given policy provision. All data reflect policies in place by the first day of the given school year. More details and data presented at the district level and for various subpopulations and geographic areas are available at www.bridgingthegapresearch.org.
table 2 Percentage of Students Nationwide in Districts with Wellness Policies Addressing Competitive Food and Beverage Content Restrictions by Grade Level and Location of Sale, School Year 2008–09
Elementary School Level (Grades 1–5) Any location *
vending m
achines
School Stores
À la Carte
Class Parties
Fundraisers
evening events
FooD STanDaRDS
Sugar contentNo policy/provision 27% 29% 38% 33% 78% 54% 96%Weak policy 13% 15% 16% 26% 20% 10% 4%Strong policy: Did not meet IOM standard 11% 11% 9% 10% 0% 8% 0%Strong policy: Met IOM standard (≤35% of total calories/ total weight from sugar)
18% 20% 21% 22% 2% 15% 0%
Competitive food or location ban 30% 26% 16% 10% 0% 13% 0%
Fat contentNo policy/provision 19% 21% 30% 23% 70% 51% 95%Weak policy 16% 18% 20% 21% 28% 10% 5%Strong policy: Did not meet IOM standard 13% 14% 13% 22% 0% 13% 0%Strong policy: Met IOM standard (≤35% of total calories from fat) 21% 21% 22% 25% 2% 14% 0%Competitive food or location ban 30% 26% 16% 10% 0% 13% 0%
% oF STUDEnTS In DISTRICTS naTIonWIDE, Sy 2008–09

23www.bridgingthegapresearch.org
Elementary School Level (Grades 1–5) (continued) Any location *
vending m
achines
School Stores
À la Carte
Class Parties
Fundraisers
evening events
FooD STanDaRDS (continued)
Trans fatsNo policy/provision 51% 54% 64% 57% 91% 70% 98%Weak policy 10% 10% 12% 20% 7% 10% 2%Strong policy: Did not meet IOM standard 7% 8% 7% 11% 1% 6% 0%Strong policy: Met IOM standard (trans fat free or no more than 0.5g trans fat)
2% 2% 2% 1% 1% 0% 0%
Competitive food or location ban 30% 26% 16% 10% 0% 13% 0%
Sodium contentNo policy/provision 43% 47% 57% 61% 81% 70% 97%Weak policy 16% 15% 16% 17% 19% 7% 3%Strong policy: Did not meet IOM standard 11% 11% 11% 12% 0% 9% 0%Strong policy: Met IOM standard (≤200mg sodium/portion) 0% 0% 0% 0% 0% 0% 0%Competitive food or location ban 30% 26% 16% 10% 0% 13% 0%
Calorie contentNo policy/provision 48% 52% 63% 65% 91% 71% 99%Weak policy 3% 3% 3% 5% 8% 2% 1%Strong policy: Did not meet IOM standard 4% 4% 3% 5% 0% 4% 0%Strong policy: Met IOM standard (≤200 calories/serving) 14% 15% 16% 14% 1% 10% 0%Competitive food or location ban 30% 26% 17% 9% 0% 13% 0%
BEvERaGE STanDaRDS
Regular sodaNo policy/provision 18% 22% 31% 21% 76% 51% 96%Weak policy 5% 9% 10% 6% 15% 8% 3%Strong policy: Did not meet IOM standard (bans regular soda but not all sugar-sweetened beverages)
35% 32% 31% 48% 8% 20% 0%
Strong policy: Met IOM standard (beverages with added caloric sweeteners prohibited)
16% 16% 13% 16% 1% 9% 0%
Competitive beverage or location ban 25% 21% 16% 9% 0% 12% 0%
other sugar-sweetened beverages (SSBs)**No policy/provision 38% 42% 50% 43% 86% 62% 98%Weak policy 21% 21% 21% 32% 13% 16% 2%Strong policy: Met IOM standard (beverages with added caloric sweeteners prohibited)
16% 16% 13% 16% 1% 9% 0%
Competitive beverage or location ban 25% 21% 16% 9% 0% 12% 0%
Sugar/calorie content of flavored milkNo policy/provision 55% 59% 66% 63% 90% 73% 99%Weak policy 4% 4% 4% 4% 9% 2% 1%Strong policy: Did not meet IOM standard 14% 14% 12% 23% 1% 11% 0%Strong policy: Met IOM standard (≤22g of total sugars/8 oz portion) 2% 2% 2% 2% 0% 2% 0%Competitive beverage or location ban 25% 21% 16% 8% 0% 12% 0%
table 2, continued
* “Any Location” means the extent to which the policy provisions apply to at least one of the competitive food/beverage locations examined for this study: vending machines, school stores, à la carte, class parties, fundraisers, and/or evening/community events.
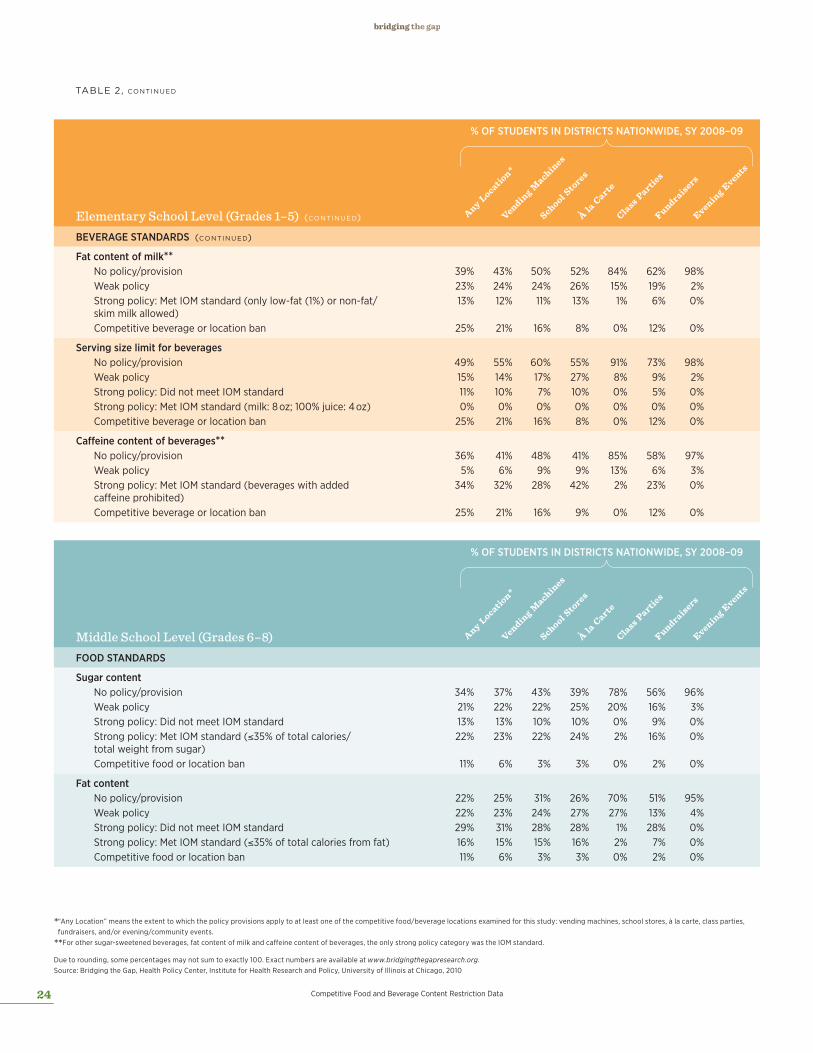
**For other sugar-sweetened beverages, fat content of milk and caffeine content of beverages, the only strong policy category was the IOM standard.
Due to rounding, some percentages may not sum to exactly 100. Exact numbers are available at www.bridgingthegapresearch.org. Source: Bridging the Gap, Health Policy Center, Institute for Health Research and Policy, University of Illinois at Chicago, 2010
% oF STUDEnTS In DISTRICTS naTIonWIDE, Sy 2008–09
24 Competitive Food and Beverage Content Restriction Data
Elementary School Level (Grades 1–5) (continued) Any location *
vending m
achines
School Stores
À la Carte
Class Parties
Fundraisers
evening events
BEvERaGE STanDaRDS (continued)
Fat content of milk**No policy/provision 39% 43% 50% 52% 84% 62% 98%Weak policy 23% 24% 24% 26% 15% 19% 2%Strong policy: Met IOM standard (only low-fat (1%) or non-fat/ skim milk allowed)
13% 12% 11% 13% 1% 6% 0%
Competitive beverage or location ban 25% 21% 16% 8% 0% 12% 0%
Serving size limit for beveragesNo policy/provision 49% 55% 60% 55% 91% 73% 98%Weak policy 15% 14% 17% 27% 8% 9% 2%Strong policy: Did not meet IOM standard 11% 10% 7% 10% 0% 5% 0%Strong policy: Met IOM standard (milk: 8 oz; 100% juice: 4 oz) 0% 0% 0% 0% 0% 0% 0%Competitive beverage or location ban 25% 21% 16% 8% 0% 12% 0%
Caffeine content of beverages**No policy/provision 36% 41% 48% 41% 85% 58% 97%Weak policy 5% 6% 9% 9% 13% 6% 3%Strong policy: Met IOM standard (beverages with added caffeine prohibited)
34% 32% 28% 42% 2% 23% 0%
Competitive beverage or location ban 25% 21% 16% 9% 0% 12% 0%
Middle School Level (Grades 6–8) Any location *
vending m
achines
School Stores
À la Carte
Class Parties
Fundraisers
evening events
FooD STanDaRDS
Sugar contentNo policy/provision 34% 37% 43% 39% 78% 56% 96%Weak policy 21% 22% 22% 25% 20% 16% 3%Strong policy: Did not meet IOM standard 13% 13% 10% 10% 0% 9% 0%Strong policy: Met IOM standard (≤35% of total calories/ total weight from sugar)
22% 23% 22% 24% 2% 16% 0%
Competitive food or location ban 11% 6% 3% 3% 0% 2% 0%
Fat contentNo policy/provision 22% 25% 31% 26% 70% 51% 95%Weak policy 22% 23% 24% 27% 27% 13% 4%Strong policy: Did not meet IOM standard 29% 31% 28% 28% 1% 28% 0%Strong policy: Met IOM standard (≤35% of total calories from fat) 16% 15% 15% 16% 2% 7% 0%Competitive food or location ban 11% 6% 3% 3% 0% 2% 0%
table 2, continued
* “Any Location” means the extent to which the policy provisions apply to at least one of the competitive food/beverage locations examined for this study: vending machines, school stores, à la carte, class parties, fundraisers, and/or evening/community events.
**For other sugar-sweetened beverages, fat content of milk and caffeine content of beverages, the only strong policy category was the IOM standard.
Due to rounding, some percentages may not sum to exactly 100. Exact numbers are available at www.bridgingthegapresearch.org. Source: Bridging the Gap, Health Policy Center, Institute for Health Research and Policy, University of Illinois at Chicago, 2010
% oF STUDEnTS In DISTRICTS naTIonWIDE, Sy 2008–09
% oF STUDEnTS In DISTRICTS naTIonWIDE, Sy 2008–09
25www.bridgingthegapresearch.org
Middle School Level (Grades 6–8) (continued) Any location *
vending m
achines
School Stores
À la Carte
Class Parties
Fundraisers
evening events
FooD STanDaRDS (continued)
Trans fatsNo policy/provision 60% 63% 68% 66% 91% 72% 98%Weak policy 18% 18% 18% 19% 7% 17% 2%Strong policy: Did not meet IOM standard 10% 11% 8% 11% 1% 9% 0%Strong policy: Met IOM standard (trans fat free or no more than 0.5g trans fat)
2% 2% 2% 2% 1% 0% 0%
Competitive food or location ban 11% 6% 3% 3% 0% 2% 0%
Sodium contentNo policy/provision 58% 64% 68% 65% 80% 81% 97%Weak policy 18% 16% 16% 18% 19% 6% 2%Strong policy: Did not meet IOM standard 13% 14% 13% 14% 0% 10% 0%Strong policy: Met IOM standard (≤200mg sodium/portion) 0% 0% 0% 0% 0% 0% 0%Competitive food or location ban 11% 6% 3% 3% 0% 2% 0%
Calorie contentNo policy/provision 63% 66% 75% 74% 91% 81% 99%Weak policy 5% 6% 3% 2% 7% 1% 1%Strong policy: Did not meet IOM standard 16% 17% 13% 16% 1% 14% 0%Strong policy: Met IOM standard (≤200 calories/serving) 6% 5% 6% 5% 0% 1% 0%Competitive food or location ban 11% 6% 3% 3% 0% 2% 0%
BEvERaGE STanDaRDS
Regular sodaNo policy/provision 19% 26% 33% 21% 77% 52% 97%Weak policy 5% 12% 12% 6% 14% 8% 3%Strong policy: Did not meet IOM standard (bans regular soda but not all SSBs)
58% 49% 44% 62% 8% 33% 0%
Strong policy: Met IOM standard (beverages with added caloric sweeteners prohibited)
10% 10% 9% 9% 1% 5% 0%
Competitive beverage or location ban 8% 4% 2% 2% 0% 2% 0%
other sugar-sweetened beverages (SSBs)**No policy/provision 64% 67% 73% 71% 93% 80% 99%Weak policy 18% 20% 16% 18% 6% 13% 1%Strong policy: Met IOM standard (beverages with added caloric sweeteners prohibited)
10% 10% 9% 9% 1% 5% 0%
Competitive beverage or location ban 8% 4% 2% 2% 0% 2% 0%
Sugar/calorie content of flavored milkNo policy/provision 65% 68% 72% 70% 91% 76% 99%Weak policy 4% 4% 3% 4% 8% 1% 1%Strong policy: Did not meet IOM standard 22% 22% 20% 22% 1% 19% 0%Strong policy: Met IOM standard (≤22g of total sugars/8 oz portion) 2% 2% 2% 2% 0% 2% 0%Competitive beverage or location ban 8% 4% 2% 2% 0% 2% 0%
table 2, continued
* “Any Location” means the extent to which the policy provisions apply to at least one of the competitive food/beverage locations examined for this study: vending machines, school stores, à la carte, class parties, fundraisers, and/or evening/community events.
**For other sugar-sweetened beverages, fat content of milk and caffeine content of beverages, the only strong policy category was the IOM standard.
Due to rounding, some percentages may not sum to exactly 100. Exact numbers are available at www.bridgingthegapresearch.org. Source: Bridging the Gap, Health Policy Center, Institute for Health Research and Policy, University of Illinois at Chicago, 2010
% oF STUDEnTS In DISTRICTS naTIonWIDE, Sy 2008–09
26 Competitive Food and Beverage Content Restriction Data
Middle School Level (Grades 6–8) (continued) Any location *
vending m
achines
School Stores
À la Carte
Class Parties
Fundraisers
evening events
BEvERaGE STanDaRDS (continued)
Fat content of milk**No policy/provision 52% 55% 60% 58% 85% 71% 98%Weak policy 26% 28% 25% 28% 14% 20% 2%Strong policy: Met IOM standard (only low-fat (1%) or non-fat/ skim milk allowed)
14% 13% 13% 13% 1% 7% 0%
Competitive beverage or location ban 8% 4% 2% 2% 0% 2% 0%
Serving size limit for beveragesNo policy/provision 52% 55% 61% 58% 89% 71% 97%Weak policy 30% 31% 29% 28% 10% 20% 2%Strong policy: Did not meet IOM standard 11% 11% 9% 11% 1% 6% 0%Strong policy: Met IOM standard (milk: 8 oz; 100% juice: 4 oz) 0% 0% 0% 0% 0% 0% 0%Competitive beverage or location ban 8% 4% 2% 2% 0% 2% 0%
Caffeine content of beverages**No policy/provision 53% 57% 62% 59% 86% 69% 97%Weak policy 21% 21% 20% 21% 13% 16% 2%Strong policy: Met IOM standard (beverages with added caffeine prohibited)
19% 18% 16% 18% 1% 13% 0%
Competitive beverage or location ban 8% 4% 2% 2% 0% 2% 0%
High School Level (Grades 9–12) Any location *
vending m
achines
School Stores
À la Carte
Class Parties
Fundraisers
evening events
FooD STanDaRDS
Sugar contentNo policy/provision 42% 44% 49% 47% 79% 61% 96%Weak policy 23% 24% 23% 25% 19% 16% 3%Strong policy: Did not meet IOM standard 12% 12% 11% 9% 1% 8% 0%Strong policy: Met IOM standard (≤35% of total calories/ total weight from sugar)
17% 18% 15% 17% 1% 13% 0%
Competitive food or location ban 7% 2% 1% 2% 0% 2% 0%
Fat contentNo policy/provision 27% 30% 36% 32% 71% 55% 95%Weak policy 26% 27% 25% 29% 26% 13% 4%Strong policy: Did not meet IOM standard 27% 28% 26% 25% 0% 25% 0%Strong policy: Met IOM standard (≤35% of total calories from fat) 13% 13% 11% 12% 2% 5% 0%Competitive food or location ban 7% 2% 1% 2% 0% 2% 0%
table 2, continued
* “Any Location” means the extent to which the policy provisions apply to at least one of the competitive food/beverage locations examined for this study: vending machines, school stores, à la carte, class parties, fundraisers, and/or evening/community events.
**For other sugar-sweetened beverages, fat content of milk and caffeine content of beverages, the only strong policy category was the IOM standard.
Due to rounding, some percentages may not sum to exactly 100. Exact numbers are available at www.bridgingthegapresearch.org. Source: Bridging the Gap, Health Policy Center, Institute for Health Research and Policy, University of Illinois at Chicago, 2010
% oF STUDEnTS In DISTRICTS naTIonWIDE, Sy 2008–09
% oF STUDEnTS In DISTRICTS naTIonWIDE, Sy 2008–09

27www.bridgingthegapresearch.org
High School Level (Grades 9–12) (continued) Any location *
vending m
achines
School Stores
À la Carte
Class Parties
Fundraisers
evening events
FooD STanDaRDS (continued)
Trans fatsNo policy/provision 64% 70% 70% 68% 91% 74% 97%Weak policy 19% 19% 19% 19% 8% 17% 2%Strong policy: Did not meet IOM standard 8% 10% 8% 10% 1% 7% 0%Strong policy: Met IOM standard (trans fat free or no more than 0.5g trans fat)
2% 2% 1% 1% 0% 0% 0%
Competitive food or location ban 7% 2% 1% 2% 0% 2% 0%
Sodium contentNo policy/provision 61% 68% 70% 69% 79% 84% 97%Weak policy 21% 18% 17% 18% 20% 7% 3%Strong policy: Did not meet IOM standard 11% 12% 11% 11% 0% 7% 0%Strong policy: Met IOM standard (≤200mg sodium/portion) 0% 0% 0% 0% 0% 0% 0%Competitive food or location ban 7% 2% 1% 2% 0% 2% 0%
Calorie contentNo policy/provision 72% 75% 81% 80% 94% 85% 100%Weak policy 6% 7% 3% 2% 5% 1% 0%Strong policy: Did not meet IOM standard 14% 14% 13% 14% 0% 11% 0%Strong policy: Met IOM standard (≤200 calories/serving) 3% 2% 2% 2% 1% 1% 0%Competitive food or location ban 7% 2% 1% 2% 0% 2% 0%
BEvERaGE STanDaRDS
Regular sodaNo policy/provision 25% 35% 42% 28% 80% 57% 97%Weak policy 7% 28% 24% 7% 12% 22% 3%Strong policy: Did not meet IOM standard (bans regular soda but not all SSBs)
58% 31% 29% 60% 7% 18% 0%
Strong policy: Met IOM standard (beverages with added caloric sweeteners prohibited)
4% 4% 4% 4% 1% 2% 0%
Competitive beverage or location ban 6% 1% 1% 1% 0% 2% 9%
other sugar-sweetened beverages (SSBs)**No policy/provision 71% 75% 77% 76% 95% 84% 99%Weak policy 19% 20% 18% 18% 5% 12% 1%Strong policy: Met IOM standard (beverages with added caloric sweeteners prohibited)
4% 4% 4% 4% 1% 2% 0%
Competitive beverage or location ban 6% 1% 1% 1% 0% 2% 0%
Sugar/calorie content of flavored milkNo policy/provision 71% 74% 75% 74% 94% 80% 99%Weak policy 4% 4% 4% 4% 6% 1% 1%Strong policy: Did not meet IOM standard 18% 19% 18% 19% 0% 15% 0%Strong policy: Met IOM standard (≤22g of total sugars/8 oz portion) 2% 2% 2% 2% 0% 2% 0%Competitive beverage or location ban 6% 1% 1% 1% 0% 2% 0%
table 2, continued
* “Any Location” means the extent to which the policy provisions apply to at least one of the competitive food/beverage locations examined for this study: vending machines, school stores, à la carte, class parties, fundraisers, and/or evening/community events.
**For other sugar-sweetened beverages, fat content of milk and caffeine content of beverages, the only strong policy category was the IOM standard.
Due to rounding, some percentages may not sum to exactly 100. Exact numbers are available at www.bridgingthegapresearch.org. Source: Bridging the Gap, Health Policy Center, Institute for Health Research and Policy, University of Illinois at Chicago, 2010
% oF STUDEnTS In DISTRICTS naTIonWIDE, Sy 2008–09

28 Competitive Food and Beverage Content Restriction Data
High School Level (Grades 9–12) (continued) Any location *
vending m
achines
School Stores
À la Carte
Class Parties
Fundraisers
evening events
BEvERaGE STanDaRDS (continued)
Fat content of milk**No policy/provision 57% 60% 64% 62% 87% 75% 98%Weak policy 24% 26% 23% 24% 12% 16% 2%Strong policy: Met IOM standard (only low-fat (1%) or non-fat/ skim milk allowed)
13% 13% 12% 13% 1% 7% 0%
Competitive beverage or location ban 6% 1% 1% 1% 0% 2% 0%
Serving size limit for beveragesNo policy/provision 56% 59% 63% 62% 89% 75% 97%Weak policy 33% 34% 31% 31% 10% 20% 2%Strong policy: Did not meet IOM standard 6% 5% 5% 6% 0% 3% 0%Strong policy: Met IOM standard (milk: 8 oz; 100% juice: 8 oz) 0% 0% 0% 0% 0% 0% 0%Competitive beverage or location ban 6% 1% 1% 1% 0% 2% 0%
Caffeine content of beverages**No policy/provision 62% 66% 69% 67% 90% 75% 97%Weak policy 19% 21% 19% 19% 9% 15% 2%Strong policy: Met IOM standard (beverages with added caffeine prohibited)
13% 11% 11% 13% 1% 9% 0%
Competitive beverage or location ban 6% 1% 1% 1% 0% 2% 0%
table 2, continued
* “Any Location” means the extent to which the policy provisions apply to at least one of the competitive food/beverage locations examined for this study: vending machines, school stores, à la carte, class parties, fundraisers, and/or evening/community events.
**For other sugar-sweetened beverages, fat content of milk and caffeine content of beverages, the only strong policy category was the IOM standard.
Due to rounding, some percentages may not sum to exactly 100. Exact numbers are available at www.bridgingthegapresearch.org. Source: Bridging the Gap, Health Policy Center, Institute for Health Research and Policy, University of Illinois at Chicago, 2010
% oF STUDEnTS In DISTRICTS naTIonWIDE, Sy 2008–09
29www.bridgingthegapresearch.org
Overview of Study Methods
This study examined written policies from districts in 47 of the 48 contiguous states, and included nationally representative samples of 579, 641, and 593 districts with wellness policies in place by the first day of the 2006–07, 2007–08 and 2008–09 school years, respectively. The day after Labor Day of each year was used as a proxy for the first day of the school year. All of the written policies were collected between April 2007 and June 2008 for school years 2006–07 and 2007–08 and between September 2008 and March 2009 for school year 2008–09. A 94 percent response rate was achieved for school years 2006–07 and 2007–08; and a 97 percent response rate was achieved for school year 2008–09.
For purposes of this study, WELLnESS PoLICy was defined to include: 1) the actual district wellness policy; 2) the associated administrative policies, including implementation regulations, rules, procedures or administrative guidelines; and 3) any district, state or model policies that were referenced within the wellness policy or administrative documents.
All policies were analyzed by two trained analysts using an adaptation of a wellness policy coding scheme developed by Schwartz et al.43 and originally presented in Chriqui et al.44 A detailed explanation of the coding methodology can be found in the Appendix included in Chriqui et al.45 For each policy provision described, data are presented on the percentage of students in a district with: 1) a strong policy; 2) a weak policy; or 3) no policy. We defined STRonG PoLICy PRovISIonS as those that were definitely required and specified an implementation plan or strategy. Strong policy provisions included language such as shall, must, will, require, comply and enforce. For Table 2, we also differentiated strong policies that were required and either: 1) met the 2007 IOM competitive food and/or beverage standards;46 or 2) had a weaker requirement that did not meet the IOM standards. We defined WEak PoLICy PRovISIonS as those that included vague terms, suggestions or recommendations, as well as those that required action, but noted exceptions for certain grade levels or certain times of day. Weak policy provisions included language such as should, might, encourage, some, make an effort to, partial and try.
Data are presented on the weighted percentages of students nationwide who were enrolled in districts with each policy provision discussed. Data are presented on the percentage of students nationwide to provide readers with a sense of the relative reach of the policies. Findings presented in this report are based on analyses of wellness policy data representing approximately 41.7 million students for the 2006–07 school year, 45.3 million students for the 2007–08 school year, and approximately 42.4 million students for the 2008–09 school year.
Acknowledgements
The authors would like to gratefully thank a number of people for their contributions to this work:
Marlene Schwartz, Ph.D., and her team at the Rudd Center for Food Policy and Obesity at Yale University for their guidance and insight into their original coding tool they developed for analyzing wellness policy data.
Tracy Fox, for her assistance in expanding our coding scheme to account for the Institute of Medicine’s recommendations for competitive foods and beverages as well as her continued support and guidance on all nutrition-related policy issues.
Steven Horvath of the Bridging the Gap program for his data entry assistance.
Lloyd Johnston, Ph.D., from the University of Michigan, and Lindsey Turner, Ph.D., from the University of Illinois at Chicago, who direct two related companion studies that examine school nutrition and physical activity-related policies and practices.
The Survey Research Center in the Institute for Social Research at the University of Michigan for developing the sample frame and weights for the study.
From the Robert Wood Johnson Foundation: C. Tracy orleans, Ph.D., Laura Leviton, Ph.D., kathryn Thomas and Joan Barlow; and from Burness Communications: Laurie Lennon, Elizabeth Wenk, Matt Gruenburg and Chuck alexander.
30 References
References
Flegal KM, Carroll MD, Ogden CL, et al. “Prevalence and Trends in 1.
U.S. Children and Adolescents, 2007–2008.” Journal of the American
Medical Association, 303(3): 242–249, 2010.
Overweight and Obesity, Health Consequences.2. Centers for Disease
Control and Prevention, 2009, www.cdc.gov/obesity/causes/
health.html (accessed June 2010).
Marder W and Chang S. “Childhood Obesity: Costs, Treatment 3.
Patterns, Disparities in Care, and Prevalent Medical Conditions.”
Thomson Medstat Research Brief, 2005.
Geier A, Foster G, Womble L, et al. “The Relationship Between 4.
Relative Weight and School Attendance Among Elementary School
Children.” Obesity, 15(8): 2157–2161, 2007.
Story M, Kaphingst K and French S. “The Role of Schools in Obesity 5.
Prevention.” The Future of Children, 16(1): 109–142, 2006.
ibid.6.
Active Education: Physical Education, Physical Activity and 7.
Academic Performance. Active Living Research, 2009,
http://activelivingresearch.org/files/Active_Ed_Summer2009.pdf
(accessed April 2010).
ibid. 8.
School Foods Sold Outside of Meals (Competitive Foods).9. Healthy
Eating Research, 2007, www.healthyeatingresearch.org/images/
stories/her_research_briefs/hercompetfoodsresearchbrief.pdf
(accessed June 2010).
Crepinsek M, Gordon A, McKinney P, et al. “Meals Offered and 10.
Served in U.S. Public Schools: Do They Meet Nutrition Standards?”
Journal of the American Dietetic Association, 109
(2, Supplement 1):S31–S43, 2009.
Condon E, Crepinsek M and Fox M. “School Meals: Types of Foods 11.
Offered to and Consumed by Children at Lunch and Breakfast.”
Journal of the American Dietetic Association, 109
(2, Supplement 1):S67–S78, 2008.
Institute of Medicine. 12. Progress in Preventing Childhood Obesity.
Washington, DC: National Academies Press, 2007.
Institute of Medicine. 13. Preventing Childhood Obesity: Health in the
Balance. Washington, DC: National Academies Press, 2005.
National School Lunch Program.14. Food Research Assistance Center,
2009, www.frac.org/html/federal_food_programs/programs/
nslp.html (accessed April 2010).
School Breakfast Program.15. Food Research Assistance Center, 2009,
www.frac.org/html/federal_food_programs/programs/sbp.html
(accessed April 2010).
Solving the Problem of Childhood Obesity Within a Generation: 16.
Report to the President. Washington, DC: White House Task Force
on Childhood Obesity, 2010.
Chriqui JF, Schneider L, Chaloupka FJ, et al. 17. Local Wellness Policies:
Assessing School District Strategies for Improving Children’s Health.
School Years 2006–07 and 2007–08. Chicago, IL: Bridging the
Gap Program, Health Policy Center, Institute for Health Research
and Policy, University of Illinois at Chicago, 2009,
www.bridgingthegapresearch.org.
Institute of Medicine. 18. Nutrition Standards for Food in Schools:
Leading the Way Toward Healthier Youth. Washington, DC: National
Academies Press, 2007.
Chriqui JF, Schneider L, Chaloupka FJ, et al. 19. Executive Summary—
Local Wellness Policies: Assessing School District Strategies for
Improving Children’s Health. School Years 2006–07 and 2007–08.
Chicago, IL: Bridging the Gap Program, Health Policy Center,
Institute for Health Research and Policy, University of Illinois at
Chicago, 2009, www.bridgingthegapresearch.org.
Institute of Medicine. 20. Nutrition Standards for Food in Schools, 2007.
Dietary Guidelines for Americans, 2005.21. Washington, DC: U.S.
Department of Health and Human Services and U.S. Department of
Agriculture, 2005.
Institute of Medicine. 22. Nutrition Standards for Food in Schools, 2007.
ibid.23.
ibid.24.
ibid.25.
Nutrition and Your Health: Dietary Guidelines for Americans, 1995. 26.
Washington, DC: U.S. Department of Health and Human Services,
1995.
Institute of Medicine. 27. School Meals: Building Blocks for Healthier
Children. Washington, DC: National Academies Press, 2009.
Dietary Guidelines for Americans, 2005.28.
Institute of Medicine. 29. School Meals: Building Blocks for Healthier
Children.
Changing the Scene: Improving the School Nutrition Environment— 30.
A Guide to Local Action. Washington, DC: U.S. Department of
Agriculture, Food and Nutrition Service, 2000.
U.S. Department of Health and Human Services. 31. Healthy People
2010: Understanding and Improving Health. Washington, DC:
Government Printing Office, 2000.
Moving Into the Future: National Standards for Physical Education. 32.
2nd Edition. Reston, VA: National Association for Sport & Physical
Education, 2004.
Sallis JF, McKenzie TI, Alcaraz JE, et al. “The Effects of a 2-year 33.
Physical Education Program (SPARK) on Physical Activity and
Fitness in Elementary School Students.” American Journal of Public
Health, 87(8): 1328–1334, 1997.
McKenzie TL, Sallis JF, Kolody B, et al. “Long-term Effects of a 34.
Physical Education Curriculum and Staff Development Program:
SPARK.” Research Quarterly on Exercise & Sport, 68: 280–291, 1997.
McKenzie TL, Stone EJ, Feldman HA, et al. “Effects of the CATCH 35.
Physical Education Intervention: Teacher Type and Lesson Location.”
American Journal of Preventive Medicine. 21:101–109, 2001.
2008 Physical Activity Guidelines for Americans.36. Washington, DC:
U.S. Department of Health and Human Services, Office of Disease
Prevention and Health Promotion, 2008.
Longley C and Sneed J. “Effects of Federal Legislation on Wellness 37.
Policy Formation in School Districts in the United States.” Journal of
the American Dietetic Association, 190(1): 95–101, 2009.
31www.bridgingthegapresearch.org
From Cupcakes to Carrots: Local Wellness Policies One Year Later. 38.
Alexandria, VA: School Nutrition Association, 2007.
Local Wellness Policies One Year Later: Showing Improvements in 39.
School Nutrition and Physical Activity. Skokie, IL: Action for Healthy
Kids, 2007.
Solving the Problem of Childhood Obesity Within a Generation: 40.
Report to the President. Washington, DC: White House Task Force
on Childhood Obesity, 2010.
Chriqui JF, Schneider L, Chaloupka FJ, et al. 41. Local Wellness Policies:
Assessing School District Strategies for Improving Children’s Health.
School Years 2006–07 and 2007–08, 2009.
ibid.42.
Schwartz M, Lund A, Grow H, et al. “A Comprehensive Coding 43.
System to Measure the Quality of School Wellness Policies.” Journal
of the American Dietetic Association, 109(7): 1256–1262, 2009.
Chriqui JF, Schneider L, Chaloupka FJ, et al. 44. Local Wellness Policies:
Assessing School District Strategies for Improving Children’s Health.
School Years 2006–07 and 2007–08, 2009.
ibid.45.
Institute of Medicine. 46. Nutrition Standards for Food in Schools, 2007.

www.bridgingthegapresearch.org
Related Documents