School Breakfast Scorecard School Year 2016 –2017 February 2018 n www.FRAC.org

Welcome message from author
This document is posted to help you gain knowledge. Please leave a comment to let me know what you think about it! Share it to your friends and learn new things together.
Transcript

FRAC n School Breakfast Scorecard n www.FRAC.org n twitter @fractweets 1
School Breakfast ScorecardSchool Year 2016–2017
February 2018 n www.FRAC.org

FRAC n School Breakfast Scorecard n www.FRAC.org n twitter @fractweets 2
School Breakfast ScorecardSchool Year 2016–2017
Acknowledgments The Food Research & Action Center (FRAC) gratefully
acknowledges major dedicated support of its work to
increase participation and improve the School Breakfast
Program from the following:
n Eos Foundation;
n General Mills Foundation;
n Hunger Is, a joint program of
The Albertsons Companies Foundation and the
Entertainment Industry Foundation;
n Kellogg Company Fund;
n National Dairy Council/Dairy Management, Inc.; and
n Walmart Foundation.
Additional support for FRAC’s breakfast and child nutrition
work has been provided by the following:
n Anonymous;
n Annie E. Casey Foundation;
n The JPB Foundation;
n Menemsha Family Fund; and
n Tyson Foods, Inc.
This report was written by FRAC’s Senior Policy Analyst,
Etienne Melcher Philbin, and Senior Research and Policy
Analyst, Randy Rosso. The findings and conclusions
presented in this report are those of FRAC alone.
About FRAC The Food Research & Action Center (FRAC) is the
leading national organization working for more effective
public and private policies to eradicate domestic hunger
and undernutrition. For more information about FRAC,
or to sign up for FRAC’s Weekly News Digest and
monthly Meals Matter: School Breakfast Newsletter,
go to: frac.org.

FRAC n School Breakfast Scorecard n www.FRAC.org n twitter @fractweets 3
I. Introduction
More low-income students and schools than ever
before are participating in the national School
Breakfast Program. In the 2016–2017 school
year, nearly 12.2 million low-income students participated
in the program, an increase of 0.6 percent when
compared to the prior school year. While participation has
continued to increase, the rate of growth slowed during
the last school year, from an average of 390,000 additional
students in each of the four preceding years to almost
70,000 additional students in the 2016–2017 school year.
This continued growth in participation — although slower
than in previous years, likely because the economy is
shrinking the number of low-income students — is due to
more schools moving breakfast out of the cafeteria and
into the classroom, making it part of the school day; broad
implementation of the Community Eligibility Provision,
which allows free breakfast and lunch to be offered to
all students in high-poverty schools and districts; and
improvements to how low-income children are identified
as eligible for free school meals. These strategies have
contributed to substantial growth over the past decade
— 4.1 million more low-income children received school
breakfast in the 2016–2017 school year than in the 2006–
2007 school year.
Success can be seen in school districts of all shapes and
sizes — large and small; urban, suburban, and rural — as
they adopt the strategies above to grow participation.
Key factors contributing to schools making the choice to
implement school breakfast expansion strategies include
strong leadership within the school district; diverse and
engaged school breakfast coalitions that include state
agency, school nutrition, education, anti-hunger, and health
partners; proper and meaningful engagement and training
for all school staff; research showing profound positive
effects of school breakfast on health and learning; and
strong communication channels among all partners with
policies made clear and publicly available.
Efforts to increase breakfast participation pay off — school
breakfast leads to improved dietary intake, reduced food
insecurity, better test scores, improved student health,
and fewer distractions in the classroom throughout the
morning. See the Food Research & Action Center’s
Breakfast for Learning, Breakfast for Health, and The
Connections Between Food Insecurity, the Federal
Nutrition Programs, and Student Behavior for summaries
of the research on the health and learning benefits of
school breakfast.
The Food Research & Action Center’s ambitious but
attainable goal of every state serving 70 low-income
students breakfast for every 100 who eat school lunch
would result in nearly 2.9 million additional children a year
experiencing the positive academic and health outcomes
that are linked to participating in school breakfast. The
sustained increase in participation each year is helping to
move the nation closer to this goal, but the slowed rate of
growth in the 2016–2017 school year signals the need to
redouble efforts to grow participation.
The U.S. Department of Agriculture, state child nutrition
agency staff, policymakers, district and school leaders,
educators and anti-hunger advocates must continue to
work in partnership with school districts to implement
effective strategies to ensure all students start the school
day ready to learn.

FRAC n School Breakfast Scorecard n www.FRAC.org n twitter @fractweets 4
About the ScorecardThis report measures the reach of the School Breakfast
Program in the 2016–2017 school year — nationally and in
each state — based on a variety of metrics, and examines
the impact of select trends and policies on program
participation.
The report measures free and reduced-price school
breakfast participation to determine how many low-
income students school breakfast is reaching nationally
and in each state, using the ratio to free and reduced-
price school lunch participation as a benchmark. Because
there is broad participation in the National School Lunch
Program by low-income students across the states, it
is a useful comparison by which to measure how many
students could and should be benefiting from school
breakfast each day. The report also compares the number
of schools offering the School Breakfast Program to the
number of schools operating the National School Lunch
Program, as this is an important indicator of access to the
program for low-income children in the states.
Finally, the Food Research & Action Center sets an
ambitious, but achievable, goal of reaching 70 low-income
students with breakfast for every 100 participating in
school lunch; and calculates the number of children not
being served and the federal dollars lost in each state as a
result of not meeting this goal.
Who Operates the School Breakfast Program?
Any public school, nonprofit private school, or residential
child care institution can participate in the national School
Breakfast Program and receive federal funds for each
breakfast served. The program is administered at the
federal level by the U.S. Department of Agriculture and
in each state typically through the state department of
education or agriculture.
Who can Participate in the School Breakfast Program?
Any student attending a school that offers the program
can eat breakfast. What the federal government covers,
and what a student pays, depends on family income:
n Children from families with incomes at or below 130
percent of the Federal Poverty Level (FPL) are eligible
for free school meals.
n Children from families with incomes between 130 to 185
percent of the FPL qualify for reduced-price meals and
can be charged no more than 30 cents per breakfast.
n Children from families with incomes above 185 percent
of the FPL pay charges (referred to as “paid meals”),
which are set by the school.
Other federal and, in some cases, state rules, however,
make it possible to offer free meals to all children, or to all
children in households with incomes under 185 percent of
the FPL, especially in schools with high proportions of low-
income children.
How are Children Certified for Free or Reduced-Price Meals?
Most children are certified for free or reduced-price meals
via applications collected by the school district at the
beginning of the school year or during the year. However,
children in households participating in the Supplemental
Nutrition Assistance Program (SNAP), Temporary
Assistance for Needy Families (TANF), and the Food
Distribution Program on Indian Reservations (FDPIR), as
well as foster youth, migrant, homeless, or runaway youth,
and Head Start participants are “categorically eligible”
(automatically eligible) for free school meals and can be
certified without submitting a school meal application.
How the School Breakfast Program Works

FRAC n School Breakfast Scorecard n www.FRAC.org n twitter @fractweets 5
School districts are required to “directly certify” children
in households participating in SNAP for free school meals
through data matching of SNAP records with school
enrollment lists. School districts also have the option of
directly certifying other categorically eligible children as
well. Some states also utilize income information from
Medicaid to directly certify students as eligible for free and
reduced-price school meals.
Schools should also use data from the state to certify
categorically eligible students and they can coordinate
with other personnel, such as the school district’s
homeless and migrant education liaisons, to obtain
documentation to certify children for free school meals.
Some categorically eligible children may be missed in
this process, requiring the household to submit a school
meals application. However, these households are not
required to complete the income information section of
the application.
How are School Districts Reimbursed?
The federal reimbursement rate the school receives
for each meal served depends on whether a student is
receiving free, reduced-price, or paid meals.
For the 2016–2017 school year, schools received
n $1.71 per free breakfast;
n $1.41 per reduced-price breakfast; and
n $0.29 per “paid” breakfast.
“Severe need” schools received an additional 33 cents
for each free or reduced-price breakfast served. Schools
are considered severe need if at least 40 percent of the
lunches served during the second preceding school year
were free or reduced-price.
Offering Breakfast Free to All
Many high-poverty schools are able to offer free meals for
all students, with federal reimbursements based on the
proportions of low-income children in the school. Providing
breakfast at no charge to all students helps remove
the stigma often associated with means-tested school
breakfast (that breakfast in school is for “the poor kids”),
opens the program to children from families that would
struggle to pay the reduced-price copayment or the paid
breakfast charges, and streamlines the implementation of
breakfast in the classroom and other alternative service
models. Schools can offer free breakfast to all students
through the following options:
n Community Eligibility Provision: Community eligibility
schools are high-poverty schools that offer free
breakfast and lunch to all students and do not have
to collect, process, or verify school meal applications,
or keep track of meals by fee category, resulting
in significant administrative savings and increased
participation. For more information on community
eligibility, see page 11.
n Provision 2: Schools using Provision 2 (referring to a
provision of the National School Lunch Act) do not need
to collect, process, or verify school meal applications
or keep track of meals by fee category for at least
three out of every four years. Schools collect school
meal applications and count and claim meals by fee
category during year one of the multi-year cycle, called
the “base year.” Those data then determine the federal
reimbursement and are used for future years in the
cycle. Provision 2 schools have the option to serve only
breakfast or lunch, or both breakfast and lunch, to all
students at no charge, and use economies of scale from
increased participation and significant administrative
savings to offset the cost of offering free meals to all
students.
n Nonpricing: No fees are collected from students, while
schools continue to receive federal reimbursements for
the breakfasts served under the three-tier federal fee
categories (free, reduced-price, and paid).

FRAC n School Breakfast Scorecard n www.FRAC.org n twitter @fractweets 6
II. National Findings
In the 2016–2017 school year, school breakfast
participation continued to grow.
n On an average school day, almost 14.4 million children
participated in the School Breakfast Program; nearly
12.2 million of them were low-income children who
received a free or reduced-price school breakfast.
n Breakfast participation among low-income (free or
reduced-price certified) children increased by nearly
70,000 students, or 0.6 percent, over the previous
school year. While participation has continued to
increase, the rate of growth slowed during the last
school year, from an average of 3.5 percent in the
four preceding years to 0.6 percent in the 2016–2017
school year.
n The ratio of low-income children participating in school
breakfast to low-income children participating in school
lunch increased slightly, to 56.7 per 100 in school year
2016–2017, up from 56 per 100 in the previous school
year.
n If all states met the Food Research & Action Center’s
goal of reaching 70 low-income children with school
breakfast for every 100 participating in school lunch,
close to 2.9 million children would start the day with a
healthy breakfast at school. States and school districts
would tap into an additional $803.7 million in federal
funding to support school food services and local
economies.
n The number of schools offering school meal programs
decreased slightly, with 89,878 schools offering
breakfast and 97,202 offering school lunch. The share
of schools offering school breakfast, compared to
those that offer school lunch, improved slightly to 92.5
percent, an increase from 92.2 percent in the previous
school year.
2001–2002
6.78.0
10.5
12.2
2006–2007 2011–2012 2016–2017
05
.010
.015
.0
Mill
ion
s o
f Stu
de
nts
Fre
e o
f Re
du
ced
-Pro
ces
SB
P P
artic
ipat
ion
, in
Mill
ion
s
School Year
Figure 1: Free and Reduced-Price Participation in the School Breakfast Program
Efforts to increase breakfast participation pay off — school breakfast leads to reduced food insecurity, better test scores, improved student health, and
fewer distractions in the classroom.
FRAC n School Breakfast Scorecard n www.FRAC.org n twitter @fractweets 7
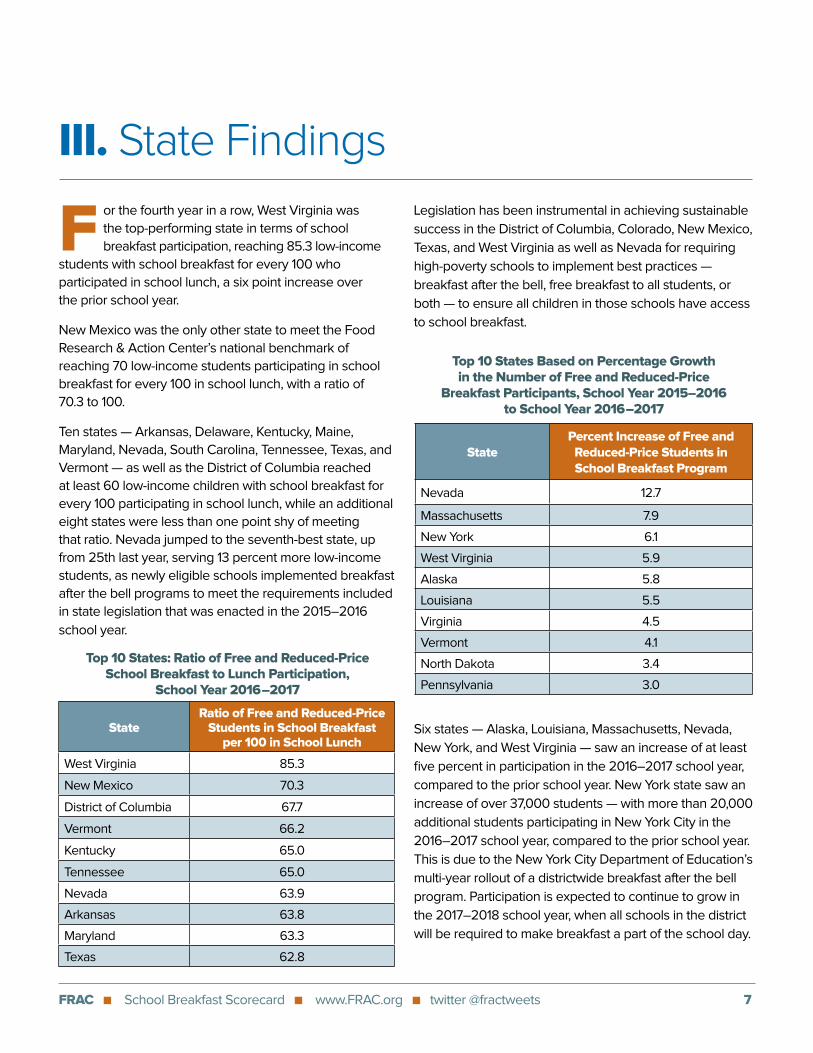
III. State Findings
For the fourth year in a row, West Virginia was
the top-performing state in terms of school
breakfast participation, reaching 85.3 low-income
students with school breakfast for every 100 who
participated in school lunch, a six point increase over
the prior school year.
New Mexico was the only other state to meet the Food
Research & Action Center’s national benchmark of
reaching 70 low-income students participating in school
breakfast for every 100 in school lunch, with a ratio of
70.3 to 100.
Ten states — Arkansas, Delaware, Kentucky, Maine,
Maryland, Nevada, South Carolina, Tennessee, Texas, and
Vermont — as well as the District of Columbia reached
at least 60 low-income children with school breakfast for
every 100 participating in school lunch, while an additional
eight states were less than one point shy of meeting
that ratio. Nevada jumped to the seventh-best state, up
from 25th last year, serving 13 percent more low-income
students, as newly eligible schools implemented breakfast
after the bell programs to meet the requirements included
in state legislation that was enacted in the 2015–2016
school year.
Legislation has been instrumental in achieving sustainable
success in the District of Columbia, Colorado, New Mexico,
Texas, and West Virginia as well as Nevada for requiring
high-poverty schools to implement best practices —
breakfast after the bell, free breakfast to all students, or
both — to ensure all children in those schools have access
to school breakfast.
Six states — Alaska, Louisiana, Massachusetts, Nevada,
New York, and West Virginia — saw an increase of at least
five percent in participation in the 2016–2017 school year,
compared to the prior school year. New York state saw an
increase of over 37,000 students — with more than 20,000
additional students participating in New York City in the
2016–2017 school year, compared to the prior school year.
This is due to the New York City Department of Education’s
multi-year rollout of a districtwide breakfast after the bell
program. Participation is expected to continue to grow in
the 2017–2018 school year, when all schools in the district
will be required to make breakfast a part of the school day.
Top 10 States: Ratio of Free and Reduced-Price School Breakfast to Lunch Participation,
School Year 2016–2017
StateRatio of Free and Reduced-Price
Students in School Breakfast per 100 in School Lunch
West Virginia 85.3
New Mexico 70.3
District of Columbia 67.7
Vermont 66.2
Kentucky 65.0
Tennessee 65.0
Nevada 63.9
Arkansas 63.8
Maryland 63.3
Texas 62.8
Top 10 States Based on Percentage Growth in the Number of Free and Reduced-Price
Breakfast Participants, School Year 2015–2016 to School Year 2016–2017
StatePercent Increase of Free and Reduced-Price Students in School Breakfast Program
Nevada 12.7
Massachusetts 7.9
New York 6.1
West Virginia 5.9
Alaska 5.8
Louisiana 5.5
Virginia 4.5
Vermont 4.1
North Dakota 3.4
Pennsylvania 3.0

FRAC n School Breakfast Scorecard n www.FRAC.org n twitter @fractweets 8
Bottom 10 States: Ratio of Free and Reduced-Price School Breakfast to Lunch Participation,
School Year 2016–2017
StateRatio of Free and Reduced-Price
Students in School Breakfast per 100 in School Lunch
North Dakota 49.6
Illinois 47.6
South Dakota 46.1
Washington 45.5
Wyoming 43.9
Iowa 43.8
Nebraska 42.8
Hawaii 41.8
New Hampshire 41.1
Utah 39.6
Breakfast After the Bell Implementing a breakfast after the bell model that
moves breakfast out of the school cafeteria served
before school starts — making it more accessible and
a part of the regular school day — has proven to be the
most successful strategy for increasing school breakfast
participation. Breakfast after the bell overcomes timing,
convenience, and stigma barriers that get in the way of
children participating in school breakfast and are even
more impactful when they are combined with offering
breakfast at no charge to all students. Schools generally
use one or more of three options when offering
breakfast after the bell:
n Breakfast in the Classroom: Meals are delivered
to and eaten in the classroom at the start of the
school day.
n “Grab and Go”: Children (particularly older students)
can quickly grab the components of their breakfast
from carts or kiosks in the hallway or the cafeteria line
to eat in their classroom or in common areas.
n Second Chance Breakfast: Students are offered a
second chance to eat breakfast after homeroom or
first period. Many middle and high school students
are not hungry first thing in the morning. Serving
these students breakfast after first period allows
them ample time to arrive to class promptly, while
still providing them the opportunity to get a nutritious
start to the day.
While school breakfast participation among low-income
students increased nationally, 26 states and the District
of Columbia served fewer low-income children in
2016–2017, compared to the prior year, compared to a
decrease in participation in just two states in the 2015–
2016 school year. States must regain the momentum
seen over the past five years and continue to work with
school districts to expand the number of eligible schools
adopting community eligibility and breakfast after the bell
models to meet the Food Research & Action Center’s
goal of reaching 70 low-income students with school
breakfast for every 100 who participate in school lunch.
The state of Utah remained the lowest-performing state
in school year 2016–2017, serving 39.6 students breakfast
for every 100 receiving lunch, a three-percent increase,
compared to the prior school year. An additional nine
states — Hawaii, Illinois, Iowa, Nebraska, New Hampshire,
North Dakota, South Dakota, Washington, and Wyoming
— failed to reach even half of the low-income students
who ate school lunch in the 2016–2017 school year.

FRAC n School Breakfast Scorecard n www.FRAC.org n twitter @fractweets 9
The Fiscal Cost of Low Participation
Low participation in the School Breakfast Program is costly
on many levels. Students miss out on the educational
and health benefits associated with eating school
breakfast, while states miss out on substantial federal
funding. Only two states met the Food Research & Action
Center’s challenging, but attainable, goal of reaching
70 low-income students with school breakfast for every
100 participating in school lunch, proving there is ample
opportunity for growth in many states.
For the District of Columbia and the 48 states that did
not meet this goal, the Food Research & Action Center
measures the number of additional children who would
have started the day ready to learn, as well as the
additional funding that the state would have received if it
had achieved this goal. In total, nearly $803.7 million was
left on the table in the 2016–2017 school year, with over 12
states each passing up more than $20 million in additional
federal funding. The three largest states — California,
Florida, and New York — together missed out on more
than $237 million.
School Participation
In 36 states, 90 percent or more of schools that operated
the National School Lunch Program offered school
breakfast in the 2016–2017 school year. The number
of schools offering breakfast, compared to lunch, is an
important indicator of access to the School Breakfast
Program and more work should be done to increase
breakfast service, especially in states with low school
participation in the School Breakfast Program.
Texas operated school breakfast programs in more
schools than the number of schools that ran school
lunch programs, resulting in a school breakfast-to-school
lunch program ratio of 100.2. In Arkansas, Delaware,
and South Carolina, almost all (99 percent or more)
schools that offered school lunch also offered school
breakfast in the 2016–2017 school year. Illinois,
Massachusetts, New Jersey, and Wisconsin were the
lowest performers in terms of school participation in the
School Breakfast Program — less than 84 percent of
schools that offered lunch also offered breakfast in the
2016–2017 school year.
Top 10 States for School Participation, School Year 2016–2017
Bottom 10 States for School Participation, School Year 2016–2017
StateRatio of Schools Offering
Breakfast to Schools Offering Lunch
Texas 100.2
Arkansas 99.9
South Carolina 99.8
Delaware 99.6
West Virginia 98.9
Florida 98.6
North Carolina 98.6
Maryland 98.6
Virginia 98.5
Rhode Island 98.4
StateRatio of Schools Offering
Breakfast to Schools Offering Lunch
Minnesota 87.7
Ohio 87.5
South Dakota 86.6
Connecticut 84.8
Nebraska 84.2
Colorado 84.1
Massachusetts 83.2
Illinois 83.0
New Jersey 81.4
Wisconsin 81.3

FRAC n School Breakfast Scorecard n www.FRAC.org n twitter @fractweets 10
In the 2016–2017 school year, the third year of its
nationwide availability, 20,751 schools and 3,538
school districts participated in community eligibility,
using this option to offer free breakfast and lunch to more
than 9.7 million children. This represents an increase of
2,500 schools and 1.2 million children, compared to the
prior school year. Now, more than half of all eligible schools
nationwide have adopted community eligibility, with
participation expected to grow further in the 2017–2018
school year, as more school districts fully understand
the provision and the benefits of adoption. Clearly
communicated policies from states on issues, such as
assuring continued state education funding, have mitigated
many districts’ concerns.
States where community eligibility was implemented
broadly have experienced high participation in the School
Breakfast Program. In the 2016–2017 school year, the six
states with the highest school breakfast participation were
among the top 15 states for the percentage of eligible
schools participating in community eligibility.
Since its initial rollout, best practices have been established
to ensure broad implementation of community eligibility
by high-poverty school districts. In addition, community
eligibility makes it easier for schools to implement
breakfast after the bell programs, so the two approaches
can combine to have a particularly dramatic impact on
breakfast participation. Advocates should continue to
work with local and state stakeholders to build support for
the provision, effectively communicating with all parties
to address issues that have thus far discouraged some
eligible schools and school districts from participating —
including challenges associated with the loss of
traditional school meal application data and low direct
certification rates.
Community Eligibility Continues to Grow
IV. Best Practices in the 2016–2017 School Year
StateRatio of Free and Reduced-Price
Students in School Breakfast per 100 in School Lunch
Schools Eligible for Community
Eligibility
Schools Adopting
Community Eligibility
Percentage of Eligible Schools Adopting
Community Eligibility
West Virginia 85.3 568 492 86.6
New Mexico 70.3 633 487 76.9
District of Columbia 67.7 172 160 93.0
Vermont 66.2 79 60 75.9
Kentucky 65 1,041 888 85.3
Top 5 States: Breakfast Participation and Community Eligibility Take-Up by Schools, School Year 2016–2017

FRAC n School Breakfast Scorecard n www.FRAC.org n twitter @fractweets 11
How Community Eligibility Works Authorized by the Healthy, Hunger-Free Kids Act of
2010, and phased in first in select states and then
nationwide, the Community Eligibility Provision allows
high-poverty schools to offer breakfast and lunch
free of charge to all students and to realize significant
administrative savings by eliminating school meal
applications. Any district, group of schools in a district,
or school with 40 percent or more “identified students”
— children who are eligible for free school meals who
already are identified by means other than an individual
household application — can choose to participate.
“Identified students” may be
n children who are directly certified for free school
meals through data matching because their
households receive SNAP, TANF, or FDPIR benefits
or, in some states, Medicaid benefits;
n children who are certified for free meals without an
application because they are homeless, migrant,
enrolled in Head Start, or in foster care.
Community eligibility schools are reimbursed for meals
served, based on a formula. Because of evidence that
the ratio of all eligible children-to-children in these
identified categories would be 1.6-to-1, Congress built
that into the formula. Reimbursements to the school are
calculated by multiplying the percentage of identified
students by 1.6 to determine the percentage of meals
that will be reimbursed at the federal free rate. For
example, a school with 50 percent identified students
would be reimbursed at the free rate for 80 percent
of the meals eaten (50 multiplied by 1.6 = 80), and 20
percent at the paid rate.
School districts also may choose to participate
districtwide or group schools however they choose if
the district or group has an overall identified student
percentage of 40 percent or higher.
Find out which schools in your state or community are
participating or eligible for the Community Eligibility
Provision with the Food Research & Action Center’s
database.
School Breakfast in Rural Schools
Access to school breakfast is critically important for every
student, including those living in rural areas. In 2016,
the national prevalence of food insecurity was higher
for households located in nonmetropolitan (rural) areas
(15 percent), compared to those in principal cities of
metropolitan areas (14.2 percent), and in suburbs or exurbs
and other metropolitan areas outside principal cities (9.5
percent).
The common barriers that typically contribute to low
breakfast participation are even more pronounced in
rural areas: long bus rides that do not allow for enough
time to eat before school; late bus arrivals; and the stigma
associated with the program, especially in small, close-knit
communities.
Due to funding uncertainty and lack of resources, many
rural districts in Colorado, Idaho, Montana, Oklahoma, and
Oregon have moved to a four-day school week to reduce
costs. The impact of this shift in educational outcomes is
unclear. For low-income families who depend on the Child
Nutrition Programs, this schedule change may impact
myriad resources — food at home will need to stretch
further to account for meals that were once consumed
at school. Additional child care can come at a price that
low-income families, who are already struggling to make
ends meet, may find it impossible to afford. Additionally,
four-day school weeks also mean longer school days
(typically an additional 30–90 minutes each day). For these
reasons, it is even more imperative for these schools to run
robust Child Nutrition Programs and ensure students eat
nutritious breakfasts and lunches, as well as afterschool
meals and snacks, every single school day.

FRAC n School Breakfast Scorecard n www.FRAC.org n twitter @fractweets 12
While schools in rural areas also may face special
challenges implementing a school breakfast program,
including limited administrative capacity; qualified staff;
dispersed student populations; limited food and supply
options; and aging or inadequate equipment and
infrastructures, there are proven strategies to address
each of these issues to ensure all students have access
to a nutritious morning meal. In fact, seven (Alabama,
Arkansas, Kentucky, Maine, Mississippi, Vermont, and West
Virginia) of the 10 most rural states in the country rank in
the top 20 for breakfast participation in the 2016–2017
school year.
Best practices, such as offering breakfast at no charge to
all students in high-poverty schools (potentially through
community eligibility), combined with a breakfast after the
The Every Student Succeeds Act (ESSA) was signed
into law in December 2015. The bill reauthorized the
Elementary and Secondary Education Act (ESEA),
replacing No Child Left Behind (NCLB), the bill that
reauthorized ESEA in 2001. ESSA was designed to bring
more decision-making back to state education agencies
and local education agencies (LEAs — more commonly
referred to as school districts), and to ensure that all
students are prepared for the future, academically
and professionally.
ESSA is focused on ensuring students succeed
academically, but it acknowledges that in order
to achieve those goals, the whole child must be
supported through collaboration, engagement, and
evidence-based programs. The School Breakfast
Program is linked to improved academic achievement
and test scores and reduced absenteeism, tardiness,
and behavioral referrals; it is an evidence-based
program that can help state agencies and school
districts meet the goals of ESSA.
ESSA requires every state to submit a state plan that
includes challenging academic standards; assessments
used to measure achievement based on the standards;
a state accountability system and metrics; and methods
to assess schools and subgroups of students within
schools to determine if they are in need of improvement
interventions. In the months after the state plan
development, school districts must develop — with
meaningful engagement from community members —
their own plans to meet their state plan’s broad goals.
This creates an important opportunity for stakeholders
to highlight the role that school breakfast (and lunch)
can play in supporting academic achievement.
Advocates should work with local and state education
partners to ensure that best practices to increase
participation in school breakfast (and lunch), such as
the adoption of community eligibility and breakfast
after the bell models, are included as evidenced-based
interventions to improve student outcomes. Additionally,
ESSA requires states and school districts to identify
how they will serve homeless students to ensure they
are properly identified and have access to a high-
quality education, including how homeless students
will have access to the school nutrition programs.
Advocates should work with districts to ensure that all
homeless students are certified for free school meals
automatically without the need to submit a school
meal application.
For more information on opportunities to increase
access to the child nutrition programs through ESSA,
visit FRAC’s website.
Opportunities to Increase School Breakfast Participation in the Every Student Succeeds Act

FRAC n School Breakfast Scorecard n www.FRAC.org n twitter @fractweets 13
bell model, address barriers, and, with proper planning
and stakeholder support, can be implemented in schools
and school districts of any size, regardless of location.
Some rural schools also have offered breakfast on the
bus as a way to nourish children during their long bus
rides to school.
Rural child nutrition programs can make an impact on
more than just the students; such programs can positively
affect communities, such as forming a partnership with
local farmers to procure and serve fresh, local produce
and food.
State School Breakfast Legislation
States with legislation focused on building strong school
breakfast programs continued to take the top-performing
spots in the 2016–2017 school year. Colorado, Nevada,
New Mexico, Texas, West Virginia, and the District of
Columbia all have implemented legislation that requires
all or some schools to operate breakfast after the bell
models or requires high-poverty schools to offer free
breakfast to all students or requires both approaches. In all
of these states, school breakfast participation dramatically
increased after the passage of state legislation and the
subsequent implementation of breakfast after the bell
models, which fueled these states to become — and
continue to be — top performers. Illinois also has passed
legislation, and schools there will start implementing
alternative models in the 2017–2018 school year.
In Nevada, the most recent state to implement breakfast
after the bell legislation, participation continues to grow
in the second year, with more schools being required
to implement breakfast after the bell models. In the
2015–2016 school year, the first year of implementation,
participation skyrocketed, with over 20,000 more students
eating school breakfast. The momentum continued in
the 2016–2017 school year, with over 13,000 additional
students eating breakfast. Since school year 2014–2015
(one school year before the legislation was implemented),
more than 34,600 additional students in Nevada now eat
school breakfast.
School breakfast legislation provides an important
opportunity to increase and expand school breakfast
participation, especially as growth in participation has
decelerated. Advocates and allies should work to create
policies that address the two main barriers to school
breakfast participation — timing and stigma. Legislation
that encourages schools to offer breakfast at no charge to
all students after the bell eliminates both of these barriers.
School breakfast legislation also can address concerns
regarding unpaid school meal debt.
For more information on state legislation and policy that
support school breakfast participation, refer to the Food
Research & Action Center’s School Meals Legislation and
Funding Chart.

FRAC n School Breakfast Scorecard n www.FRAC.org n twitter @fractweets 14
School breakfast legislation
provides an important opportunity to
increase and expand school breakfast
participation … Advocates and allies
should work to create policies that address
the two main barriers to school breakfast
participation — timing and stigma.
Unpaid School Meal Fee PoliciesIn 2016, the U.S. Department of Agriculture (USDA)
published guidance requiring all school districts
participating in the School Breakfast and National
School Lunch Programs to establish and clearly
communicate a local meal charge policy by July 1,
2017, for the 2017–2018 school year. A school district’s
policy guides schools on how to handle situations
when students who are not certified for free school
meals arrive in the cafeteria without cash in hand or
in their school meals account. The policy impacts two
categories of students: those who are not certified for
free or reduced-price school meals and are charged
the meal price set by the district; and those who are
certified for reduced-price school meals, and are
charged 30 cents per day for breakfast and 40 cents for
lunch.
USDA did not establish national standards for these
policies, nor set any baseline of protections for students
and their families, but all policies should prohibit
students from being singled out or embarrassed if they
are unable to pay for their school meal; require schools
to directly communicate with the parent or guardian —
not the students — about unpaid school meals debt;
take steps to qualify students for free or reduced-price
school meals, when they are eligible, if they have
unpaid school meals debt; and support a positive
school environment. Two best practices — offering free
breakfast to all students and eliminating the reduced-
price copay — can help dramatically reduce unpaid
school meal debt, while increasing school breakfast
participation.
States can develop a policy to be implemented by all
participating school districts or can provide guidelines
for school districts to create a policy that complies with
the state requirement. Over the past year, a number of
states, including California, New Mexico, and Oregon,
have passed legislation to require school districts in
their respective states to create policies that protect
children from stigma and ensure that eligible families
are certified for school meal benefits. States, such as
West Virginia, have established guidelines to protect
students from stigma (without passing state legislation)
that all school districts must follow when creating their
policy.
For more information on this issue, including model
policies, see FRAC’s guide: Establishing Unpaid Meal
Fee Policies: Best Practices to Ensure Access and
Prevent Stigma and FRAC’s Unpaid School Meal Fees:
A Review of 50 Large Districts.
FRAC n School Breakfast Scorecard n www.FRAC.org n twitter @fractweets 15
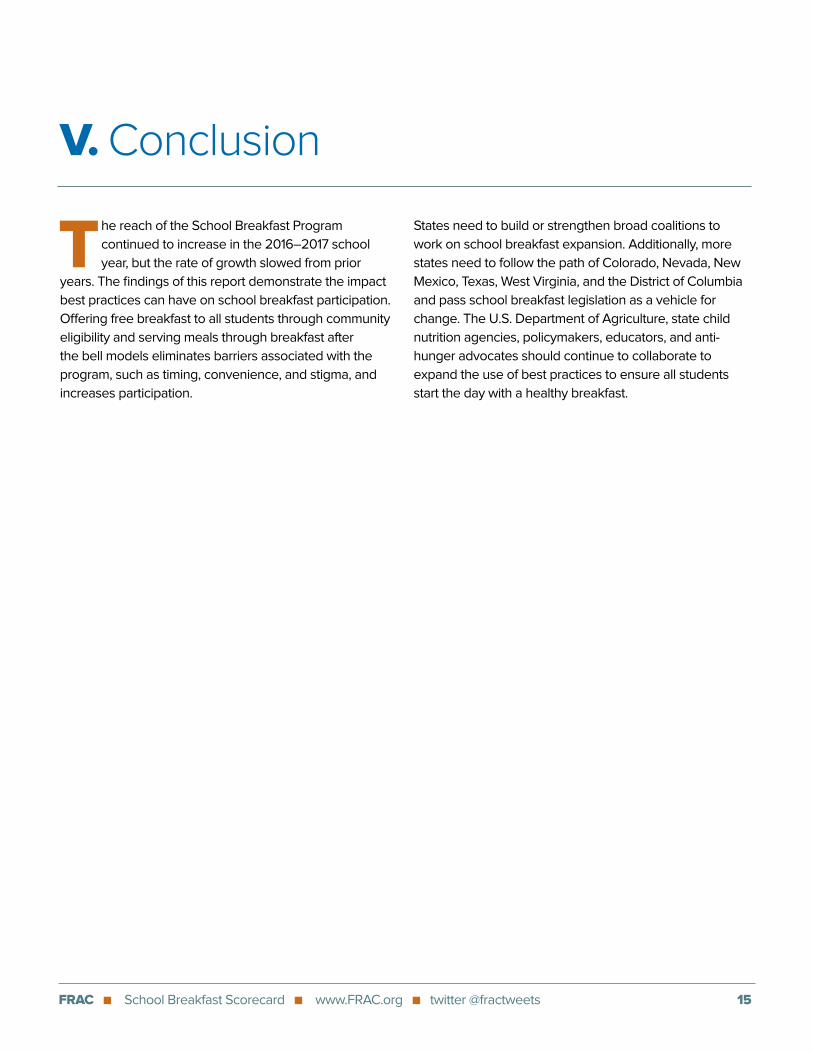
V. Conclusion
The reach of the School Breakfast Program
continued to increase in the 2016–2017 school
year, but the rate of growth slowed from prior
years. The findings of this report demonstrate the impact
best practices can have on school breakfast participation.
Offering free breakfast to all students through community
eligibility and serving meals through breakfast after
the bell models eliminates barriers associated with the
program, such as timing, convenience, and stigma, and
increases participation.
States need to build or strengthen broad coalitions to
work on school breakfast expansion. Additionally, more
states need to follow the path of Colorado, Nevada, New
Mexico, Texas, West Virginia, and the District of Columbia
and pass school breakfast legislation as a vehicle for
change. The U.S. Department of Agriculture, state child
nutrition agencies, policymakers, educators, and anti-
hunger advocates should continue to collaborate to
expand the use of best practices to ensure all students
start the day with a healthy breakfast.

FRAC n School Breakfast Scorecard n www.FRAC.org n twitter @fractweets 16
Technical Notes
The data in this report are collected from the U.S.
Department of Agriculture (USDA) and an annual survey
of state child nutrition officials conducted by the Food
Research & Action Center (FRAC). This report does not
include students or schools that participate in school meal
programs in Puerto Rico, Guam, the U.S. Virgin Islands, or
Department of Defense schools.
Due to rounding, totals in the tables may not add up
to 100 percent.
Student participation data for the 2016–2017 school year
and prior years are based on daily averages of the number
of breakfasts and lunches served during the nine months
from September through May of each year, as provided by
USDA. States report to USDA the number of meals they
serve each month. These numbers may undergo later
revisions by states as accounting procedures find errors
or other estimates become confirmed.
For consistency, all USDA data used in this report are from
the states’ 90-day revisions of the monthly reports. The
90-day revisions are the final required reports from the
states, but states have the option to change numbers at
any time after that point.
Based on information from USDA, FRAC applies a
formula (divide by 0.938 for 2016–2017 and 2015–2016)
to adjust numbers upwards as an attendance factor to
account for children who were absent from school on a
particular day.
The number of participating schools is reported by states
to USDA in October of the relevant school year. The
number includes not only public schools but also private
schools, residential child care institutions, and other
institutions that operate school meal programs. FRAC’s
School Breakfast Scorecard uses the October number,
which is verified by FRAC with state officials, and FRAC
provides an opportunity for state officials to update or
correct the school numbers.
For each state, FRAC calculates the average daily number
of children receiving free or reduced-price breakfasts for
every 100 children who were receiving free or reduced-
price lunches during the same school year. Based on
the top states’ performance, FRAC has set an attainable
benchmark of every state reaching a ratio of 70 children
receiving free or reduced-price breakfast for every
100 receiving free or reduced-price lunch. FRAC then
calculates the number of additional children who would be
reached if each state reached this 70-to-100 ratio. FRAC
multiplies this unserved population by the reimbursement
rate for breakfast for each state’s average number of
school days of breakfast during the 2016–2017 school
year. FRAC assumes each state’s mix of free and reduced-
price students would apply to any new participants, and
conservatively assumes that no additional student’s
meal is reimbursed at the somewhat higher rate that
severe need schools receive for breakfast. Severe need
schools are those where more than 40 percent of lunches
served in the second preceding school year were free or
reduced-price.

FRAC n School Breakfast Scorecard n www.FRAC.org n twitter @fractweets 17
School Year 2015–2016 School Year 2016–2017
Table 1: Low-Income Student Participation in School Lunch (NSLP) and School Breakfast (SBP),School Years 2015–2016 and 2016–2017
Free & Reduced-
Price (F&RP) SBP Students
Free & Reduced-
Price (F&RP) SBP Students
F&RP NSLP
Students
F&RP NSLP
Students
F&RP Students in SBP per 100
in NSLP
F&RP Students in SBP per 100
in NSLP
Percent Change in Number of F&RP Students
in SBP
Change in Ratio of SBP
to NSLP ParticipationRank Rank State
Alabama 229,658 396,936 57.9 21 229,439 386,178 59.4 18 1.6 -0.1%
Alaska 21,678 39,519 54.9 28 22,928 41,440 55.3 28 0.5 5.8%
Arizona 267,331 496,205 53.9 29 268,086 492,921 54.4 29 0.5 0.3%
Arkansas 155,102 244,295 63.5 7 154,518 242,035 63.8 8 0.4 -0.4%
California 1,457,976 2,620,828 55.6 27 1,450,307 2,576,452 56.3 26 0.7 -0.5%
Colorado 147,469 245,238 60.1 12 143,026 239,389 59.7 14 -0.4 -3.0%
Connecticut 87,405 170,023 51.4 33 88,192 171,061 51.6 38 0.1 0.9%
Delaware 41,038 66,712 61.5 11 41,664 66,865 62.3 12 0.8 1.5%
District of Columbia 31,956 47,396 67.4 3 30,523 45,075 67.7 3 0.3 -4.5%
Florida 713,159 1,412,090 50.5 37 728,594 1,426,719 51.1 39 0.6 2.2%
Georgia 552,290 937,730 58.9 16 554,479 928,128 59.7 15 0.8 0.4%
Hawaii 28,733 66,811 43.0 47 27,248 65,152 41.8 49 -1.2 -5.2%
Idaho 60,406 101,748 59.4 13 58,097 99,022 58.7 22 -0.7 -3.8%
Illinois 397,513 834,033 47.7 43 389,506 818,649 47.6 43 -0.1 -2.0%
Indiana 230,666 454,579 50.7 36 229,392 444,742 51.6 37 0.8 -0.6%
Iowa 80,783 183,782 44.0 46 80,318 183,490 43.8 47 -0.2 -0.6%
Kansas 98,672 199,981 49.3 40 98,412 196,011 50.2 40 0.9 -0.3%
Kentucky 268,501 418,362 64.2 6 276,057 424,420 65.0 5 0.9 2.8%
Louisiana 244,944 424,196 57.7 22 258,528 453,806 57.0 25 -0.8 5.5%
Maine 37,205 62,780 59.3 15 37,110 61,058 60.8 13 1.5 -0.3%
Maryland 204,388 318,138 64.2 5 199,501 315,029 63.3 9 -0.9 -2.4%
Massachusetts 167,206 338,138 49.4 39 180,347 342,232 52.7 33 3.2 7.9%
Michigan 335,506 577,101 58.1 20 330,360 556,922 59.3 20 1.2 -1.5%
Minnesota 154,415 290,611 53.1 31 156,144 289,594 53.9 30 0.8 1.1%
Mississippi 188,976 321,730 58.7 17 186,603 312,790 59.7 16 0.9 -1.3%
Missouri 228,397 385,156 59.3 14 223,891 375,718 59.6 17 0.3 -2.0%
Montana 26,161 49,357 53.0 32 25,951 49,923 52.0 34 -1.0 -0.8%
Nebraska 52,914 123,113 43.0 48 54,178 126,704 42.8 48 -0.2 2.4%
Nevada 103,197 184,083 56.1 25 116,267 182,056 63.9 7 7.8 12.7%
New Hampshire 15,977 39,069 40.9 50 15,273 37,158 41.1 50 0.2 -4.4%
New Jersey 267,756 456,695 58.6 19 270,008 454,598 59.4 19 0.8 0.8%
New Mexico 134,640 184,771 72.9 2 129,909 184,862 70.3 2 -2.6 -3.5%
New York 615,689 1,256,466 49.0 42 653,424 1,257,580 52.0 35 3.0 6.1%
North Carolina 398,591 694,359 57.4 23 398,711 682,885 58.4 24 1.0 0.0%
North Dakota 15,991 32,538 49.1 41 16,533 33,356 49.6 42 0.4 3.4%
Ohio 374,043 671,836 55.7 26 371,785 663,311 56.0 27 0.4 -0.6%
Oklahoma 191,994 326,981 58.7 18 190,522 326,178 58.4 23 -0.3 -0.8%
Oregon 121,386 227,160 53.4 30 117,784 218,970 53.8 31 0.4 -3.0%
Pennsylvania 326,395 659,969 49.5 38 336,229 672,588 50.0 41 0.5 3.0%
Rhode Island 27,829 54,262 51.3 34 28,288 53,577 52.8 32 1.5 1.7%
South Carolina 231,343 371,443 62.3 10 229,429 368,071 62.3 11 0.1 -0.8%
South Dakota 24,286 52,663 46.1 44 23,619 51,219 46.1 44 0.0 -2.7%
Tennessee 340,369 527,726 64.5 4 333,734 513,617 65.0 6 0.5 -1.9%
Texas 1,619,173 2,564,138 63.1 8 1,616,283 2,571,665 62.8 10 -0.3 -0.2%
Utah 65,246 171,095 38.1 51 66,981 169,314 39.6 51 1.4 2.7%
Vermont 17,331 27,642 62.7 9 18,038 27,260 66.2 4 3.5 4.1%
Virginia 248,045 441,165 56.2 24 259,288 437,401 59.3 21 3.1 4.5%
Washington 163,362 362,299 45.1 45 164,225 360,819 45.5 45 0.4 0.5%
West Virginia 111,724 133,241 83.9 1 118,360 138,828 85.3 1 1.4 5.9%
Wisconsin 153,208 300,006 51.1 35 149,522 289,257 51.7 36 0.6 -2.4%
Wyoming 11,264 26,353 42.7 49 11,600 26,402 43.9 46 1.2 3.0%
TOTAL 12,089,284 21,592,546 56.0 12,159,209 21,452,496 56.7 0.7 0.6%

FRAC n School Breakfast Scorecard n www.FRAC.org n twitter @fractweets 18
State
Alabama 1,439 1,473 97.7 15 1,437 1,478 97.2 14 -0.1 %
Alaska 382 437 87.4 40 387 436 88.8 41 1.3 %
Arizona 1,686 1,792 94.1 26 1,701 1,801 94.4 24 0.9 %
Arkansas 1,054 1,054 100.0 3 1,053 1,054 99.9 2 -0.1 %
California 8,987 9,998 89.9 36 8,880 9,967 89.1 39 -1.2 %
Colorado 1,441 1,724 83.6 45 1,455 1,730 84.1 47 1.0 %
Connecticut 871 1,065 81.8 49 886 1,045 84.8 45 1.7%
Delaware 259 263 98.5 11 263 264 99.6 4 1.5 %
District of Columbia 230 232 99.1 7 206 223 92.4 31 -10.4 %
Florida 3,729 3,810 97.9 14 3,783 3,835 98.6 6 1.4 %
Georgia 2,316 2,384 97.1 19 2,312 2,379 97.2 15 -0.2 %
Hawaii 294 295 99.7 5 285 292 97.6 13 -3.1 %
Idaho 657 688 95.5 23 669 698 95.8 18 1.8 %
Illinois 3,395 4,129 82.2 48 3,399 4,094 83.0 49 0.1 %
Indiana 1,930 2,127 90.7 34 1,945 2,142 90.8 36 0.8 %
Iowa 1,375 1,374 100.1 2 1,301 1,399 93.0 30 -5.4 %
Kansas 1,440 1,534 93.9 27 1,391 1,485 93.7 27 -3.4 %
Kentucky 1,391 1,391 100.0 3 1,294 1,359 95.2 21 -7.0 %
Louisiana 1,590 1,648 96.5 20 1,455 1,527 95.3 20 -8.5 %
Maine 589 614 95.9 21 594 616 96.4 16 0.8 %
Maryland 1,482 1,505 98.5 12 1,468 1,489 98.6 8 -0.9 %
Massachusetts 1,804 2,189 82.4 47 1,813 2,179 83.2 48 0.5 %
Michigan 3,041 3,372 90.2 35 3,050 3,331 91.6 32 0.3 %
Minnesota 1,837 2,114 86.9 43 1,765 2,013 87.7 42 -3.9 %
Mississippi 862 914 94.3 25 859 907 94.7 23 -0.3 %
Missouri 2,306 2,488 92.7 31 2,307 2,477 93.1 29 0.0 %
Montana 728 822 88.6 39 731 815 89.7 37 0.4 %
Nebraska 788 944 83.5 46 777 923 84.2 46 -1.4 %
Nevada 582 608 95.7 22 573 604 94.9 22 -1.5 %
New Hampshire 403 441 91.4 32 404 443 91.2 35 0.2 %
New Jersey 2,104 2,629 80.0 50 2,150 2,641 81.4 50 2.2 %
New Mexico 832 894 93.1 29 848 898 94.4 25 1.9 %
New York 5,714 6,131 93.2 28 5,623 5,997 93.8 26 -1.6 %
North Carolina 2,495 2,528 98.7 10 2,525 2,560 98.6 7 1.2 %
North Dakota 363 407 89.2 37 366 409 89.5 38 0.8 %
Ohio 3,197 3,670 87.1 41 3,208 3,665 87.5 43 0.3 %
Oklahoma 1,828 1,874 97.5 17 1,817 1,859 97.7 12 -0.6 %
Oregon 1,284 1,353 94.9 24 1,266 1,325 95.5 19 -1.4 %
Pennsylvania 3,213 3,690 87.1 42 3,170 3,476 91.2 34 -1.3 %
Rhode Island 349 358 97.5 18 369 375 98.4 10 5.7 %
South Carolina 1,183 1,189 99.5 6 1,190 1,192 99.8 3 0.6 %
South Dakota 703 820 85.7 44 738 852 86.6 44 5.0 %
Tennessee 1,770 1,800 98.3 13 1,758 1,788 98.3 11 -0.7 %
Texas 8,457 8,443 100.2 1 8,425 8,408 100.2 1 -0.4 %
Utah 848 957 88.6 38 853 961 88.8 40 0.6 %
Vermont 329 337 97.6 16 321 333 96.4 17 -2.4 %
Virginia 1,885 1,907 98.8 9 1,935 1,964 98.5 9 2.7 %
Washington 1,958 2,105 93.0 30 1,875 2,007 93.4 28 -4.2 %
West Virginia 712 720 98.9 8 730 738 98.9 5 2.5 %
Wisconsin 1,955 2,447 79.9 51 1,979 2,433 81.3 51 1.2 %
Wyoming 288 316 91.1 33 289 316 91.5 33 0.3 %
TOTAL 90,355 98,004 92.2 89,878 97,202 92.5 -0.5%
School Year 2015–2016 School Year 2016–2017
Table 2: School Participation in School Lunch (NSLP) and School Breakfast (SBP),School Years 2015–2016 and 2016–2017
SBP Schools
SBP Schools
NSLP Schools
NSLP Schools
SBP Schools as % of NSLP
Schools
SBP Schools as % of NSLP
Schools
Percent Change in Number of
SBP SchoolsRank Rank

FRAC n School Breakfast Scorecard n www.FRAC.org n twitter @fractweets 19
Free (F) SBP StudentsTotal F&RP
SBP StudentsReduced Price (RP)
SBP StudentsPaid SBP Students
Table 3: Average Daily Student Participation in School Breakfast Program (SBP),School Year 2016–2017
Number NumberNumber NumberPercent PercentPercent PercentTotal SBP Students State
Alabama 218,148 81.3% 11,291 4.2% 229,439 85.5% 39,025 14.5% 268,464
Alaska 21,813 82.8% 1,115 4.2% 22,928 87.1% 3,400 12.9% 26,328
Arizona 247,722 79.6% 20,364 6.5% 268,086 86.1% 43,189 13.9% 311,275
Arkansas 139,519 76.6% 14,999 8.2% 154,518 84.8% 27,631 15.2% 182,149
California 1,290,643 75.5% 159,665 9.3% 1,450,307 84.9% 258,354 15.1% 1,708,661
Colorado 124,032 68.4% 18,994 10.5% 143,026 78.9% 38,185 21.1% 181,211
Connecticut 84,194 81.5% 3,998 3.9% 88,192 85.3% 15,146 14.7% 103,338
Delaware 40,513 78.1% 1,150 2.2% 41,664 80.4% 10,186 19.6% 51,850
District of Columbia 30,173 87.6% 350 1.0% 30,523 88.6% 3,909 11.4% 34,432
Florida 692,833 83.1% 35,760 4.3% 728,594 87.4% 105,301 12.6% 833,894
Georgia 520,745 80.9% 33,734 5.2% 554,479 86.1% 89,467 13.9% 643,946
Hawaii 24,327 70.5% 2,921 8.5% 27,248 78.9% 7,275 21.1% 34,522
Idaho 51,334 65.8% 6,763 8.7% 58,097 74.4% 19,971 25.6% 78,068
Illinois 380,302 91.2% 9,204 2.2% 389,506 93.4% 27,614 6.6% 417,120
Indiana 209,636 75.1% 19,757 7.1% 229,392 82.2% 49,741 17.8% 279,133
Iowa 73,759 72.3% 6,559 6.4% 80,318 78.8% 21,658 21.2% 101,976
Kansas 86,967 73.2% 11,445 9.6% 98,412 82.9% 20,364 17.1% 118,775
Kentucky 272,338 88.5% 3,719 1.2% 276,057 89.7% 31,664 10.3% 307,721
Louisiana 253,214 90.5% 5,314 1.9% 258,528 92.4% 21,157 7.6% 279,685
Maine 33,251 67.1% 3,859 7.8% 37,110 74.8% 12,475 25.2% 49,585
Maryland 180,597 66.7% 18,905 7.0% 199,501 73.7% 71,326 26.3% 270,827
Massachusetts 175,605 87.4% 4,743 2.4% 180,347 89.7% 20,629 10.3% 200,976
Michigan 307,533 77.4% 22,827 5.7% 330,360 83.1% 66,982 16.9% 397,342
Minnesota 132,672 58.0% 23,472 10.3% 156,144 68.2% 72,709 31.8% 228,853
Mississippi 177,855 88.3% 8,749 4.3% 186,603 92.6% 14,917 7.4% 201,521
Missouri 204,043 72.8% 19,848 7.1% 223,891 79.9% 56,408 20.1% 280,300
Montana 23,928 71.9% 2,024 6.1% 25,951 77.9% 7,348 22.1% 33,299
Nebraska 46,586 61.4% 7,592 10.0% 54,178 71.4% 21,727 28.6% 75,905
Nevada 106,185 77.4% 10,082 7.3% 116,267 84.8% 20,915 15.2% 137,183
New Hampshire 13,771 66.4% 1,502 7.2% 15,273 73.7% 5,463 26.3% 20,736
New Jersey 252,145 78.0% 17,863 5.5% 270,008 83.6% 53,085 16.4% 323,093
New Mexico 126,003 84.8% 3,906 2.6% 129,909 87.5% 18,643 12.5% 148,552
New York 623,128 83.3% 30,296 4.1% 653,424 87.4% 94,457 12.6% 747,881
North Carolina 377,239 82.0% 21,472 4.7% 398,711 86.6% 61,454 13.4% 460,165
North Dakota 14,288 54.7% 2,245 8.6% 16,533 63.3% 9,598 36.7% 26,131
Ohio 350,953 79.3% 20,832 4.7% 371,785 84.0% 70,689 16.0% 442,474
Oklahoma 174,742 76.4% 15,781 6.9% 190,522 83.3% 38,150 16.7% 228,672
Oregon 108,561 75.9% 9,222 6.4% 117,784 82.4% 25,242 17.6% 143,026
Pennsylvania 325,715 84.2% 10,514 2.7% 336,229 87.0% 50,429 13.0% 386,658
Rhode Island 26,330 77.2% 1,958 5.7% 28,288 83.0% 5,804 17.0% 34,093
South Carolina 219,495 82.8% 9,934 3.7% 229,429 86.6% 35,503 13.4% 264,932
South Dakota 21,623 74.0% 1,996 6.8% 23,619 80.9% 5,590 19.1% 29,209
Tennessee 320,589 83.1% 13,144 3.4% 333,734 86.5% 51,934 13.5% 385,668
Texas 1,512,482 80.0% 103,801 5.5% 1,616,283 85.5% 274,181 14.5% 1,890,464
Utah 58,356 67.6% 8,625 10.0% 66,981 77.6% 19,368 22.4% 86,349
Vermont 15,940 65.8% 2,097 8.7% 18,038 74.5% 6,183 25.5% 24,221
Virginia 233,414 72.1% 25,873 8.0% 259,288 80.1% 64,548 19.9% 323,835
Washington 144,920 75.1% 19,305 10.0% 164,225 85.1% 28,758 14.9% 192,982
West Virginia 115,245 74.8% 3,115 2.0% 118,360 76.8% 35,718 23.2% 154,078
Wisconsin 139,640 74.4% 9,882 5.3% 149,522 79.7% 38,083 20.3% 187,605
Wyoming 9,656 62.3% 1,943 12.5% 11,600 74.8% 3,903 25.2% 15,503
TOTAL 11,334,700 79.0% 824,509 5.7% 12,159,209 84.7% 2,195,455 15.3% 14,354,664

FRAC n School Breakfast Scorecard n www.FRAC.org n twitter @fractweets 20
Actual Total Free & Reduced Price (F&RP)
SBP Students
Total F&RP Students if 70 SBP
per 100 NSLP
F&RP Students in SBP per 100
in NSLP
Additional F&RP Students if 70 SBP
per 100 NSLP
Additional Annual Funding if 70 SBP
per 100 NSLP F&RP Students
State
Alabama 229,439 59.4 270,325 40,885 $11,454,332
Alaska 22,928 55.3 29,008 6,080 $1,703,580
Arizona 268,086 54.4 345,045 76,959 $21,458,520
Arkansas 154,518 63.8 169,425 14,907 $4,140,944
California 1,450,307 56.3 1,803,516 353,209 $97,888,352
Colorado 143,026 59.7 167,572 24,547 $6,775,300
Connecticut 88,192 51.6 119,743 31,551 $8,845,330
Delaware 41,664 62.3 46,805 5,142 $1,445,945
District of Columbia 30,523 67.7 31,552 1,029 $290,337
Florida 728,594 51.1 998,703 270,109 $75,675,088
Georgia 554,479 59.7 649,690 95,211 $26,619,136
Hawaii 27,248 41.8 45,606 18,359 $5,090,560
Idaho 58,097 58.7 69,31 11,218 $3,105,518
Illinois 389,506 47.6 573,054 183,548 $51,655,264
Indiana 229,392 51.6 311,319 81,927 $22,802,572
Iowa 80,318 43.8 128,443 48,125 $13,405,232
Kansas 98,412 50.2 137,208 38,796 $10,739,940
Kentucky 276,057 65.0 297,094 21,037 $5,930,888
Louisiana 258,528 57.0 317,664 59,136 $16,651,560
Maine 37,110 60.8 42,740 5,631 $1,562,243
Maryland 199,501 63.3 220,521 21,019 $5,841,300
Massachusetts 180,347 52.7 239,563 59,215 $16,656,868
Michigan 330,360 59.3 389,846 59,486 $16,606,856
Minnesota 156,144 53.9 202,716 46,572 $12,814,004
Mississippi 186,603 59.7 218,953 32,349 $9,066,704
Missouri 223,891 59.6 263,003 39,111 $10,880,900
Montana 25,951 52.0 34,946 8,995 $2,507,168
Nebraska 54,178 42.8 88,693 34,515 $9,514,093
Nevada 116,267 63.9 127,439 11,172 $3,109,128
New Hampshire 15,273 41.1 26,010 10,737 $2,981,959
New Jersey 270,008 59.4 318,218 48,211 $13,466,080
New Mexico 129,909 70.3 129,403 goal met goal met
New York 653,424 52.0 880,306 226,881 $63,594,688
North Carolina 398,711 58.4 478,019 79,308 $22,200,664
North Dakota 16,533 49.6 23,349 6,816 $1,880,364
Ohio 371,785 56.0 464,318 92,533 $25,892,632
Oklahoma 190,522 58.4 228,325 37,802 $10,527,640
Oregon 117,784 53.8 153,279 35,495 $9,893,156
Pennsylvania 336,229 50.0 470,812 134,583 $37,824,200
Rhode Island 28,288 52.8 37,504 9,215 $2,572,628
South Carolina 229,429 62.3 257,650 28,221 $7,914,520
South Dakota 23,619 46.1 35,853 12,234 $3,406,079
Tennessee 333,734 65.0 359,532 25,799 $7,240,248
Texas 1,616,283 62.8 1,800,165 183,882 $51,379,296
Utah 66,981 39.6 118,520 51,539 $14,235,678
Vermont 18,038 66.2 19,082 1,044 $289,062
Virginia 259,288 59.3 306,181 46,893 $13,019,984
Washington 164,225 45.5 252,573 88,348 $24,452,184
West Virginia 118,360 85.3 97,180 goal met goal met
Wisconsin 149,522 51.7 202,480 52,958 $14,792,428
Wyoming 11,600 43.9 18,482 6,882 $1,887,580
TOTAL 12,159,209 56.7 15,016,747 2,879,225 $803,688,704
Table 4: Additional Participation and Funding if 70 Low-Income Students Were Served School Breakfast (SBP) Per 100 Served School Lunch (NSLP), School Year 2016–2017
Food Research & Action Center
1200 18th Street, NW
Suite 400
Washington, DC 20036
202.986.2200
ww.frac.org
@fractweets
@fracgram
facebook.com/ foodresearchandactioncenter
linkedin.com/company/ food-research-and-action-centerCopyright © 2018 Food Research & Action Center
Related Documents