SCBA Annual Convention Charleston Place June 7-9, 2015 Successful Acquirers, Sellers & Independents Belief Strength Purpose

Welcome message from author
This document is posted to help you gain knowledge. Please leave a comment to let me know what you think about it! Share it to your friends and learn new things together.
Transcript
SCBA Annual ConventionCharleston Place
June 7-9, 2015
Successful Acquirers, Sellers & Independents
Belief Strength Purpose
2
Disclosure StatementsThis presentation was prepared exclusively for the South Carolina Bankers Association Annual Convention (“SCBA Annual Convention”) and for the benefit and internal use of the SCBA Annual Convention attendees to whom it is directly addressed and delivered (including such attendee’s subsidiaries and affiliates, the “Attendees”) as an informational presentation and does not carry any right of publication or disclosure, in whole or in part, to any other party. This presentation is for discussion purposes only and is incomplete without reference to, and should be viewed solely in conjunction with, the oral briefing provided by Banks Street Partners, LLC (“BSP”). Neither this presentation nor any of its contents may be disclosed or used for any other purpose without the prior written consent of BSP.
The information in this presentation is based upon public information and industry research and reflects prevailing conditions and our views as of this date, all of which are accordingly subject to change. BSP’s opinions and estimates constitute BSP’s judgment and should be regarded as indicative, preliminary and for illustrative purposes only. In preparing this presentation, we have relied upon and assumed, without independent verification, the accuracy and completeness of all information available from public sources or industry research sources. Furthermore, BSP shall have no liability to any party for any errors or omissions that may be contained in this presentations. In addition, our analyses are not and do not purport to be appraisals of the assets, stock or business of any company, financial institution or any other entity. BSP makes no representations as to the actual value which may be paid or received in connection with any investment or other transaction nor the legal, tax or accounting effects of consummating any investment or other transaction.
For any discussion or analysis contained in this presentation that pertains to public companies (including the Attendees, if they are public companies), please note that past performance of such companies and their securities is not necessarily a guide to future performance and no representation or warranty, express or implied, is made by BSP with respect to future performance. The price or value of the securities analyzed, either directly or indirectly, may fall or rise against the interest of investors. Any recommendation or opinion contained in this report may become outdated as a consequence of changes in the environment in which the issuer of the securities under analysis operates, in addition to changes in the estimates and forecasts, assumptions and valuation methodology used herein.
IRS Circular 230 Disclosure: BSP and its affiliates do not provide tax advice. Accordingly, any discussion of U.S. tax matters included herein (including any attachments) is not intended or written to be used, and cannot be used, in connection with the promotion, marketing or recommendation by anyone not affiliated with BSP of any of the matters addressed herein or for the purpose of avoiding U.S. tax-related penalties.
This presentation is not to be considered a solicitation to buy or sell any securities and does not constitute a commitment by any BSP entity to underwrite, subscribe for or place any securities or to arrange credit or to provide any other services.
3
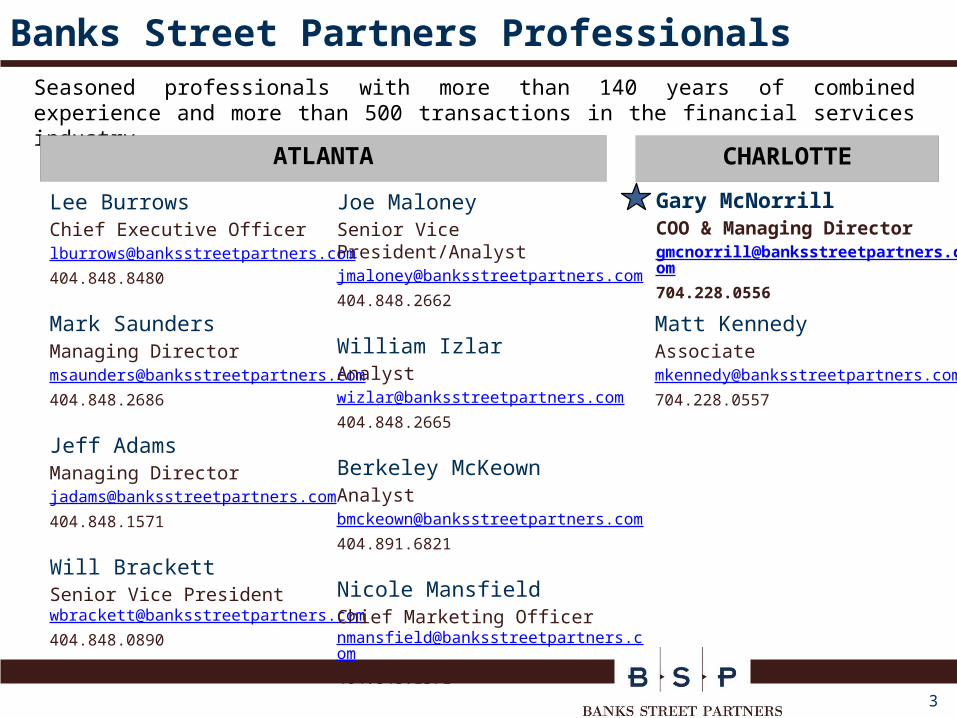
Banks Street Partners ProfessionalsSeasoned professionals with more than 140 years of combined experience and more than 500 transactions in the financial services industry
Lee BurrowsChief Executive [email protected]
Mark SaundersManaging [email protected]
Jeff AdamsManaging [email protected]
Will BrackettSenior Vice President [email protected]
Gary McNorrillCOO & Managing [email protected]
Joe MaloneySenior Vice President/[email protected]
William IzlarAnalyst [email protected]
Berkeley [email protected]
Nicole MansfieldChief Marketing Officer [email protected]
ATLANTA CHARLOTTE
Matt [email protected]
4
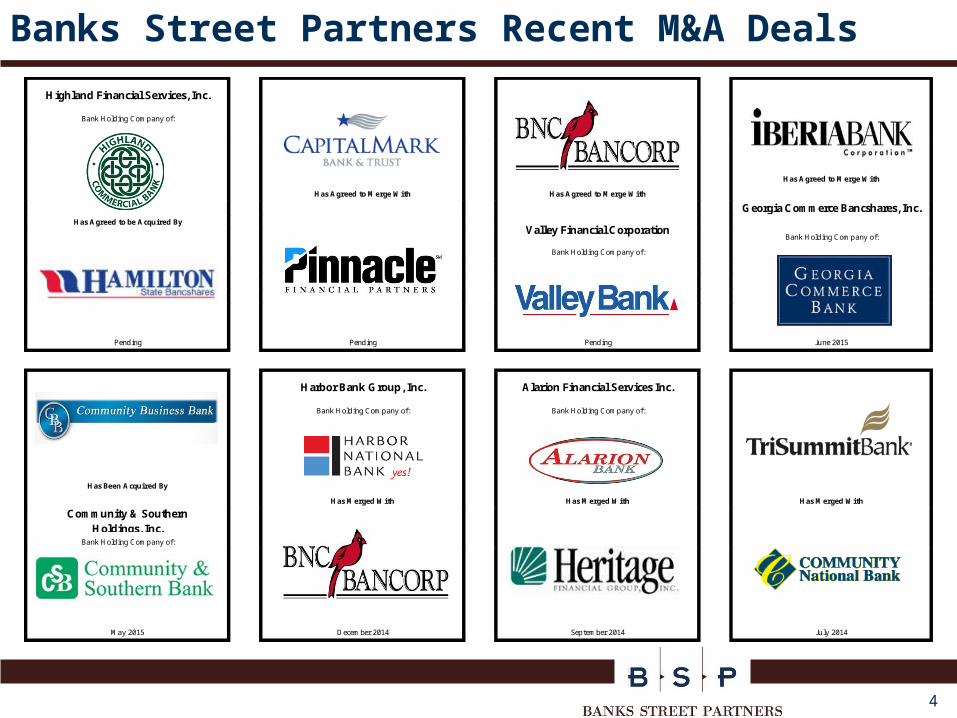
Banks Street Partners Recent M&A Deals
Has Merged With
December 2014
Has Agreed to Merge With
Pending
Harbor Bank Group, Inc.
Bank Holding Company of:
September 2014
Pending
Alarion Financial Services Inc.
Bank Holding Company of:
Has Merged With
Has Agreed to Merge With
Valley Financial Corporation
Bank Holding Company of:
July 2014
June 2015
Has Merged With
Has Agreed to Merge With
Georgia Commerce Bancshares, Inc.
Bank Holding Company of:
Community & SouthernHoldings, Inc.
Bank Holding Company of:
May 2015
Has Been Acquired By
Highland Financial Services, Inc.
Bank Holding Company of:
Has Agreed to be Acquired By
Pending
5
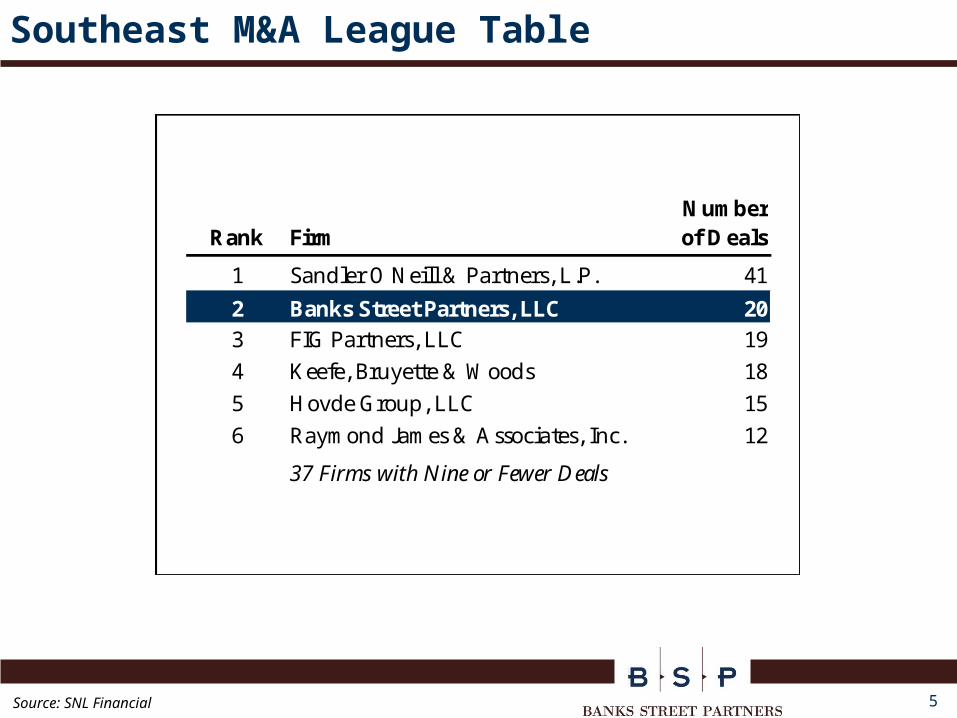
Southeast M&A League Table
Source: SNL Financial
Rank FirmNumber of Deals
1 Sandler O'Neill & Partners, L.P. 41
2 Banks Street Partners, LLC 203 FIG Partners, LLC 19
4 Keefe, Bruyette & Woods 18
5 Hovde Group, LLC 15
6 Raymond James & Associates, Inc. 12
37 Firms with Nine or Fewer Deals
Whole Bank, Branch and FDIC-assisted transactions announced between Jan. 1, 2013 and June, 1 2015 with the target located in either AL, FL, GA, NC, SC or TN
6
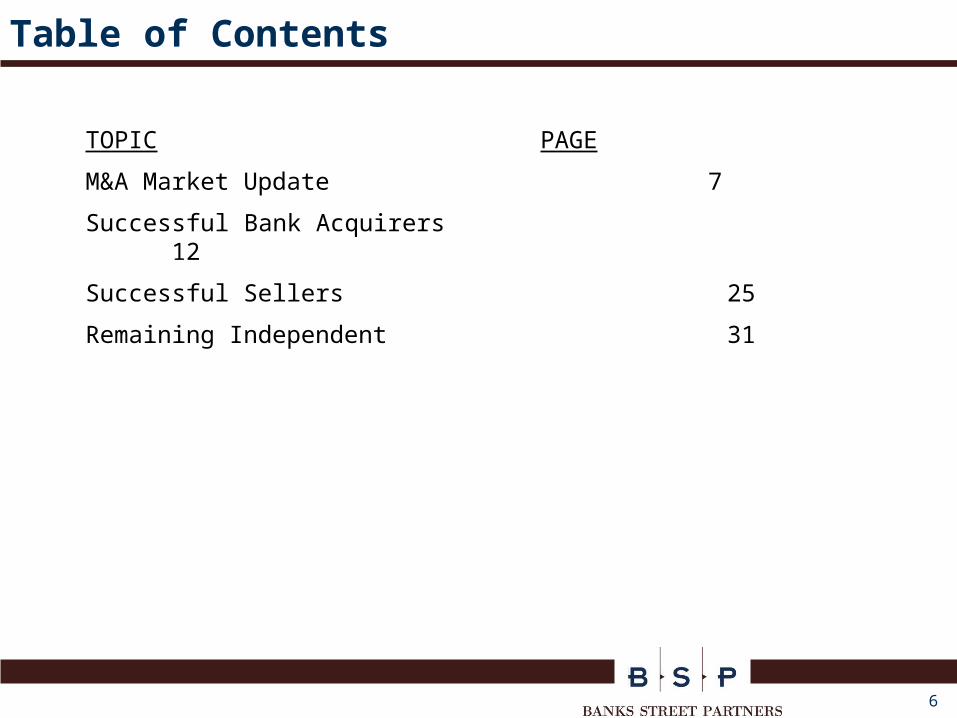
Table of Contents
TOPIC PAGE
M&A Market Update 7
Successful Bank Acquirers 12
Successful Sellers 25
Remaining Independent 31
M&A Market Update
8
-
5
10
15
20
25
30
-
50
100
150
200
250
300
2006 2007 2008 2009 2010 2011 2012 2013 2014 2015
Median Deal Value/ TCE (%) Median Deal Value/ Earnings (x)
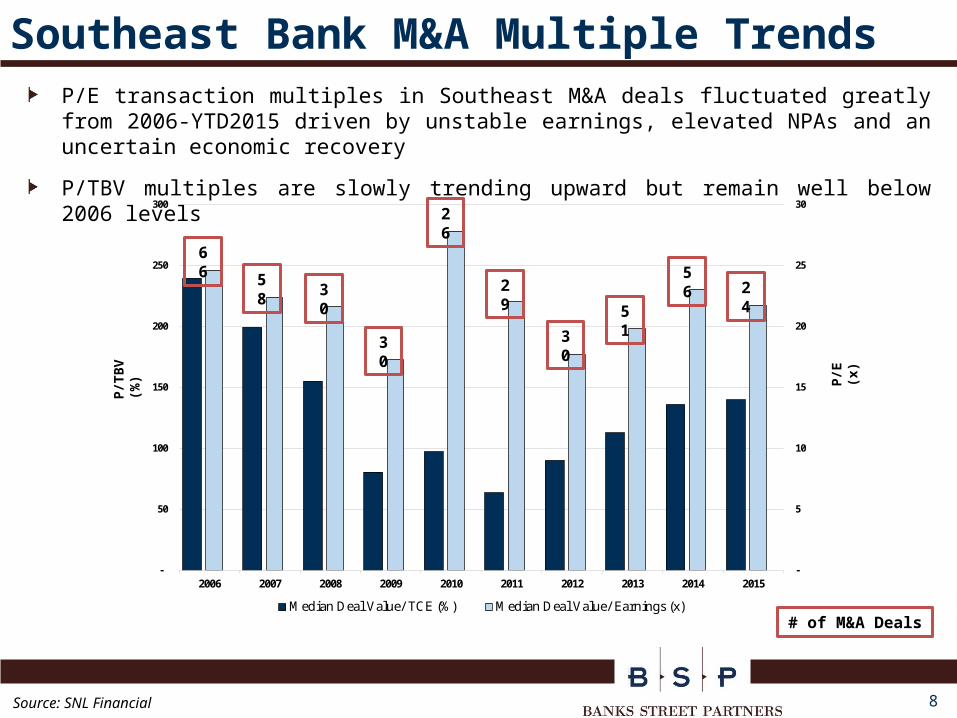
Southeast Bank M&A Multiple TrendsP/E transaction multiples in Southeast M&A deals fluctuated greatly from 2006-YTD2015 driven by unstable earnings, elevated NPAs and an uncertain economic recovery
P/TBV multiples are slowly trending upward but remain well below 2006 levels
66
# of M&A Deals
58 3
0
30
26
29
30
51
56 2
4
Source: SNL Financial
P/T
BV
(%
) P/E
(x
)
9
-
5
10
15
20
25
30
35
40
45
40
60
80
100
120
140
160
National Southeast Mid-Atlantic Northeast Midwest Southwest West
LTM Transaction Multiples by Region
P/TBV P/E
-
5
10
15
20
25
30
35
40
45
40
60
80
100
120
140
160
180
LTM Transaction Multiples by State
P/TBV P/E
M&A Activity by Region and State
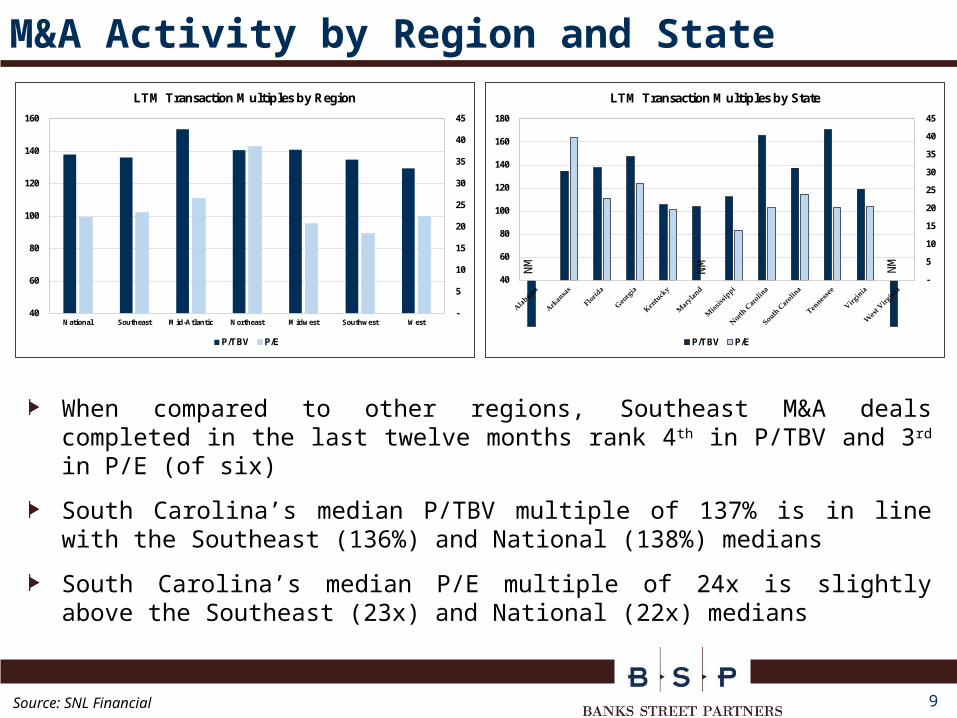
When compared to other regions, Southeast M&A deals completed in the last twelve months rank 4th in P/TBV and 3rd in P/E (of six)
South Carolina’s median P/TBV multiple of 137% is in line with the Southeast (136%) and National (138%) medians
South Carolina’s median P/E multiple of 24x is slightly above the Southeast (23x) and National (22x) medians
N M N M N M
Source: SNL Financial
10
M&A Pricing (Population & Asset Size)
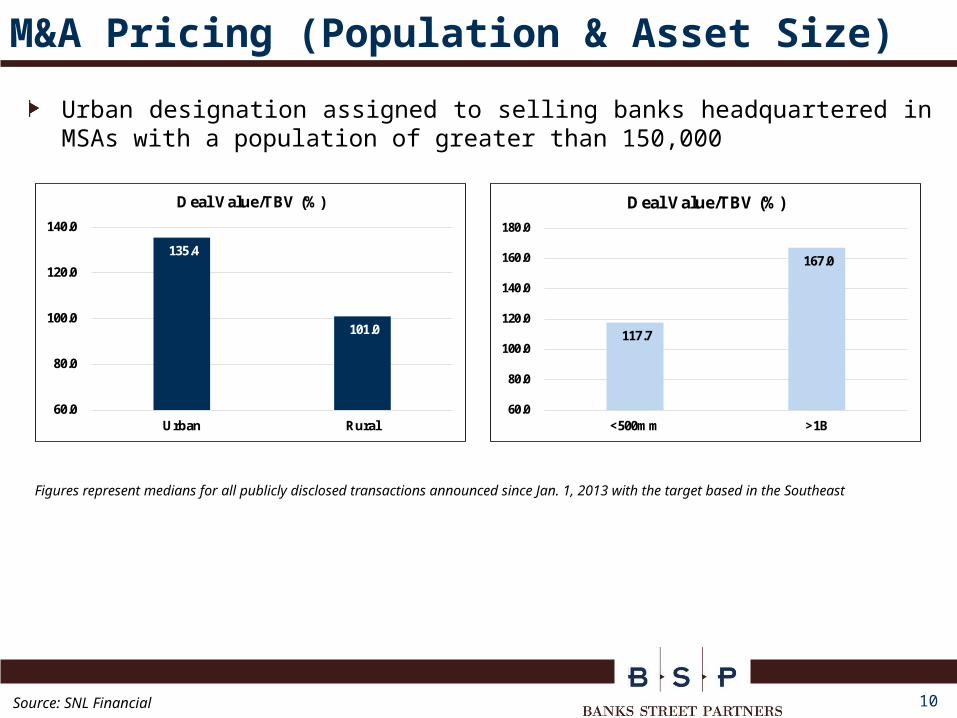
Urban designation assigned to selling banks headquartered in MSAs with a population of greater than 150,000
Figures represent medians for all publicly disclosed transactions announced since Jan. 1, 2013 with the target based in the Southeast
135.4
101.0
60.0
80.0
100.0
120.0
140.0
Urban Rural
Deal Value/TBV (%)
Source: SNL Financial
117.7
167.0
60.0
80.0
100.0
120.0
140.0
160.0
180.0
<500mm >1B
Deal Value/TBV (%)
11
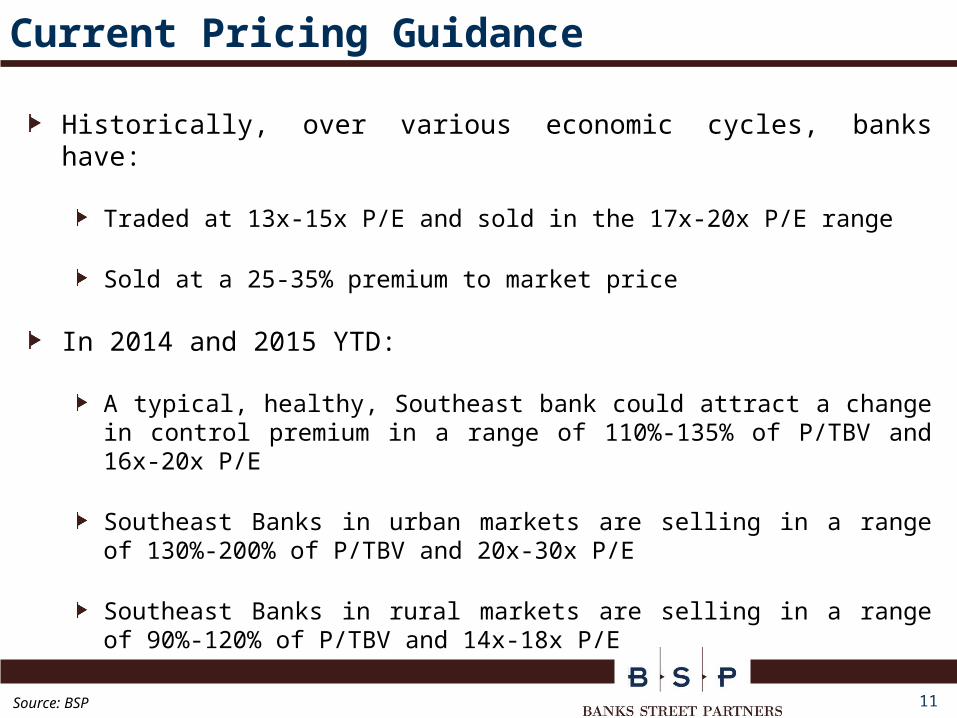
Current Pricing Guidance
Historically, over various economic cycles, banks have:
Traded at 13x-15x P/E and sold in the 17x-20x P/E range
Sold at a 25-35% premium to market price
In 2014 and 2015 YTD:
A typical, healthy, Southeast bank could attract a change in control premium in a range of 110%-135% of P/TBV and 16x-20x P/E
Southeast Banks in urban markets are selling in a range of 130%-200% of P/TBV and 20x-30x P/E
Southeast Banks in rural markets are selling in a range of 90%-120% of P/TBV and 14x-18x P/E
Source: BSP
Successful Bank Acquirers

13
Is There a Difference?
Source: The New Yorker
14
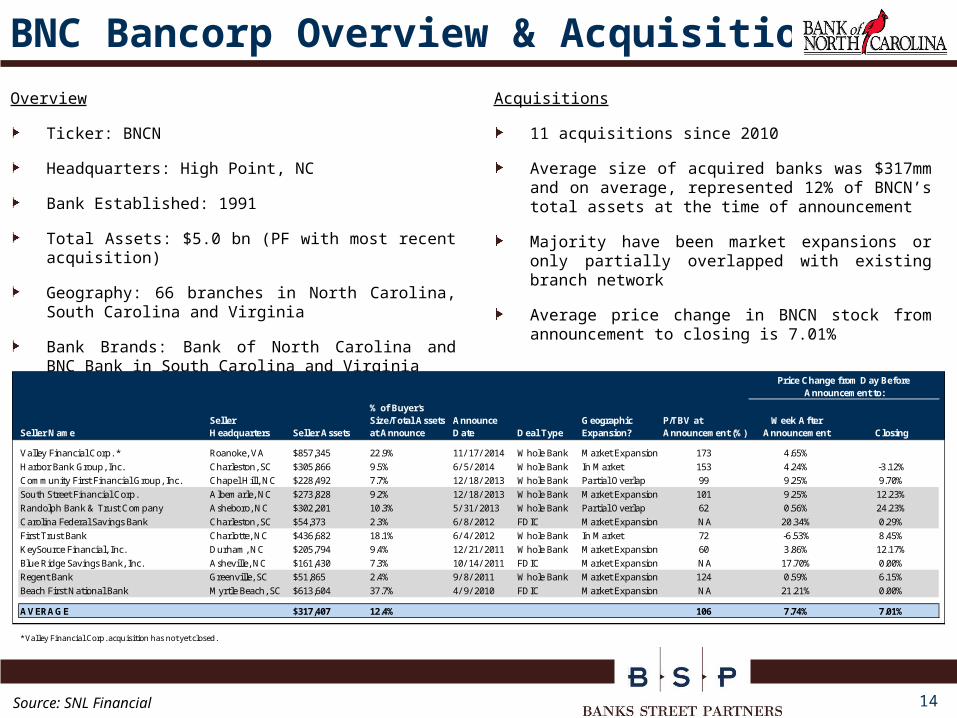
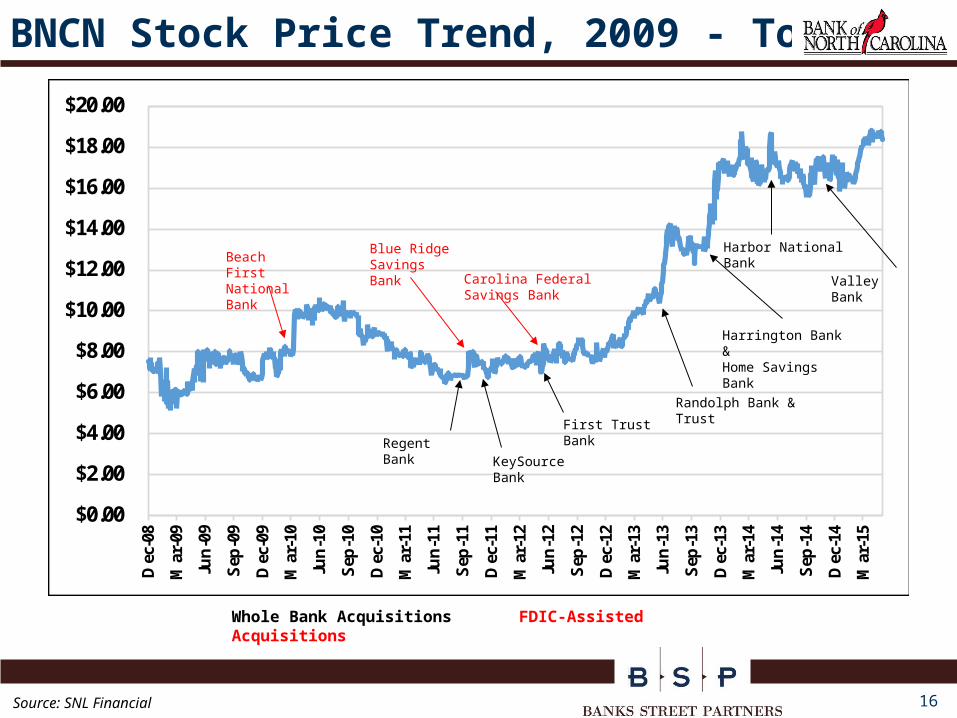
BNC Bancorp Overview & AcquisitionsAcquisitions
11 acquisitions since 2010
Average size of acquired banks was $317mm and on average, represented 12% of BNCN’s total assets at the time of announcement
Majority have been market expansions or only partially overlapped with existing branch network
Average price change in BNCN stock from announcement to closing is 7.01%
Overview
Ticker: BNCN
Headquarters: High Point, NC
Bank Established: 1991
Total Assets: $5.0 bn (PF with most recent acquisition)
Geography: 66 branches in North Carolina, South Carolina and Virginia
Bank Brands: Bank of North Carolina and BNC Bank in South Carolina and Virginia
Source: SNL Financial
Seller NameSeller Headquarters Seller Assets
% of Buyer's Size/Total Assets at Announce
Announce Date Deal Type
Geographic Expansion?
P/TBV at Announcement (%)
Week After Announcement Closing
Valley Financial Corp. * Roanoke, VA $857,345 22.9% 11/ 17/ 2014 Whole Bank Market Expansion 173 4.65%
Harbor Bank Group, Inc. Charleston, SC $305,866 9.5% 6/ 5/ 2014 Whole Bank In Market 153 4.24% -3.12%
Community First Financial Group, Inc. Chapel Hill, NC $228,492 7.7% 12/ 18/ 2013 Whole Bank Partial Overlap 99 9.25% 9.70%
South Street Financial Corp. Albemarle, NC $273,828 9.2% 12/ 18/ 2013 Whole Bank Market Expansion 101 9.25% 12.23%
Randolph Bank & Trust Company Asheboro, NC $302,201 10.3% 5/ 31/ 2013 Whole Bank Partial Overlap 62 0.56% 24.23%
Carolina Federal Savings Bank Charleston, SC $54,373 2.3% 6/ 8/ 2012 FDIC Market Expansion NA 20.34% 0.29%
First Trust Bank Charlotte, NC $436,682 18.1% 6/ 4/ 2012 Whole Bank In Market 72 -6.53% 8.45%
KeySource Financial, Inc. Durham, NC $205,794 9.4% 12/ 21/ 2011 Whole Bank Market Expansion 60 3.86% 12.17%
Blue Ridge Savings Bank, Inc. Asheville, NC $161,430 7.3% 10/ 14/ 2011 FDIC Market Expansion NA 17.70% 0.00%
Regent Bank Greenville, SC $51,865 2.4% 9/ 8/ 2011 Whole Bank Market Expansion 124 0.59% 6.15%
Beach First National Bank Myrtle Beach, SC $613,604 37.7% 4/ 9/ 2010 FDIC Market Expansion NA 21.21% 0.00%
AVERAGE $317,407 12.4% 106 7.74% 7.01%
* Valley Financial Corp. acquisition has not yet closed.
Price Change from Day Before Announcement to:
15
BNC Bancorp Acquisition Map
• Legacy BNCN
• Beach First
• Regent Bank
• Blue Ridge Savings Bank
• KeySource
• First Trust
• Carolina Federal
• Randolph Bank & Trust
• South Street
• Community First
• Harbor
• Valley Financial
• Hampton Roads*
• Certus*
*Branch Acquisition
Sources: SNL Financial, ESRI
16
$0.00
$2.00
$4.00
$6.00
$8.00
$10.00
$12.00
$14.00
$16.00
$18.00
$20.00
Dec
-08
Mar
-09
Jun-0
9
Sep
-09
Dec
-09
Mar
-10
Jun-1
0
Sep
-10
Dec
-10
Mar
-11
Jun-1
1
Sep
-11
Dec
-11
Mar
-12
Jun-1
2
Sep
-12
Dec
-12
Mar
-13
Jun-1
3
Sep
-13
Dec
-13
Mar
-14
Jun-1
4
Sep
-14
Dec
-14
Mar
-15
BNCN Stock Price Trend, 2009 - Today
Harbor National Bank
Harrington Bank &Home Savings Bank
Whole Bank Acquisitions FDIC-Assisted Acquisitions
Randolph Bank & TrustFirst Trust
Bank
KeySource Bank
Regent Bank
Carolina Federal Savings Bank
Blue Ridge Savings Bank
Beach First National Bank
Source: SNL Financial
Valley Bank

17
BNC Bancorp Key Strengths
Took advantage of the financial upside associated with FDIC-assisted deals
Able to acquire even when their stock was trading at a discount to book value
All but 3 whole bank transactions were priced at or below book value at time of announcement
Strong corporate culture
Take care of management teams
Currency caught up to culture and M&A expertise
All but two transactions negotiated without auction process
Source: BSP
18
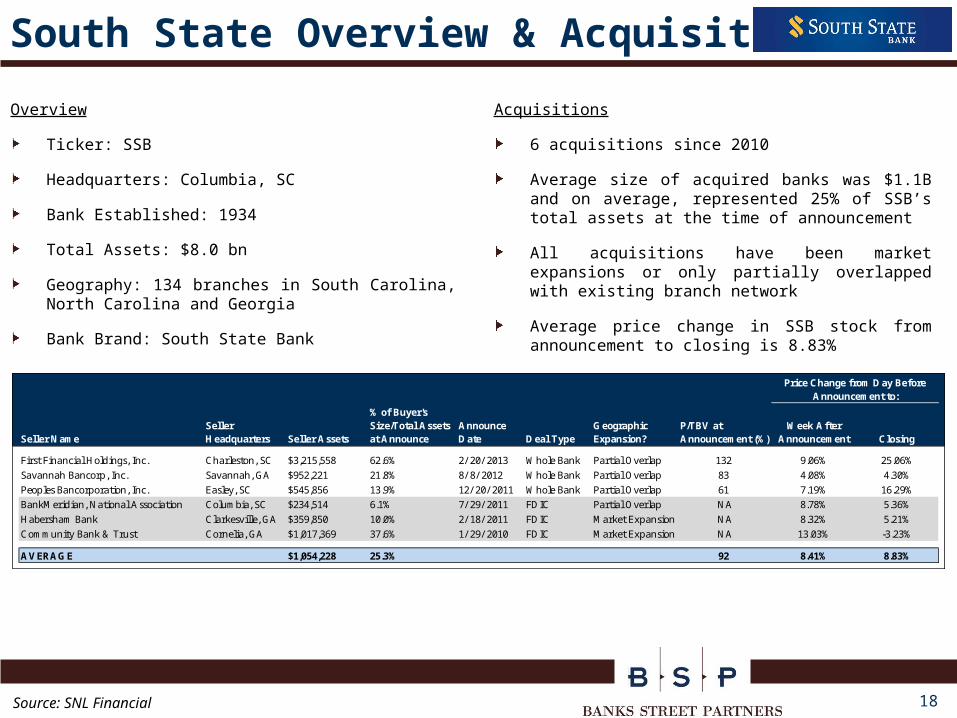
South State Overview & Acquisitions
Acquisitions
6 acquisitions since 2010
Average size of acquired banks was $1.1B and on average, represented 25% of SSB’s total assets at the time of announcement
All acquisitions have been market expansions or only partially overlapped with existing branch network
Average price change in SSB stock from announcement to closing is 8.83%
Overview
Ticker: SSB
Headquarters: Columbia, SC
Bank Established: 1934
Total Assets: $8.0 bn
Geography: 134 branches in South Carolina, North Carolina and Georgia
Bank Brand: South State Bank
Source: SNL Financial
Seller NameSeller Headquarters Seller Assets
% of Buyer's Size/Total Assets at Announce
Announce Date Deal Type
Geographic Expansion?
P/TBV at Announcement (%)
Week After Announcement Closing
First Financial Holdings, Inc. Charleston, SC $3,215,558 62.6% 2/ 20/ 2013 Whole Bank Partial Overlap 132 9.06% 25.06%
Savannah Bancorp, Inc. Savannah, GA $952,221 21.8% 8/ 8/ 2012 Whole Bank Partial Overlap 83 4.08% 4.30%
Peoples Bancorporation, Inc. Easley, SC $545,856 13.9% 12/ 20/ 2011 Whole Bank Partial Overlap 61 7.19% 16.29%
BankMeridian, National Association Columbia, SC $234,514 6.1% 7/ 29/ 2011 FDIC Partial Overlap NA 8.78% 5.36%
Habersham Bank Clarkesville, GA $359,850 10.0% 2/ 18/ 2011 FDIC Market Expansion NA 8.32% 5.21%
Community Bank & Trust Cornelia, GA $1,017,369 37.6% 1/ 29/ 2010 FDIC Market Expansion NA 13.03% -3.23%
AVERAGE $1,054,228 25.3% 92 8.41% 8.83%
Price Change from Day Before Announcement to:
19
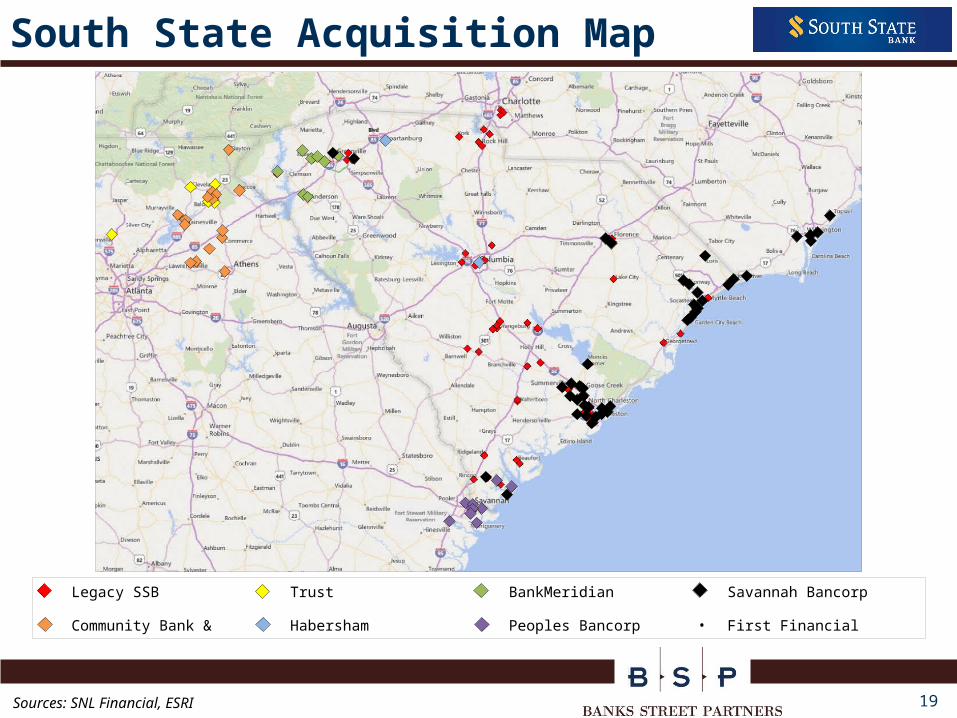
South State Acquisition Map
• Legacy SSB
• Community Bank & Trust
• Habersham
• BankMeridian
• Peoples Bancorp
• Savannah Bancorp
• First Financial
Sources: SNL Financial, ESRI
20
$0.00
$10.00
$20.00
$30.00
$40.00
$50.00
$60.00
$70.00
$80.00
Dec
-08
Mar
-09
Jun-0
9
Sep
-09
Dec
-09
Mar
-10
Jun-1
0
Sep
-10
Dec
-10
Mar
-11
Jun-1
1
Sep
-11
Dec
-11
Mar
-12
Jun-1
2
Sep
-12
Dec
-12
Mar
-13
Jun-1
3
Sep
-13
Dec
-13
Mar
-14
Jun-1
4
Sep
-14
Dec
-14
Mar
-15
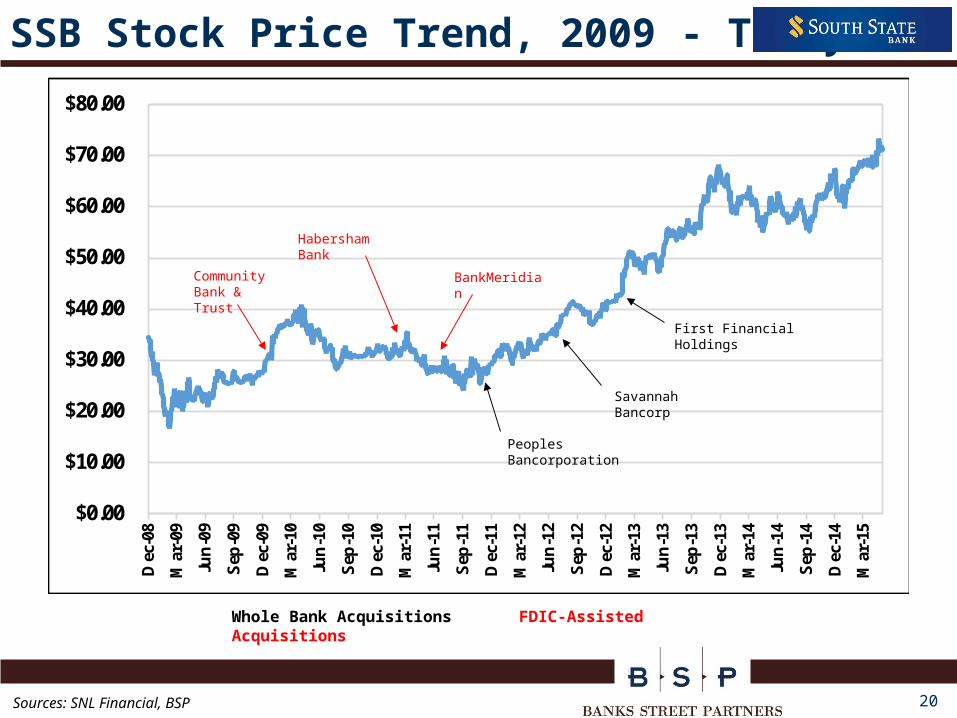
SSB Stock Price Trend, 2009 - Today
Whole Bank Acquisitions FDIC-Assisted Acquisitions
First Financial Holdings
Savannah Bancorp
Peoples Bancorporation
BankMeridian
Habersham Bank
Community Bank & Trust
Sources: SNL Financial, BSP
21
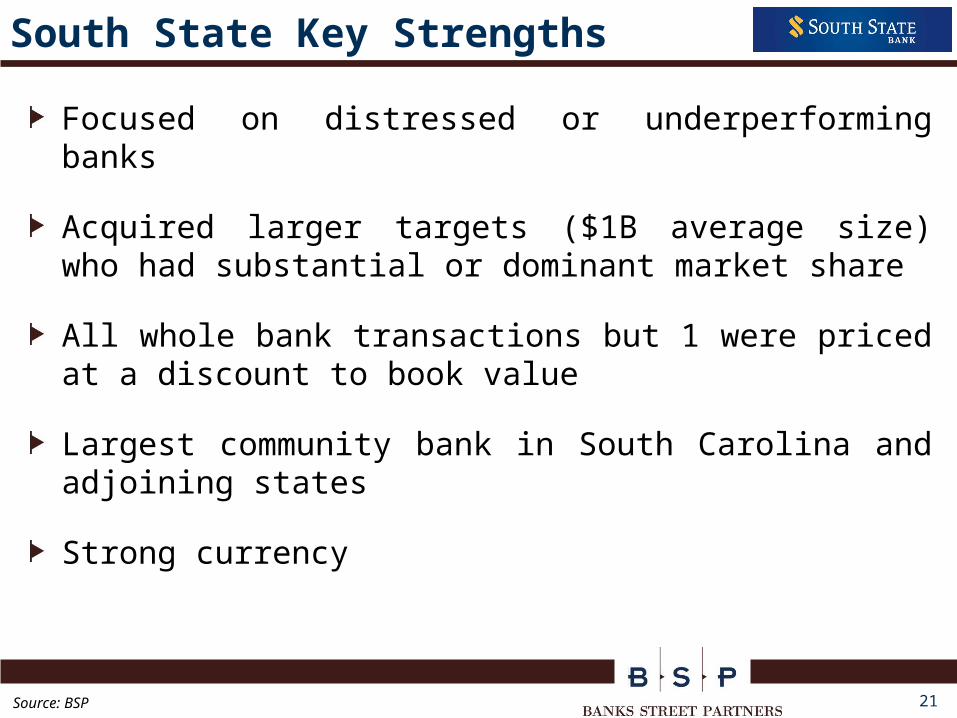
South State Key Strengths
Focused on distressed or underperforming banks
Acquired larger targets ($1B average size) who had substantial or dominant market share
All whole bank transactions but 1 were priced at a discount to book value
Largest community bank in South Carolina and adjoining states
Strong currency
Source: BSP
22
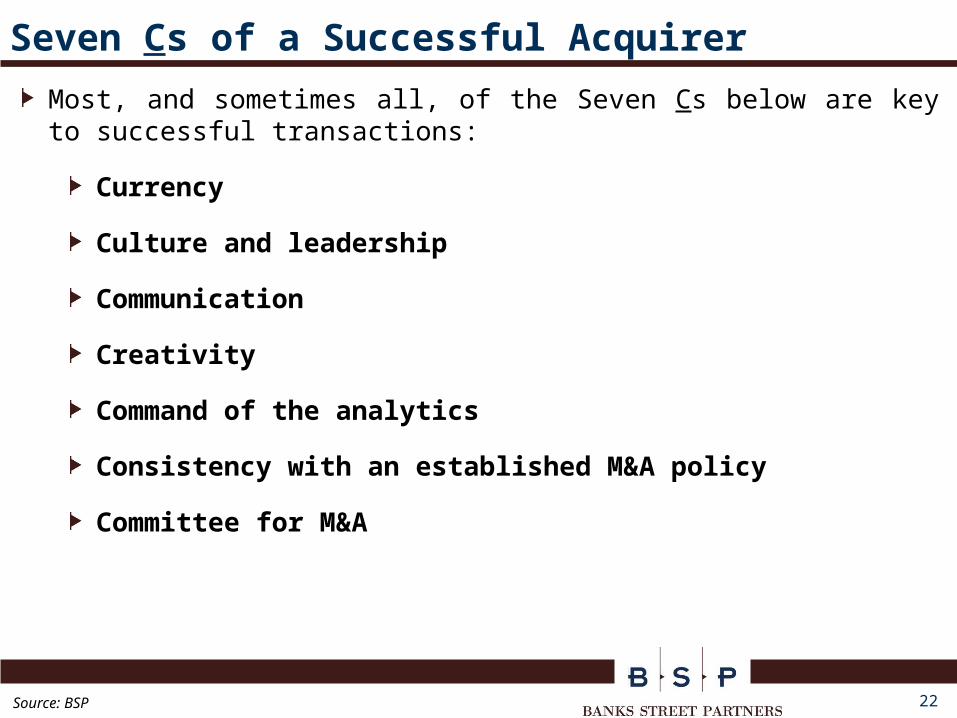
Seven Cs of a Successful Acquirer
Most, and sometimes all, of the Seven Cs below are key to successful transactions:
Currency
Culture and leadership
Communication
Creativity
Command of the analytics
Consistency with an established M&A policy
Committee for M&A
Source: BSP
23
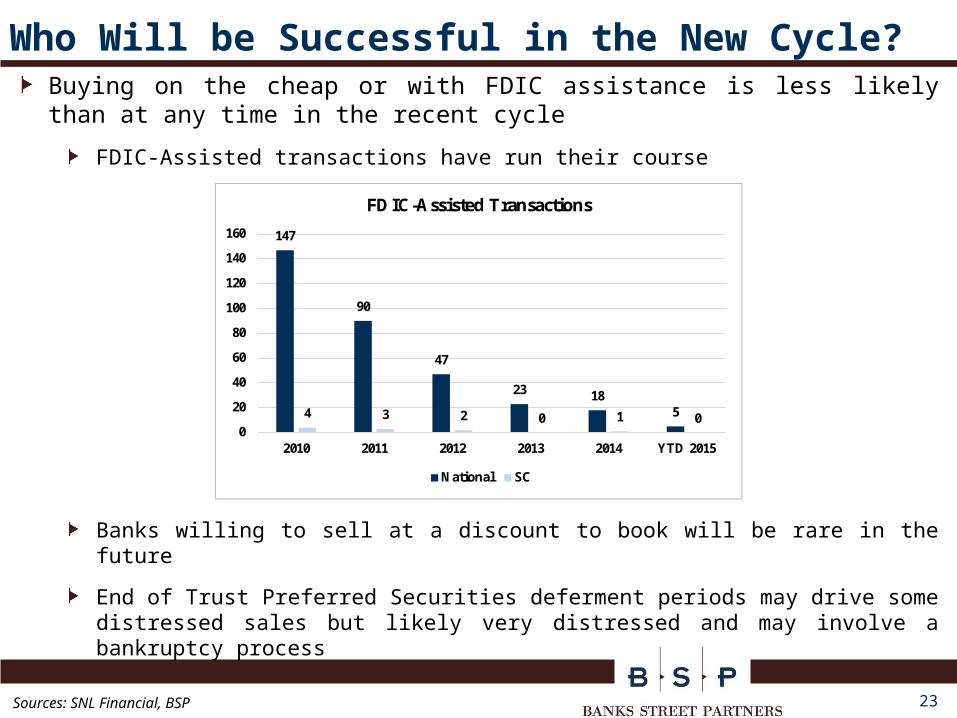
Who Will be Successful in the New Cycle?Buying on the cheap or with FDIC assistance is less likely than at any time in the recent cycle
FDIC-Assisted transactions have run their course
Banks willing to sell at a discount to book will be rare in the future
End of Trust Preferred Securities deferment periods may drive some distressed sales but likely very distressed and may involve a bankruptcy process
Sources: SNL Financial, BSP
147
90
47
23 1854 3 2 0 1 0
0
20
40
60
80
100
120
140
160
2010 2011 2012 2013 2014 YTD 2015
FDIC-Assisted Transactions
National SC
24
Who Will be Successful in the New Cycle? (cont.)
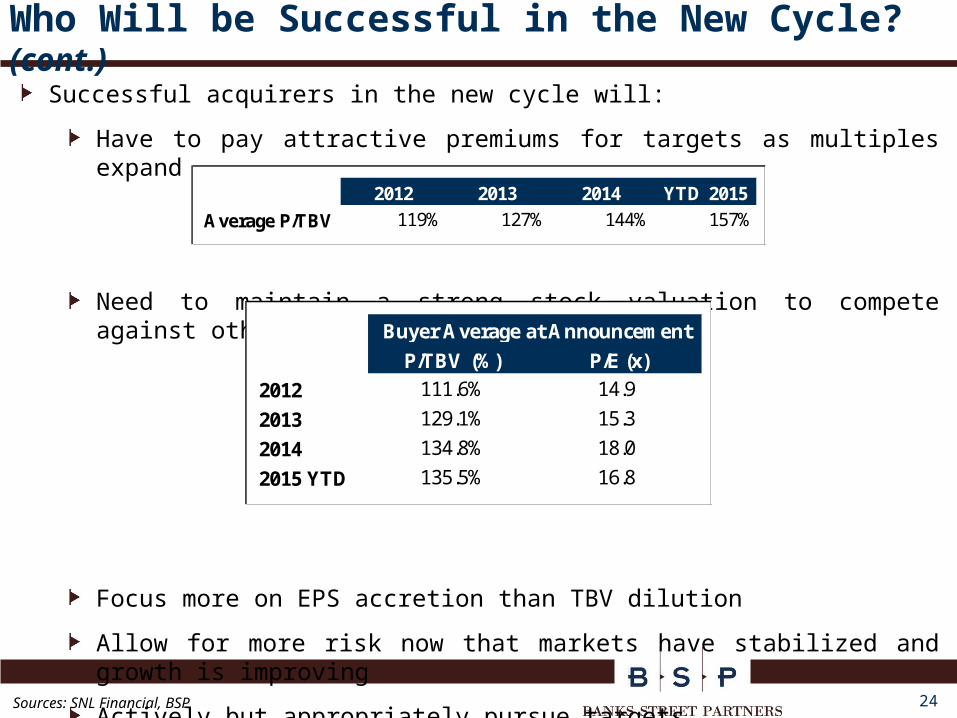
Successful acquirers in the new cycle will:
Have to pay attractive premiums for targets as multiples expand
Need to maintain a strong stock valuation to compete against other acquirers
Focus more on EPS accretion than TBV dilution
Allow for more risk now that markets have stabilized and growth is improving
Actively but appropriately pursue targetsSources: SNL Financial, BSP
2012 2013 2014 YTD 2015
Average P/TBV 119% 127% 144% 157%
P/TBV (%) P/E (x)
2012 111.6% 14.9
2013 129.1% 15.3
2014 134.8% 18.0
2015 YTD 135.5% 16.8
Buyer Average at Announcement
Successful Sellers
26
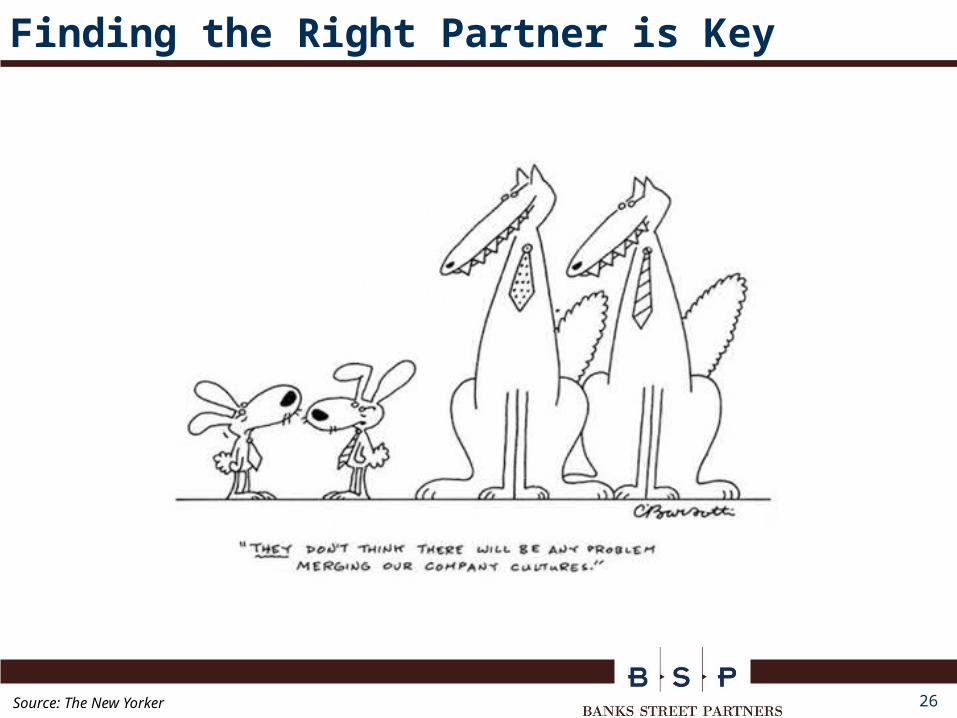
Finding the Right Partner is Key
Source: The New Yorker
27
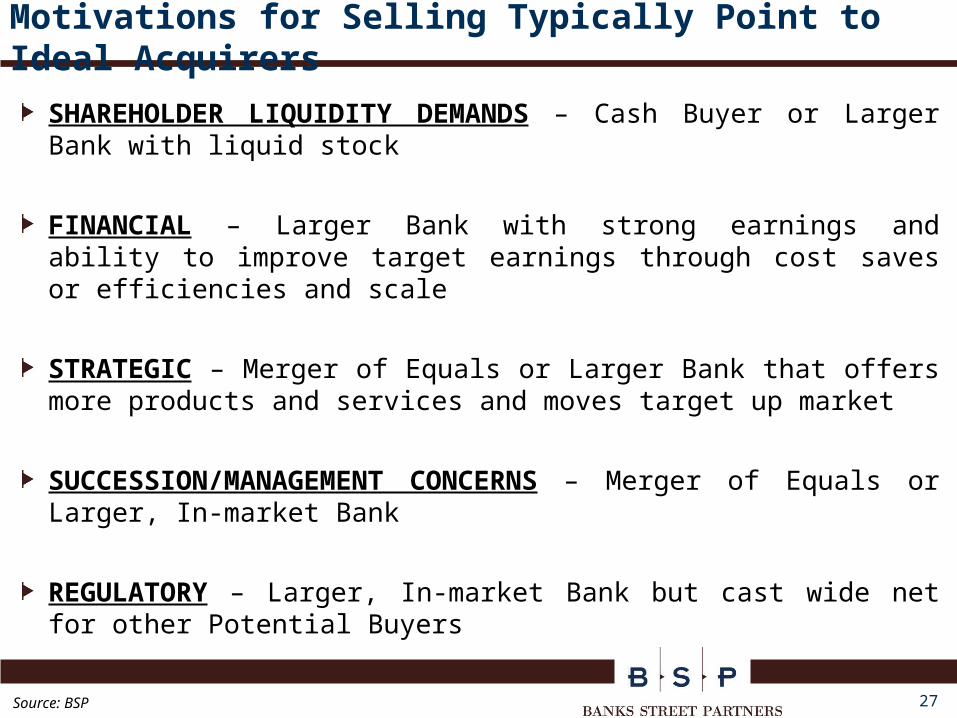
Motivations for Selling Typically Point to Ideal Acquirers
SHAREHOLDER LIQUIDITY DEMANDS – Cash Buyer or Larger Bank with liquid stock
FINANCIAL – Larger Bank with strong earnings and ability to improve target earnings through cost saves or efficiencies and scale
STRATEGIC – Merger of Equals or Larger Bank that offers more products and services and moves target up market
SUCCESSION/MANAGEMENT CONCERNS – Merger of Equals or Larger, In-market Bank
REGULATORY – Larger, In-market Bank but cast wide net for other Potential Buyers
Source: BSP
28
0
20
40
60
80
100
120
140
160
180
200
Tot
al R
eturn
(%
)
Total Return Since Announcement
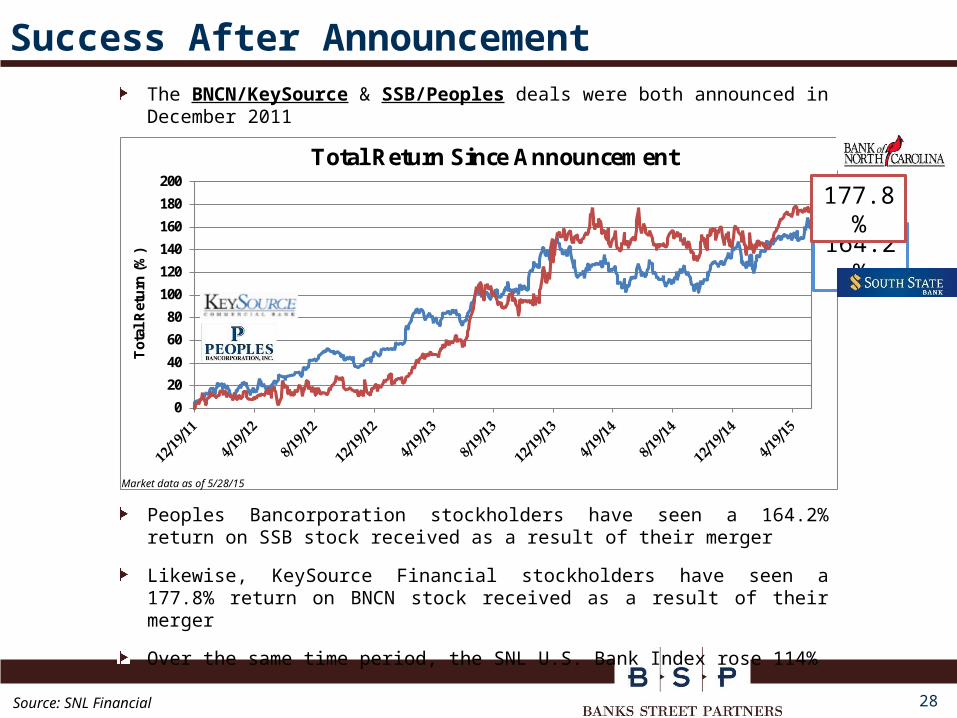
Success After Announcement
Peoples Bancorporation stockholders have seen a 164.2% return on SSB stock received as a result of their merger
Likewise, KeySource Financial stockholders have seen a 177.8% return on BNCN stock received as a result of their merger
Over the same time period, the SNL U.S. Bank Index rose 114%
Market data as of 5/28/15
164.2%
177.8%
The BNCN/KeySource & SSB/Peoples deals were both announced in December 2011
Source: SNL Financial
29
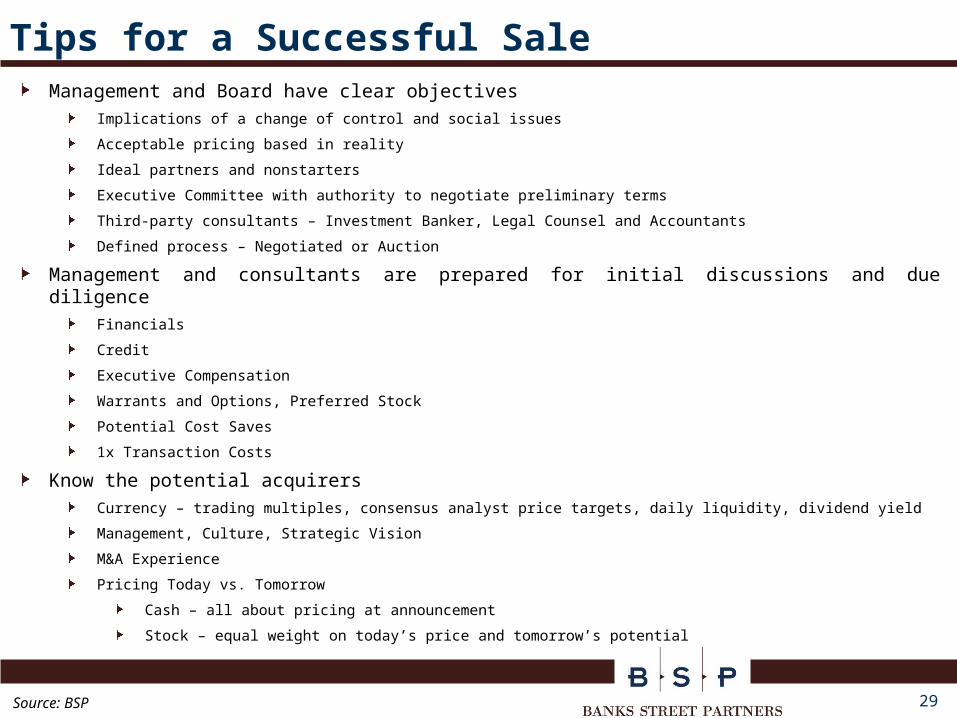
Tips for a Successful SaleManagement and Board have clear objectives
Implications of a change of control and social issues
Acceptable pricing based in reality
Ideal partners and nonstarters
Executive Committee with authority to negotiate preliminary terms
Third-party consultants – Investment Banker, Legal Counsel and Accountants
Defined process – Negotiated or Auction
Management and consultants are prepared for initial discussions and due diligenceFinancials
Credit
Executive Compensation
Warrants and Options, Preferred Stock
Potential Cost Saves
1x Transaction Costs
Know the potential acquirersCurrency – trading multiples, consensus analyst price targets, daily liquidity, dividend yield
Management, Culture, Strategic Vision
M&A Experience
Pricing Today vs. Tomorrow
Cash – all about pricing at announcement
Stock – equal weight on today’s price and tomorrow’s potential
Source: BSP
30
Stock for Stock Analysis Slide
*Based on May 28th closing price
Sources: SNL Financial, BSP
Company Name
Stock Exchange Ratio *
May 28 Closing Price
20-Day Avg. Close
52-Week High
May 28
Close
20-Day Avg. Close
52-Week High
52-Week Low
Median Price Target
High Price Target
Low Price Target
A 0.5333 $18.75 $18.58 $18.96 $15.51 $21.25 $22.00 $20.00 $10.00 $9.91 $10.11 $8.27 $11.33 $11.73 $10.67
B 0.6711 $14.90 $14.51 $14.92 $11.09 $14.75 $16.50 $13.00 $10.00 $9.74 $10.01 $7.44 $9.90 $11.07 $8.72
C 0.2804 $35.66 $35.44 $36.86 $27.52 $38.00 $39.00 $37.00 $10.00 $9.94 $10.34 $7.72 $10.66 $10.94 $10.37
D 0.1389 $72.00 $69.97 $73.76 $53.87 $75.00 $77.00 $66.00 $10.00 $9.72 $10.25 $7.48 $10.42 $10.70 $9.17
E 0.4864 $20.56 $20.04 $21.27 $15.80 $23.50 $24.00 $18.00 $10.00 $9.75 $10.35 $7.69 $11.43 $11.67 $8.76
F 0.523 $19.12 $18.82 $19.53 $15.06 $21.00 $22.00 $21.00 $10.00 $9.84 $10.21 $7.88 $10.98 $11.51 $10.98G 0.5003 $19.99 $19.92 $20.98 $17.50 $23.00 $23.00 $21.75 $10.00 $9.96 $10.49 $8.76 $11.51 $11.51 $10.88
FactSet Median Price Target
FactSet High Price Target
FactSet Low Price Target
Offer Value Per Common Share Based On:
52-Week Low
$8.00
$8.50
$9.00
$9.50
$10.00
$10.50
$11.00
$11.50
$12.00
A B C D E F G
Offer Value per Common Share
20-Day Avg. Close Median Price Target
Remaining Independent
32
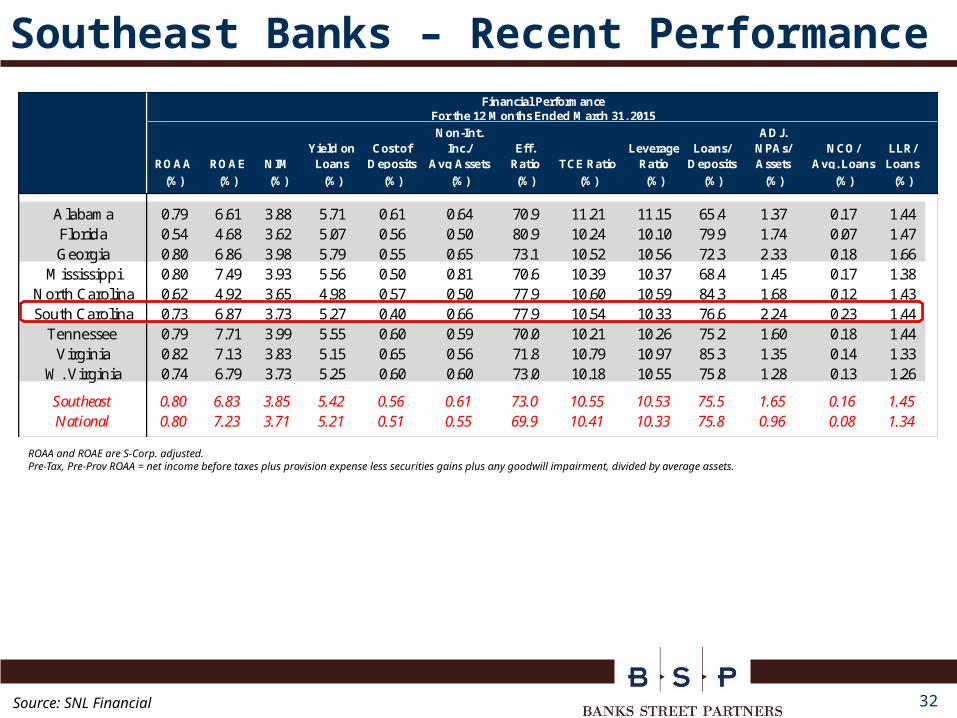
Southeast Banks – Recent Performance
ROAA and ROAE are S-Corp. adjusted.Pre-Tax, Pre-Prov ROAA = net income before taxes plus provision expense less securities gains plus any goodwill impairment, divided by average assets.
Source: SNL Financial
ROAA ROAE NIMYield on Loans
Cost of Deposits
Non-Int. Inc./
Avg AssetsEff.
Ratio TCE Ratio Leverage
RatioLoans/
Deposits
ADJ. NPAs/Assets
NCO/Avg. Loans
LLR/Loans
(%) (%) (%) (%) (%) (%) (%) (%) (%) (%) (%) (%) (%)
Alabama 0.79 6.61 3.88 5.71 0.61 0.64 70.9 11.21 11.15 65.4 1.37 0.17 1.44Florida 0.54 4.68 3.62 5.07 0.56 0.50 80.9 10.24 10.10 79.9 1.74 0.07 1.47Georgia 0.80 6.86 3.98 5.79 0.55 0.65 73.1 10.52 10.56 72.3 2.33 0.18 1.66
Mississippi 0.80 7.49 3.93 5.56 0.50 0.81 70.6 10.39 10.37 68.4 1.45 0.17 1.38North Carolina 0.62 4.92 3.65 4.98 0.57 0.50 77.9 10.60 10.59 84.3 1.68 0.12 1.43South Carolina 0.73 6.87 3.73 5.27 0.40 0.66 77.9 10.54 10.33 76.6 2.24 0.23 1.44
Tennessee 0.79 7.71 3.99 5.55 0.60 0.59 70.0 10.21 10.26 75.2 1.60 0.18 1.44Virginia 0.82 7.13 3.83 5.15 0.65 0.56 71.8 10.79 10.97 85.3 1.35 0.14 1.33
W. Virginia 0.74 6.79 3.73 5.25 0.60 0.60 73.0 10.18 10.55 75.8 1.28 0.13 1.26
Southeast 0.80 6.83 3.85 5.42 0.56 0.61 73.0 10.55 10.53 75.5 1.65 0.16 1.45National 0.80 7.23 3.71 5.21 0.51 0.55 69.9 10.41 10.33 75.8 0.96 0.08 1.34
Financial PerformanceFor the 12 Months Ended March 31, 2015
33
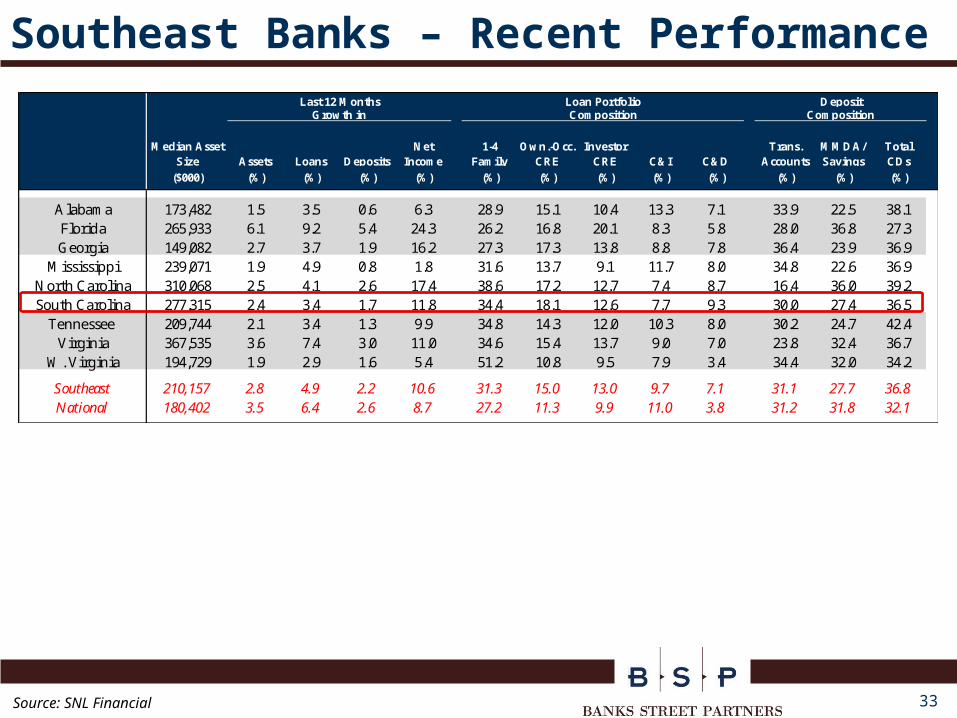
Southeast Banks – Recent Performance
Source: SNL Financial
Median Asset Size Assets Loans Deposits
Net Income
1-4 Family
Own.-Occ. CRE
Investor CRE C&I C&D
Trans. Accounts
MMDA/Savings
Total CDs
($000) (%) (%) (%) (%) (%) (%) (%) (%) (%) (%) (%) (%)
Alabama 173,482 1.5 3.5 0.6 6.3 28.9 15.1 10.4 13.3 7.1 33.9 22.5 38.1Florida 265,933 6.1 9.2 5.4 24.3 26.2 16.8 20.1 8.3 5.8 28.0 36.8 27.3Georgia 149,082 2.7 3.7 1.9 16.2 27.3 17.3 13.8 8.8 7.8 36.4 23.9 36.9
Mississippi 239,071 1.9 4.9 0.8 1.8 31.6 13.7 9.1 11.7 8.0 34.8 22.6 36.9North Carolina 310,068 2.5 4.1 2.6 17.4 38.6 17.2 12.7 7.4 8.7 16.4 36.0 39.2South Carolina 277,315 2.4 3.4 1.7 11.8 34.4 18.1 12.6 7.7 9.3 30.0 27.4 36.5
Tennessee 209,744 2.1 3.4 1.3 9.9 34.8 14.3 12.0 10.3 8.0 30.2 24.7 42.4Virginia 367,535 3.6 7.4 3.0 11.0 34.6 15.4 13.7 9.0 7.0 23.8 32.4 36.7
W. Virginia 194,729 1.9 2.9 1.6 5.4 51.2 10.8 9.5 7.9 3.4 34.4 32.0 34.2
Southeast 210,157 2.8 4.9 2.2 10.6 31.3 15.0 13.0 9.7 7.1 31.1 27.7 36.8National 180,402 3.5 6.4 2.6 8.7 27.2 11.3 9.9 11.0 3.8 31.2 31.8 32.1
Last 12 Months Loan Portfolio DepositGrowth in Composition Composition
34
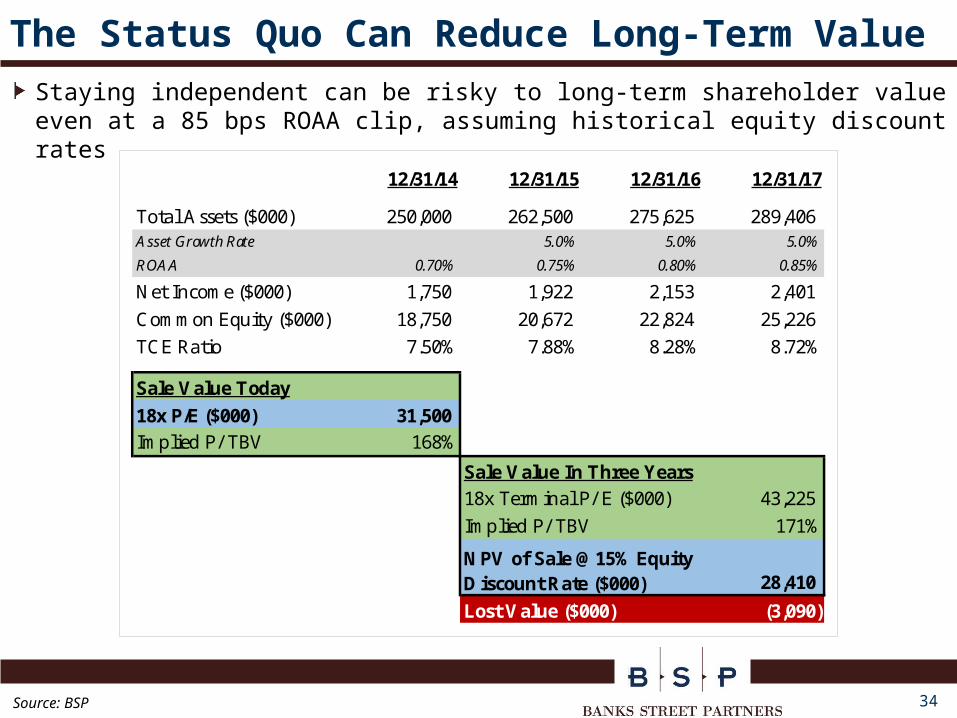
The Status Quo Can Reduce Long-Term Value
Staying independent can be risky to long-term shareholder value even at a 85 bps ROAA clip, assuming historical equity discount rates
Source: BSP
12/31/14 12/31/15 12/31/16 12/31/17
Total Assets ($000) 250,000 262,500 275,625 289,406 Asset Growth Rate 5.0% 5.0% 5.0%
ROAA 0.70% 0.75% 0.80% 0.85%
Net Income ($000) 1,750 1,922 2,153 2,401
Common Equity ($000) 18,750 20,672 22,824 25,226
TCE Ratio 7.50% 7.88% 8.28% 8.72%
Sale Value Today
18x P/E ($000) 31,500 Implied P/ TBV 168%
Sale Value In Three Years18x Terminal P/ E ($000) 43,225
Implied P/ TBV 171%
28,410
Lost Value ($000) (3,090)
NPV of Sale @ 15% Equity Discount Rate ($000)
35
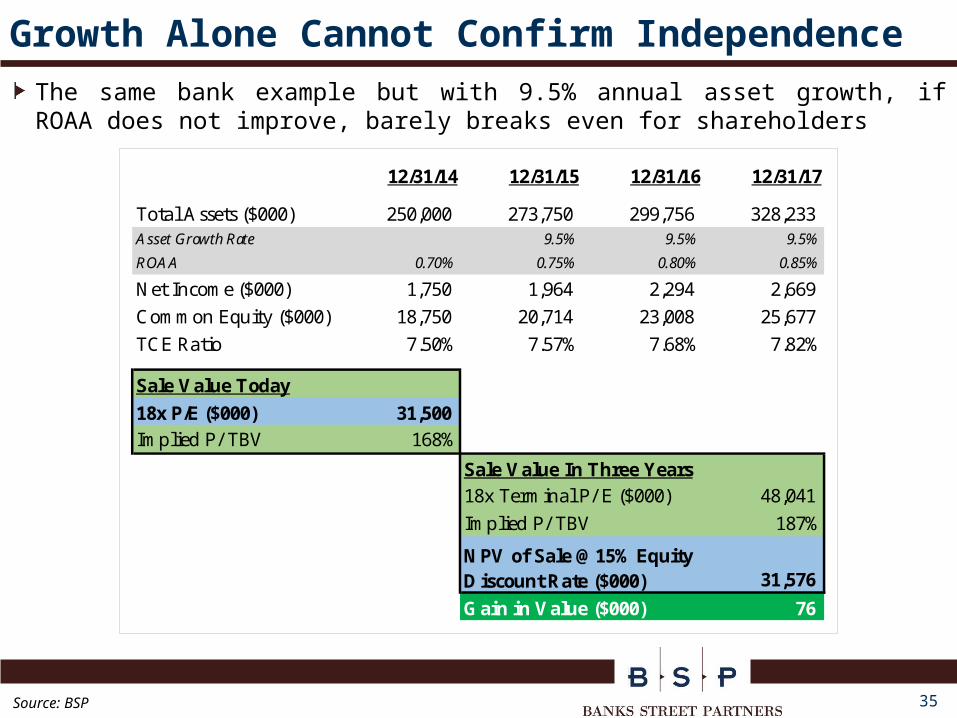
Growth Alone Cannot Confirm IndependenceThe same bank example but with 9.5% annual asset growth, if ROAA does not improve, barely breaks even for shareholders
12/31/14 12/31/15 12/31/16 12/31/17
Total Assets ($000) 250,000 273,750 299,756 328,233 Asset Growth Rate 9.5% 9.5% 9.5%
ROAA 0.70% 0.75% 0.80% 0.85%
Net Income ($000) 1,750 1,964 2,294 2,669
Common Equity ($000) 18,750 20,714 23,008 25,677
TCE Ratio 7.50% 7.57% 7.68% 7.82%
Sale Value Today
18x P/E ($000) 31,500 Implied P/ TBV 168%
Sale Value In Three Years18x Terminal P/ E ($000) 48,041
Implied P/ TBV 187%
31,576
Gain in Value ($000) 76
NPV of Sale @ 15% Equity Discount Rate ($000)
Source: BSP
36
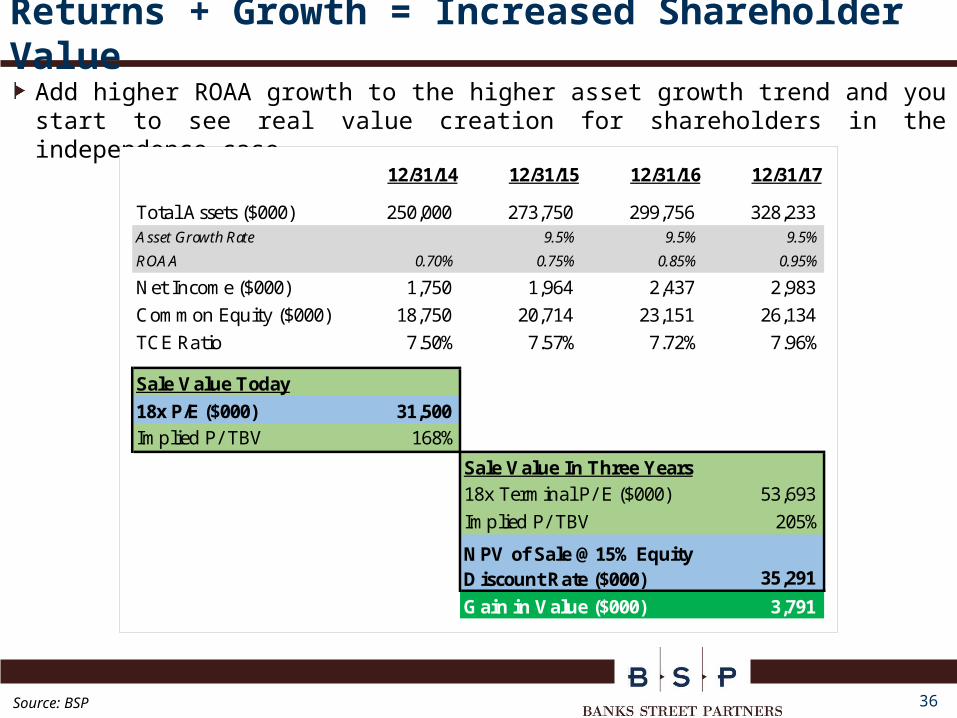
Returns + Growth = Increased Shareholder Value
Add higher ROAA growth to the higher asset growth trend and you start to see real value creation for shareholders in the independence case
12/31/14 12/31/15 12/31/16 12/31/17
Total Assets ($000) 250,000 273,750 299,756 328,233 Asset Growth Rate 9.5% 9.5% 9.5%
ROAA 0.70% 0.75% 0.85% 0.95%
Net Income ($000) 1,750 1,964 2,437 2,983
Common Equity ($000) 18,750 20,714 23,151 26,134
TCE Ratio 7.50% 7.57% 7.72% 7.96%
Sale Value Today
18x P/E ($000) 31,500 Implied P/ TBV 168%
Sale Value In Three Years18x Terminal P/ E ($000) 53,693
Implied P/ TBV 205%
35,291
Gain in Value ($000) 3,791
NPV of Sale @ 15% Equity Discount Rate ($000)
Source: BSP
37
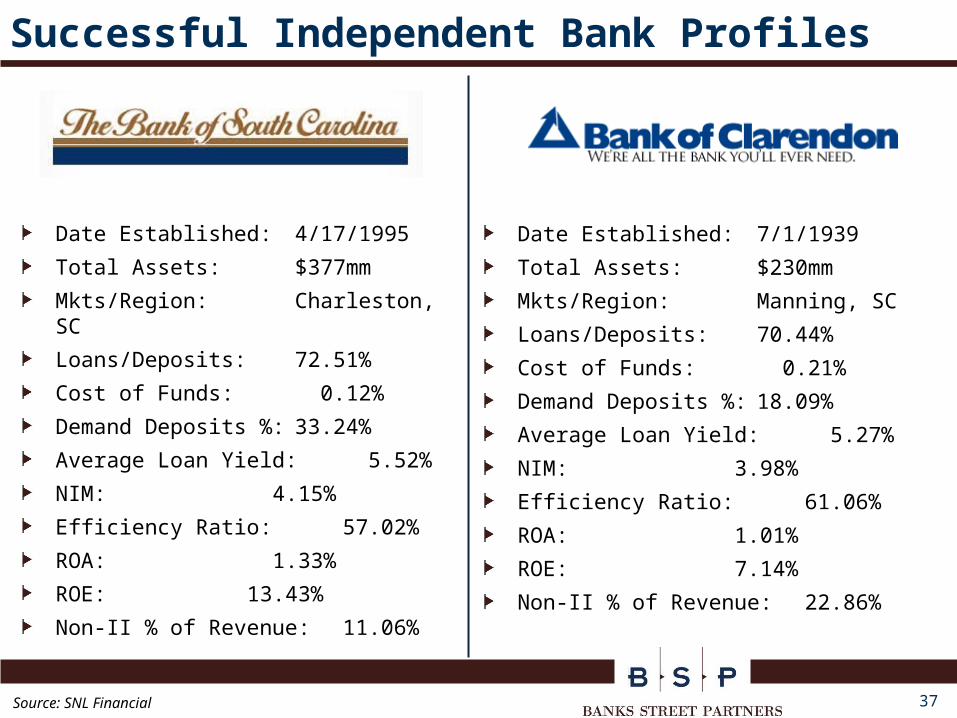
Successful Independent Bank Profiles
Date Established: 4/17/1995
Total Assets: $377mm
Mkts/Region:Charleston, SC
Loans/Deposits: 72.51%
Cost of Funds: 0.12%
Demand Deposits %: 33.24%
Average Loan Yield: 5.52%
NIM: 4.15%
Efficiency Ratio: 57.02%
ROA: 1.33%
ROE: 13.43%
Non-II % of Revenue: 11.06%
Date Established: 7/1/1939
Total Assets: $230mm
Mkts/Region: Manning, SC
Loans/Deposits: 70.44%
Cost of Funds: 0.21%
Demand Deposits %: 18.09%
Average Loan Yield: 5.27%
NIM: 3.98%
Efficiency Ratio: 61.06%
ROA: 1.01%
ROE: 7.14%
Non-II % of Revenue: 22.86%
Source: SNL Financial
1380 West Paces Ferry Rd. NW, Suite 2060Atlanta, GA 30327
(404) 848-1571
200 Providence Rd., Suite 207Charlotte, NC 28207
Related Documents