Satisfaction Survey - 2014/15 073 - Kamloops/Thompson USER NOTES 2011/2012 Survey report users should keep in mind that during the 2011/12 school year, due to labour disputes survey participation was optional. Response rates for that one year fell far below typical levels, and so those responses may not be representative of the school populations. Report users should carefully compare any results for 2011/12 against trends established in earlier and subsequent years, and consider discounting the 2011/12 results if they differ greatly from established trends. 2014/2015 In response to extensive feedback from educational administrators, the ministry conducted a review of core survey questions. To allow for more flexibility, questions seldom or never used by schools, districts and other organizations for planning and major initiatives were removed in 2014/2015 (indicated as grey cells). Schools and districts can still opt to include these questions and receive their own results in web-based reports. Page 1 of 29 July 2015 BC Ministry of Education

Welcome message from author
This document is posted to help you gain knowledge. Please leave a comment to let me know what you think about it! Share it to your friends and learn new things together.
Transcript
Satisfaction Survey - 2014/15073 - Kamloops/Thompson
USER NOTES
2011/2012
Survey report users should keep in mind that during the 2011/12 school year, due to labour disputes survey participation was optional.
Response rates for that one year fell far below typical levels, and so those responses may not berepresentative of the school populations.
Report users should carefully compare any results for 2011/12 against trends established in earlierand subsequent years, and consider discounting the 2011/12 results if they differ greatly fromestablished trends.
2014/2015
In response to extensive feedback from educational administrators, the ministry conducted a review of core survey questions. To allow for more flexibility, questions seldom or never used by schools, districts and other organizations for planning and major initiatives were removed in 2014/2015 (indicated as grey cells).
Schools and districts can still opt to include these questions and receive their own results in web-based reports.
Page 1 of 29 July 2015 BC Ministry of Education
Satisfaction Survey - 2014/15073 - Kamloops/Thompson
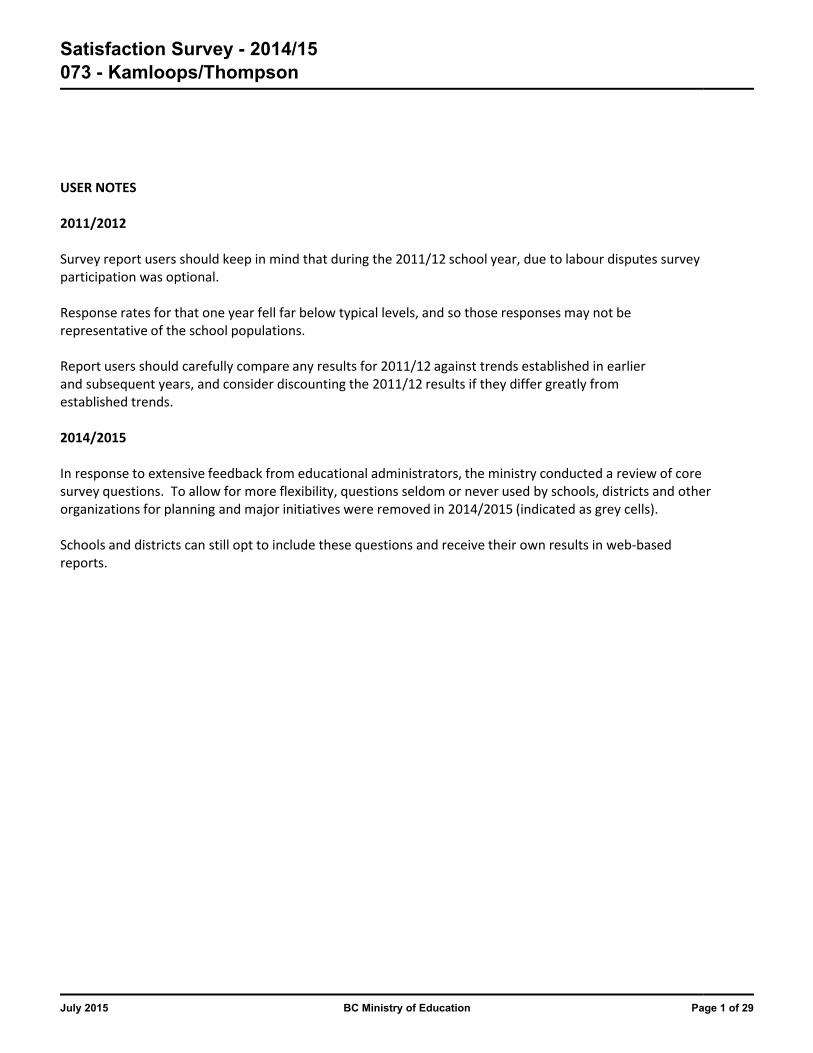
All Respondents (standard public schools only)
Respondent Counts by Respondent Group
(#) (#) (#) (#) (#) (#) (#)
Count of Respondents '-' indicates no respondents expected. '0' indicates no respondents when some were expected.
2010/11 858 804 828 770 316 184 1632011/12 167 158 249 183 49 43 Msk2012/13 893 690 822 645 226 191 1512013/14 881 673 899 680 282 81 1162014/15 940 883 835 709 197 63 95
Participation Percents by Respondent Group
(%) (%) (%) (%) (%) (%) (%)
Percent Who Responded '-' indicates no respondents expected. '0' indicates 0 response rate when some were expected.
2010/11 90 71 67 67 15 8 -2011/12 17 15 22 16 2 2 -2012/13 90 73 74 57 12 8 -2013/14 89 71 79 61 15 4 -2014/15 93 88 78 64 10 3 -
¹
Respondent Counts in School Year 2014/15
(#) (#) (#) (#) (#) (#) (#)
Count of Respondents by DemographicGroup in School Year 2014/15²
Female 455 444 400 361 Not asked Not asked Not asked
Male 483 438 429 347 Not asked Not asked Not asked
Aboriginal 153 172 177 106 14 6 Not asked
Non-Aboriginal 774 706 649 598 183 57 Not asked
²
Staff
Data may not add up to the total number of participants, as some respondents did not state their gender and/or ethnicity.
In response to extensive feedback from educational administrators, the ministry conducted a review of core survey questions. To allow for more flexibility, questions seldom or never used by schools, districts and other organizations for planning and major initiatives were removed in 2014/2015 (indicated as grey cells). Schools and districts can still opt to include these questions and receive their own results in web-based reports.
Secondary Parents Staff¹School
Year
A participation rate for staff is not included as the Ministry only collects data on teaching staff and the survey is open to all school employees. It is therefore not appropriate to calculate a staff participation rate.
Grade 3/4 Students
Grade 7 Students
Grade 10 Students
Grade 12 Students
Elementary Parents
Secondary Parents
Elementary Parents
SchoolYear
Grade 3/4 Students
Grade 7 Students
Grade 10 Students
Grade 12 Students
Grade 3/4 Students
Grade 7 Students
Grade 10 Students
Grade 12 Students
Elementary Parents
Secondary Parents Staff
Page 2 of 29July 2015 BC Ministry of Education
Satisfaction Survey - 2014/15073 - Kamloops/Thompson
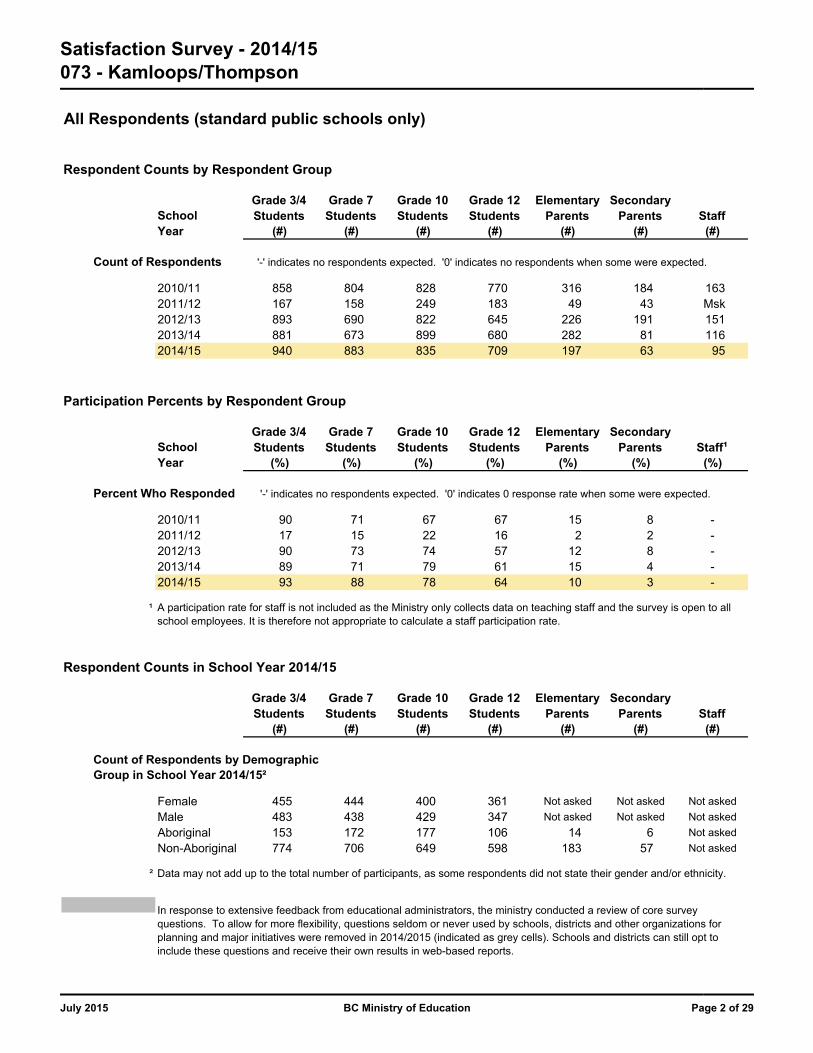
Student Survey - Achievement
# % # % # % # %
Do you try to do your best at school?
2010/11 764 91 676 85 592 72 500 662011/12 156 95 138 88 171 69 120 662012/13 819 93 597 88 593 73 450 702013/14 800 92 590 88 672 75 457 682014/15
Are you getting better at reading?
2010/11 652 80 583 76 398 54 361 522011/12 142 87 117 79 121 55 97 572012/13 701 81 497 76 418 56 326 552013/14 697 83 484 75 423 52 346 562014/15 710 80 568 70 410 54 314 49
Are you getting better at writing sentences or stories? (Grades 3/4)Are you getting better at writing? (Grades 7, 10, 12)
2010/11 569 69 544 70 459 57 438 592011/12 117 73 109 70 148 61 120 662012/13 607 70 471 70 470 59 379 602013/14 575 68 456 69 466 54 386 592014/15 571 64 527 63 443 55 380 56
Are you getting better at math? (Grades 3/4, 7)Are you getting better at mathematics? (Grades 10, 12)
2010/11 586 71 535 68 431 53 352 472011/12 124 75 121 79 129 52 97 542012/13 634 73 461 69 428 53 338 542013/14 645 76 461 70 456 52 354 542014/15 657 73 553 65 391 48 321 47
At school, are you learning about art?
2010/11 404 48 311 39 141 17 122 162011/12 85 51 54 34 34 14 26 142012/13 396 45 250 37 140 17 149 232013/14 362 42 231 35 142 16 122 182014/15 410 45 245 28 151 19 115 16
Students Reporting "Many Times" or "All of the Time"
SchoolYear
Grade 3/4 Students Grade 7 Students Grade 10 Students Grade 12 Students
Page 3 of 29July 2015 BC Ministry of Education
Satisfaction Survey - 2014/15073 - Kamloops/Thompson
Student Survey - Achievement
# % # % # % # %
Students Reporting "Many Times" or "All of the Time"
SchoolYear
Grade 3/4 Students Grade 7 Students Grade 10 Students Grade 12 Students
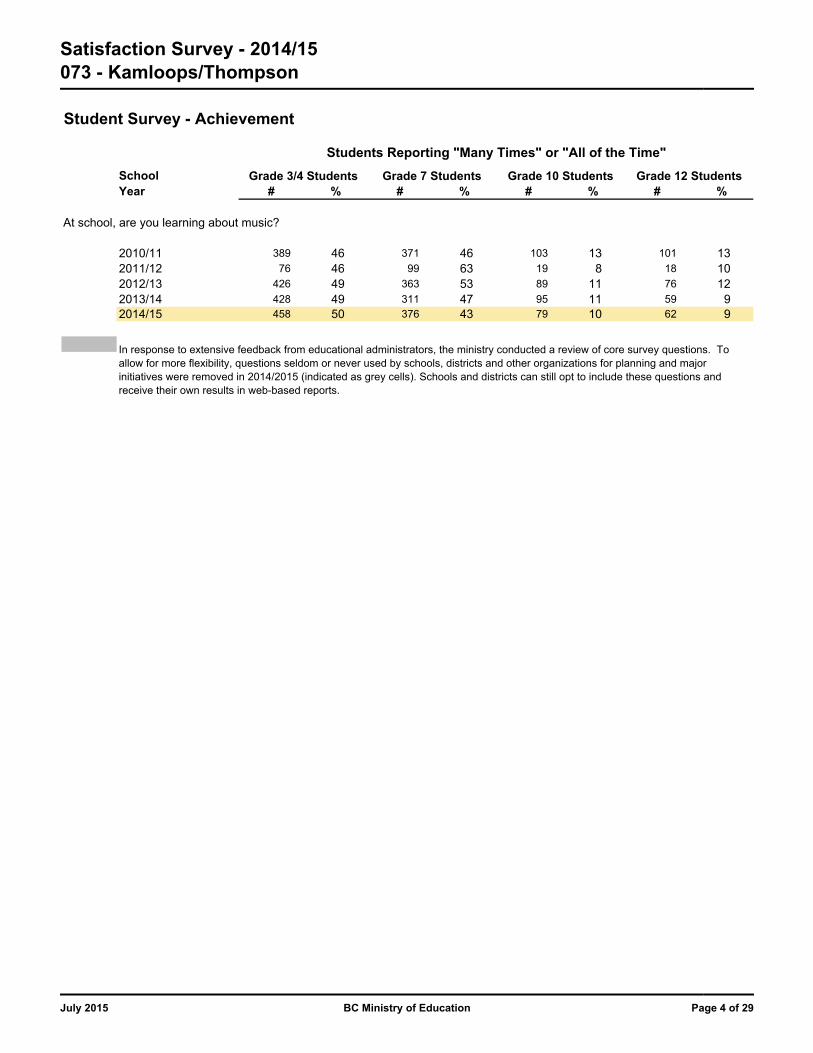
At school, are you learning about music?
2010/11 389 46 371 46 103 13 101 132011/12 76 46 99 63 19 8 18 102012/13 426 49 363 53 89 11 76 122013/14 428 49 311 47 95 11 59 92014/15 458 50 376 43 79 10 62 9
In response to extensive feedback from educational administrators, the ministry conducted a review of core survey questions. To allow for more flexibility, questions seldom or never used by schools, districts and other organizations for planning and major initiatives were removed in 2014/2015 (indicated as grey cells). Schools and districts can still opt to include these questions and receive their own results in web-based reports.
Page 4 of 29July 2015 BC Ministry of Education

Satisfaction Survey - 2014/15073 - Kamloops/Thompson
Student Survey - Human and Social Development
# % # % # % # %
2010/11 396 48 439 55 252 31 223 292011/12 90 56 66 42 62 25 42 232012/13 466 54 350 51 208 26 199 312013/14 391 46 289 44 180 20 145 222014/15 496 55 367 43 189 23 143 20
At school, are you learning about climate change? (Grades 10, 12)
2010/11 Not asked Not asked Not asked Not asked 216 27 116 152011/12 Not asked Not asked Not asked Not asked 43 17 15 82012/13 Not asked Not asked Not asked Not asked 164 20 94 152013/14 Not asked Not asked Not asked Not asked 166 19 80 122014/15 Not asked Not asked Not asked Not asked 169 21 74 11
At school, are you being taught about Aboriginal peoples in Canada?
2010/11 482 60 119 15 213 26 156 212011/12 86 54 20 13 79 32 37 222012/13 513 61 145 22 241 30 179 282013/14 449 54 122 19 332 38 188 292014/15 486 55 208 24 287 35 192 28
At school, do you respect people who are different from you (for example, think, act, or look different)?
2010/11 746 90 691 88 679 83 640 852011/12 155 94 143 91 208 85 151 882012/13 792 91 640 94 699 86 555 872013/14 801 93 626 94 738 85 590 882014/15 845 92 808 94 691 85 607 87
At school, do you participate in activities outside of class hours (for example, clubs, dance, sports teams, music)?
2010/11 459 57 474 60 338 42 327 432011/12 95 59 108 69 108 44 80 442012/13 486 57 405 60 334 41 263 412013/14 482 57 393 60 380 43 278 412014/15 504 56 474 55 351 43 263 38
In response to extensive feedback from educational administrators, the ministry conducted a review of core survey questions. To allow for more flexibility, questions seldom or never used by schools, districts and other organizations for planning and major initiatives were removed in 2014/2015 (indicated as grey cells). Schools and districts can still opt to include these questions and receive their own results in web-based reports.
At school, are you learning how to do things to care for the environment (for example: recycling, waste reduction, energy, land and water conservation)?
Students Reporting "Many Times" or "All of the Time"
SchoolYear
Grade 3/4 Students Grade 7 Students Grade 10 Students Grade 12 Students
Page 5 of 29July 2015 BC Ministry of Education
Satisfaction Survey - 2014/15073 - Kamloops/Thompson
Student Survey - Safety
# % # % # % # %
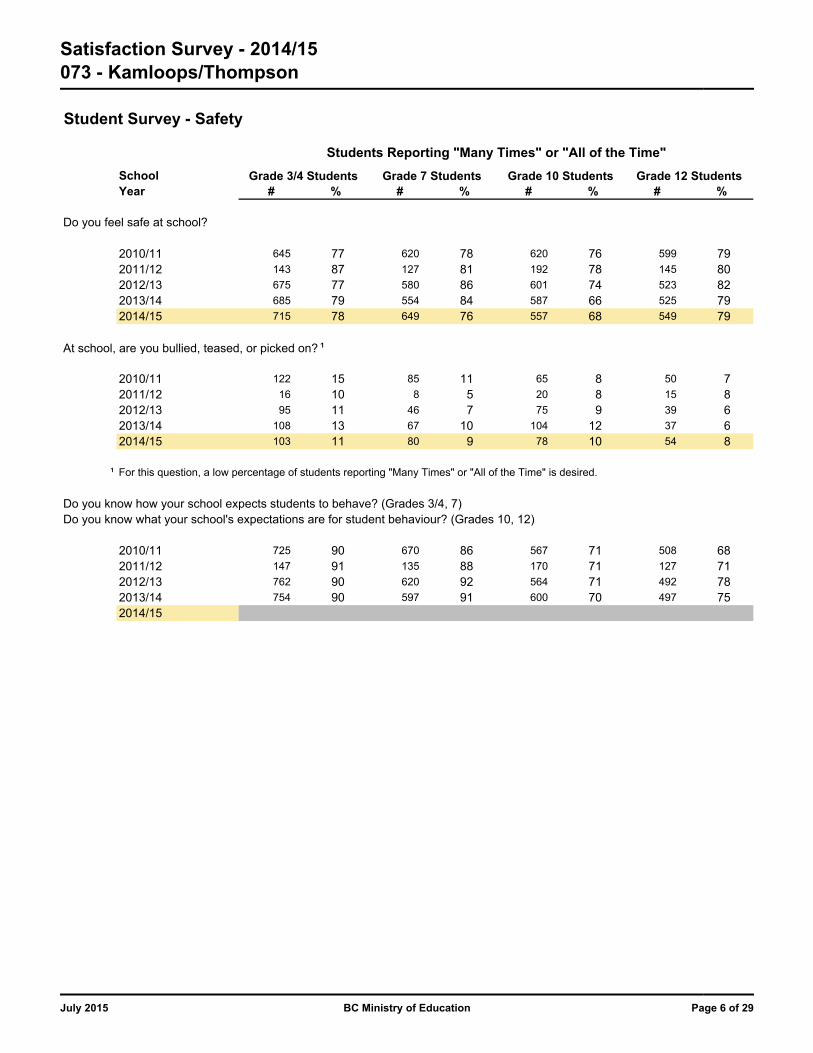
Do you feel safe at school?
2010/11 645 77 620 78 620 76 599 792011/12 143 87 127 81 192 78 145 802012/13 675 77 580 86 601 74 523 822013/14 685 79 554 84 587 66 525 792014/15 715 78 649 76 557 68 549 79
At school, are you bullied, teased, or picked on? ¹
2010/11 122 15 85 11 65 8 50 72011/12 16 10 8 5 20 8 15 82012/13 95 11 46 7 75 9 39 62013/14 108 13 67 10 104 12 37 62014/15 103 11 80 9 78 10 54 8
¹ For this question, a low percentage of students reporting "Many Times" or "All of the Time" is desired.
Do you know how your school expects students to behave? (Grades 3/4, 7)Do you know what your school's expectations are for student behaviour? (Grades 10, 12)
2010/11 725 90 670 86 567 71 508 682011/12 147 91 135 88 170 71 127 712012/13 762 90 620 92 564 71 492 782013/14 754 90 597 91 600 70 497 752014/15
Students Reporting "Many Times" or "All of the Time"
SchoolYear
Grade 3/4 Students Grade 7 Students Grade 10 Students Grade 12 Students
Page 6 of 29July 2015 BC Ministry of Education
Satisfaction Survey - 2014/15073 - Kamloops/Thompson
Student Survey - Preparation for the Future
# % # % # % # %
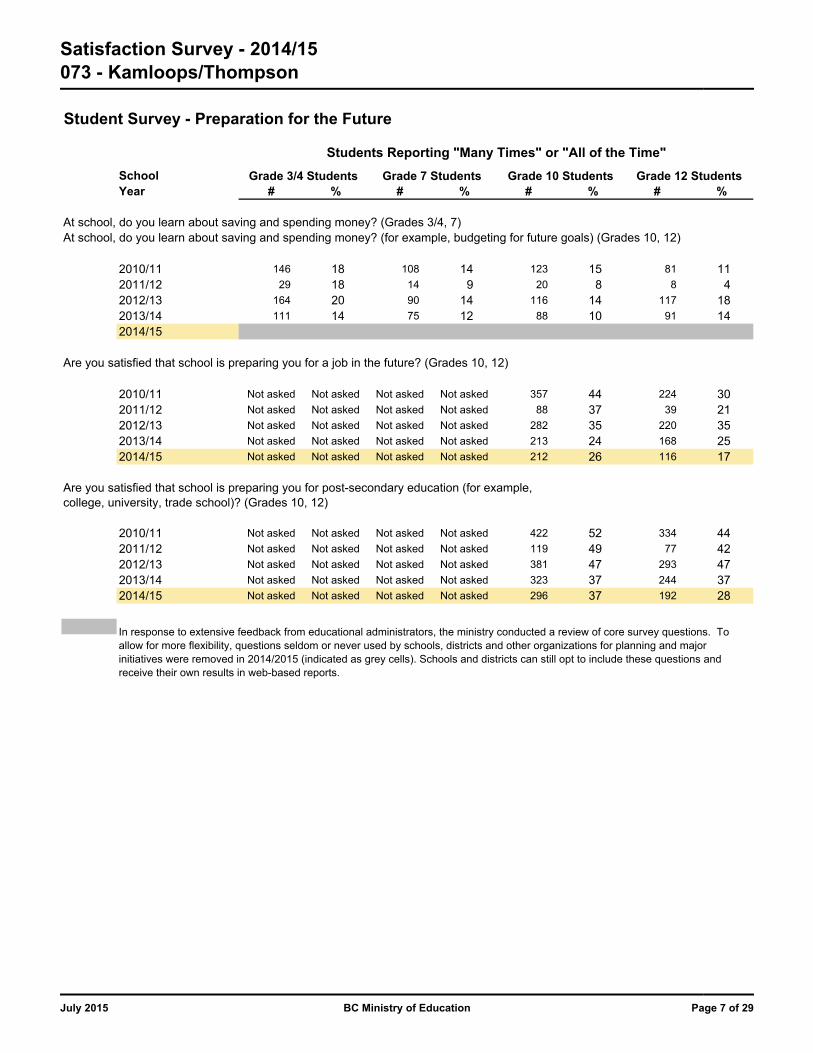
At school, do you learn about saving and spending money? (Grades 3/4, 7)At school, do you learn about saving and spending money? (for example, budgeting for future goals) (Grades 10, 12)
2010/11 146 18 108 14 123 15 81 112011/12 29 18 14 9 20 8 8 42012/13 164 20 90 14 116 14 117 182013/14 111 14 75 12 88 10 91 142014/15
Are you satisfied that school is preparing you for a job in the future? (Grades 10, 12)
2010/11 Not asked Not asked Not asked Not asked 357 44 224 302011/12 Not asked Not asked Not asked Not asked 88 37 39 212012/13 Not asked Not asked Not asked Not asked 282 35 220 352013/14 Not asked Not asked Not asked Not asked 213 24 168 252014/15 Not asked Not asked Not asked Not asked 212 26 116 17
2010/11 Not asked Not asked Not asked Not asked 422 52 334 442011/12 Not asked Not asked Not asked Not asked 119 49 77 422012/13 Not asked Not asked Not asked Not asked 381 47 293 472013/14 Not asked Not asked Not asked Not asked 323 37 244 372014/15 Not asked Not asked Not asked Not asked 296 37 192 28
In response to extensive feedback from educational administrators, the ministry conducted a review of core survey questions. To allow for more flexibility, questions seldom or never used by schools, districts and other organizations for planning and major initiatives were removed in 2014/2015 (indicated as grey cells). Schools and districts can still opt to include these questions and receive their own results in web-based reports.
Are you satisfied that school is preparing you for post-secondary education (for example, college, university, trade school)? (Grades 10, 12)
Students Reporting "Many Times" or "All of the Time"
SchoolYear
Grade 3/4 Students Grade 7 Students Grade 10 Students Grade 12 Students
Page 7 of 29July 2015 BC Ministry of Education
Satisfaction Survey - 2014/15073 - Kamloops/Thompson
Student Survey - School Environment
# % # % # % # %
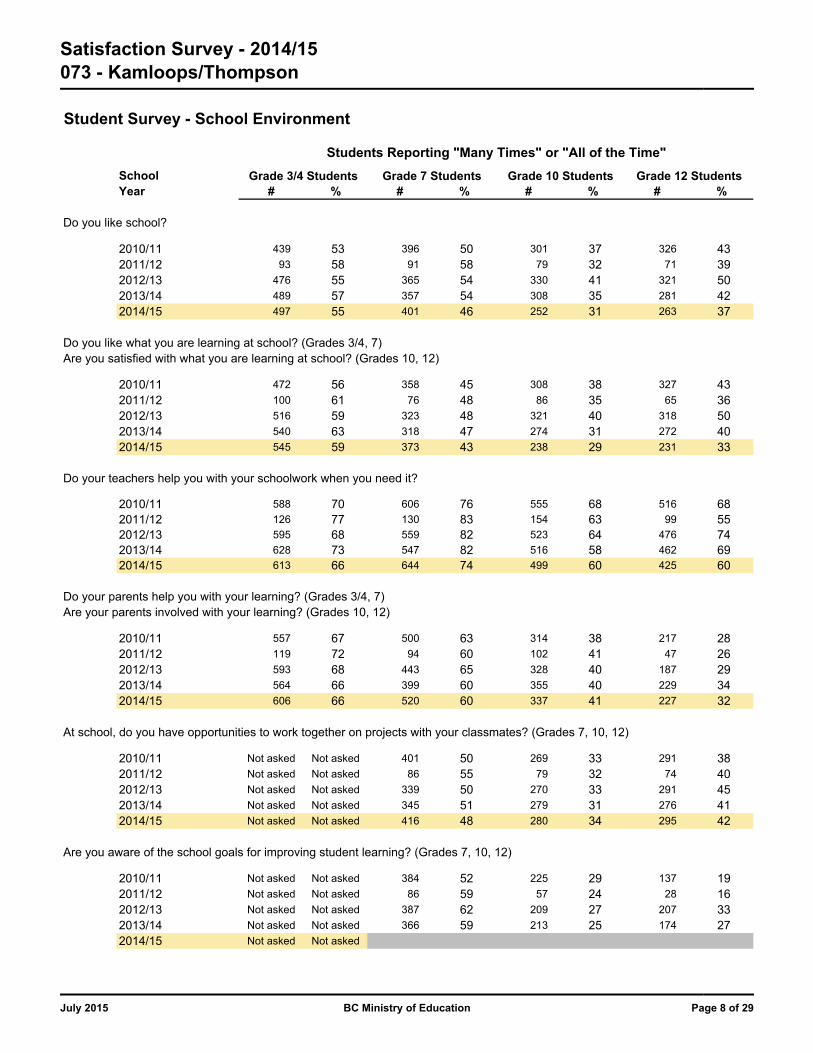
Do you like school?
2010/11 439 53 396 50 301 37 326 432011/12 93 58 91 58 79 32 71 392012/13 476 55 365 54 330 41 321 502013/14 489 57 357 54 308 35 281 422014/15 497 55 401 46 252 31 263 37
Do you like what you are learning at school? (Grades 3/4, 7)Are you satisfied with what you are learning at school? (Grades 10, 12)
2010/11 472 56 358 45 308 38 327 432011/12 100 61 76 48 86 35 65 362012/13 516 59 323 48 321 40 318 502013/14 540 63 318 47 274 31 272 402014/15 545 59 373 43 238 29 231 33
Do your teachers help you with your schoolwork when you need it?
2010/11 588 70 606 76 555 68 516 682011/12 126 77 130 83 154 63 99 552012/13 595 68 559 82 523 64 476 742013/14 628 73 547 82 516 58 462 692014/15 613 66 644 74 499 60 425 60
Do your parents help you with your learning? (Grades 3/4, 7)Are your parents involved with your learning? (Grades 10, 12)
2010/11 557 67 500 63 314 38 217 282011/12 119 72 94 60 102 41 47 262012/13 593 68 443 65 328 40 187 292013/14 564 66 399 60 355 40 229 342014/15 606 66 520 60 337 41 227 32
At school, do you have opportunities to work together on projects with your classmates? (Grades 7, 10, 12)
2010/11 Not asked Not asked 401 50 269 33 291 382011/12 Not asked Not asked 86 55 79 32 74 402012/13 Not asked Not asked 339 50 270 33 291 452013/14 Not asked Not asked 345 51 279 31 276 412014/15 Not asked Not asked 416 48 280 34 295 42
Are you aware of the school goals for improving student learning? (Grades 7, 10, 12)
2010/11 Not asked Not asked 384 52 225 29 137 192011/12 Not asked Not asked 86 59 57 24 28 162012/13 Not asked Not asked 387 62 209 27 207 332013/14 Not asked Not asked 366 59 213 25 174 272014/15 Not asked Not asked
Students Reporting "Many Times" or "All of the Time"
SchoolYear
Grade 3/4 Students Grade 7 Students Grade 10 Students Grade 12 Students
Page 8 of 29July 2015 BC Ministry of Education
Satisfaction Survey - 2014/15073 - Kamloops/Thompson
Student Survey - School Environment
# % # % # % # %
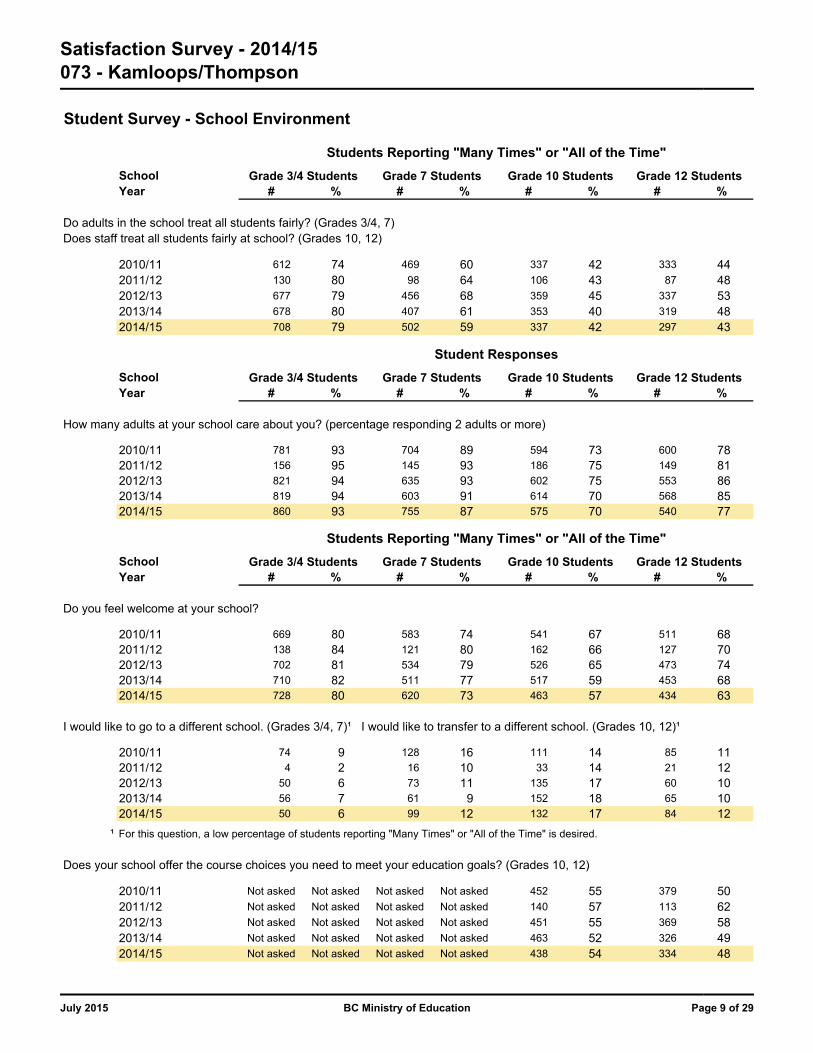
Do adults in the school treat all students fairly? (Grades 3/4, 7)Does staff treat all students fairly at school? (Grades 10, 12)
2010/11 612 74 469 60 337 42 333 442011/12 130 80 98 64 106 43 87 482012/13 677 79 456 68 359 45 337 532013/14 678 80 407 61 353 40 319 482014/15 708 79 502 59 337 42 297 43
# % # % # % # %
How many adults at your school care about you? (percentage responding 2 adults or more)
2010/11 781 93 704 89 594 73 600 782011/12 156 95 145 93 186 75 149 812012/13 821 94 635 93 602 75 553 862013/14 819 94 603 91 614 70 568 852014/15 860 93 755 87 575 70 540 77
# % # % # % # %
Do you feel welcome at your school?
2010/11 669 80 583 74 541 67 511 682011/12 138 84 121 80 162 66 127 702012/13 702 81 534 79 526 65 473 742013/14 710 82 511 77 517 59 453 682014/15 728 80 620 73 463 57 434 63
I would like to go to a different school. (Grades 3/4, 7)¹ I would like to transfer to a different school. (Grades 10, 12)¹
2010/11 74 9 128 16 111 14 85 112011/12 4 2 16 10 33 14 21 122012/13 50 6 73 11 135 17 60 102013/14 56 7 61 9 152 18 65 102014/15 50 6 99 12 132 17 84 12
¹ For this question, a low percentage of students reporting "Many Times" or "All of the Time" is desired.
Does your school offer the course choices you need to meet your education goals? (Grades 10, 12)
2010/11 Not asked Not asked Not asked Not asked 452 55 379 502011/12 Not asked Not asked Not asked Not asked 140 57 113 622012/13 Not asked Not asked Not asked Not asked 451 55 369 582013/14 Not asked Not asked Not asked Not asked 463 52 326 492014/15 Not asked Not asked Not asked Not asked 438 54 334 48
Students Reporting "Many Times" or "All of the Time"
SchoolYear
Grade 3/4 Students Grade 7 Students Grade 10 Students Grade 12 Students
Student Responses
SchoolYear
Grade 3/4 Students Grade 7 Students Grade 10 Students Grade 12 Students
Students Reporting "Many Times" or "All of the Time"
SchoolYear
Grade 3/4 Students Grade 7 Students Grade 10 Students Grade 12 Students
Page 9 of 29July 2015 BC Ministry of Education

Satisfaction Survey - 2014/15073 - Kamloops/Thompson
Student Survey - School Environment
# % # % # % # %
At school, do you have opportunities to work on things you are interested in as part of your coursework? (Grades 7, 10, 12)
2010/11 Not asked Not asked 205 27 258 32 229 302011/12 Not asked Not asked 46 30 49 20 53 292012/13 Not asked Not asked 197 31 252 32 247 392013/14 Not asked Not asked 196 31 211 24 209 322014/15 Not asked Not asked 224 27 231 29 170 24
As part of your coursework, are you encouraged to include learning activities that happen outside of your classroom?(for example, volunteering at a gallery as part of your art class, or participating in a research project as part of yourscience class). (Grades 10, 12)
2010/11 Not asked Not asked Not asked Not asked 115 15 103 142011/12 Not asked Not asked Not asked Not asked 25 10 18 102012/13 Not asked Not asked Not asked Not asked 123 16 106 172013/14 Not asked Not asked Not asked Not asked 92 11 118 182014/15 Not asked Not asked Not asked Not asked 125 16 91 13
In response to extensive feedback from educational administrators, the ministry conducted a review of core survey questions. To allow for more flexibility, questions seldom or never used by schools, districts and other organizations for planning and major initiatives were removed in 2014/2015 (indicated as grey cells). Schools and districts can still opt to include these questions and receive their own results in web-based reports.
Students Reporting "Many Times" or "All of the Time"
SchoolYear
Grade 3/4 Students Grade 7 Students Grade 10 Students Grade 12 Students
Page 10 of 29July 2015 BC Ministry of Education
Satisfaction Survey - 2014/15073 - Kamloops/Thompson
Student Survey - Health
# % # % # % # %
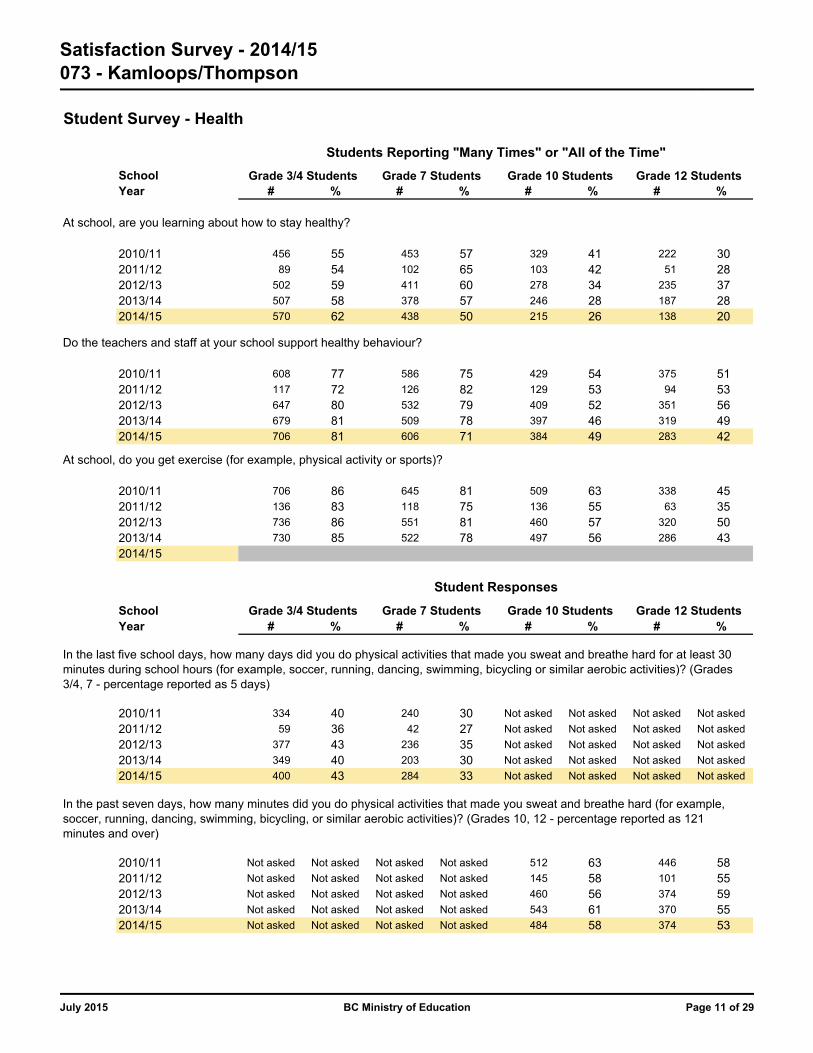
At school, are you learning about how to stay healthy?
2010/11 456 55 453 57 329 41 222 302011/12 89 54 102 65 103 42 51 282012/13 502 59 411 60 278 34 235 372013/14 507 58 378 57 246 28 187 282014/15 570 62 438 50 215 26 138 20
Do the teachers and staff at your school support healthy behaviour?
2010/11 608 77 586 75 429 54 375 512011/12 117 72 126 82 129 53 94 532012/13 647 80 532 79 409 52 351 562013/14 679 81 509 78 397 46 319 492014/15 706 81 606 71 384 49 283 42
At school, do you get exercise (for example, physical activity or sports)?
2010/11 706 86 645 81 509 63 338 452011/12 136 83 118 75 136 55 63 352012/13 736 86 551 81 460 57 320 502013/14 730 85 522 78 497 56 286 432014/15
# % # % # % # %
2010/11 334 40 240 30 Not asked Not asked Not asked Not asked
2011/12 59 36 42 27 Not asked Not asked Not asked Not asked
2012/13 377 43 236 35 Not asked Not asked Not asked Not asked
2013/14 349 40 203 30 Not asked Not asked Not asked Not asked
2014/15 400 43 284 33 Not asked Not asked Not asked Not asked
2010/11 Not asked Not asked Not asked Not asked 512 63 446 582011/12 Not asked Not asked Not asked Not asked 145 58 101 552012/13 Not asked Not asked Not asked Not asked 460 56 374 592013/14 Not asked Not asked Not asked Not asked 543 61 370 552014/15 Not asked Not asked Not asked Not asked 484 58 374 53
Grade 10 Students Grade 12 Students
In the last five school days, how many days did you do physical activities that made you sweat and breathe hard for at least 30 minutes during school hours (for example, soccer, running, dancing, swimming, bicycling or similar aerobic activities)? (Grades 3/4, 7 - percentage reported as 5 days)
In the past seven days, how many minutes did you do physical activities that made you sweat and breathe hard (for example, soccer, running, dancing, swimming, bicycling, or similar aerobic activities)? (Grades 10, 12 - percentage reported as 121 minutes and over)
Students Reporting "Many Times" or "All of the Time"
SchoolYear
Grade 3/4 Students Grade 7 Students Grade 10 Students Grade 12 Students
Student Responses
SchoolYear
Grade 3/4 Students Grade 7 Students
Page 11 of 29July 2015 BC Ministry of Education
Satisfaction Survey - 2014/15073 - Kamloops/Thompson
Student Survey - Health
# % # % # % # %
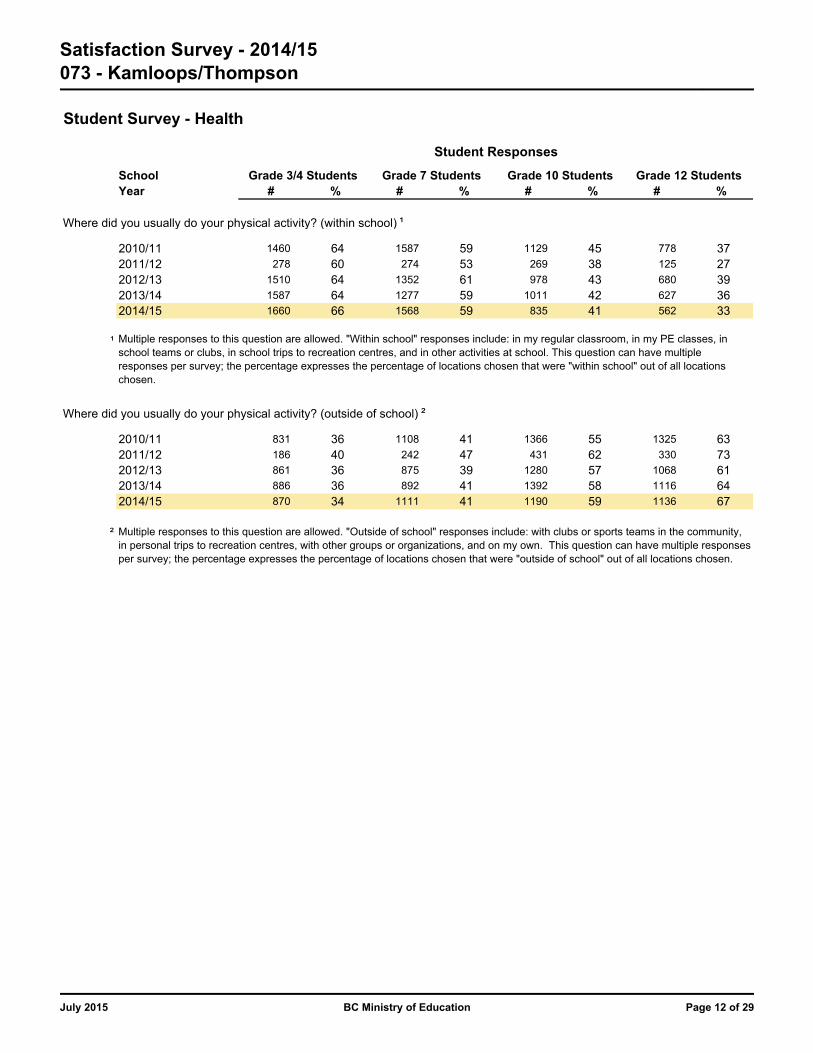
Where did you usually do your physical activity? (within school) ¹
2010/11 1460 64 1587 59 1129 45 778 372011/12 278 60 274 53 269 38 125 272012/13 1510 64 1352 61 978 43 680 392013/14 1587 64 1277 59 1011 42 627 362014/15 1660 66 1568 59 835 41 562 33
¹
Where did you usually do your physical activity? (outside of school) ²
2010/11 831 36 1108 41 1366 55 1325 632011/12 186 40 242 47 431 62 330 732012/13 861 36 875 39 1280 57 1068 612013/14 886 36 892 41 1392 58 1116 642014/15 870 34 1111 41 1190 59 1136 67
² Multiple responses to this question are allowed. "Outside of school" responses include: with clubs or sports teams in the community, in personal trips to recreation centres, with other groups or organizations, and on my own. This question can have multiple responses per survey; the percentage expresses the percentage of locations chosen that were "outside of school" out of all locations chosen.
Student Responses
SchoolYear
Grade 3/4 Students Grade 7 Students Grade 10 Students Grade 12 Students
Multiple responses to this question are allowed. "Within school" responses include: in my regular classroom, in my PE classes, in school teams or clubs, in school trips to recreation centres, and in other activities at school. This question can have multiple responses per survey; the percentage expresses the percentage of locations chosen that were "within school" out of all locations chosen.
Page 12 of 29July 2015 BC Ministry of Education
Satisfaction Survey - 2014/15073 - Kamloops/Thompson
Student Survey - Health
# % # % # % # %
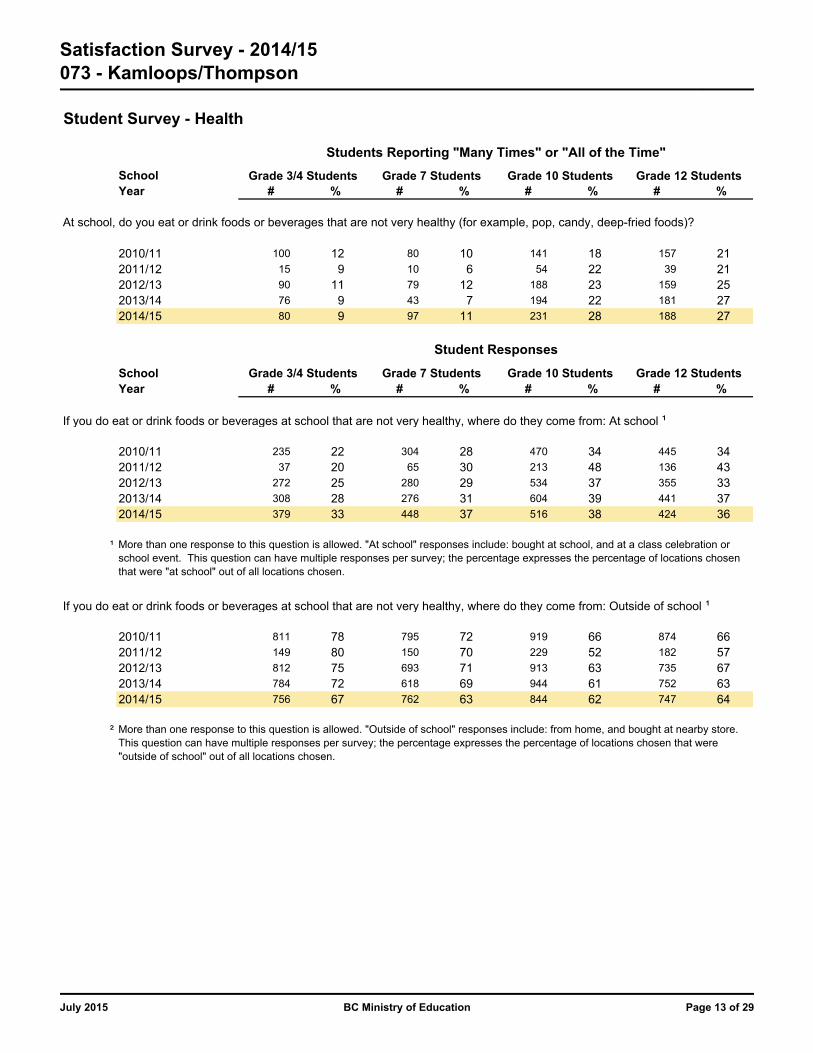
At school, do you eat or drink foods or beverages that are not very healthy (for example, pop, candy, deep-fried foods)?
2010/11 100 12 80 10 141 18 157 212011/12 15 9 10 6 54 22 39 212012/13 90 11 79 12 188 23 159 252013/14 76 9 43 7 194 22 181 272014/15 80 9 97 11 231 28 188 27
# % # % # % # %
If you do eat or drink foods or beverages at school that are not very healthy, where do they come from: At school ¹
2010/11 235 22 304 28 470 34 445 342011/12 37 20 65 30 213 48 136 432012/13 272 25 280 29 534 37 355 332013/14 308 28 276 31 604 39 441 372014/15 379 33 448 37 516 38 424 36
¹
If you do eat or drink foods or beverages at school that are not very healthy, where do they come from: Outside of school ¹
2010/11 811 78 795 72 919 66 874 662011/12 149 80 150 70 229 52 182 572012/13 812 75 693 71 913 63 735 672013/14 784 72 618 69 944 61 752 632014/15 756 67 762 63 844 62 747 64
²
Students Reporting "Many Times" or "All of the Time"
SchoolYear
Grade 3/4 Students Grade 7 Students Grade 10 Students Grade 12 Students
More than one response to this question is allowed. "Outside of school" responses include: from home, and bought at nearby store. This question can have multiple responses per survey; the percentage expresses the percentage of locations chosen that were "outside of school" out of all locations chosen.
More than one response to this question is allowed. "At school" responses include: bought at school, and at a class celebration or school event. This question can have multiple responses per survey; the percentage expresses the percentage of locations chosen that were "at school" out of all locations chosen.
Student Responses
SchoolYear
Grade 3/4 Students Grade 7 Students Grade 10 Students Grade 12 Students
Page 13 of 29July 2015 BC Ministry of Education
Satisfaction Survey - 2014/15073 - Kamloops/Thompson
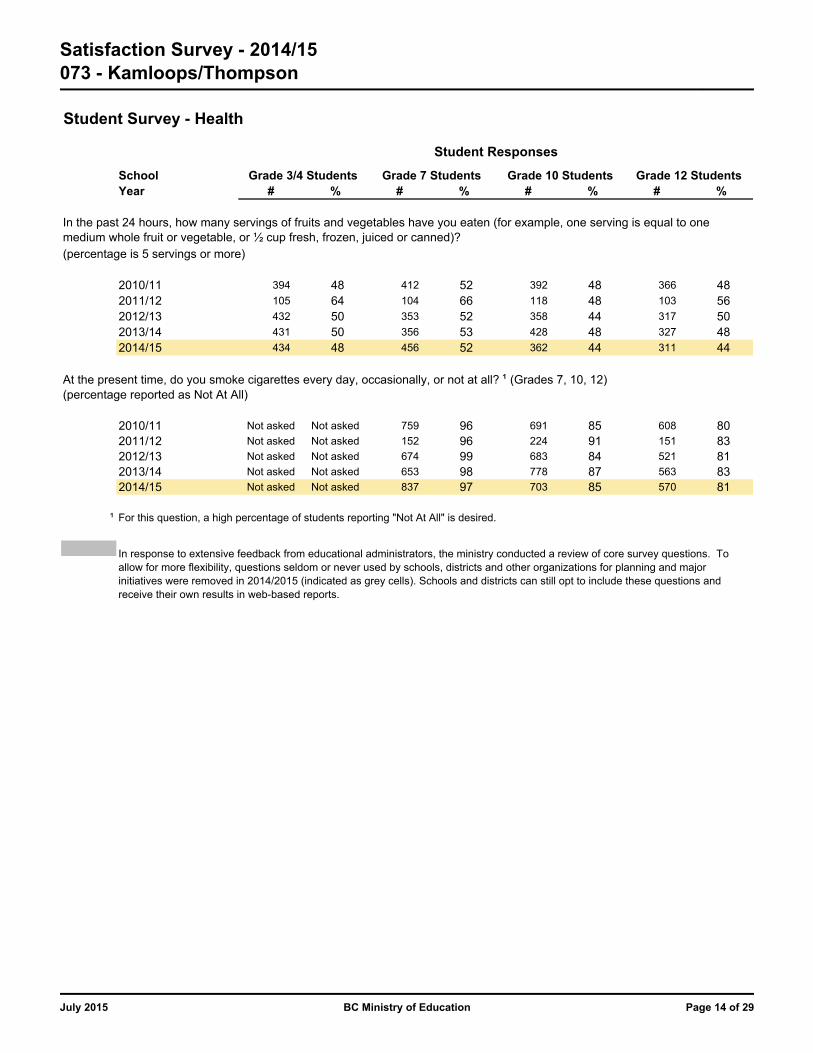
Student Survey - Health
# % # % # % # %
(percentage is 5 servings or more)
2010/11 394 48 412 52 392 48 366 482011/12 105 64 104 66 118 48 103 562012/13 432 50 353 52 358 44 317 502013/14 431 50 356 53 428 48 327 482014/15 434 48 456 52 362 44 311 44
At the present time, do you smoke cigarettes every day, occasionally, or not at all? ¹ (Grades 7, 10, 12)(percentage reported as Not At All)
2010/11 Not asked Not asked 759 96 691 85 608 802011/12 Not asked Not asked 152 96 224 91 151 832012/13 Not asked Not asked 674 99 683 84 521 812013/14 Not asked Not asked 653 98 778 87 563 832014/15 Not asked Not asked 837 97 703 85 570 81
¹ For this question, a high percentage of students reporting "Not At All" is desired.
In the past 24 hours, how many servings of fruits and vegetables have you eaten (for example, one serving is equal to one medium whole fruit or vegetable, or ½ cup fresh, frozen, juiced or canned)?
In response to extensive feedback from educational administrators, the ministry conducted a review of core survey questions. To allow for more flexibility, questions seldom or never used by schools, districts and other organizations for planning and major initiatives were removed in 2014/2015 (indicated as grey cells). Schools and districts can still opt to include these questions and receive their own results in web-based reports.
Student Responses
SchoolYear
Grade 3/4 Students Grade 7 Students Grade 10 Students Grade 12 Students
Page 14 of 29July 2015 BC Ministry of Education
Satisfaction Survey - 2014/15073 - Kamloops/Thompson
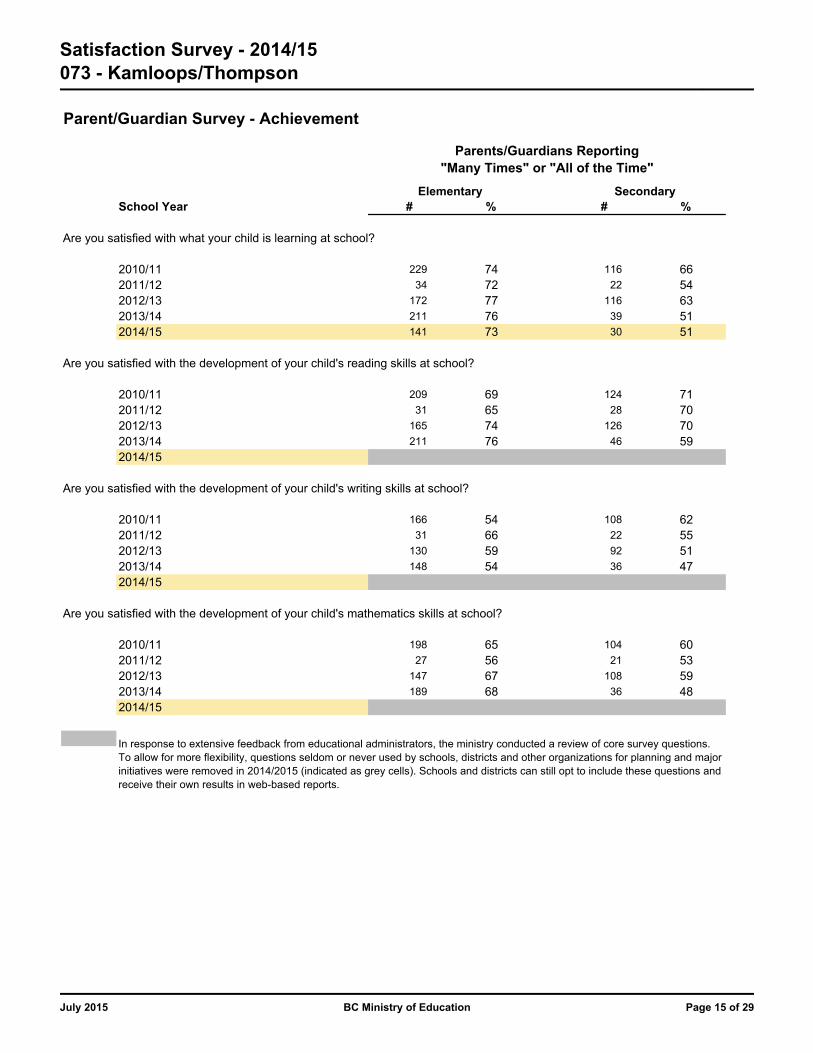
Parent/Guardian Survey - Achievement
# % # %
Are you satisfied with what your child is learning at school?
2010/11 229 74 116 662011/12 34 72 22 542012/13 172 77 116 632013/14 211 76 39 512014/15 141 73 30 51
Are you satisfied with the development of your child's reading skills at school?
2010/11 209 69 124 712011/12 31 65 28 702012/13 165 74 126 702013/14 211 76 46 592014/15
Are you satisfied with the development of your child's writing skills at school?
2010/11 166 54 108 622011/12 31 66 22 552012/13 130 59 92 512013/14 148 54 36 472014/15
Are you satisfied with the development of your child's mathematics skills at school?
2010/11 198 65 104 602011/12 27 56 21 532012/13 147 67 108 592013/14 189 68 36 482014/15
In response to extensive feedback from educational administrators, the ministry conducted a review of core survey questions. To allow for more flexibility, questions seldom or never used by schools, districts and other organizations for planning and major initiatives were removed in 2014/2015 (indicated as grey cells). Schools and districts can still opt to include these questions and receive their own results in web-based reports.
Parents/Guardians Reporting"Many Times" or "All of the Time"
School YearElementary Secondary
Page 15 of 29July 2015 BC Ministry of Education
Satisfaction Survey - 2014/15073 - Kamloops/Thompson
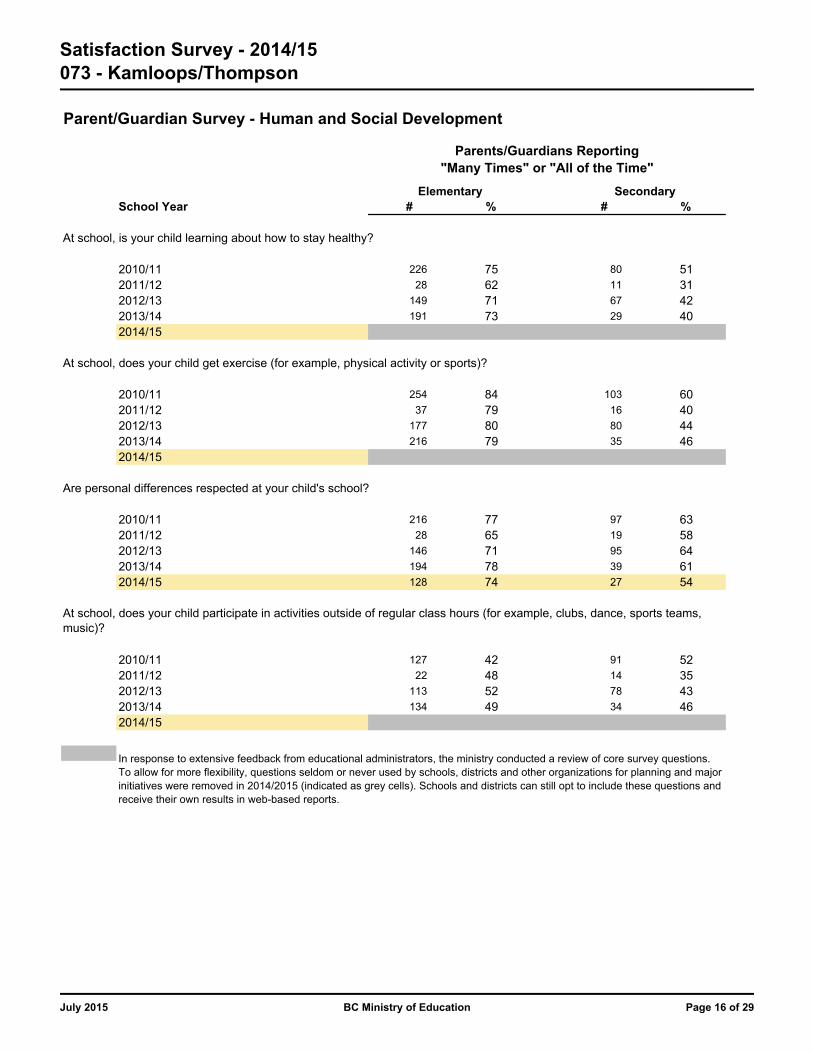
Parent/Guardian Survey - Human and Social Development
# % # %
At school, is your child learning about how to stay healthy?
2010/11 226 75 80 512011/12 28 62 11 312012/13 149 71 67 422013/14 191 73 29 402014/15
At school, does your child get exercise (for example, physical activity or sports)?
2010/11 254 84 103 602011/12 37 79 16 402012/13 177 80 80 442013/14 216 79 35 462014/15
Are personal differences respected at your child's school?
2010/11 216 77 97 632011/12 28 65 19 582012/13 146 71 95 642013/14 194 78 39 612014/15 128 74 27 54
2010/11 127 42 91 522011/12 22 48 14 352012/13 113 52 78 432013/14 134 49 34 462014/15
In response to extensive feedback from educational administrators, the ministry conducted a review of core survey questions. To allow for more flexibility, questions seldom or never used by schools, districts and other organizations for planning and major initiatives were removed in 2014/2015 (indicated as grey cells). Schools and districts can still opt to include these questions and receive their own results in web-based reports.
At school, does your child participate in activities outside of regular class hours (for example, clubs, dance, sports teams, music)?
Parents/Guardians Reporting"Many Times" or "All of the Time"
School YearElementary Secondary
Page 16 of 29July 2015 BC Ministry of Education
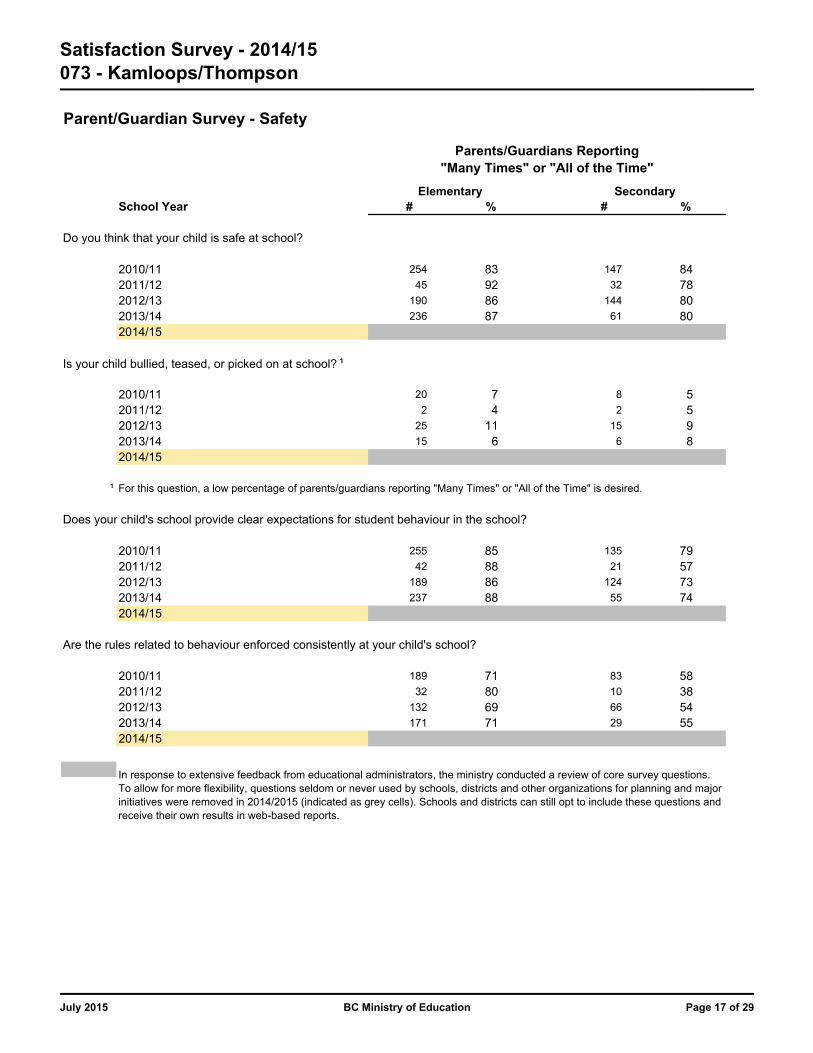
Satisfaction Survey - 2014/15073 - Kamloops/Thompson
Parent/Guardian Survey - Safety
# % # %
Do you think that your child is safe at school?
2010/11 254 83 147 842011/12 45 92 32 782012/13 190 86 144 802013/14 236 87 61 802014/15
Is your child bullied, teased, or picked on at school? ¹
2010/11 20 7 8 52011/12 2 4 2 52012/13 25 11 15 92013/14 15 6 6 82014/15
¹ For this question, a low percentage of parents/guardians reporting "Many Times" or "All of the Time" is desired.
Does your child's school provide clear expectations for student behaviour in the school?
2010/11 255 85 135 792011/12 42 88 21 572012/13 189 86 124 732013/14 237 88 55 742014/15
Are the rules related to behaviour enforced consistently at your child's school?
2010/11 189 71 83 582011/12 32 80 10 382012/13 132 69 66 542013/14 171 71 29 552014/15
In response to extensive feedback from educational administrators, the ministry conducted a review of core survey questions. To allow for more flexibility, questions seldom or never used by schools, districts and other organizations for planning and major initiatives were removed in 2014/2015 (indicated as grey cells). Schools and districts can still opt to include these questions and receive their own results in web-based reports.
Parents/Guardians Reporting"Many Times" or "All of the Time"
School YearElementary Secondary
Page 17 of 29July 2015 BC Ministry of Education
Satisfaction Survey - 2014/15073 - Kamloops/Thompson
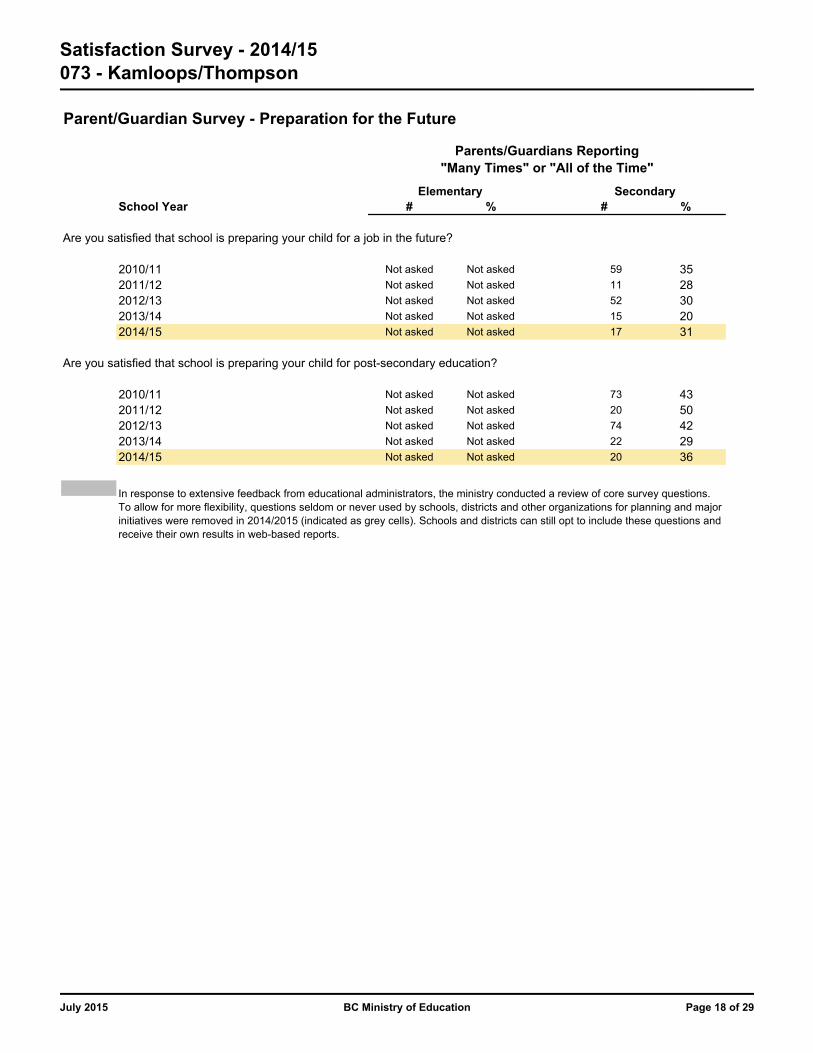
Parent/Guardian Survey - Preparation for the Future
# % # %
Are you satisfied that school is preparing your child for a job in the future?
2010/11 Not asked Not asked 59 352011/12 Not asked Not asked 11 282012/13 Not asked Not asked 52 302013/14 Not asked Not asked 15 202014/15 Not asked Not asked 17 31
Are you satisfied that school is preparing your child for post-secondary education?
2010/11 Not asked Not asked 73 432011/12 Not asked Not asked 20 502012/13 Not asked Not asked 74 422013/14 Not asked Not asked 22 292014/15 Not asked Not asked 20 36
In response to extensive feedback from educational administrators, the ministry conducted a review of core survey questions. To allow for more flexibility, questions seldom or never used by schools, districts and other organizations for planning and major initiatives were removed in 2014/2015 (indicated as grey cells). Schools and districts can still opt to include these questions and receive their own results in web-based reports.
Parents/Guardians Reporting"Many Times" or "All of the Time"
School YearElementary Secondary
Page 18 of 29July 2015 BC Ministry of Education

Satisfaction Survey - 2014/15073 - Kamloops/Thompson
Parent/Guardian Survey - School Environment
# % # %
Are you satisfied that staff treat all students fairly at school?
2010/11 195 68 86 532011/12 27 64 15 482012/13 142 69 83 582013/14 179 72 34 502014/15
Do your child's teachers help with schoolwork when needed?
2010/11 207 72 100 582011/12 25 57 17 442012/13 141 68 97 562013/14 188 72 41 542014/15
Do teachers care about your child?
2010/11 253 85 108 642011/12 34 71 23 582012/13 186 85 112 642013/14 231 86 46 612014/15
Does your child's school provide clear information about his/her progress?
2010/11 251 84 114 662011/12 16 40 20 502012/13 183 85 112 612013/14 223 81 48 632014/15 138 74 36 67
Parents/Guardians Reporting"Many Times" or "All of the Time"
School YearElementary Secondary
Page 19 of 29July 2015 BC Ministry of Education
Satisfaction Survey - 2014/15073 - Kamloops/Thompson
Parent/Guardian Survey - School Environment
# % # %
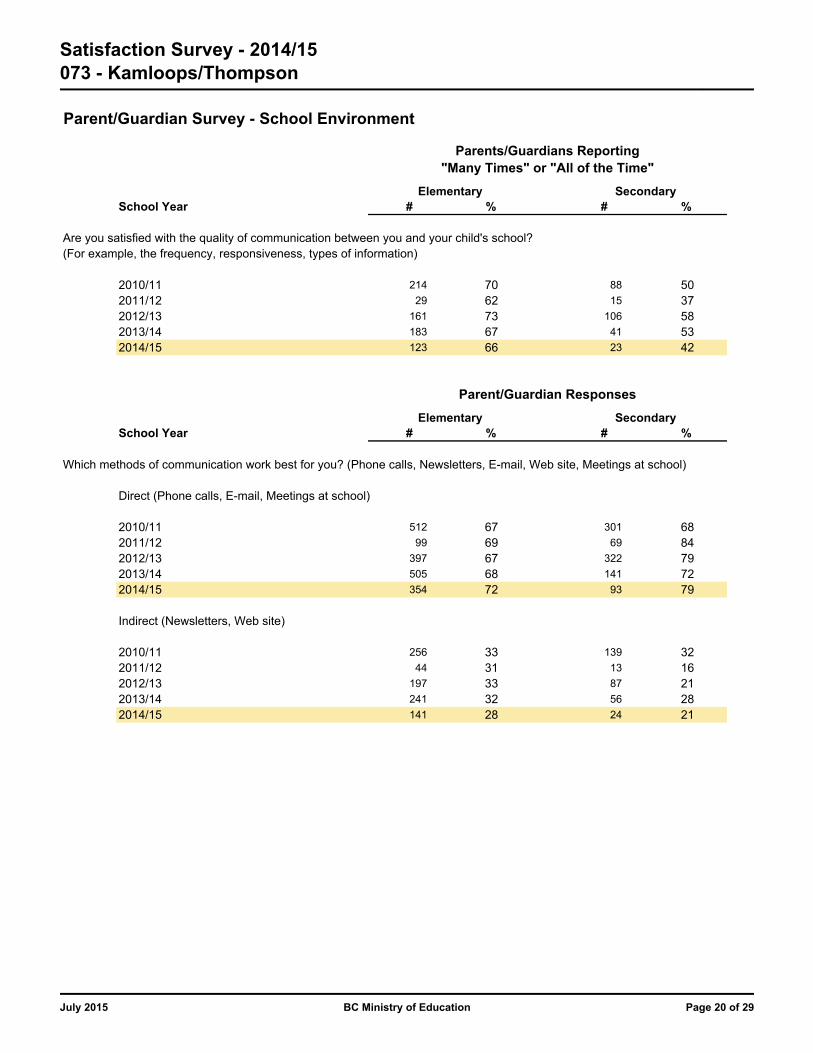
Are you satisfied with the quality of communication between you and your child's school? (For example, the frequency, responsiveness, types of information)
2010/11 214 70 88 502011/12 29 62 15 372012/13 161 73 106 582013/14 183 67 41 532014/15 123 66 23 42
# % # %
Which methods of communication work best for you? (Phone calls, Newsletters, E-mail, Web site, Meetings at school)
Direct (Phone calls, E-mail, Meetings at school)
2010/11 512 67 301 682011/12 99 69 69 842012/13 397 67 322 792013/14 505 68 141 722014/15 354 72 93 79
Indirect (Newsletters, Web site)
2010/11 256 33 139 322011/12 44 31 13 162012/13 197 33 87 212013/14 241 32 56 282014/15 141 28 24 21
Parent/Guardian Responses
School YearElementary Secondary
Parents/Guardians Reporting"Many Times" or "All of the Time"
School YearElementary Secondary
Page 20 of 29July 2015 BC Ministry of Education
Satisfaction Survey - 2014/15073 - Kamloops/Thompson
Parent/Guardian Survey - School Environment
# % # %
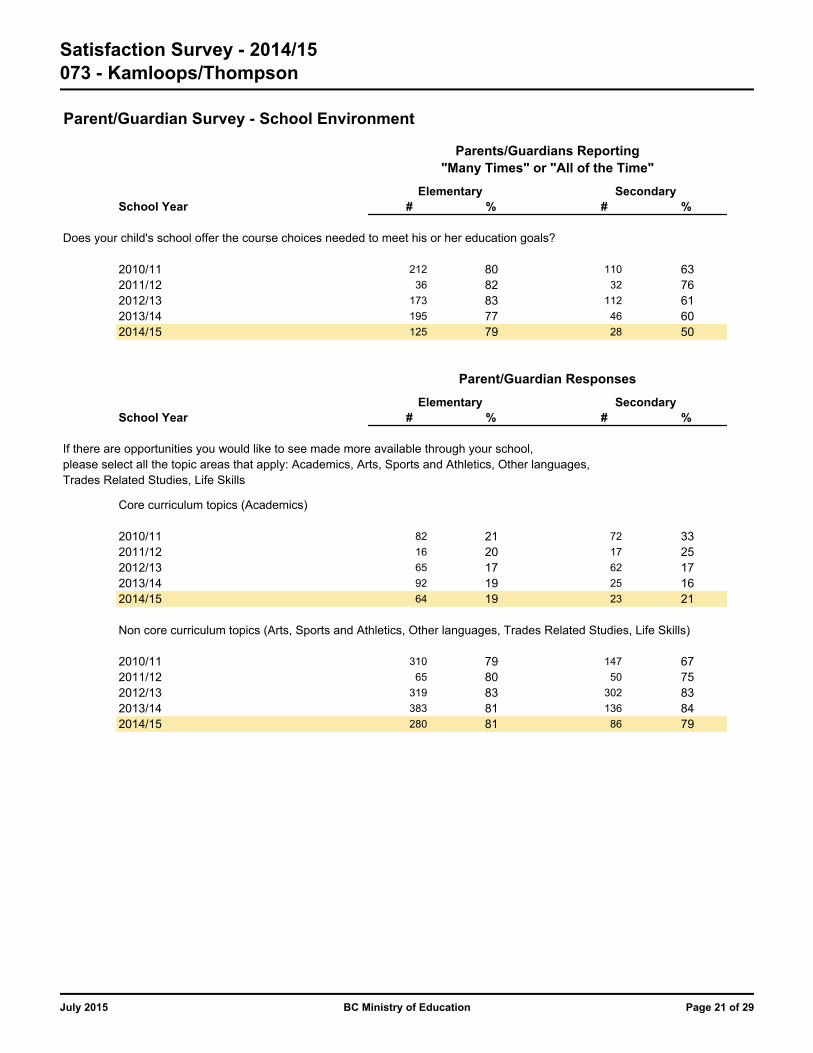
Does your child's school offer the course choices needed to meet his or her education goals?
2010/11 212 80 110 632011/12 36 82 32 762012/13 173 83 112 612013/14 195 77 46 602014/15 125 79 28 50
# % # %
If there are opportunities you would like to see made more available through your school,please select all the topic areas that apply: Academics, Arts, Sports and Athletics, Other languages,Trades Related Studies, Life Skills
Core curriculum topics (Academics)
2010/11 82 21 72 332011/12 16 20 17 252012/13 65 17 62 172013/14 92 19 25 162014/15 64 19 23 21
Non core curriculum topics (Arts, Sports and Athletics, Other languages, Trades Related Studies, Life Skills)
2010/11 310 79 147 672011/12 65 80 50 752012/13 319 83 302 832013/14 383 81 136 842014/15 280 81 86 79
Parent/Guardian Responses
School YearElementary Secondary
Parents/Guardians Reporting"Many Times" or "All of the Time"
School YearElementary Secondary
Page 21 of 29July 2015 BC Ministry of Education

Satisfaction Survey - 2014/15073 - Kamloops/Thompson
Parent/Guardian Survey - School Environment
# % # %
I would like to transfer my child to a different school. ¹
2010/11 28 9 11 62011/12 1 2 5 142012/13 11 5 16 92013/14 15 5 5 72014/15
¹ For this question, a low percentage of parents/guardians reporting "Many Times" or "All of the Time" is desired.
In response to extensive feedback from educational administrators, the ministry conducted a review of core survey questions. To allow for more flexibility, questions seldom or never used by schools, districts and other organizations for planning and major initiatives were removed in 2014/2015 (indicated as grey cells). Schools and districts can still opt to include these questions and receive their own results in web-based reports.
Parents/Guardians Reporting"Many Times" or "All of the Time"
School YearElementary Secondary
Page 22 of 29July 2015 BC Ministry of Education
Satisfaction Survey - 2014/15073 - Kamloops/Thompson
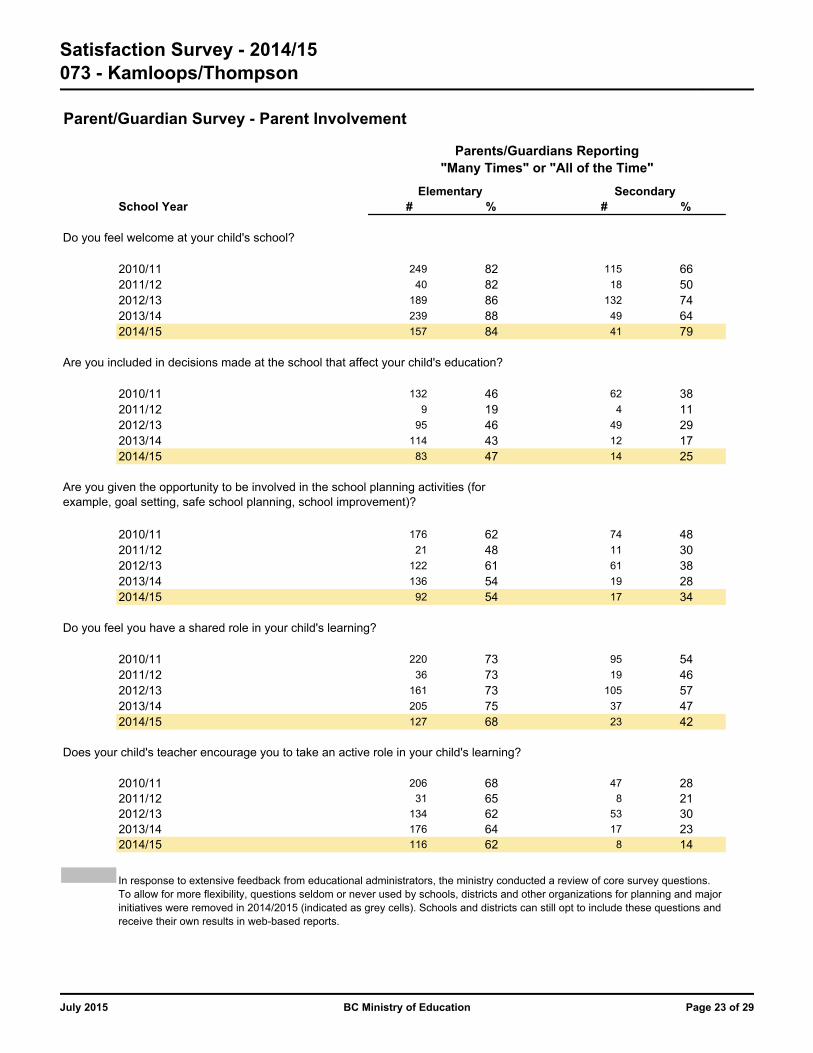
Parent/Guardian Survey - Parent Involvement
# % # %
Do you feel welcome at your child's school?
2010/11 249 82 115 662011/12 40 82 18 502012/13 189 86 132 742013/14 239 88 49 642014/15 157 84 41 79
Are you included in decisions made at the school that affect your child's education?
2010/11 132 46 62 382011/12 9 19 4 112012/13 95 46 49 292013/14 114 43 12 172014/15 83 47 14 25
2010/11 176 62 74 482011/12 21 48 11 302012/13 122 61 61 382013/14 136 54 19 282014/15 92 54 17 34
Do you feel you have a shared role in your child's learning?
2010/11 220 73 95 542011/12 36 73 19 462012/13 161 73 105 572013/14 205 75 37 472014/15 127 68 23 42
Does your child's teacher encourage you to take an active role in your child's learning?
2010/11 206 68 47 282011/12 31 65 8 212012/13 134 62 53 302013/14 176 64 17 232014/15 116 62 8 14
In response to extensive feedback from educational administrators, the ministry conducted a review of core survey questions. To allow for more flexibility, questions seldom or never used by schools, districts and other organizations for planning and major initiatives were removed in 2014/2015 (indicated as grey cells). Schools and districts can still opt to include these questions and receive their own results in web-based reports.
Are you given the opportunity to be involved in the school planning activities (for example, goal setting, safe school planning, school improvement)?
Parents/Guardians Reporting"Many Times" or "All of the Time"
School YearElementary Secondary
Page 23 of 29July 2015 BC Ministry of Education
Satisfaction Survey - 2014/15073 - Kamloops/Thompson
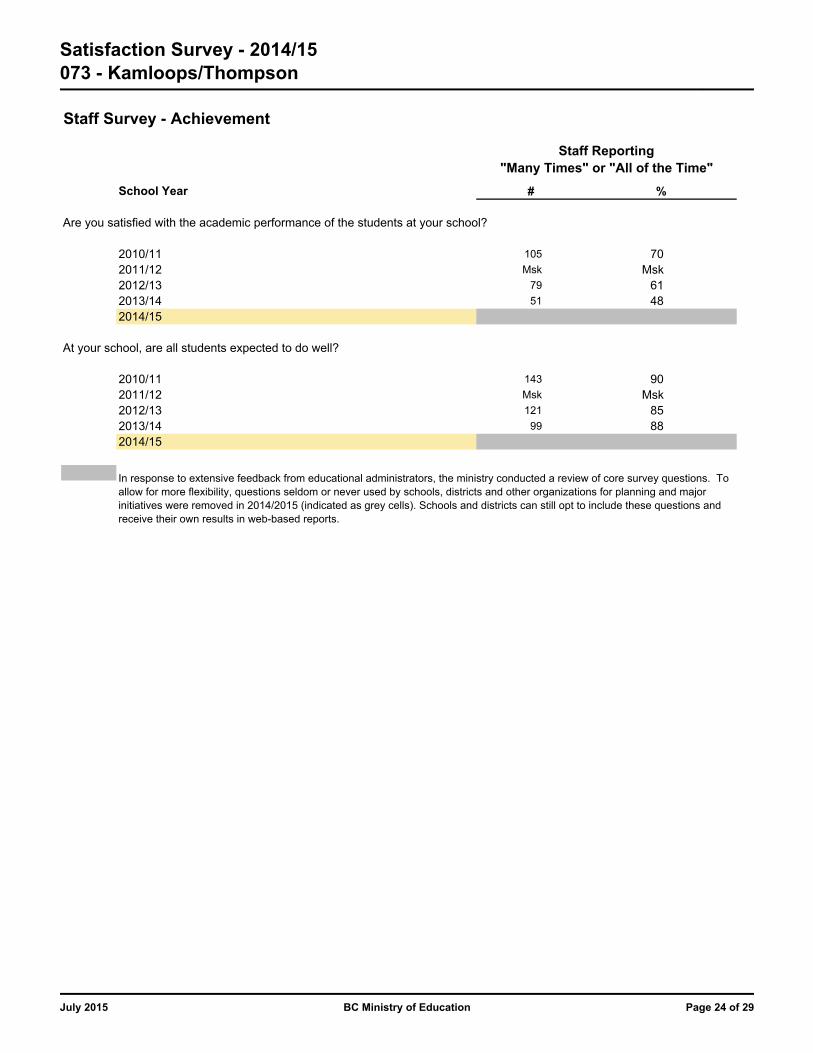
Staff Survey - Achievement
School Year # %
Are you satisfied with the academic performance of the students at your school?
2010/11 105 702011/12 Msk Msk2012/13 79 612013/14 51 482014/15
At your school, are all students expected to do well?
2010/11 143 902011/12 Msk Msk2012/13 121 852013/14 99 882014/15
Staff Reporting"Many Times" or "All of the Time"
In response to extensive feedback from educational administrators, the ministry conducted a review of core survey questions. To allow for more flexibility, questions seldom or never used by schools, districts and other organizations for planning and major initiatives were removed in 2014/2015 (indicated as grey cells). Schools and districts can still opt to include these questions and receive their own results in web-based reports.
Page 24 of 29July 2015 BC Ministry of Education
Satisfaction Survey - 2014/15073 - Kamloops/Thompson
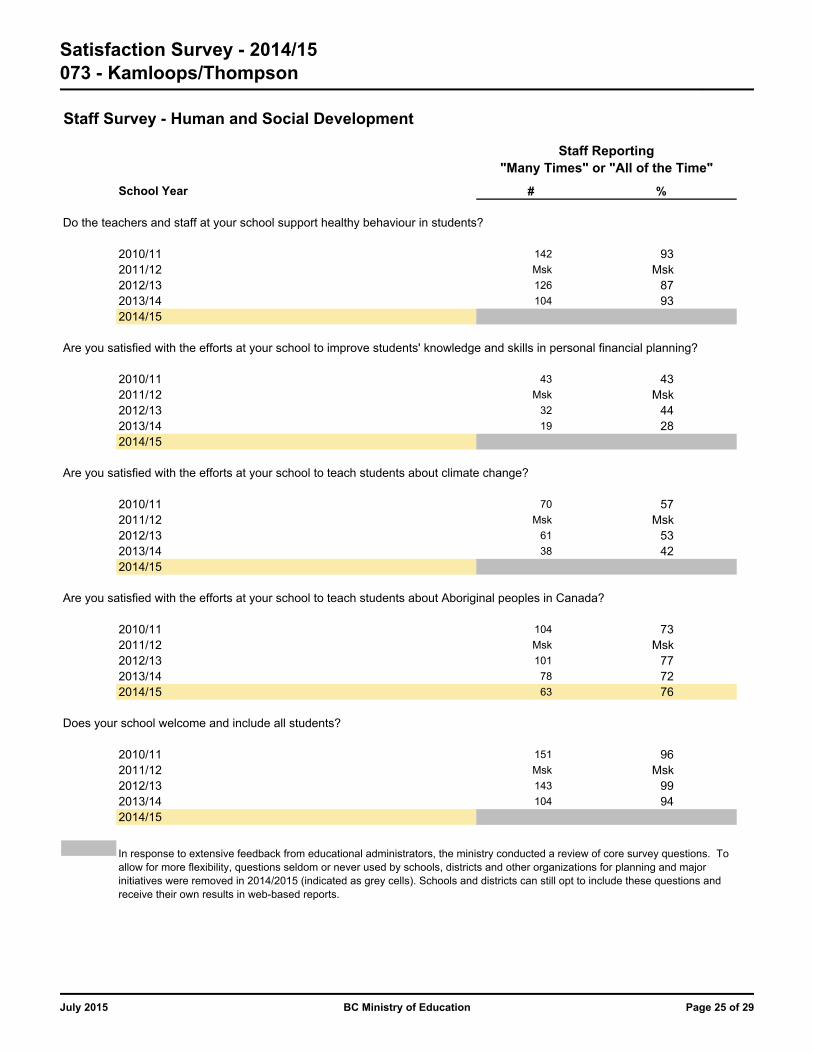
Staff Survey - Human and Social Development
School Year # %
Do the teachers and staff at your school support healthy behaviour in students?
2010/11 142 932011/12 Msk Msk2012/13 126 872013/14 104 932014/15
Are you satisfied with the efforts at your school to improve students' knowledge and skills in personal financial planning?
2010/11 43 432011/12 Msk Msk2012/13 32 442013/14 19 282014/15
Are you satisfied with the efforts at your school to teach students about climate change?
2010/11 70 572011/12 Msk Msk2012/13 61 532013/14 38 422014/15
Are you satisfied with the efforts at your school to teach students about Aboriginal peoples in Canada?
2010/11 104 732011/12 Msk Msk2012/13 101 772013/14 78 722014/15 63 76
Does your school welcome and include all students?
2010/11 151 962011/12 Msk Msk2012/13 143 992013/14 104 942014/15
Staff Reporting"Many Times" or "All of the Time"
In response to extensive feedback from educational administrators, the ministry conducted a review of core survey questions. To allow for more flexibility, questions seldom or never used by schools, districts and other organizations for planning and major initiatives were removed in 2014/2015 (indicated as grey cells). Schools and districts can still opt to include these questions and receive their own results in web-based reports.
Page 25 of 29July 2015 BC Ministry of Education
Satisfaction Survey - 2014/15073 - Kamloops/Thompson
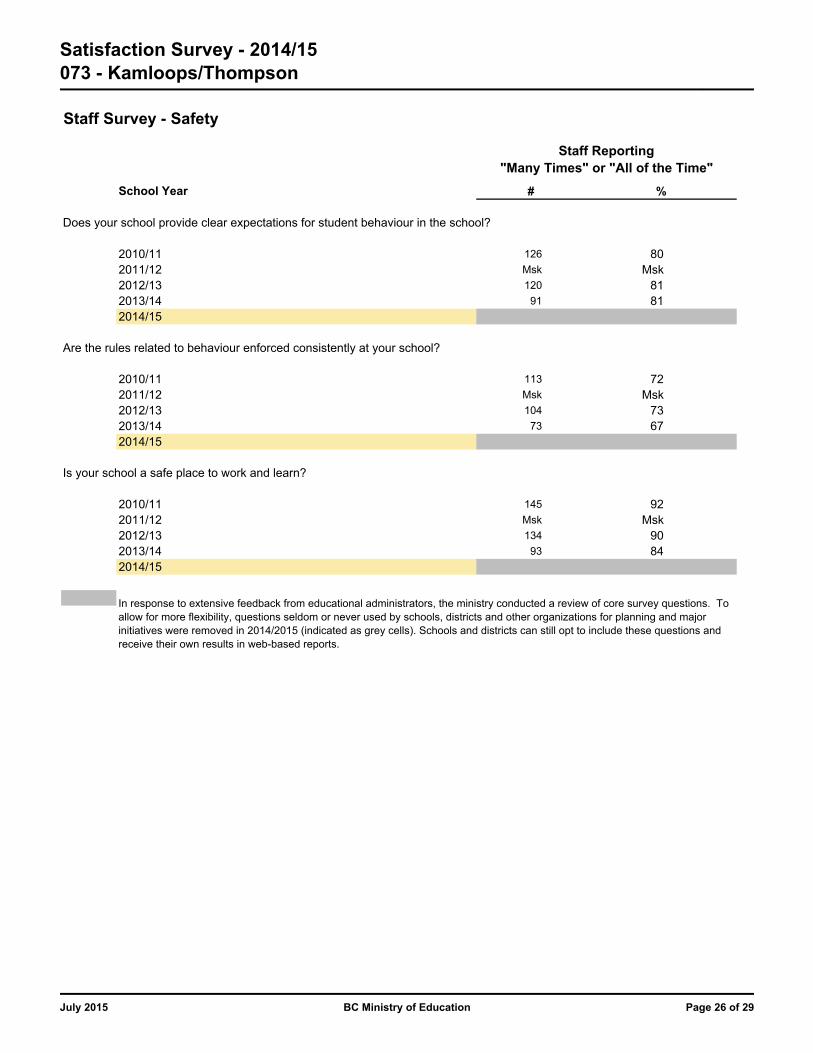
Staff Survey - Safety
School Year # %
Does your school provide clear expectations for student behaviour in the school?
2010/11 126 802011/12 Msk Msk2012/13 120 812013/14 91 812014/15
Are the rules related to behaviour enforced consistently at your school?
2010/11 113 722011/12 Msk Msk2012/13 104 732013/14 73 672014/15
Is your school a safe place to work and learn?
2010/11 145 922011/12 Msk Msk2012/13 134 902013/14 93 842014/15
Staff Reporting"Many Times" or "All of the Time"
In response to extensive feedback from educational administrators, the ministry conducted a review of core survey questions. To allow for more flexibility, questions seldom or never used by schools, districts and other organizations for planning and major initiatives were removed in 2014/2015 (indicated as grey cells). Schools and districts can still opt to include these questions and receive their own results in web-based reports.
Page 26 of 29July 2015 BC Ministry of Education

Satisfaction Survey - 2014/15073 - Kamloops/Thompson
Staff Survey - School Environment
School Year # %
Are you aware of the school goals for improving student learning?
2010/11 124 822011/12 Msk Msk2012/13 110 802013/14 91 822014/15
Does your school provide courses to meet all students' needs?
2010/11 117 802011/12 Msk Msk2012/13 98 762013/14 81 792014/15
Does your school support ongoing improvement to the quality of instruction?
2010/11 139 912011/12 Msk Msk2012/13 121 882013/14 90 852014/15 72 86
Is students' progress regularly and systematically assessed and evaluated?
2010/11 142 952011/12 Msk Msk2012/13 125 972013/14 94 942014/15 76 94
Is assessment information used to plan for instruction?
2010/11 109 832011/12 Msk Msk2012/13 104 882013/14 84 882014/15 57 80
Do teachers collaborate to plan for instruction?
2010/11 95 662011/12 Msk Msk2012/13 70 562013/14 57 552014/15 39 51
Staff Reporting"Many Times" or "All of the Time"
Page 27 of 29July 2015 BC Ministry of Education
Satisfaction Survey - 2014/15073 - Kamloops/Thompson
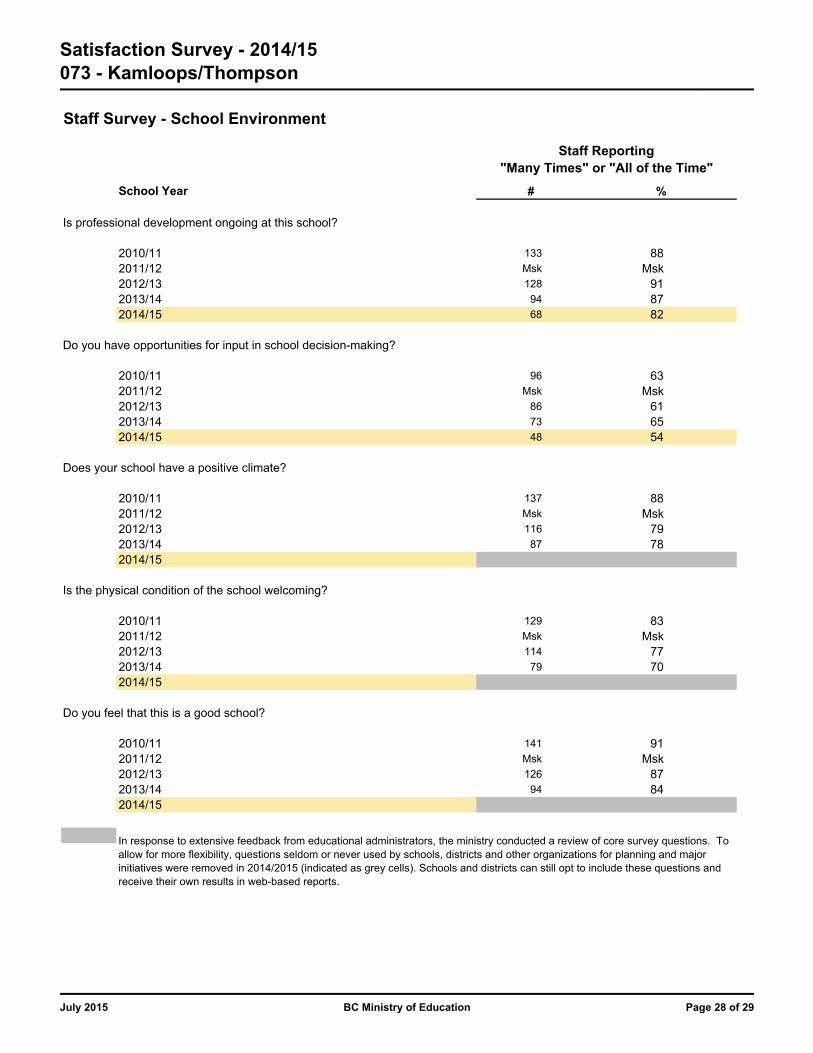
Staff Survey - School Environment
School Year # %
Staff Reporting"Many Times" or "All of the Time"
Is professional development ongoing at this school?
2010/11 133 882011/12 Msk Msk2012/13 128 912013/14 94 872014/15 68 82
Do you have opportunities for input in school decision-making?
2010/11 96 632011/12 Msk Msk2012/13 86 612013/14 73 652014/15 48 54
Does your school have a positive climate?
2010/11 137 882011/12 Msk Msk2012/13 116 792013/14 87 782014/15
Is the physical condition of the school welcoming?
2010/11 129 832011/12 Msk Msk2012/13 114 772013/14 79 702014/15
Do you feel that this is a good school?
2010/11 141 912011/12 Msk Msk2012/13 126 872013/14 94 842014/15
In response to extensive feedback from educational administrators, the ministry conducted a review of core survey questions. To allow for more flexibility, questions seldom or never used by schools, districts and other organizations for planning and major initiatives were removed in 2014/2015 (indicated as grey cells). Schools and districts can still opt to include these questions and receive their own results in web-based reports.
Page 28 of 29July 2015 BC Ministry of Education

Satisfaction Survey - 2014/15073 - Kamloops/Thompson
Staff Survey - Parent Involvement
School Year # %
In your school, do staff members work hard to maintain good relations with parents?
2010/11 144 952011/12 Msk Msk2012/13 125 952013/14 88 852014/15 84 94
Are parents involved in decisions at the school that affect their child?
2010/11 118 812011/12 Msk Msk2012/13 90 722013/14 74 742014/15 67 79
Do you believe that parents should have a shared role in their child's learning?
2010/11 140 892011/12 Msk Msk2012/13 130 872013/14 105 932014/15 84 88
Do you encourage parents to take an active role in their child's learning?
2010/11 129 842011/12 Msk Msk2012/13 116 822013/14 91 832014/15 73 79
Does your school welcome the input of parents in school-planning activities?
2010/11 112 802011/12 Msk Msk2012/13 102 832013/14 74 762014/15 59 79
Does your school welcome the participation of parents (for example, volunteering)?
2010/11 132 862011/12 Msk Msk2012/13 119 892013/14 95 882014/15 74 84
Staff Reporting"Many Times" or "All of the Time"
Page 29 of 29July 2015 BC Ministry of Education
Related Documents


![arXiv:2001.03787v1 [eess.SY] 11 Jan 2020 · 2020. 1. 14. · Hashim A. Hashima aDepartment of Engineering and Applied Science, Thompson Rivers University, Kamloops, Britich Columbia,](https://static.cupdf.com/doc/110x72/60c952350e708a3d8833f636/arxiv200103787v1-eesssy-11-jan-2020-2020-1-14-hashim-a-hashima-adepartment.jpg)