Satellite detection of earlier wheat sowing in India and implications for yield trends David B. Lobell a,⇑ , J. Ivan Ortiz-Monasterio b , Adam M. Sibley a , V.S. Sohu c a Department of Environmental Earth System Science and Program on Food Security and the Environment, Stanford University, Stanford, CA 94305, United States b International Maize and Wheat Improvement Center (CIMMYT), Global Conservation Agriculture Program, Apdo. Postal 6-641, 06600 Mexico DF, Mexico c Department of Plant Breeding & Genetics, Punjab Agricultural University, Ludhiana, India article info Article history: Received 25 January 2012 Received in revised form 23 August 2012 Accepted 24 September 2012 Available online xxxx Keywords: Agronomy Remote sensing Conservation agriculture abstract Wheat is a staple crop throughout much of India, but in many areas it is commonly sown past the opti- mum window for yields. Recent technologies, such as adoption of no-till practices or earlier maturing cot- ton and rice varieties, have enabled some farmers to sow wheat earlier, but repeatable and publicly available measurements of sow date trends are lacking. Here we utilize satellite measurements since 2000 to estimate sow dates over a decade throughout wheat growing areas in India. Comparisons with ground-based sow dates in Punjab confirmed the reliability of satellite estimates, and data from two independent satellite sensors were used as a robustness check. We find statistically significant (p < 0.05) shifts toward earlier sowing of wheat throughout much of Haryana and Uttar Pradesh, with insignificant changes in Punjab. A production-weighted average of the entire region indicates that, on average, wheat was sown 1 week earlier by 2010 than it was at the beginning of the decade. Using pre- viously published experimental estimates of yield gains from earlier sowing, we estimate that an overall yield gain of at least 5% averaged across India can be explained by the sow date trend. Given that national yield changes since 2000 have been less than 5%, our results indicate that the sow date shift has been a major factor in yield changes over the past decade, and that the net yield effect of all factors other than sow date has been close to zero, perhaps even negative. The results also indicate that sow dates in much of Haryana and western Uttar Pradesh are nearing or already at the optimum window for yields, so that yield benefits from sow date shifts will likely diminish in the next decade. Ó 2012 Elsevier Ltd. All rights reserved. 1. Introduction Wheat is a major staple in South Asia, a region which continues to have over 300 million malnourished people despite relatively rapid economic growth. Improving wheat yields in the Indo- Gangetic Plains (IGPs) would be a valuable contributor to meeting growing demand for food in the region. However, concerns have mounted over the past decade that wheat yields have stopped rising in experimental trials (Ladha et al., 2003) and in farmers’ fields (Chatrath et al., 2007; Lin and Huybers, 2012). Many factors have been cited as explanations for the slowdown in yield growth, including declining soil potassium (Ladha et al., 2003), increased temperatures (Pathak et al., 2003), and increased disease pressures (Sharma et al., 2007). As a partial solution to yield stagnation, several researchers have proposed that adoption of zero-till or reduced-till (ZRT) man- agement of wheat, whereby drill seeders are used to sow wheat directly into soil, could offer significant yield gains (Mehla et al., 2000; Hobbs, 2001; Hobbs et al., 2008). Currently, much of the planted area of wheat in India is sown after the optimal sowing window because summer crops (typically rice or cotton) have to be harvested and the fields then prepared for wheat sowing. ZRT eliminates this preparation requirement and thus allows sowing as much as 2 weeks before traditional methods in western IGP states, such as Haryana, and nearly a month in eastern IGP states, such as Bihar (Erenstein and Laxmi, 2008). Each day of sowing de- lay causes roughly 0.8–1.5% yield loss according to field experi- ments (e.g., Randhawa et al., 1981; Ortiz-Monasterio et al., 1994) and simulation models (Aggarwal and Kalra, 1994), largely because of excessive heat near the end of the season. Thus, adoption of ZRT has shown clear yield gains in cases where it enables wheat sowing closer to the optimum window around mid-November (Erenstein and Laxmi, 2008). Adoption of ZRT by farmers began in the late 1990s with a roughly exponential increase between 2000 and 2004 (Fig. 1). Offi- cial statistics on ZRT area were not collected after 2004 but some recent surveys indicate that net adoption of ZRT has stagnated at roughly 20–25% of total area in survey villages in Northwest IGP (Erenstein, 2009; Singh et al., 2009). However, in recent years there have also been other trends that facilitate earlier planting of wheat, such as the adoption of new cultivars of Bt cotton throughout much of the cotton–wheat region, and increased use of rotavator tillage systems throughout much of the IGP (Erenstein, 2009). Bt 0308-521X/$ - see front matter Ó 2012 Elsevier Ltd. All rights reserved. http://dx.doi.org/10.1016/j.agsy.2012.09.003 ⇑ Corresponding author. E-mail address: [email protected] (D.B. Lobell). Agricultural Systems xxx (2012) xxx–xxx Contents lists available at SciVerse ScienceDirect Agricultural Systems journal homepage: www.elsevier.com/locate/agsy Please cite this article in press as: Lobell, D.B., et al. Satellite detection of earlier wheat sowing in India and implications for yield trends. Agr. Syst. (2012), http://dx.doi.org/10.1016/j.agsy.2012.09.003

Welcome message from author
This document is posted to help you gain knowledge. Please leave a comment to let me know what you think about it! Share it to your friends and learn new things together.
Transcript
Agricultural Systems xxx (2012) xxx–xxx
Contents lists available at SciVerse ScienceDirect
Agricultural Systems
journal homepage: www.elsevier .com/locate /agsy
Satellite detection of earlier wheat sowing in India and implications for yield trends
David B. Lobell a,⇑, J. Ivan Ortiz-Monasterio b, Adam M. Sibley a, V.S. Sohu c
a Department of Environmental Earth System Science and Program on Food Security and the Environment, Stanford University, Stanford, CA 94305, United Statesb International Maize and Wheat Improvement Center (CIMMYT), Global Conservation Agriculture Program, Apdo. Postal 6-641, 06600 Mexico DF, Mexicoc Department of Plant Breeding & Genetics, Punjab Agricultural University, Ludhiana, India
a r t i c l e i n f o a b s t r a c t
Article history:Received 25 January 2012Received in revised form 23 August 2012Accepted 24 September 2012Available online xxxx
Keywords:AgronomyRemote sensingConservation agriculture
0308-521X/$ - see front matter � 2012 Elsevier Ltd. Ahttp://dx.doi.org/10.1016/j.agsy.2012.09.003
⇑ Corresponding author.E-mail address: [email protected] (D.B. Lobell)
Please cite this article in press as: Lobell, D.B., ehttp://dx.doi.org/10.1016/j.agsy.2012.09.003
Wheat is a staple crop throughout much of India, but in many areas it is commonly sown past the opti-mum window for yields. Recent technologies, such as adoption of no-till practices or earlier maturing cot-ton and rice varieties, have enabled some farmers to sow wheat earlier, but repeatable and publiclyavailable measurements of sow date trends are lacking. Here we utilize satellite measurements since2000 to estimate sow dates over a decade throughout wheat growing areas in India. Comparisons withground-based sow dates in Punjab confirmed the reliability of satellite estimates, and data from twoindependent satellite sensors were used as a robustness check. We find statistically significant(p < 0.05) shifts toward earlier sowing of wheat throughout much of Haryana and Uttar Pradesh, withinsignificant changes in Punjab. A production-weighted average of the entire region indicates that, onaverage, wheat was sown 1 week earlier by 2010 than it was at the beginning of the decade. Using pre-viously published experimental estimates of yield gains from earlier sowing, we estimate that an overallyield gain of at least 5% averaged across India can be explained by the sow date trend. Given that nationalyield changes since 2000 have been less than 5%, our results indicate that the sow date shift has been amajor factor in yield changes over the past decade, and that the net yield effect of all factors other thansow date has been close to zero, perhaps even negative. The results also indicate that sow dates in muchof Haryana and western Uttar Pradesh are nearing or already at the optimum window for yields, so thatyield benefits from sow date shifts will likely diminish in the next decade.
� 2012 Elsevier Ltd. All rights reserved.
1. Introduction
Wheat is a major staple in South Asia, a region which continuesto have over 300 million malnourished people despite relativelyrapid economic growth. Improving wheat yields in the Indo-Gangetic Plains (IGPs) would be a valuable contributor to meetinggrowing demand for food in the region. However, concerns havemounted over the past decade that wheat yields have stoppedrising in experimental trials (Ladha et al., 2003) and in farmers’fields (Chatrath et al., 2007; Lin and Huybers, 2012). Many factorshave been cited as explanations for the slowdown in yield growth,including declining soil potassium (Ladha et al., 2003), increasedtemperatures (Pathak et al., 2003), and increased disease pressures(Sharma et al., 2007).
As a partial solution to yield stagnation, several researchershave proposed that adoption of zero-till or reduced-till (ZRT) man-agement of wheat, whereby drill seeders are used to sow wheatdirectly into soil, could offer significant yield gains (Mehla et al.,2000; Hobbs, 2001; Hobbs et al., 2008). Currently, much of theplanted area of wheat in India is sown after the optimal sowing
ll rights reserved.
.
t al. Satellite detection of earlier
window because summer crops (typically rice or cotton) have tobe harvested and the fields then prepared for wheat sowing. ZRTeliminates this preparation requirement and thus allows sowingas much as 2 weeks before traditional methods in western IGPstates, such as Haryana, and nearly a month in eastern IGP states,such as Bihar (Erenstein and Laxmi, 2008). Each day of sowing de-lay causes roughly 0.8–1.5% yield loss according to field experi-ments (e.g., Randhawa et al., 1981; Ortiz-Monasterio et al., 1994)and simulation models (Aggarwal and Kalra, 1994), largely becauseof excessive heat near the end of the season. Thus, adoption of ZRThas shown clear yield gains in cases where it enables wheat sowingcloser to the optimum window around mid-November (Erensteinand Laxmi, 2008).
Adoption of ZRT by farmers began in the late 1990s with aroughly exponential increase between 2000 and 2004 (Fig. 1). Offi-cial statistics on ZRT area were not collected after 2004 but somerecent surveys indicate that net adoption of ZRT has stagnated atroughly 20–25% of total area in survey villages in Northwest IGP(Erenstein, 2009; Singh et al., 2009). However, in recent years therehave also been other trends that facilitate earlier planting of wheat,such as the adoption of new cultivars of Bt cotton throughoutmuch of the cotton–wheat region, and increased use of rotavatortillage systems throughout much of the IGP (Erenstein, 2009). Bt
wheat sowing in India and implications for yield trends. Agr. Syst. (2012),

Fig. 1. Percentage of total wheat area planted using zero or reduced till (ZRT)methods, from 2002 to 2004 harvest years (source: Erenstein and Laxmi, 2008).
2 D.B. Lobell et al. / Agricultural Systems xxx (2012) xxx–xxx
cotton matures roughly 1 month sooner than traditional cottonvarieties, whereas rotavators allow preparation of the field in a sin-gle pass that pulverizes the shallow layers of the soil. Both technol-ogies therefore allow earlier sowing of wheat, although they do notpossess some of the other benefits of ZRT such as improved soilstructure and organic matter accumulation.
Despite selected surveys and anecdotal evidence on adoption ofvarious technologies that affect sow date, little is known about theoverall impacts on wheat systems throughout the region. Fortu-nately, however, just as ZRT rates were increasing at the turn ofthe century, so too was the ability to monitor vegetation dynamicsusing satellites. In the current study, we use data from the Moder-ate Resolution Imaging Spectroradiometer (MODIS) and the Satel-lite Pour l’Observation de la Terre Vegetation (SPOT) sensors tomeasure sow dates on an annual basis since 2000 throughout theIndian section of the IGP. The advantages of using satellite remotesensing in this case include the ability to monitor the entire grow-ing region at low cost, the ability to obtain objective measures ofsow dates via repeatable methods, and the lack of any comparableground-based records on management trends.
Using these satellite datasets, the goals of the study are twofold:(i) to measure and document trends in sow dates throughout theregion, which can provide an indirect measure of adoption ofnew technologies; and (ii) to estimate the effects of these sow datetrends on overall wheat yield progress in the past decade. The lat-ter is the main goal of the paper, as understanding the role of sowdates in yield change can help to elucidate the net effect of otherfactors, such as trends in soil or climatic conditions.
2. Methods
In order to obtain spatially explicit estimates of sow datesacross the IGP we used the vegetation index (VI) products fromMODIS and SPOT in conjunction with Timesat (Jönsson andEklundh, 2004). We restrict our analysis to areas of the IGP thatregularly cultivate wheat using a global map of wheat harvestedarea (Monfreda et al., 2008). The harvested area product has a100 (roughly 20 km) spatial resolution and gives the percentageof each cell that is cultivated with wheat in the year 2000. We de-fined our study area as the land within India above 24�N that isalso at least 40% cultivated in the Monfreda map (see Fig. 2).
Please cite this article in press as: Lobell, D.B., et al. Satellite detection of earlierhttp://dx.doi.org/10.1016/j.agsy.2012.09.003
Within this study area both VI products give temporal coveragespanning the years 2000–2010. Our MODIS time series was ob-tained by combining the MOD13A2 (Terra) and MYD13A2 (Aqua)products (available at https://lpdaac.usgs.gov). Each gives the max-imum value of the enhanced VI (EVI) over a 16 day compositingwindow with an 8 day offset between the two products, yieldingEVI estimates at 8 day intervals. The SPOT time series for the sameperiod is composited within a 10 day window and represents anormalized difference VI (NDVI). Both products cover the entirestudy area at a spatial resolution of 1 km.
The use of MODIS data to estimate plant phenology is wellestablished in the literature. At the global scale, detection of themaximum curvature change rates of fitted logistic functions hasbeen shown to yield good approximations of greenup and maturityonset at broad scales and across vegetation types (Zhang et al.,2006). At finer scales more detailed algorithms have been appliedand tested against ground truth data, both in natural ecosystems(Beck et al., 2007) and croplands (Sakamoto et al., 2005). Both ofthese studies demonstrate reasonable agreement between predic-tions and validation data at the pixel level as well as unbiased lin-ear relationships between the two, suggesting that greenup andmaturity estimates from MODIS VIs would give robust predictionsof decadal scale trends at reasonable levels of spatial aggregation.Sakamoto et al. (2010) provide good evidence of the agreement be-tween MODIS derived phenology estimates and metrics of cropdevelopment given at the level of agricultural statistical districtsby the National Agricultural Statistics Service.
For both VI time series we used Timesat to extract an estimateof sow date. Timesat is a program that provides robust methods offitting a variety of functions to time series data (Jönsson andEklundh, 2004). In this study we fit double logistic functions toeach time series on a pixel-by-pixel basis. From our fitted functionswe were able to extract estimates of the date each year when thegreen-up phase began; green-up in this study is defined as thepoint when a fitted curve reaches 10% of that year’s maximumamplitude.
The estimates of green-up represent the earliest time that veg-etation growth can be reliably detected by satellite, and should beoffset from actual sow dates by a fixed number of days related tothe time between sowing and emergence. To confirm this, simula-tions were run with the CERES-Wheat model at a location with aweather station in Northwest India (28.05�N, 77.17�E). Simulationswere run for various sow dates for a 9 year period (harvest years2001–2009) for a field using a cultivar typical of the region andwithout water or nitrogen stress, given that fields in the study re-gion are irrigated and well-fertilized. The date at which simulatedleaf area index (LAI) reached 10% of its maximum value were ob-tained for each simulation, and plotted against the correspondingsow date (Fig. 3). The green-up date (at 10% of LAI) was highly cor-related with the initial sow date (R2 = 0.98), with an average ofroughly 3 weeks separating the two dates.
Pixel level estimates of green-up were aggregated on a yearlybasis by taking the mean of all the wheat pixels in each districtin the IGP. Statewide averages were also computed by taking aweighted average of values in districts, with weights equal to theproportion of average statewide wheat production from each dis-trict. An ‘‘All India’’ average was similarly computed from the dis-trict-level averages. Although our study only considered districtsnorth of 24�N, only a very small fraction of wheat is producedsouth of this latitude. For presentation, we focus on trends forthree main states (Punjab, Haryana, and Uttar Pradesh (UP)), aswell as for the ‘‘All India’’ average.
As mentioned the literature presents reason for confidence indetecting crop phenology. Nonetheless we also sought indepen-dent ground-based estimates of sow date for comparison whereavailable. In particular, average sow dates within the state of
wheat sowing in India and implications for yield trends. Agr. Syst. (2012),
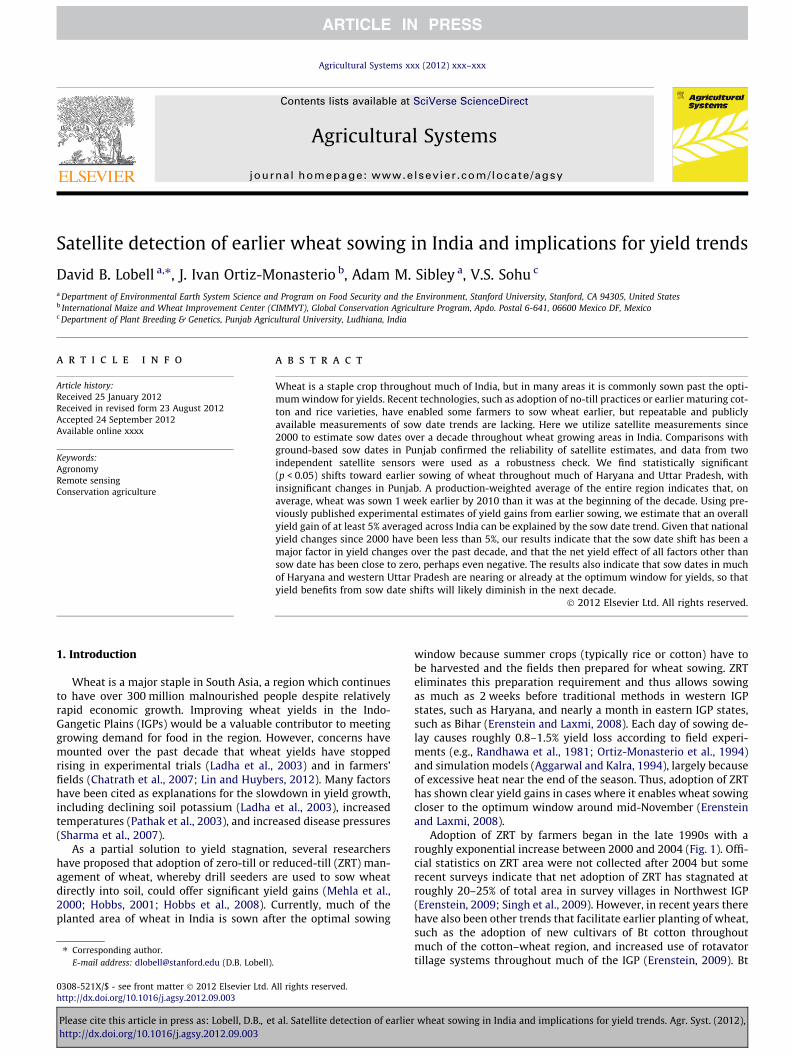
Fig. 2. Estimates of green-up date for wheat in India in (a) 2001, (c) 2010, and (e) linear trend between 2001 and 2010 using MODIS data. (b, d, and f) same as (a, c, and e) butfor SPOT data. Only cells with at least 30% wheat area based on the maps of (Monfreda et al., 2008) were analyzed. Thin black lines show outline of districts, and thick blacklines show outline of states. (For interpretation of the references to color in this figure legend, the reader is referred to the web version of this article.)
D.B. Lobell et al. / Agricultural Systems xxx (2012) xxx–xxx 3
Punjab were obtained for each year from surveys conducted byPunjab Agricultural University, Department of Economics & Sociol-ogy, under the Extension Education Scheme. The surveys typicallycover at least 6000 farmers within the state each year. Statewideaverages were available for harvest years 2000–2012, while esti-mates for six individual districts were also available for harvestyears 2011–2012. The mean estimates of green-up from MODISand SPOT were converted to sow date using the relationships ob-tained with the CERES-Wheat simulations described above. Foreach year, the average satellite sow date estimates for Punjab werecompared to reported data to examine agreement both for means
Please cite this article in press as: Lobell, D.B., et al. Satellite detection of earlierhttp://dx.doi.org/10.1016/j.agsy.2012.09.003
and trends. For the six districts with available data since 2011, re-ported average satellite estimates for the study period (2000–2010) were compared to the reported dates.
3. Results and discussion
Estimates of wheat green-up dates from MODIS showed a clearpattern of early sowing in Northwest IGP to late sowing in the East-ern IGP (Fig. 2a and c). Within states, gradients that reflect differ-ences in cropping systems are also evident. For example, the
wheat sowing in India and implications for yield trends. Agr. Syst. (2012),

Fig. 3. Simulated green-up dates in CERES-Wheat simulations (day of year at whichleaf area index reaches 10% of maximum value) vs. the corresponding sow dates(day of year) in the simulations. Each point corresponds to a single year and sowdate combination, with simulations performed for harvest years 2001–2009. Pointsare jittered to avoid overlapping points. No water or nitrogen stress was simulated,given that fields in the study region are heavily irrigated and fertilized. The highcorrelation indicates that changes in green-up date are a good measure of changesin sow dates.
Fig. 4. Comparison of average satellite estimates and reported sow dates for sixdistricts in Punjab with available ground-based survey data. Survey data areaverages over 2011–2012, while satellite estimates are averages over 2000–2010.
4 D.B. Lobell et al. / Agricultural Systems xxx (2012) xxx–xxx
southwestern region of Punjab has sandier soils which are lessfavorable for rice production, resulting in the widespread rotationof wheat with cotton. Since cotton tends to be harvested later thanrice, the average wheat sow date is significantly later in this part ofthe Punjab. Estimates derived from the alternative dataset fromSPOT exhibited very similar spatial patterns in green-up dates forindividual years (Fig. 2b and d).
Comparison of satellite estimates with ground data in Punjabconfirmed the ability of satellites to detect sow dates. In particular,statewide satellite estimates from both MODIS and SPOT averagedwithin 2 day of reported values (Table 1). Most relevant for the cur-rent study, the ground-based data showed a small and statisticallyinsignificant positive trend of 0.4 days per year, which was within0.2 days per year of the trend estimates from both sensors.Reported district level data were also in agreement with satellitedata, with satellite data explaining more than 75% of spatial vari-ance in sow date estimates (Fig. 4). Although ground-based evalu-ation was limited to Punjab, this analysis lends confidence to theuse of satellite data to evaluate sow date trends within IGP.
Table 1Average sow date in the state of Punjab by year as reported by official statistics and estimaacross all years and the linear trend in sow date, respectively.
Year Reported sow date MODIS sow date Differe
2001 316 313 �32002 315 315 02003 313 311 �22004 315 313 �22005 312 310 �22006 315 323 72007 316 308 �82008 316 308 �82009 317 314 �42010 318 319 1Average 315 313 �2Trend (days/year) 0.40 0.20 �0.20
Please cite this article in press as: Lobell, D.B., et al. Satellite detection of earlierhttp://dx.doi.org/10.1016/j.agsy.2012.09.003
Trends in green-up for the ten wheat seasons in the MODIS re-cord (harvest years 2001–2010) show significant advances ofgreen-up for much of Haryana and UP, with an opposite trend to-ward later sowing in Punjab (Fig. 2e). Again, these same patternsare evident with the SPOT data (Fig. 2f). The average sow dateswithin each state exhibited statistically significant (p < 0.05) nega-tive trends for Haryana, UP, and for India as a whole (Fig. 4). In Pun-jab, trends were slightly positive and not statistically significant,indicating that sow dates have not appreciably changed in Punjabsince 2000. As a result of these contrasting trends, there has been aconvergence towards more similar sow dates throughout the re-gion. For example, the average sow date in Punjab was more than10 days earlier than in Haryana for 2001, but by 2010 the averagesow date was actually slightly earlier in Haryana (Fig. 5). Green-updates in both states now average roughly December 1 (day of year335), corresponding to sow dates around November 10.
One likely cause of the trend toward earlier green-up inHaryana and UP has been adoption of ZRT. As discussed above,Haryana in particular witnessed a substantial fraction of wheatarea converted to this technology by 2005 (Fig. 1). However, thereare several reasons to believe that other factors are also influencinga move toward earlier sowing. First, the estimated green-up trendsin UP are nearly as large as in Haryana, despite the fact that re-corded rates of ZRT adoption are generally much lower in UP(Fig. 1). Second, sow dates continued to move earlier after 2005,when some survey data suggest that adoption of ZRT slowed
ted in this study using MODIS and SPOT. Bottom two rows show the average sow date
nce (MODIS-reported) SPOT sow date Difference (SPOT-reported)
311 �4307 �8317 4315 1309 �3317 2307 �9312 �5314 �4321 3313 �20.57 0.18
wheat sowing in India and implications for yield trends. Agr. Syst. (2012),

Fig. 5. Average green-up date (day of year) estimated for wheat in three states andfor national average, using MODIS for harvest years 2001–2010. Averages for allwheat pixels were first computed within districts, and then an average for the stateor country was computed using weights based on total production within eachdistrict. Dashed line shows best-fit linear slope.
Fig. 6. (a) Linear slope of sow date trend (2001–2010) for three states and for nationastandard error of the slope. Top axis indicates estimated yield effect of sow date trend aswheat yield in India (solid black line), along with counter-factual yields if sow dates had rgain per day of earlier sowing. Values in bottom right indicate linear slope for 2001–2although SPOT produces almost identical results.
D.B. Lobell et al. / Agricultural Systems xxx (2012) xxx–xxx 5
Please cite this article in press as: Lobell, D.B., et al. Satellite detection of earlierhttp://dx.doi.org/10.1016/j.agsy.2012.09.003
significantly (Erenstein, 2009; Singh et al., 2009). Third, the 10-dayshift in green-up date in Haryana is larger than one would expectif, as stated elsewhere (Erenstein, 2009), roughly one-quarter offarmers have switched to ZRT. Assuming a 2-week shift in sow datein these fields would imply only a 3–4 day shift in average sowdate for the state. This is less than half the observed trend,although within two standard errors of the estimated mean trend.
These factors all suggest additional explanations beyond ZRTadoption for the observed trends in green-up. One likely causehas been the recent adoption of rotavator tillage machinery, whichcan significantly reduce time for field preparation and subsequentsowing. Another possible reason is adoption of shorter maturingrice varieties. Unfortunately, detailed ground data on these factorsare not available, precluding more specific explanations for theobserved trends.
Setting aside the cause of green-up trends, we turn now to theconsequences of these trends for wheat production in the region.Previous field studies have concluded that each day of sowing de-lay beyond the optimum window (up to mid-November) results in0.8–1.5% yield reduction throughout the region (Randhawa et al.,
l average, estimated using MODIS or SPOT satellite data. Error bars indicate ± onesuming 0.8% gain of yield for each day of earlier sowing. (b) Time series of nationalemained fixed at 2001 levels, assuming 0.8% (medium gray) or 1.5% (light gray) yield010 of the three different lines. MODIS estimates were used in the bottom graph,
wheat sowing in India and implications for yield trends. Agr. Syst. (2012),
6 D.B. Lobell et al. / Agricultural Systems xxx (2012) xxx–xxx
1981; Ortiz-Monasterio et al., 1994; Mehla et al., 2000; Chandnaet al., 2004; Erenstein and Laxmi, 2008). Late sowing is a problemthroughout the region (Timsina and Connor, 2001), although asChandna et al. (2004) report, yield effects tend to get stronger asone moves from west to east. They state that the ‘‘rate of yield de-cline in the eastern IGP is 1.5–2.0 times the rate found in north-western IGP. This is primarily due to short winter windowavailable for growth and reproduction of wheat in the eastern IGP.’’
Given yield penalties for late sowing, a move toward earliersowing should incur comparable yield gains per day. Assumingconservatively a 0.8% gain for each day of earlier sowing through-out the region, we estimated the total yield gain from sow datetrends in the past decade by multiplying the average green-uptrend in each district by 0.8%, and then computing a weightedaverage of all districts based on their average production. At thenational level, we estimate that trends toward earlier sowing sincethe 2000–2001 season have increased yields by more than 5%(Fig. 6a). Estimates based on MODIS and SPOT were nearly identi-cal at the national scale. The national average gain is driven pri-marily by trends in Haryana and UP, with slight but insignificantyield losses associated with delayed sowing in Punjab.
Historically a 5% yield impact over a decade would have been arelatively small component of overall yield change, given the rapidpace of yield improvement during the Green Revolution. However,the past decade has seen a notable slowdown in yield growth, witha linear trend in reported yields of 12.5 kg ha�1 yr�1 (or roughly0.5% yr�1) in the 9-year overlap between the reported yield records(up to harvest year 2009) and the MODIS record (beginning in har-vest year 2001) (Fig. 6b). If one subtracts out our conservative esti-mate of the sow date effect (�0.5% yr�1) the net yield trend overthis period due to other factors is essentially zero. Moreover, usingthe upper end of reported estimates of yield responses to sow datesresults in a negative trend of 17.8 kg ha�1 yr�1 using MODIS esti-mates (or roughly �0.7% yr�1).
We note that a small net trend does not necessarily imply asmall impact of all other factors over the study period, but onlythat any positive or negative effects of these factors were opposedby trends in other factors. For example, there have been significantincreases in nitrogen and phosphorus applications over the pastdecade in Punjab, and since 2005 the iconic wheat variety PBW343 has been gradually replaced by newer varieties (e.g., PBW502, PBW 550, DBW 17). These changes have undoubtedly contrib-uted to some yield increases, but at the same time trends in factorssuch as soil potassium (Ladha et al., 2003), weather (Pathak et al.,2003; Lobell et al., 2011), and increased incidence and severity ofstripe rust (Wellings, 2011) could have suppressed yields.
Although trends over the relatively brief period of 9 years canonly be suggestive at best, these results indicate that shifts insow date have been an important factor in recent yield trendsand have helped to partially counteract an overall slowdown inyield growth. It is possible that newer varieties have less sensitivityto late sowing than those used in the field experiments cited above.However, there is no evidence (even anecdotal) that we are awareof to suggest that late sowing presents any less of a challenge nowthan it did for previous varieties.
4. Conclusions
This study documented a substantial shift in sow dates forwheat throughout much of the major growing region in India overthe past decade. These trends were observed in two independentsatellite datasets acquired continuously since the start of 2000and made publically available at no cost. The agreement betweenthe two satellite datasets, as well as agreement with availableground-based data, indicates that the estimates are fairly robust.
Please cite this article in press as: Lobell, D.B., et al. Satellite detection of earlierhttp://dx.doi.org/10.1016/j.agsy.2012.09.003
The ability to efficiently obtain low-cost, accurate estimates ofsow date to retroactively study recent trends is a considerableadvantage of a satellite-based approach, especially consideringthe scarcity of systematic ground-based data on crop phenologyin most agricultural regions.
The results of the study indicate that the national slowdown inwheat yield growth would have been even more dramatic had re-cent trends toward earlier sowing in many wheat growing areasnot occurred. Yet sow dates can only be shifted so far before thebenefits of moving earlier are diminished. Average sow dates inboth Punjab and Haryana, for example, are now within the optimalwindow for sowing in the region, which ends around November 10(Ortiz-Monasterio et al., 1994; Chandna et al., 2004). This factpartly explains why trends in Punjab have not been observed,and also suggests that trends in Haryana will cease, or at leastcease to incur yield benefits. Considerable room still exists for yieldgains from earlier sowing in UP, but more work is needed to under-stand the cause of recent sowing shifts in this region and the like-lihood that they will continue. Overall, there appears to beremaining scope to improve yields by sowing earlier, but the likelymagnitude and pace of these gains are unclear and will likelydiminish with time. Repeated monitoring with satellite data willbe a useful tool for understanding future sowing trends and theirimplications for wheat yields in this region. The approach pre-sented here should also be directly applicable to other major crop-ping regions, as both satellite datasets provide global coverage.
Acknowledgments
This work was supported by NASA New Investigator Grant No.NNX08AV25G to D.B.L. We thank two anonymous reviewers forhelpful comments on the manuscript.
References
Aggarwal, P.K., Kalra, N., 1994. Analyzing the limitations set by climatic factors,genotype, and water and nitrogen availability on productivity of wheat. 2.Climatically potential yields and management strategies. Field Crops Res. 38 (2),93–103.
Beck, P., Jönsson, P., Høgda, K.A., Karlsen, S., Eklundh, L., Skidmore, A., 2007. Aground-validated NDVI dataset for monitoring vegetation dynamics andmapping phenology in fennoscandia and the Kola Peninsula. Int. J. RemoteSens. 28 (19), 4311–4330.
Chandna, P., Hodson, D.P., Singh, U.P., Singh, A.N., Gosain, A.K., Sahoo, R.N., Gupta,R.K., 2004. Increasing the productivity of underutilized lands by targetingresource conserving technologies-a gis/remote sensing approach: a case studyof Ballia district, Uttar Pradesh, in the eastern Gangetic plains.
Chatrath, R., Mishra, B., Ortiz Ferrara, G., Singh, S., Joshi, A., 2007. Challenges towheat production in South Asia. Euphytica 157 (3), 447–456.
Erenstein, O., 2009. Adoption and impact of conservation agriculture-basedresource conserving technologies in South Asia, Lead papers from the 4thworld congress on conservation agriculture, 4–7 February 2009. WorldCongress on Conservation Agriculture, New Delhi, pp. 439–444.
Erenstein, O., Laxmi, V., 2008. Zero tillage impacts in India’s rice–wheat systems: areview. Soil Tillage Res. 100 (1–2), 1–14.
Hobbs, P.R., 2001. Tillage and crop establishment in South Asian rice–wheatsystems: present practices and future options. J. Crop Prod. 4 (1), 1–22.
Hobbs, P.R., Sayre, K., Gupta, R., 2008. The role of conservation agriculture insustainable agriculture. Philos. Trans. Royal Soc. B: Biol. Sci. 363 (1491), 543–555.
Jönsson, P., Eklundh, L., 2004. Timesat – a program for analyzing time-series ofsatellite sensor data� 1. Comput. Geosci. 30 (8), 833–845.
Ladha, J.K., Dawe, D., Pathak, H., Padre, A.T., Yadav, R.L., Singh, B., Singh, Y., Singh, Y.,Singh, P., Kundu, A.L., 2003. How extensive are yield declines in long-term rice–wheat experiments in Asia? Field Crops Res. 81 (2–3), 159–180.
Lin, M., Huybers, P., 2012. Reckoning wheat yield trends. Environ. Res. Lett. 7 (2),024016.
Lobell, D.B., Schlenker, W.S., Costa-Roberts, J., 2011. Climate trends and global cropproduction since 1980. Science 333 (6042), 616–620.
Mehla, R., Verma, J., Gupta, R., Hobbs, P., 2000. Stagnation in the productivity ofwheat in the Indo-Gangetic plains: zero-till-seed-cum-fertilizer drill as anintegrated solution. Rice–Wheat Consort. Paper Series 8, 1–12.
Monfreda, C., Ramankutty, N. and Foley, J.A., 2008. Farming the planet: 2.Geographic distribution of crop areas, yields, physiological types, and netprimary production in the year 2000. Global Biogeochem. Cycles, 22.
wheat sowing in India and implications for yield trends. Agr. Syst. (2012),

D.B. Lobell et al. / Agricultural Systems xxx (2012) xxx–xxx 7
Ortiz-Monasterio, J.I., Dhillon, S.S., Fischer, R.A., 1994. Date of sowing effects ongrain-yield and yield components of irrigated spring wheat cultivars andrelationships with radiation and temperature in Ludhiana, India. Field CropsRes. 37 (3), 169–184.
Pathak, H., Ladha, J.K., Aggarwal, P.K., Peng, S., Das, S., Singh, Y., Singh, B., Kamra, S.K.,Mishra, B., Sastri, A., Aggarwal, H.P., Das, D.K., Gupta, R.K., 2003. Trends ofclimatic potential and on-farm yields of rice and wheat in the Indo-Gangeticplains. Field Crops Res. 80 (3), 223–234.
Randhawa, A., Dhillon, S. and Singh, D., 1981. Productivity of wheat varieties asinfluenced by the time of sowing. Journal of Research-Punjab AgriculturalUniversity (India).
Sakamoto, T., Wardlow, B.D., Gitelson, A.A., Verma, S.B., Suyker, A.E., Arkebauer, T.J.,2010. A two-step filtering approach for detecting maize and soybean phenologywith time-series MODIS data. Remote Sens. Environ. 114 (10), 2146–2159.
Sakamoto, T., Yokozawa, M., Toritani, H., Shibayama, M., Ishitsuka, N., Ohno, H.,2005. A crop phenology detection method using time-series MODIS data.Remote Sens. Environ. 96 (3), 366–374.
Please cite this article in press as: Lobell, D.B., et al. Satellite detection of earlierhttp://dx.doi.org/10.1016/j.agsy.2012.09.003
Sharma, R., Duveiller, E., Ortiz-Ferrara, G., 2007. Progress and challenge towardsreducing wheat SPOT blotch threat in the eastern Gangetic plains of South Asia:is climate change already taking its toll? Field Crops Res. 103 (2), 109–118.
Singh, R., Erenstein, O., Gathala, M., Alam, M., Regmi, A., Singh, U., Rehman, H.,Tripathi, B., 2009. Socio-economics of integrated crop and resourcemanagement in the rice–wheat systems of South Asia: site contrasts,adoption and impacts using village survey findings, Integrated crop andresource management technologies for sustainable rice–wheat systems ofSouth Asia. International Rice Research Institute, pp. 355–395.
Timsina, J., Connor, D.J., 2001. Productivity and management of rice–wheatcropping systems: issues and challenges. Field Crops Res. 69 (2), 93–132.
Wellings, C.R., 2011. Global status of stripe rust: a review of historical and currentthreats. Euphytica 179 (1), 129–141.
Zhang, X, Friedl, M.A., Schaaf, C.B., 2006. Global vegetation phenology frommoderate resolution imaging spectroradiometer (MODIS): evaluation of globalpatterns and comparison with in situ measurements. J. Geophys. Res. 111 (G4),G04017.
wheat sowing in India and implications for yield trends. Agr. Syst. (2012),
Related Documents