Sapio Sciences Analysis Report –Micronodular Adrenocortical Hyperplasia Research Paper Supplement 1 04/24/06 3:33 PM, Sapio Sciences, LLC Sapio Sciences Analysis Report – Micronodular (non-pigmented) Adrenocortical Hyperplasia (MAH) Research Paper Supplement Version 1.0 Revision Level: A Revision Date: April 24, 2006

Welcome message from author
This document is posted to help you gain knowledge. Please leave a comment to let me know what you think about it! Share it to your friends and learn new things together.
Transcript
Sapio Sciences Analysis Report –Micronodular Adrenocortical Hyperplasia Research Paper Supplement
1 04/24/06 3:33 PM, Sapio Sciences, LLC
Sapio Sciences Analysis Report –
Micronodular (non-pigmented) Adrenocortical Hyperplasia (MAH)
Research Paper Supplement
Version 1.0
Revision Level: A
Revision Date: April 24, 2006
Sapio Sciences Analysis Report –Micronodular Adrenocortical Hyperplasia Research Paper Supplement
2 04/24/06 3:33 PM, Sapio Sciences, LLC
Table of Contents
1 OVERVIEW ...........................................................................................................................................................................................................................................5
2 ANALYTIC PROCESS .........................................................................................................................................................................................................................6
2.1 STEP 1 – ASSOCIATION STATISTICS..................................................................................................................................................................................................6 2.2 STEP 2 – GENETIC ALGORITHM........................................................................................................................................................................................................6 2.3 STEP 3 – LOSS OF HETEROZYGOSITY ...............................................................................................................................................................................................6 2.4 STEP 4 – EM ALGORITHM ................................................................................................................................................................................................................7
3 STUDY GROUP INFORMATION ......................................................................................................................................................................................................8
4 ANALYSIS RESULTS.........................................................................................................................................................................................................................11
4.1 AS MODULE RESULTS SUMMARY ...................................................................................................................................................................................................11 4.1.1 Statistics By Genotype ............................................................................................................................................................................................................11
4.1.1.1 Top 35 Results By Genotype:...................................................................................................................................................................................................................... 11 4.1.2 Statistics By Allele ..................................................................................................................................................................................................................13
4.1.2.1 Top 35 Results By Allele: ........................................................................................................................................................................................................................... 13 4.1.3 Fishers Exact Analysis Statistics Discussion..........................................................................................................................................................................14 4.1.4 Statistics - Odds Ratio By Genotype.......................................................................................................................................................................................14
4.1.4.1 Top 35 Results By Genotype:...................................................................................................................................................................................................................... 14 4.1.5 Statistics: Odds Ratio By Allele..............................................................................................................................................................................................17
4.1.5.1 Top 35 Results By Allele: ........................................................................................................................................................................................................................... 17 4.1.6 GA Module Results Summary .................................................................................................................................................................................................19
4.1.6.1 GA Based Analysis ..................................................................................................................................................................................................................................... 19 4.1.6.2 GA Results .................................................................................................................................................................................................................................................. 20
4.1.6.2.1 Model Summary Results ....................................................................................................................................................................................................................... 20 4.1.6.2.1.1 Models 1 and 7-9 - Exp 124 (Run 20)............................................................................................................................................................................................ 20 4.1.6.2.1.2 Models 1-2 - Exp 128 (Run 23)...................................................................................................................................................................................................... 28
4.1.6.3 Genetic Algorithm SNP List........................................................................................................................................................................................................................ 32 4.1.7 CA Module Results Summary .................................................................................................................................................................................................33 4.1.8 Loh analysis on select individual samples..............................................................................................................................................................................36
4.1.8.1 Results for family CAR545 ......................................................................................................................................................................................................................... 36 4.1.8.2 Results for Family CAR36 .......................................................................................................................................................................................................................... 39 4.1.8.3 Results for Family CAR14 .......................................................................................................................................................................................................................... 42
4.1.9 EM Algorithm Results.............................................................................................................................................................................................................46 4.1.9.1 Top 100 Results By p-value: ....................................................................................................................................................................................................................... 46
5 DISCUSSION .......................................................................................................................................................................................................................................50
5.1 FINAL SNP LIST FOR FURTHER REVIEW..........................................................................................................................................................................................51

Sapio Sciences Analysis Report –Micronodular Adrenocortical Hyperplasia Research Paper Supplement
3 04/24/06 3:33 PM, Sapio Sciences, LLC
6 APPENDIX A .......................................................................................................................................................................................................................................55
6.1 LOSS OF HETEROZYGOSITY CALCULATIONS ...................................................................................................................................................................................55 6.1.1 Analysis-Set Defined Block Size .............................................................................................................................................................................................55 6.1.2 LOH P-Value..........................................................................................................................................................................................................................56
Sapio Sciences Analysis Report –Micronodular Adrenocortical Hyperplasia Research Paper Supplement
4 04/24/06 3:33 PM, Sapio Sciences, LLC
Supplementary Tables TABLE 1 - STUDY GROUP DETAILS..................................................................................................................................................................................................................10 TABLE 2 - STATISTICS - TOP 35 RESULTS BY GENOTYPE.................................................................................................................................................................................12 TABLE 3 - STATISTICS - TOP 35 RESULTS BY ALLELE .....................................................................................................................................................................................14 TABLE 4 - ODDS RATIO - TOP 35 RESULTS BY GENOTYPE ..............................................................................................................................................................................16 TABLE 5 - ODDS RATIO - TOP 35 RESULTS BY ALLELE ...................................................................................................................................................................................18 TABLE 6 - GENETIC ALGORITHM SNP LIST.....................................................................................................................................................................................................32 TABLE 7 - LOSS OF HETEROZYGOSITY RESULTS .............................................................................................................................................................................................36 TABLE 8 - EM ALGORITHM - TOP 100 RESULTS BY PVALUE...........................................................................................................................................................................49 TABLE 9 - FINAL SNP LIST FOR FURTHER REVIEW .........................................................................................................................................................................................54
Supplementary Figures FIGURE 1 - GA MODEL 1, EXP 124 (RUN 20) ..................................................................................................................................................................................................20 FIGURE 2 - GA MODEL 1, EXP 124 (RUN 20) - PREDICTIONS ..........................................................................................................................................................................21 FIGURE 3 - GA MODEL 7, EXP 124 (RUN 20) ..................................................................................................................................................................................................22 FIGURE 4 - GA MODEL 7, EXP 124 (RUN 20) - PREDICTIONS..........................................................................................................................................................................23 FIGURE 5 - GA MODEL 8, EXP 124 (RUN 20) ..................................................................................................................................................................................................24 FIGURE 6 - GA MODEL 8, EXP 124 (RUN 20) - PREDICTIONS..........................................................................................................................................................................25 FIGURE 7 - GA MODEL 9, EXP 124 (RUN 20) ..................................................................................................................................................................................................26 FIGURE 8 - GA MODEL 9, EXP 124 (RUN 20) - PREDICTIONS ..........................................................................................................................................................................27 FIGURE 9 - GA MODEL 1, EXP 128 (RUN 23) ..................................................................................................................................................................................................28 FIGURE 10 - GA MODEL 1, EXP 128 (RUN 23) - PREDICTIONS ........................................................................................................................................................................29 FIGURE 11 - GA MODEL 2, EXP 128 (RUN 23) ................................................................................................................................................................................................30 FIGURE 12 - GA MODEL 2, EXP 128 (RUN 23) - PREDICTIONS........................................................................................................................................................................31
Sapio Sciences Analysis Report –Micronodular Adrenocortical Hyperplasia Research Paper Supplement
5 04/24/06 3:33 PM, Sapio Sciences, LLC
1 Overview Sapio Sciences was engaged to analyze genotyping data from samples submitted by NICHD to Genome Explorations. Genome Explorations ran the samples on the
Affymetrix 10K xba 142 arrays producing 10,000 plus genotypes for each sample. The samples themselves were derived from the adrenal tissue of affected individuals
as well as from peripheral blood. There were 34 total samples, 18 cases and 16 controls. The cases phenotype was a form of adrenal cancer called “Micronodular
(non-pigmented) Adrenocortical Hyperplasia” (MAH) that occurs early in life.
Sapio Sciences will use its Exemplar Genotyping Analysis Suite to perform various analyses on the supplied data. The objective is to reduce the 10,000+ SNP’s to a
smaller subset of interesting candidates for further exploration. Extensive reports will be part of this document to detail analytic results and support the findings of the
analyses. The Exemplar modules to be utilized are the:
1. Genetic Algorithm Module (GA Module) – This module implements an Artificial Intelligence approach to finding logical combinations of SNP’s for
association based studies.
2. Association Study Module (AS Module) – this module calculates many useful statistics like Chi Square, Yates, Fisher Exact, Odds Ratio, LD, D’, etc.
3. Chromosome Alteration module (CA Module) – this module performs LOH analysis on the dataset using user-specified controls as the reference set to
identify possible deletions in the chromosome.
4. EM Algorithm – this module performs haplotype based analysis on the dataset using to identify possible associations between haplotype pairs and the
phenotype.
The difficulty with such a small sample size is the lack of statistical power. Nonetheless, we hoped that by performing multiple types of analysis on the data, we could
reduce the problem space from ~10,000 SNP’s to <50 SNP’s for consideration. With the experience of the NICHD researchers, they could then apply their biological
knowledge of these disorders to this reduced set of data and further prune the list of interesting SNP's. Resequencing would then be used to determine whether any of
the final SNP set was related to MAH.

Sapio Sciences Analysis Report –Micronodular Adrenocortical Hyperplasia Research Paper Supplement
6 04/24/06 3:33 PM, Sapio Sciences, LLC
2 Analytic Process
2.1 STEP 1 – Association Statistics Exemplar’s AS Module will first be utilized to provide extensive statistical analysis of the dataset including:
1. Fishers Exact by genotype and by allele
2. Odds Ratio by genotype and by allele
The AS module will also be used for feature selection of the dataset prior to being input to the GA Module.
2.2 STEP 2 – Genetic Algorithm Exemplar’s GA Module will be run against the dataset many times with various parameter settings. A brief overview of what will be run follows:
1. GA module will be run against the entire input dataset and will attempt to build models of the smallest size that can effectively predict outcomes while
minimizing False Positives and maximizing True Positives. Different sized and type models will be attempted to improve results as necessary.
2. Various feature selection methods will be employed to reduce the input parameter space, these will include:
a. Statistical Reduction (usually Fishers is used here) whereby each SNP has a p-value calculated and if their p-value does not fall below a certain
threshold, they will be eliminated.
b. Minor allele frequency changes – the minor allele frequency is calculated for each SNP for cases and controls, if the variance is below a certain
defined threshold, the SNP is eliminated from consideration.
Comprehensive model results will be provided in this reports including:
1 Model predictive results for each sample
2 Model statistical p-values when possible
3 Relevant Ontology’s for GA discovered SNP’s
4 Complete details of each discovered SNP including its id, position, chromosome, and related genes.
2.3 STEP 3 – Loss of Heterozygosity Exemplar’s CA Module will be run against the dataset to detect possible deletions in the chromosomes by looking for Loss Of Heterozygosity. Each SNP will be assigned a p-value.

Sapio Sciences Analysis Report –Micronodular Adrenocortical Hyperplasia Research Paper Supplement
7 04/24/06 3:33 PM, Sapio Sciences, LLC
2.4 STEP 4 – EM Algorithm Exemplar’s EM Algorithm will be run against the dataset to identify possible associations between haplotype pairs and the phenotype. Each haplotype will be assigned a p-value. NOTE:
this analysis was done after the PDE11A gene was already identified as a test of this new methods addition to the Exemplar software. Therefore these results were not presented to
researchers when they began detailed analysis of the final SNP list and regions of interest we provided. It’s notable that this analysis confirmed PDE11A’s involvement via a haplotype
pairing from within the gene with a significant p-value being associated with the MAH.
Sapio Sciences Analysis Report –Micronodular Adrenocortical Hyperplasia Research Paper Supplement
8 04/24/06 3:33 PM, Sapio Sciences, LLC
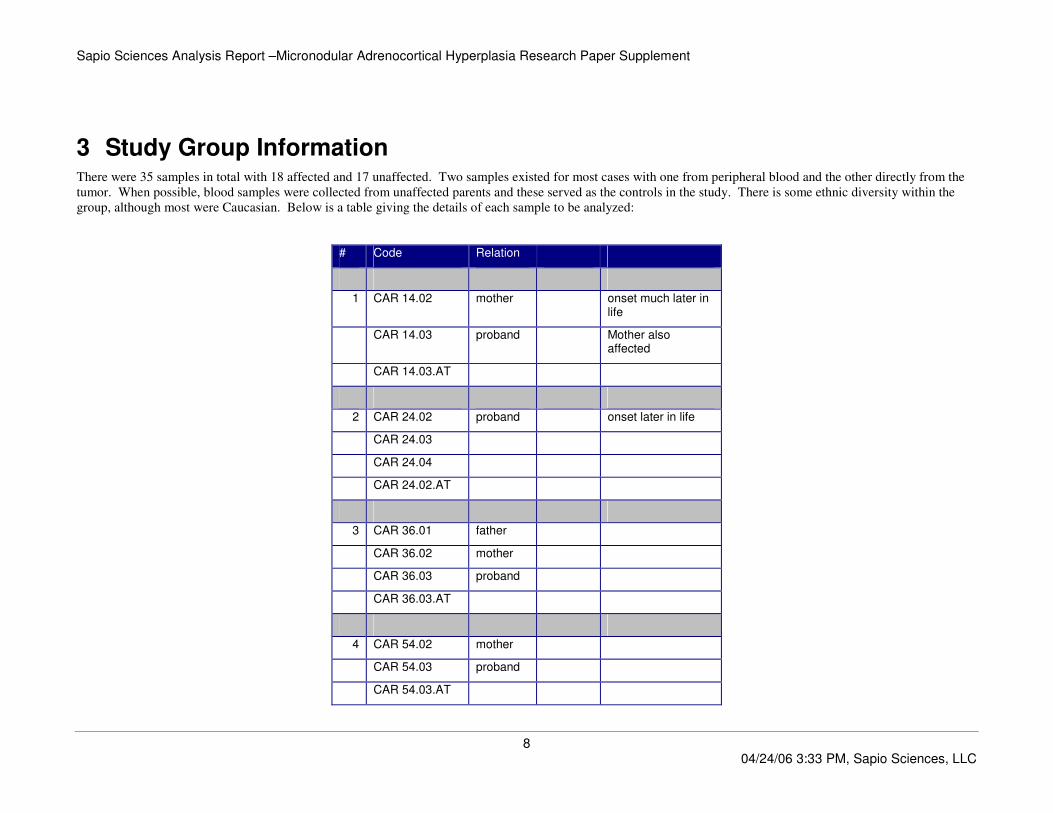
3 Study Group Information There were 35 samples in total with 18 affected and 17 unaffected. Two samples existed for most cases with one from peripheral blood and the other directly from the
tumor. When possible, blood samples were collected from unaffected parents and these served as the controls in the study. There is some ethnic diversity within the
group, although most were Caucasian. Below is a table giving the details of each sample to be analyzed:
# Code Relation
1 CAR 14.02 mother onset much later in life
CAR 14.03 proband Mother also affected
CAR 14.03.AT
2 CAR 24.02 proband onset later in life
CAR 24.03
CAR 24.04
CAR 24.02.AT
3 CAR 36.01 father
CAR 36.02 mother
CAR 36.03 proband
CAR 36.03.AT
4 CAR 54.02 mother
CAR 54.03 proband
CAR 54.03.AT
Sapio Sciences Analysis Report –Micronodular Adrenocortical Hyperplasia Research Paper Supplement
9 04/24/06 3:33 PM, Sapio Sciences, LLC
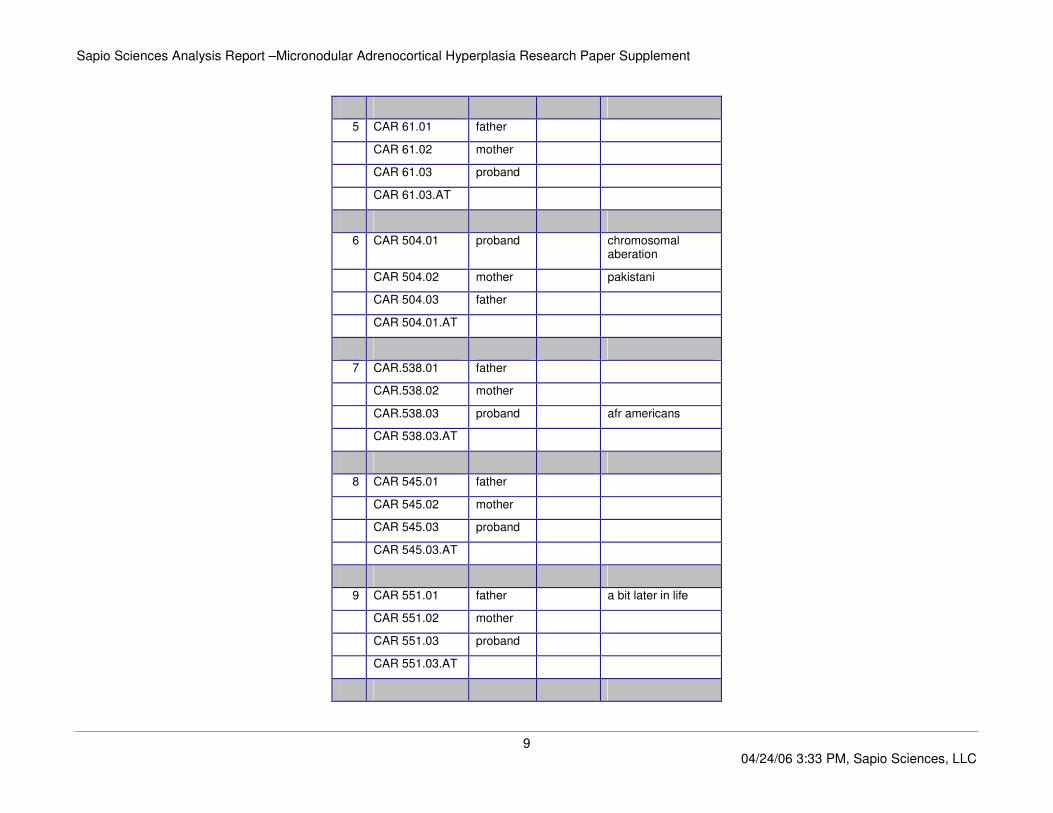
5 CAR 61.01 father
CAR 61.02 mother
CAR 61.03 proband
CAR 61.03.AT
6 CAR 504.01 proband chromosomal aberation
CAR 504.02 mother pakistani
CAR 504.03 father
CAR 504.01.AT
7 CAR.538.01 father
CAR.538.02 mother
CAR.538.03 proband afr americans
CAR 538.03.AT
8 CAR 545.01 father
CAR 545.02 mother
CAR 545.03 proband
CAR 545.03.AT
9 CAR 551.01 father a bit later in life
CAR 551.02 mother
CAR 551.03 proband
CAR 551.03.AT

Sapio Sciences Analysis Report –Micronodular Adrenocortical Hyperplasia Research Paper Supplement
10 04/24/06 3:33 PM, Sapio Sciences, LLC
10 CAR 559.01 father a bit later in life
CAR 559.02 mother chiliean
CAR 559.03 proband
CAR 559.03.AT
11 CAR 583.01
CAR 583.02
CAR 583.03 proband
Table 1 - Study Group Details

Sapio Sciences Analysis Report –Micronodular Adrenocortical Hyperplasia Research Paper Supplement
11 04/24/06 3:33 PM, Sapio Sciences, LLC
4 Analysis Results
4.1 AS Module Results Summary Multiple statistics were generated for each SNP in the input dataset. We utilized Fishers Exact 2 tailed test to compute all statistics.
4.1.1 Statistics By Genotype
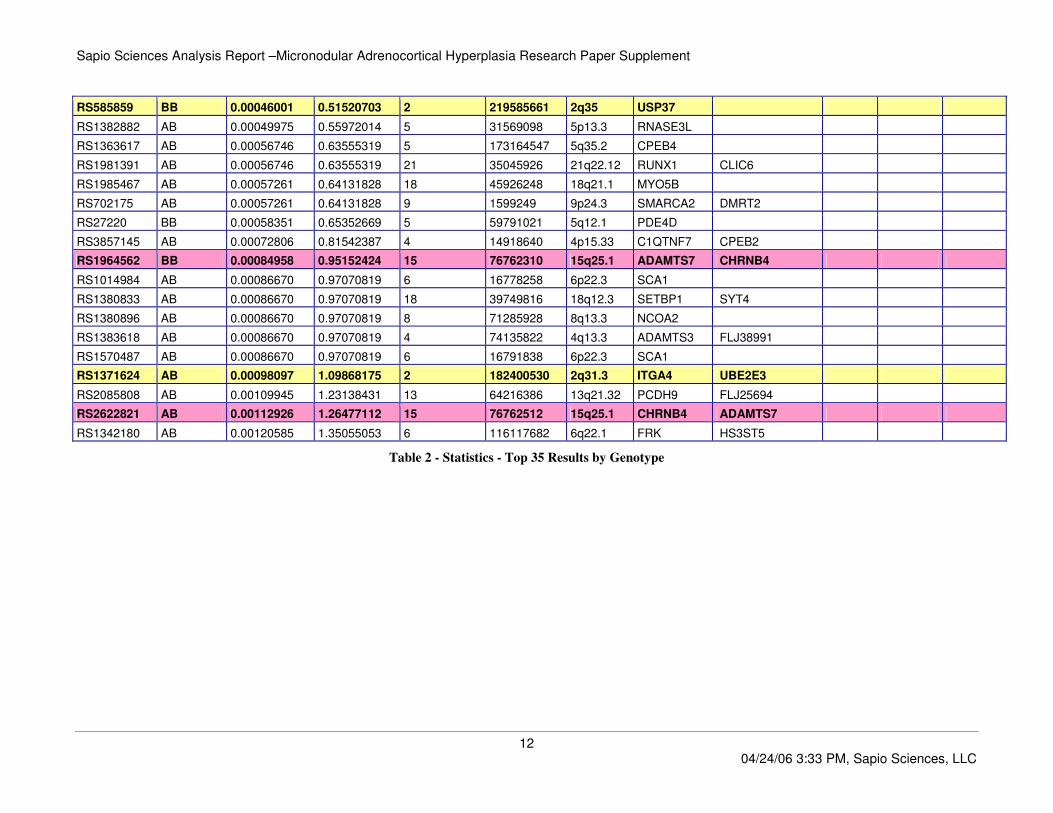
This statistic is generated by building 2 x 2 contingency tables and doing proper counts of genotypes (Note that this is not allele counts, but genotype counts). To give
an example, suppose there is a SNP RS001. Given three possible genotypes of AA, AB and BB, Exemplar generates a contingency table for each of the three
possibilities and therefore gets a p-value for each SNP/genotype combination. The provided p-values are corrected for type 1 errors using Bonferoni correction.
4.1.1.1 Top 35 Results By Genotype:
SNP Category Fisher Exact Adjusted Chromosome Position Cytoband Related
RS1404090 AB 0.00000685 0.00767358 2 76402264 2p12 C2orf3 LRRTM4
RS27220 AB 0.00009541 0.10686091 5 59791021 5q12.1 PDE4D
RS1221150 AB 0.00009592 0.10743016 2 81960032 2p12 SUCLG1
RS1964562 AB 0.00009592 0.10743016 15 76762310 15q25.1 ADAMTS7 CHRNB4
RS6539866 AB 0.00009592 0.10743016 12 83740879 12q21.31 SLC6A15 DKFZp762A217
RS58982 AB 0.00014616 0.16370309 5 104236349 5q21.2 EFNA5 NUDT12
RS691140 AA 0.00021229 0.23776227 2 219829544 2q35 TTLL4 CYP27A1
RS967305 AB 0.00021229 0.23776227 20 49145368 20q13.13 SLC9A8
RS2616552 AB 0.00027406 0.30694330 3 11641798 3p25.3 KIAA0121
RS967445 AB 0.00027406 0.30694330 21 43090530 21q22.3 WDR4 PDE9A
RS2395166 AB 0.00030146 0.33763763 6 32459456 6p21.32
RS344214 AB 0.00030146 0.33763763 8 62987120 8q12.3 ASPH FLJ39630
RS719316 AB 0.00030146 0.33763763 6 16780739 6p22.3 SCA1
RS1382883 AB 0.00035772 0.40064178 5 31568782 5p13.3 RNASE3L
RS1411445 AB 0.00043849 0.49110928 9 120294727 9q33.2 NDUFA8
RS1601981 AB 0.00046001 0.51520703 12 28961846 12p11.22 MLSTD1 FLJ11088
RS2077774 AB 0.00046001 0.51520703 3 59693919 3p14.2 FHIT ACOX2 TU3A FAM3D KCTD6
Sapio Sciences Analysis Report –Micronodular Adrenocortical Hyperplasia Research Paper Supplement
12 04/24/06 3:33 PM, Sapio Sciences, LLC
RS585859 BB 0.00046001 0.51520703 2 219585661 2q35 USP37
RS1382882 AB 0.00049975 0.55972014 5 31569098 5p13.3 RNASE3L
RS1363617 AB 0.00056746 0.63555319 5 173164547 5q35.2 CPEB4
RS1981391 AB 0.00056746 0.63555319 21 35045926 21q22.12 RUNX1 CLIC6
RS1985467 AB 0.00057261 0.64131828 18 45926248 18q21.1 MYO5B
RS702175 AB 0.00057261 0.64131828 9 1599249 9p24.3 SMARCA2 DMRT2
RS27220 BB 0.00058351 0.65352669 5 59791021 5q12.1 PDE4D
RS3857145 AB 0.00072806 0.81542387 4 14918640 4p15.33 C1QTNF7 CPEB2
RS1964562 BB 0.00084958 0.95152424 15 76762310 15q25.1 ADAMTS7 CHRNB4
RS1014984 AB 0.00086670 0.97070819 6 16778258 6p22.3 SCA1
RS1380833 AB 0.00086670 0.97070819 18 39749816 18q12.3 SETBP1 SYT4
RS1380896 AB 0.00086670 0.97070819 8 71285928 8q13.3 NCOA2
RS1383618 AB 0.00086670 0.97070819 4 74135822 4q13.3 ADAMTS3 FLJ38991
RS1570487 AB 0.00086670 0.97070819 6 16791838 6p22.3 SCA1
RS1371624 AB 0.00098097 1.09868175 2 182400530 2q31.3 ITGA4 UBE2E3
RS2085808 AB 0.00109945 1.23138431 13 64216386 13q21.32 PCDH9 FLJ25694
RS2622821 AB 0.00112926 1.26477112 15 76762512 15q25.1 CHRNB4 ADAMTS7
RS1342180 AB 0.00120585 1.35055053 6 116117682 6q22.1 FRK HS3ST5
Table 2 - Statistics - Top 35 Results by Genotype
Sapio Sciences Analysis Report –Micronodular Adrenocortical Hyperplasia Research Paper Supplement
13 04/24/06 3:33 PM, Sapio Sciences, LLC
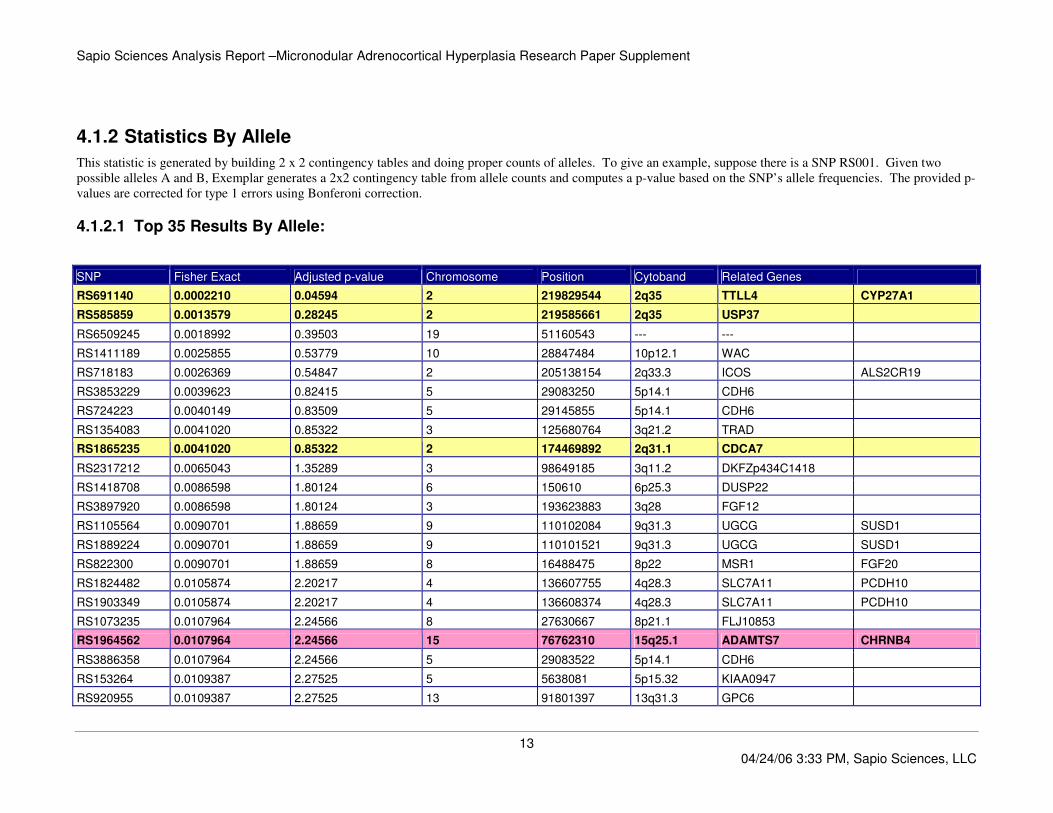
4.1.2 Statistics By Allele
This statistic is generated by building 2 x 2 contingency tables and doing proper counts of alleles. To give an example, suppose there is a SNP RS001. Given two
possible alleles A and B, Exemplar generates a 2x2 contingency table from allele counts and computes a p-value based on the SNP’s allele frequencies. The provided p-
values are corrected for type 1 errors using Bonferoni correction.
4.1.2.1 Top 35 Results By Allele:
SNP Fisher Exact Adjusted p-value Chromosome Position Cytoband Related Genes
RS691140 0.0002210 0.04594 2 219829544 2q35 TTLL4 CYP27A1
RS585859 0.0013579 0.28245 2 219585661 2q35 USP37
RS6509245 0.0018992 0.39503 19 51160543 --- ---
RS1411189 0.0025855 0.53779 10 28847484 10p12.1 WAC
RS718183 0.0026369 0.54847 2 205138154 2q33.3 ICOS ALS2CR19
RS3853229 0.0039623 0.82415 5 29083250 5p14.1 CDH6
RS724223 0.0040149 0.83509 5 29145855 5p14.1 CDH6
RS1354083 0.0041020 0.85322 3 125680764 3q21.2 TRAD
RS1865235 0.0041020 0.85322 2 174469892 2q31.1 CDCA7
RS2317212 0.0065043 1.35289 3 98649185 3q11.2 DKFZp434C1418
RS1418708 0.0086598 1.80124 6 150610 6p25.3 DUSP22
RS3897920 0.0086598 1.80124 3 193623883 3q28 FGF12
RS1105564 0.0090701 1.88659 9 110102084 9q31.3 UGCG SUSD1
RS1889224 0.0090701 1.88659 9 110101521 9q31.3 UGCG SUSD1
RS822300 0.0090701 1.88659 8 16488475 8p22 MSR1 FGF20
RS1824482 0.0105874 2.20217 4 136607755 4q28.3 SLC7A11 PCDH10
RS1903349 0.0105874 2.20217 4 136608374 4q28.3 SLC7A11 PCDH10
RS1073235 0.0107964 2.24566 8 27630667 8p21.1 FLJ10853
RS1964562 0.0107964 2.24566 15 76762310 15q25.1 ADAMTS7 CHRNB4
RS3886358 0.0107964 2.24566 5 29083522 5p14.1 CDH6
RS153264 0.0109387 2.27525 5 5638081 5p15.32 KIAA0947
RS920955 0.0109387 2.27525 13 91801397 13q31.3 GPC6

Sapio Sciences Analysis Report –Micronodular Adrenocortical Hyperplasia Research Paper Supplement
14 04/24/06 3:33 PM, Sapio Sciences, LLC
RS1410093 0.0110582 2.3001 13 71636628 13q22.1 KLF5 KLF12
RS153263 0.0111944 2.32843 5 5638041 5p15.32 KIAA0947
RS1074866 0.0112539 2.34081 13 110710283 13q34 SOX1 LOC122258
RS1146122 0.0119727 2.49032 12 62815387 12q14.2 ---
RS718602 0.0129698 2.69772 13 76623522 13q22.3 POU4F1 EDNRB
RS2159040 0.0132450 2.75495 17 13193935 17p12 HS3ST3A1 ELAC2
RS2362815 0.0132627 2.75864 1 119420405 1p12 LOC128102 HSD3B1
RS951693 0.0132627 2.75864 1 119419684 1p12 LOC128102 HSD3B1
RS1373904 0.0136155 2.83202 13 42273398 13q14.11 FLJ38725
RS2393537 0.0136350 2.83607 10 60345806 10q21.1 PHYHIPL
RS4129019 0.0144999 3.01597 1 213049358 1q41 USH2A KCTD3
RS959175 0.0166866 3.47082 1 233794031 1q43 LGALS8 ACTN2
RS722516 0.0167604 3.48617 16 27362834 16p12.1 IL4R IL21R
Table 3 - Statistics - Top 35 Results by Allele
4.1.3 Fishers Exact Analysis Statistics Discussion
As stated earlier, the statistical power of this study is low. Nonetheless, once correction was applied to the genotype and allele statistics, only 2 SNP’s fell below the
significance threshold of p<.05 (RS1404090 and RS691140). To further expand the number of SNP’s to consider, we looked for SNP’s from proximate cytobands
between the two analyses. We have color coded the SNP’s between the genotype based statistic and allele statistic where there was SNP proximity. There were only 3
regions that appeared in both tests: 2q35, 2q31 and 15q25. We further note a SNP from 2q33.3 is on the allele list, giving us several SNP’s in the 2q3# region that were
statistically significant. As a reference point, the Affymetrix 10K platform that served as the basis for this study has 155 SNP’s in the region between 2q31.1 and 2q35,
which covers positions 178470389-221390185, or roughly ~43 million base pairs.
4.1.4 Statistics - Odds Ratio By Genotype
This statistic is generated by building 2 x 2 contingency tables and doing proper counts of genotypes (Note that this is not allele counts, but genotype counts). To give
an example, suppose there is a SNP RS001. Given three possible genotypes of AA, AB and BB, Exemplar generates a contingency table for each of the three
possibilities and therefore gets an Odds Ratio for each SNP/genotype combination. These can then be read as: “RS691149 as AA has an Odds Ratio of 28.00.
RS691149 as AB has an Odds Ratio of ##.##., etc..”
4.1.4.1 Top 35 Results By Genotype:
SNP Category Odds Ratio Chromosome Position Cytoband Related Genes

Sapio Sciences Analysis Report –Micronodular Adrenocortical Hyperplasia Research Paper Supplement
15 04/24/06 3:33 PM, Sapio Sciences, LLC
RS691140 AA 28.00 2 219829544 2q35 TTLL4 CYP27A1
RS967305 AB 28.00 20 49145368 20q13.13 SLC9A8
RS1964562 BB 25.67 15 76762310 15q25.1 ADAMTS7 CHRNB4
RS27220 BB 23.83 5 59791021 5q12.1 PDE4D
RS2077774 AB 21.13 3 59693919 3p14.2 FHIT ACOX2 TU3A FAM3D KCTD6
RS585859 BB 21.13 2 219585661 2q35 USP37
RS1503466 AB 20.00 4 27495090 4p15.2 PCDH7 STIM2
RS2896587 AB 20.00 11 11734173 11p15.3 USP47
RS702175 AB 18.67 9 1599249 9p24.3 SMARCA2 DMRT2
RS1492117 BB 18.29 12 19971727 12p12.2 PDE3A AEBP2
RS1527260 AA 18.29 12 19971799 12p12.2 PDE3A AEBP2
RS2312546 AA 18.29 4 132345202 4q28.3 PCDH10 LOC132321
RS1409197 AB 18.00 X 45350386 Xp11.3 FLJ20344
RS2622821 AA 17.50 15 76762512 15q25.1 CHRNB4 ADAMTS7
RS1371624 AB 17.11 2 182400530 2q31.3 ITGA4 UBE2E3
ROW 2248 AB 16.50 --- --- --- ---
RS2377107 AB 16.50 3 185908787 3q27.2 KIAA0804
RS951647 BB 16.00 10 90656781 10q23.31 LIPA
RS1405735 AB 15.60 2 157436377 2q24.1 GPD2 NR4A2
RS363225 AB 15.60 10 118689089 10q26.11 SLC18A2
RS723720 AB 15.60 --- --- --- ---
RS951101 AB 15.60 3 105604336 3q13.11 LOC131368 ALCAM
RS164022 AB 15.00 19 6779040 --- ---
RS1824482 BB 15.00 4 136607755 4q28.3 SLC7A11 PCDH10
RS1903349 BB 15.00 4 136608374 4q28.3 SLC7A11 PCDH10
RS2066007 AA 15.00 1 66331081 1p31.2 ---
RS3848096 AB 15.00 13 31692672 13q13.1 RFC3 STARD13
RS536243 AB 15.00 10 89623659 10q23.31 FLJ11218 PTEN
RS1112573 AB 14.00 14 76835369 14q24.3 NRXN3
RS1751005 AB 14.00 13 93527871 13q32.1 ---
RS1952514 AB 14.00 14 19601896 14q11.2 HNRPC
RS2014422 AB 13.71 18 60158077 18q22.1 CDH7 MGC39571
RS1856133 AB 13.50 6 102146470 6q16.3 GRIK2
RS2213177 AB 13.50 12 11852139 12p13.2 ETV6
RS4496103 AB 13.50 15 86073423 15q25.3 NTRK3 FLJ31461

Sapio Sciences Analysis Report –Micronodular Adrenocortical Hyperplasia Research Paper Supplement
16 04/24/06 3:33 PM, Sapio Sciences, LLC
Table 4 - Odds Ratio - Top 35 Results by Genotype

Sapio Sciences Analysis Report –Micronodular Adrenocortical Hyperplasia Research Paper Supplement
17 04/24/06 3:33 PM, Sapio Sciences, LLC
4.1.5 Statistics: Odds Ratio By Allele
This statistic is generated by building 2 x 2 contingency tables and doing proper counts of alleles. To give an example, suppose there is a SNP RS001. Given two
possible alleles A and B, Exemplar generates a 2x2 contingency table from allele counts and computes an Odds Ratio based on the SNP’s allele frequencies.
4.1.5.1 Top 35 Results By Allele:
SNP Odds Ratio Chromosome Position Cytoband Related Genes
RS724223 13.095 5 29145855 5p14.1 CDH6
RS691140 13.000 2 219829544 2q35 TTLL4 CYP27A1
RS1074866 10.440 13 110710283 13q34 SOX1 LOC122258
ROW 2248 9.857 --- --- --- ---
RS536243 9.000 10 89623659 10q23.31 FLJ11218 PTEN
RS1407856 8.308 9 7036901 9p24.1 JMJD2C
RS150739 7.519 16 63237330 16q21 CDH8 CDH11
RS1941375 7.519 11 85483441 11q14.2 PICALM
RS2036237 7.519 4 129942269 4q28.2 PGRMC2 PHF17
RS860751 7.519 6 14741352 6p23 CD83 JARID2
RS2243891 6.571 14 22836885 14q11.2 NFATC4
RS1584232 6.231 8 27013789 8p21.2 ADRA1A STMN4
RS929245 6.214 7 82531860 7q21.11 PCLO
RS956298 6.214 20 49977485 20q13.13 C20orf175
RS2219745 5.833 5 74590731 5q13.3 FLJ40191
RS1856203 5.800 9 109872650 9q31.3 GNG10 C9orf84
RS1407972 5.786 9 8451714 9p24.1 PTPRD
RS1889224 5.571 9 110101521 9q31.3 UGCG SUSD1
RS1368747 5.500 3 85320645 3p12.1 IGSF4D
RS4075882 5.417 --- --- --- ---
RS1410093 5.367 13 71636628 13q22.1 KLF5 KLF12
RS1316583 5.273 15 36602102 15q14 RASGRP1
RS154949 5.143 5 64886978 5q12.3 KIAA0073
RS717910 5.077 1 93714056 1p22.1 BCAR3 HSU15552

Sapio Sciences Analysis Report –Micronodular Adrenocortical Hyperplasia Research Paper Supplement
18 04/24/06 3:33 PM, Sapio Sciences, LLC
RS1350836 5.040 4 74082207 4q13.3 FLJ38991 ADAMTS3
RS2207664 5.040 10 82913820 10q23.1 FLJ41984 GHITM
RS269048 5.040 1 57239760 1p32.2 DAB1
RS4332221 5.040 9 12742371 9p23 C9orf150 TYRP1
RS719980 5.040 15 95196648 15q26.2 ARRDC4
ROW 6449 5.000 --- --- --- ---
RS1408505 5.000 6 150502254 6q25.1 PPP1R14C
RS725131 5.000 16 66362029 16q22.1 CKLF TK2
RS1412197 4.909 20 59360564 20q13.33 CDH4 FLJ33860
RS722516 4.909 16 27362834 16p12.1 IL4R IL21R
RS710506 4.769 3 190043990 3q28 LPP
Table 5 - Odds Ratio - Top 35 Results by Allele
Sapio Sciences Analysis Report –Micronodular Adrenocortical Hyperplasia Research Paper Supplement
19 04/24/06 3:33 PM, Sapio Sciences, LLC
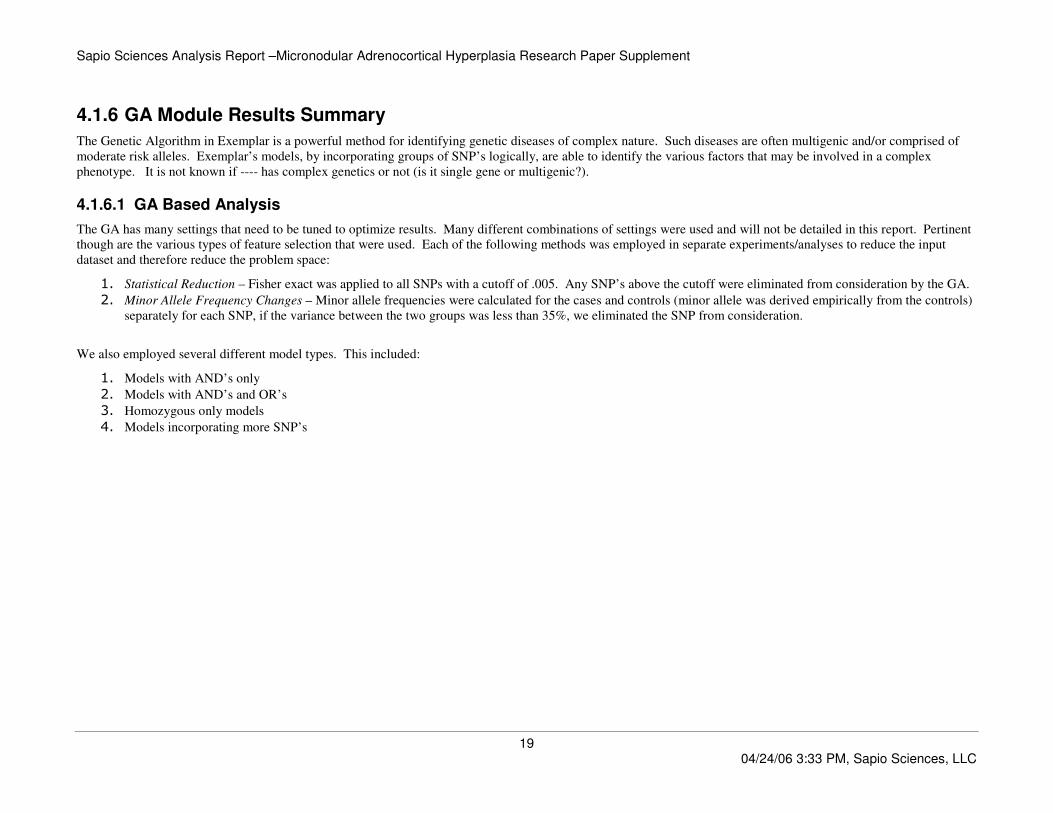
4.1.6 GA Module Results Summary
The Genetic Algorithm in Exemplar is a powerful method for identifying genetic diseases of complex nature. Such diseases are often multigenic and/or comprised of
moderate risk alleles. Exemplar’s models, by incorporating groups of SNP’s logically, are able to identify the various factors that may be involved in a complex
phenotype. It is not known if ---- has complex genetics or not (is it single gene or multigenic?).
4.1.6.1 GA Based Analysis
The GA has many settings that need to be tuned to optimize results. Many different combinations of settings were used and will not be detailed in this report. Pertinent
though are the various types of feature selection that were used. Each of the following methods was employed in separate experiments/analyses to reduce the input
dataset and therefore reduce the problem space:
1. Statistical Reduction – Fisher exact was applied to all SNPs with a cutoff of .005. Any SNP’s above the cutoff were eliminated from consideration by the GA.
2. Minor Allele Frequency Changes – Minor allele frequencies were calculated for the cases and controls (minor allele was derived empirically from the controls)
separately for each SNP, if the variance between the two groups was less than 35%, we eliminated the SNP from consideration.
We also employed several different model types. This included:
1. Models with AND’s only
2. Models with AND’s and OR’s
3. Homozygous only models
4. Models incorporating more SNP’s
Sapio Sciences Analysis Report –Micronodular Adrenocortical Hyperplasia Research Paper Supplement
20 04/24/06 3:33 PM, Sapio Sciences, LLC
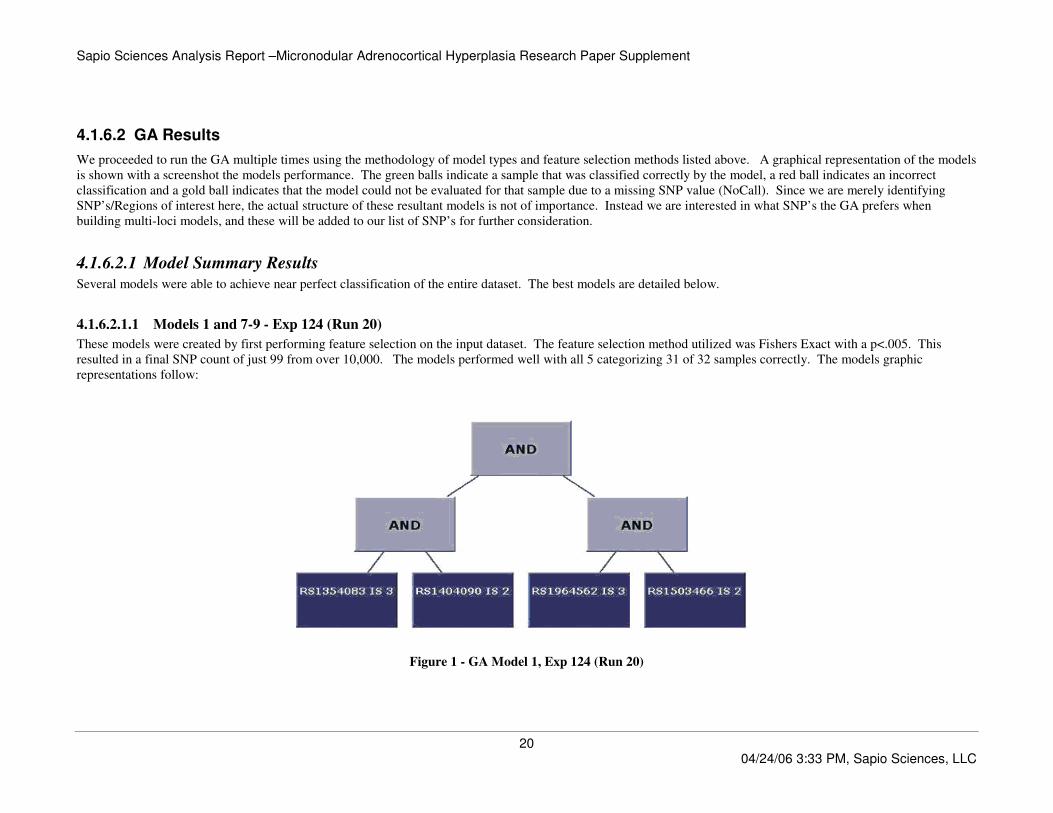
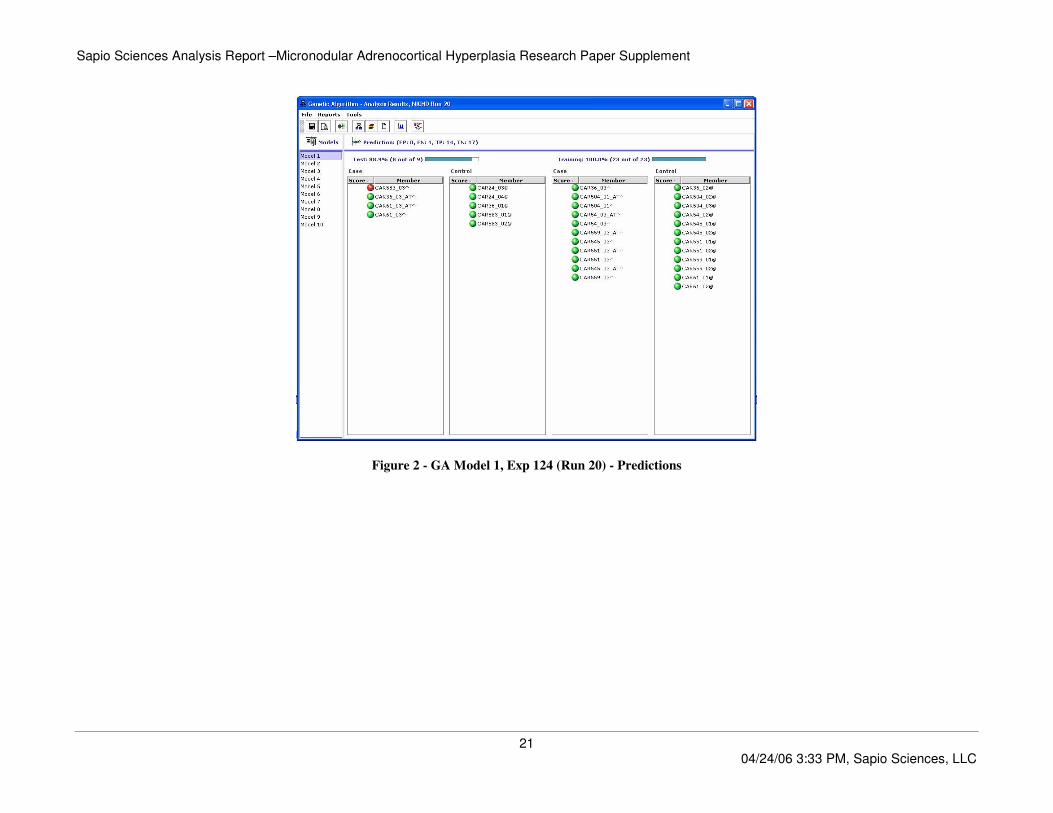
4.1.6.2 GA Results
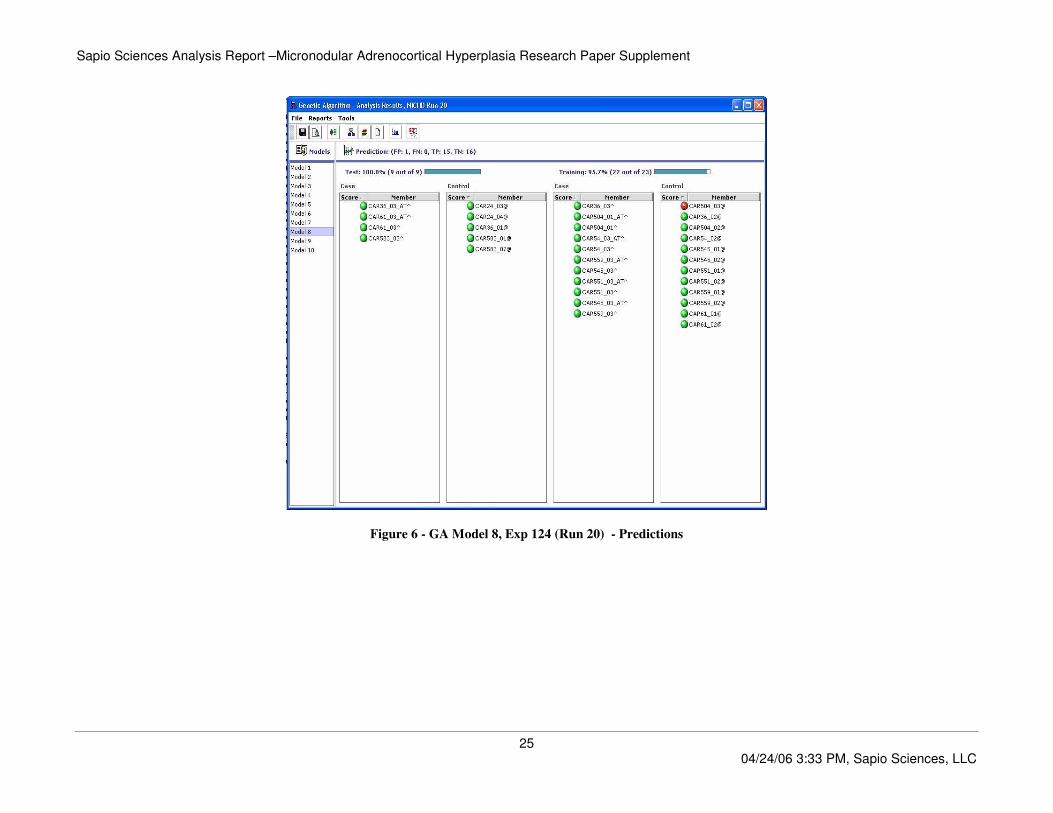
We proceeded to run the GA multiple times using the methodology of model types and feature selection methods listed above. A graphical representation of the models
is shown with a screenshot the models performance. The green balls indicate a sample that was classified correctly by the model, a red ball indicates an incorrect
classification and a gold ball indicates that the model could not be evaluated for that sample due to a missing SNP value (NoCall). Since we are merely identifying
SNP’s/Regions of interest here, the actual structure of these resultant models is not of importance. Instead we are interested in what SNP’s the GA prefers when
building multi-loci models, and these will be added to our list of SNP’s for further consideration.
4.1.6.2.1 Model Summary Results
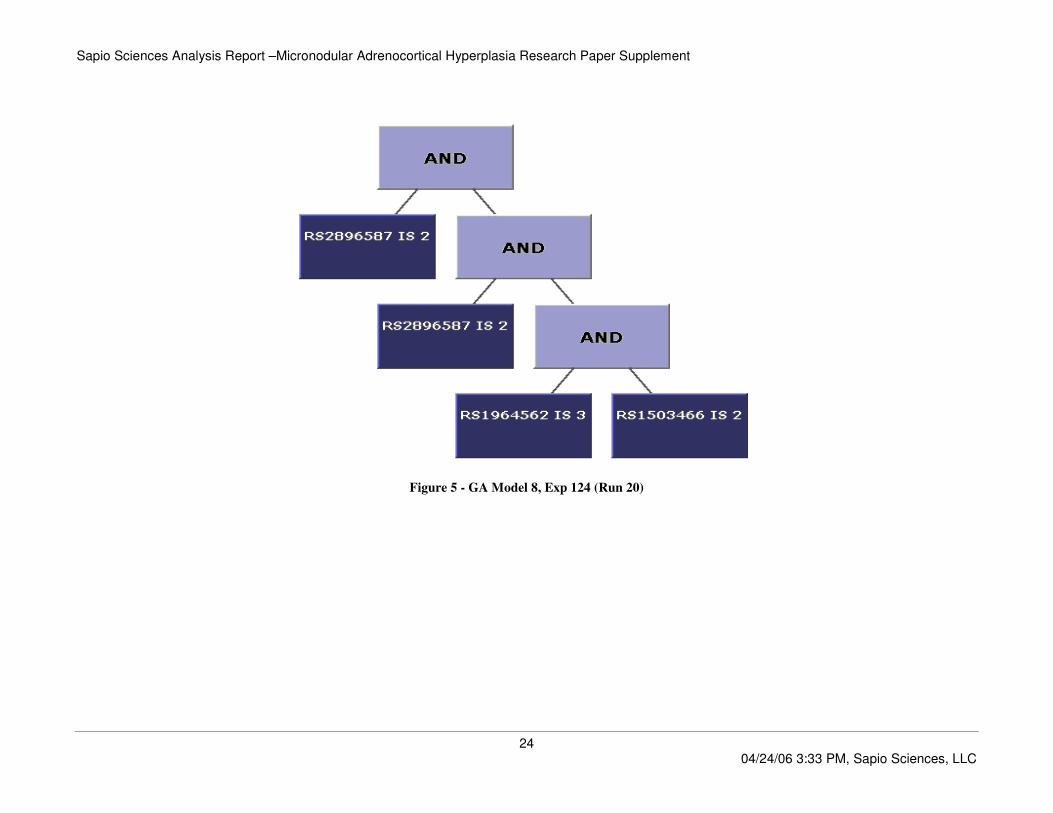
Several models were able to achieve near perfect classification of the entire dataset. The best models are detailed below.
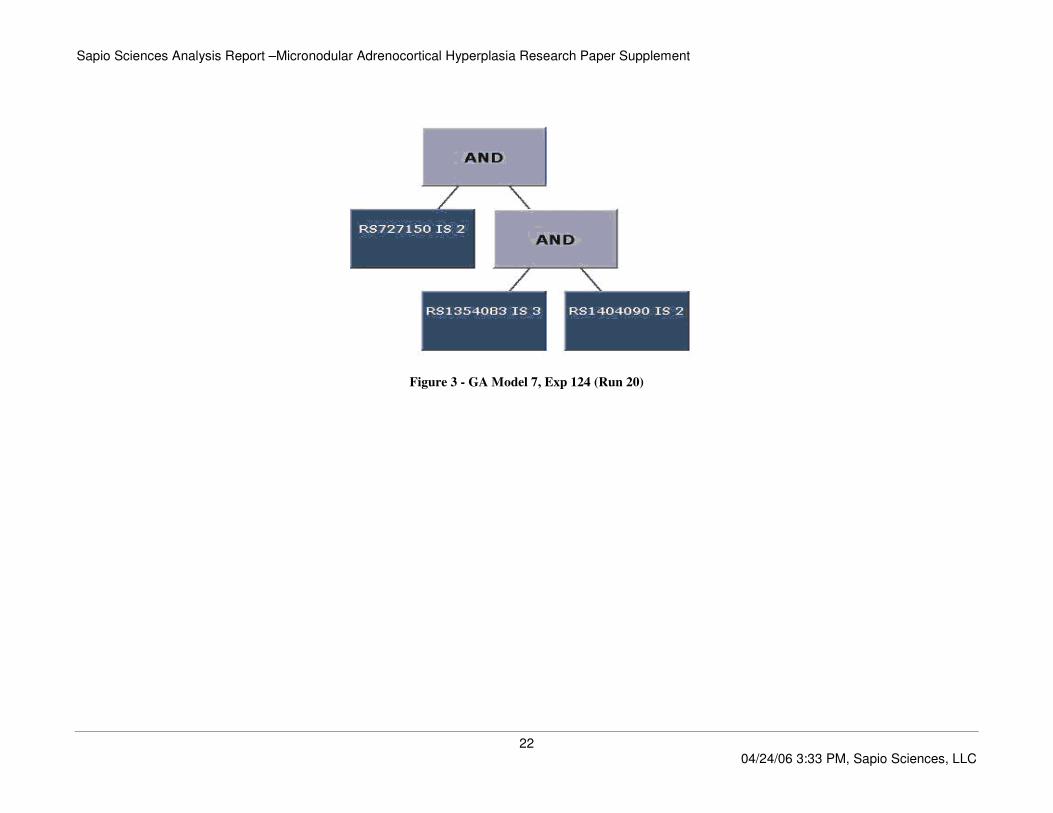
4.1.6.2.1.1 Models 1 and 7-9 - Exp 124 (Run 20)
These models were created by first performing feature selection on the input dataset. The feature selection method utilized was Fishers Exact with a p<.005. This
resulted in a final SNP count of just 99 from over 10,000. The models performed well with all 5 categorizing 31 of 32 samples correctly. The models graphic
representations follow:
Figure 1 - GA Model 1, Exp 124 (Run 20)
Sapio Sciences Analysis Report –Micronodular Adrenocortical Hyperplasia Research Paper Supplement
21 04/24/06 3:33 PM, Sapio Sciences, LLC
Figure 2 - GA Model 1, Exp 124 (Run 20) - Predictions
Sapio Sciences Analysis Report –Micronodular Adrenocortical Hyperplasia Research Paper Supplement
22 04/24/06 3:33 PM, Sapio Sciences, LLC
Figure 3 - GA Model 7, Exp 124 (Run 20)

Sapio Sciences Analysis Report –Micronodular Adrenocortical Hyperplasia Research Paper Supplement
23 04/24/06 3:33 PM, Sapio Sciences, LLC
Figure 4 - GA Model 7, Exp 124 (Run 20) - Predictions
Sapio Sciences Analysis Report –Micronodular Adrenocortical Hyperplasia Research Paper Supplement
24 04/24/06 3:33 PM, Sapio Sciences, LLC
Figure 5 - GA Model 8, Exp 124 (Run 20)
Sapio Sciences Analysis Report –Micronodular Adrenocortical Hyperplasia Research Paper Supplement
25 04/24/06 3:33 PM, Sapio Sciences, LLC
Figure 6 - GA Model 8, Exp 124 (Run 20) - Predictions

Sapio Sciences Analysis Report –Micronodular Adrenocortical Hyperplasia Research Paper Supplement
26 04/24/06 3:33 PM, Sapio Sciences, LLC
Figure 7 - GA Model 9, Exp 124 (Run 20)

Sapio Sciences Analysis Report –Micronodular Adrenocortical Hyperplasia Research Paper Supplement
27 04/24/06 3:33 PM, Sapio Sciences, LLC
Figure 8 - GA Model 9, Exp 124 (Run 20) - Predictions
Sapio Sciences Analysis Report –Micronodular Adrenocortical Hyperplasia Research Paper Supplement
28 04/24/06 3:33 PM, Sapio Sciences, LLC
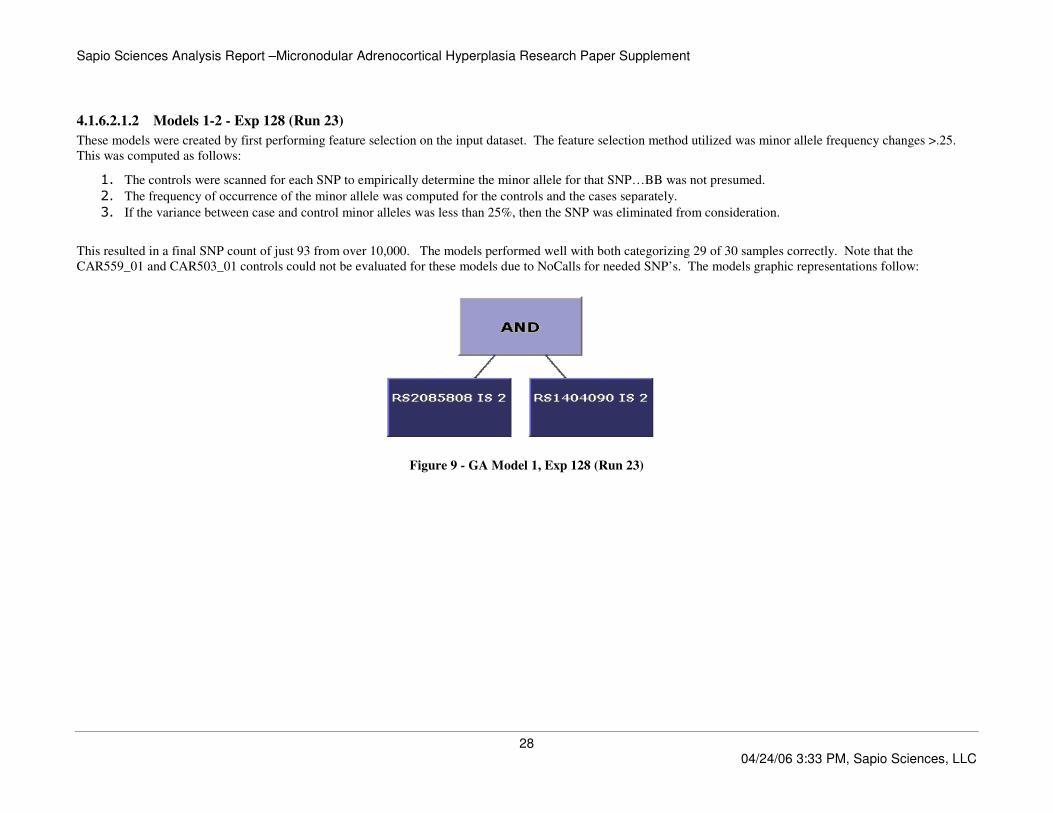
4.1.6.2.1.2 Models 1-2 - Exp 128 (Run 23)
These models were created by first performing feature selection on the input dataset. The feature selection method utilized was minor allele frequency changes >.25.
This was computed as follows:
1. The controls were scanned for each SNP to empirically determine the minor allele for that SNP…BB was not presumed.
2. The frequency of occurrence of the minor allele was computed for the controls and the cases separately.
3. If the variance between case and control minor alleles was less than 25%, then the SNP was eliminated from consideration.
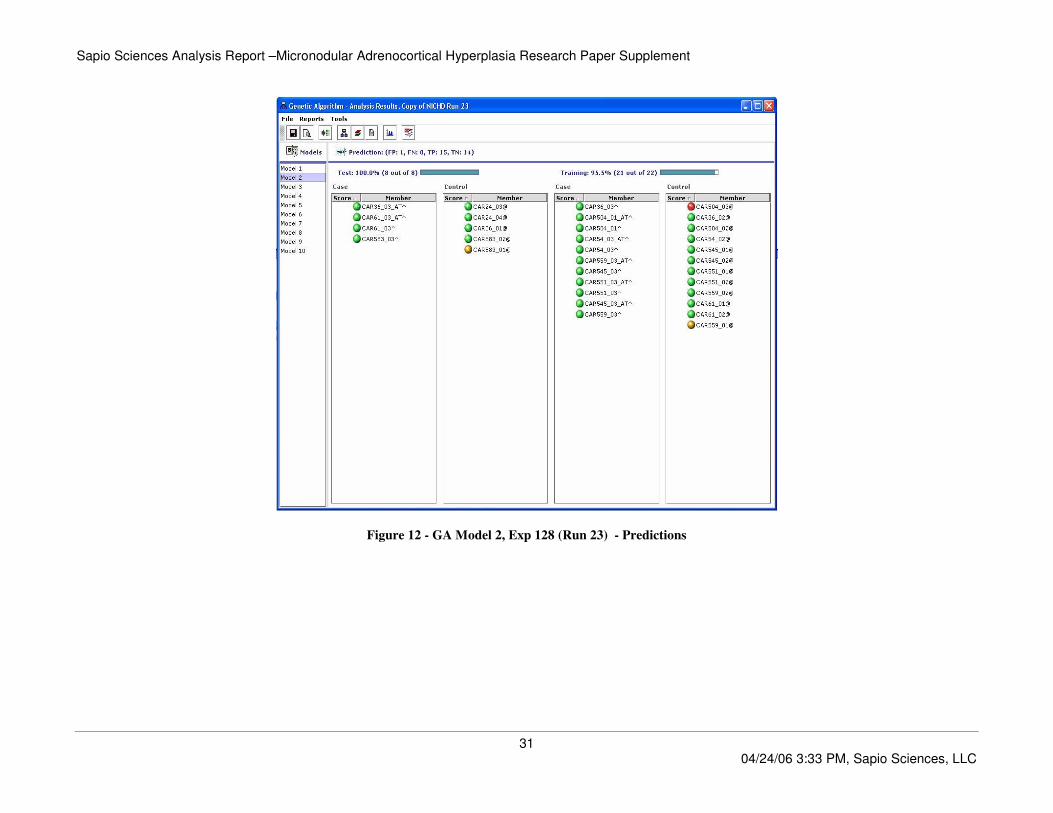
This resulted in a final SNP count of just 93 from over 10,000. The models performed well with both categorizing 29 of 30 samples correctly. Note that the
CAR559_01 and CAR503_01 controls could not be evaluated for these models due to NoCalls for needed SNP’s. The models graphic representations follow:
Figure 9 - GA Model 1, Exp 128 (Run 23)

Sapio Sciences Analysis Report –Micronodular Adrenocortical Hyperplasia Research Paper Supplement
29 04/24/06 3:33 PM, Sapio Sciences, LLC
Figure 10 - GA Model 1, Exp 128 (Run 23) - Predictions

Sapio Sciences Analysis Report –Micronodular Adrenocortical Hyperplasia Research Paper Supplement
30 04/24/06 3:33 PM, Sapio Sciences, LLC
Figure 11 - GA Model 2, Exp 128 (Run 23)
Sapio Sciences Analysis Report –Micronodular Adrenocortical Hyperplasia Research Paper Supplement
31 04/24/06 3:33 PM, Sapio Sciences, LLC
Figure 12 - GA Model 2, Exp 128 (Run 23) - Predictions

Sapio Sciences Analysis Report –Micronodular Adrenocortical Hyperplasia Research Paper Supplement
32 04/24/06 3:33 PM, Sapio Sciences, LLC
4.1.6.3 Genetic Algorithm SNP List
The GA identified 10 unique SNP’s from all the above models, which included:
SNP Genotype Chromosome Position Cytoband Related Genes
RS2393537 AB 10 60345806 10q21.1 PHYHIPL
RS2896587 AB 11 11734173 11p15.3 USP47
RS2085808 AB 13 64216386 13q21.32 PCDH9 FLJ25694
RS1964562 BB 15 76762310 15q25.1 ADAMTS7 CHRNB4
RS727150 AB 21 18764912 21q21.1 NCAM2 PRSS7
RS1404090 AB 2 76402264 2p12 C2orf3 LRRTM4
RS585859 BB 2 219585661 2q35 USP37
RS691140 AA 2 219829544 2q35 TTLL4 CYP27A1
RS1354083 BB 3 125680764 3q21.2 TRAD
RS1503466 AB 4 27495090 4p15.2 PCDH7 STIM2
Table 6 - Genetic Algorithm SNP List

Sapio Sciences Analysis Report –Micronodular Adrenocortical Hyperplasia Research Paper Supplement
33 04/24/06 3:33 PM, Sapio Sciences, LLC
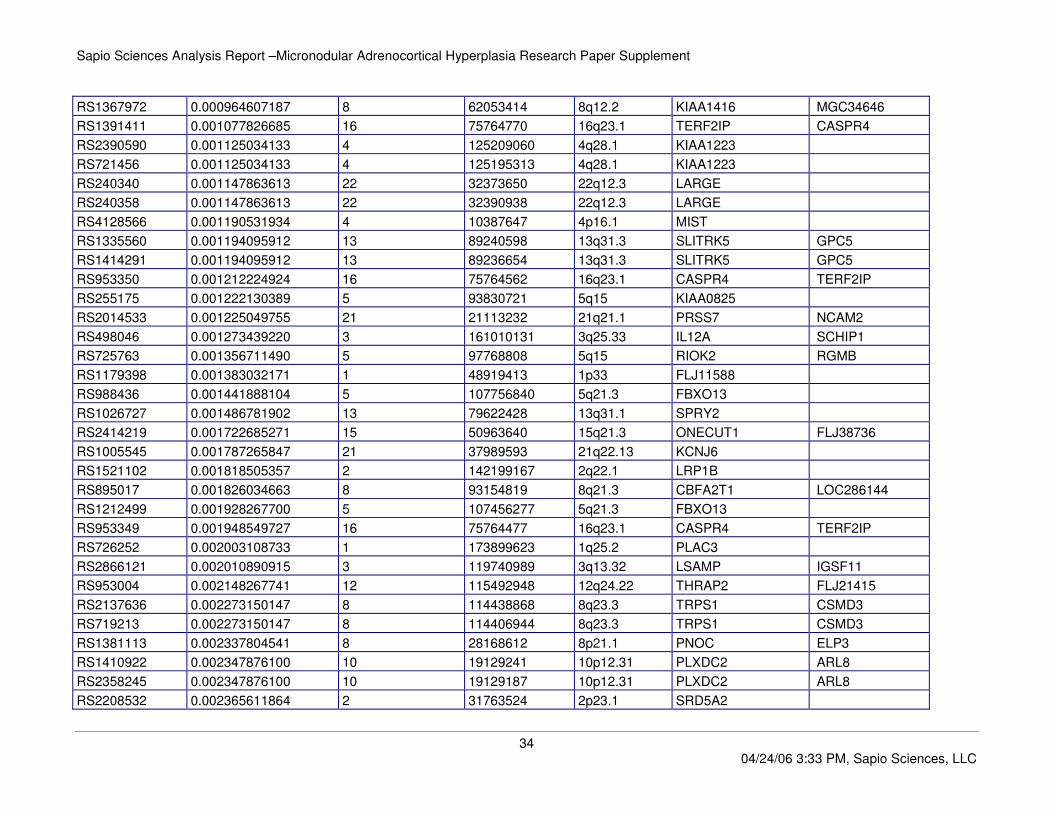
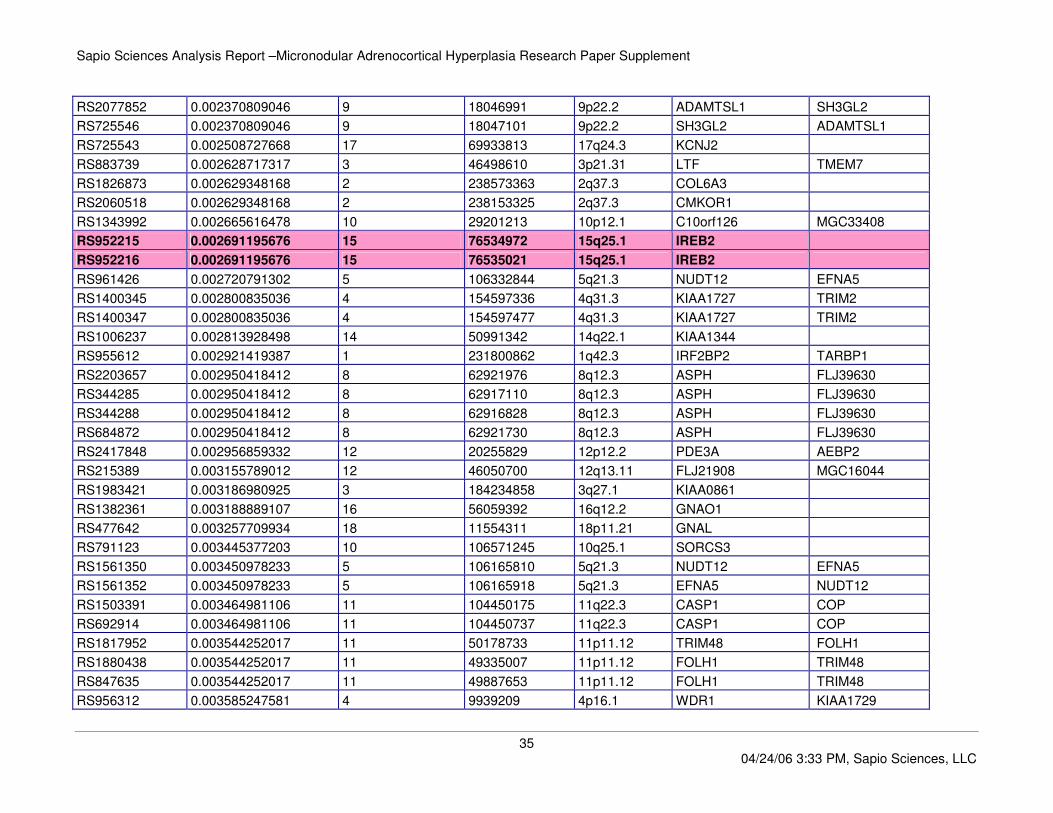
4.1.7 CA Module Results Summary
The CA module was run with the controls used as the reference set and only the tumor samples (Peripheral Blood samples were not utilized) as cases. The cases were
analyzed as a whole against the reference set, versus on an individual basis. A mean p-value was calculated for each SNP to determine its probability of LOH at that
point in the genome. We exported a table with a stringent cutoff of p<.005. Details on the method for calculating p-values are in Appendix A attached to this document.
Results for the top 100 most significant (lowest p-values) SNP’s follow:
SNP pValue Chromosome Position Cytoband Related Genes
RS2226935 0.000020779287 11 126168083 11q24.2 KIRREL3
RS1486991 0.000028336915 4 135748809 4q28.3 SLC7A11 PCDH10
RS1486992 0.000028336915 4 135748925 4q28.3 SLC7A11 PCDH10
RS173282 0.000046166411 5 77188683 5q14.1 TBCA AP3B1
RS1007499 0.000056856122 10 10525838 10p14 CUGBP2 GATA3
RS722569 0.000056856122 10 10502667 10p14 CUGBP2 GATA3
RS34999 0.000059392282 5 80361118 5q14.1 RASGRF2
RS35000 0.000059392282 5 80361309 5q14.1 RASGRF2
RS719542 0.000079278403 1 19868655 1p36.13 PLA2G5
RS764051 0.000478082737 1 98819881 1p21.3 SNX7
RS1402116 0.000513256296 15 44103792 15q21.1 SEMA6D SQRDL
RS1402118 0.000513256296 15 44108344 15q21.1 SEMA6D SQRDL
RS1434673 0.000513256296 15 44226937 15q21.1 SEMA6D SQRDL
RS1434674 0.000513256296 15 44226985 15q21.1 SEMA6D SQRDL
RS1112687 0.000550725476 1 49438621 1p33 FLJ11588
RS764206 0.000732136427 1 168784428 1q24.3 XTP2
RS2371455 0.000738590551 12 55130160 12q13.3 TIMELESS MIP
RS722135 0.000777976521 12 27470179 12p11.23 PPFIBP1 ARNTL2
RS727158 0.000818958479 5 125603971 5q23.2 NS3TP2
RS1343836 0.000840747552 4 137951836 4q28.3 SLC7A11 PCDH10
RS2014303 0.000912116153 4 10336739 4p16.1 MIST
RS4128567 0.000912116153 4 10387724 4p16.1 MIST
RS2895530 0.000964064792 10 12483709 10p13 CAMK1D
Sapio Sciences Analysis Report –Micronodular Adrenocortical Hyperplasia Research Paper Supplement
34 04/24/06 3:33 PM, Sapio Sciences, LLC
RS1367972 0.000964607187 8 62053414 8q12.2 KIAA1416 MGC34646
RS1391411 0.001077826685 16 75764770 16q23.1 TERF2IP CASPR4
RS2390590 0.001125034133 4 125209060 4q28.1 KIAA1223
RS721456 0.001125034133 4 125195313 4q28.1 KIAA1223
RS240340 0.001147863613 22 32373650 22q12.3 LARGE
RS240358 0.001147863613 22 32390938 22q12.3 LARGE
RS4128566 0.001190531934 4 10387647 4p16.1 MIST
RS1335560 0.001194095912 13 89240598 13q31.3 SLITRK5 GPC5
RS1414291 0.001194095912 13 89236654 13q31.3 SLITRK5 GPC5
RS953350 0.001212224924 16 75764562 16q23.1 CASPR4 TERF2IP
RS255175 0.001222130389 5 93830721 5q15 KIAA0825
RS2014533 0.001225049755 21 21113232 21q21.1 PRSS7 NCAM2
RS498046 0.001273439220 3 161010131 3q25.33 IL12A SCHIP1
RS725763 0.001356711490 5 97768808 5q15 RIOK2 RGMB
RS1179398 0.001383032171 1 48919413 1p33 FLJ11588
RS988436 0.001441888104 5 107756840 5q21.3 FBXO13
RS1026727 0.001486781902 13 79622428 13q31.1 SPRY2
RS2414219 0.001722685271 15 50963640 15q21.3 ONECUT1 FLJ38736
RS1005545 0.001787265847 21 37989593 21q22.13 KCNJ6
RS1521102 0.001818505357 2 142199167 2q22.1 LRP1B
RS895017 0.001826034663 8 93154819 8q21.3 CBFA2T1 LOC286144
RS1212499 0.001928267700 5 107456277 5q21.3 FBXO13
RS953349 0.001948549727 16 75764477 16q23.1 CASPR4 TERF2IP
RS726252 0.002003108733 1 173899623 1q25.2 PLAC3
RS2866121 0.002010890915 3 119740989 3q13.32 LSAMP IGSF11
RS953004 0.002148267741 12 115492948 12q24.22 THRAP2 FLJ21415
RS2137636 0.002273150147 8 114438868 8q23.3 TRPS1 CSMD3
RS719213 0.002273150147 8 114406944 8q23.3 TRPS1 CSMD3
RS1381113 0.002337804541 8 28168612 8p21.1 PNOC ELP3
RS1410922 0.002347876100 10 19129241 10p12.31 PLXDC2 ARL8
RS2358245 0.002347876100 10 19129187 10p12.31 PLXDC2 ARL8
RS2208532 0.002365611864 2 31763524 2p23.1 SRD5A2
Sapio Sciences Analysis Report –Micronodular Adrenocortical Hyperplasia Research Paper Supplement
35 04/24/06 3:33 PM, Sapio Sciences, LLC
RS2077852 0.002370809046 9 18046991 9p22.2 ADAMTSL1 SH3GL2
RS725546 0.002370809046 9 18047101 9p22.2 SH3GL2 ADAMTSL1
RS725543 0.002508727668 17 69933813 17q24.3 KCNJ2
RS883739 0.002628717317 3 46498610 3p21.31 LTF TMEM7
RS1826873 0.002629348168 2 238573363 2q37.3 COL6A3
RS2060518 0.002629348168 2 238153325 2q37.3 CMKOR1
RS1343992 0.002665616478 10 29201213 10p12.1 C10orf126 MGC33408
RS952215 0.002691195676 15 76534972 15q25.1 IREB2
RS952216 0.002691195676 15 76535021 15q25.1 IREB2
RS961426 0.002720791302 5 106332844 5q21.3 NUDT12 EFNA5
RS1400345 0.002800835036 4 154597336 4q31.3 KIAA1727 TRIM2
RS1400347 0.002800835036 4 154597477 4q31.3 KIAA1727 TRIM2
RS1006237 0.002813928498 14 50991342 14q22.1 KIAA1344
RS955612 0.002921419387 1 231800862 1q42.3 IRF2BP2 TARBP1
RS2203657 0.002950418412 8 62921976 8q12.3 ASPH FLJ39630
RS344285 0.002950418412 8 62917110 8q12.3 ASPH FLJ39630
RS344288 0.002950418412 8 62916828 8q12.3 ASPH FLJ39630
RS684872 0.002950418412 8 62921730 8q12.3 ASPH FLJ39630
RS2417848 0.002956859332 12 20255829 12p12.2 PDE3A AEBP2
RS215389 0.003155789012 12 46050700 12q13.11 FLJ21908 MGC16044
RS1983421 0.003186980925 3 184234858 3q27.1 KIAA0861
RS1382361 0.003188889107 16 56059392 16q12.2 GNAO1
RS477642 0.003257709934 18 11554311 18p11.21 GNAL
RS791123 0.003445377203 10 106571245 10q25.1 SORCS3
RS1561350 0.003450978233 5 106165810 5q21.3 NUDT12 EFNA5
RS1561352 0.003450978233 5 106165918 5q21.3 EFNA5 NUDT12
RS1503391 0.003464981106 11 104450175 11q22.3 CASP1 COP
RS692914 0.003464981106 11 104450737 11q22.3 CASP1 COP
RS1817952 0.003544252017 11 50178733 11p11.12 TRIM48 FOLH1
RS1880438 0.003544252017 11 49335007 11p11.12 FOLH1 TRIM48
RS847635 0.003544252017 11 49887653 11p11.12 FOLH1 TRIM48
RS956312 0.003585247581 4 9939209 4p16.1 WDR1 KIAA1729
Sapio Sciences Analysis Report –Micronodular Adrenocortical Hyperplasia Research Paper Supplement
36 04/24/06 3:33 PM, Sapio Sciences, LLC
RS1350851 0.003597400009 8 120342175 8q24.12 MAL2 NOV
RS952440 0.003663704056 16 56750502 16q13 HERPUD1
RS1823718 0.003801102528 15 71863061 15q24.1 B7H3 MGC34741
RS1371664 0.003816291749 2 199107008 2q33.1 PLCL1 BOLL
RS1401096 0.003816291749 2 199026371 2q33.1 PLCL1 BOLL
RS745899 0.003816291749 2 199110583 2q33.1 PLCL1 BOLL
RS892514 0.003816291749 2 199107813 2q33.1 BOLL PLCL1
RS298898 0.003834859006 13 61543833 13q21.31 PCDH20 FLJ25694
RS4128460 0.003853565249 6 142336556 6q24.1 NMBR
RS1382541 0.003864033042 5 80037557 5q14.1 MSH3
RS1382542 0.003864033042 5 80037654 5q14.1 MSH3
RS1643655 0.003864033042 5 80037849 5q14.1 MSH3
RS1650692 0.003864033042 5 80037466 5q14.1 MSH3
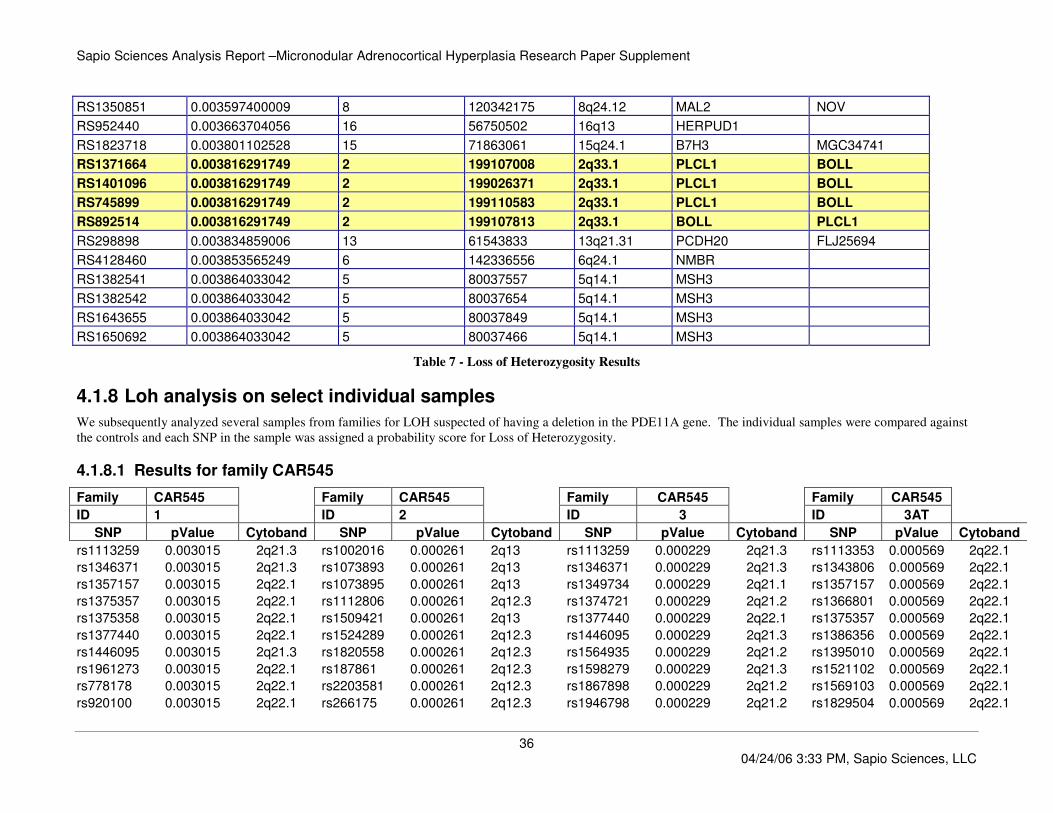
Table 7 - Loss of Heterozygosity Results
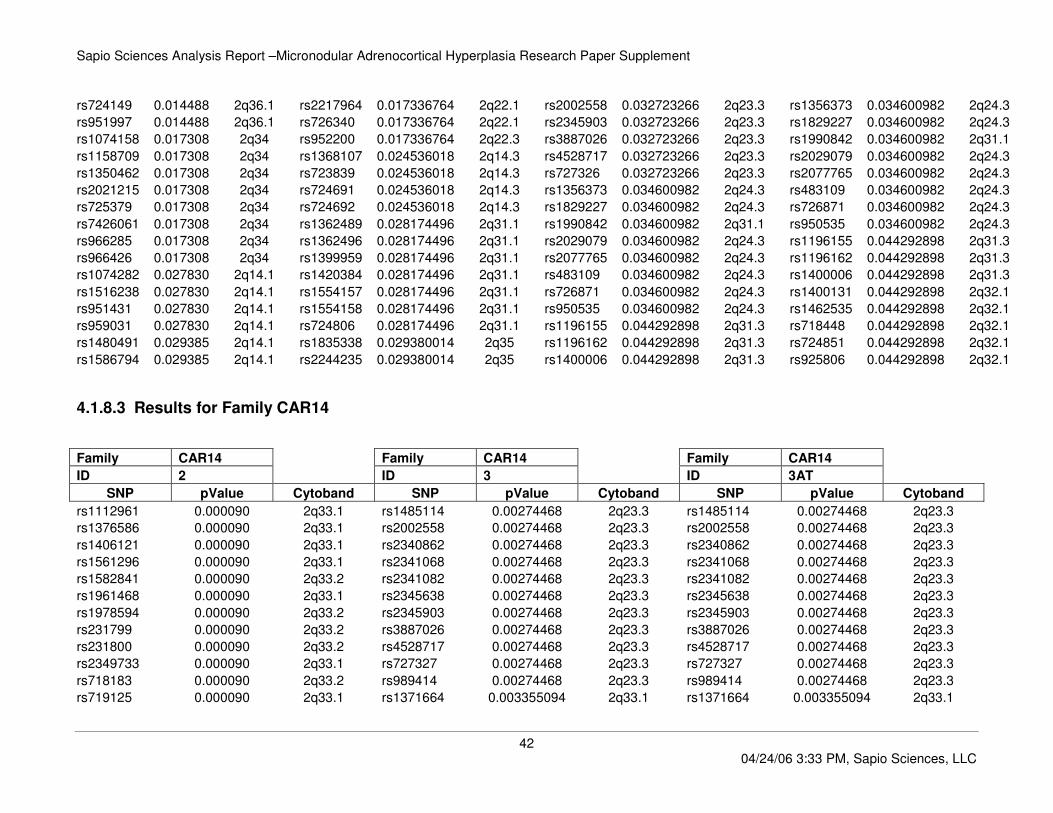
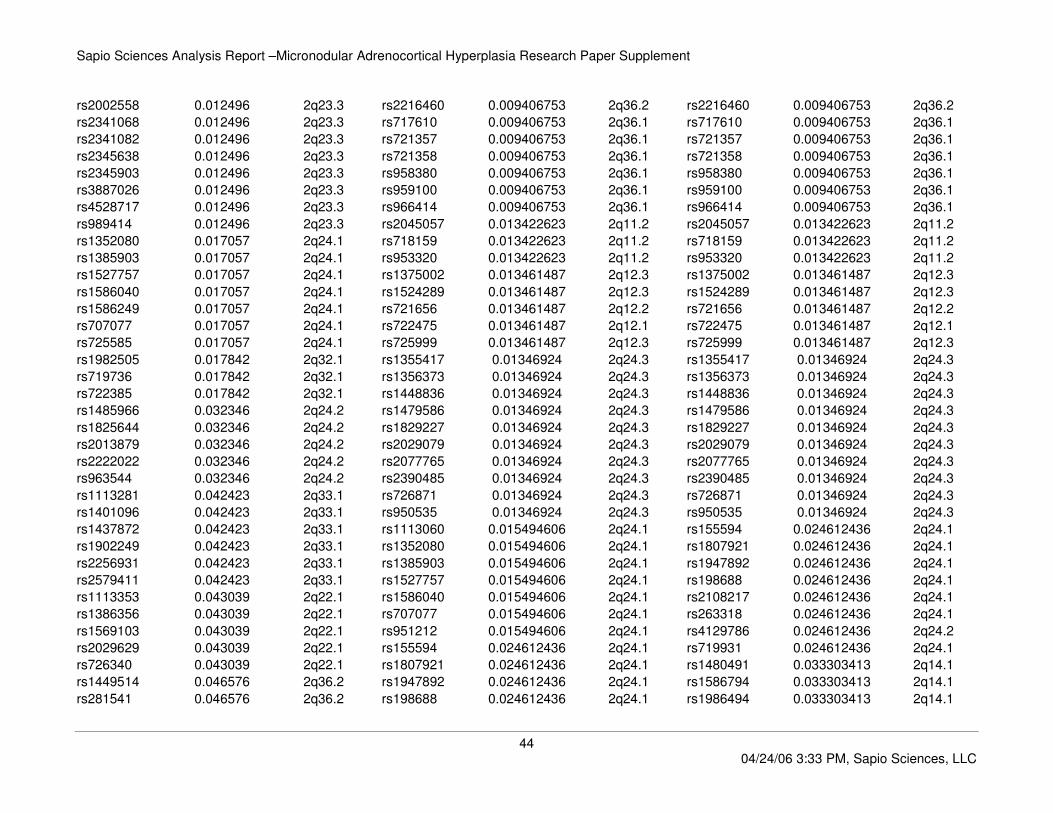
4.1.8 Loh analysis on select individual samples
We subsequently analyzed several samples from families for LOH suspected of having a deletion in the PDE11A gene. The individual samples were compared against
the controls and each SNP in the sample was assigned a probability score for Loss of Heterozygosity.
4.1.8.1 Results for family CAR545
Family CAR545 Family CAR545 Family CAR545 Family CAR545
ID 1 ID 2 ID 3 ID 3AT
SNP pValue Cytoband SNP pValue Cytoband SNP pValue Cytoband SNP pValue Cytoband
rs1113259 0.003015 2q21.3 rs1002016 0.000261 2q13 rs1113259 0.000229 2q21.3 rs1113353 0.000569 2q22.1
rs1346371 0.003015 2q21.3 rs1073893 0.000261 2q13 rs1346371 0.000229 2q21.3 rs1343806 0.000569 2q22.1
rs1357157 0.003015 2q22.1 rs1073895 0.000261 2q13 rs1349734 0.000229 2q21.1 rs1357157 0.000569 2q22.1
rs1375357 0.003015 2q22.1 rs1112806 0.000261 2q12.3 rs1374721 0.000229 2q21.2 rs1366801 0.000569 2q22.1
rs1375358 0.003015 2q22.1 rs1509421 0.000261 2q13 rs1377440 0.000229 2q22.1 rs1375357 0.000569 2q22.1
rs1377440 0.003015 2q22.1 rs1524289 0.000261 2q12.3 rs1446095 0.000229 2q21.3 rs1386356 0.000569 2q22.1
rs1446095 0.003015 2q21.3 rs1820558 0.000261 2q12.3 rs1564935 0.000229 2q21.2 rs1395010 0.000569 2q22.1
rs1961273 0.003015 2q22.1 rs187861 0.000261 2q12.3 rs1598279 0.000229 2q21.3 rs1521102 0.000569 2q22.1
rs778178 0.003015 2q22.1 rs2203581 0.000261 2q12.3 rs1867898 0.000229 2q21.2 rs1569103 0.000569 2q22.1
rs920100 0.003015 2q22.1 rs266175 0.000261 2q12.3 rs1946798 0.000229 2q21.2 rs1829504 0.000569 2q22.1

Sapio Sciences Analysis Report –Micronodular Adrenocortical Hyperplasia Research Paper Supplement
37 04/24/06 3:33 PM, Sapio Sciences, LLC
rs961360 0.003015 2q21.3 rs266177 0.000261 2q12.3 rs1961273 0.000229 2q22.1 rs2029629 0.000569 2q22.1
rs1368884 0.006932 2q36.2 rs724710 0.000261 2q13 rs2320399 0.000229 2q21.2 rs1020941 0.001095 2q32.3
rs1371552 0.006932 2q36.1 rs730988 0.000261 2q13 rs2321201 0.000229 2q21.2 rs1112629 0.001095 2q32.3
rs1821409 0.006932 2q36.2 rs855034 0.000261 2q12.3 rs3886664 0.000229 2q21.2 rs1551443 0.001095 2q32.3
rs1921634 0.006932 2q36.1 rs920264 0.000261 2q12.3 rs627244 0.000229 2q21.3 rs2030171 0.001095 2q32.2
rs1921635 0.006932 2q36.1 rs967895 0.000261 2q13 rs778178 0.000229 2q22.1 rs2884207 0.001095 2q32.3
rs2216460 0.006932 2q36.2 rs1079861 0.000637 2q24.1 rs920100 0.000229 2q22.1 rs722882 0.001095 2q32.3
rs717610 0.006932 2q36.1 rs1352080 0.000637 2q24.1 rs961360 0.000229 2q21.3 rs726130 0.001095 2q32.3
rs721357 0.006932 2q36.1 rs1385903 0.000637 2q24.1 rs1113353 0.000569 2q22.1 rs801368 0.001095 2q32.3
rs721358 0.006932 2q36.1 rs1586040 0.000637 2q24.1 rs1343806 0.000569 2q22.1 rs950480 0.001095 2q32.3
rs953945 0.006932 2q36.2 rs1586249 0.000637 2q24.1 rs1357157 0.000569 2q22.1 rs957845 0.001095 2q32.3
rs958380 0.006932 2q36.1 rs707077 0.000637 2q24.1 rs1366801 0.000569 2q22.1 rs1112809 0.002251 2q22.3
rs959100 0.006932 2q36.1 rs725585 0.000637 2q24.1 rs1375357 0.000569 2q22.1 rs1113958 0.002251 2q22.3
rs966414 0.006932 2q36.1 rs727326 0.000637 2q23.3 rs1386356 0.000569 2q22.1 rs1371031 0.002251 2q22.3
rs2375936 0.007078 2q12.1 rs727327 0.000637 2q23.3 rs1395010 0.000569 2q22.1 rs1919447 0.002251 2q22.3
rs264962 0.007078 2q12.1 rs967496 0.000637 2q23.3 rs1521102 0.000569 2q22.1 rs1986706 0.002251 2q23.1
rs409542 0.007078 2q12.1 rs1196155 0.001698 2q31.3 rs1569103 0.000569 2q22.1 rs2078542 0.002251 2q22.3
rs435852 0.007078 2q12.1 rs1196162 0.001698 2q31.3 rs1829504 0.000569 2q22.1 rs720844 0.002251 2q23.1
rs445077 0.007078 2q12.1 rs1371624 0.001698 2q31.3 rs2029629 0.000569 2q22.1 rs1074282 0.003001 2q14.1
rs722475 0.007078 2q12.1 rs1375487 0.001698 2q31.3 rs1074282 0.003070 2q14.1 rs1516238 0.003001 2q14.1
rs1384398 0.008782 2q34 rs1400006 0.001698 2q31.3 rs1516238 0.003070 2q14.1 rs1534100 0.003001 2q14.2
rs1402718 0.008782 2q34 rs1400131 0.001698 2q32.1 rs2311398 0.003070 2q14.2 rs2311398 0.003001 2q14.2
rs1427356 0.008782 2q34 rs1406331 0.001698 2q32.1 rs332704 0.003070 2q14.2 rs332704 0.003001 2q14.2
rs1820569 0.008782 2q34 rs718448 0.001698 2q32.1 rs951431 0.003070 2q14.1 rs874816 0.003001 2q14.2
rs2128392 0.008782 2q34 rs723390 0.001698 2q32.1 rs959031 0.003070 2q14.1 rs951431 0.003001 2q14.1
rs2217161 0.008782 2q34 rs724851 0.001698 2q32.1 rs1074750 0.003403 2q23.3 rs959031 0.003001 2q14.1
rs2888038 0.008782 2q34 rs763860 0.001698 2q31.3 rs1079861 0.003403 2q24.1 rs1074167 0.003491 2q23.3
rs724954 0.008782 2q34 rs890059 0.001698 2q31.3 rs1385903 0.003403 2q24.1 rs1074750 0.003491 2q23.3
rs953133 0.008782 2q34 rs925806 0.001698 2q32.1 rs1586040 0.003403 2q24.1 rs1079861 0.003491 2q24.1
rs956179 0.008782 2q34 rs950165 0.001698 2q31.3 rs1586249 0.003403 2q24.1 rs1586249 0.003491 2q24.1
rs1561002 0.013115 2q11.2 rs951542 0.001698 2q31.3 rs707033 0.003403 2q24.1 rs707033 0.003491 2q24.1
rs1922296 0.013115 2q11.2 rs1016120 0.003289 2q21.3 rs707077 0.003403 2q24.1 rs707077 0.003491 2q24.1
rs720229 0.013115 2q11.2 rs1113259 0.003289 2q21.3 rs725585 0.003403 2q24.1 rs967496 0.003491 2q23.3
rs953934 0.013115 2q11.2 rs1346371 0.003289 2q21.3 rs967496 0.003403 2q23.3 rs1376755 0.003671 2q24.2
rs958790 0.013115 2q11.2 rs1374721 0.003289 2q21.2 rs1376755 0.003671 2q24.2 rs1376757 0.003671 2q24.2
rs1114562 0.016684 2q36.3 rs1446095 0.003289 2q21.3 rs1376757 0.003671 2q24.2 rs1485966 0.003671 2q24.2

Sapio Sciences Analysis Report –Micronodular Adrenocortical Hyperplasia Research Paper Supplement
38 04/24/06 3:33 PM, Sapio Sciences, LLC
rs1343845 0.016684 2q36.3 rs1564935 0.003289 2q21.2 rs1485966 0.003671 2q24.2 rs1825644 0.003671 2q24.2
rs1395339 0.016684 2q36.3 rs1598279 0.003289 2q21.3 rs1825644 0.003671 2q24.2 rs2013879 0.003671 2q24.2
rs1917126 0.016684 2q36.3 rs1867898 0.003289 2q21.2 rs2013879 0.003671 2q24.2 rs2216847 0.003671 2q24.2
rs720501 0.016684 2q36.3 rs2321201 0.003289 2q21.2 rs2216847 0.003671 2q24.2 rs2222022 0.003671 2q24.2
rs1374717 0.018033 2q33.3 rs3886664 0.003289 2q21.2 rs2222022 0.003671 2q24.2 rs4129787 0.003671 2q24.2
rs2359721 0.018033 2q33.3 rs627244 0.003289 2q21.3 rs4129787 0.003671 2q24.2 rs963544 0.003671 2q24.2
rs2359722 0.018033 2q33.3 rs961360 0.003289 2q21.3 rs963544 0.003671 2q24.2 rs997015 0.003671 2q24.2
rs725822 0.018033 2q33.3 rs1343822 0.004282 2q14.3 rs997015 0.003671 2q24.2 rs1355417 0.006615 2q24.3
rs763832 0.018033 2q33.3 rs1405090 0.004282 2q14.3 rs1343822 0.007919 2q14.3 rs1374592 0.006615 2q24.3
rs867344 0.018033 2q33.3 rs1589908 0.004282 2q14.3 rs1405090 0.007919 2q14.3 rs1447235 0.006615 2q24.3
rs872943 0.018033 2q33.3 rs1980356 0.004282 2q14.3 rs1589908 0.007919 2q14.3 rs1479586 0.006615 2q24.3
rs952242 0.018033 2q33.3 rs2090030 0.004282 2q14.3 rs1980356 0.007919 2q14.3 rs1858102 0.006615 2q24.3
rs1112961 0.023509058 2q33.1 rs2419559 0.004282442 2q14.3 rs2203772 0.007919 2q14.3 rs1858104 0.006615 2q24.3
rs2349733 0.023509058 2q33.1 rs1112961 0.0047321 2q33.1 rs2419559 0.007919 2q14.3 rs2390485 0.006615 2q24.3
rs727361 0.023509058 2q33.2 rs1582841 0.0047321 2q33.2 rs1518308 0.008196 2q36.3 rs718573 0.006615 2q24.3
rs733882 0.023509058 2q33.1 rs1978594 0.0047321 2q33.2 rs1518309 0.008196105 2q36.3 rs962188 0.006615 2q24.3
rs1372086 0.023724077 2q36.3 rs231799 0.0047321 2q33.2 rs1562010 0.008196105 2q36.3 rs1518308 0.008254 2q36.3
rs1405837 0.023724077 2q36.3 rs231800 0.0047321 2q33.2 rs281541 0.008196105 2q36.2 rs1518309 0.008254 2q36.3
rs1419944 0.023724077 2q36.3 rs2349733 0.0047321 2q33.1 rs51071 0.008196105 2q36.2 rs1562010 0.008254 2q36.3
rs1419946 0.023724077 2q36.3 rs727361 0.0047321 2q33.2 rs718850 0.008196105 2q36.3 rs51071 0.008254 2q36.2
rs1865684 0.023724077 2q36.3 rs733882 0.0047321 2q33.1 rs925865 0.008196105 2q36.3 rs718850 0.008254 2q36.3
rs2396644 0.023724077 2q36.3 rs1113958 0.007737409 2q22.3 rs1196155 0.008730829 2q31.3 rs728654 0.008254 2q36.2
rs475525 0.023724077 2q36.3 rs1453317 0.007737409 2q23.1 rs1196162 0.008730829 2q31.3 rs925865 0.008254 2q36.3
rs800753 0.023724077 2q36.3 rs1986706 0.007737409 2q23.1 rs1375487 0.008730829 2q31.3 rs1196155 0.008739 2q31.3
rs1020941 0.024683066 2q32.3 rs4464217 0.007737409 2q23.1 rs1400006 0.008730829 2q31.3 rs1196162 0.008739 2q31.3
rs1073982 0.024683066 2q32.3 rs720844 0.007737409 2q23.1 rs1400131 0.008730829 2q32.1 rs1375487 0.008739 2q31.3
rs1112629 0.024683066 2q32.3 rs1025944 0.008216881 2q31.2 rs1406331 0.008730829 2q32.1 rs1400006 0.008739 2q31.3
rs1994569 0.024683066 2q32.3 rs1112467 0.008216881 2q31.2 rs1462535 0.008730829 2q32.1 rs1400131 0.008739 2q32.1
rs2884207 0.024683066 2q32.3 rs1370540 0.008216881 2q31.1 rs718448 0.008730829 2q32.1 rs1406331 0.008739 2q32.1
rs722882 0.024683066 2q32.3 rs1370541 0.008216881 2q31.1 rs724851 0.008730829 2q32.1 rs1462535 0.008739 2q32.1
rs726130 0.024683066 2q32.3 rs1435572 0.008216881 2q31.2 rs763860 0.008730829 2q31.3 rs718448 0.008739 2q32.1
rs957845 0.024683066 2q32.3 rs1550723 0.008216881 2q31.1 rs925806 0.008730829 2q32.1 rs724851 0.008739 2q32.1
rs1518308 0.028875267 2q36.3 rs1901823 0.008216881 2q31.2 rs950165 0.008730829 2q31.3 rs763860 0.008739 2q31.3
rs1518309 0.028875267 2q36.3 rs1997207 0.008216881 2q31.2 rs951542 0.008730829 2q31.3 rs925806 0.008739 2q32.1
rs1562010 0.028875267 2q36.3 rs959157 0.008216881 2q31.2 rs1367179 0.009353677 2q14.1 rs950165 0.008739 2q31.3
rs718850 0.028875267 2q36.3 rs1384398 0.022293794 2q34 rs1367180 0.009353677 2q14.1 rs1367179 0.009354 2q14.1

Sapio Sciences Analysis Report –Micronodular Adrenocortical Hyperplasia Research Paper Supplement
39 04/24/06 3:33 PM, Sapio Sciences, LLC
rs925865 0.028875267 2q36.3 rs1427356 0.022293794 2q34 rs1374161 0.009353677 2q13 rs1367180 0.009354 2q14.1
rs1374431 0.029662612 2q31.1 rs1820569 0.022293794 2q34 rs1375147 0.009353677 2q14.1 rs1374161 0.009354 2q13
rs2885116 0.029662612 2q31.1 rs2217161 0.022293794 2q34 rs1430104 0.009353677 2q14.1 rs1375147 0.009354 2q14.1
rs717852 0.029662612 2q31.1 rs724954 0.022293794 2q34 rs1517361 0.009353677 2q14.1 rs1430104 0.009354 2q14.1
rs726032 0.029662612 2q31.1 rs953133 0.022293794 2q34 rs1519669 0.009353677 2q14.1 rs1517361 0.009354 2q14.1
rs726033 0.029662612 2q31.1 rs956179 0.022293794 2q34 rs717522 0.009353677 2q14.1 rs1519669 0.009354 2q14.1
rs847145 0.029662612 2q31.1 rs1374431 0.022518984 2q31.1 rs724496 0.009353677 2q13 rs717522 0.009354 2q14.1
rs1362496 0.03612024 2q31.1 rs1378729 0.022518984 2q31.1 rs785046 0.009353677 2q14.1 rs724496 0.009354 2q13
rs1554157 0.03612024 2q31.1 rs1982235 0.022518984 2q31.1 rs958396 0.009353677 2q14.1 rs785046 0.009354 2q14.1
rs1554158 0.03612024 2q31.1 rs726032 0.022518984 2q31.1 rs1362496 0.011885652 2q31.1 rs958396 0.009354 2q14.1
rs1865236 0.03612024 2q31.1 rs726033 0.022518984 2q31.1 rs1420384 0.011885652 2q31.1 rs1349734 0.010499 2q21.1
rs2161994 0.03612024 2q31.1 rs1480491 0.029385364 2q14.1 rs1816670 0.011885652 2q31.1 rs1374721 0.010499 2q21.2
rs724997 0.03612024 2q31.1 rs1586794 0.029385364 2q14.1 rs1829227 0.011885652 2q24.3 rs1564935 0.010499 2q21.2
rs1073901 0.038179956 2q24.1 rs1986494 0.029385364 2q14.1 rs1990842 0.011885652 2q31.1 rs1598279 0.010499 2q21.3
rs1113060 0.038179956 2q24.1 rs1986496 0.029385364 2q14.1 rs2016702 0.011885652 2q31.1 rs1867898 0.010499 2q21.2
rs1405735 0.038179956 2q24.1 rs1993998 0.029385364 2q14.1 rs2077765 0.011885652 2q24.3 rs1946798 0.010499 2q21.2
rs295826 0.038179956 2q24.1 rs967418 0.029385364 2q14.1 rs483109 0.011885652 2q24.3 rs2320399 0.010499 2q21.2
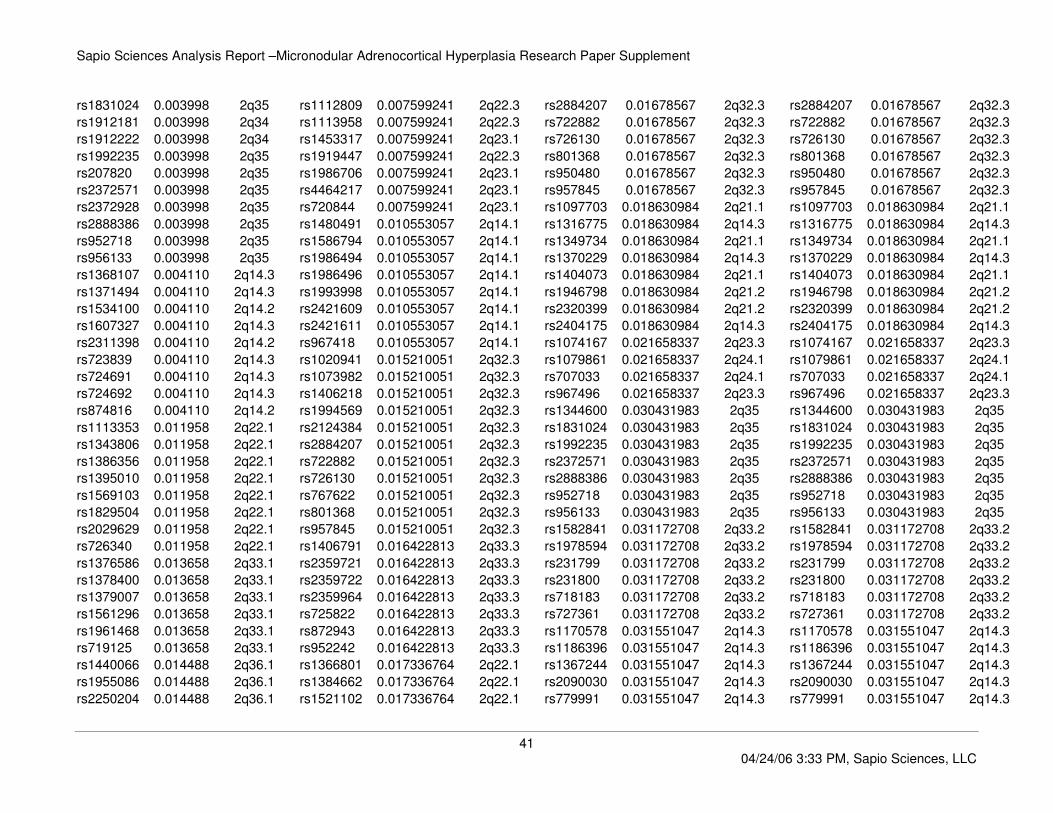
4.1.8.2 Results for Family CAR36
Family CAR36 Family CAR36 Family CAR36 Family CAR36
ID 1 ID 2 ID 3 ID 3AT
SNP pValue Cytoband SNP pValue Cytoband SNP pValue Cytoband SNP pValue Cytoband
rs1371178 0.000493 2q24.3 rs1343822 0.002012243 2q14.3 rs1368107 0.002489702 2q14.3 rs1368107 0.002489702 2q14.3
rs1376755 0.000493 2q24.2 rs1405090 0.002012243 2q14.3 rs1371494 0.002489702 2q14.3 rs1371494 0.002489702 2q14.3
rs1376757 0.000493 2q24.2 rs1589908 0.002012243 2q14.3 rs1607327 0.002489702 2q14.3 rs1607327 0.002489702 2q14.3
rs1485966 0.000493 2q24.2 rs1607327 0.002012243 2q14.3 rs167164 0.002489702 2q14.3 rs167164 0.002489702 2q14.3
rs1807921 0.000493 2q24.1 rs167164 0.002012243 2q14.3 rs2203772 0.002489702 2q14.3 rs2203772 0.002489702 2q14.3
rs1825644 0.000493 2q24.2 rs1980356 0.002012243 2q14.3 rs2311398 0.002489702 2q14.2 rs2311398 0.002489702 2q14.2
rs2013879 0.000493 2q24.2 rs2203772 0.002012243 2q14.3 rs294665 0.002489702 2q14.3 rs294665 0.002489702 2q14.3
rs2216847 0.000493 2q24.2 rs2419559 0.002012243 2q14.3 rs723839 0.002489702 2q14.3 rs723839 0.002489702 2q14.3
rs2222022 0.000493 2q24.2 rs294665 0.002012243 2q14.3 rs724691 0.002489702 2q14.3 rs724691 0.002489702 2q14.3
rs4129786 0.000493 2q24.2 rs951528 0.002012243 2q14.3 rs724692 0.002489702 2q14.3 rs724692 0.002489702 2q14.3
rs4129787 0.000493 2q24.2 rs1449514 0.002531588 2q36.2 rs951528 0.002489702 2q14.3 rs951528 0.002489702 2q14.3

Sapio Sciences Analysis Report –Micronodular Adrenocortical Hyperplasia Research Paper Supplement
40 04/24/06 3:33 PM, Sapio Sciences, LLC
rs717366 0.000493 2q24.3 rs1518308 0.002531588 2q36.3 rs1273788 0.003228004 2q36.3 rs1273788 0.003228004 2q36.3
rs963544 0.000493 2q24.2 rs1518309 0.002531588 2q36.3 rs1518308 0.003228004 2q36.3 rs1518308 0.003228004 2q36.3
rs997015 0.000493 2q24.2 rs1562010 0.002531588 2q36.3 rs1518309 0.003228004 2q36.3 rs1518309 0.003228004 2q36.3
rs1365779 0.001300 2q22.3 rs281541 0.002531588 2q36.2 rs1562010 0.003228004 2q36.3 rs1562010 0.003228004 2q36.3
rs1370521 0.001300 2q22.3 rs51071 0.002531588 2q36.2 rs2396297 0.003228004 2q36.3 rs2396297 0.003228004 2q36.3
rs1371048 0.001300 2q22.3 rs718850 0.002531588 2q36.3 rs281541 0.003228004 2q36.2 rs281541 0.003228004 2q36.2
rs1384662 0.001300 2q22.1 rs728654 0.002531588 2q36.2 rs51071 0.003228004 2q36.2 rs51071 0.003228004 2q36.2
rs1521102 0.001300 2q22.1 rs925865 0.002531588 2q36.3 rs718850 0.003228004 2q36.3 rs718850 0.003228004 2q36.3
rs2077724 0.001300 2q22.3 rs953945 0.002531588 2q36.2 rs728654 0.003228004 2q36.2 rs728654 0.003228004 2q36.2
rs2077917 0.001300 2q22.3 rs1366842 0.003432727 2q32.1 rs925865 0.003228004 2q36.3 rs925865 0.003228004 2q36.3
rs2217964 0.001300 2q22.1 rs1386515 0.003432727 2q32.1 rs1386515 0.006535384 2q32.1 rs1386515 0.006535384 2q32.1
rs222811 0.001300 2q22.3 rs1483232 0.003432727 2q32.1 rs1483232 0.006535384 2q32.1 rs1483232 0.006535384 2q32.1
rs952200 0.001300 2q22.3 rs1583765 0.003432727 2q32.1 rs1583765 0.006535384 2q32.1 rs1583765 0.006535384 2q32.1
rs1020941 0.001574 2q32.3 rs1861896 0.003432727 2q32.1 rs1861896 0.006535384 2q32.1 rs1861896 0.006535384 2q32.1
rs1073982 0.001574 2q32.3 rs2370672 0.003432727 2q32.1 rs2370672 0.006535384 2q32.1 rs2370672 0.006535384 2q32.1
rs1112629 0.001574 2q32.3 rs721568 0.003432727 2q32.1 rs721568 0.006535384 2q32.1 rs721568 0.006535384 2q32.1
rs1406218 0.001574 2q32.3 rs763330 0.003432727 2q32.1 rs726093 0.006535384 2q32.2 rs726093 0.006535384 2q32.2
rs1994569 0.001574 2q32.3 rs1074167 0.005356937 2q23.3 rs763330 0.006535384 2q32.1 rs763330 0.006535384 2q32.1
rs2124384 0.001574 2q32.3 rs1074750 0.005356937 2q23.3 rs2360966 0.012422765 2q33.3 rs2360966 0.012422765 2q33.3
rs2884207 0.001574 2q32.3 rs2002558 0.005356937 2q23.3 rs720632 0.012422765 2q33.3 rs720632 0.012422765 2q33.3
rs717621 0.001574 2q32.3 rs2345903 0.005356937 2q23.3 rs722760 0.012422765 2q33.3 rs722760 0.012422765 2q33.3
rs722882 0.001574 2q32.3 rs3887026 0.005356937 2q23.3 rs722761 0.012422765 2q33.3 rs722761 0.012422765 2q33.3
rs726130 0.001574 2q32.3 rs4528717 0.005356937 2q23.3 rs723349 0.012422765 2q33.3 rs723349 0.012422765 2q33.3
rs767622 0.001574 2q32.3 rs727326 0.005356937 2q23.3 rs991684 0.012422765 2q33.3 rs991684 0.012422765 2q33.3
rs801368 0.001574 2q32.3 rs727327 0.005356937 2q23.3 rs1074158 0.015506772 2q34 rs1074158 0.015506772 2q34
rs950480 0.001574 2q32.3 rs967496 0.005356937 2q23.3 rs1158709 0.015506772 2q34 rs1158709 0.015506772 2q34
rs957845 0.001574 2q32.3 rs1112806 0.0070806 2q12.3 rs1350462 0.015506772 2q34 rs1350462 0.015506772 2q34
rs1020088 0.001772 2q23.3 rs1524289 0.0070806 2q12.3 rs1583631 0.015506772 2q34 rs1583631 0.015506772 2q34
rs1384503 0.001772 2q23.2 rs1820558 0.0070806 2q12.3 rs2021215 0.015506772 2q34 rs2021215 0.015506772 2q34
rs1404683 0.001772 2q23.2 rs1820559 0.0070806 2q12.3 rs725379 0.015506772 2q34 rs725379 0.015506772 2q34
rs1453317 0.001772 2q23.1 rs187861 0.0070806 2q12.3 rs7426061 0.015506772 2q34 rs7426061 0.015506772 2q34
rs1986706 0.001772 2q23.1 rs2203581 0.0070806 2q12.3 rs966426 0.015506772 2q34 rs966426 0.015506772 2q34
rs4464217 0.001772 2q23.1 rs266175 0.0070806 2q12.3 rs1020941 0.01678567 2q32.3 rs1020941 0.01678567 2q32.3
rs720844 0.001772 2q23.1 rs266177 0.0070806 2q12.3 rs1073982 0.01678567 2q32.3 rs1073982 0.01678567 2q32.3
rs726253 0.001772 2q23.3 rs725999 0.0070806 2q12.3 rs1112629 0.01678567 2q32.3 rs1112629 0.01678567 2q32.3
rs1344600 0.003998 2q35 rs855034 0.0070806 2q12.3 rs1994569 0.01678567 2q32.3 rs1994569 0.01678567 2q32.3
Sapio Sciences Analysis Report –Micronodular Adrenocortical Hyperplasia Research Paper Supplement
41 04/24/06 3:33 PM, Sapio Sciences, LLC
rs1831024 0.003998 2q35 rs1112809 0.007599241 2q22.3 rs2884207 0.01678567 2q32.3 rs2884207 0.01678567 2q32.3
rs1912181 0.003998 2q34 rs1113958 0.007599241 2q22.3 rs722882 0.01678567 2q32.3 rs722882 0.01678567 2q32.3
rs1912222 0.003998 2q34 rs1453317 0.007599241 2q23.1 rs726130 0.01678567 2q32.3 rs726130 0.01678567 2q32.3
rs1992235 0.003998 2q35 rs1919447 0.007599241 2q22.3 rs801368 0.01678567 2q32.3 rs801368 0.01678567 2q32.3
rs207820 0.003998 2q35 rs1986706 0.007599241 2q23.1 rs950480 0.01678567 2q32.3 rs950480 0.01678567 2q32.3
rs2372571 0.003998 2q35 rs4464217 0.007599241 2q23.1 rs957845 0.01678567 2q32.3 rs957845 0.01678567 2q32.3
rs2372928 0.003998 2q35 rs720844 0.007599241 2q23.1 rs1097703 0.018630984 2q21.1 rs1097703 0.018630984 2q21.1
rs2888386 0.003998 2q35 rs1480491 0.010553057 2q14.1 rs1316775 0.018630984 2q14.3 rs1316775 0.018630984 2q14.3
rs952718 0.003998 2q35 rs1586794 0.010553057 2q14.1 rs1349734 0.018630984 2q21.1 rs1349734 0.018630984 2q21.1
rs956133 0.003998 2q35 rs1986494 0.010553057 2q14.1 rs1370229 0.018630984 2q14.3 rs1370229 0.018630984 2q14.3
rs1368107 0.004110 2q14.3 rs1986496 0.010553057 2q14.1 rs1404073 0.018630984 2q21.1 rs1404073 0.018630984 2q21.1
rs1371494 0.004110 2q14.3 rs1993998 0.010553057 2q14.1 rs1946798 0.018630984 2q21.2 rs1946798 0.018630984 2q21.2
rs1534100 0.004110 2q14.2 rs2421609 0.010553057 2q14.1 rs2320399 0.018630984 2q21.2 rs2320399 0.018630984 2q21.2
rs1607327 0.004110 2q14.3 rs2421611 0.010553057 2q14.1 rs2404175 0.018630984 2q14.3 rs2404175 0.018630984 2q14.3
rs2311398 0.004110 2q14.2 rs967418 0.010553057 2q14.1 rs1074167 0.021658337 2q23.3 rs1074167 0.021658337 2q23.3
rs723839 0.004110 2q14.3 rs1020941 0.015210051 2q32.3 rs1079861 0.021658337 2q24.1 rs1079861 0.021658337 2q24.1
rs724691 0.004110 2q14.3 rs1073982 0.015210051 2q32.3 rs707033 0.021658337 2q24.1 rs707033 0.021658337 2q24.1
rs724692 0.004110 2q14.3 rs1406218 0.015210051 2q32.3 rs967496 0.021658337 2q23.3 rs967496 0.021658337 2q23.3
rs874816 0.004110 2q14.2 rs1994569 0.015210051 2q32.3 rs1344600 0.030431983 2q35 rs1344600 0.030431983 2q35
rs1113353 0.011958 2q22.1 rs2124384 0.015210051 2q32.3 rs1831024 0.030431983 2q35 rs1831024 0.030431983 2q35
rs1343806 0.011958 2q22.1 rs2884207 0.015210051 2q32.3 rs1992235 0.030431983 2q35 rs1992235 0.030431983 2q35
rs1386356 0.011958 2q22.1 rs722882 0.015210051 2q32.3 rs2372571 0.030431983 2q35 rs2372571 0.030431983 2q35
rs1395010 0.011958 2q22.1 rs726130 0.015210051 2q32.3 rs2888386 0.030431983 2q35 rs2888386 0.030431983 2q35
rs1569103 0.011958 2q22.1 rs767622 0.015210051 2q32.3 rs952718 0.030431983 2q35 rs952718 0.030431983 2q35
rs1829504 0.011958 2q22.1 rs801368 0.015210051 2q32.3 rs956133 0.030431983 2q35 rs956133 0.030431983 2q35
rs2029629 0.011958 2q22.1 rs957845 0.015210051 2q32.3 rs1582841 0.031172708 2q33.2 rs1582841 0.031172708 2q33.2
rs726340 0.011958 2q22.1 rs1406791 0.016422813 2q33.3 rs1978594 0.031172708 2q33.2 rs1978594 0.031172708 2q33.2
rs1376586 0.013658 2q33.1 rs2359721 0.016422813 2q33.3 rs231799 0.031172708 2q33.2 rs231799 0.031172708 2q33.2
rs1378400 0.013658 2q33.1 rs2359722 0.016422813 2q33.3 rs231800 0.031172708 2q33.2 rs231800 0.031172708 2q33.2
rs1379007 0.013658 2q33.1 rs2359964 0.016422813 2q33.3 rs718183 0.031172708 2q33.2 rs718183 0.031172708 2q33.2
rs1561296 0.013658 2q33.1 rs725822 0.016422813 2q33.3 rs727361 0.031172708 2q33.2 rs727361 0.031172708 2q33.2
rs1961468 0.013658 2q33.1 rs872943 0.016422813 2q33.3 rs1170578 0.031551047 2q14.3 rs1170578 0.031551047 2q14.3
rs719125 0.013658 2q33.1 rs952242 0.016422813 2q33.3 rs1186396 0.031551047 2q14.3 rs1186396 0.031551047 2q14.3
rs1440066 0.014488 2q36.1 rs1366801 0.017336764 2q22.1 rs1367244 0.031551047 2q14.3 rs1367244 0.031551047 2q14.3
rs1955086 0.014488 2q36.1 rs1384662 0.017336764 2q22.1 rs2090030 0.031551047 2q14.3 rs2090030 0.031551047 2q14.3
rs2250204 0.014488 2q36.1 rs1521102 0.017336764 2q22.1 rs779991 0.031551047 2q14.3 rs779991 0.031551047 2q14.3
Sapio Sciences Analysis Report –Micronodular Adrenocortical Hyperplasia Research Paper Supplement
42 04/24/06 3:33 PM, Sapio Sciences, LLC
rs724149 0.014488 2q36.1 rs2217964 0.017336764 2q22.1 rs2002558 0.032723266 2q23.3 rs1356373 0.034600982 2q24.3
rs951997 0.014488 2q36.1 rs726340 0.017336764 2q22.1 rs2345903 0.032723266 2q23.3 rs1829227 0.034600982 2q24.3
rs1074158 0.017308 2q34 rs952200 0.017336764 2q22.3 rs3887026 0.032723266 2q23.3 rs1990842 0.034600982 2q31.1
rs1158709 0.017308 2q34 rs1368107 0.024536018 2q14.3 rs4528717 0.032723266 2q23.3 rs2029079 0.034600982 2q24.3
rs1350462 0.017308 2q34 rs723839 0.024536018 2q14.3 rs727326 0.032723266 2q23.3 rs2077765 0.034600982 2q24.3
rs2021215 0.017308 2q34 rs724691 0.024536018 2q14.3 rs1356373 0.034600982 2q24.3 rs483109 0.034600982 2q24.3
rs725379 0.017308 2q34 rs724692 0.024536018 2q14.3 rs1829227 0.034600982 2q24.3 rs726871 0.034600982 2q24.3
rs7426061 0.017308 2q34 rs1362489 0.028174496 2q31.1 rs1990842 0.034600982 2q31.1 rs950535 0.034600982 2q24.3
rs966285 0.017308 2q34 rs1362496 0.028174496 2q31.1 rs2029079 0.034600982 2q24.3 rs1196155 0.044292898 2q31.3
rs966426 0.017308 2q34 rs1399959 0.028174496 2q31.1 rs2077765 0.034600982 2q24.3 rs1196162 0.044292898 2q31.3
rs1074282 0.027830 2q14.1 rs1420384 0.028174496 2q31.1 rs483109 0.034600982 2q24.3 rs1400006 0.044292898 2q31.3
rs1516238 0.027830 2q14.1 rs1554157 0.028174496 2q31.1 rs726871 0.034600982 2q24.3 rs1400131 0.044292898 2q32.1
rs951431 0.027830 2q14.1 rs1554158 0.028174496 2q31.1 rs950535 0.034600982 2q24.3 rs1462535 0.044292898 2q32.1
rs959031 0.027830 2q14.1 rs724806 0.028174496 2q31.1 rs1196155 0.044292898 2q31.3 rs718448 0.044292898 2q32.1
rs1480491 0.029385 2q14.1 rs1835338 0.029380014 2q35 rs1196162 0.044292898 2q31.3 rs724851 0.044292898 2q32.1
rs1586794 0.029385 2q14.1 rs2244235 0.029380014 2q35 rs1400006 0.044292898 2q31.3 rs925806 0.044292898 2q32.1
4.1.8.3 Results for Family CAR14
Family CAR14 Family CAR14 Family CAR14
ID 2 ID 3 ID 3AT
SNP pValue Cytoband SNP pValue Cytoband SNP pValue Cytoband
rs1112961 0.000090 2q33.1 rs1485114 0.00274468 2q23.3 rs1485114 0.00274468 2q23.3
rs1376586 0.000090 2q33.1 rs2002558 0.00274468 2q23.3 rs2002558 0.00274468 2q23.3
rs1406121 0.000090 2q33.1 rs2340862 0.00274468 2q23.3 rs2340862 0.00274468 2q23.3
rs1561296 0.000090 2q33.1 rs2341068 0.00274468 2q23.3 rs2341068 0.00274468 2q23.3
rs1582841 0.000090 2q33.2 rs2341082 0.00274468 2q23.3 rs2341082 0.00274468 2q23.3
rs1961468 0.000090 2q33.1 rs2345638 0.00274468 2q23.3 rs2345638 0.00274468 2q23.3
rs1978594 0.000090 2q33.2 rs2345903 0.00274468 2q23.3 rs2345903 0.00274468 2q23.3
rs231799 0.000090 2q33.2 rs3887026 0.00274468 2q23.3 rs3887026 0.00274468 2q23.3
rs231800 0.000090 2q33.2 rs4528717 0.00274468 2q23.3 rs4528717 0.00274468 2q23.3
rs2349733 0.000090 2q33.1 rs727327 0.00274468 2q23.3 rs727327 0.00274468 2q23.3
rs718183 0.000090 2q33.2 rs989414 0.00274468 2q23.3 rs989414 0.00274468 2q23.3
rs719125 0.000090 2q33.1 rs1371664 0.003355094 2q33.1 rs1371664 0.003355094 2q33.1

Sapio Sciences Analysis Report –Micronodular Adrenocortical Hyperplasia Research Paper Supplement
43 04/24/06 3:33 PM, Sapio Sciences, LLC
rs727361 0.000090 2q33.2 rs1378400 0.003355094 2q33.1 rs1378400 0.003355094 2q33.1
rs733882 0.000090 2q33.1 rs1379020 0.003355094 2q33.1 rs1379020 0.003355094 2q33.1
rs1074282 0.000434 2q14.1 rs1401096 0.003355094 2q33.1 rs1401096 0.003355094 2q33.1
rs1480491 0.000434 2q14.1 rs1437872 0.003355094 2q33.1 rs1437872 0.003355094 2q33.1
rs1516238 0.000434 2q14.1 rs1440087 0.003355094 2q33.1 rs1440087 0.003355094 2q33.1
rs1586794 0.000434 2q14.1 rs1456572 0.003355094 2q33.1 rs1456572 0.003355094 2q33.1
rs1986494 0.000434 2q14.1 rs1902249 0.003355094 2q33.1 rs1902249 0.003355094 2q33.1
rs1986496 0.000434 2q14.1 rs2579411 0.003355094 2q33.1 rs2579411 0.003355094 2q33.1
rs1993998 0.000434 2q14.1 rs720401 0.003355094 2q33.1 rs720401 0.003355094 2q33.1
rs2421609 0.000434 2q14.1 rs745899 0.003355094 2q33.1 rs745899 0.003355094 2q33.1
rs2421611 0.000434 2q14.1 rs892514 0.003355094 2q33.1 rs892514 0.003355094 2q33.1
rs951431 0.000434 2q14.1 rs1344600 0.004991869 2q35 rs1344600 0.004991869 2q35
rs959031 0.000434 2q14.1 rs207820 0.004991869 2q35 rs207820 0.004991869 2q35
rs967418 0.000434 2q14.1 rs2244235 0.004991869 2q35 rs2244235 0.004991869 2q35
rs1524289 0.005306 2q12.3 rs2372928 0.004991869 2q35 rs2372928 0.004991869 2q35
rs1820559 0.005306 2q12.3 rs2888386 0.004991869 2q35 rs2888386 0.004991869 2q35
rs187861 0.005306 2q12.3 rs718685 0.004991869 2q35 rs718685 0.004991869 2q35
rs2203581 0.005306 2q12.3 rs718686 0.004991869 2q35 rs718686 0.004991869 2q35
rs266175 0.005306 2q12.3 rs966423 0.004991869 2q35 rs966423 0.004991869 2q35
rs266177 0.005306 2q12.3 rs1362489 0.007141047 2q31.1 rs1362489 0.007141047 2q31.1
rs721656 0.005306 2q12.2 rs1362496 0.007141047 2q31.1 rs1362496 0.007141047 2q31.1
rs725999 0.005306 2q12.3 rs1399959 0.007141047 2q31.1 rs1399959 0.007141047 2q31.1
rs1430246 0.006948 2q36.1 rs1420384 0.007141047 2q31.1 rs1420384 0.007141047 2q31.1
rs1955086 0.006948 2q36.1 rs1554157 0.007141047 2q31.1 rs1554157 0.007141047 2q31.1
rs2009199 0.006948 2q36.1 rs1554158 0.007141047 2q31.1 rs1554158 0.007141047 2q31.1
rs2250204 0.006948 2q36.1 rs1816670 0.007141047 2q31.1 rs1816670 0.007141047 2q31.1
rs719445 0.006948 2q36.1 rs1865236 0.007141047 2q31.1 rs1865236 0.007141047 2q31.1
rs724149 0.006948 2q36.1 rs2016702 0.007141047 2q31.1 rs2016702 0.007141047 2q31.1
rs951997 0.006948 2q36.1 rs2161994 0.007141047 2q31.1 rs2161994 0.007141047 2q31.1
rs1365779 0.009532 2q22.3 rs724806 0.007141047 2q31.1 rs724806 0.007141047 2q31.1
rs1384662 0.009532 2q22.1 rs724997 0.007141047 2q31.1 rs724997 0.007141047 2q31.1
rs1521102 0.009532 2q22.1 rs1368884 0.009406753 2q36.2 rs1368884 0.009406753 2q36.2
rs2077724 0.009532 2q22.3 rs1371552 0.009406753 2q36.1 rs1371552 0.009406753 2q36.1
rs2217964 0.009532 2q22.1 rs1440066 0.009406753 2q36.1 rs1440066 0.009406753 2q36.1
rs952200 0.009532 2q22.3 rs1921634 0.009406753 2q36.1 rs1921634 0.009406753 2q36.1
rs1485114 0.012496 2q23.3 rs1921635 0.009406753 2q36.1 rs1921635 0.009406753 2q36.1
Sapio Sciences Analysis Report –Micronodular Adrenocortical Hyperplasia Research Paper Supplement
44 04/24/06 3:33 PM, Sapio Sciences, LLC
rs2002558 0.012496 2q23.3 rs2216460 0.009406753 2q36.2 rs2216460 0.009406753 2q36.2
rs2341068 0.012496 2q23.3 rs717610 0.009406753 2q36.1 rs717610 0.009406753 2q36.1
rs2341082 0.012496 2q23.3 rs721357 0.009406753 2q36.1 rs721357 0.009406753 2q36.1
rs2345638 0.012496 2q23.3 rs721358 0.009406753 2q36.1 rs721358 0.009406753 2q36.1
rs2345903 0.012496 2q23.3 rs958380 0.009406753 2q36.1 rs958380 0.009406753 2q36.1
rs3887026 0.012496 2q23.3 rs959100 0.009406753 2q36.1 rs959100 0.009406753 2q36.1
rs4528717 0.012496 2q23.3 rs966414 0.009406753 2q36.1 rs966414 0.009406753 2q36.1
rs989414 0.012496 2q23.3 rs2045057 0.013422623 2q11.2 rs2045057 0.013422623 2q11.2
rs1352080 0.017057 2q24.1 rs718159 0.013422623 2q11.2 rs718159 0.013422623 2q11.2
rs1385903 0.017057 2q24.1 rs953320 0.013422623 2q11.2 rs953320 0.013422623 2q11.2
rs1527757 0.017057 2q24.1 rs1375002 0.013461487 2q12.3 rs1375002 0.013461487 2q12.3
rs1586040 0.017057 2q24.1 rs1524289 0.013461487 2q12.3 rs1524289 0.013461487 2q12.3
rs1586249 0.017057 2q24.1 rs721656 0.013461487 2q12.2 rs721656 0.013461487 2q12.2
rs707077 0.017057 2q24.1 rs722475 0.013461487 2q12.1 rs722475 0.013461487 2q12.1
rs725585 0.017057 2q24.1 rs725999 0.013461487 2q12.3 rs725999 0.013461487 2q12.3
rs1982505 0.017842 2q32.1 rs1355417 0.01346924 2q24.3 rs1355417 0.01346924 2q24.3
rs719736 0.017842 2q32.1 rs1356373 0.01346924 2q24.3 rs1356373 0.01346924 2q24.3
rs722385 0.017842 2q32.1 rs1448836 0.01346924 2q24.3 rs1448836 0.01346924 2q24.3
rs1485966 0.032346 2q24.2 rs1479586 0.01346924 2q24.3 rs1479586 0.01346924 2q24.3
rs1825644 0.032346 2q24.2 rs1829227 0.01346924 2q24.3 rs1829227 0.01346924 2q24.3
rs2013879 0.032346 2q24.2 rs2029079 0.01346924 2q24.3 rs2029079 0.01346924 2q24.3
rs2222022 0.032346 2q24.2 rs2077765 0.01346924 2q24.3 rs2077765 0.01346924 2q24.3
rs963544 0.032346 2q24.2 rs2390485 0.01346924 2q24.3 rs2390485 0.01346924 2q24.3
rs1113281 0.042423 2q33.1 rs726871 0.01346924 2q24.3 rs726871 0.01346924 2q24.3
rs1401096 0.042423 2q33.1 rs950535 0.01346924 2q24.3 rs950535 0.01346924 2q24.3
rs1437872 0.042423 2q33.1 rs1113060 0.015494606 2q24.1 rs155594 0.024612436 2q24.1
rs1902249 0.042423 2q33.1 rs1352080 0.015494606 2q24.1 rs1807921 0.024612436 2q24.1
rs2256931 0.042423 2q33.1 rs1385903 0.015494606 2q24.1 rs1947892 0.024612436 2q24.1
rs2579411 0.042423 2q33.1 rs1527757 0.015494606 2q24.1 rs198688 0.024612436 2q24.1
rs1113353 0.043039 2q22.1 rs1586040 0.015494606 2q24.1 rs2108217 0.024612436 2q24.1
rs1386356 0.043039 2q22.1 rs707077 0.015494606 2q24.1 rs263318 0.024612436 2q24.1
rs1569103 0.043039 2q22.1 rs951212 0.015494606 2q24.1 rs4129786 0.024612436 2q24.2
rs2029629 0.043039 2q22.1 rs155594 0.024612436 2q24.1 rs719931 0.024612436 2q24.1
rs726340 0.043039 2q22.1 rs1807921 0.024612436 2q24.1 rs1480491 0.033303413 2q14.1
rs1449514 0.046576 2q36.2 rs1947892 0.024612436 2q24.1 rs1586794 0.033303413 2q14.1
rs281541 0.046576 2q36.2 rs198688 0.024612436 2q24.1 rs1986494 0.033303413 2q14.1
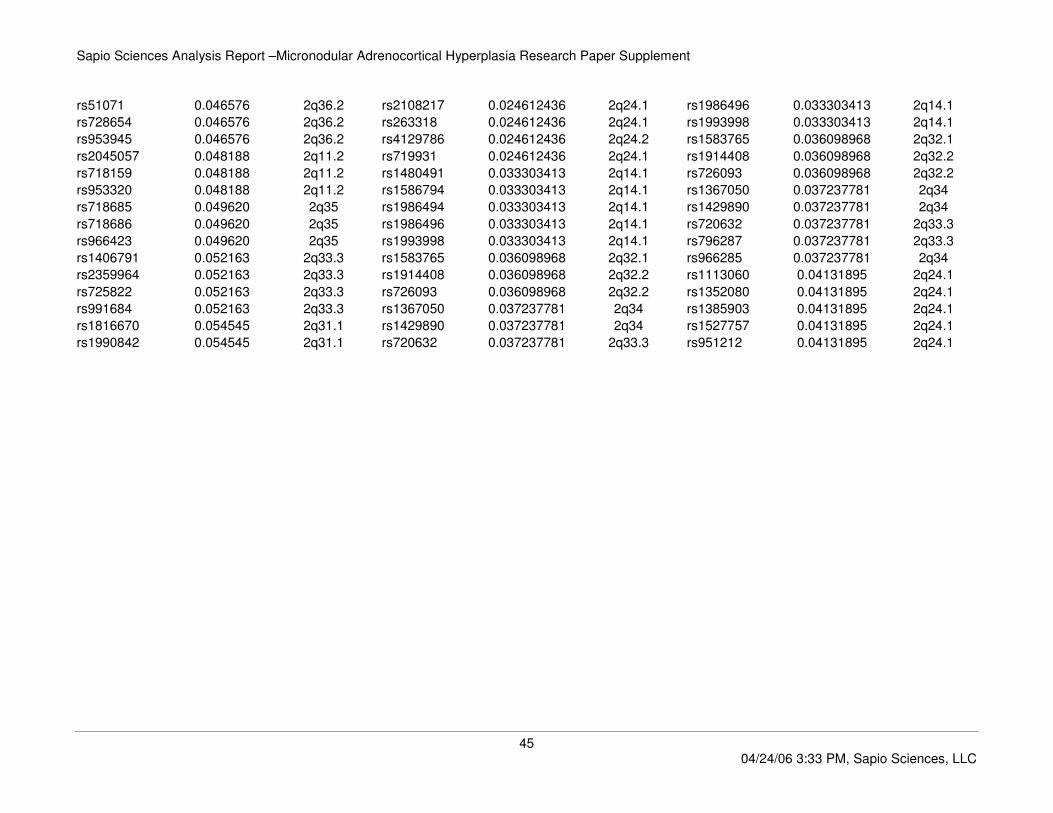
Sapio Sciences Analysis Report –Micronodular Adrenocortical Hyperplasia Research Paper Supplement
45 04/24/06 3:33 PM, Sapio Sciences, LLC
rs51071 0.046576 2q36.2 rs2108217 0.024612436 2q24.1 rs1986496 0.033303413 2q14.1
rs728654 0.046576 2q36.2 rs263318 0.024612436 2q24.1 rs1993998 0.033303413 2q14.1
rs953945 0.046576 2q36.2 rs4129786 0.024612436 2q24.2 rs1583765 0.036098968 2q32.1
rs2045057 0.048188 2q11.2 rs719931 0.024612436 2q24.1 rs1914408 0.036098968 2q32.2
rs718159 0.048188 2q11.2 rs1480491 0.033303413 2q14.1 rs726093 0.036098968 2q32.2
rs953320 0.048188 2q11.2 rs1586794 0.033303413 2q14.1 rs1367050 0.037237781 2q34
rs718685 0.049620 2q35 rs1986494 0.033303413 2q14.1 rs1429890 0.037237781 2q34
rs718686 0.049620 2q35 rs1986496 0.033303413 2q14.1 rs720632 0.037237781 2q33.3
rs966423 0.049620 2q35 rs1993998 0.033303413 2q14.1 rs796287 0.037237781 2q33.3
rs1406791 0.052163 2q33.3 rs1583765 0.036098968 2q32.1 rs966285 0.037237781 2q34
rs2359964 0.052163 2q33.3 rs1914408 0.036098968 2q32.2 rs1113060 0.04131895 2q24.1
rs725822 0.052163 2q33.3 rs726093 0.036098968 2q32.2 rs1352080 0.04131895 2q24.1
rs991684 0.052163 2q33.3 rs1367050 0.037237781 2q34 rs1385903 0.04131895 2q24.1
rs1816670 0.054545 2q31.1 rs1429890 0.037237781 2q34 rs1527757 0.04131895 2q24.1
rs1990842 0.054545 2q31.1 rs720632 0.037237781 2q33.3 rs951212 0.04131895 2q24.1
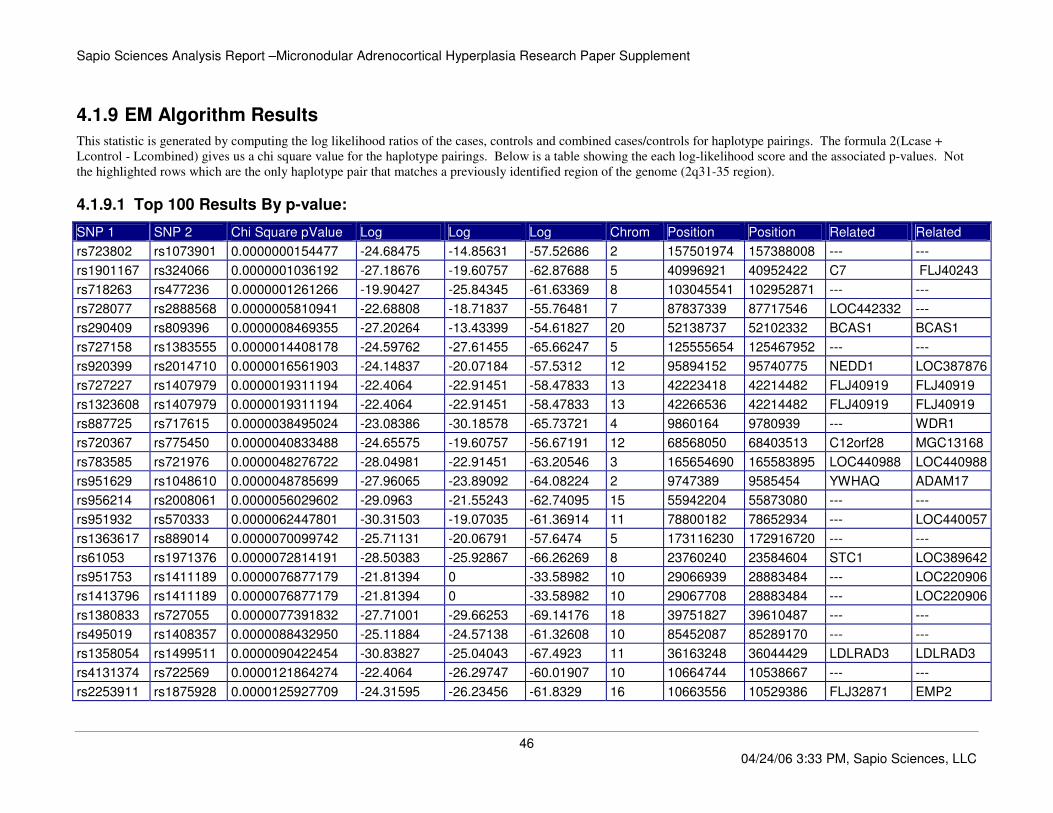
Sapio Sciences Analysis Report –Micronodular Adrenocortical Hyperplasia Research Paper Supplement
46 04/24/06 3:33 PM, Sapio Sciences, LLC
4.1.9 EM Algorithm Results
This statistic is generated by computing the log likelihood ratios of the cases, controls and combined cases/controls for haplotype pairings. The formula 2(Lcase +
Lcontrol - Lcombined) gives us a chi square value for the haplotype pairings. Below is a table showing the each log-likelihood score and the associated p-values. Not
the highlighted rows which are the only haplotype pair that matches a previously identified region of the genome (2q31-35 region).
4.1.9.1 Top 100 Results By p-value:
SNP 1 SNP 2 Chi Square pValue Log Likelihood
Log Likelihood
Log Likelihood
Chrom Position (SNP 1)
Position (SNP 2)
Related Genes (SNP
Related Genes rs723802 rs1073901 0.0000000154477 -24.68475 -14.85631 -57.52686 2 157501974 157388008 --- ---
rs1901167 rs324066 0.0000001036192 -27.18676 -19.60757 -62.87688 5 40996921 40952422 C7 FLJ40243
rs718263 rs477236 0.0000001261266 -19.90427 -25.84345 -61.63369 8 103045541 102952871 --- ---
rs728077 rs2888568 0.0000005810941 -22.68808 -18.71837 -55.76481 7 87837339 87717546 LOC442332 ---
rs290409 rs809396 0.0000008469355 -27.20264 -13.43399 -54.61827 20 52138737 52102332 BCAS1 BCAS1
rs727158 rs1383555 0.0000014408178 -24.59762 -27.61455 -65.66247 5 125555654 125467952 --- ---
rs920399 rs2014710 0.0000016561903 -24.14837 -20.07184 -57.5312 12 95894152 95740775 NEDD1 LOC387876
rs727227 rs1407979 0.0000019311194 -22.4064 -22.91451 -58.47833 13 42223418 42214482 FLJ40919 FLJ40919
rs1323608 rs1407979 0.0000019311194 -22.4064 -22.91451 -58.47833 13 42266536 42214482 FLJ40919 FLJ40919
rs887725 rs717615 0.0000038495024 -23.08386 -30.18578 -65.73721 4 9860164 9780939 --- WDR1
rs720367 rs775450 0.0000040833488 -24.65575 -19.60757 -56.67191 12 68568050 68403513 C12orf28 MGC13168
rs783585 rs721976 0.0000048276722 -28.04981 -22.91451 -63.20546 3 165654690 165583895 LOC440988 LOC440988
rs951629 rs1048610 0.0000048785699 -27.96065 -23.89092 -64.08224 2 9747389 9585454 YWHAQ ADAM17
rs956214 rs2008061 0.0000056029602 -29.0963 -21.55243 -62.74095 15 55942204 55873080 --- ---
rs951932 rs570333 0.0000062447801 -30.31503 -19.07035 -61.36914 11 78800182 78652934 --- LOC440057
rs1363617 rs889014 0.0000070099742 -25.71131 -20.06791 -57.6474 5 173116230 172916720 --- ---
rs61053 rs1971376 0.0000072814191 -28.50383 -25.92867 -66.26269 8 23760240 23584604 STC1 LOC389642
rs951753 rs1411189 0.0000076877179 -21.81394 0 -33.58982 10 29066939 28883484 --- LOC220906
rs1413796 rs1411189 0.0000076877179 -21.81394 0 -33.58982 10 29067708 28883484 --- LOC220906
rs1380833 rs727055 0.0000077391832 -27.71001 -29.66253 -69.14176 18 39751827 39610487 --- ---
rs495019 rs1408357 0.0000088432950 -25.11884 -24.57138 -61.32608 10 85452087 85289170 --- ---
rs1358054 rs1499511 0.0000090422454 -30.83827 -25.04043 -67.4923 11 36163248 36044429 LDLRAD3 LDLRAD3
rs4131374 rs722569 0.0000121864274 -22.4064 -26.29747 -60.01907 10 10664744 10538667 --- ---
rs2253911 rs1875928 0.0000125927709 -24.31595 -26.23456 -61.8329 16 10663556 10529386 FLJ32871 EMP2
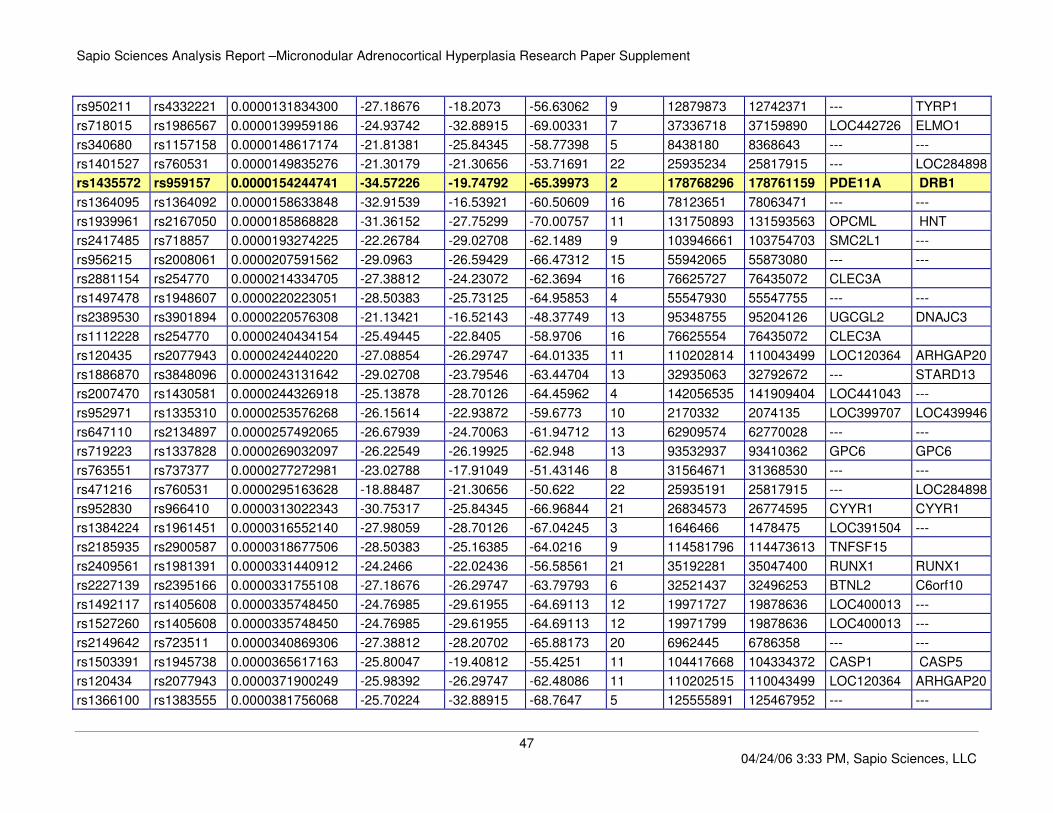
Sapio Sciences Analysis Report –Micronodular Adrenocortical Hyperplasia Research Paper Supplement
47 04/24/06 3:33 PM, Sapio Sciences, LLC
rs950211 rs4332221 0.0000131834300 -27.18676 -18.2073 -56.63062 9 12879873 12742371 --- TYRP1
rs718015 rs1986567 0.0000139959186 -24.93742 -32.88915 -69.00331 7 37336718 37159890 LOC442726 ELMO1
rs340680 rs1157158 0.0000148617174 -21.81381 -25.84345 -58.77398 5 8438180 8368643 --- ---
rs1401527 rs760531 0.0000149835276 -21.30179 -21.30656 -53.71691 22 25935234 25817915 --- LOC284898
rs1435572 rs959157 0.0000154244741 -34.57226 -19.74792 -65.39973 2 178768296 178761159 PDE11A DRB1
rs1364095 rs1364092 0.0000158633848 -32.91539 -16.53921 -60.50609 16 78123651 78063471 --- ---
rs1939961 rs2167050 0.0000185868828 -31.36152 -27.75299 -70.00757 11 131750893 131593563 OPCML HNT
rs2417485 rs718857 0.0000193274225 -22.26784 -29.02708 -62.1489 9 103946661 103754703 SMC2L1 ---
rs956215 rs2008061 0.0000207591562 -29.0963 -26.59429 -66.47312 15 55942065 55873080 --- ---
rs2881154 rs254770 0.0000214334705 -27.38812 -24.23072 -62.3694 16 76625727 76435072 CLEC3A LOC342419 rs1497478 rs1948607 0.0000220223051 -28.50383 -25.73125 -64.95853 4 55547930 55547755 --- ---
rs2389530 rs3901894 0.0000220576308 -21.13421 -16.52143 -48.37749 13 95348755 95204126 UGCGL2 DNAJC3
rs1112228 rs254770 0.0000240434154 -25.49445 -22.8405 -58.9706 16 76625554 76435072 CLEC3A LOC342419 rs120435 rs2077943 0.0000242440220 -27.08854 -26.29747 -64.01335 11 110202814 110043499 LOC120364 ARHGAP20
rs1886870 rs3848096 0.0000243131642 -29.02708 -23.79546 -63.44704 13 32935063 32792672 --- STARD13
rs2007470 rs1430581 0.0000244326918 -25.13878 -28.70126 -64.45962 4 142056535 141909404 LOC441043 ---
rs952971 rs1335310 0.0000253576268 -26.15614 -22.93872 -59.6773 10 2170332 2074135 LOC399707 LOC439946
rs647110 rs2134897 0.0000257492065 -26.67939 -24.70063 -61.94712 13 62909574 62770028 --- ---
rs719223 rs1337828 0.0000269032097 -26.22549 -26.19925 -62.948 13 93532937 93410362 GPC6 GPC6
rs763551 rs737377 0.0000277272981 -23.02788 -17.91049 -51.43146 8 31564671 31368530 --- ---
rs471216 rs760531 0.0000295163628 -18.88487 -21.30656 -50.622 22 25935191 25817915 --- LOC284898
rs952830 rs966410 0.0000313022343 -30.75317 -25.84345 -66.96844 21 26834573 26774595 CYYR1 CYYR1
rs1384224 rs1961451 0.0000316552140 -27.98059 -28.70126 -67.04245 3 1646466 1478475 LOC391504 ---
rs2185935 rs2900587 0.0000318677506 -28.50383 -25.16385 -64.0216 9 114581796 114473613 TNFSF15 LOC389786 rs2409561 rs1981391 0.0000331440912 -24.2466 -22.02436 -56.58561 21 35192281 35047400 RUNX1 RUNX1
rs2227139 rs2395166 0.0000331755108 -27.18676 -26.29747 -63.79793 6 32521437 32496253 BTNL2 C6orf10
rs1492117 rs1405608 0.0000335748450 -24.76985 -29.61955 -64.69113 12 19971727 19878636 LOC400013 ---
rs1527260 rs1405608 0.0000335748450 -24.76985 -29.61955 -64.69113 12 19971799 19878636 LOC400013 ---
rs2149642 rs723511 0.0000340869306 -27.38812 -28.20702 -65.88173 20 6962445 6786358 --- ---
rs1503391 rs1945738 0.0000365617163 -25.80047 -19.40812 -55.4251 11 104417668 104334372 CASP1 CASP5
rs120434 rs2077943 0.0000371900249 -25.98392 -26.29747 -62.48086 11 110202515 110043499 LOC120364 ARHGAP20
rs1366100 rs1383555 0.0000381756068 -25.70224 -32.88915 -68.7647 5 125555891 125467952 --- ---

Sapio Sciences Analysis Report –Micronodular Adrenocortical Hyperplasia Research Paper Supplement
48 04/24/06 3:33 PM, Sapio Sciences, LLC
rs1971376 rs732563 0.0000398555651 -28.50383 -30.70903 -69.34311 8 23584604 23401471 LOC389642 ENTPD4
rs886390 rs718254 0.0000404288144 -15.18002 -20.43671 -45.7327 6 30442973 30267018 TRIM39 RPP21
rs4300310 rs220346 0.0000404555896 -32.66272 -20.68307 -63.4611 10 24830399 24670266 --- ---
rs2328410 rs2328384 0.0000404686871 -26.25449 -20.95089 -57.32036 20 19494958 19368901 SLC24A3 SLC24A3
rs2328411 rs2328384 0.0000404686871 -26.25449 -20.95089 -57.32036 20 19495213 19368901 SLC24A3 SLC24A3
rs1929715 rs727435 0.0000405458294 -27.98059 -17.24401 -55.33767 9 80950472 80809022 --- ---
rs952840 rs2115152 0.0000415270763 -27.52656 -22.42228 -60.03801 5 86135661 86002809 --- ---
rs2371356 rs2014710 0.0000427121540 -27.95158 -23.9339 -61.94651 12 95907440 95740775 --- LOC387876
rs2347086 rs1079634 0.0000430046037 -29.45198 -19.54859 -59.05477 16 77649949 77468635 WWOX WWOX
rs2365778 rs2365842 0.0000435214865 -25.04043 -22.77521 -57.85789 2 31649870 31499939 SRD5A2 XDH
rs448182 rs1371810 0.0000467758548 -31.00585 -23.94691 -64.9229 5 34699672 34539109 RAI14 LOC401180 rs702175 rs1576748 0.0000473932267 -22.76208 -20.49686 -53.21597 9 1599249 1493356 --- ---
rs955744 rs1944932 0.0000474074074 -31.34564 -26.59429 -67.89667 11 110879544 110807220 BTG4 LAYN
rs720484 rs951848 0.0000478454245 -31.00585 -22.09561 -63.04899 4 145819969 145682952 LOC391703 LOC391703
rs952122 rs718894 0.0000491495792 -32.39214 -23.42666 -65.73944 3 154891360 154772091 --- ---
rs1280100 rs1376534 0.0000492068888 -27.18676 -23.72348 -60.82972 4 187913282 187766010 FAT LOC285441
rs1398065 rs952768 0.0000522394863 -31.00585 -27.75299 -68.61851 3 68683178 68517293 FAM19A1 FAM19A1
rs733882 rs2349733 0.0000553657488 -26.56529 -26.19925 -62.56609 2 202582575 202448571 ALS2CR7 ALS2
rs2421826 rs952489 0.0000604058564 -21.89903 -22.31094 -53.9244 11 35187181 34988152 CD44 SLC1A2
rs469190 rs717804 0.0000609640707 -27.38812 -26.79172 -63.88506 21 39163152 39028564 ETS2 ---
rs759394 rs763874 0.0000620197651 -29.36688 -22.4064 -61.46134 12 94961810 94922681 LTA4H HAL
rs944838 rs719223 0.0000620654672 -25.80047 -23.42666 -58.91445 13 93678220 93532937 GPC6 GPC6
rs717176 rs727488 0.0000638919763 -29.95935 -22.93242 -62.55008 4 15671583 15572610 PROM1 KSP37
rs951265 rs1482049 0.0000692955302 -24.68475 -24.70063 -58.96251 15 59077153 59011402 RORA LOC440283 rs3847924 rs1074716 0.0000693751684 -25.63289 -31.47385 -66.68272 12 16314554 16146769 --- ---
rs595413 rs1408457 0.0000708132437 -25.09377 -22.32118 -56.97041 6 4014165 3975912 PRPF4B PECI
rs718007 rs951101 0.0000720767598 -26.07104 -22.97263 -58.58146 3 105825933 105766125 --- ---
rs723967 rs2017566 0.0000720767598 -32.39214 -27.16052 -69.09044 15 56483592 56292332 LIPC AQP9
rs961797 rs1661294 0.0000720767598 -31.79967 -28.20702 -69.54447 9 116596498 116515445 ASTN2 TRIM32
rs2243869 rs319088 0.0000741978888 -29.0963 -27.16052 -65.7656 6 108027221 107846733 FLJ10159 C6orf210
rs6539866 rs1452227 0.0000763901803 -22.32118 -15.37947 -47.18031 12 83740879 83715627 SLC6A15 SLC6A15
rs1590405 rs2224860 0.0000764476284 -20.88154 -17.93673 -48.29717 9 13691927 13540069 --- FLJ44082
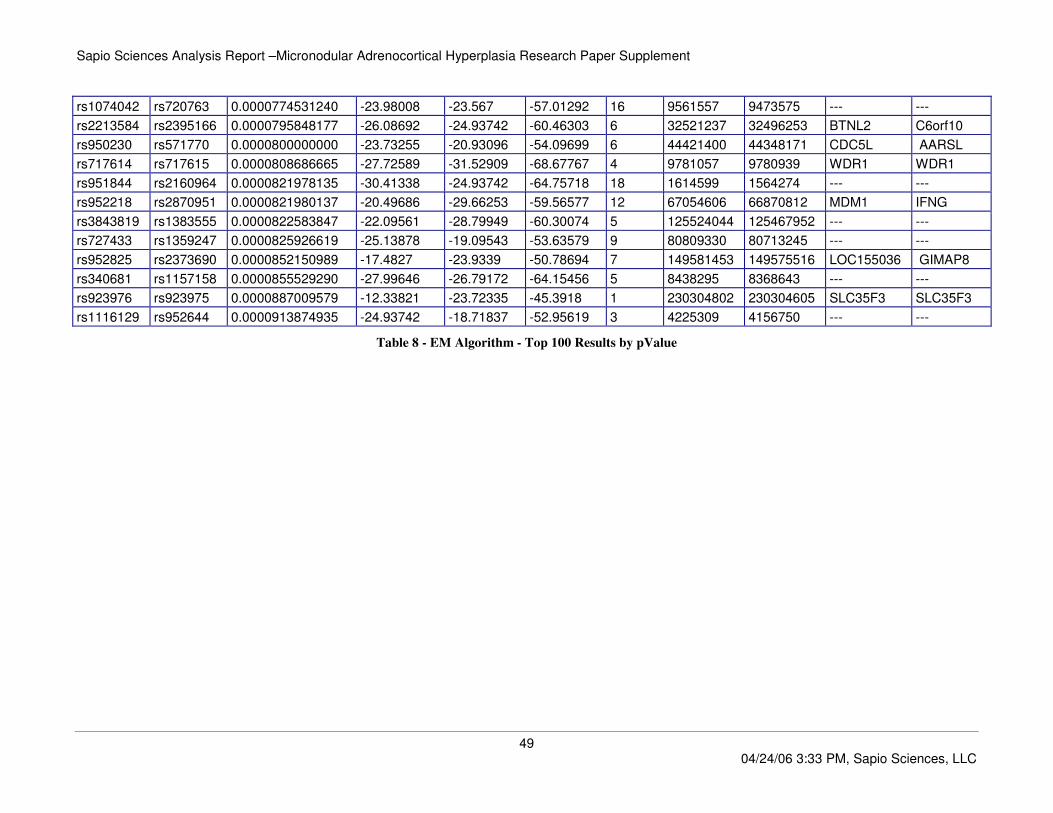
Sapio Sciences Analysis Report –Micronodular Adrenocortical Hyperplasia Research Paper Supplement
49 04/24/06 3:33 PM, Sapio Sciences, LLC
rs1074042 rs720763 0.0000774531240 -23.98008 -23.567 -57.01292 16 9561557 9473575 --- ---
rs2213584 rs2395166 0.0000795848177 -26.08692 -24.93742 -60.46303 6 32521237 32496253 BTNL2 C6orf10
rs950230 rs571770 0.0000800000000 -23.73255 -20.93096 -54.09699 6 44421400 44348171 CDC5L AARSL
rs717614 rs717615 0.0000808686665 -27.72589 -31.52909 -68.67767 4 9781057 9780939 WDR1 WDR1
rs951844 rs2160964 0.0000821978135 -30.41338 -24.93742 -64.75718 18 1614599 1564274 --- ---
rs952218 rs2870951 0.0000821980137 -20.49686 -29.66253 -59.56577 12 67054606 66870812 MDM1 IFNG
rs3843819 rs1383555 0.0000822583847 -22.09561 -28.79949 -60.30074 5 125524044 125467952 --- ---
rs727433 rs1359247 0.0000825926619 -25.13878 -19.09543 -53.63579 9 80809330 80713245 --- ---
rs952825 rs2373690 0.0000852150989 -17.4827 -23.9339 -50.78694 7 149581453 149575516 LOC155036 GIMAP8
rs340681 rs1157158 0.0000855529290 -27.99646 -26.79172 -64.15456 5 8438295 8368643 --- ---
rs923976 rs923975 0.0000887009579 -12.33821 -23.72335 -45.3918 1 230304802 230304605 SLC35F3 SLC35F3
rs1116129 rs952644 0.0000913874935 -24.93742 -18.71837 -52.95619 3 4225309 4156750 --- ---
Table 8 - EM Algorithm - Top 100 Results by pValue
Sapio Sciences Analysis Report –Micronodular Adrenocortical Hyperplasia Research Paper Supplement
50 04/24/06 3:33 PM, Sapio Sciences, LLC
5 Discussion We note the multiple occurrence of SNP’s from 2q35 region by the GA. Further, one model contained only two SNP’s from chromosome 2 and was able to classify almost the entire dataset, RS2085808 and RS1404090, both as heterozygous genotypes. Be aware that when a model says that a SNP has a certain genotype like AB, it is implied that it is saying that the person does NOT have AA or BB. So in the case of this 2 SNP model, it may be indicated that for the related genes that 2 copies are required to avoid the phenotype.
Stratakis suspected the 2p region in prior studies as a possible region of interest for MAH. In our results 2p12 showed as being significant. There was congruence between several statistically significant SNP’s and SNP’s the GA identified, which is not surprising in the case where statistics were used as a feature selection method.
The CA module was utilized to detect possible chromosomal deletions/additions. With a cutoff of p<.005, ~200 SNP’s remained. We selected the top 100 from the list for review. Notable are common regions of significance with the statistical and machine learning approaches, further confirming these regions as candidates for detailed investigation.
In order to provide a comprehensive list, we combined the results of all the statistics and genetic algorithm analysis, removed duplicates and also removed one of any SNP pair that were neighboring SNP’s that were in high LD. The next page provides the resultant list. Although this list covers many chromosomes, we pointed the researchers specifically to several regions, including the 2q3# (SNP’s in this region are highlighted by green shading) region due to its significance under multiple tests. We also noted 2p12 and 15q25#(SNP’s in this region are highlighted by blue shading) due to their frequent occurrence in several evaluations. Notably, LOH analysis also identified SNP’s in the 2q3# region as well as the 15q25# region, but not the 2p# region.
As noted above, the haplotype based analyses was completed after the PDE11A discovery. We note that the 2q3# regions are the only regions that were implicated in all analysis, including the haplotype analysis. We also note that the haplotype analysis directly identified the PDE11A gene. The haplotype analysis was not part of the results returned to the researchers from which they discovered the PDE11A’s involvement.
Given that the source data for this study was family based triads with 2 unaffected parents, it lends itself to the Transmission Distortion Test and Haplotype-based Relative Risk, which are powerful methods for association based analysis. Currently these methods are not in the Exemplar product, but will be added in the near future for studies of this nature.
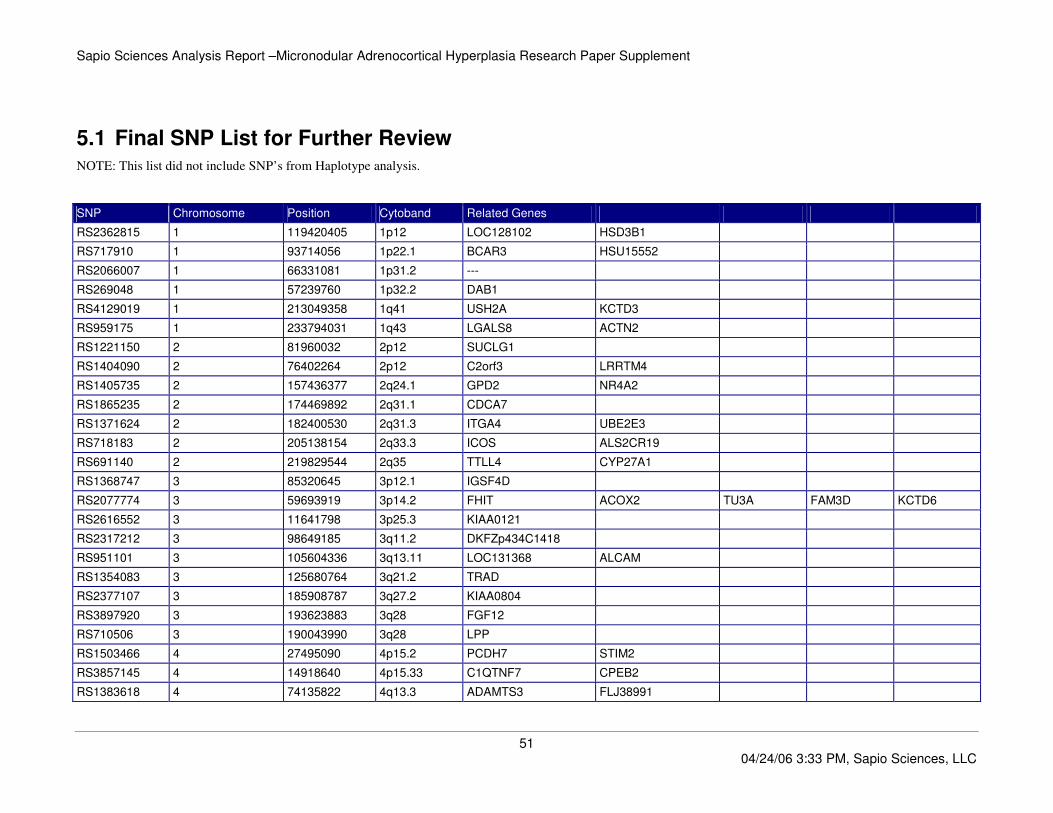
Sapio Sciences Analysis Report –Micronodular Adrenocortical Hyperplasia Research Paper Supplement
51 04/24/06 3:33 PM, Sapio Sciences, LLC
5.1 Final SNP List for Further Review NOTE: This list did not include SNP’s from Haplotype analysis.
SNP Chromosome Position Cytoband Related Genes
RS2362815 1 119420405 1p12 LOC128102 HSD3B1
RS717910 1 93714056 1p22.1 BCAR3 HSU15552
RS2066007 1 66331081 1p31.2 ---
RS269048 1 57239760 1p32.2 DAB1
RS4129019 1 213049358 1q41 USH2A KCTD3
RS959175 1 233794031 1q43 LGALS8 ACTN2
RS1221150 2 81960032 2p12 SUCLG1
RS1404090 2 76402264 2p12 C2orf3 LRRTM4
RS1405735 2 157436377 2q24.1 GPD2 NR4A2
RS1865235 2 174469892 2q31.1 CDCA7
RS1371624 2 182400530 2q31.3 ITGA4 UBE2E3
RS718183 2 205138154 2q33.3 ICOS ALS2CR19
RS691140 2 219829544 2q35 TTLL4 CYP27A1
RS1368747 3 85320645 3p12.1 IGSF4D
RS2077774 3 59693919 3p14.2 FHIT ACOX2 TU3A FAM3D KCTD6
RS2616552 3 11641798 3p25.3 KIAA0121
RS2317212 3 98649185 3q11.2 DKFZp434C1418
RS951101 3 105604336 3q13.11 LOC131368 ALCAM
RS1354083 3 125680764 3q21.2 TRAD
RS2377107 3 185908787 3q27.2 KIAA0804
RS3897920 3 193623883 3q28 FGF12
RS710506 3 190043990 3q28 LPP
RS1503466 4 27495090 4p15.2 PCDH7 STIM2
RS3857145 4 14918640 4p15.33 C1QTNF7 CPEB2
RS1383618 4 74135822 4q13.3 ADAMTS3 FLJ38991

Sapio Sciences Analysis Report –Micronodular Adrenocortical Hyperplasia Research Paper Supplement
52 04/24/06 3:33 PM, Sapio Sciences, LLC
RS2036237 4 129942269 4q28.2 PGRMC2 PHF17
RS1903349 4 136608374 4q28.3 SLC7A11 PCDH10
RS2312546 4 132345202 4q28.3 PCDH10 LOC132321
RS1382883 5 31568782 5p13.3 RNASE3L
RS724223 5 29145855 5p14.1 CDH6
RS153264 5 5638081 5p15.32 KIAA0947
RS27220 5 59791021 5q12.1 PDE4D
RS154949 5 64886978 5q12.3 KIAA0073
RS2219745 5 74590731 5q13.3 FLJ40191
RS58982 5 104236349 5q21.2 EFNA5 NUDT12
RS1363617 5 173164547 5q35.2 CPEB4
RS2395166 6 32459456 6p21.32
RS719316 6 16780739 6p22.3 SCA1
RS860751 6 14741352 6p23 CD83 JARID2
RS1418708 6 150610 6p25.3 DUSP22
RS1856133 6 102146470 6q16.3 GRIK2
RS1342180 6 116117682 6q22.1 FRK HS3ST5
RS1408505 6 150502254 6q25.1 PPP1R14C
RS929245 7 82531860 7q21.11 PCLO
RS1584232 8 27013789 8p21.2 ADRA1A STMN4
RS822300 8 16488475 8p22 MSR1 FGF20
RS344214 8 62987120 8q12.3 ASPH FLJ39630
RS1380896 8 71285928 8q13.3 NCOA2
RS4332221 9 12742371 9p23 C9orf150 TYRP1
RS1407856 9 7036901 9p24.1 JMJD2C
RS1407972 9 8451714 9p24.1 PTPRD
RS702175 9 1599249 9p24.3 SMARCA2 DMRT2
RS1889224 9 110101521 9q31.3 UGCG SUSD1
RS1411445 9 120294727 9q33.2 NDUFA8
RS1411189 10 28847484 10p12.1 WAC
RS2393537 10 60345806 10q21.1 PHYHIPL
RS2207664 10 82913820 10q23.1 FLJ41984 GHITM

Sapio Sciences Analysis Report –Micronodular Adrenocortical Hyperplasia Research Paper Supplement
53 04/24/06 3:33 PM, Sapio Sciences, LLC
RS951647 10 90656781 10q23.31 LIPA
RS363225 10 118689089 10q26.11 SLC18A2
RS2896587 11 11734173 11p15.3 USP47
RS1941375 11 85483441 11q14.2 PICALM
RS1601981 12 28961846 12p11.22 MLSTD1 FLJ11088
RS1527260 12 19971799 12p12.2 PDE3A AEBP2
RS2213177 12 11852139 12p13.2 ETV6
RS1146122 12 62815387 12q14.2 ---
RS6539866 12 83740879 12q21.31 SLC6A15 DKFZp762A217
RS3848096 13 31692672 13q13.1 RFC3 STARD13
RS1373904 13 42273398 13q14.11 FLJ38725
RS2085808 13 64216386 13q21.32 PCDH9 FLJ25694
RS1410093 13 71636628 13q22.1 KLF5 KLF12
RS718602 13 76623522 13q22.3 POU4F1 EDNRB
RS920955 13 91801397 13q31.3 GPC6
RS1751005 13 93527871 13q32.1 ---
RS1074866 13 110710283 13q34 SOX1 LOC122258
RS1952514 14 19601896 14q11.2 HNRPC
RS2243891 14 22836885 14q11.2 NFATC4
RS1112573 14 76835369 14q24.3 NRXN3
RS1316583 15 36602102 15q14 RASGRP1
RS1964562 15 76762310 15q25.1 ADAMTS7 CHRNB4
RS4496103 15 86073423 15q25.3 NTRK3 FLJ31461
RS719980 15 95196648 15q26.2 ARRDC4
RS722516 16 27362834 16p12.1 IL4R IL21R
RS150739 16 63237330 16q21 CDH8 CDH11
RS725131 16 66362029 16q22.1 CKLF TK2
RS2159040 17 13193935 17p12 HS3ST3A1 ELAC2
RS1380833 18 39749816 18q12.3 SETBP1 SYT4
RS1985467 18 45926248 18q21.1 MYO5B
RS2014422 18 60158077 18q22.1 CDH7 MGC39571
RS956298 20 49977485 20q13.13 C20orf175
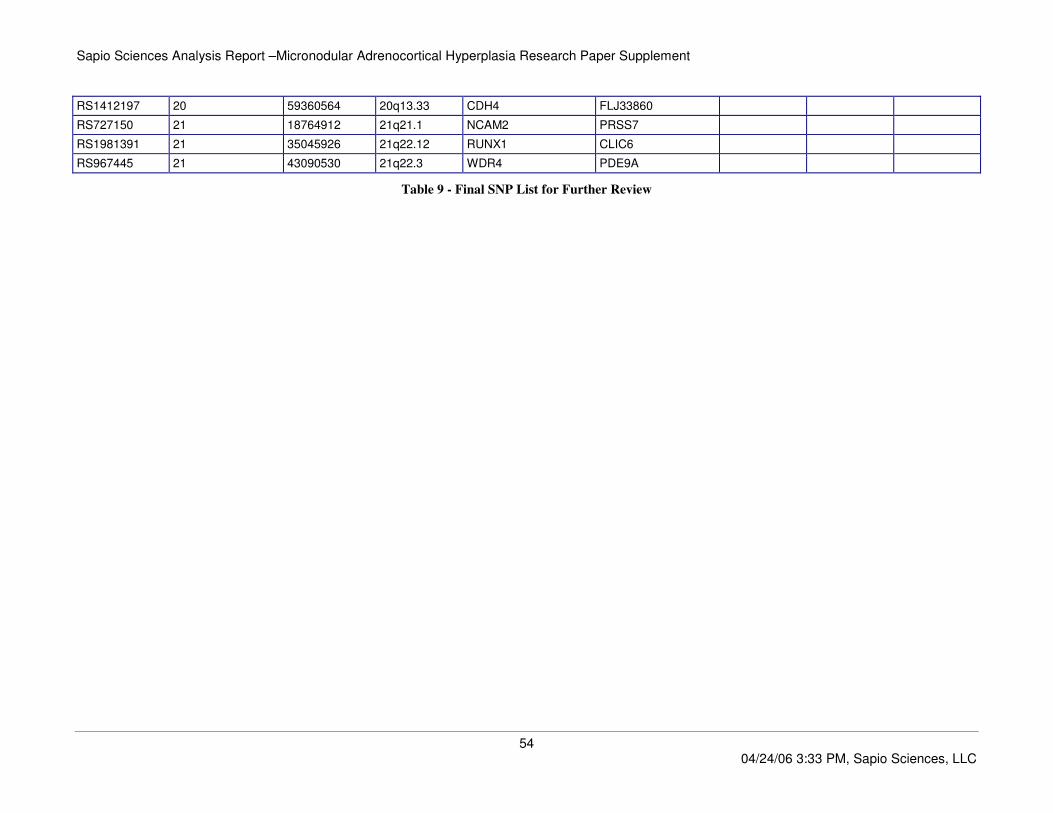
Sapio Sciences Analysis Report –Micronodular Adrenocortical Hyperplasia Research Paper Supplement
54 04/24/06 3:33 PM, Sapio Sciences, LLC
RS1412197 20 59360564 20q13.33 CDH4 FLJ33860
RS727150 21 18764912 21q21.1 NCAM2 PRSS7
RS1981391 21 35045926 21q22.12 RUNX1 CLIC6
RS967445 21 43090530 21q22.3 WDR4 PDE9A
Table 9 - Final SNP List for Further Review
Sapio Sciences Analysis Report –Micronodular Adrenocortical Hyperplasia Research Paper Supplement
55 04/24/06 3:33 PM, Sapio Sciences, LLC
6 Appendix A
6.1 Loss of Heterozygosity Calculations LOH in Exemplar is calculated via a probability-based method. This method computes the probability that a string of homozygous genotypes would occur by chance
alone. If a block of homozygous neighboring SNP’s in the analysis set has a very low probability of being homozygous in the reference set, then that block is shown to
have a high probability of LOH. LOH is calculated for each individual SNP in the input dataset, and then the results are ‘smoothed’ across blocks of SNP’s to reduce
noise.
For each SNPi that appears in the input dataset, look across all samples in the reference set and find the number of homozygous call values for that SNP. That number is
then divided by the total number of genotype calls for that SNP in the reference set to get the probability that SNPj is homozygous.
Pj = (# homozygous calls on SNPj ) / total # genotype calls on SNPj)
Where Pj is the probability that SNPj is homozygous in the reference set
After Pj is calculated for each SNPj in the input dataset against the reference set, a determination is made for what SNP’s make up each ‘block’ of SNP’s. This is
determined by the following method.
6.1.1 Analysis-Set Defined Block Size
When using a ‘analysis-set defined’ block size, the size of the blocks are determined by examining the call values in the analysis set. For each array to be analyzed, scan
the genotype call values for the SNP’s ordered by position on the chromosome. Group streams of homozygous call values together such that each ‘block’ of SNP’s is
bounded by a SNP with a heterozygous call value, and all other SNP’s in the block are homozygous. Once each block is identified, calculate the product of the
homozygous probabilities for each SNP in the block on the reference set. That becomes the p-Value for that block.

Sapio Sciences Analysis Report –Micronodular Adrenocortical Hyperplasia Research Paper Supplement
56 04/24/06 3:33 PM, Sapio Sciences, LLC
Figure 1 - LOH - Analysis-Set Defined Block Size
P(SNPm->n homozygous) = SUM(Pj) where j = m->n (SNP’s in the block)
When using this block type, all SNP’s in a given block will have the same probability value (for a given analysis array), which is a different effect than the sliding block
approach used above with user-defined block sizes where SNP’s in a block would normally have a variable final p-Value.
6.1.2 LOH P-Value
Now that we have the probability that a given block of SNP’s is homozygous on the reference set, we can examine each SNP for each array in the analysis set. For each
SNPj in the analysis set, if it is homozygous, the probability that it has lost heterozygosity is calculated in the following manner:
LOH = (-1)(Log10 P(SNPm-> homozygous))
For analysis-set defined blocks, each array in the analysis set could cause a different block to be identified on the reference set, so each LOH value on SNPj in each
array in the analysis set could be different. For this reason, standard deviation is calculated on each homozygous SNPj across the analysis set and plotted with the LOH
value.
Related Documents


