Sand Control Selection for Wells in Tukau Field by Nur Hafiz Bin Ahmad Zubir Dissertation submitted in partial fulfilment of the requirements for the Bachelor of Engineering (Hons) (Mechanical Engineering) JANUARY 2009 Universiti Teknologi PETRONAS Bandar Seri Iskandar 31750 Tronoh Perak Darul Ridzuan

Welcome message from author
This document is posted to help you gain knowledge. Please leave a comment to let me know what you think about it! Share it to your friends and learn new things together.
Transcript
Sand Control Selection for Wells in Tukau Field
by
Nur Hafiz Bin Ahmad Zubir
Dissertation submitted in partial fulfilment of
the requirements for the
Bachelor of Engineering (Hons)
(Mechanical Engineering)
JANUARY 2009
Universiti Teknologi PETRONAS
Bandar Seri Iskandar
31750 Tronoh
Perak Darul Ridzuan
i
CERTIFICATION OF APPROVAL
Sand Control Selection for Wells in Tukau Field
by
Nur Hafiz Bin Ahmad Zubir
A project dissertation in partial fulfilment of
the requirement for the
BACHELOR OF ENGINEERING (Hons)
(MECHANICAL ENGINEERING)
Approved by,
______________________________
(Assoc. Prof. Dr Razali Bin Hamzah)
UNIVERSITI TEKNOLOGI PETRONAS
TRONOH, PERAK

ii
CERTIFICATION OF ORIGINALITY
This is to certify that I am responsible for the work submitted in this project, that the
original work is my own except as specified in the references and acknowledgements,
and that the original work contained herein have not been undertaken or done by
unspecified sources or persons.
______________________________
NUR HAFIZ BIN AHMAD ZUBIR
iii
ABSTRACT
The objective of this research was to determine the effective method of sand control
for wells in Tukau field. In Tukau Field which was located offshore in Sarawak
Baram Delta area, several wells were experiencing sand problem. In this research,
TK-54L was selected as case study. The main problems with this well were
significant reduction of gross liquid production which results in closing down the
well. TK-54L well was completed using through tubing screen to prevent sand
production but has shown to be ineffective. Therefore, a proper study was required to
select an effective sand control method specifically for Tukau field.
The scopes of study were (a) examine on the sand sample, (b) study on the liquid and
reservoir properties, (c) study on the available types sand control methods and (d)
selection of appropriate sand control methods. Sand sample from TK-54L was used to
determine the particle size distribution using sieve analysis. This test determined the
uniformity coefficient which suggested several sand control methods. Precise
selection done by analysis using existing computer simulation software named
WellFlo to simulate the conditions obtained from options available based on the
highest production rate.
The average sand uniformity coefficient obtained from particle size distribution test
was 1.52. This value indicates that the distribution consist of highly uniform sand.
The three available sand control methods considered from this research were metal
mesh screen, wire wrap screen and gravel pack. Based on the results obtained, wire
wrap screen shows the highest operating rate which is at 645.98 STB/day where it is
3.5 times more than the current sand control method using through tubing screen. This
concludes that the wire wrap screen was selected for well TK-54L.

iv
ACKNOWLEDGEMENT
In the name of Allah, the Most Gracious Most Merciful
First and foremost, I would like to thank my supervisor, Assoc. Prof. Dr. Razali
Hamzah for his guidance and input throughout the overall progress of this project.
Thank you for your kind guidance and word of advice throughout the completion of
the project
I would also like to extend my gratitude to Miss Suzanna Juyannty from SSI-SK
BPD-S, Petronas Carigali who has given all her support on sand control matters.
Thank you for your time in assisting the completion this project with all the
knowledge and material supplied.
Not forget also all the lecturers of Geoscience & Petroleum Engineering and
Mechanical Engineering, that have kind-heartedly assisted me in completing my
tasks. Thank you for your kind support.
And last but not least, I would like to thank all my family and friends for your input
and support.
Thank you.
v
TABLE OF CONTENTS
CERTIFICATION . . . . . . . i
ABSTRACT . . . . . . . . iii
ACKNOWLEDGEMENT . . . . . . . iv
CHAPTER 1: INTRODUCTION . . . . . 1
1.1 Background of Study . . . . 1
1.2 Problem Statement . . . . 1
1.3 Objectives and Scope of Study . . 2
CHAPTER 2: LITERATURE REVIEW . . . . 4
2.1 Sand Production Phenomena . . . 4
2.2 Sand Control Management . . . 8
2.3 Active Sand Control Techniques . . 10
2.4 Case Study: TK-54L . . . . 15
2.5 Further Analysis . . . . 17
CHAPTER 3: METHODOLOGY . . . . . 19
3.1 Procedure Identification . . . 19
3.2 Tools and Equipment Required . . 22
3.3 Scanning Electron Microscope . . 22
3.4 Particle Size Distribution Test . . 23
3.5 WellFlo Software . . . . 24
CHAPTER 4: RESULTS AND DISCUSSION . . . 26
4.1 Sand Production Factors . . . 26
4.2 Welltest Analysis . . . . 29
4.3 Sand Production Identification . . 30
4.4 Sand Particle Shape . . . . 31
4.5 Particle Size Distribution . . . 32
4.6 Computer Simulation . . . . 34
vi
4.7 Performance Comparison . . . 38
CHAPTER 5: CONCLUSIONS AND
RECOMENDATIONS . . . . 40
5.1 Conclusions . . . . . 40
5.2 Recommendations . . . . 41
REFERENCES: . . . . . . . . 42
APPENDICES: . . . . . . . . 44
vii
LIST OF FIGURES
Figure 2.1 Weatherford through tubing sand screens cross section details 11
Figure 2.2 Gravel pack in opened hole well 12
Figure 2.3 Expandable sand screen 13
Figure 2.4 Location of Tukau Field in Baram Delta Operation 15
Figure 3.1 Project flowchart 21
Figure 4.1 Effect of perforation density on successful production life 26
Figure 4.2 Response of sonic probe before and after perforation 27
Figure 4.3 Effect of completion length on successful production life 28
Figure 4.4 Effect of permeability-thickness product on successful
production life 29
Figure 4.5 Electron micrograph of some fine subangular and subrounded
quartz sand 31
Figure 4.6 Particle Size Distribution for TK-20L 33
Figure 4.7 TK-54L Inflow/Outflow Performance Curve 35
Figure 4.8 TK-54L Inflow/Outflow Performance Curve using sensitivity
to different skin value 37
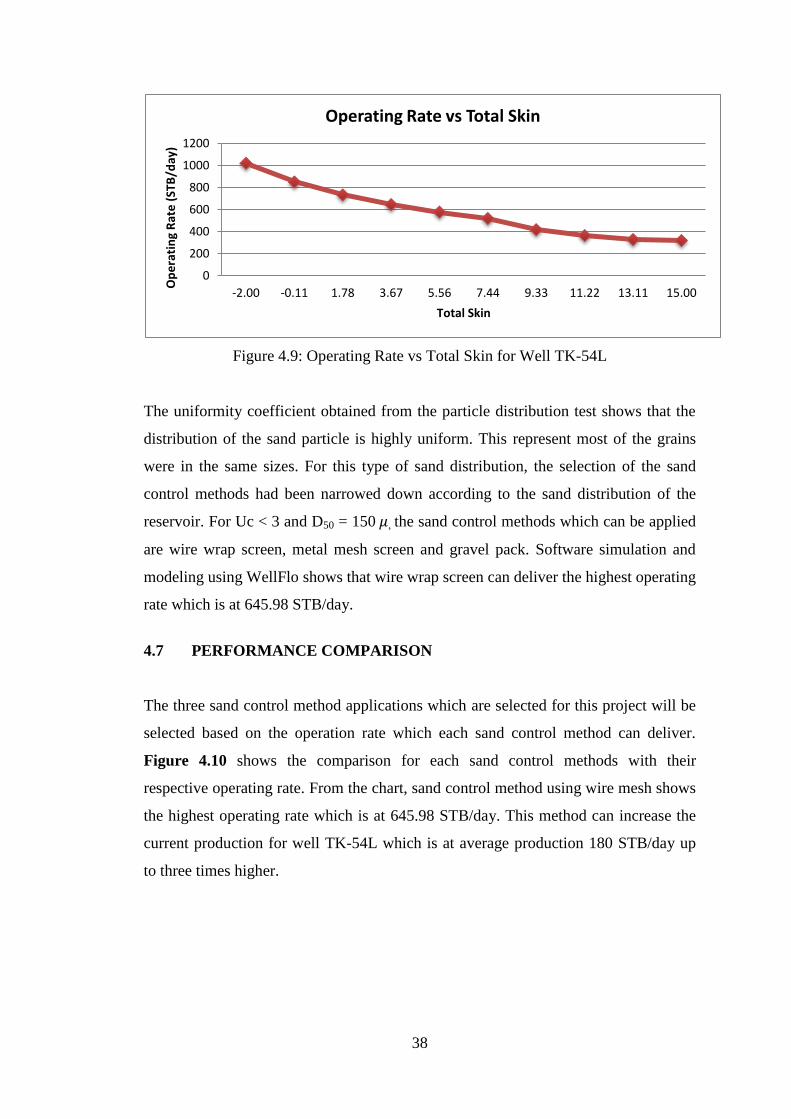
Figure 4.9 Operating Rate vs Total Skin for Well TK-54L 38
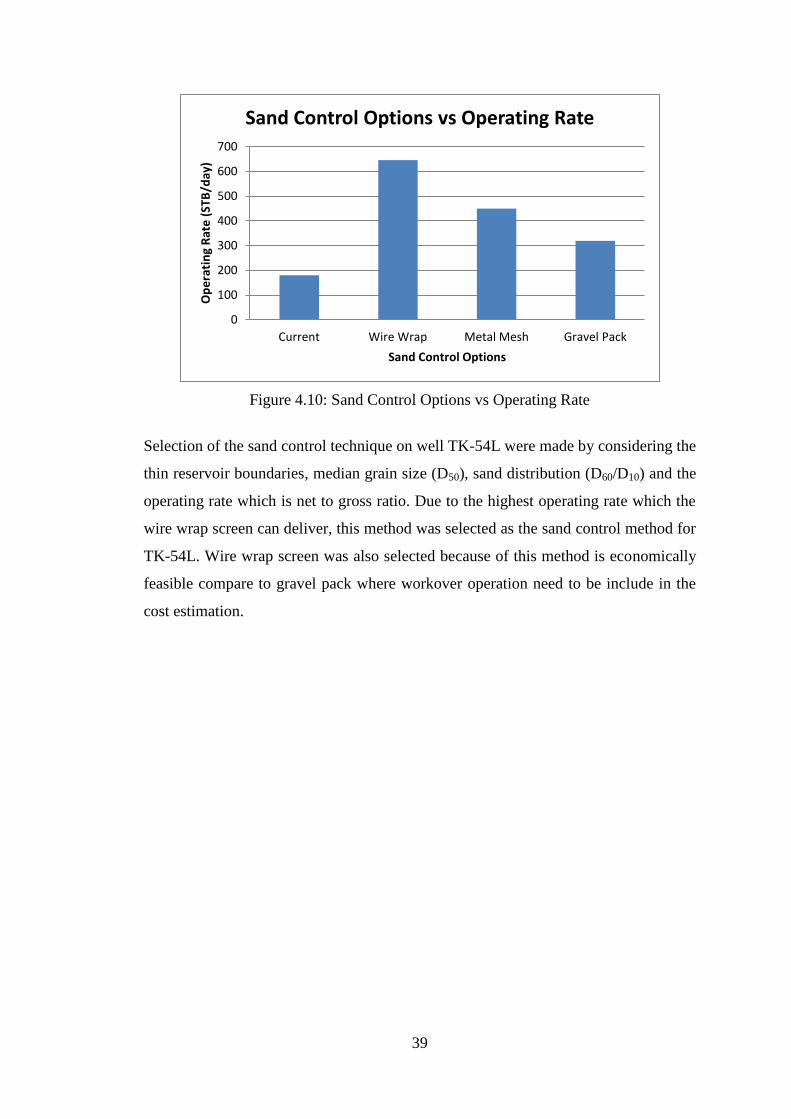
Figure 4.10 Sand Control Options vs Operating Rate 39
LIST OF TABLES
Table 2.1 Particle size classifications 5
Table 2.2 U.S. Standard sieve size 6
Table 2.3 TK-54L well details 16
Table 4.1 TK-54L welltest result 30
Table 4.2 Crude Oil Analysis Report on Tukau Wells 31
Table 4.3 Particle Size Distribution for TK-20L 32
Table 4.4 Uniformity Coefficient Classification 34
Table 4.5 Parameters obtained for current condition performance 35
1
CHAPTER 1
INTRODUCTION
1.1 BACKGROUND OF STUDY
Sand production from unconsolidated formations in oil and gas fields has been a
worldwide challenge for the petroleum industry for many decades. Sand influx into
producing wells can cause reduce productivity and increase the expenses to prevent
equipment erosion. Sanding results in high removal costs, equipment erosion, and
significant maintenance expenditure. Even in a sand free or clean well where sand
production rate is only a few pounds per day, erosion damage could be very severe at
high production velocities. Sand management involves the development and
monitoring of optimal sand control strategies that recognize the particular problems
and constraints of the field but yet maximize the productivity and completion
longevity. Understanding the sensitivity of productivity to different sand control
methods is essential to the longer term economic success.
1.2 PROBLEM STATEMENT
In Tukau Field located at Sarawak Baram Delta Operations, several existing wells
were experiencing sand production. Wells which were drilled and completed with
sand control application failed to prevent sand production due to weak sand formation
and gravel pack failure. The challenge was not merely to avoid or stop sand
production, but to be able to maintain commercial well productivity after efforts to
control sand are implemented. At the same time, the control method selected must be
economically feasible to the well.

2
The well candidate selected for this research would be TK-54L. TK-54L completed in
year 1987 with no gravel pack installed. The first sand production reported in 2001
where sand found accumulated in the separator. In 2005, the well was installed with
through tubing screen which is metal mesh screen type but was found ineffective.
Sanding still produced into the completion and the gross production of the well still
low from expected. The study of this research is to determine the best sand control
alternative for the well.
1.3 OBJECTIVES AND SCOPE OF STUDY
1.3.1 Objectives of Study
This project was essential to select the suitable sand control method for wells in
Tukau field. The main objectives of this research are:
a) To identify the sand and fluid properties of Tukau field.
b) To select the most effective sand control alternative for wells in Tukau field.
1.3.2 Scope of Study
The scope of work of this project will emphasize on the best sand control method for
wells in Tukau which will suits the above objective listed. Various parameters need to
be considered such as:
a) Examine the sand sample.
b) Study on the reservoir and liquid properties.
c) Study on the types of available sand control methods.
d) Selection on the appropriate sand control methods.
3
The operating conditions shall be different for each sand control methods, so the
effect of those parameters is vital towards permeability and good separation. At the
same time, the control method selected must be justified by a reasonable payback time
of the investment cost.
1.3.3 Significant of the Project
This project would emphasize on comparing the different types of sand control
method based on skin value provided for each sand control method. The finalize
results of this research should increase the performance of this well and overcome the
sanding problem. Furthermore the results of this research could play a vital role in
selecting different types of sand control method to reduce sanding problem which is
suitable for the well and helps operator to reduce the cost of maintenance.
4
CHAPTER 2
LITERATURE REVIEW
2.1 SAND PRODUCTION PHENOMENA
Sand production and control remain as one of the critical challenges in reservoir
management and production operations. Sand results in high removal costs,
equipment erosion, and significant maintenance expenditure. The common causes of
sand production are it can plug up upstream and downstream equipment such as
completion tubing, tubing manifold, separator, pipeline and also access to enter
wellbore. Excessive sand production in oil and gas industry may require production
shut in. Sand production is not an exact science although theoretical analytical and
numerical model exist. It is necessary to approach the problem with a good
engineering based understanding of the limitations of the rock, well and reservoir
data, and an appreciation of all the other sources of information that can be targeted
on the problem [11].
2.1.1 Sand Failure
Sand failure occurs when stress acting on the wellbore exceeds the strength of the
overlying rock in the reservoir. High velocity viscous fluid and water can mobilize the
failed rock or weaken sand into the wellbore. There are two failure mechanism occur
on the rock formation which is shear failure and tensile failure.
a) Shear failure
This type of failure occur when the shear stress acting on the rock exceed the shear
strength where the rock can sustain. This phenomenon will result in the grain
5
breakage of the rock into small particles where sand is produce. Excessive amounts of
shear yielding can result in severe sand production problem and potentially
catastrophic collapse of boreholes and perforations.
b) Tensile failure
Tensile stress occurs when the effective normal stresses become negative. Tensile
stresses act to force a solid body apart. Tensile stresses develop in producing wells
when a steep pressure gradient exists near the borehole or perforation wall. If they
exceed the tensile strength of the rock, this result in tensile yielding where grain
breakage occur on the rock and induced sand production [5]
.
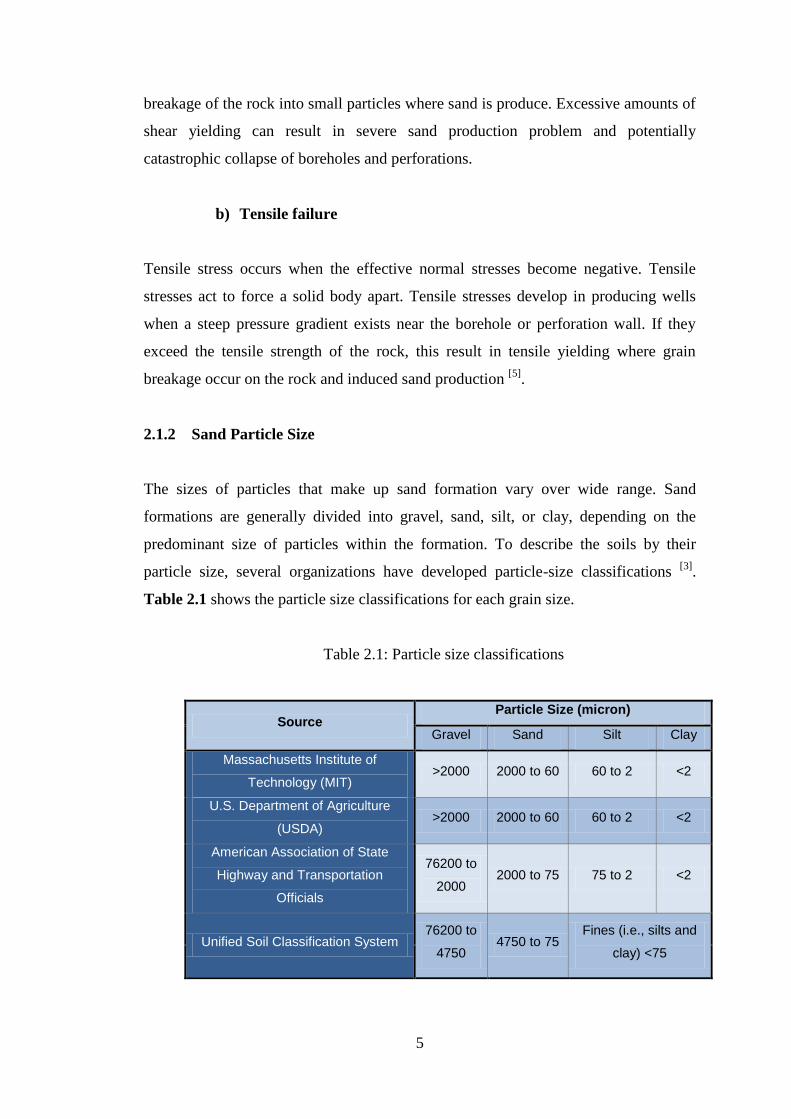
2.1.2 Sand Particle Size
The sizes of particles that make up sand formation vary over wide range. Sand
formations are generally divided into gravel, sand, silt, or clay, depending on the
predominant size of particles within the formation. To describe the soils by their
particle size, several organizations have developed particle-size classifications [3]
.
Table 2.1 shows the particle size classifications for each grain size.
Table 2.1: Particle size classifications
Source Particle Size (micron)
Gravel Sand Silt Clay
Massachusetts Institute of
Technology (MIT) >2000 2000 to 60 60 to 2 <2
U.S. Department of Agriculture
(USDA) >2000 2000 to 60 60 to 2 <2
American Association of State
Highway and Transportation
Officials
76200 to
2000 2000 to 75 75 to 2 <2
Unified Soil Classification System 76200 to
4750 4750 to 75
Fines (i.e., silts and
clay) <75
6
2.1.2 Sand Particle Analysis
Particle analysis is the determination of the size range of particles present in a sand
sample which is expressed as a percentage of the total dry weight. The general
method which is used to find the particle-size distribution of sand is called sieve
analysis.
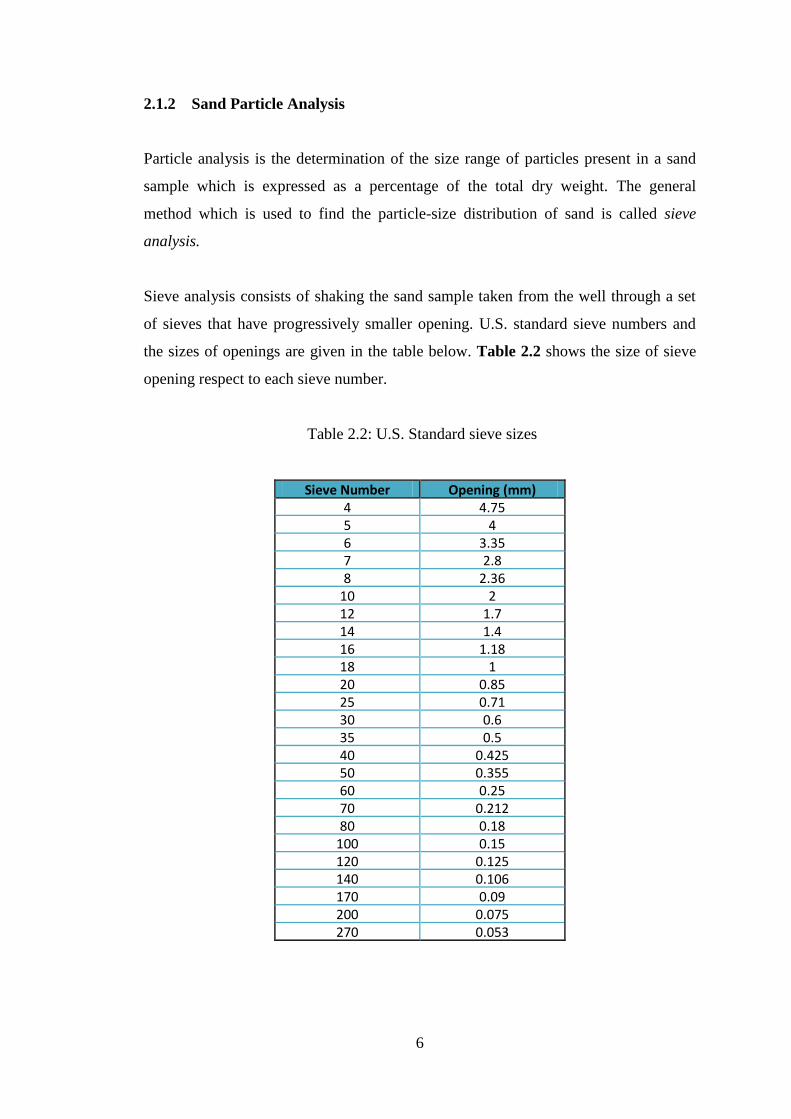
Sieve analysis consists of shaking the sand sample taken from the well through a set
of sieves that have progressively smaller opening. U.S. standard sieve numbers and
the sizes of openings are given in the table below. Table 2.2 shows the size of sieve
opening respect to each sieve number.
Table 2.2: U.S. Standard sieve sizes
Sieve Number Opening (mm) 4 4.75 5 4 6 3.35 7 2.8 8 2.36
10 2 12 1.7 14 1.4 16 1.18 18 1 20 0.85 25 0.71 30 0.6 35 0.5 40 0.425 50 0.355 60 0.25 70 0.212 80 0.18
100 0.15 120 0.125 140 0.106 170 0.09 200 0.075 270 0.053

7
The sieves used for soil analysis are generally 203 mm (8 in.) in diameter. To conduct
sieve analysis, the soil first need to be oven-dry and all lump break into small
particles. The soil is then shaken through a stack of sieves with openings of
decreasing size from top to bottom. The mass of soil retained on each sieve is
determined after the soil is shaken [3]
.
2.1.3 Particle-Size Distribution Curve
A particle-size distribution curve can be used to determine the following four
parameters from the sand sample which are:
a) Effective Size (D10): This parameter is the diameter in the particle-size
distribution curve corresponding to 10% fines. The effective size of a
granular soil is a good measure to estimate the hydraulic conductivity and
drainage through soil
b) Uniformity coefficient (Cu): This parameter is defined as
……………..... (1)
Where D60 = diameter corresponding to 60% fines.
c) Coefficient of gradation (Cz): This parameter is defined as
.……………...... (2)
8
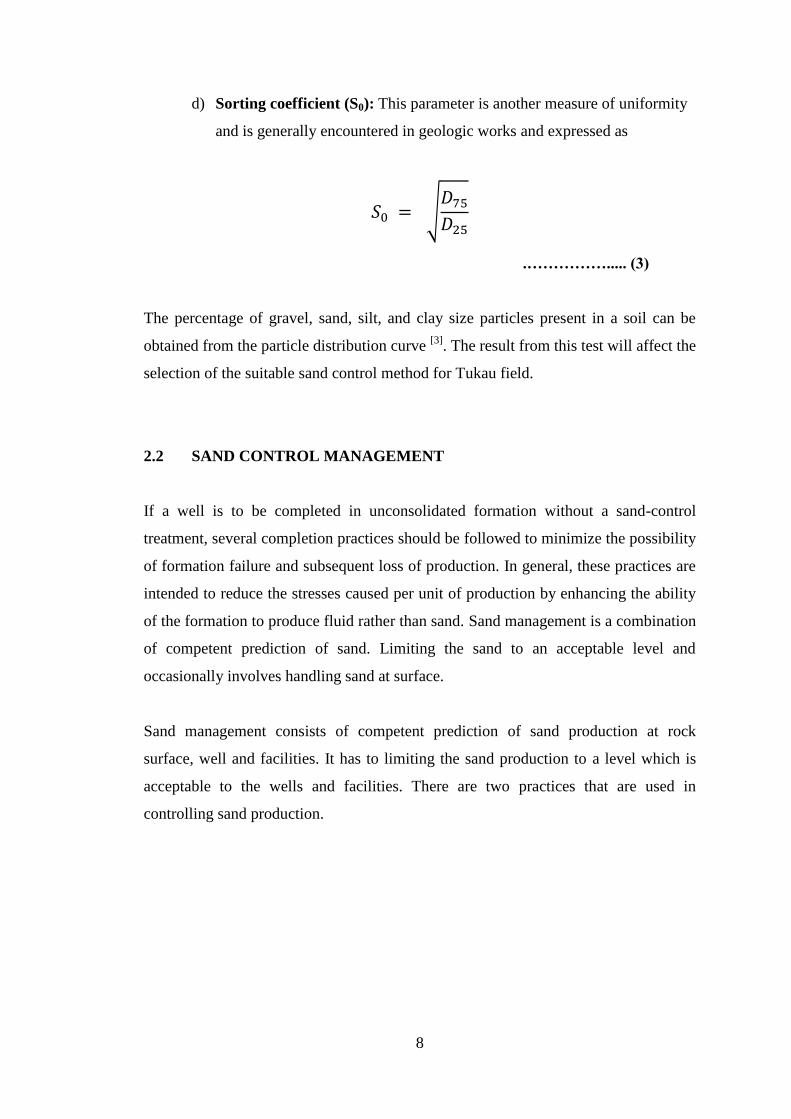
d) Sorting coefficient (S0): This parameter is another measure of uniformity
and is generally encountered in geologic works and expressed as
.……………..... (3)
The percentage of gravel, sand, silt, and clay size particles present in a soil can be
obtained from the particle distribution curve [3]
. The result from this test will affect the
selection of the suitable sand control method for Tukau field.
2.2 SAND CONTROL MANAGEMENT
If a well is to be completed in unconsolidated formation without a sand-control
treatment, several completion practices should be followed to minimize the possibility
of formation failure and subsequent loss of production. In general, these practices are
intended to reduce the stresses caused per unit of production by enhancing the ability
of the formation to produce fluid rather than sand. Sand management is a combination
of competent prediction of sand. Limiting the sand to an acceptable level and
occasionally involves handling sand at surface.
Sand management consists of competent prediction of sand production at rock
surface, well and facilities. It has to limiting the sand production to a level which is
acceptable to the wells and facilities. There are two practices that are used in
controlling sand production.
9
2.2.1 Passive Control
Passive method incorporates well production techniques to minimize or eliminate the
amount of sand produced and also to reduce the amount of produced sand without
mechanical sand exclusion method. Depending on the risk associated with produced
sand on well integrity and safety, sand prevention measures are usually applied in
combination with monitoring and removal techniques and equipments [5]
.
Passive sand control method which are commonly practiced:
i) Reducing production rate
ii) Increase the number of perforations
iii) Increase perforation diameter
iv) Oriented and selective perforation
v) Drawdown control
2.2.2 Active Control
Active control method is widely used in combating sand production. This type of
control consist two methods which are:
a) Mechanical method
Screens or gravel particles are used to retain sand inclusion from flowing into the well
by bridging it at the formation face [2]
.
b) Chemical method
Chemicals are used to control sand inclusion by means of increasing the strength of
the formation in order that sand particles will not loose from rock formation [2]
.
10
2.3 ACTIVE SAND CONTROL TECHNIQUES
There are two types of sand control techniques which are widely used in sand
producing wells which are:
2.3.1 Mechanical Sand Control
The basic theory behind the mentioned sand control technique is that a control section
is place around the wellbore to act as filter media. Formation particles migrating
towards the wellbore are bridged of this controlled section. Below are the types of
various mechanical sand control methods used:
a) Through Tubing Screen
This type of screen will be installed inside the tubing which is set at the tubing Sliding
Sleeve Door (SSD) or tubing nipple. Usually it will be installed after sand
accumulation reported inside the well. It works in open and cased holes, gravel and
non gravel packed and horizontal and multilateral wells. Sand particles are not
uniform in size, yet most sand control media have uniform pore sizes. The intelligent
alternative is the engineered pore structure of PPM (Porous Metal Membrane) and
PMF II (Porous Metal Fiber).
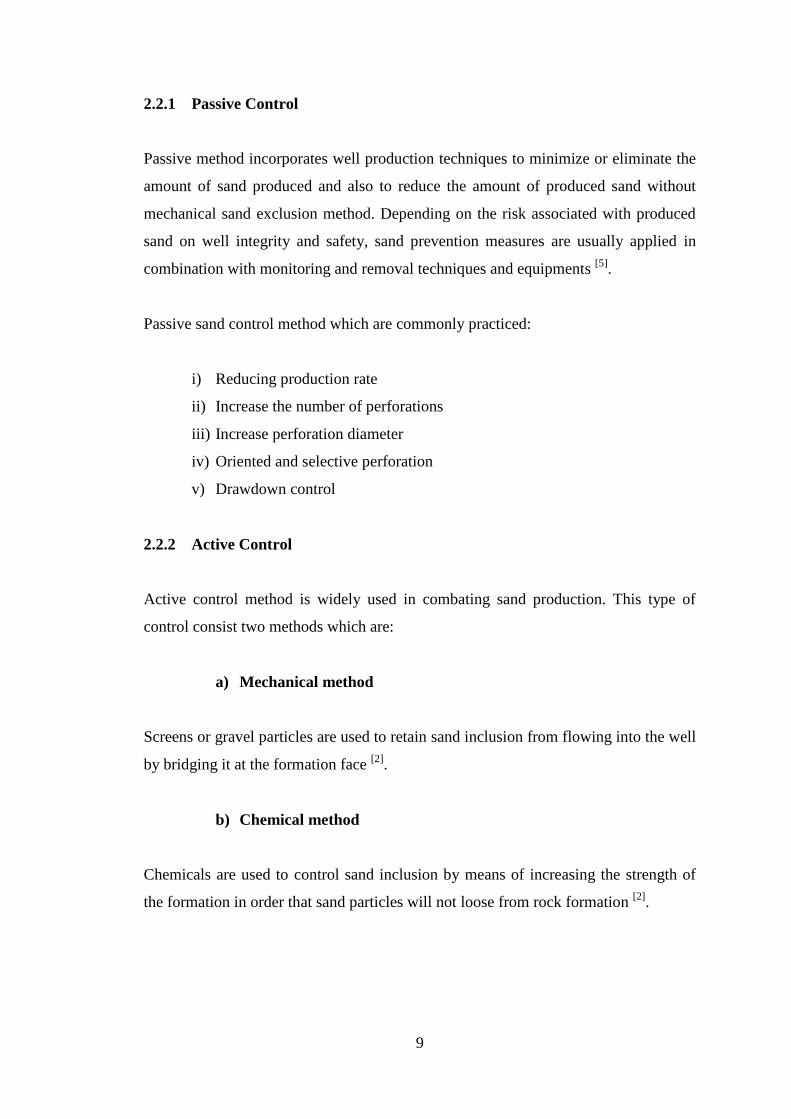
A controlled distribution of pore sizes gives these patented media the unique ability to
extend screen service life while providing sand control across a broader range of
particle sizes than all other sand control devices, which simply repackage
conventional media. Figure 2.1 shows the cross section of the through tubing screens.
This cross section details also apply for pre-packed screens, woven and non-woven
wire meshes, slotted liners and high-performance screens [14]
.
11
Figure 2.1: Weatherford through tubing sand screens cross section details
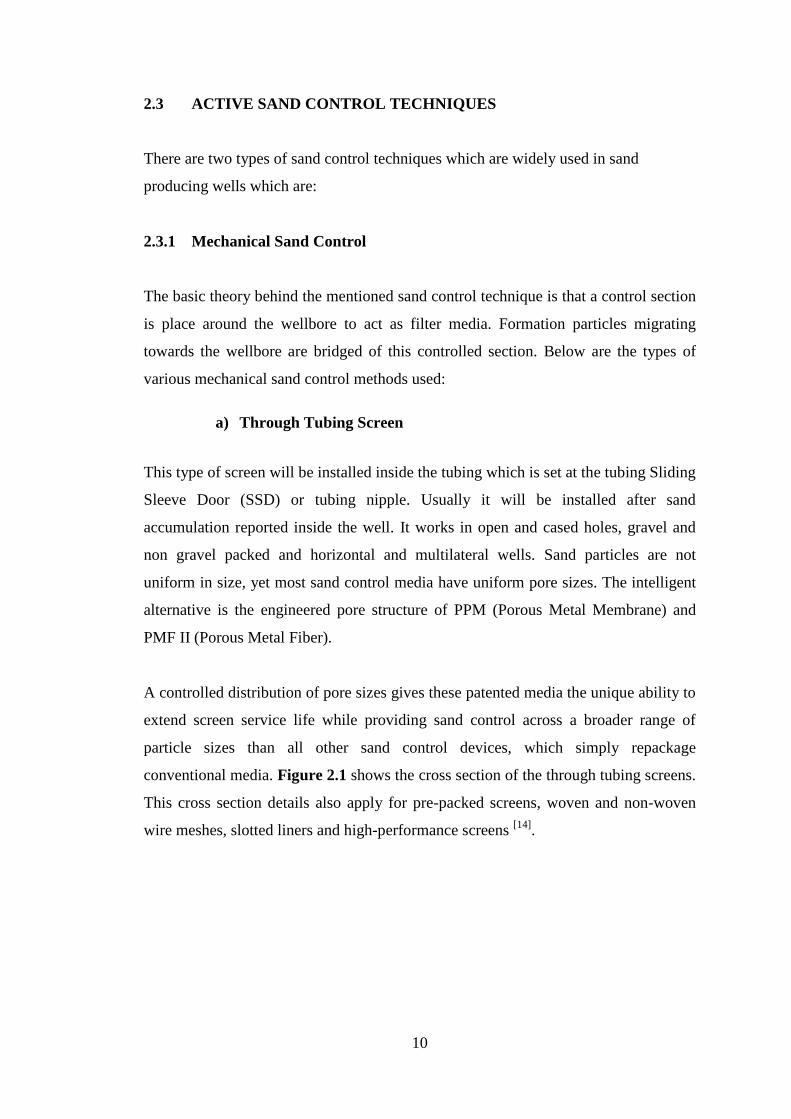
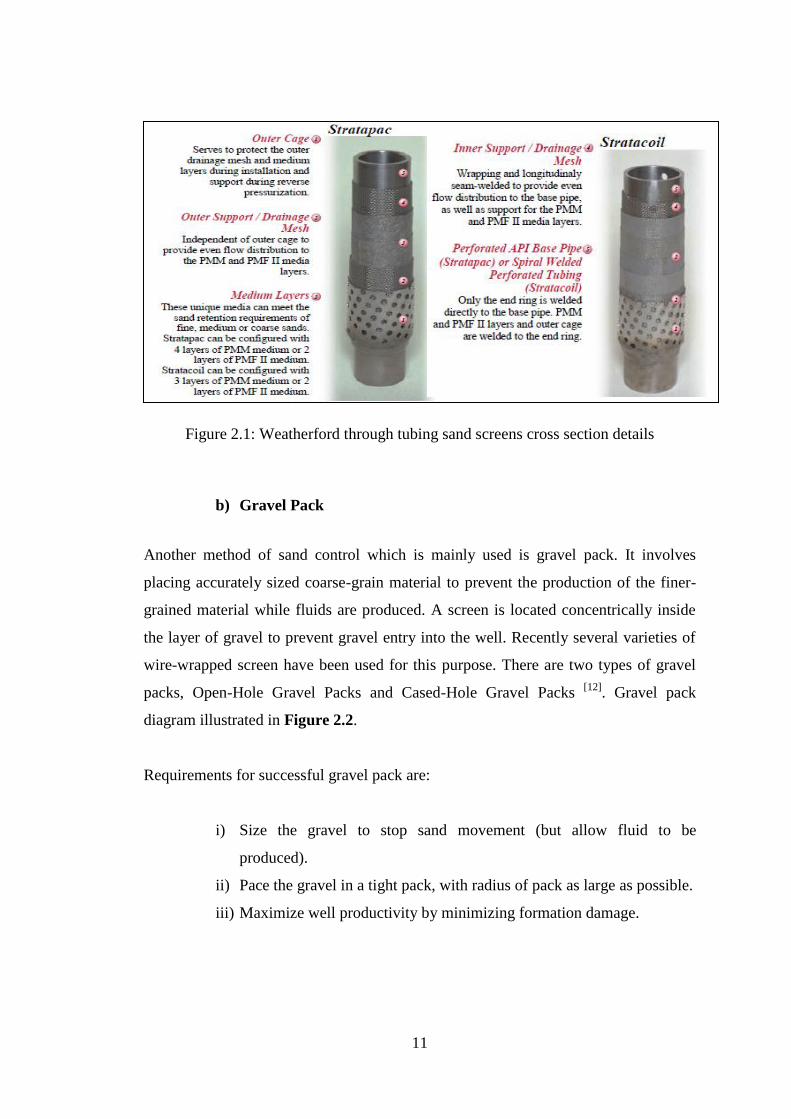
b) Gravel Pack
Another method of sand control which is mainly used is gravel pack. It involves
placing accurately sized coarse-grain material to prevent the production of the finer-
grained material while fluids are produced. A screen is located concentrically inside
the layer of gravel to prevent gravel entry into the well. Recently several varieties of
wire-wrapped screen have been used for this purpose. There are two types of gravel
packs, Open-Hole Gravel Packs and Cased-Hole Gravel Packs [12]
. Gravel pack
diagram illustrated in Figure 2.2.
Requirements for successful gravel pack are:
i) Size the gravel to stop sand movement (but allow fluid to be
produced).
ii) Pace the gravel in a tight pack, with radius of pack as large as possible.
iii) Maximize well productivity by minimizing formation damage.
12
Figure 2.2: Gravel pack in opened hole well
c) Frac Pack
The frac-pack theory simply allows for the bypassing of near wellbore damage
created during drilling, perforating and fluid management process. Initially companies
drawn to frac and pack for higher production and lower drawdown. But after a few
years producing their wells, operators are becoming more convinced that the reduced
sand control failure rates are equally as important. For a successful frac & pack, it
requires two different processes, tip screen-out (TSO) and fracture inflation and
packing (FIP).
TSO occurs when the sand or proppant reach the tip of fracture tip at an early stage of
the treatment, preventing the fracture from growing further. Further injection after
TSO, the second stage, results in FIP. Combining these two stages is called „Frac‟ and
Cement
Formation
sand
Production
Casing
Packer
Casing shoe
Gravel
Formation
sand
Under reamed
hole section
Slotted liner/Wire
wrap screen retain
the gravel
13
„Pack‟. By bypassing the near wellbore damage and creating a stimulation effect for
the completion, typical skin values of +25 to +30 for gravel pack completions have
dramatically reduced to +2 for frac pack completions. Thus, with lower skin would
results in higher PI and higher production rate [9]
.
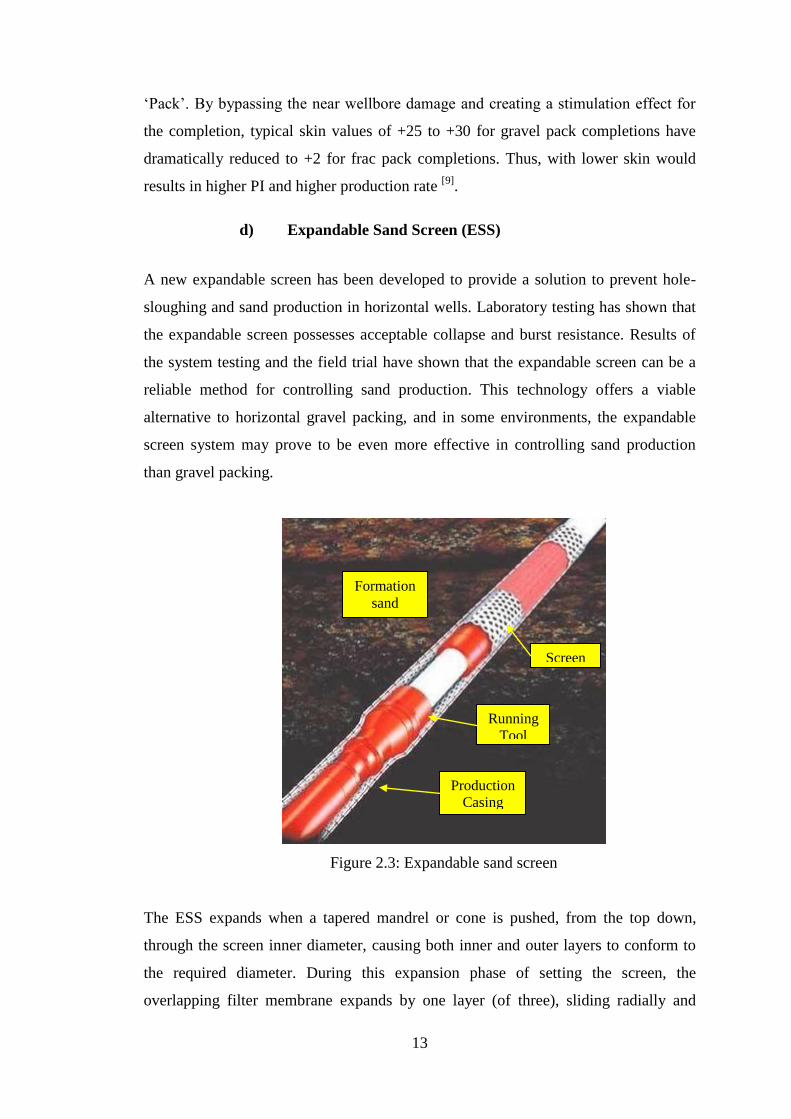
d) Expandable Sand Screen (ESS)
A new expandable screen has been developed to provide a solution to prevent hole-
sloughing and sand production in horizontal wells. Laboratory testing has shown that
the expandable screen possesses acceptable collapse and burst resistance. Results of
the system testing and the field trial have shown that the expandable screen can be a
reliable method for controlling sand production. This technology offers a viable
alternative to horizontal gravel packing, and in some environments, the expandable
screen system may prove to be even more effective in controlling sand production
than gravel packing.
Figure 2.3: Expandable sand screen
The ESS expands when a tapered mandrel or cone is pushed, from the top down,
through the screen inner diameter, causing both inner and outer layers to conform to
the required diameter. During this expansion phase of setting the screen, the
overlapping filter membrane expands by one layer (of three), sliding radially and
Formation
sand
Production
Casing
Screen
Running
Tool
14
axially over another until the final diameter is achieved, while remaining firmly
sandwiched between the other two layers [7][8]
. Figure 2.3 shows an ESS being
running in hole inside the wellbore.
2.3.2 Chemical Sand Control
Other alternative besides mechanical method is the chemical method. This method
uses the injected fluid into the well to increases the strength around the wellbore or to
remove the sand accumulated inside the well. Below are the types of chemical control
method:
a) Sand Consolidation
Hydrocarbon formations often contain loosely and separate sandy material. In the
production phases, sand tends to be carried along with the oil into the wellbore. The
flow of sand can be prevented by consolidating or cementing together the sand
particles of the formation around the well bore. The cementing has to be
accomplished while maintain the flow channels between sand particles open.
In the first step of the process, resin is injected into the formation where it fully
saturates the interstices between sand grains. Permeability is established in the second
step by displacement of the excess resin from the interstices, thereby leaving a thin
film of resin on the sand grains. In the third step, polymerization is activated by
migration of catalyst from the inert fluid into the thin resin film on the sand. The
process has the advantage that resin is placed and permeability is established before
the resin is catalyzed [10]
.
15
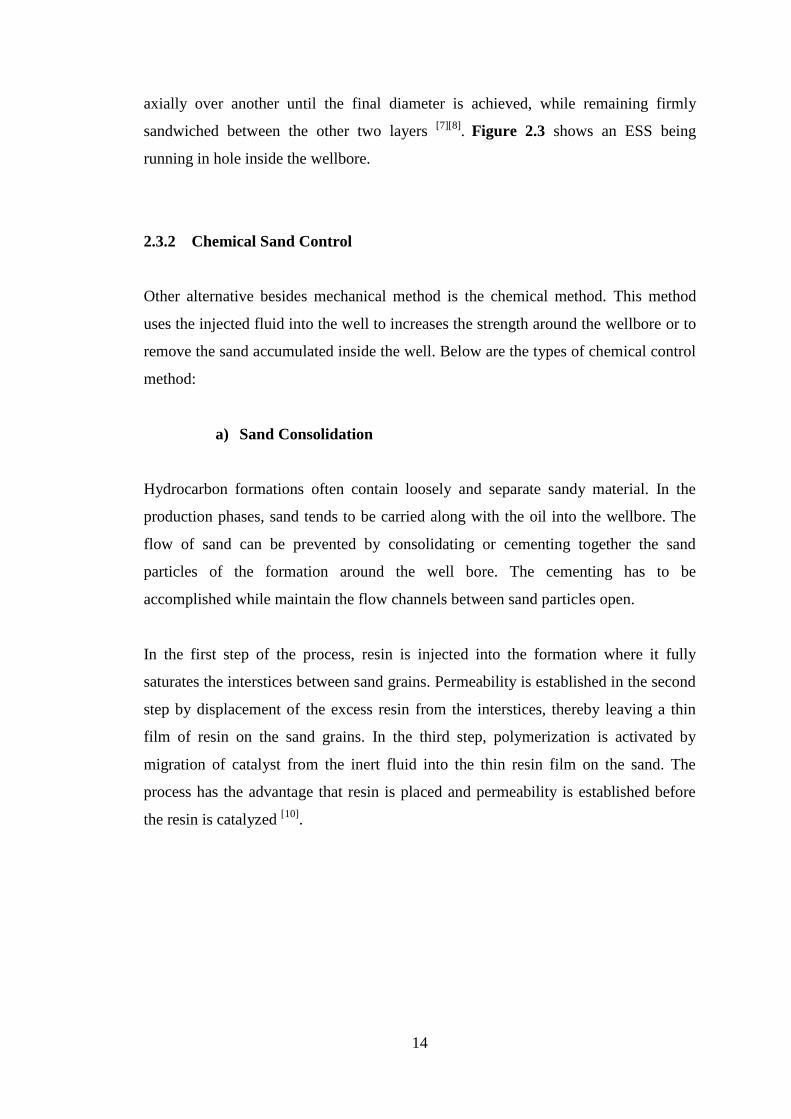
2.4 CASE STUDY: TK-54L
The Tukau Field is located some 30 km offshore Sarawak, Malaysia in water depth of
about 160 ft as illustrated in Figure 2.4. The field, discovered by TK-2 in 1966 found
235 ft net oil sand and 16 ft wet gas sand. After further seismic data acquisition and
interpretation, six appraisal wells were drilled from 1973 to 1975 before the field
could be commercially developed. Well TK-54L had been selected as a case study for
this project.
Figure 2.4: Location of Tukau Field in Baram Delta Operation
16
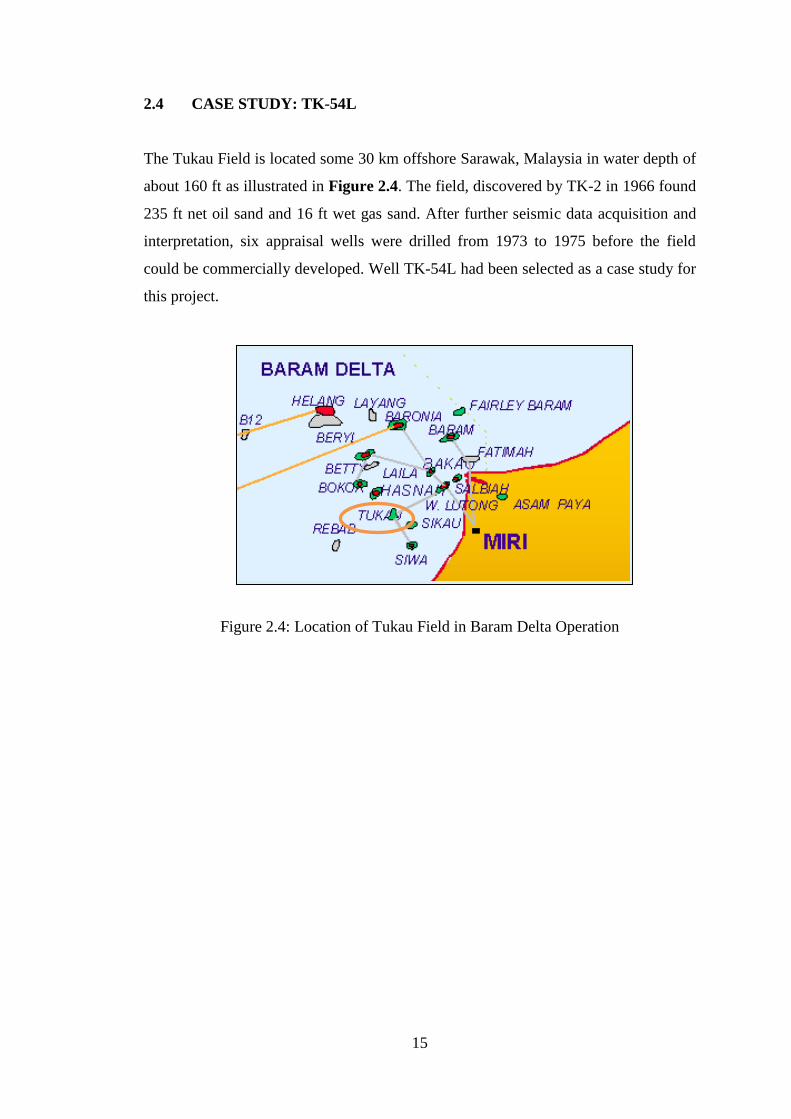
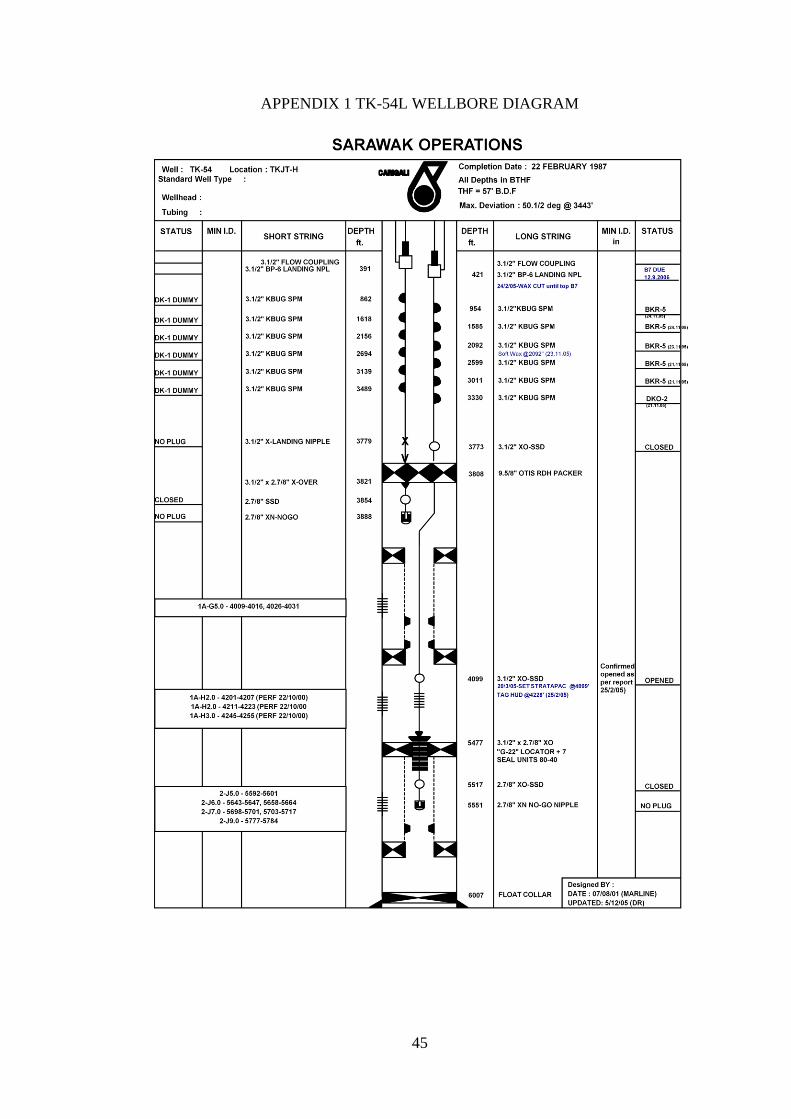
2.4.1 Well Candidate
Candidate selected for this research would be TK-54. This well is a dual string
completion and was completed on 22 February 1987. Study will concentrate on the
long string TK-54L since this string accumulates with sand production. It consist of
three reservoirs namely 1A-G5.0 upper zone, 1A-H2.0/H3.0 middle zone and 2-
J5.0/J6.0/J7.0/J9.0 for bottom zone (Appendix 1). Zone 1A-H2.0/H3.0 was perforated
in year 2000. This well completion does not equip with Internal Gravel Pack (IGP).
Currently the well installed with trough tubing screen called Stratapac with PMF
12/20 mesh wire since March 2005. Table 2.3 summarizes the details for well TK-
54L.
Table 2.3: TK-54L well details
Platform TKJT-H
Well TK-54L
Completion Type Dual String
Production Mode GLI (Gas Lift Injection)
Well Status Idle
Production Zone a) 1A-G5.0
b) 1A-H2.0/H3.0
c) 2-J5.0/J6.0/J7.0/J9.0
Maximum Deviation 50.5 deg@3443ft BTHF
17
2.5 FURTHER ANALYSIS
Apart measure the performance of the well as explained above, there are further
analysis need to be done to study the performance and economic value of the well.
Among the studies are:
a) Formation Damage
b) Productivity Index (PI)
c) Net Present Value (NPV)
2.5.1 Formation Damage
Sometimes a well completion can cause damage to the formation of the reservoir.
There are analysis needs to be carry out to determine the level of formation damage.
The studies are skin analysis and pressure transient analysis
There are 2 major types of skin which are:
a) Mechanical Skin
Caused by a reduction in absolute permeability of the formation, reduction
in the absolute permeability of the produce fluid, or an increase in the
viscosity of the produced fluid, i.e. actual physical damage to the formation.
b) Apparent Skin
Due to the development of non radial flow around the wellbore resulting
from the wells production having to flow through a smaller vertical
thickness near the well than away from the well.
Total Skin is obtained from a pressure transient test:
.……………...... (4)
18
S = Total Skin
ht = Height of the entire formation interval (feet)
hp = Height of the perforated interval (feet)
Sp = Apparent Skin Factor
Sd = Mechanical Skin Factor
2.5.2 Productivity Index
The Productivity Index, J, is a measure of the flow capacity of a well per unit
reservoir drop across the formation (drawdown). The PI is used to compare well
performance before and after completion and well workovers, and after water
breakthrough.
.……………...... (5)
J = Productivity Index (bbl/d/psi)
qo = Flowrate (bbl/d)
PRES = Average reservoir pressure (psi)
Pwf = Flowing bottomhole pressure (psi)
19
CHAPTER 3
METHODOLOGY
3.1 PROCEDURE IDENTIFICATION
Well TK-54L from Tukau field was selected as a case study. Sand sample from the
well was collected to run Particle Size Distribution (PSD) test to ensure the mean size
and distribution of sand. The particle shape was analyzed using Scanning Electron
Microscope to study the characteristics. The distribution curve determined the
suggested types of sand control method and sand screens that used. Calculation on the
production performance was done using computer software named WellFlo to
compare between the available sand control methods and finally the selection of the
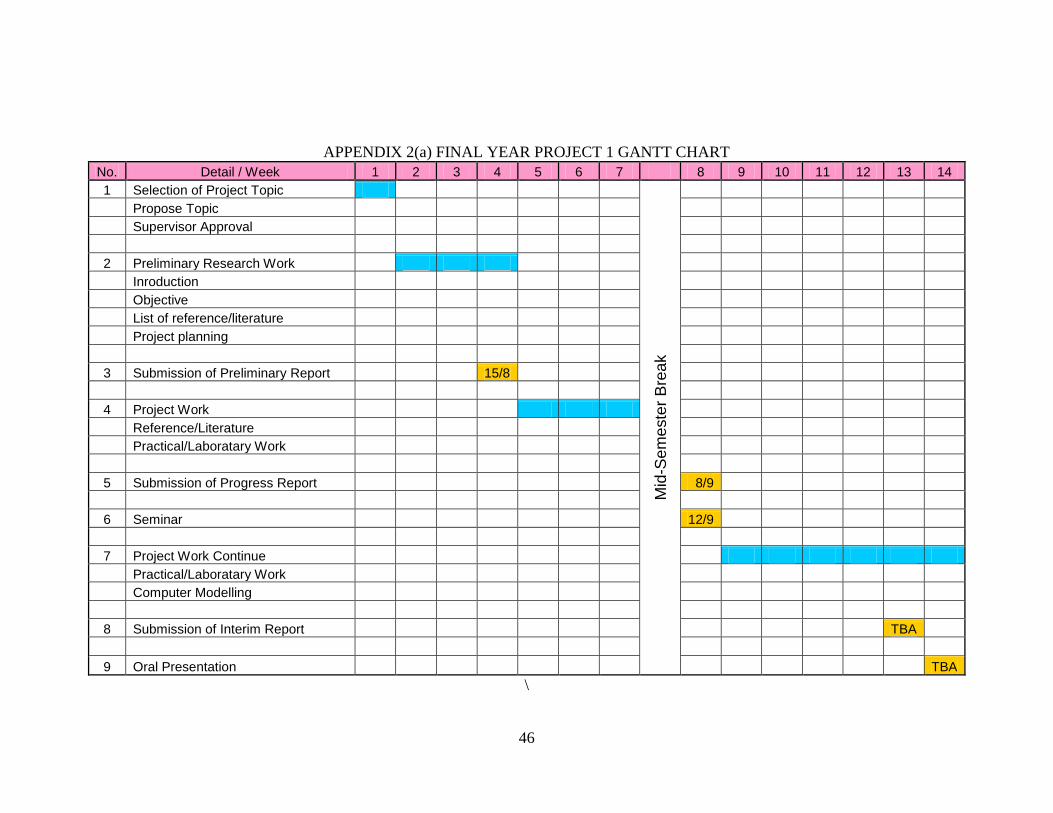
best methods to suits the objectives listed. The Gantt Chart for this project is available
in Appendix 2.
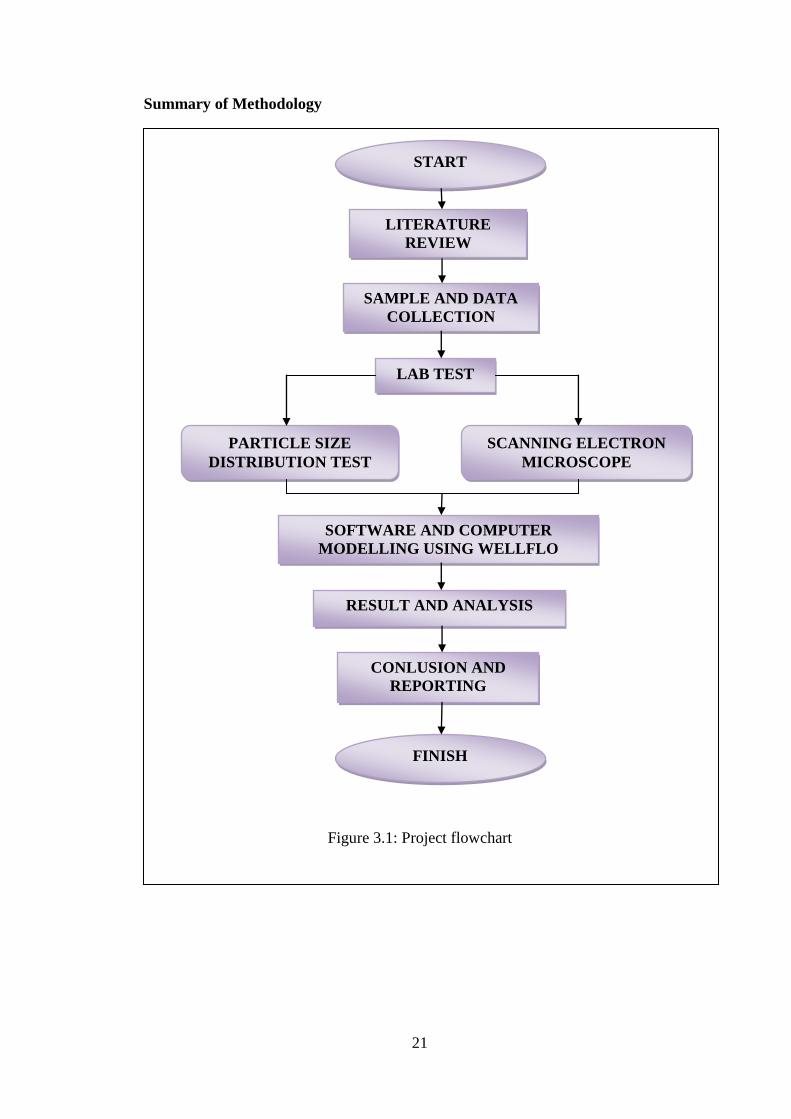
This project was divided into four main methodologies summarize in Figure 3.1.
3.1.1 Literature Review
a) Literature review of types of sand control method.
b) History on main sanding cases in Tukau.
c) Properties of formation.
d) Discuss with Tukau Production Technologist.
3.1.2 Laboratory Test and Experiment
a) Particle Size Distribution (PSD) Test on sample using Particle Size Analyzer
Machine.
b) Study on particle shape using Scanning Electron Microscope (SEM)

20
3.1.3 Computer Modeling and Simulation Work
a) Familiarization of available computer modeling software.
b) Calculate production performance through sand screens.
c) Gathering data of a specific reservoir with sanding cases.
3.1.4 Data Analysis and Report Preparation
a) Study the screens effectiveness in minimizing sanding problems.
b) Build clear comparisons based on the simulation between simulated sand-
control screen completion
c) Prepare final report.
21
FINISH
START
Summary of Methodology
Figure 3.1: Project flowchart
SAMPLE AND DATA
COLLECTION
LAB TEST
PARTICLE SIZE
DISTRIBUTION TEST
SCANNING ELECTRON
MICROSCOPE
SOFTWARE AND COMPUTER
MODELLING USING WELLFLO
RESULT AND ANALYSIS
CONLUSION AND
REPORTING
LITERATURE
REVIEW
22
3.2 TOOLS AND EQUIPMENT REQUIRED
The equipment required for this research would be the particle size analyzer or
sieving machine which is use to run the particle size distribution test and the Scanning
Electron Microscope (SEM) to analyze the particle shape. This project also required
computer software which was used to simulate and model the performance called
WellFloTM
. Other tools used for this project are the basic software used in computers
to produce the documentations.
3.3 SCANNING ELECTRON MICROSCOPE
The scanning electron microscope (SEM) is a type of electron microscope that images
the sample surface by scanning it with a high-energy beam of electrons in a raster
scan pattern. The electrons interact with the atoms that make up the sample producing
signals that contain information about the sample's surface topography, composition
and other properties such as electrical conductivity.
The types of signals produced by an SEM include secondary electrons, back scattered
electrons (BSE), characteristic x-rays, light, specimen current and transmitted
electrons. These types of signal all require specialized detectors for their detection
that are not usually all present on a single machine. The signals result from
interactions of the electron beam with atoms at or near the surface of the sample. In
the most common or standard detection mode, secondary electron imaging or SEI, the
SEM can produce very high-resolution images of a sample surface, revealing details
about 1 to 5 nm in size. Due to the way these images are created, SEM micrographs
have a very large depth of field yielding a characteristic three-dimensional appearance
useful for understanding the surface structure of a sample [17]
.
23
3.4 PARTICLE SIZE DISTRIBUTION TEST
Particle size distribution test was used to determine the physical makeup of samples
specifically the size in a sample. Commonly particle size distribution will measure
zeta potential, a measure of the magnitude of the repulsion or attraction between
particles [8]
. This test will use the sieving method. Sieving is an old fashioned, but
cheap and readily usable technique for large particles, such as those found in mining
and some food processing applications. It allows separation into some size bands if
required. Using this technique, it is not possible to measure sprays or emulsions, and
dry powders under 38mm are difficult. The longer the measurement times the smaller
the answer, as particles orient themselves to fall through the sieve.
The method use for this particle size distribution test is commonly using sieving
analysis. Petronas Research Sdn. Bhd. and Sarawak Shell Berhad are currently using
sieve analysis for the test. Sieve analysis requires 50g to 100g of the sand sample.
3.4.1 Sieve Analysis Procedure
The particle size distribution of a sample is determined by shaking the sample in a
prescribed manner through an appropriate succession on test sieves. Portion retained
on each sieve are collected separately and oven dried before the mass retained on each
sieve is measured [3]
.
i. Determine the mass of sand retain on each sieve (i.e., M1,M2, . . . Mn) and
in the pan (i.e., Mp).
ii. Determine the total mass of sand: M1 + M2 + Mi + . . . + Mn + Mp = M.
iii. Determine the cumulative mass of soil retained above each sieve. For the
ith sieve, it is M1 + M2 + . . . + Mi.
iv. The mass of soil passing the ith sieve is M - (M1 + M2 + . . . + Mi).
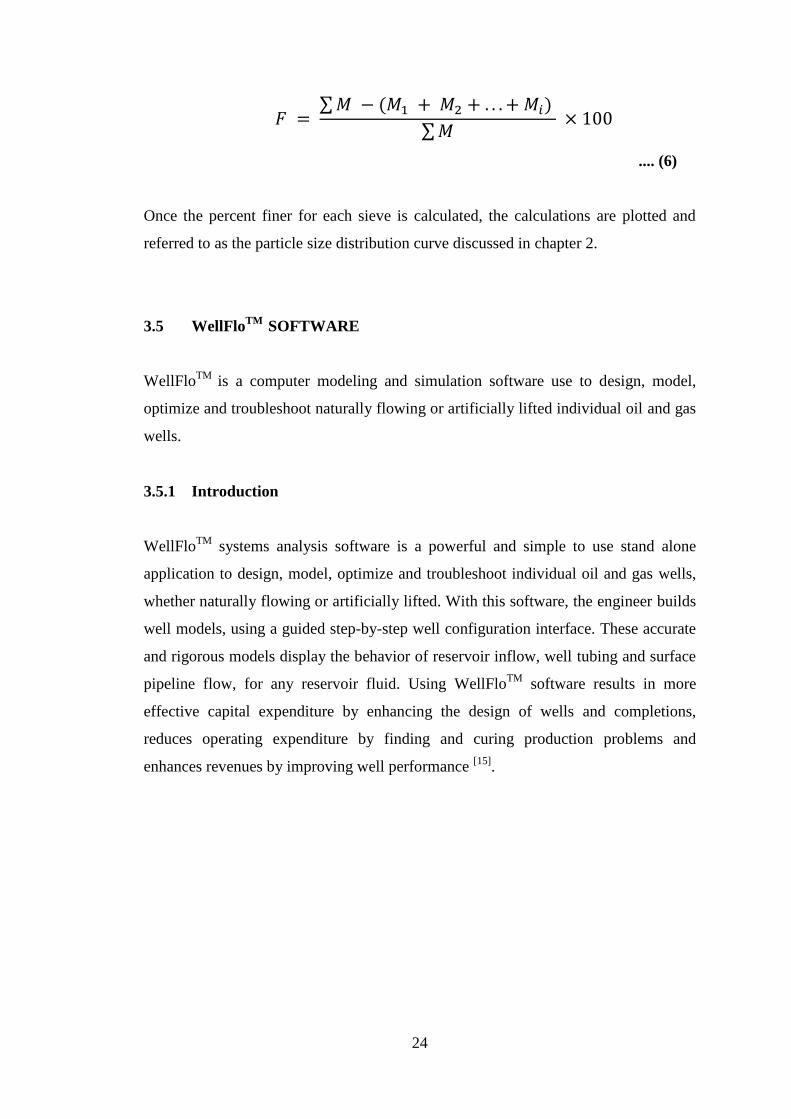
v. The percent of soil passing the ith sieve is:
24
.... (6)
Once the percent finer for each sieve is calculated, the calculations are plotted and
referred to as the particle size distribution curve discussed in chapter 2.
3.5 WellFloTM
SOFTWARE
WellFloTM
is a computer modeling and simulation software use to design, model,
optimize and troubleshoot naturally flowing or artificially lifted individual oil and gas
wells.
3.5.1 Introduction
WellFloTM
systems analysis software is a powerful and simple to use stand alone
application to design, model, optimize and troubleshoot individual oil and gas wells,
whether naturally flowing or artificially lifted. With this software, the engineer builds
well models, using a guided step-by-step well configuration interface. These accurate
and rigorous models display the behavior of reservoir inflow, well tubing and surface
pipeline flow, for any reservoir fluid. Using WellFloTM
software results in more
effective capital expenditure by enhancing the design of wells and completions,
reduces operating expenditure by finding and curing production problems and
enhances revenues by improving well performance [15]
.
25
3.5.2 Application
The WellFloTM
software package is a single well tool which uses nodal analysis
techniques to model reservoir inflow and well outflow performance. WellFloTM
modeling can be applied to designing, optimizing and troubleshooting individual
wells. Specific applications for which the software can be used include:
a) Well configuration design for maximum performance over life of well
b) Completion design to maximize well performance over the life of well
c) Artificial lift design
d) Prediction of flowing temperatures and pressures in wells and
flowlines and at surface equipment for optimum design calculations
e) Reservoir, well and flowline monitoring
f) Generate vertical lift performance curves for use in reservoir
simulators
As well as these applications, the software has two key internal sub-applications
which can be used stand alone from the rest of the program and offer the user an
excellent engineering toolkit.
a) Detailed reservoir inflow performance modeling
i. Multiple completion and perforation models
ii. Detailed skin analysis
b) Detailed fluid PVT modeling
i. Black oil models for oil and gas
ii. Equation of State models for condensate and volatile oil
iii. Laboratory data matching
iv. Fluid behavior prediction
26
CHAPTER 4
RESULTS AND DISCUSSION
4.1 SAND PRODUCTION FACTORS
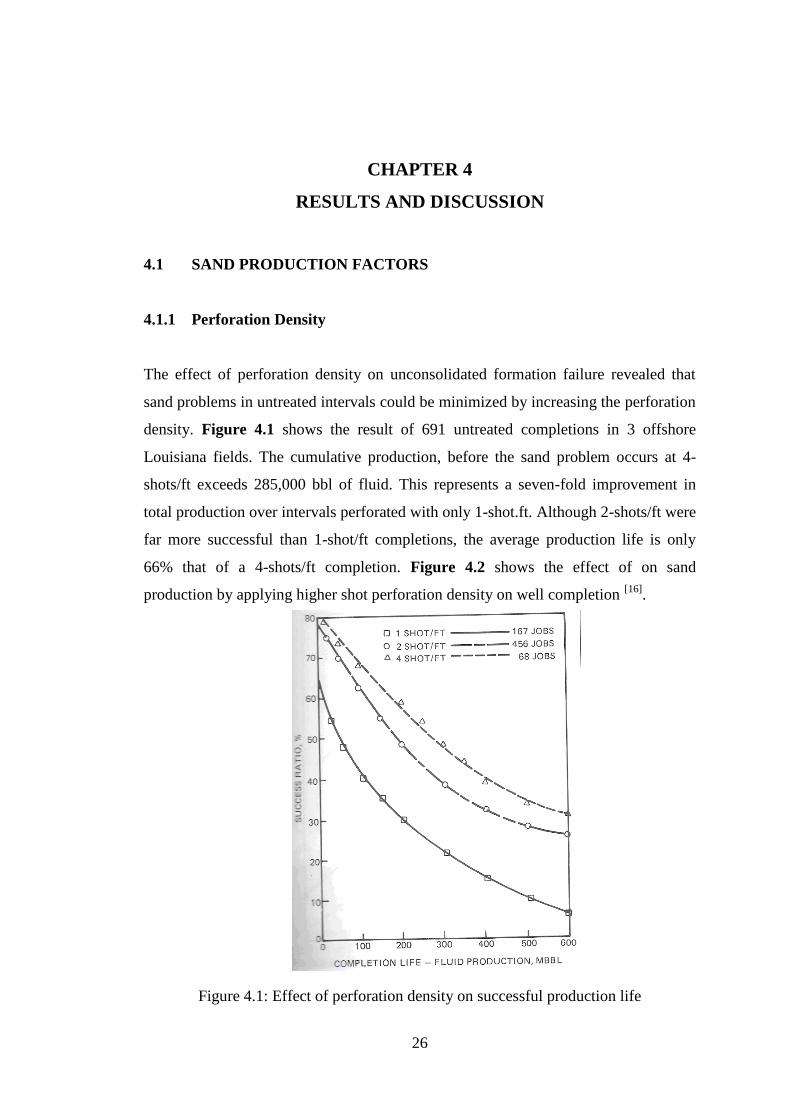
4.1.1 Perforation Density
The effect of perforation density on unconsolidated formation failure revealed that
sand problems in untreated intervals could be minimized by increasing the perforation
density. Figure 4.1 shows the result of 691 untreated completions in 3 offshore
Louisiana fields. The cumulative production, before the sand problem occurs at 4-
shots/ft exceeds 285,000 bbl of fluid. This represents a seven-fold improvement in
total production over intervals perforated with only 1-shot.ft. Although 2-shots/ft were
far more successful than 1-shot/ft completions, the average production life is only
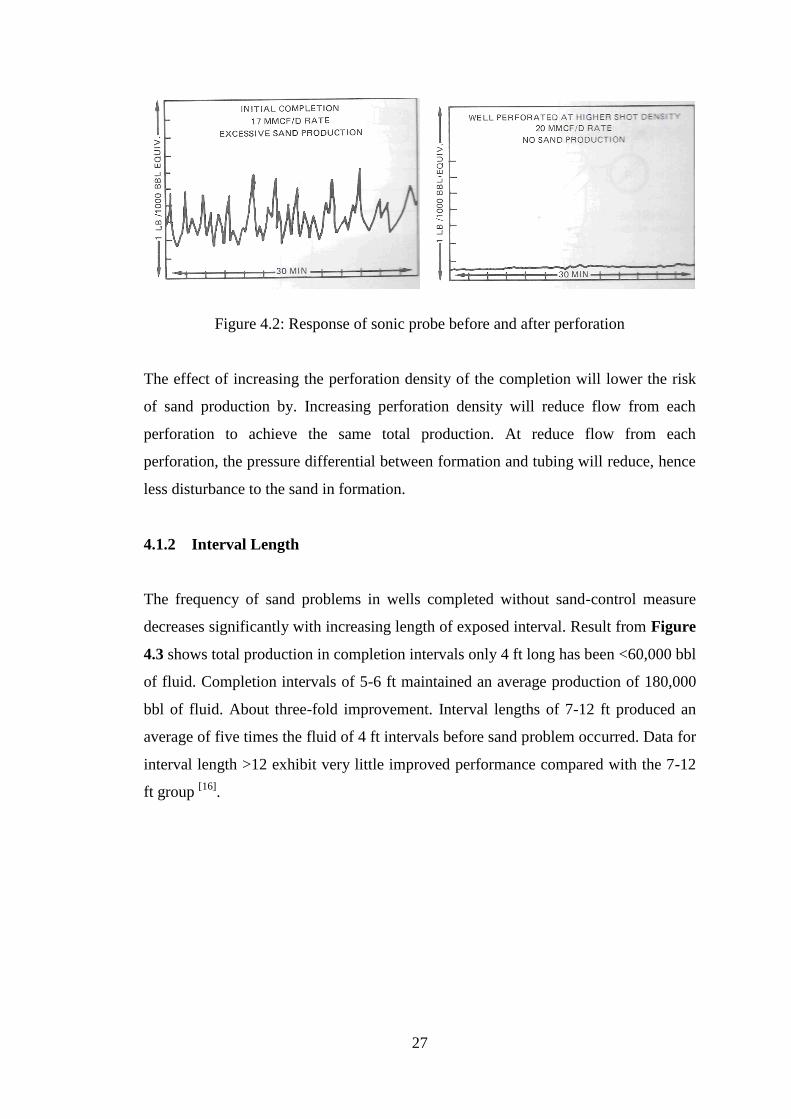
66% that of a 4-shots/ft completion. Figure 4.2 shows the effect of on sand
production by applying higher shot perforation density on well completion [16]
.
Figure 4.1: Effect of perforation density on successful production life
27
Figure 4.2: Response of sonic probe before and after perforation
The effect of increasing the perforation density of the completion will lower the risk
of sand production by. Increasing perforation density will reduce flow from each
perforation to achieve the same total production. At reduce flow from each
perforation, the pressure differential between formation and tubing will reduce, hence
less disturbance to the sand in formation.
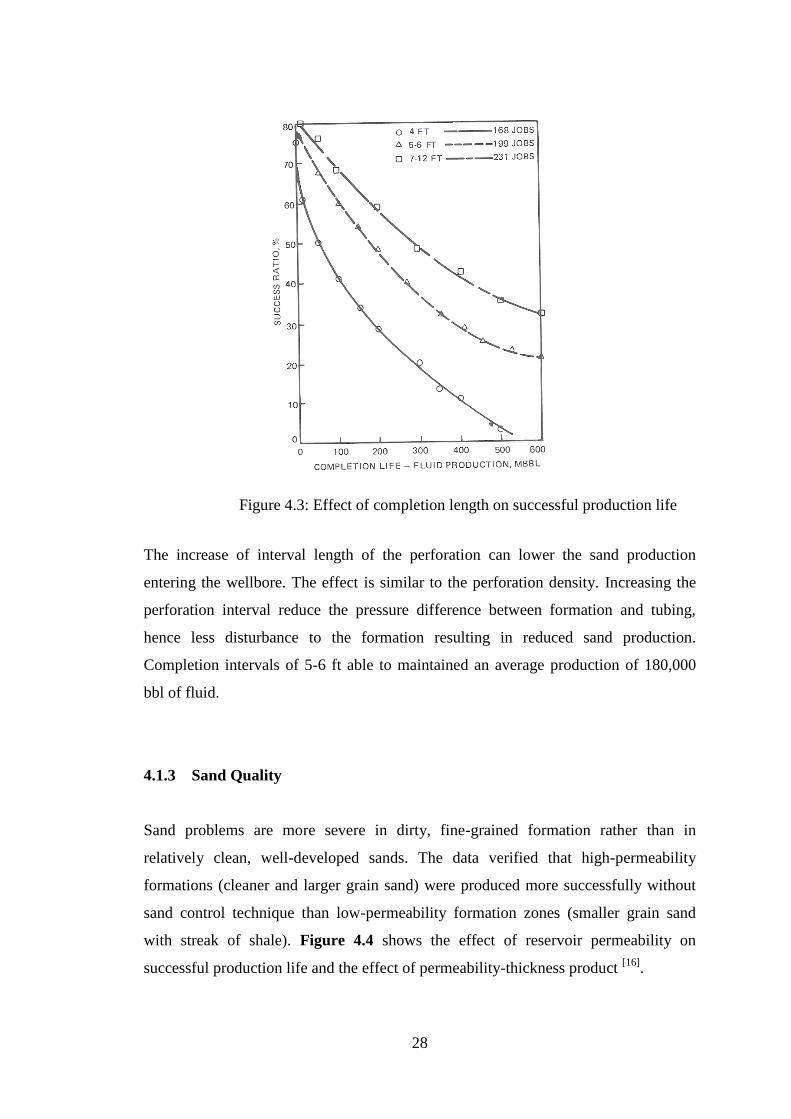
4.1.2 Interval Length
The frequency of sand problems in wells completed without sand-control measure
decreases significantly with increasing length of exposed interval. Result from Figure
4.3 shows total production in completion intervals only 4 ft long has been <60,000 bbl
of fluid. Completion intervals of 5-6 ft maintained an average production of 180,000
bbl of fluid. About three-fold improvement. Interval lengths of 7-12 ft produced an
average of five times the fluid of 4 ft intervals before sand problem occurred. Data for
interval length >12 exhibit very little improved performance compared with the 7-12
ft group [16]
.
28
Figure 4.3: Effect of completion length on successful production life
The increase of interval length of the perforation can lower the sand production
entering the wellbore. The effect is similar to the perforation density. Increasing the
perforation interval reduce the pressure difference between formation and tubing,
hence less disturbance to the formation resulting in reduced sand production.
Completion intervals of 5-6 ft able to maintained an average production of 180,000
bbl of fluid.
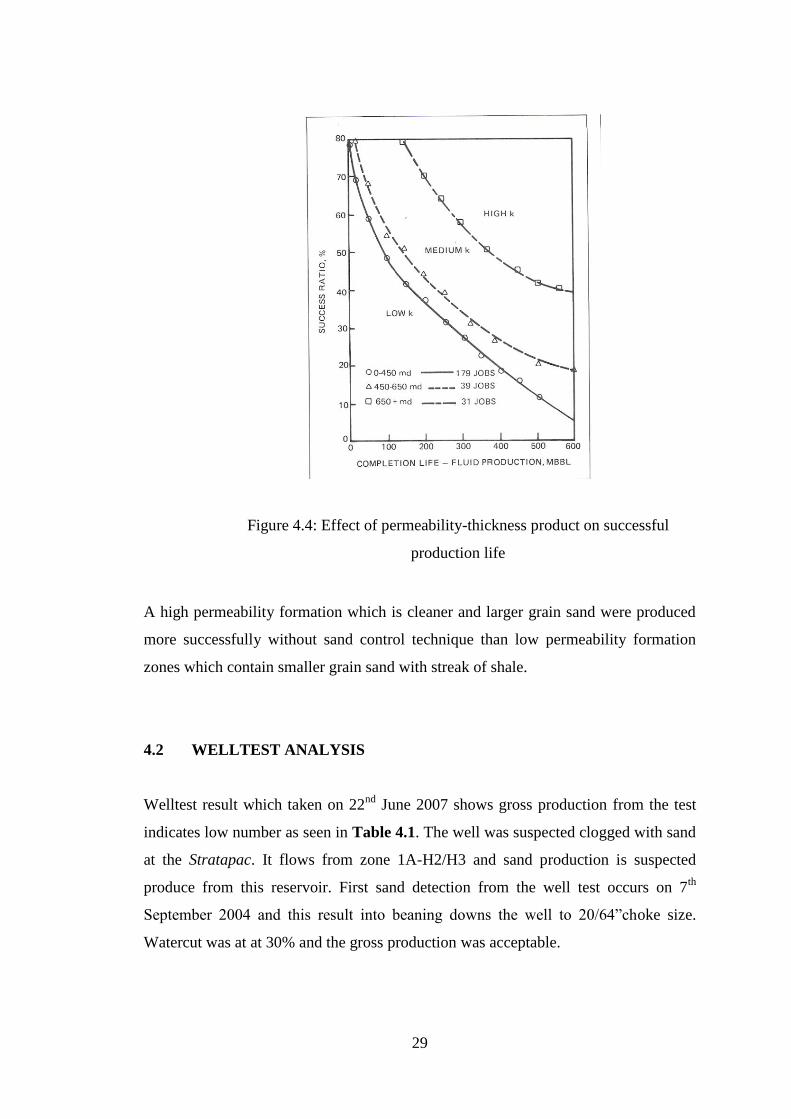
4.1.3 Sand Quality
Sand problems are more severe in dirty, fine-grained formation rather than in
relatively clean, well-developed sands. The data verified that high-permeability
formations (cleaner and larger grain sand) were produced more successfully without
sand control technique than low-permeability formation zones (smaller grain sand
with streak of shale). Figure 4.4 shows the effect of reservoir permeability on
successful production life and the effect of permeability-thickness product [16]
.
29
Figure 4.4: Effect of permeability-thickness product on successful
production life
A high permeability formation which is cleaner and larger grain sand were produced
more successfully without sand control technique than low permeability formation
zones which contain smaller grain sand with streak of shale.
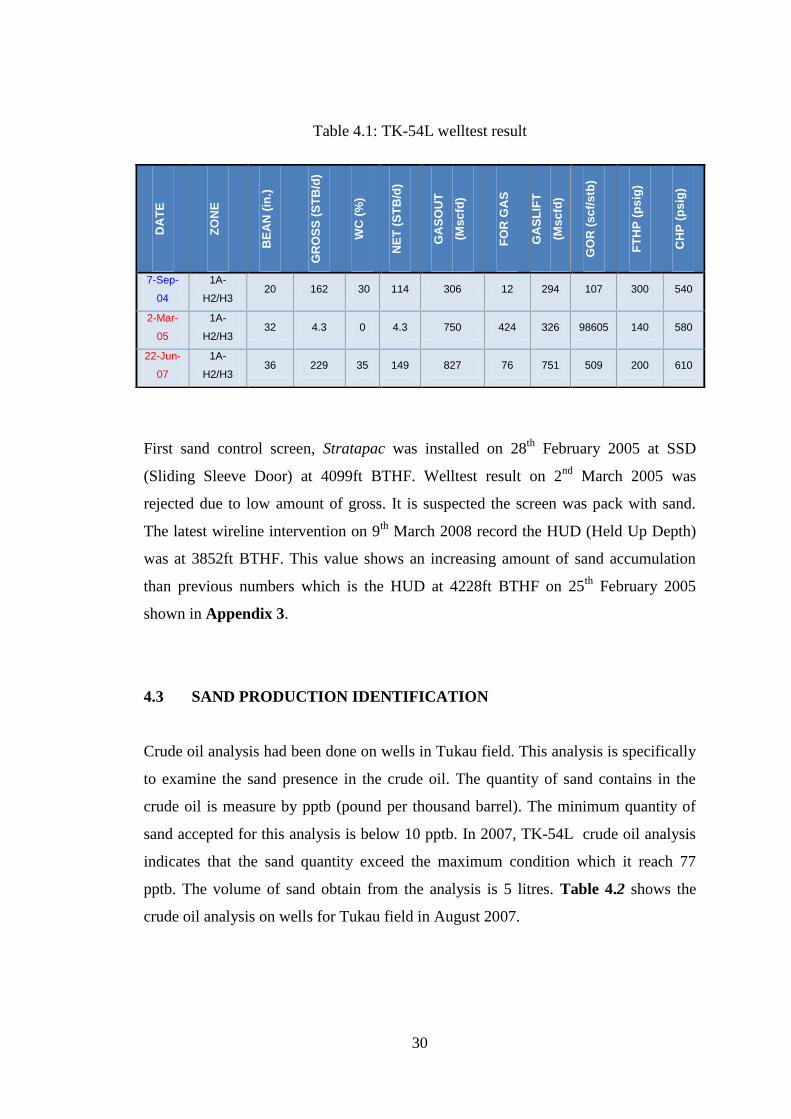
4.2 WELLTEST ANALYSIS
Welltest result which taken on 22nd
June 2007 shows gross production from the test
indicates low number as seen in Table 4.1. The well was suspected clogged with sand
at the Stratapac. It flows from zone 1A-H2/H3 and sand production is suspected
produce from this reservoir. First sand detection from the well test occurs on 7th
September 2004 and this result into beaning downs the well to 20/64”choke size.
Watercut was at at 30% and the gross production was acceptable.
30
Table 4.1: TK-54L welltest result
First sand control screen, Stratapac was installed on 28th
February 2005 at SSD
(Sliding Sleeve Door) at 4099ft BTHF. Welltest result on 2nd
March 2005 was
rejected due to low amount of gross. It is suspected the screen was pack with sand.
The latest wireline intervention on 9th
March 2008 record the HUD (Held Up Depth)
was at 3852ft BTHF. This value shows an increasing amount of sand accumulation
than previous numbers which is the HUD at 4228ft BTHF on 25th
February 2005
shown in Appendix 3.
4.3 SAND PRODUCTION IDENTIFICATION
Crude oil analysis had been done on wells in Tukau field. This analysis is specifically
to examine the sand presence in the crude oil. The quantity of sand contains in the
crude oil is measure by pptb (pound per thousand barrel). The minimum quantity of
sand accepted for this analysis is below 10 pptb. In 2007, TK-54L crude oil analysis
indicates that the sand quantity exceed the maximum condition which it reach 77
pptb. The volume of sand obtain from the analysis is 5 litres. Table 4.2 shows the
crude oil analysis on wells for Tukau field in August 2007.
DA
TE
ZO
NE
BE
AN
(in
.)
GR
OS
S (
ST
B/d
)
WC
(%
)
NE
T (
ST
B/d
)
GA
SO
UT
(Ms
cfd
)
FO
R G
AS
GA
SL
IFT
(Ms
cfd
)
GO
R (
sc
f/s
tb)
FT
HP
(p
sig
)
CH
P (
ps
ig)
7-Sep-
04
1A-
H2/H3 20 162 30 114 306 12 294 107 300 540
2-Mar-
05
1A-
H2/H3 32 4.3 0 4.3 750 424 326 98605 140 580
22-Jun-
07
1A-
H2/H3 36 229 35 149 827 76 751 509 200 610
31
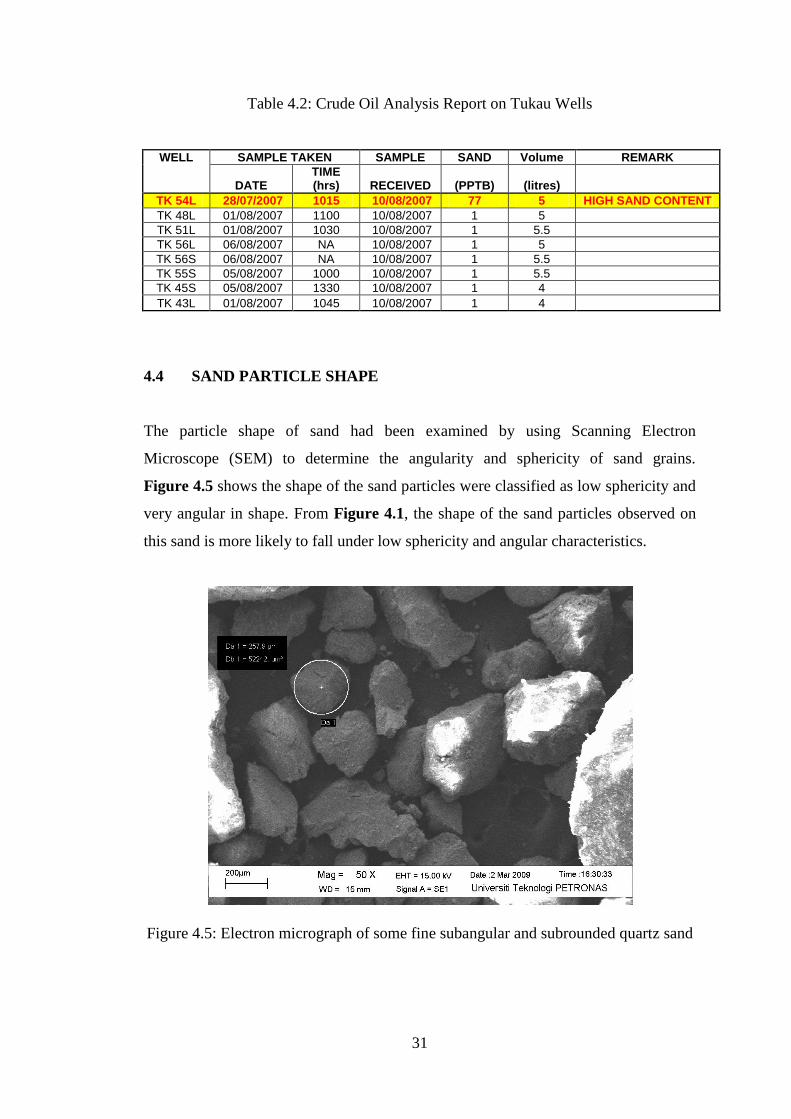
Table 4.2: Crude Oil Analysis Report on Tukau Wells
WELL SAMPLE TAKEN SAMPLE SAND Volume REMARK
DATE TIME (hrs) RECEIVED (PPTB) (litres)
TK 54L 28/07/2007 1015 10/08/2007 77 5 HIGH SAND CONTENT
TK 48L 01/08/2007 1100 10/08/2007 1 5
TK 51L 01/08/2007 1030 10/08/2007 1 5.5
TK 56L 06/08/2007 NA 10/08/2007 1 5
TK 56S 06/08/2007 NA 10/08/2007 1 5.5
TK 55S 05/08/2007 1000 10/08/2007 1 5.5
TK 45S 05/08/2007 1330 10/08/2007 1 4
TK 43L 01/08/2007 1045 10/08/2007 1 4
4.4 SAND PARTICLE SHAPE
The particle shape of sand had been examined by using Scanning Electron
Microscope (SEM) to determine the angularity and sphericity of sand grains.
Figure 4.5 shows the shape of the sand particles were classified as low sphericity and
very angular in shape. From Figure 4.1, the shape of the sand particles observed on
this sand is more likely to fall under low sphericity and angular characteristics.
Figure 4.5: Electron micrograph of some fine subangular and subrounded quartz sand
32
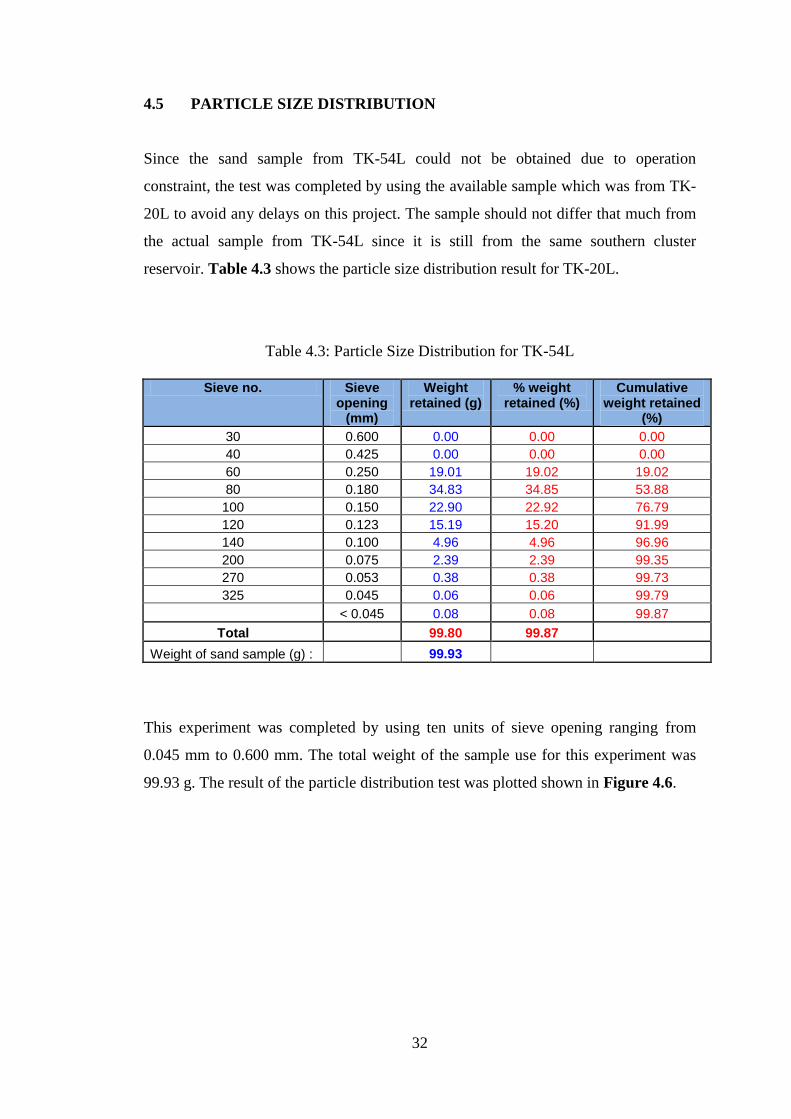
4.5 PARTICLE SIZE DISTRIBUTION
Since the sand sample from TK-54L could not be obtained due to operation
constraint, the test was completed by using the available sample which was from TK-
20L to avoid any delays on this project. The sample should not differ that much from
the actual sample from TK-54L since it is still from the same southern cluster
reservoir. Table 4.3 shows the particle size distribution result for TK-20L.
Table 4.3: Particle Size Distribution for TK-54L
Sieve no. Sieve
opening (mm)
Weight retained (g)
% weight retained (%)
Cumulative weight retained
(%)
30 0.600 0.00 0.00 0.00
40 0.425 0.00 0.00 0.00
60 0.250 19.01 19.02 19.02
80 0.180 34.83 34.85 53.88
100 0.150 22.90 22.92 76.79
120 0.123 15.19 15.20 91.99
140 0.100 4.96 4.96 96.96
200 0.075 2.39 2.39 99.35
270 0.053 0.38 0.38 99.73
325 0.045 0.06 0.06 99.79
< 0.045 0.08 0.08 99.87
Total 99.80 99.87
Weight of sand sample (g) : 99.93
This experiment was completed by using ten units of sieve opening ranging from
0.045 mm to 0.600 mm. The total weight of the sample use for this experiment was
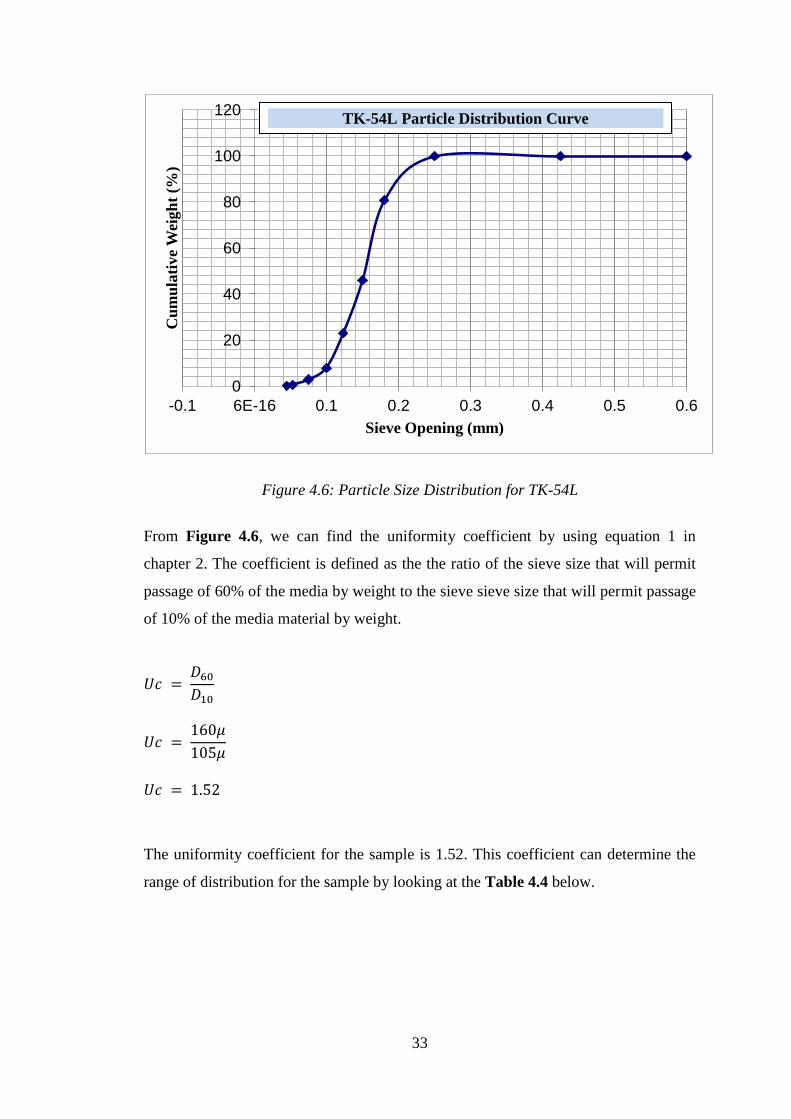
99.93 g. The result of the particle distribution test was plotted shown in Figure 4.6.
33
Figure 4.6: Particle Size Distribution for TK-54L
From Figure 4.6, we can find the uniformity coefficient by using equation 1 in
chapter 2. The coefficient is defined as the the ratio of the sieve size that will permit
passage of 60% of the media by weight to the sieve sieve size that will permit passage
of 10% of the media material by weight.
The uniformity coefficient for the sample is 1.52. This coefficient can determine the
range of distribution for the sample by looking at the Table 4.4 below.
0
20
40
60
80
100
120
-0.1 6E-16 0.1 0.2 0.3 0.4 0.5 0.6
Cu
mu
lati
ve
Wei
gh
t (%
)
Sieve Opening (mm)
TK-54L Particle Distribution Curve
34
Table 4.4: Uniformity Coefficient Classification
Uc Sand Distribution
Uc < 3 Highly Uniform Sand
3 < Uc < 5 Uniform Sand
5< Uc < 10 Non-Uniform Sand
Uc > 10 Highly Non-Uniform Sand
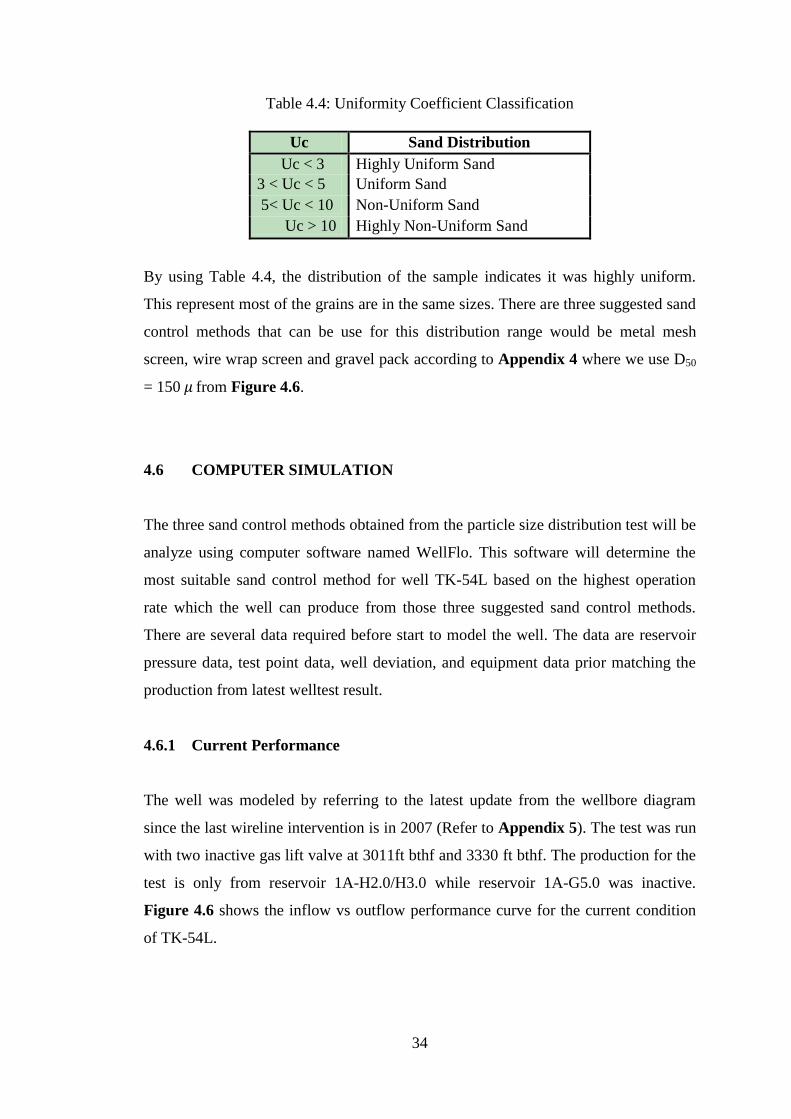
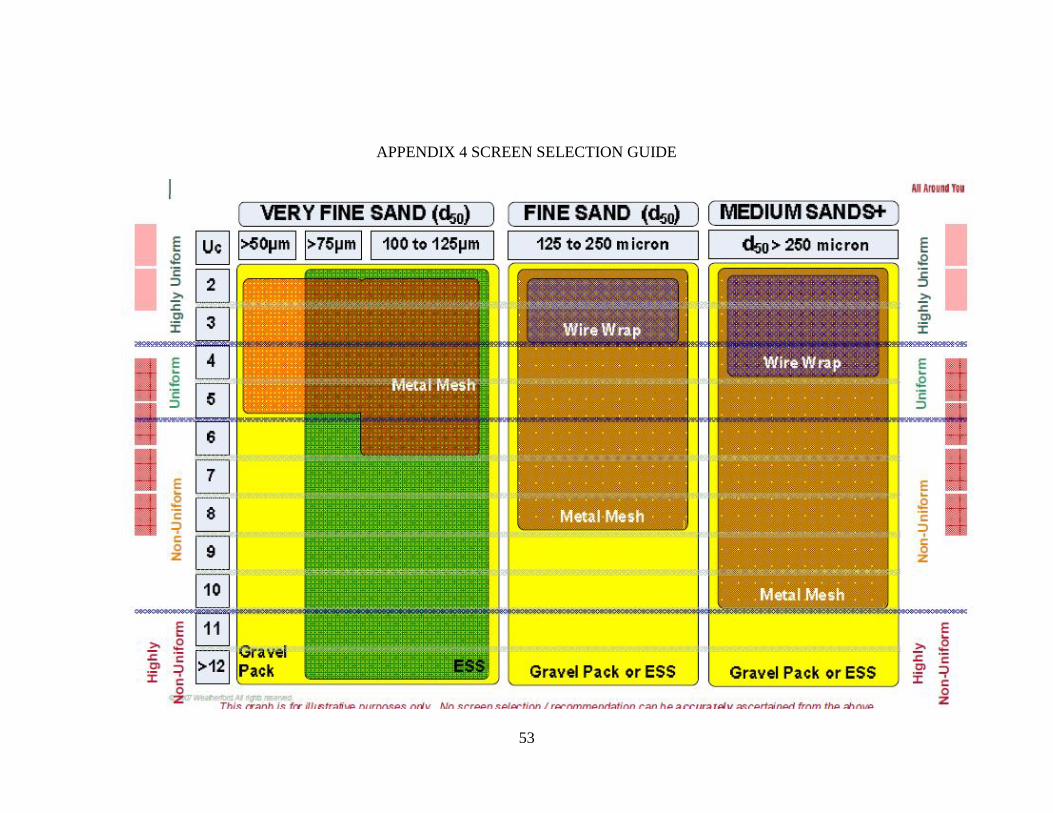
By using Table 4.4, the distribution of the sample indicates it was highly uniform.
This represent most of the grains are in the same sizes. There are three suggested sand
control methods that can be use for this distribution range would be metal mesh
screen, wire wrap screen and gravel pack according to Appendix 4 where we use D50
= 150 from Figure 4.6.
4.6 COMPUTER SIMULATION
The three sand control methods obtained from the particle size distribution test will be
analyze using computer software named WellFlo. This software will determine the
most suitable sand control method for well TK-54L based on the highest operation
rate which the well can produce from those three suggested sand control methods.
There are several data required before start to model the well. The data are reservoir
pressure data, test point data, well deviation, and equipment data prior matching the
production from latest welltest result.
4.6.1 Current Performance
The well was modeled by referring to the latest update from the wellbore diagram
since the last wireline intervention is in 2007 (Refer to Appendix 5). The test was run
with two inactive gas lift valve at 3011ft bthf and 3330 ft bthf. The production for the
test is only from reservoir 1A-H2.0/H3.0 while reservoir 1A-G5.0 was inactive.
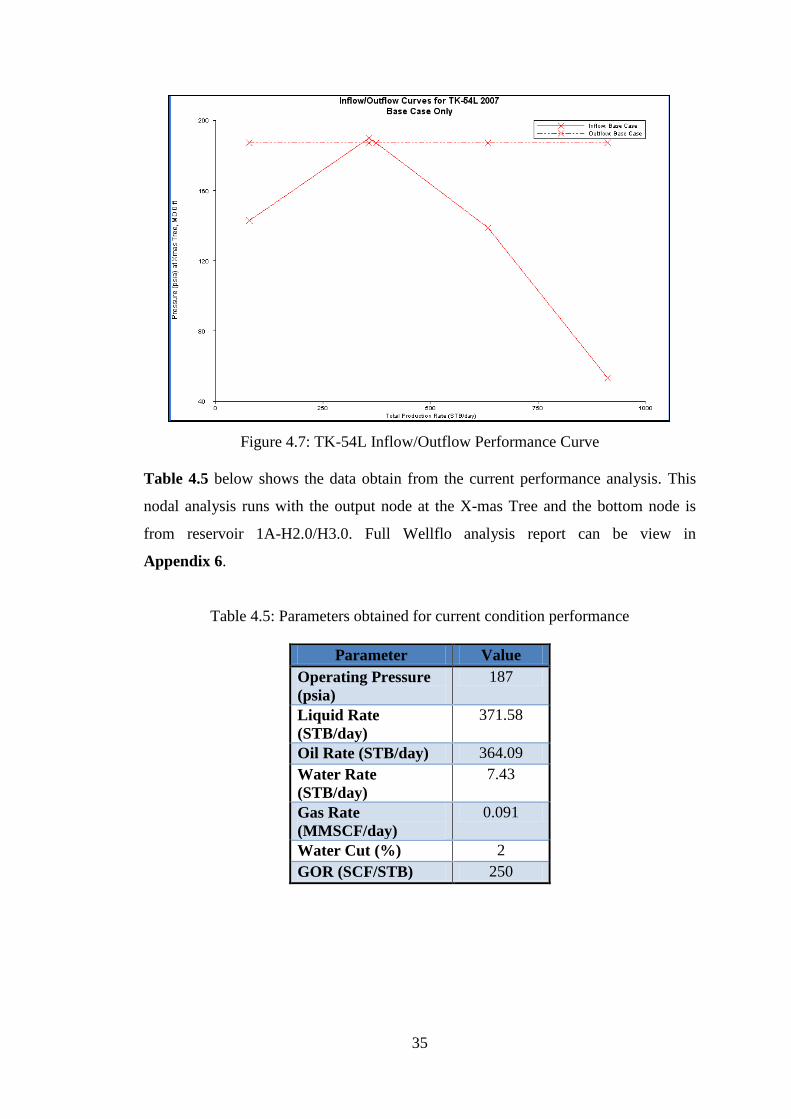
Figure 4.6 shows the inflow vs outflow performance curve for the current condition
of TK-54L.
35
Figure 4.7: TK-54L Inflow/Outflow Performance Curve
Table 4.5 below shows the data obtain from the current performance analysis. This
nodal analysis runs with the output node at the X-mas Tree and the bottom node is
from reservoir 1A-H2.0/H3.0. Full Wellflo analysis report can be view in
Appendix 6.
Table 4.5: Parameters obtained for current condition performance
Parameter Value
Operating Pressure
(psia)
187
Liquid Rate
(STB/day)
371.58
Oil Rate (STB/day) 364.09
Water Rate
(STB/day)
7.43
Gas Rate
(MMSCF/day)
0.091
Water Cut (%) 2
GOR (SCF/STB) 250
36
4.6.2 Sensitivity Analysis
This analysis objective is to determine the operating rate which is the gross liquid
produce from the well with respect to different skin values for each sand control
methods. The skin value consider for this research is ranging from -2 to 15 with 9
steps increment. Other parameters for this analysis would such as the reservoir
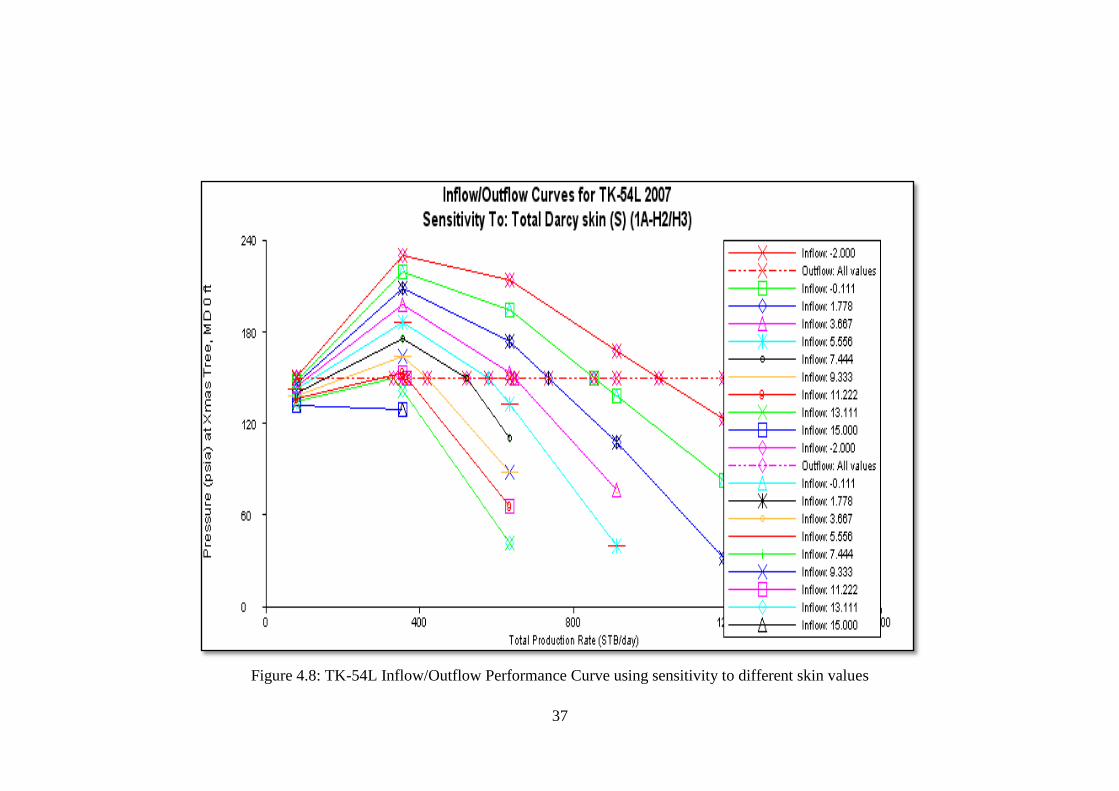
pressure, reservoir temperature and liquid properties remain unchanged. Figure 4.8
shows the inflow vs outflow performance curve for TK-54L with respect to different
skin value.
The curve shows that the increment of skin value will result in lowering the output
performance of the well. Since there are three sand control method options choosen
from the particle distribution test which are metal mesh screen, wire wrap screen and
gravel pack, three estimated skin value will be selected. Full Wellflo analysis report
can be view in Appendix 7. The trending for the operating rate which respect to the
respective skin value is shown in Figure 4.9.
37
Figure 4.8: TK-54L Inflow/Outflow Performance Curve using sensitivity to different skin values
38
Figure 4.9: Operating Rate vs Total Skin for Well TK-54L
The uniformity coefficient obtained from the particle distribution test shows that the
distribution of the sand particle is highly uniform. This represent most of the grains
were in the same sizes. For this type of sand distribution, the selection of the sand
control methods had been narrowed down according to the sand distribution of the
reservoir. For Uc < 3 and D50 = 150 , the sand control methods which can be applied
are wire wrap screen, metal mesh screen and gravel pack. Software simulation and
modeling using WellFlo shows that wire wrap screen can deliver the highest operating
rate which is at 645.98 STB/day.
4.7 PERFORMANCE COMPARISON
The three sand control method applications which are selected for this project will be
selected based on the operation rate which each sand control method can deliver.
Figure 4.10 shows the comparison for each sand control methods with their
respective operating rate. From the chart, sand control method using wire mesh shows
the highest operating rate which is at 645.98 STB/day. This method can increase the
current production for well TK-54L which is at average production 180 STB/day up
to three times higher.
0
200
400
600
800
1000
1200
-2.00 -0.11 1.78 3.67 5.56 7.44 9.33 11.22 13.11 15.00
Op
era
tin
g R
ate
(ST
B/d
ay)
Total Skin
Operating Rate vs Total Skin
39
Figure 4.10: Sand Control Options vs Operating Rate
Selection of the sand control technique on well TK-54L were made by considering the
thin reservoir boundaries, median grain size (D50), sand distribution (D60/D10) and the
operating rate which is net to gross ratio. Due to the highest operating rate which the
wire wrap screen can deliver, this method was selected as the sand control method for
TK-54L. Wire wrap screen was also selected because of this method is economically
feasible compare to gravel pack where workover operation need to be include in the
cost estimation.
0
100
200
300
400
500
600
700
Current Wire Wrap Metal Mesh Gravel Pack
Op
era
tin
g R
ate
(ST
B/d
ay)
Sand Control Options
Sand Control Options vs Operating Rate
40
CHAPTER 5
CONLUSIONS AND RECOMENDATIONS
5.1 CONCLUSIONS
The following conclusions could be drawn from the study.
a) Most of the wells in Tukau were completed without any sand control method
installed. This is due to the high permeability formation which is cleaner and
larger sand grains were produced during the early stages of exploration and
production.
b) Throughout the production life of the well, the sand production in Tukau wells
comes from the failure in the overlying rock inside the reservoir. It occurs
when stress acting on the wellbore exceeds the strength of the overlying rock
in the reservoir. This results into two types of rock failure which are shear and
tensile failure.
c) Wire wrap screen is selected as the alternative sand control method for well
TK-54L. The expected production by using this method would be 645.98
STB/day which is 3.5 times increment from the current installed sand control.
d) This method also is economically feasible because it is a through tubing screen
method compare to gravel pack where workover operation is required.

41
5.2 RECOMENDATIONS
The study could be improved on the sand control selection if the following test could
be carry on in the future.
a) Considering the due date and lack of data of this project it is advisable that the
scope of work is lessen to only up to the selection of the sand control method.
It is suggested that further analysis on wire wrap screen should be conducted.
b) It is found that analysis the performance of sand control technique with only
computer software is difficult and would be best performed through analyzing
the performance of real well. The only way in this project to analyze is
through statistical report on nearby well such TK-20L which possessed the
same properties with the reservoir and well.
c) Sand control on surface such as the sand desander could also be considered if
the wire wrap screen installed shown to be ineffective.
d) However further analysis on its feasibility and economic aspects to implement
this method on this field must be conducted.
42
REFFERENCES
[1] About Particle Size Analyzers, from the World Wide Web:
http://testequipment.globalspec.com/LearnMore/Labware_Test_Measurem
ent
[2] Associate Professor Aung Kyaw, (2008).” Well Interventions”, MAB 4646
Drilling and Production Technology, University Technology of
PETRONAS.
[3] Braja M. Das, (2002). “Origin of Soil and Grain Size”, Principles of
Geotechnical Engineering, Fifth Edition, California State University,
Sacramento.
[4] Choo Der Jium, (January 2008). “Coiled Tubing Recommendation Rev.
2.1”, BJ Oilwell Services (M) Sdn Bhd.
[5] Collin Mc Phee and Adrian Slayter, (December 2004). “Sand Management
Training, Petronas Carigali Sdn Bhd”.
[6] Dr Samuel Osisanya and Dr. Nor Azlan Nordin. “Sand Control and
Management – Field Guidelines Manual”.
[7] Innovative expandable sand screen system, from the World Wide Web:
http://www.offshoremag.com/display_article/173945/9/ARCHI/none/none/1
[8] M.R Kabir, M.Z. Awang, L. Umar, N. Omar and K.Yusof, (2003). “First
Successful Implementation Of Expandable Sand Screen (ESS®)
Technology In An Open Hole Horizontal Well Located In Baram Field”
SPE 84914.
[9] Mark Van Domelen, Wes Ritter, and David Hammeke, (March 2000)
“Fracpack Completions in Deepwater/High-Permeability Reservoirs”
43
[10] P. Harold Parker Jr., B. R. Treadway, H. Brandt, (March 2003). “Applied
Polymer Science”.
[11] Sand Production, from the World Wide Web:
http://www.ep-solutions.com/Solutions/Consult/Sand_Production.htm
[12] Sand Production. Production Operations, Petronas Carigali Sdn. Bhd.
[13] Schlumberger Oilfield Glossary, from the World Wide Web:
http://www.glossary.oilfield.slb.com/
[14] Weatherford Completion System, (2000). “Stratapac and Stratacoil
Screens”. Houston, Texas 77027 USA.
[15] Weatherford (2008). “WellFloTM
Petroleum Engineering Software”.
Houston, Texas 77027 USA.
[16] W.L. Penberthy Jr. & C.M. Shaugnessy. (1997) SPE Series on Special
Topics, Sand Control. Society of Petroleum Engineers.
[17] Scanning Electron Microscope, from the World Wide Web:
http://en.wikipedia.org/wiki/Scanning_electron_microscope
[18] Brian Scott (July 2007). Weatherford Well Screen, “Selection Process –
Sand Control Solutions”.
.
44
APPENDICES
1. Appendix 1: TK-54 Wellbore Diagram
2. Appendix 2: Gantt Chart
a) Final Year Project I
b) Final Year Project II
3. Appendix 3: Welltest Result
a) Gross/Net/Bean Profile
b) Gross/Net/Bean Profile II
c) Gasout/Gaslift Profile
d) FTHP/CHP/GOR Profile
e) Gross/Net/WC Profile
4. Appendix 4: Screen Selection Guide
5. Appendix 5: TK-54L Well Model
6. Appendix 5: WellFlo Analysis Report - Current
7. Appendix 7: WellFlo Analysis Report – Sensitivity to Total Skin
45
APPENDIX 1 TK-54L WELLBORE DIAGRAM
46
APPENDIX 2(a) FINAL YEAR PROJECT 1 GANTT CHART
No. Detail / Week 1 2 3 4 5 6 7 8 9 10 11 12 13 14
1 Selection of Project Topic
Mid
-Se
me
ste
r B
rea
k
Propose Topic
Supervisor Approval
2 Preliminary Research Work
Inroduction
Objective
List of reference/literature
Project planning
3 Submission of Preliminary Report 15/8
4 Project Work
Reference/Literature
Practical/Laboratary Work
5 Submission of Progress Report 8/9
6 Seminar 12/9
7 Project Work Continue
Practical/Laboratary Work
Computer Modelling
8 Submission of Interim Report TBA
9 Oral Presentation TBA
\

47
APPENDIX 2(b) FINAL YEAR PROJECT II GANTT CHART
No. Detail/ Week 1 2 3 4 5 6 7 8 9 10 11 12 13 14
1 Project Work Continue
2 Submission of Progress Report 1
3 Project Work Continue
4 Submission of Progress Report 2
5 Seminar (compulsory)
5 Project work continue
6 Poster Exhibition
7 Submission of Dissertation (soft bound)
8 Oral Presentation
9 Submission of Project Dissertation (Hard
Bound)
1
Mid
-Sem
este
r B
reak
48
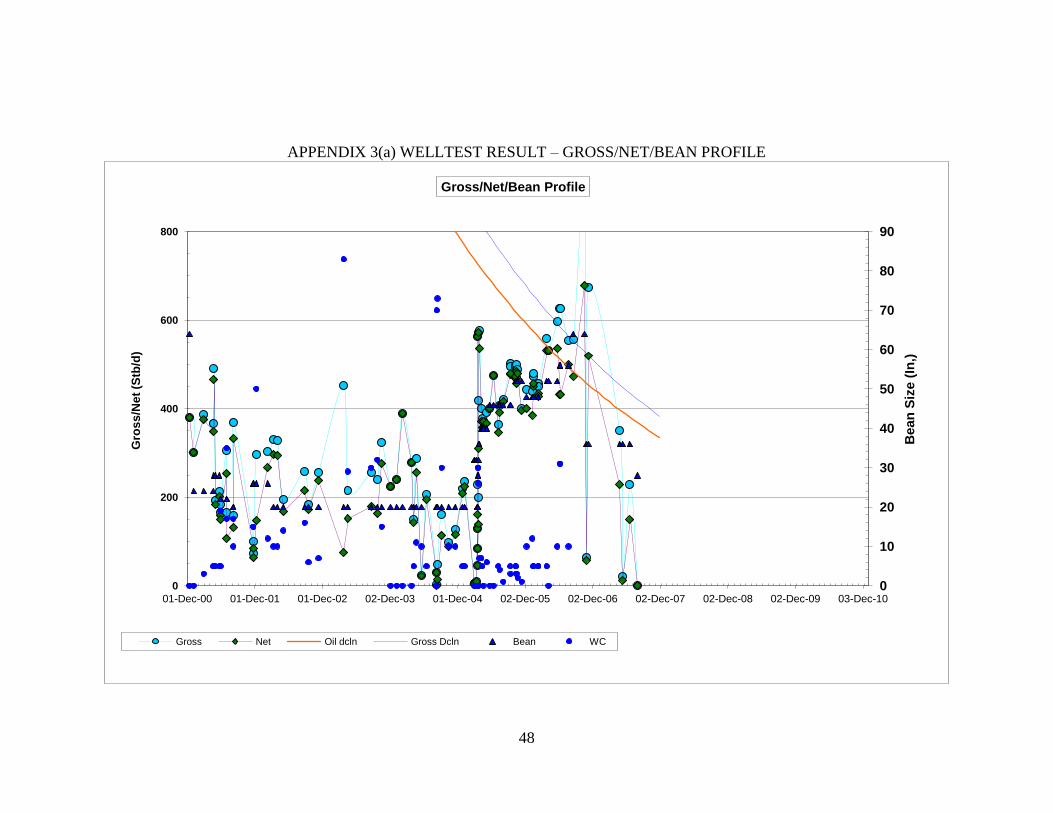
APPENDIX 3(a) WELLTEST RESULT – GROSS/NET/BEAN PROFILE
0
10
20
30
40
50
60
70
80
90
0
200
400
600
800
01-Dec-00 01-Dec-01 01-Dec-02 02-Dec-03 01-Dec-04 02-Dec-05 02-Dec-06 02-Dec-07 02-Dec-08 02-Dec-09 03-Dec-10
Bean
Siz
e (
In,)
Gro
ss
/Ne
t (S
tb/d
)
Gross/Net/Bean Profile
Gross Net Oil dcln Gross Dcln Bean WC
49
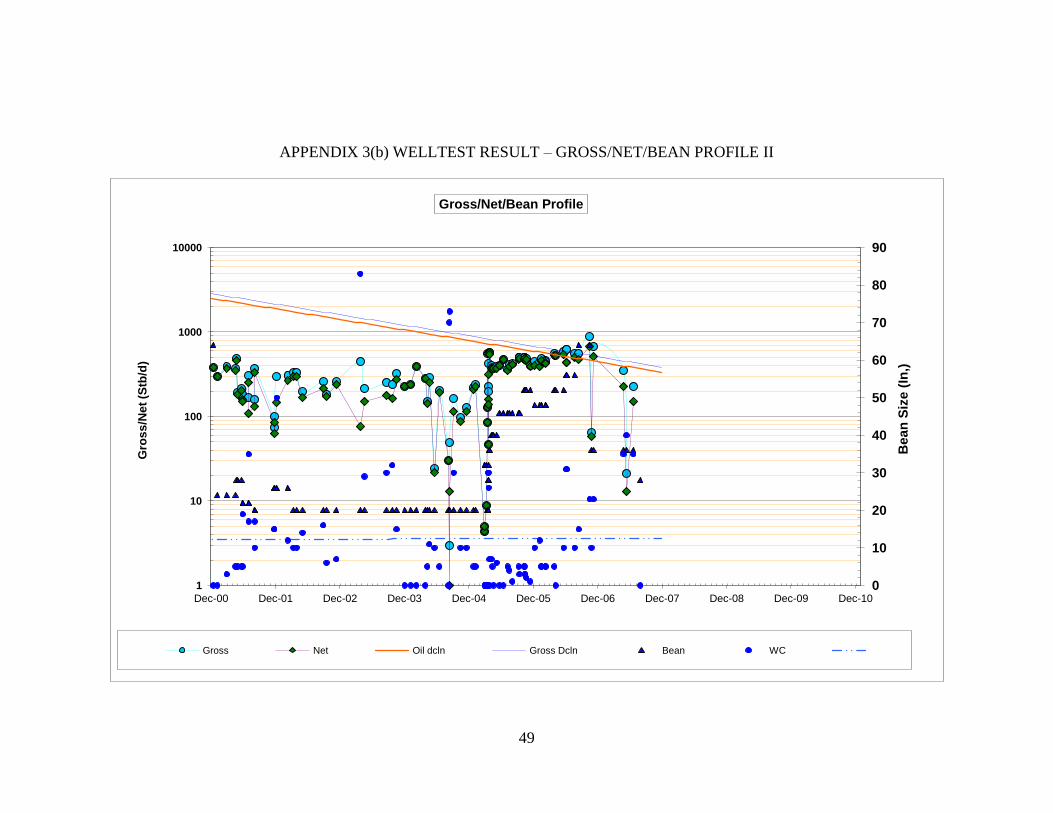
APPENDIX 3(b) WELLTEST RESULT – GROSS/NET/BEAN PROFILE II
0
10
20
30
40
50
60
70
80
90
1
10
100
1000
10000
Dec-00 Dec-01 Dec-02 Dec-03 Dec-04 Dec-05 Dec-06 Dec-07 Dec-08 Dec-09 Dec-10
Bean
Siz
e (
In,)
Gro
ss
/Ne
t (S
tb/d
)
Gross/Net/Bean Profile
Gross Net Oil dcln Gross Dcln Bean WC
50
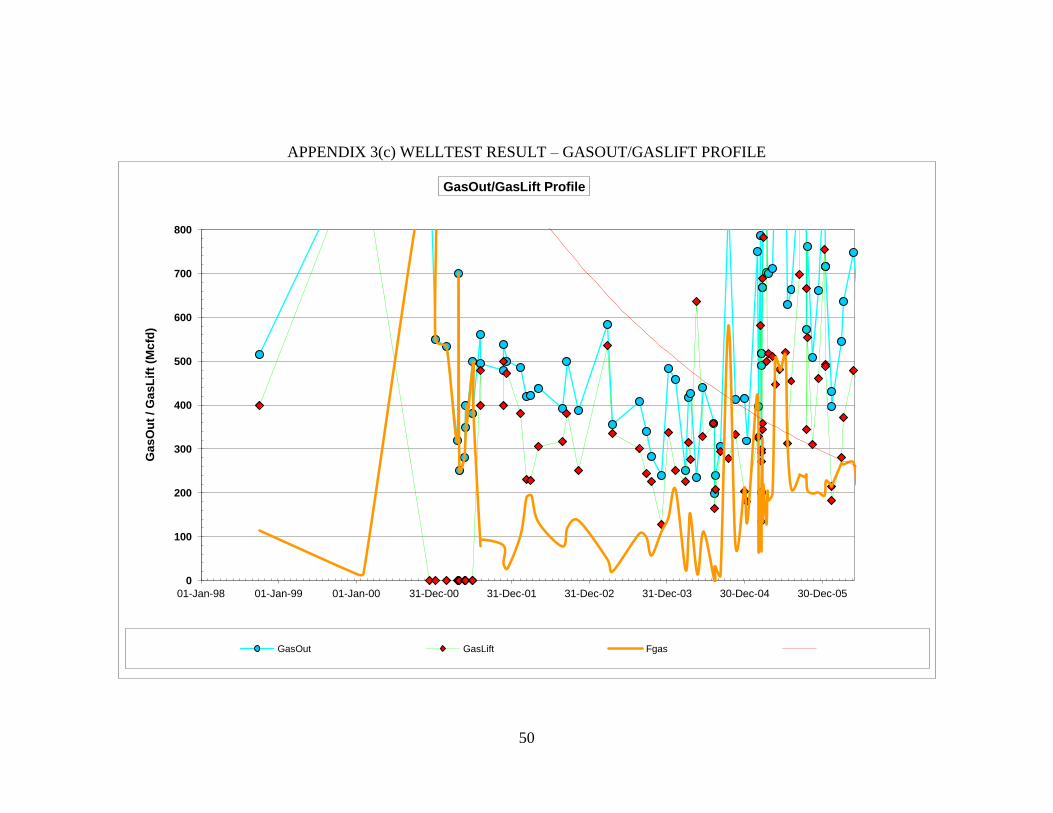
APPENDIX 3(c) WELLTEST RESULT – GASOUT/GASLIFT PROFILE
0
100
200
300
400
500
600
700
800
01-Jan-98 01-Jan-99 01-Jan-00 31-Dec-00 31-Dec-01 31-Dec-02 31-Dec-03 30-Dec-04 30-Dec-05
Ga
sO
ut
/ G
as
Lif
t (M
cfd
)
GasOut/GasLift Profile
GasOut GasLift Fgas
51
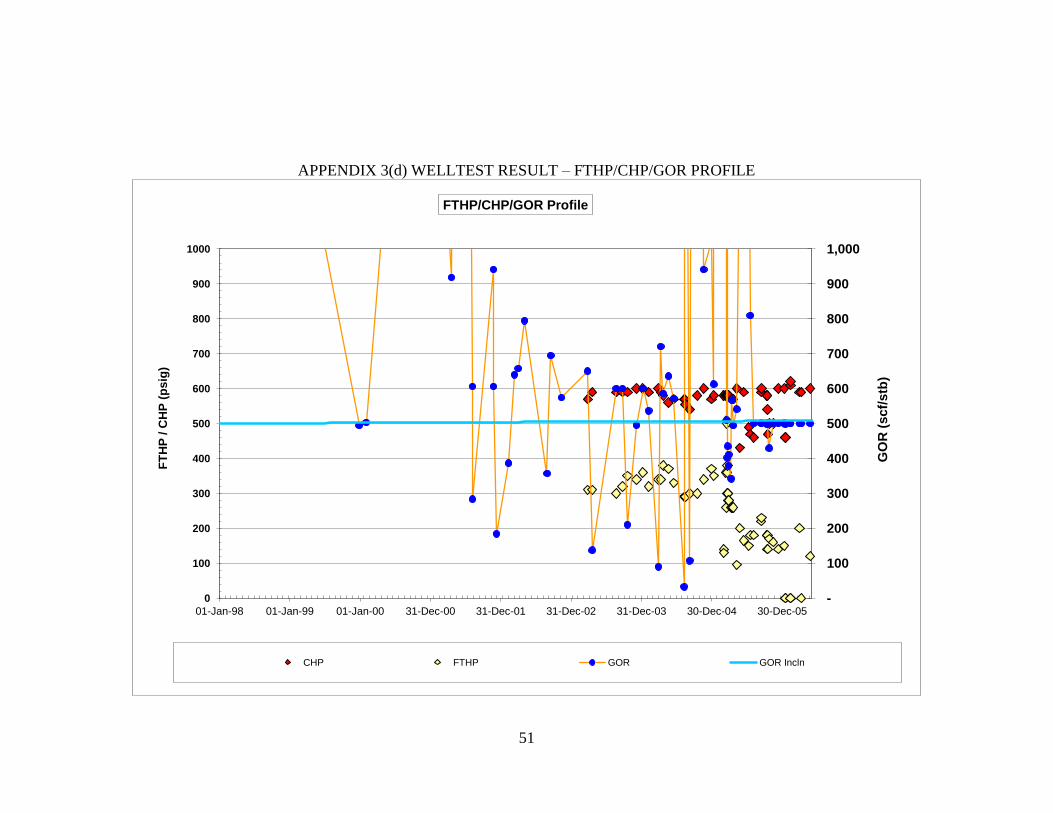
APPENDIX 3(d) WELLTEST RESULT – FTHP/CHP/GOR PROFILE
-
100
200
300
400
500
600
700
800
900
1,000
0
100
200
300
400
500
600
700
800
900
1000
01-Jan-98 01-Jan-99 01-Jan-00 31-Dec-00 31-Dec-01 31-Dec-02 31-Dec-03 30-Dec-04 30-Dec-05
GO
R (
scf/
stb
)
FT
HP
/ C
HP
(p
sig
)
FTHP/CHP/GOR Profile
CHP FTHP GOR GOR Incln
52
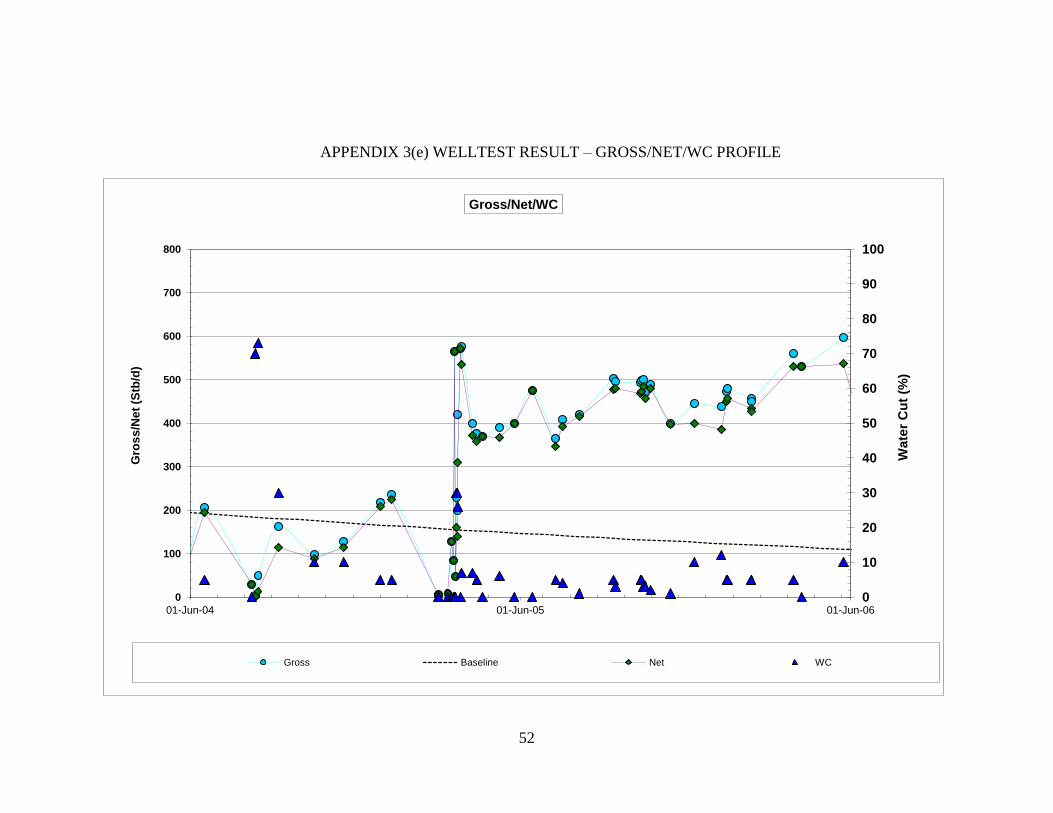
APPENDIX 3(e) WELLTEST RESULT – GROSS/NET/WC PROFILE
0
10
20
30
40
50
60
70
80
90
100
0
100
200
300
400
500
600
700
800
01-Jun-04 01-Jun-05 01-Jun-06
Wate
r C
ut
(%)
Gro
ss
/Ne
t (S
tb/d
)
Gross/Net/WC
Gross Baseline Net WC
53
APPENDIX 4 SCREEN SELECTION GUIDE
54
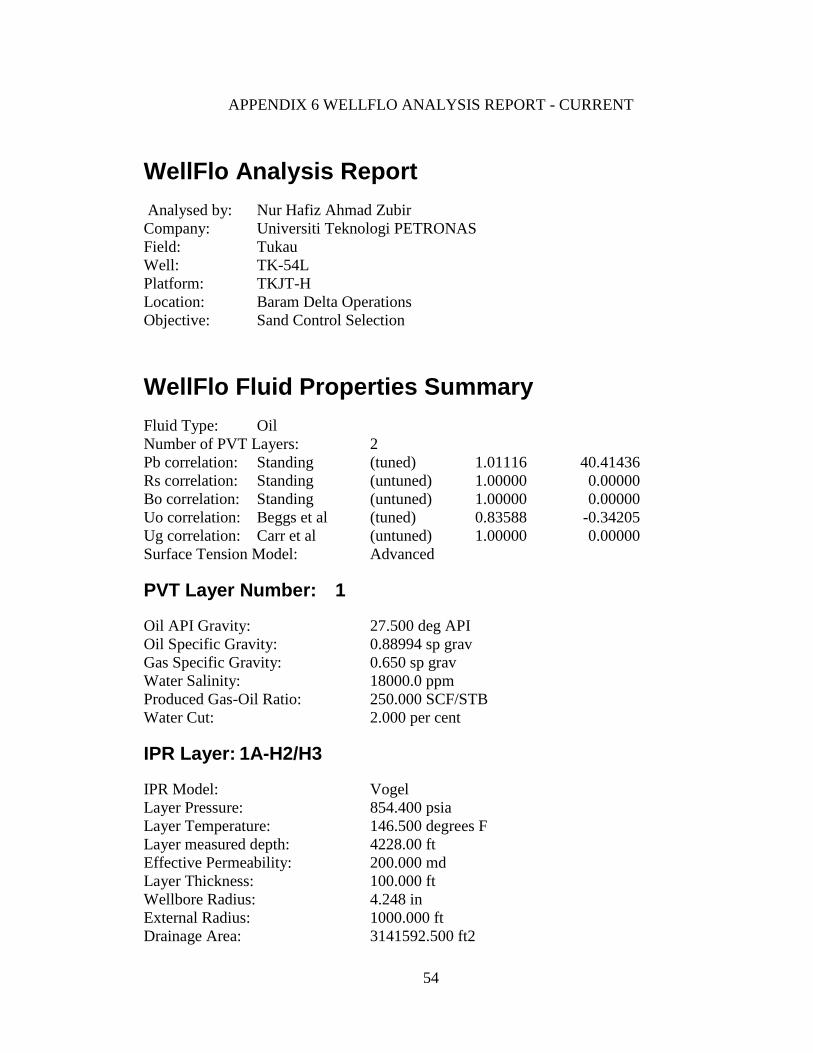
APPENDIX 6 WELLFLO ANALYSIS REPORT - CURRENT
WellFlo Analysis Report
Analysed by: Nur Hafiz Ahmad Zubir
Company: Universiti Teknologi PETRONAS
Field: Tukau
Well: TK-54L
Platform: TKJT-H
Location: Baram Delta Operations
Objective: Sand Control Selection
WellFlo Fluid Properties Summary
Fluid Type: Oil
Number of PVT Layers: 2
Pb correlation: Standing (tuned) 1.01116 40.41436
Rs correlation: Standing (untuned) 1.00000 0.00000
Bo correlation: Standing (untuned) 1.00000 0.00000
Uo correlation: Beggs et al (tuned) 0.83588 -0.34205
Ug correlation: Carr et al (untuned) 1.00000 0.00000
Surface Tension Model: Advanced
PVT Layer Number: 1
Oil API Gravity: 27.500 deg API
Oil Specific Gravity: 0.88994 sp grav
Gas Specific Gravity: 0.650 sp grav
Water Salinity: 18000.0 ppm
Produced Gas-Oil Ratio: 250.000 SCF/STB
Water Cut: 2.000 per cent
IPR Layer: 1A-H2/H3
IPR Model: Vogel
Layer Pressure: 854.400 psia
Layer Temperature: 146.500 degrees F
Layer measured depth: 4228.00 ft
Effective Permeability: 200.000 md
Layer Thickness: 100.000 ft
Wellbore Radius: 4.248 in
External Radius: 1000.000 ft
Drainage Area: 3141592.500 ft2
55
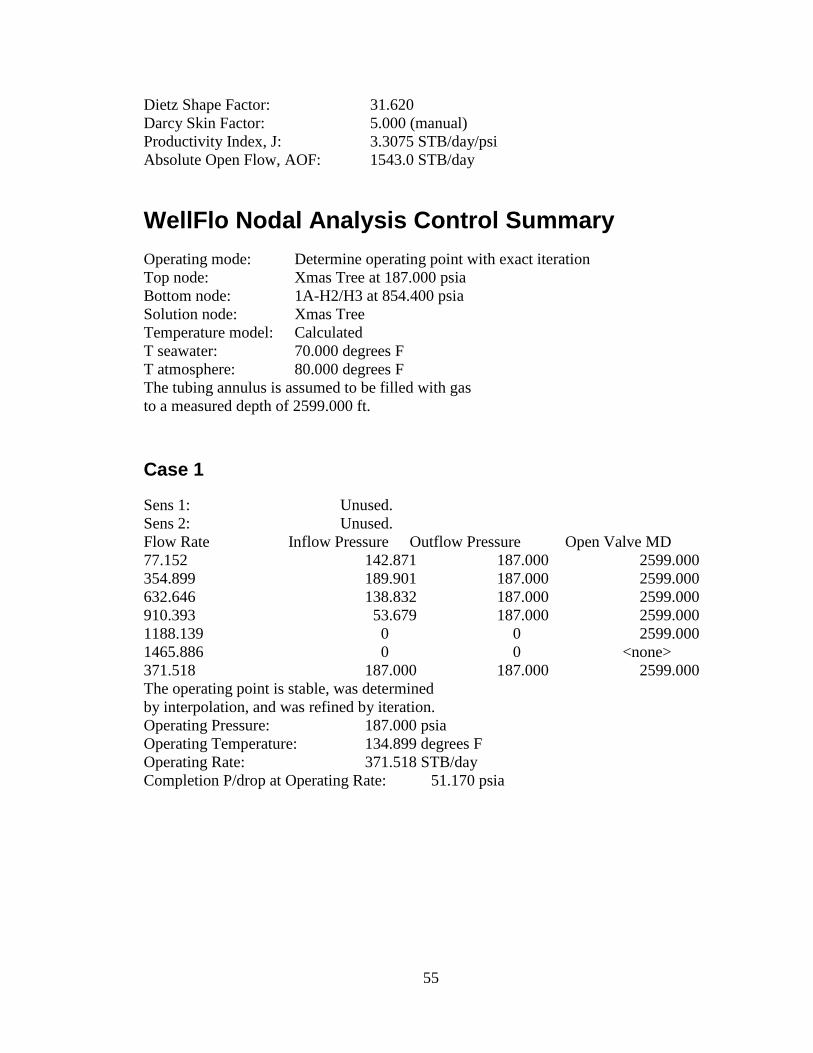
Dietz Shape Factor: 31.620
Darcy Skin Factor: 5.000 (manual)
Productivity Index, J: 3.3075 STB/day/psi
Absolute Open Flow, AOF: 1543.0 STB/day
WellFlo Nodal Analysis Control Summary
Operating mode: Determine operating point with exact iteration
Top node: Xmas Tree at 187.000 psia
Bottom node: 1A-H2/H3 at 854.400 psia
Solution node: Xmas Tree
Temperature model: Calculated
T seawater: 70.000 degrees F
T atmosphere: 80.000 degrees F
The tubing annulus is assumed to be filled with gas
to a measured depth of 2599.000 ft.
Case 1
Sens 1: Unused.
Sens 2: Unused.
Flow Rate Inflow Pressure Outflow Pressure Open Valve MD
77.152 142.871 187.000 2599.000
354.899 189.901 187.000 2599.000
632.646 138.832 187.000 2599.000
910.393 53.679 187.000 2599.000
1188.139 0 0 2599.000
1465.886 0 0 <none>
371.518 187.000 187.000 2599.000
The operating point is stable, was determined
by interpolation, and was refined by iteration.
Operating Pressure: 187.000 psia
Operating Temperature: 134.899 degrees F
Operating Rate: 371.518 STB/day
Completion P/drop at Operating Rate: 51.170 psia
56
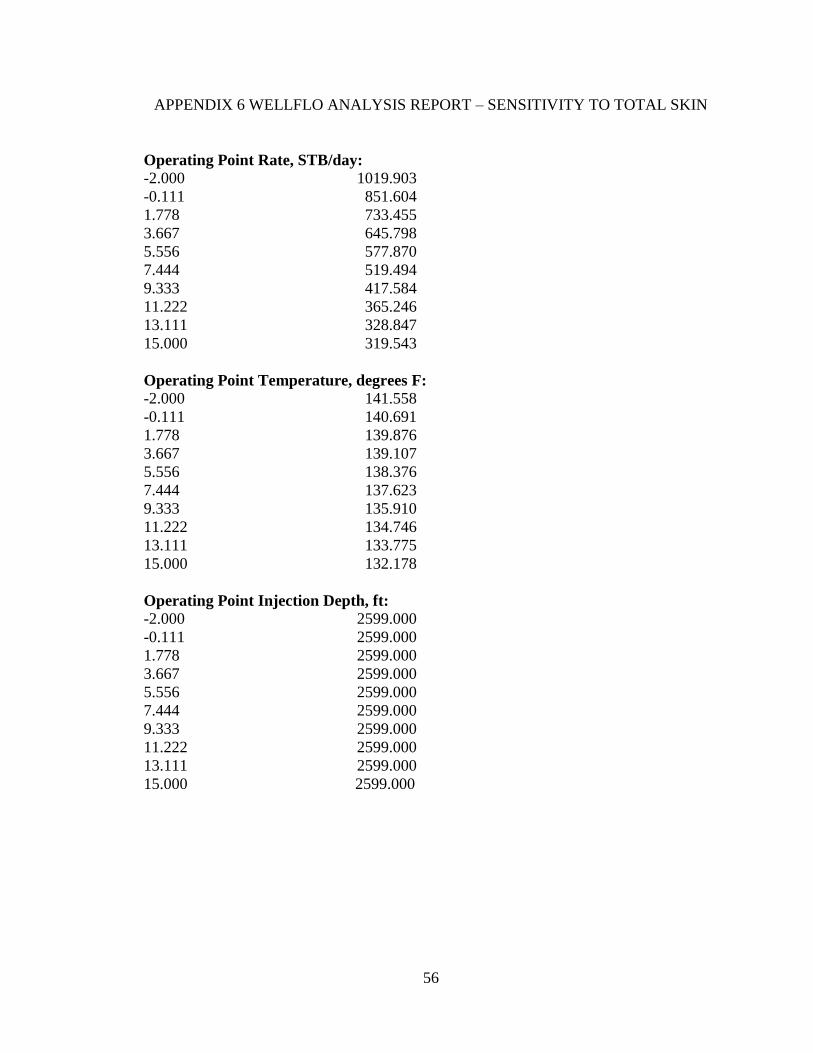
APPENDIX 6 WELLFLO ANALYSIS REPORT – SENSITIVITY TO TOTAL SKIN
Operating Point Rate, STB/day:
-2.000 1019.903
-0.111 851.604
1.778 733.455
3.667 645.798
5.556 577.870
7.444 519.494
9.333 417.584
11.222 365.246
13.111 328.847
15.000 319.543
Operating Point Temperature, degrees F:
-2.000 141.558
-0.111 140.691
1.778 139.876
3.667 139.107
5.556 138.376
7.444 137.623
9.333 135.910
11.222 134.746
13.111 133.775
15.000 132.178
Operating Point Injection Depth, ft:
-2.000 2599.000
-0.111 2599.000
1.778 2599.000
3.667 2599.000
5.556 2599.000
7.444 2599.000
9.333 2599.000
11.222 2599.000
13.111 2599.000
15.000 2599.000
Related Documents


