SAMPLE SIZE DETERMINATION IN HEALTH STUDIES A Practical Manual s. K. Lwanga Epidemiological and Statistical Methodology World Health Organization Geneva, Switzerland and S. Lemeshow Division of Public Health University of Massachusetts at Amherst MA USA World Health Organization Geneva 1991

Welcome message from author
This document is posted to help you gain knowledge. Please leave a comment to let me know what you think about it! Share it to your friends and learn new things together.
Transcript

SAMPLE SIZE DETERMINATION
IN HEALTH STUDIES
A Practical Manual
s. K. Lwanga Epidemiological and Statistical Methodology
World Health Organization Geneva, Switzerland
and S. Lemeshow
Division of Public Health University of Massachusetts at Amherst
MA USA
World Health Organization Geneva
1991

WHO Library Cataloguing in Publication Data
Lwanga, S K. Sample size determination in health studies' a practical manual
1 Sampling studies 2.Health surveys I. Lemeshow, S II.Title
ISBN 92 4 154405 8 (NLM Classification WA 950)
© World Health Organization 1991
Publications of the World Health Organization enjoy copyright
protection in accordance with the provisions of Protocol 2 of the
Universal Copyright Convention. For rights of reproduction or
translation of WHO publications, in part or in toto, application
should be made to the Office of Publications, World Health
Organization, Geneva, Switzerland. The World Health Organiza
tion welcomes such applications.
The designations employed and the presentation of the material in
this publication do not imply the expression of any opinion
whatsoever on the part of the Secretariat of the World Health
Organization concerning the legal status of any country, territory,
city or area or of its authorities. or concerning the delimitation of
its frontiers or boundaries.
The mention of specific companies or of certain manufacturers'
products does not imply that they are endorsed or recommended
by the World Health Organization in preference to others of a
similar nature that are not mentioned. Errors and omissions
excepted, the names of proprietary products are distinguished by
initial capital letters.
The authors alone are responsible for the views expressed in this
publication.
Typeset In India
Printed In England
89/8087 -Macm ,llan/Clays-5000

Contents
Introduction Vll
One-sample situations 1 Estimating a population proportion with specified absolute
preclslOn Estimating a population proportion with specified relative
preClSlon 2 Hypothesis tests for a population proportion 3
Two-sample situations 6 Estimating the difference between two population
proportions with specified absolute precision 6 Hypothesis tests for two population proportions 7
Case-control studies 9 Estimating an odds ratio with specified relative precision 9 Hypothesis tests for an odds ratio 10
Cohort studies 12 Estimating a relative risk with specified relative precision 12 Hypothesis tests for a relative risk 13
Lot quality assurance sampling 15 Accepting a population prevalence as not exceeding a specified
value 15 Decision rule for "rejecting a lot" 15
Incidence-rate studies 17 Estimating an incidence rate with specified relative precision 17 Hypothesis tests for an incidence rate 17 Hypothesis tests for two incidence rates in follow-up (cohort)
studies 18
Definitions of commonly used terms 21
Tables of minimum sample size 23 1. Estimating a population proportion with specified absolute
preclslOn 25 2. Estimating a population proportion with specified relative
preClSlon 27 3. Hypothesis tests for a population proportion 29 4. Estimating the difference between two population propor-
tions with specified absolute precision 33
iii

Sample size determination
5. Hypothesis tests for two population proportions 36 6. Estimating an odds ratio with specified relative precision 42 7. Hypothesis tests for an odds ratio 50 8. Estimating a relative risk with specified relative precision 52 9. Hypothesis tests for a relative risk 60
10. Acceptjng a population prevalence as not exceeding a specified value 63
11. Decision rule for "rejecting a lot" 69 12. Estimating an incidence rate with specified relative precision 72 13. Hypothesis tests for an incidence rate 73 14. Hypothesis tests for two incidence rates in follow-up (cohort)
studies (study duration not fixed) 77
iv
Preface
In many of WHO's Member States, surveys are being undertaken to obtain information for planning, operating, monitoring and evaluating health services. Central to the planning of any such survey is the decision on how large a sample to select from the population under study, and it is to meet the needs of health workers and managers responsible for making that decision that this manual has been prepared. It is essentially a revised and expanded version of a popular unpublished document on sample size that has been widely used in WHO's field projects and training courses. The examples and tables presented, which have been selected to cover many of the approaches likely to be adopted in health studies, will not only be of immediate practical use to health workers but also provide insight into the statistical methodology of sample size determination.
The authors would like to thank Dr B. Grab, formerly Statistician, WHO, Geneva, Dr R. J. Hayes, London School of Hygiene and Tropical Medicine, and colleagues in the Unit of Epidemiological and Statistical Methodology, the Diarrhoeal Diseases Control Programme and the Expanded Programme on Immunization of WHO for their comments. The financial support of the UNDP/World Bank/WHO Special Programme for Research and Training in Tropical Diseases is gratefully acknowledged.
v

Introduction
Among the questions that a health worker should ask when planning a surveyor study is "How large a sample do I need?" The answer will depend on the aims, nature and scope of the study and on the expected result, all of which should be carefully considered at the planning stage.
For example, in a study of the curative effect of a drug on a fatal disease such as the acquired immunodeficiency syndrome (AIDS), where a single positive result could be important, sample size might be considered irrelevant. In contrast, if a new malaria vaccine is to be tested, the number of subjects studied will have to be sufficiently large to permit comparison of the vaccine's effects with those of existing preventive measures.
The type of "outcome" under study should also be taken into account. There are three possible categories of outcome. The first is the simple case where two alternatives exist: yes/no, dead/alive, vaccinated/not vaccinated, existence of a health committee/lack of a health committee. The second category covers multiple, mutually exclusive alternatives such as religious beliefs or blood groups. For these two categories of outcome the data are generally expressed as percentages or rates. The third category covers continuous response variables such as weight, height, age and blood pressure, for which numerical measurements are usually made. In this case the data are summarized in the form of means and variances or their derivatives. The statistical methods appropriate for sample size determination will depend on which of these types of outcome the investigator is interested in.
Only once a proposed study and its objectives have been clearly defined can a health worker decide how large a sample to select from the population in question. This manual is intended to be a practical guide to making such decisions. It presents a variety of situations in which sample size must be determined, including studies of population proportion, odds ratio, relative risk and incidence rate. 1 In each case the information needed is specified and at least one illustrative example is given. All but one example are accompanied by tables of minimum sample size for various study conditions so that the reader may obtain solutions to problems of sample size without recourse to calculations (more extensive tables are available in the publication by Lemeshow et al. mentioned below). Random sampling is assumed for all examples, so that if the sample is not to be selected in a statistically random manner the tables are not valid.
1 Continuous response variables are not considered in this manual because of the wide range of possible parameter values.
vii
Sample size determination
The manual is designed to be used in "cookbook" fashion; it neither helps the reader to decide what type of study, confidence level or degree of precision is most appropriate, nor discusses the theoretical basis of sample size determination. Before using the manual, therefore, the investigator should have decided on the study design, made a reasonable guess at the likely result, determined what levels of significance, power and precision (where relevant) are required and considered operational constraints such as restrictions on time or resources. The reader who wishes to learn more about the statistical methodology of sample size determination is referred to Lemeshow, S. et aI., Adequacy of sample size in health studies (Chichester, John Wiley, 1990; published on behalf of the World Health Organization) or to any standard textbook on statistics.
viii

Required information and notation
Example 1
Solution
One-sample situations
Estimating a population proportion with specified absolute precision
(a) Anticipated population proportion (b) Confidence level (c) Absolute precision required on either side
of the proportion (in percentage points)
P 100(1-1X)%
d
A rough estimate of P will usually suffice. If it is not possible to estimate P, a figure of 0.5 should be used (as in Example 2); this is the "safest" choice for the population proportion since the sample size required is largest when P = 0.5. If the anticipated proportion is given as a range, the value closest to 0.5 should be used.
Tables 1a and 1b (pages 25-26) present mInImUm sample SIzes for confidence levels of 95% and 90%, respectively.
Simple random sampling is unlikely to be the sampling method of choice in an actual field survey. If another sampling method is used, a larger sample size is likely to be needed because of the "design effect". For example, for a cluster sampling strategy the design effect might be estimated as 2. This would mean that, to obtain the same precision, twice as many individuals would have to be studied as with the simple random sampling strategy. In Example 2, for instance, a sample size of 192 would be needed.
A local health department wishes to estimate the prevalence of tuberculosis among children under five years of age in its locality. How many children should be included in the sample so that the prevalence may be estimated to within 5 percentage points of the true value with 95% confidence, if it is known that the true rate is unlikely to exceed 20%?
(a) Anticipated population proportion (b) Confidence level (c) Absolute precision (15%-25%)
20% 95%
5 percentage points
Table 1a (page 25)shows that for P = 0.20 and d = 0.05 a sample size of 246 would be needed.
If it is impractical, with respect to time and money, to study 246 children, the investigators should lower their requirements of confidence to, per-

Example 2
Solution
Required information and notation
Example 3
Solution
Sample size determination
haps, 90%. Table 1 b (page 26) shows that, in this case, the required sample size would be reduced to 173.
An investigator working for a national programme of immunization seeks to estimate the proportion of children in the country who are receiving appropriate childhood vaccinations. How many children must be studied if the resulting estimate is to fall within 10 percentage points of the true proportion with 95% confidence? (It is not possible to make any assumption regarding the vaccination coverage.)
(a) Anticipated population proportion ("safest" choice, since P is unknown)
(b) Confidence level (c) Absolute precision (40%-60%)
50% 95%
10 percentage points
Table 1a (page 25) shows that for P=0.50 and d=O.1O a sample size of96 would be required.
Estimating a population proportion with specified relative precision
(a) Anticipated population proportion (b) Confidence level (c) Relative precision
P 100(1-IX)%
E
The choice of P for the sample size computation should be as "conservative" (small) as possible, since the smaller P is the greater is the minimum sample size.
Tables 2a and 2b (pages 27-28) present mmImum sample SIzes for confidence levels of 95% and 90%, respectively.
An investigator working for a national programme of immunization seeks to estimate the proportion of children in the country who are receiving appropriate childhood vaccinations. How many children must be studied if the resulting estimate is to fall within 10% (not 10 percentage points) of the true proportion with 95% confidence? (The vaccination coverage is not expected to be below 50%.)
(a) Anticipated population proportion (conservative choice)
(b) Confidence level (c) Relative precision (from 45% to 55%)
50% 95%
10% (of 50%)
Table 2a (page 27) shows that for P = 0.50 and E = 0.10 a sample size of 384 would be needed.
If it is impractical, with respect to time and money, to study 384 children, the investigators should lower their requirements of confidence to, per-
2

One-sample situations
haps, 90%. Table 2b (page 28) shows that, in this case, the required sample size would be reduced to 271.
Simple random sampling is unlikely to be the sampling method of choice in an actual field survey. If another sampling method is used, a larger sample size is likely to be needed because of the "design effect". For example, for a cluster sampling strategy the design effect might be estimated as 2. This would mean that, to obtain the same precision, twice as many individuals would have to be studied as with the simple random sampling strategy. In this example, therefore, for a confidence level of 95%, a sample size of 768 would be needed.
Example 4 How large a sample would be required to estimate the proportion of pregnant women in a population who seek prenatal care within the first trimester of pregnancy, to within 5% of the true value with 95% confidence? It is estimated that the proportion of women seeking such care will be between 25% and 40%.
Solution
Required information and notation
(a) Anticipated population proportion (b) Confidence level (c) Relative precision
25%-40% 95%
5% (of 25%-40%)
Table 2a (page 27) presents the following sample sizes for E = 0.05 and for population proportions in the range 25%-40%.
P Sample size
0.25 4610 0.30 3585 0.35 2854 0.40 2305
Therefore a study of roughly 4610 women might be planned to satisfy the stated objectives. If necessary a smaller sample size could be used, but this would result in a loss of precision or confidence or both if the true value of P was close to 25%.
Hypothesis tests for a population proportion
This section applies to studies designed to test the hypothesis that the proportion of individuals in a population possessing a given characteristic is equal to a particular value.
3
(a) Test value of the population proportion under the null hypothesis
(b) Anticipated value of the population proportion (c) Level of significance
Po Pa
1000(% 100(1- fJ)% (d) Power of the test
(e) Alternative hypothesis: either
or
Pa>Po or Pa<Po (for one-sided test)
Pai=Po (for two-sided test)

Example 5
Solution
Example 6
Solution
Example 7
Solution
Sample size determination
Tables 3a-d (pages 29-32) present minimum sample sizes for a level of significance of 5%, powers of90% and 80%, and both one-sided and twosided tests. For Tables 3c and 3d the complement of Po should be used as the column value whenever Po> 0.5.
The five-year cure rate for a particular cancer (the proportion of patients free of cancer five years after treatment) is reported in the literature to be 50%. An investigator wishes to test the hypothesis that this cure rate applies in a certain local health district. What minimum sample size would be needed if the investigator was interested in rejecting the null hypothesis only if the true rate was less than 50%, and wanted to be 90% sure of detecting a true rate of 40% at the 5% level of significance?
(a) Test cure rate (b) Anticipated cure rate ( c ) Level of significance ( d) Power of the test (e) Alternative hypothesis (one-sided test)
50% 40%
5% 90%
cure rate < 50%
Table 3a (page 29) shows that for Po = 0.50 and P a = 0.40 a sample size of 211 would be needed.
Previous surveys have demonstrated that the usual prevalence of dental caries among schoolchildren in a particular community is about 25%. How many children should be included in a new survey designed to test for a decrease in the prevalence of dental caries, if it is desired to be 90% sure of detecting a rate of 20% at the 5% level of significance?
(a) Test caries rate (b) Anticipated caries rate ( c ) Level of significance ( d) Power of the test (e) Alternative hypothesis (one-sided test)
25% 20%
5% 90%
caries rate < 25%
Table 3a (page 29) shows that for Po = 0.25 and P a = 0.20 a sample size of 601 would be needed.
If the investigators use this sample size, and if the actual caries rate is less than 20%, then the power of the test will be larger than 90%, i.e. they will be more than 90% likely to detect that rate.
The success rate for a surgical treatment of a particular heart condition is widely reported in the literature to be 70%. A new medical treatment has been proposed that is alleged to offer equivalent treatment success. A hospital without the necessary facilities or staff to provide the surgical treatment has decided to use the new medical treatment for all new patients presenting with this condition. How many patients must be studied to test the hypothesis that the success rate of the new method of treatment is 70% against an alternative hypothesis that it is not 70% at the 5% level of significance? The investigators wish to have a 90% power of detecting a difference between the success rates of 10 percentage points or more in either direction.
(a) Test success rate (b) Anticipated success rate
4
70% 80% or 60%

Example 8
Solution
One-sample situations
( c ) Level of significance ( d) Power of the test ( e ) Alternative hypothesis (two-sided test)
5% 90%
success rate #- 70%
Table 3c (page 31) shows that for ( 1- Po) = 0.30 and iF a - Pol = 0.1 0 a sample size of 233 would be needed.
In a particular province the proportion of pregnant women provided with prenatal care in the first trimester of pregnancy is estimated to be 40% by the provincial department of health. Health officials in another province are interested in comparing their success at providing prenatal care with these figures. How many women should be sampled to test the hypothesis that the coverage rate in the second province is 40% against the alternative that it is not 40%? The investigators wish to be 90% confident of detecting a difference of 5 percentage points or more in either direction at the 5% level of significance.
(a) Test coverage rate (b) Anticipated coverage rate ( c ) Level of significance ( d) Power of the test (e) Alternative hypothesis (two-sided test)
40% 35% or 45%
5% 90%
coverage rate #- 40%
Table 3c (page 31) shows that for Po =0.40 and iFa-Pol=0.05 a sample size of 1022 would be needed.
5
Required information and notation
Example 9
Solution
Example 10
Two-sample situations
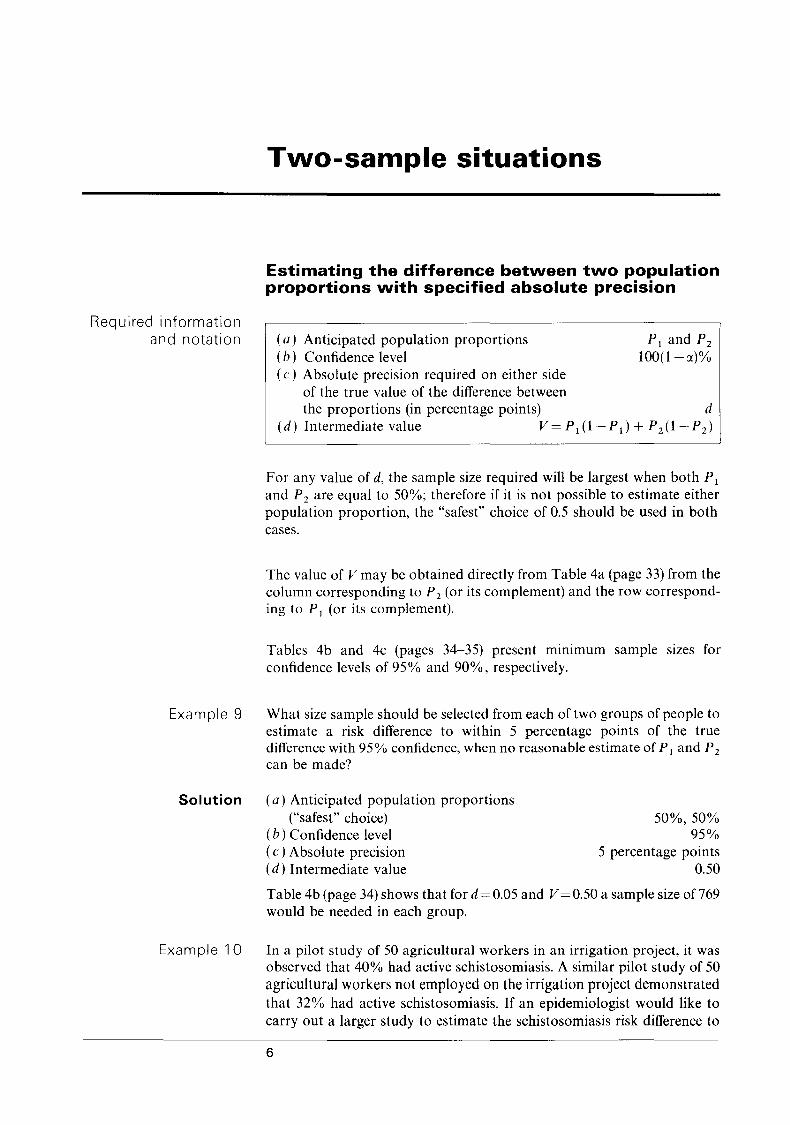
Estimating the difference between two population proportions with specified absolute precision
(a) Anticipated population proportions ( b) Confidence level (c) Absolute precision required on either side
of the true value of the difference between
PI and Pz 100(1-a)%
the proportions (in percentage points) d (d) Intermediate value V=P I (1-Pd+P 2 (1-P z)
For any value of d, the sample size required will be largest when both PI
and P z are equal to 50%; therefore if it is not possible to estimate either population proportion, the "safest" choice of 0.5 should be used in both cases.
The value of V may be obtained directly from Table 4a (page 33) from the column corresponding to P z (or its complement) and the row corresponding to PI (or its complement).
Tables 4b and 4c (pages 34-35) present mInImUm sample SIzes for confidence levels of 95% and 90%, respectively.
What size sample should be selected from each of two groups of people to estimate a risk difference to within 5 percentage points of the true difference with 95 % confidence, when no reasonable estimate of PI and P z can be made?
(a) Anticipated population proportions ("safest " choice)
( b ) Confidence level ( c ) Absolute precision (d) Intermediate value
50%,50% 95%
5 percentage points 0.50
Table 4b (page 34) shows that for d = 0.05 and V = 0.50 a sample size of 769 would be needed in each group.
In a pilot study of 50 agricultural workers in an irrigation project, it was observed that 40% had active schistosomiasis. A similar pilot study of 50 agricultural workers not employed on the irrigation project demonstrated that 32% had active schistosomiasis. If an epidemiologist would like to carry out a larger study to estimate the schistosomiasis risk difference to
6

Two-sample situations
within 5 percentage points of the true value with 95% confidence, how many people must be studied in each of the two groups?
Solution (a) Anticipated population proportions ( b) Confidence level
40%,32% 95%
5 percentage points 0.46
Required information and notation
Example 11
Solution
( c) Absolute precision ( d) In termedia te value
Table 4b (page 34) shows that for d = 0.05 and V = 0.46 a sample size of 707 would be needed in each group.
Hypothesis tests for two population proportions
This section applies to studies designed to test the hypothesis that two population proportions are equal. For studies concerned with very small proportions, see Example 13.
(a) Test value of the difference between the population proportions under the null hypothesis
(b) Anticipated values of the population proportions
( c) Level of significance ( d) Power of the test ( e) Alternative hypothesis: either
or
PI and P 2
1000:% 100(1- /3)%
P 1 - P 2 > 0 or P 1 - P 2 < 0 (for one-sided test)
P 1 -P2 ¥0 (for two-sided test)
Tables 5a-h (pages 36-41) present minimum sample sizes for a level of significance of 5 %, powers of 90% and 80%, both one-sided and two-sided tests, and the special case of very small proportions. Tables 5e-h should be used whenever the proportion under consideration is less than 5%.1
It is believed that the proportion of patients who develop complications after undergoing one type of surgery is 5% while the proportion of patients who develop complications after a second type of surgery is 15%. How large should the sample size be in each of the two groups of patients if an investigator wishes to detect, with a power of 90%, whether the second procedure has a complication rate significantly higher than the first at the 5% level of significance?
(a) Test value of difference in complication rates (b) Anticipated complication rates ( c ) Level of significance ( d ) Power of the test
0% 5%,15%
5% 90%
(e) Alternative hypothesis (one-sided test) risk difference (P 1 - P 2) < 0%
1 For further discussion of small proportions, see Lemeshow, S. et ai., Adequacy of sample size in health studies (Chichester, John Wiley, 1990; published on behalf of the World Health Organization).
7

Example 12
Solution
Example 13
Solution
Sample size determination
Table 5a (page 36) shows that for PI = 0.05 and P 2 = 0.15 a sample size of 153 would be needed in each group.
In a pilot survey in a developing country, an epidemiologist compared a sample of 50 adults suffering from a certain neurological disease with a sample of 50 comparable control subjects who were free of the disease. Thirty of the subjects with the disease (60%) and 25 of the controls (50%) were involved in fishing-related occupations. If the proportion of people involved in fishing-related occupations in the entire population is similar to that observed in the pilot survey, how many subjects should be included in a larger study in each of the two groups if the epidemiologist wishes to be 90% confident of detecting a true difference between the groups at the 5% level of significance?
(a) Test value of difference between proportions involved in fishing-related occupations 0%
(b) Anticipated proportions involved in fishing-related occupations
( c ) Level of significance ( d ) Power of the test
60%,50% 5%
90% (e) Alternative hypothesis (two-sided test) risk difference # 0%
The required sample size is obtained from Table 5c (page 38) from the column corresponding to the smallest of PI' P 2 and their complements and the row corresponding to I P 2 - P 11. In this case, for (1- PI) = 0.40 and I P 2 - P 11 = 0.10, the required sample size would be 519 in each group.
Two communities are to participate in a study to evaluate a new screening programme for early identification of a particular type of cancer. In one community the screening programme will include all adults over the age of 35, whereas in the second community the procedure will not be used at all. The annual incidence of the type of cancer under study is 50 per 100000 ( = 0.0005) in an unscreened popUlation. A drop in the rate to 20 per 100000 (= 0.0002) would justify using the procedure on a widespread basis. How many adults should be included in the study in each of the two communities if the investigators wish to have an 80% probability of detecting a drop in the incidence of this magnitude at the 5% level of significance?
(a) Test difference in cancer rates ( b ) Anticipated cancer rates ( c ) Level of significance ( d) Power of the test (e) Alternative hypothesis
(one-sided test)
0% 0.05 %, 0.02 %
5% 80%
risk difference (P 1 - P 2) > 0%
Table 5f (page 40) shows that for PI = 0.0005 and P 2 = 0.0002 a sample size of 45 770 would be needed in each group.
8
Required information and notation
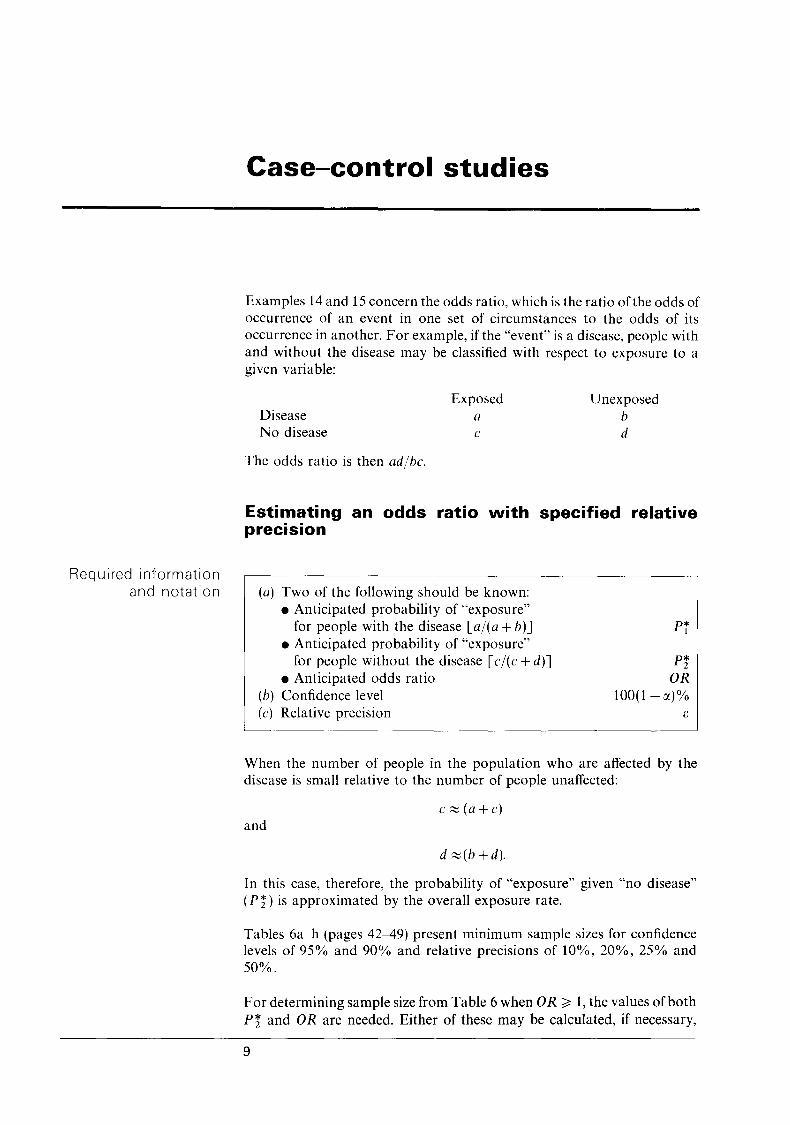
Case-control studies
Examples 14 and 15 concern the odds ratio, which is the ratio ofthe odds of occurrence of an event in one set of circumstances to the odds of its occurrence in another. For example, if the "event" is a disease, people with and without the disease may be classified with respect to exposure to a given variable:
Disease No disease
The odds ratio is then ad/be.
Exposed a c
Unexposed b d
Estimating an odds ratio with specified relative precision
(a) Two of the following should be known: • Anticipated probability of "exposure"
for people with the disease [a/(a + b)] • Anticipated probability of "exposure"
for people without the disease [c/(c + d)] • Anticipated odds ratio
(b) Confidence level (c) Relative precision
Pi
Pi OR
100(1 - Ct)% [;
When the number of people in the population who are affected by the disease is small relative to the number of people unaffected:
e~(a+c)
and
d ~(b + d).
In this case, therefore, the probability of "exposure" given "no disease" (P i) is approximated by the overall exposure rate.
Tables 6a-h (pages 42-49) present minimum sample sizes for confidence levels of 95% and 90% and relative precisions of 10%, 20%, 25% and 50%.
F or determining sample size from Table 6 when 0 R ~ 1, the values of both Pi and OR are needed. Either of these may be calculated, if necessary,
9

Sample size determination
provided that Pi is known:
OR = [Pf/(l- Pi)]/[Pi/(1 - P!)]
and P! = Pf/[OR(l- Pi) + PiJ.
If OR < 1, the values of Pi and 1/0R should be used instead.
Example 14 In a defined area where cholera is posing a serious public health problem, about 30% of the population are believed to be using water from contaminated sources. A case-control study of the association between cholera and exposure to contaminated water is to be undertaken in the area to estimate the odds ratio to within 25% of the true value, which is believed to be approximately 2, with 95% confidence. What sample sizes would be needed in the cholera and control groups?
Solution (a) Anticipated probability of "exposure" given "disease" ?
Required information and notation
Anticipated probability of "exposure" given "no disease" (approximated by overall exposure rate) 30%
Anticipated odds ratio 2 ( b) Confidence level 95% (c) Relative precision 25%
Table 6c (page 44) shows that for OR = 2 and P! = 0.3 a sample size of 408 would be needed in each group.
Hypothesis tests for an odds ratio
This section outlines how to determine the minimum sample size for testing the hypothesis that the population odds ratio is equal to one.
(a) Test value of the odds ratio under the null hypothesis (b) Two of the following should be known:
ORo=1
• Anticipated probability of "exposure" for people with the disease [al(a + b)]
• Anticipated probability of "exposure" for people without the disease [cl(c + d)]
• Anticipated odds ratio ( c) Level of significance ( d) Power of the test (e) Alternative hypothesis
(for two-sided test)
P* 1
P* 2
ORa 100a%
100(1- fJ)%
Tables 7a and 7b (pages 50-51) present minimum sample sizes for a level of significance of 5% and powers of 90% and 80% in two-sided tests.
For determining sample size from Table 7 when ORa> 1, the values of both P! and OR are needed. Either of these may be calculated, if necessary,
10

Example 15
Solution
Case--control studies
provided that Pi is known:
ORa = [Pi/(I - Pi)]/[P!I(I- Pi)]
and
Pi = Pi/[ORa(1- Pi) + PiJ.
If ORa < I, the values of Pi and IIORa should be used instead.
The efficacy of BeG vaccine in preventing childhood tuberculosis is in doubt and a study is designed to compare the vaccination coverage rates in a group of people with tuberculosis and a group of controls. Available information indicates that roughly 30% of the controls are not vaccinated. The investigators wish to have an 80% chance of detecting an odds ratio significantly different from 1 at the 5 % level. If an odds ratio of 2 would be considered an important difference between the two groups, how large a sample should be included in each study group?
(a) Test value of the odds ratio (b) Anticipated probability of "exposure" given "disease"
Anticipated probability of "exposure" given "no disease" Anticipated odds ratio
(c) Level of significance (d) Power of the test
1 ?
30% 2
5% 80%
(e) Alternative hypothesis odds ratio # 1
Table 7b (page 51) shows that for OR = 2 and Pi = 0.30 a sample size of 130 would be needed in each group.
11

Required information and notation
Example 16
Solution
Cohort studies
Estimating a relative risk with specified relative precision
(a) Two of the following should be known: • Anticipated probability of disease in people
exposed to the factor of interest • Anticipated probability of disease in people
not exposed to the factor of interest • Anticipated relative risk
(h) Confidence level (c) Relative precision
P2
RR 100(I-IX)%
B
Tables 8a-h (pages 52-59) present minimum sample sizes for confidence levels of95% and 90%, and levels of precision of 10%, 20%, 25% and 50%.
For determining sample size from Table 8 when RR ~ 1, the values of both P 2 and RR are needed. Either of these may be calculated, if necessary, provided that P I is known:
and
If RR< 1, the values of PI and I/RR should be used instead.
An epidemiologist is planning a study to investigate the possibility that a certain lung disease is linked with exposure to a recently identified air pollutant. What sample size would be needed in each of two groups, exposed and not exposed, if the epidemiologist wishes to estimate the relative risk to within 50% of the true value (which is believed to be approximately 2) with 95% confidence? The disease is present in 20% of people who are not exposed to the air pollutant.
(a) Anticipated probability of disease given "exposure" Anticipated probability of disease given "no exposure" Anticipated relative risk
(b) Confidence level (c) Relative precision
? 20%
2 95% 50%
Table 8d (page 55) shows that for RR = 2 and P 2 = 0.20 a sample size of 44 would be needed in each group.
12

Required information and notation
Example 17
Solution
Cohort studies
Hypothesis tests for a relative risk
This section outlines how to determine the minimum sample size for testing the hypothesis that the population relative risk is equal to one.
(p) Test value of the relative risk under the null hypothesis RRo = 1 (h) Two of the following should be known:
• Anticipated probability of disease in people exposed to the variable PI
• Anticipated probability of disease in people not exposed to the variable
• Anticipated relative risk ( c) Level of significance (d) Power of the test ( e) Alternative hypothesis
(for two-sided test)
Pz RRa
100()(% 100(1-rn%
Tables 9a~c (pages 60~62) present minimum sample sizes for a level of significance of 5% and powers of 90%, 80% and 50% in two-sided tests.
For determining sample size from Table 9 when RRa > 1, the values of both P z and RRa are needed. Either of these may be calculated, if necessary, provided that P I is known:
RRa= PI/Pz
and
If RRa < 1, the values of PI and l/RRa should be used instead.
Two competing therapies for a particular cancer are to be evaluated by a cohort study in a multicentre clinical trial. Patients will be randomized to either treatment A or treatment B and will be followed for 5 years after treatment for recurrence of the disease. Treatment A is a new therapy that will be widely used if it can be demonstrated that it halves the risk of recurrence in the first 5 years after treatment (i.e. RRa = 0.5); 35 % recurrence is currently observed in patients who have received treatment B. How many patients should be studied in each of the two treatment groups if the investigators wish to be 90% confident of correctly rejecting the null hypothesis (RRo = 1), if it is false, and the test is to be performed at the 5 % level of significance?
(a) Test value of the relative risk (b) Anticipated probability of recurrence given treatment A
Anticipated probability of recurrence given treatment B Anticipated relative risk
( c ) Level of Significance ( d) Power of the test
1 ?
35% 0.5
5% 90%
(e) Alternative hypothesis rela ti ve risk =I- 1
13
Sample size determination
Table 9a (page 60) shows that for RRa = 0.5 (1/ RRa = 2) and P 2 = 0.35 (P 1
= 0.175) a sample size of 135 would be needed in each group (figure obtained by interpolation; the exact sample size is 131 by computation).
14

Required information and notation
Example 18
Lot quality assurance sampling
Accepting a population prevalence as not exceeding a specified value
This section outlines how to determine the minimum sample size that should be selected from a given population so that, if a particular characteristic is found in no more than a specified number of sampled individuals, the prevalence of the characteristic in the population can be accepted as not exceeding a certain value.
(a) Anticipated population prevalence (b) Population size (c) Maximum number of sampled individuals showing
characteristic ( d) Confidence level
P N
d* 100(1-C()%
Tables lOa-j (pages 63-68) present minimum sample sizes for confidence levels of 95% and 90% and values of d* of 0-4.
In a school of 2500 children, how many children should be examined so that if no more than two are found to have malaria parasitaemia it can be concluded, with 95% confidence, that the malaria prevalence in the school is no more than 10%?
Solution (a) Anticipated population prevalence ( h) Population size
10% 2500
2 95%
(c) Maximum number of malaria cases in the sample ( d) Confidence level
Table 10c (page 64) shows that for P = 0.1 0 and N = 2500 a sample size of 61 children would be needed.
Decision rule for "rejecting a lot"
This section applies to studies designed to test whether a "lot" ( a sampled population) meets a specified standard. The null hypothesis is that the proportion of individuals in the population with a particular characteristic is equal to a given value, and a one-sided test is set up such that the lot is accepted as meeting the specified standard only if the null hypothesis can
15

Required information and notation
Example 19
Solution
Sample size determination
be rejected. For this purpose a "threshold value" of individuals with the characteristic (d*) is computed as a basis for a decision rule; if the number of sampled individuals found to possess the characteristic does not exceed the threshold, the null hypothesis is rejected (and the lot is accepted), whereas if the threshold is exceeded, the lot is rejected.
(a) Test value of the population proportion under the null hypothesis
(b) Anticipated value of the population proportion ( c) Level of significance ( d) Power of the test
Po Pa
1001):% 100(1-(1)%
Tables lla-c (pages 69-71) present minimum sample sizes for a level of significance of 5% and powers of 90%, 80% and 50% in one-sided tests.
In a large city, the local health authority aims at achieving a vaccination coverage of 90% of all eligible children. In response to concern about outbreaks of certain childhood diseases in particular parts of the city, a team of investigators from the health authority is planning a survey to identify areas where vaccination coverage is 50% or less so that appropriate action may be taken. How many children should be studied, as a minimum, in each area and what threshold value should be used if the study is to test the hypothesis that the proportion of children not vaccinated is 50% or more, at the 5% level of significance? The investigators wish to be 90% sure of recognizing areas where the target vaccination coverage has been achieved (i.e. where only 10% of children have not been fully vaccinated).
(a) Test value of the population proportion (b) Anticipated value of the population proportion ( c ) Level of significance ( d) Power of the test
50% 10% 5%
90%
Because the mistake of accepting groups of children as adequately vaccinated, when in fact the coverage is 50% or less, is the more important, Po=0.50 and Pa=O.lO. Table lla (page 69) shows that in this case a sample size of 10 and a threshold value of 2 should be used.
Therefore, a sample of 10 children should be taken from each of the areas under study. If more than 2 children in a sample are found not to have been adequately vaccinated, the lot (the sampled population) should be "rejected", and the health authority may take steps to improve vaccination coverage in that particular area. If, however, only 2 (or fewer) children are found to be inadequately vaccinated, the null hypothesis should be rejected and the group of children may be accepted as not being of immediate priority for an intensified vaccination campaign.
16

Required information and notation
Example 20
Incidence-rate studies
Estimating an incidence rate with specified relative precision
(a) Relative precision (b) Confidence level
f:
100(1- et)%
Table 12 (page 72) presents minimum sample sizes for confidence levels of 99%,95% and·90%.
How large a sample of patients should be followed up if an investigator wishes to estimate the incidence rate of a disease to within 10% of its true value with 95% confidence?
Solution (a) Relative precision (b) Confidence level
10% 95%
Required information and notation
Table 12 shows that for [; = 0.10 and a confidence level of 95% a sample size of 385 would be needed.
Hypothesis tests for an incidence rate
This section applies to studies designed to test the hypothesis that the incidence rate of a characteristic is equal to a particular value.
(a) Test value of the popUlation incidence rate under the null hypothesis
(b) Anticipated value of the population incidence rate (c) Level of significance
Ao Aa
100et% 100(1- fJ)%
Aa > Ao or Aa < Ao (for one-sided test)
Aa #- Ao (for two-sided test)
(d) Power of the test (e) Alternative hypothesis: either
or
Tables 13a-d (pages 73-76) present minimum sample sizes for a level of significance of 5 %, powers of 90% and 80% and both one-sided and twosided tests.
17
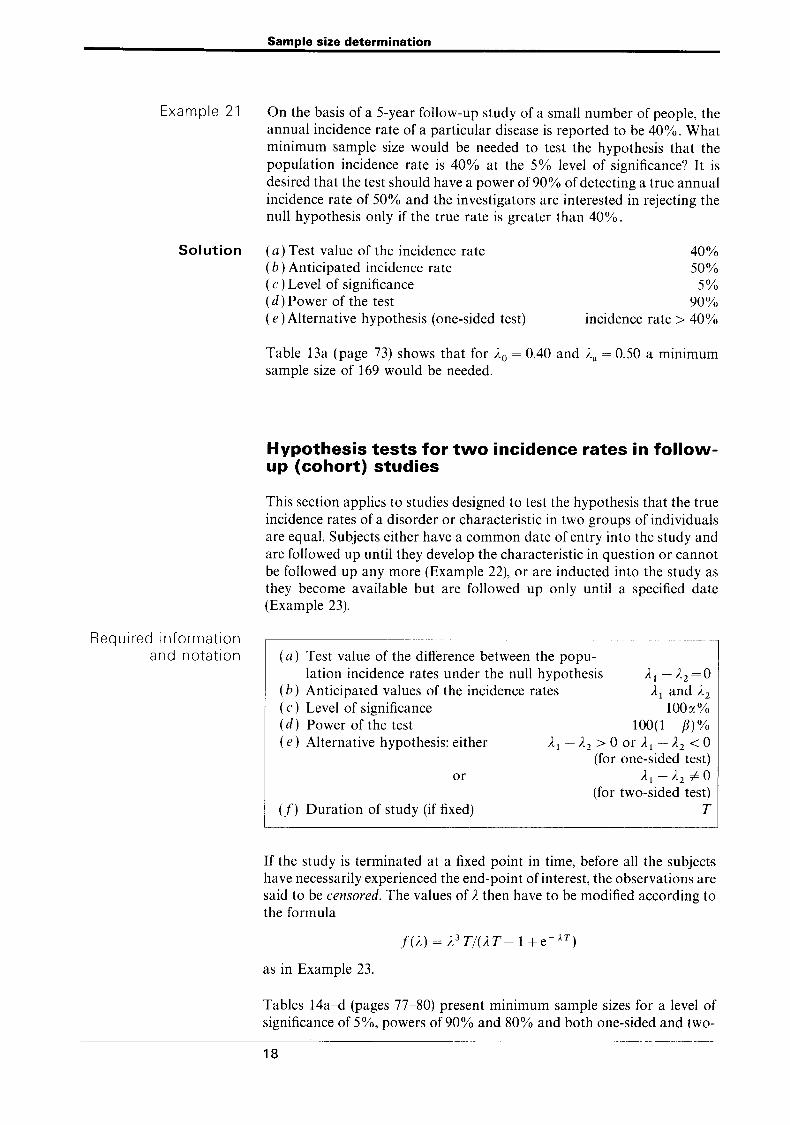
Example 21
Solution
Required information and notation
Sample size determination
On the basis of a 5-year follow-up study of a small number of people, the annual incidence rate of a particular disease is reported to be 40%. What minimum sample size would be needed to test the hypothesis that the population incidence rate is 40% at the 5% level of significance? It is desired that the test should have a power of90% of detecting a true annual incidence rate of 50% and the investigators are interested in rejecting the null hypothesis only if the true rate is greater than 40%.
(a) Test value of the incidence rate (b) Anticipated incidence rate ( c ) Level of significance ( d) Power of the test (e) Alternative hypothesis (one-sided test)
40% 50% 5%
90% incidence rate> 40%
Table 13a (page 73) shows that for ..1.0 = 0.40 and Aa = 0.50 a minimum sample size of 169 would be needed.
Hypothesis tests for two incidence rates in followup (cohort) studies
This section applies to studies designed to test the hypothesis that the true incidence rates of a disorder or characteristic in two groups of individuals are equal. Subjects either have a common date of entry into the study and are followed up until they develop the characteristic in question or cannot be followed up any more (Example 22), or are inducted into the study as they become available but are followed up only until a specified date (Example 23).
(a) Test value of the difference between the popu-lation incidence rates under the null hypothesis
(b) Anticipated values of the incidence rates ..1. 1-..1.2=0 Al and ..1.2
100a% 100(1-[3)%
( c) Level of significance ( d) Power of the test ( e) Alternative hypothesis: either
or
(f) Duration of study (if fixed)
)'1 - )'2 > 0 or Al - ..1.2 < 0 (for one-sided test)
..1.1-..1.2 #0 (for two-sided test)
T
If the study is terminated at a fixed point in time, before all the subjects have necessarily experienced the end-point of interest, the observations are said to be censored. The values of A then have to be modified according to the formula
as in Example 23.
Tables 14a-d (pages 77-80) present minimum sample sizes for a level of significance of 5%, powers of 90% and 80% and both one-sided and two-
18

Incidence-rate studies
sided tests, when the duration of the study is not fixed and the two groups studied are of equal size. No tables are given for studies of fixed duration because too many parameters are involved to permit easy tabulation.
Example 22 As part of a study of the long-term effect of noise on workers in a particularly noisy industry, it is planned to follow up a cohort of people who were recruited into the industry during a given period of time and to compare them with a similar cohort of individuals working in a much quieter industry. Subjects will be followed up for the rest of their lives or until their hearing is impaired. The results of a previous small-scale survey suggest that the annual incidence rate of hearing impairment in the noisy industry may be as much as 25%. How many people should be followed up in each of the groups (which are to be of equal size) to test the hypothesis that the incidence rates for hearing impairment in the two groups are the same, at the 5% level of significance and with a power of 80%? The alternative hypothesis is that the annual incidence rate for hearing impairment in the quieter industry is not more than the national average of about 10% (for people in the same age range), whereas in the noisy industry it differs from this.
Solution (a) Test value of the difference in incidence rates (b) Anticipated incidence rates
o 25% and 10%
5% 80%
Al =P )'2
not applicable
Example 23
( c ) Level of significance ( d) Power of the test ( e ) Alternative hypothesis (two-sided test) (f) Duration of study
Table 14d (page 80) shows that for Al = 0.25 and A2 = 0.10 a sample size of 23 would be required in each group.
A study similar to that outlined in Example 22 is to be undertaken, but the duration of the study will be limited to 5 years. How many subjects should be followed up in each group?
Solution (a) Test value of the difference in incidence rates (b) Anticipated incidence rates
o 25% and 10%
5% 80%
Al =P A2 5 years
( c) Level of significance ( d) Power of the test (e) Alternative hypothesis (two-sided test) (f) Duration of study
The values of ), must be modified according to the formula for f(A) given on page 18:
f(I =0.175) = 0.0918 where X = (AI + A2 )/2 f(AI =0.25) = 0.1456 f(A2 =0.10) = 0.0469.
The appropriate sample size formula is
where k is the ratio of the sample size for the second group of subjects (n 2 )
to that for the first group (nd (in this example k = 1).
19

Sample size determination
Thus
n 1 = {1.96)[2(0.0918)J + 0.842)(0.1456 + 0.0469)}2/(0.25 - 0.10)2 = 1.462/0.023 = 65.0.
A sample size of 65 would therefore be needed for each group.
For a one-sided test the corresponding sample size formula is
20
a
p
Case--control studies
Cluster sampling
Cohort studies
Confidence level
Design effect
Incidence rate
Lot quality assurance sampling
Null hypothesis
Definitions of commonly used terms
The brief definitions listed here are intended to serve only as reminders for the reader. Fuller explanations of statistical terms and a discussion of the statistical theory relevant to sample size determination are to be found in Lemeshow, S. et al., Adequacy of sample size in health studies (Chichester, John Wiley, 1990; published on behalf of the World Health Organization).
The significance level of a test the probability of rejecting the null hypothesis when it is true (or the probability of making a Type I error).
The probability of failing to reject the null hypothesis when it is false (or the probability of making a Type II error).
Studies in which subjects are selected on the basis of their status with respect to a given characteristic (such as the presence of a disease); the "cases" show the characteristic and the "controls" do not. Both groups are studied with respect to their prior and current exposure to suspected risk factors.
A sampling process in which sampling units are made up of clusters or groups of study units.
Studies in which subjects are selected with respect to the presence and absence of a characteristic (such as exposure to a given factor) suspected of being associated with the particular outcome of interest (for example a disease). Both groups of subjects are followed up for development of the outcome.
The probability that an estimate of a population parameter is within certain specified limits of the true value; commonly denoted by "I-a".
In cluster sampling, the design effect is an indication of the variation due to clustering. It is estimated by the ratio of the variance when cluster sampling is used to the variance when simple random sampling is used.
The number of specific events (for example new cases of a disease) occurring in a specified population per unit time.
Sampling techniques, with industrial origins, designed to ascertain whether batches of items meet specified standards.
A statement concerning the value of a population parameter. It is the hypothesis under test in a test of significance, for example the hypothesis that an observed difference is entirely due to sampling errOr.
21
Odds ratio
One-sided test
Population proportion
Power of a test
Precision
Prevalence
Relative risk
Significance level
Simple random sampling
Study units
Two-sided test
Sample size determination
The ratio of the odds of occurrence of an event in one set of circumstances to the odds of its occurrence in another (see also page 9).
In hypothesis testing, when the difference being tested is directionally specified beforehand (for example when Xl < X 2, but not Xl> X 2, is being tested against the null hypothesis Xl = X 2).
The proportion of individuals in a population possessing a given characteristic.
The probability of correctly rejecting the null hypothesis when it is false; commonly denoted by "1 - {J".
A measure of how close an estimate is to the true value of a population parameter. It may be expressed in absolute terms or relative to the estimate.
The number of cases of a disease (or people with a particular characteristic) existing in a specified population at a given point in time.
The ratio of the risk (probability) of an outcome (for example disease or death) among people exposed to a given factor to the risk among people not exposed.
See definition of iY..
Sampling procedure in which every study unit has the same chance of being selected and every sample of the same size has the same chance of being chosen.
The individual members of a population whose characteristics are to be measured.
In hypothesis testing, when the difference being tested for significance is not directionally specified beforehand (for example when the test takes no account of whether Xl> X 2 or Xl < X 2).
Represent the number of standard errors from the mean; Zl-" and Zl-,,/2
are functions of the confidence level and Z 1 _ p is a function of the power of the test.
22
Tables of minimum sample size

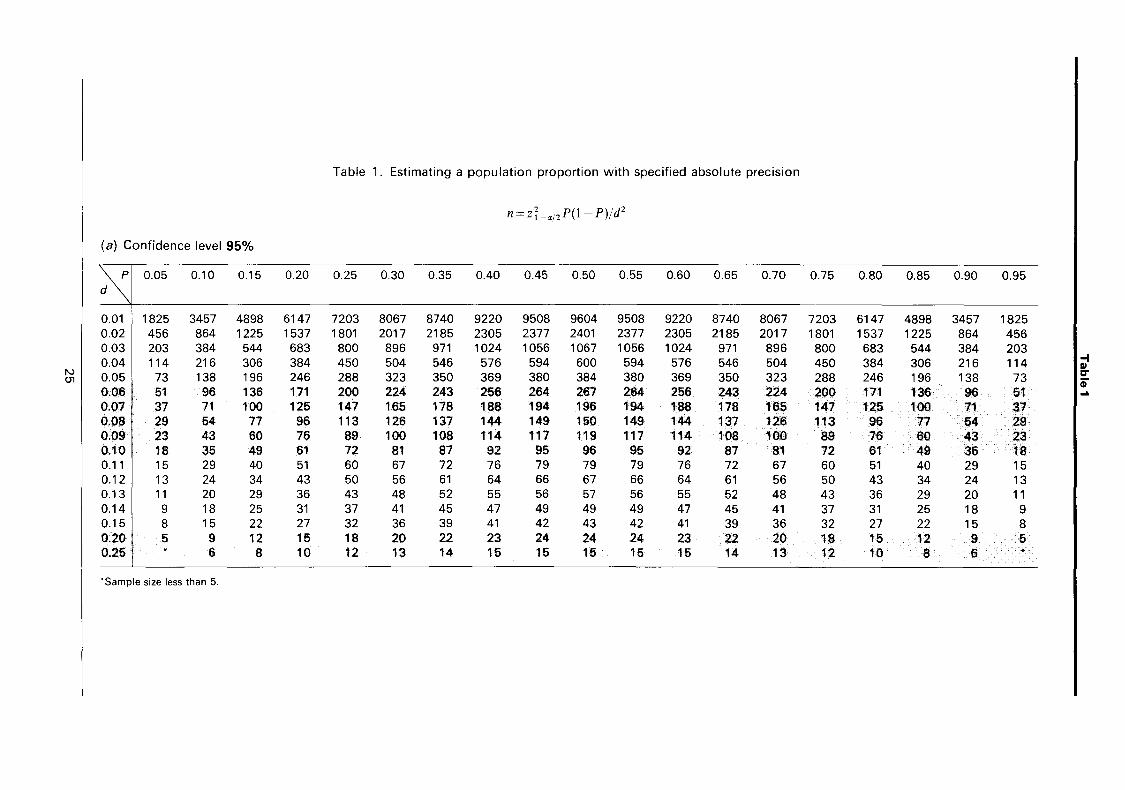
Table 1. Estimating a population proportion with specified absolute precision
n = zi -a/2P(1- P)/d2
(a) Confidence level 95%
p 0.05 0.10 0.15 0.20 0.25 0.30 0.35 0.40 0.45 0.50 0.55 0.60 0.65 0.70 0.75 0.80 0.85 0.90 0.95 d
0.01 1825 3457 4898 6147 7203 8067 8740 9220 9508 9604 9508 9220 8740 8067 7203 6147 4898 3457 1825 0.02 456 864 1225 1537 1801 2017 2185 2305 2377 2401 2377 2305 2185 2017 1801 1537 1225 864 456 0.03 203 384 544 683 800 896 971 1024 1056 1067 1056 1024 971 896 800 683 544 384 203 0.04 114 216 306 384 450 504 546 576 594 600 594 576 546 504 450 384 306 216 114
I~ ~I 0.05 73 138 196 246 288 323 350 369 380 384 380 369 350 323 288 246 196 138 73 0.06 51 96 136 171 200 224 243 256 264 267 264 256 243 224 200 171 136 96 51 0.07 37 71 100 125 147 165 178 188 194 196 194 188 178 165 147 125 100 71 37 0.08 29 54 77 96 113 126 137 144 149 150 149 144 137 126 113 96 77 54 29 0.09 23 43 60 76 89 100 108 114 117 119 117 114 108 100 89 76 60 43 23 0.10 18 35 49 61 72 81 87 92 95 96 95 92 87 81 72 61 49 35 18 0.11 15 29 40 51 60 67 72 76 79 79 79 76 72 67 60 51 40 29 15 0.12 13 24 34 43 50 56 61 64 66 67 66 64 61 56 50 43 34 24 13 0.13 11 20 29 36 43 48 52 55 56 57 56 55 52 48 43 36 29 20 1 1 0.14 9 18 25 31 37 41 45 47 49 49 49 47 45 41 37 31 25 18 9 0.15 8 15 22 27 32 36 39 41 42 43 42 41 39 36 32 27 22 15 8 0.20 5 9 12 15 18 20 22 23 24 24 24 23 22 20 18 15 12 9 5 0.25 6 8 10 12 13 14 15 15 15 15 15 14 13 12 10 8 6
'Sample size less than 5.

Table 1 ( continued)
(b) Confidence level 90%
p 0.05 0.10 0.15 0.20 0.25 0.30 0.35 0.40 0.45 0.50 0.55 0.60 0.65 0.70 0.75 0.80 0.85 0.90 0.95 d
0.01 1285 2435 3450 4330 5074 5683 6156 6494 6697 6765 6697 6494 6156 5683 5074 4330 3450 2435 1285 en 0.02 321 609 863 1268 1421 1624 1674 1691 1674 1624 1539 1421 1268 1082 863 609
III 1082 1539 321 3
0.03 143 271 383 481 564 631 684 722 744 752 744 722 684 631 564 481 383 271 143 "CI
0.04 80 152 216 271 317 355 385 406 419 423 419 406 385 355 317 271 216 152 80 iD 1/1
0.05 51 97 138 173 203 227 246 260 268 271 268 260 246 227 203 173 138 97 51 jij'
0.06 36 96 158 180 186 188 186 180 171 158 141 120 96 68 36 CD
~I 68 120 141 171 Q.
0.07 26 50 70 88 104 116 126 133 137 138 137 133 126 116 104 88 70 50 26 CD .... 0.08 20 38 54 68 79 89 96 101 105 106 105 101 96 89 79 68 54 38 20 CD ... 0.09 16 30 43 53 63 70 76 80 83 84 83 80 76 70 63 53 43 30 16 3
S' 0.10 13 24 35 43 51 57 62 65 67 68 67 65 62 57 51 43 35 24 13 III .... 0.11 11 20 29 36 42 47 51 54 55 56 55 54 51 47 42 36 29 20 11 0' 0.12 9 17 24 30 35 39 43 45 47 47 47 45 43 39 35 30 24 17 9 :s
0.13 8 14 20 26 30 34 36 38 40 40 40 38 36 34 30 26 20 14 8 0.14 7 12 18 22 26 29 31 33 34 35 34 33 31 29 26 22 18 12 7 0.15 6 11 15 19 23 25 27 29 30 30 30 29 27 25 23 19 15 11 6 0.20 6 9 11 13 14 15 16 17 17 17 16 15 14 13 11 9 6 0.25 6 7 8 9 10 10 11 11 11 10 10 9 8 7 6 * *
'Sample size less than 5.

Table 2. Estimating a population proportion with specified relative precision
n=zi _>/z(l-P)/sz P
(a) Confidence level 95%
p 0.05 0.10 0.15 0.20 0.25 0.30 0.35 0.40 0.45 0.50 0.55 0.60 0.65 0.70 0.75 0.80 0.85 0.90 0.95 G
0.01 729904 345744 217691 153664 115248 89637 71344 57624 46953 38416 31431 25611 20686 16464 12805 9604 6779 4268 2022 0.02 182476 86436 54423 38416 28812 22409 17836 14406 11738 9604 7858 6403 5171 4116 3201 2401 1695 1067 505 0.03 81100 38416 24188 17074 12805 9960 7927 6403 5217 4268 3492 2846 2298 1829 1423 1067 753 474 225 0.04 45619 21609 13606 9604 7203 5602 4459 3602 2935 2401 1964 1601 1293 1029 800 600 424 267 126 -I
III
tjl 0.05 29196 13830 8708 6147 4610 3585 2854 2305 1878 1537 1257 1024 827 659 512 384 271 171 81 cr CD
0.06 20275 9604 6047 4268 3201 2490 1982 1601 1304 1067 873 711 575 457 356 267 188 119 56 N
0.07 14896 7056 4443 3136 2352 1829 1456 1176 958 784 641 523 422 336 261 196 138 87 41 0.08 11405 5402 3401 2401 1801 1401 1115 900 734 600 491 400 323 257 200 150 106 67 32 0.09 9011 4268 2688 1897 1423 1107 881 711 580 474 388 316 255 203 158 119 84 53 25 0.10 7299 3457 2177 1537 1152 896 713 576 470 384 314 256 207 165 128 96 68 43 20 0.15 3244 1537 968 683 512 398 317 256 209 171 140 114 92 73 57 43 30 19 9 0.20 1825 864 544 384 288 224 178 144 117 96 79 64 52 41 32 24 17 11 5 0.25 1168 553 348 246 184 143 114 92 75 61 50 41 33 26 20 15 11 7 0.30 811 384 242 171 128 100 79 64 52 43 35 28 23 18 14 11 8 5 0.35 596 282 178 125 94 73 58 47 38 31 26 21 17 13 10 8 6 0.40 456 216 136 96 72 56 45 36 29 24 20 16 13 10 8 6 .. 0.50 292 138 87 61 46 36 29 23 19 15 13 10 8 7 5
• Sample size less than 5.

Table 2 ( continued)
(b) Confidence level 90%
p 0.05 0.10 0.15 0.20 0.25 0.30 0.35 0.40 0.45 0.50 0.55 0.60 0.65 0.70 0.75 0.80 0.85 0.90 0.95 e
0.01 514145 243542 153341 108241 81181 63141 50255 40590 33074 27060 22140 18040 14571 11597 9020 6765 4775 3007 1424 en 0.02 128536 60886 38335 27060 20295 15785 12564 10148 8268 6765 5535 4510 3643 2899 2255 1691 1194 752 356 CI
3 0.03 57127 27060 17038 12027 9020 7016 5584 4510 3675 3007 2460 2004 1619 1289 1002 752 531 334 158 'C
0.04 32134 15221 9584 6765 5074 3946 3141 2537 2067 1691 1384 1128 911 725 564 423 298 188 89 i' 0.05 20566 9742 6134 4330 3247 2526 2010 1624 1323 1082 886 722 583 464 361 271 191 120 57 III
j;j'
0.06 14282 6765 4259 3007 2255 1754 1396 1128 919 752 615 501 405 322 251 188 133 84 40 CD
~I 0.07 10493 4970 3129 2209 1657 1289 1026 828 675 552 452 368 297 237 184 138 97 61 29 Q. CD ..
0.08 8034 3805 2396 1691 1268 987 785 634 517 423 346 282 228 181 141 106 75 47 22 CD .. 0.09 6347 3007 1893 1336 1002 780 620 501 408 334 273 223 180 143 111 84 59 37 18 3 0.10 5141 2435 1533 1082 812 631 503 406 331 271 221 180 146 1'6 90 68 48 30 14 = CI 0.15 2285 1082 682 481 361 281 223 180 147 120 98 80 65 52 40 30 21 13 6 .. o· 0.20 1285 609 383 271 203 158 126 101 83 68 55 45 36 29 23 17 12 8 = 0.25 823 390 245 173 130 101 80 65 53 43 35 29 23 19 14 11 8 5 0.30 571 271 170 120 90 70 56 45 37 30 25 20 16 13 10 8 5 0.35 420 199 125 88 66 52 41 33 27 22 18 15 12 9 7 6 0.40 321 152 96 68 51 39 31 25 21 17 14 11 9 7 6 0.50 206 97 61 43 32 25 20 16 13 11 9 7 6 5
'Sample size less than 5.

Table 3. Hypothesis tests for a population proportion
For a one-sided test
11= [Zl-",/[Po(l-PO)]+Zl-p,/[Pa(l-Pa)J}2/(Po-Pa)2.
For a two-sided test
11 = {z 1 -,.'2 J [P 0(1 - P o)J + z 1 -pJ[Pa(1 - Pa)J}2 I(P 0 - Pa)2.
(a) Level of significance 5%, power 90%, one-sided test
pol 0.05 0.10 0.15 0.20 0.25 0.30 0.35 0.40 0.45 0.50 0.55 0.60 0.65 0.70 0.75 0.80 0.85 0.90 0.95 Pa
0.05 239 76 40 25 18 13 10 8 6 5 0.10 221 378 109 54 33 22 16 12 10 8 6 5
Ii ~I 0.15 67 362 498 137 66 39 26 19 14 11 8 7 5 0.20 34 102 485 601 161 75 44 29 20 15 11 9 7 5 0.25 21 49 131 589 686 180 83 48 31 21 16 12 9 7 5 0.30 15 30 62 156 676 754 195 88 50 32 22 16 12 9 7 5 * 0.35 11 20 36 72 176 746 804 205 92 52 33 22 16 11 8 6 5 0.40 8 14 24 42 80 191 799 837 211 93 52 32 22 15 11 8 6 0.45 7 11 17 27 46 87 203 834 853 213 93 51 31 21 14 10 7 0.50 5 9 13 19 30 49 91 210 852 852 210 91 49 30 19 13 9 5 0.55 7 10 14 21 31 51 93 213 853 834 203 87 46 27 17 11 7 0.60 6 8 11 15 22 32 52 93 211 837 799 191 80 42 24 14 8 0.65 5 6 8 11 16 22 33 52 92 205 804 746 176 72 36 20 11 0.70 5 7 9 12 16 22 32 50 88 195 754 676 156 62 30 15 0.75 5 7 9 12 16 21 31 48 83 180 686 589 131 49 21 0.80 5 7 9 11 15 20 29 44 75 161 601 485 102 34 0.85 5 7 8 11 14 19 26 39 66 137 498 362 67 0.90 5 6 8 10 12 16 22 33 54 109 378 221 0.95 5 6 8 10 13 18 25 40 76 239
• Sample size less than 5.

Table 3 ( continued)
(b) Level of significance 5%, power 80%, one-sided test ,
Po I 0.05 0.10 0.15 0.20 0.25 0.30 0.35 0.40 0.45 0.50 0.55 0.60 0.65 0.70 0.75 0.80 0.85 0.90 0.95 Pa
0.05 184 60 32 21 15 11 8 7 5 5 0.10 150 283 83 42 26 18 13 10 8 6 5 en 0.15 44 253 368 103 50 30 20 14 11 8 7 5 I»
0.20 22 69 342 441 119 56 33 22 15 11 9 7 5 3 'C
0.25 14 33 91 419 501 133 61 35 23 16 12 9 7 5 ;-0.30 9 20 43 109 483 548 143 65 37 24 16 12 9 6 5 III
N' 0.35 7 13 25 50 125 535 584 149 67 38 24 16 11 8 6 * III
W 0 0.40 5 10 16 29 57 137 574 607 153 68 38 23 16 11 8 5
Q. III
0.45 7 12 19 32 62 145 601 617 154 67 37 23 15 10 7 5 .. III ..
0.50 6 9 13 21 35 65 151 615 615 151 65 35 21 13 9 6 * ~. 0.55 5 7 10 15 23 37 67 154 617 601 145 62 32 19 12 7 = I» 0.60 5 8 11 16 23 38 68 153 607 574 137 57 29 16 10 5 .. o· 0.65 6 8 11 16 24 38 67 149 584 535 125 50 25 13 7 = 0.70 5 6 9 12 16 24 37 65 143 548 483 109 43 20 9 0.75 5 7 9 12 16 23 35 61 133 501 419 91 33 14 0.80 * 5 7 9 11 15 22 33 56 119 441 342 69 22 0.85 5 7 8 11 14 20 30 50 103 368 253' 44 0.90 5 6 8 10 13 18 26 42 83 283 150 0.95 5 5 7 8 11 15 21 32 60 184
* Sample size less than 5.

Table 3 ( continued)
(c) Level of significance 5%, power 90%, two-sided test
X 0.05 0.10 0.15 0.20 0.25 0.30 0.35 0.40 0.45 0.50 ~
I Pa- Pol
0.01 5353 9784 13686 17061 19911 22234 24032 25305 26052 26273 0.02 1423 2524 3490 4324 5026 5597 6036 6344 6521 6565 0.03 668 1155 1580 1947 2255 2504 2695 2827 2901 2916 0.04 395 667 905 1109 1279 1417 1522 1594 1633 1639
I! ~I 0.05 264 438 589 718 826 912 978 1022 1045 1047 0.10 79 122 1. 189 214 233 248 257 261 259 0.15 40 69 74 87 97 105 111 114 115 113 0.20 25 35 43 50 56 60 62 64 63 62 0.25 17 24 29 33 36 38 40 40 40 38 0.30 12 17 20 23 25 26 27 27 27 25 0.35 10 13 15 17 18 19 19 19 19 17 0.40 8 10 12 13 14 14 14 14 13 12 0.45 6 8 9 10 11 11 11 10 10 8 0.50 5 6 7 8 8 8 8 8 7
X is the smaller of Po and (1 - Pol· • Sample size less than 5.

Table 3 ( continued)
(d) Level of significance 5%, power 80%, two-sided test
~x 0.05 0.10 0.15 0.20 0.25 0.30 0.35 0.40 0.45 0.50
lPa- Pol en
0.01 3933 7250 10172 12701 14837 16580 17930 18888 19453 19626 I» 3
0.02 1031 1856 2582 3209 3737 4167 4499 4732 4868 4905 "0 ;-
0.03 478 844 1164 1440 1673 1861 2006 2107 2165 2179 1/1
0.04 280 485 664 818 947 1052 1132 1188 1219 1225 i:r CD
w 0.05 185 316 430 528 610 676 727 761 780 783 Q. N 0.10 53 86 114 131 161 172 184 111 181 114 CD .. 0.11 26 41 53 53 11 18 82 85 86 II
CD .. 0 •• 16 24 31 36 41 44 46 48 48 41 2.
::::I 0.21 11 16 20 24 a: 28 30 30 30 » I» .. 0.30 8 12 14 17 18 20 20 21 20 20 o· 0.35 6 9 11 12 13 14 15 15 15 14 ::::I
0.40 5 7 8 9 10 11 11 11 11 10 0.45 6 7 7 8 8 8 8 8 7 0.50 5 5 6 6 7 7 6 6
X is the smaller of Po and (1 - Po)' • Sample size less than 5.

Table 4. Estimating the difference between two population proportions with specified absolute precision
n =zI ~,dP dl- PI) + Pz(1- Pz)]/dz
or
n=zi~"lz V/d z
where
V=P 1 (l-Pd+P 2 (l-P Z )
(a) Values of V
X 0.01 0.02 0.03 0.04 0.05 0.10 0.15 0.20 0.25 0.30 0.35 0.40 0.45 0.50 Y
0.01 0.02 0.03 0.04 0.05 0.06 0.10 0.14 0.17 0.20 0.22 0.24 0.25 0.26 0.26 0.02 0.03 0.04 0.05 0.06 0.07 0.11 0.15 0.18 0.21 0.23 0.25 0.26 0.27 0.27 0.03 0.04 0.05 0.06 0.07 0.08 0.12 0.16 0.19 0.22 0.24 0.26 0.27 0.28 0.28 0.04 0.05 0.06 0.07 0.08 0.09 0.13 0.17 0.20 0.23 0.25 0.27 0.28 0.29 0.29 0.05 0.06 0.07 0.08 0.09 0.10 0.14 0.18 0.21 0.24 0.26 0.28 0.29 0.30 0.30 0.06 0.07 0.08 0.09 0.09 0.10 0.15 0.18 0.22 0.24 0.27 0.28 0.30 0.30 0.31
I~ ~I 0.07 0.08 0.08 0.09 0.10 0.11 0.16 0.19 0.23 0.25 0.28 0.29 0.31 0.31 0.32 0.08 0.08 0.09 0.10 0.11 0.12 0.16 0.20 0.23· 0.26 0.28 0.30 0.31 0.32 0.32 0.09 0.09 0.10 0.11 0.12 0.13 0.17 0.21 0.24 0.27 0.29 0.31 0.32 0.33 0.33 0.10 0.10 0.11 0.12 0.13 0.14 0.18 0.22 0.25 0.28 0.30 0.32 0.33 0.34 0.34 0.12 0.12 0.13 0.13 0.14 0.15 0.20 0.23 0.27 0.29 0.32 0.33 0.35 0.35 0.36 0.14 0.13 0.14 0.15 0.16 0.17 0.21 0.25 0.28 0.31 0.33 0.35 0.36 0.37 0.37 0.16 0.14 0.15 0.16 0.17 0.18 0.22 0.26 0.29 0.32 0.34 0.36 0.37 0.38 0.38 0.18 0.16 0.17 0.18 0.19 0.20 0.24 0.28 0.31 0.34 0.36 0.38 0.39 0.40 0.40 0.20 0.17 0.18 0.19 0.20 0.21 0.25 0.29 0.32 0.35 0.37 0.39 0.40 0.41 0.41 0.22 0.18 0.19 0.20 0.21 0.22 0.26 0.30 0.33 0.36 0.38 0.40 0.41 0.42 0.42 0.24 0.19 0.20 0.21 0.22 0.23 0.27 0.31 0.34 0.37 0.39 0.41 0.42 0.43 0.43 0.26 0.20 0.21 0.22 0.23 0.24 0.28 0.32 0.35 0.38 0.40 0.42 0.43 0.44 0.44 0.28 0.21 0.22 0.23 0.24 0.25 0.29 0.33 0.36 0.39 0.41 0.43 0.44 0.45 0.45 0.30 0.22 0.23 0.24 0.25 0.26 0.30 0.34 0.37 0.40 0.42 0.44 0.45 0.46 0.46 0.32 0.23 0.24 0.25 0.26 0.27 0.31 0.35 0.38 0.41 0.43 0.45 0.46 0.47 0.47 0.34 0.23 0.24 0.25 0.26 0.27 0.31 0.35 0.38 0.41 0.43 0.45 0.46 0.47 0.47 0.36 0.24 0.25 0.26 0.27 0.28 0.32 0.36 0.39 0.42 0.44 0.46 0.47 0.48 0.48 0.38 0.25 0.26 0.26 0.27 0.28 0.33 0.36 0.40 0.42 0.45 0.46 0.48 0.48 0.49 0.40 0.25 0.26 0.27 0.28 0.29 0.33 0.37 0.40 0.43 0.45 0.47 0.48 0.49 0.49 0.42 0.25 0.26 0.27 0.28 0.29 0.33 0.37 0.40 0.43 0.45 0.47 0.48 0.49 0.49 0.44 0.26 0.27 0.28 0.28 0.29 0.34 0.37 0.41 0.43 0.46 0.47 0.49 0.49 0.50 0.46 0.26 0.27 0.28 0.29 0.30 0.34 0.38 0.41 0.44 0.46 0.48 0.49 0.50 0.50 0.48 0.26 0.27 0.28 0.29 0.30 0.34 0.38 0.41 0.44 0.46 0.48 0.49 0.50 0.50 0.50 0.26 0.27 0.28 0.29 0.30 0.34 0.38 0.41 0.44 0.46 0.48 0.49 0.50 0.50
Xis the smaller of P2 and (1-P2 )·
Y is the smaller of P, and (1 - P,).
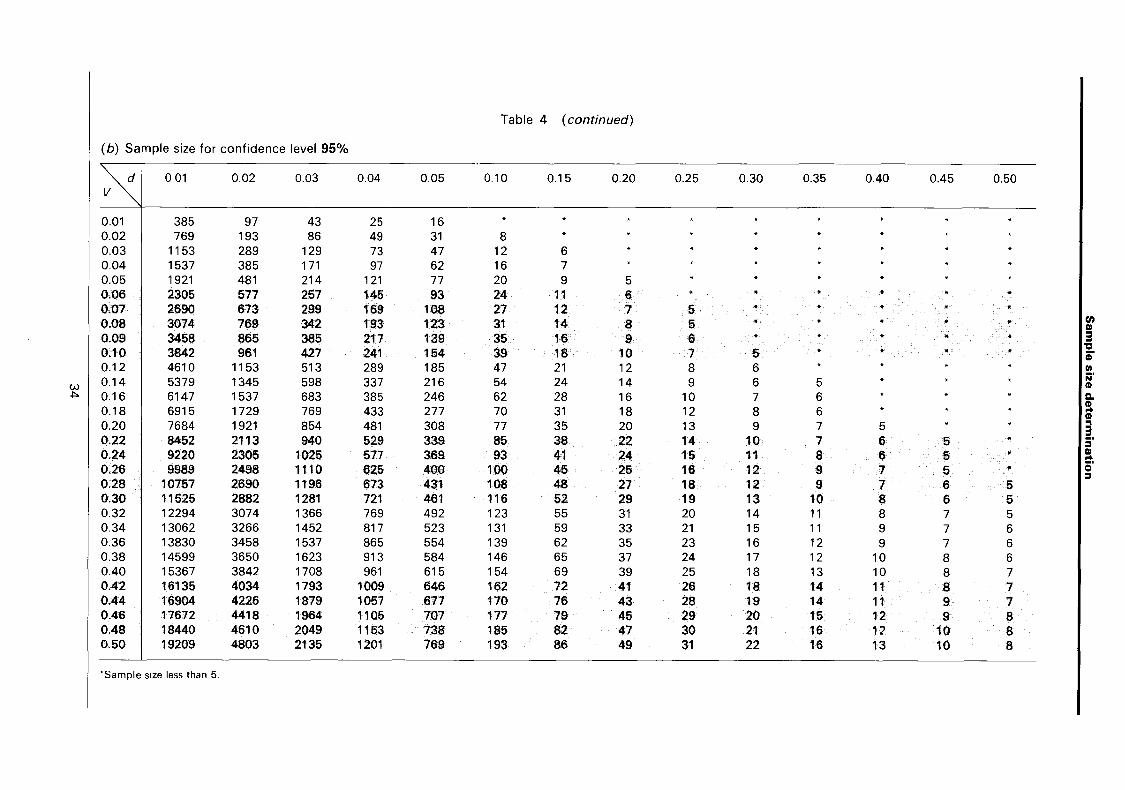
Table 4 ( continued)
(b) Sample size for confidence level 95%
d 0.01 0.02 0.03 0.04 0.05 0.10 0.15 0.20 0.25 0.30 0.35 0.40 0.45 0.50 V
0.01 385 97 43 25 16 0.02 769 193 86 49 31 8 0.03 1153 289 129 73 47 12 6 0.04 1537 385 171 97 62 16 7 0.05 1921 481 214 121 77 20 9 5 0.06 2305 577 257 145 93 24 11 6 * * 0.07 2690 673 299 169 108 27 12 7 5 * 0.08 3074 769 342 193 123 31 14 8 5 en
III 0.09 3458 865 385 217 139 35 16 9 6 * * 3 0.10 3842 961 427 241 154 39 18 10 7 5
'tI ii'
0.12 4610 1153 513 289 185 47 21 12 8 6 III
0.14 5379 1345 598 337 216 54 24 14 9 6 5 N' w III ~ 0.16 6147 1537 683 385 246 62 28 16 10 7 6 Q.
0.18 6915 1729 769 433 277 70 31 III
18 12 8 6 ... III
0.20 7684 1921 854 481 308 77 35 20 13 9 7 5 .. 3
0.22 8452 2113 940 529 339 85 38 22 14 10 7 6 5 5' 0.24 9220 2305 1025 577 369 93 41 24 15 11 8 6 5 * III ... 0.26 9989 2498 1110 625 400 100 45 25 16 12 9 7 5 * 0'
:::I 0.28 10757 2690 1196 673 431 108 48 27 18 12 9 7 6 5 0.30 11525 2882 1281 721 461 116 52 29 19 13 10 8 6 5 0.32 12294 3074 1366 769 492 123 55 31 20 14 11 8 7 5 0.34 13062 3266 1452 817 523 131 59 33 21 15 11 9 7 6 0.36 13830 3458 1537 865 554 139 62 35 23 16 12 9 7 6 0.38 14599 3650 1623 913 584 146 65 37 24 17 12 10 8 6 0.40 15367 3842 1708 961 615 154 69 39 25 18 13 10 8 7 0.42 16135 4034 1793 1009 646 162 72 41 26 18 14 11 8 7 0.44 16904 4226 1879 1057 677 170 76 43 28 19 14 11 9 7 0.46 17672 4418 1964 1105 707 177 79 45 29 20 15 12 9 8 0.48 18440 4610 2049 1153 738 185 82 47 30 21 16 12 10 8 0.50 19209 4803 2135 1201 769 193 86 49 31 22 16 13 10 8
'Sample size less than 5.
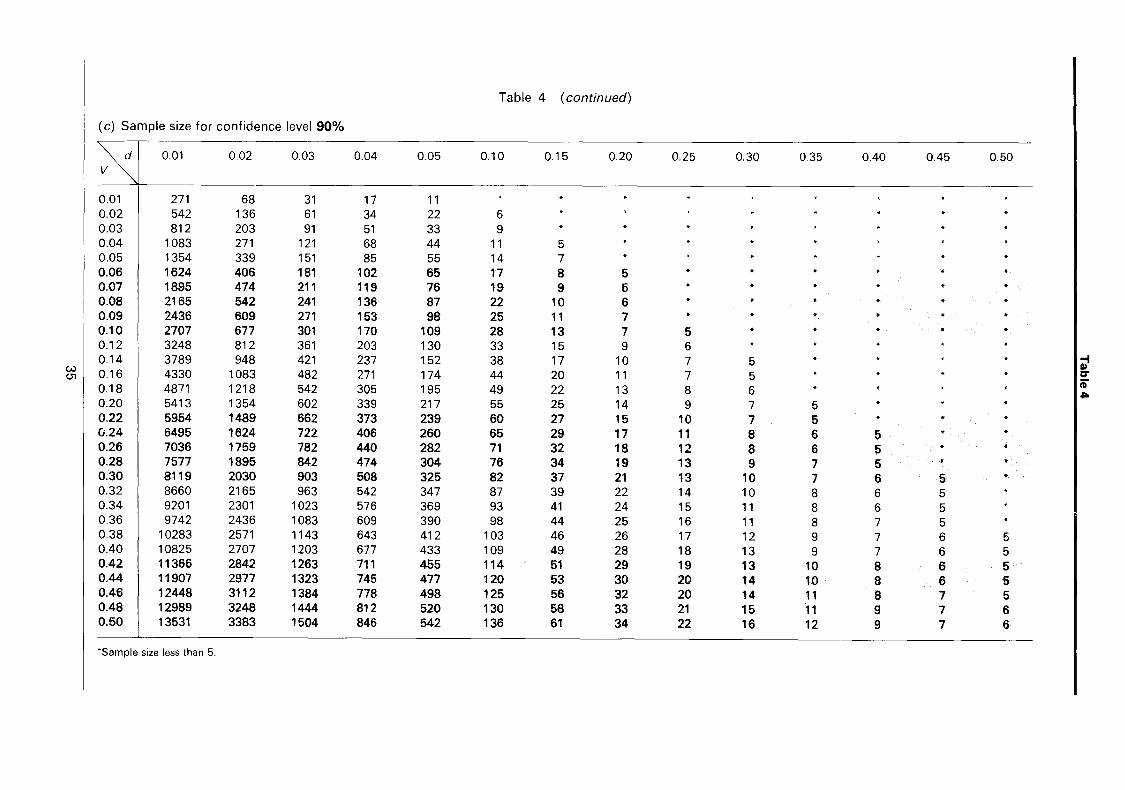
Table 4 ( continued)
(c) Sample size for confidence level 90%
d 0.01 0.02 0.03 0.04 0.05 0.10 0.15 0.20 0.25 0.30 0.35 0.40 0.45 0.50 V
0.01 271 68 31 17 11 0.02 542 136 61 34 22 6 0.03 812 203 91 51 33 9 0.04 1083 271 121 68 44 11 5 0.05 1354 339 151 85 55 14 7 0.06 1624 406 181 102 65 17 8 5 0.07 1895 474 211 119 76 19 9 5 * * 0.08 2165 542 241 136 87 22 10 6 0.09 2436 609 271 153 98 25 11 7 0.10 2707 677 301 170 109 28 13 7 5 0.12 3248 812 361 203 130 33 15 9 6
I~ 0.14 3789 948 421 237 152 38 17 10 7 5
~I 0.16 4330 1083 482 271 174 44 20 11 7 5 0.18 4871 1218 542 305 195 49 22 13 8 6 0.20 5413 1354 602 339 217 55 25 14 9 7 5 0.22 5954 1489 662 373 239 60 27 15 10 7 5 0.24 6495 1624 722 406 260 65 29 17 11 8 6 5 0.26 7036 1759 782 440 282 71 32 18 12 8 6 5 0.28 7577 1895 842 474 304 76 34 19 13 9 7 5 0.30 8119 2030 903 508 325 82 37 21 13 10 7 6 5 * 0.32 8660 2165 963 542 347 87 39 22 14 10 8 6 5 0.34 9201 2301 1023 576 369 93 41 24 15 11 8 6 5 0.36 9742 2436 1083 609 390 98 44 25 16 11 8 7 5 0.38 10283 2571 1143 643 412 103 46 26 17 12 9 7 6 5 0.40 10825 2707 1203 677 433 109 49 28 18 13 9 7 6 5 0.42 11366 2842 1263 711 455 114 51 29 19 13 10 8 6 5 0.44 11907 2977 1323 745 477 120 53 30 20 14 10 8 6 5 0.46 12448 3112 1384 778 498 125 56 32 20 14 11 8 7 5 0.48 12989 3248 1444 812 520 130 58 33 21 15 11 9 7 6 0.50 13531 3383 1504 846 542 136 61 34 22 16 12 9 7 6
'Sample size less than 5.

Table 5. Hypothesis tests for two population proportions
For a one-sided test
n = {z 1-,j[2P(1- P)] + zl_pj[P 1 (1- P tl + P2(1- P2)]}2 I(P 1 - P2)2
where P=(P1 +P2)/2.
For a two-sided test
n= {z 1-"!2j[2P(1- P)] +Zl -pJ[P 1 (1- P tl+ P2(1- P2)]}2 I(P 1 - P2)2.
For a one-sided test for small proportions
n ={z 1 _, + z 1 _p)2 1[0.00061 (arcsinJ P 2 - arcsinJ p 1)2].
For a two-sided test for small proportions
n = {Z 1 -2/2 + Z 1 _p)2 1[0.00061(arcsinJ P 2 - arcsinJp 1 )2]. I~
(a) Level of significance 5%, power 90%, one-sided test 3
I'E. CD 1/1
P, 0.05 0.10 0.15 0.20 0.25 0.30 0.35 0.40 0.45 0.50 0.55 0.60 0.65 0.70 0.75 0.80 0.85 0.90 0.95 ;:i' CD
~I P2 Q. CD ..
0.05 474 153 82 53 38 29 23 19 15 13 11 9 8 7 6 5 CD ... 0.10 474 748 217 109 67 46 34 26 21 17 14 12 10 8 7 6 5 3 0.15 153 748 988 273 131 79 53 39 29 23 18 15 12 10 9 7 6 5 = III
0.20 82 217 988 1194 320 150 89 59 42 31 24 19 16 13 10 ..
9 7 6 o· 0.25 53 109 273 1194 1365 358 166 96 63 44 33 25 20 16 13 10 8 7 = 0.30 38 67 131 320 1365 1502 388 177 101 66 46 33 25 20 16 12 10 8 0.35 29 46 79 150 358 1502 1605 410 185 105 67 46 33 25 19 15 12 9 0.40 23 34 53 89 166 388 1605 1674 423 189 106 67 46 33 24 18 14 11 0.45 19 26 39 59 96 177 410 1674 1708 427 189 105 66 44 31 23 17 13 0.50 15 21 29 42 63 101 185 423 1708 1708 423 185 101 63 42 29 21 15 0.55 13 17 23 31 44 66 105 189 427 1708 1674 410 177 96 59 39 26 19 0.60 11 14 18 24 33 46 67 106 189 423 1674 1605 388 166 89 53 34 23 0.65 9 12 15 19 25 33 46 67 105 185 410 1605 1502 358 150 79 46 29 0.70 8 10 12 16 20 25 33 46 66 101 177 388 1502 1365 320 131 67 38 0.75 7 8 10 13 16 20 25 33 44 63 96 166 358 1365 1194 273 109 53 0.80 6 7 9 10 13 16 19 24 31 42 59 89 150 320 1194 988 217 82 0.85 5 6 7 9 10 12 15 18 23 29 39 53 79 131 273 988 748 153 0.90 5 6 7 8 10 12 14 17 21 26 34 46 67 109 217 748 474 0.95 5 6 7 8 9 11 13 15 19 23 29 38 53 82 153 474
* Sample size less than 5.
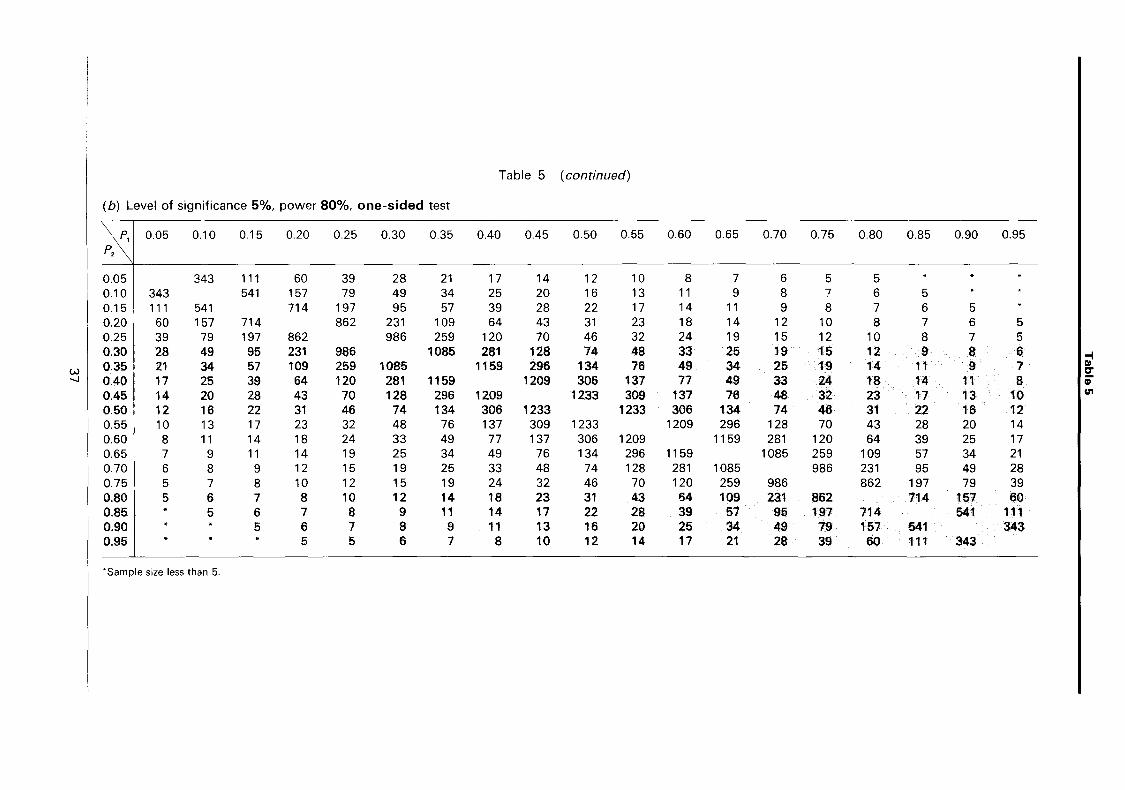
Table 5 ( continued)
(b) Level of significance 5%, power 80%, one-sided test
\ p,i 0.05 0.10 0.15 0.20 0.25 0.30 0.35 0.40 0.45 0.50 0.55 0.60 0.65 0.70 0.75 0.80 0.85 0.90 0.95 P \
2
0.05 343 111 60 39 28 21 17 14 12 10 8 7 6 5 5 0.10 343 541 157 79 49 34 25 20 16 13 11 9 8 7 6 5 0.15 111 541 714 197 95 57 39 28 22 17 14 11 9 8 7 6 5 0.20 60 157 714 862 231 109 64 43 31 23 18 14 12 10 8 7 6 5 0.25 39 79 197 862 986 259 120 70 46 32 24 19 15 12 10 8 7 5 0.30 28 49 95 231 986 1085 281 128 74 48 33 25 19 15 12 9 8 6
I~ ~I 0.35 21 34 57 109 259 1085 1159 296 134 76 49 34 25 19 14 11 9 7 0.40 17 25 39 64 120 281 1159 1209 306 137 77 49 33 24 18 14 11 8 0.45 14 20 28 43 70 128 296 1209 1233 309 137 76 48 32 23 17 13 10 0.50 12 16 22 31 46 74 134 306 1233 1233 306 134 74 46 31 22 16 12 0.55 10 13 17 23 32 48 76 137 309 1233 1209 296 128 70 43 28 20 14 0.60 8 11 14 18 24 33 49 77 137 306 1209 1159 281 120 64 39 25 17 0.65 7 9 11 14 19 25 34 49 76 134 296 1159 1085 259 109 57 34 21 0.70 6 8 9 12 15 19 25 33 48 74 128 281 1085 986 231 95 49 28 0.75 5 7 8 10 12 15 19 24 32 46 70 120 259 986 862 197 79 39 0.80 5 6 7 8 10 12 14 18 23 31 43 64 109 231 862 714 157 60 0.85 5 6 7 8 9 11 14 17 22 28 39 57 95 197 714 541 111 0.90 5 6 7 8 9 11 13 16 20 25 34 49 79 157 541 343 0.95 • 5 5 6 7 8 10 12 14 17 21 28 39 60 111 343
'Sample size less than 5.

Table 5 ( continued)
(c) Level of significance 5%, power 90%, two-sided test
~I 0.05 0.10 0.15 0.20 0.25 0.30 0.35 0.40 0.45 0.50
"en III
0.01 10924 19753 27531 34258 39933 44558 48132 50654 52126 52546 3 'tI
0.02 2962 5143 7062 8717 10110 11239 12107 12711 13053 13131 CD 0.03 1418 2376 3216 3940 4548 5038 5412 5669 5809 5832 1/1
0.04 854 1386 1852 2253 2588 2857 3061 3199 3271 3278 iii' CD
w 0.05 582 918 1212 1465 1675 1843 1969 2053 2095 2095 Q. (Xl CD
0.10 188 266 336 393 440 477 503 519 524 5f9 .. CD
0.15 101 133 181 1. 203 217 2T1 231 231 ai? ... 3
0.20 65 82 97 109 118 125 128 130 128 125 S· 0.25 47 57 85 72 77 81 82 82 81 77 III .. 0.30 36 42 47 52 54 56 57 68 54 62 cj'
= 0.35 28 33 36 39 40 41 41 40 39 36 0.40 23 26 28 30 31 31 31 30 28 26 0.45 19 21 23 24 24 24 24 23 21 19 0.50 16 17 19 19 19 19 19 17 16 14
x is the smallest of P" (1 - P,). P2 and (1 - P2 ).
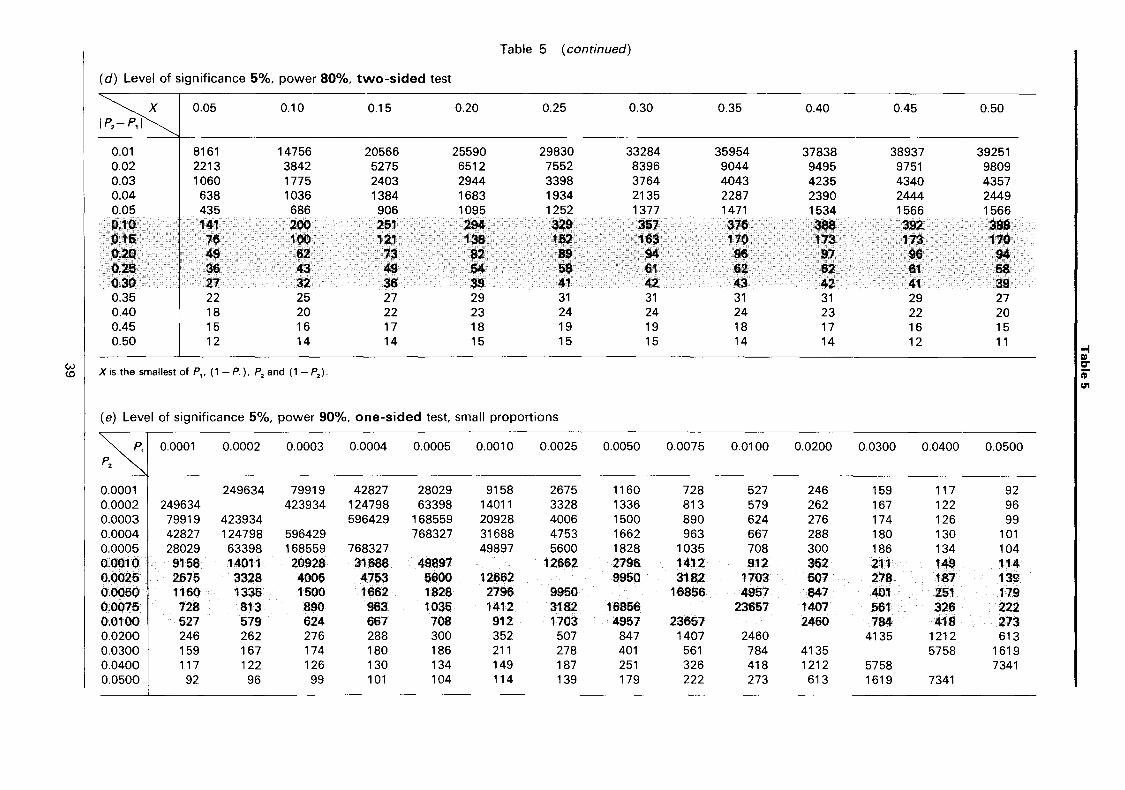
Table 5 ( continued)
(d) Level of significance 5%, power 80%, two-sided test
~x I 0.05 0.10 0.15 0.20 0.25 0.30 0.35 0.40 0.45 0.50 IP2- P,1
0.01 8161 14756 20566 25590 29830 33284 35954 37838 38937 39251 0.02 2213 3842 5275 6512 7552 8396 9044 9495 9751 9809 0.03 1060 1775 2403 2944 3398 3764 4043 4235 4340 4357 0.04 638 1036 1384 1683 1934 2135 2287 2390 2444 2449 0.05 435 686 906 1095 1252 1377 1471 1534 1566 1566 0.10 141 200 251 294 329 357 376 388 392 388 0.15 76 100 121 138 152 163 170 173 173 170 4).20 49 62 73 82 89 94 96 97 96 94 0.25 36. 43 49 54 58 61 62 62 61 58 0.30 27 32 36 39 41 42 43 42 41 39 0.35 22 25 27 29 31 31 31 31 29 27 0.40 18 20 22 23 24 24 24 23 22 20 0.45 15 16 17 18 19 19 18 17 16 15 0.50 12 14 14 15 15 15 14 14 12 11 "-I
= w X is the smallest of Pl' (1 - P,). P2 and (1 - P2 ). cr
co iD en
(e) Level of significance 5%, power 90%, one-sided test. small proportions
"-P, I 0.0001 0.0002 0.0003 0.0004 0.0005 0.0010 0.0025 0.0050 0.0075 0.0100 0.0200 0.0300 0.0400 0.0500
P2
0.0001 249634 79919 42827 28029 9158 2675 1160 728 527 246 159 117 92 0.0002 249634 423934 124798 63398 14011 3328 1336 813 579 262 167 122 96 0.0003 79919 423934 596429 168559 20928 4006 1500 890 624 276 174 126 99 0.0004 42827 124798 596429 768327 31688 4753 1662 963 667 288 180 130 101 0.0005 28029 63398 168559 768327 49897 5600 1828 1035 708 300 186 134 104 0.0010 9158 14011 20928 31688 49897 12662 ·2796 1412 912 362 211 149 114 0.0025 2676 3328 4006 4763 6600 12662 9960 3182 1703 607 278 187 13B 0.0050 1160 1336 1500 1662 1828 2796 9950 16856 4957 847 401 251 179 0.0075 728 813 890 963 1035 1412 3182 16856 23657 1407 661 326 222 0.0100 527 579 624 667 708 912 1703 4957 23657 2460 784 418 273 0.0200 246 262 276 288 300 352 507 847 1407 2460 4135 1212 613 0.0300 159 167 174 180 186 211 278 401 561 784 4135 5758 1619 0.0400 117 122 126 130 134 149 187 251 326 418 1212 5758 7341 0.0500 92 96 99 101 104 114 139 179 222 273 613 1619 7341
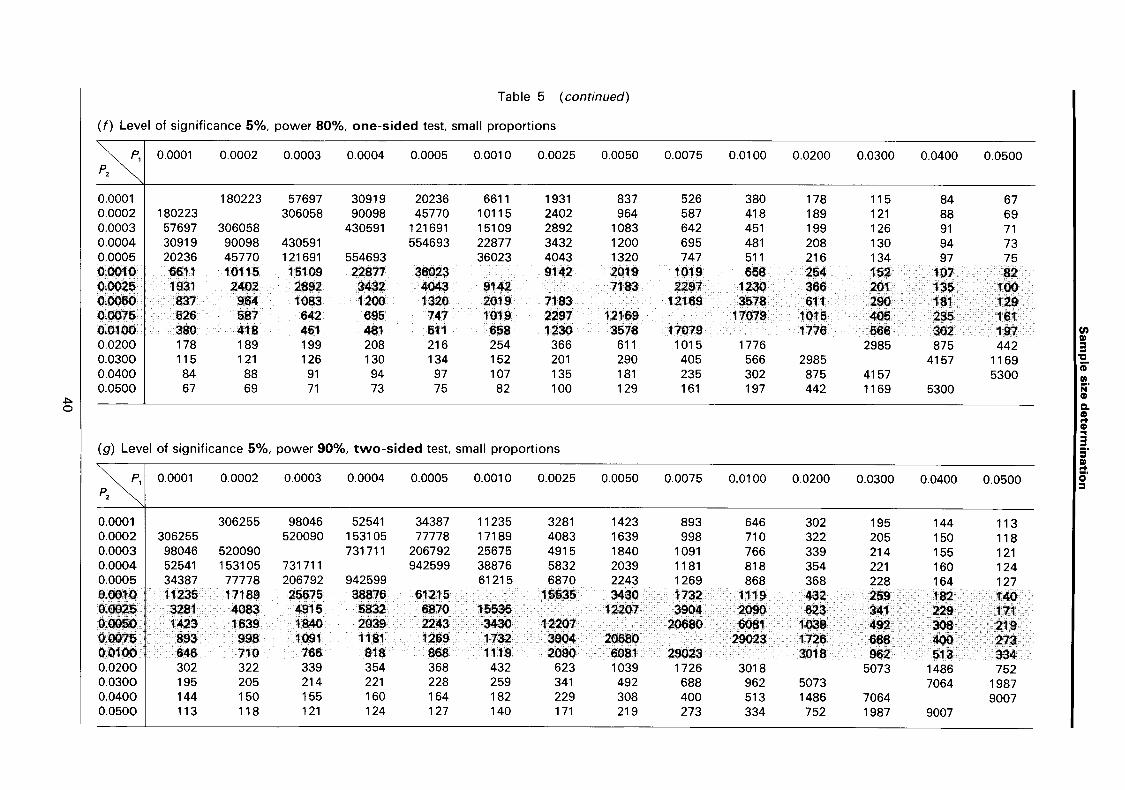

Table 5 ( continued)
(h) Level of significance 5%, power 80%, two-sided test, small proportions
P1 i 0.0001 0.0002 0.0003 0.0004 0.0005 0.0010 0.0025 0.0050 0.0075 0.0100 0.0200 0.0300 0.0400 0.0500 P2
0.0001 228767 73239 39247 25686 8392 2451 1063 667 483 226 146 107 85 0.0002 228767 388498 114367 58099 12840 3050 1224 745 530 241 153 112 88 0.0003 73239 388498 546575 154470 19179 3671 1374 815 572 253 160 116 91
I! .j::. 0.0004 39247 114367 546575 704104 29040 4356 1523 882 611 264 165 119 93 ..... 0.0005 25686 58099 154470 704104 45727 5132 1675 948 648 275 171 123 95 0.OQ10 8392 12840 19179 29040 457.27 11604 2562 1294 836 323 193 136 104 ().002$ 2451 3050 3671 4356 5132 11604 9118 2916 1561 465 255 171 127 0.0050 1063 1224 1374 1523 1675 2562 9118 15447 4542 776 368 230 164 0.0075 667 745 816 882 948 1294 2916 15447 21680 1289 614 299 204 0.0100 483 630 572 611 648 836 1561 4542 21680 2254 719 383 250 0.0200 226 241 253 264 275 323 465 776 1289 2254 3789 1110 561 0.0300 146 153 160 165 171 193 255 368 514 719 3789 5277 1484 0.0400 107 112 116 119 123 136 171 230 299 383 1110 5277 6728 0.0500 85 88 91 93 95 104 127 164 204 250 561 1484 6728
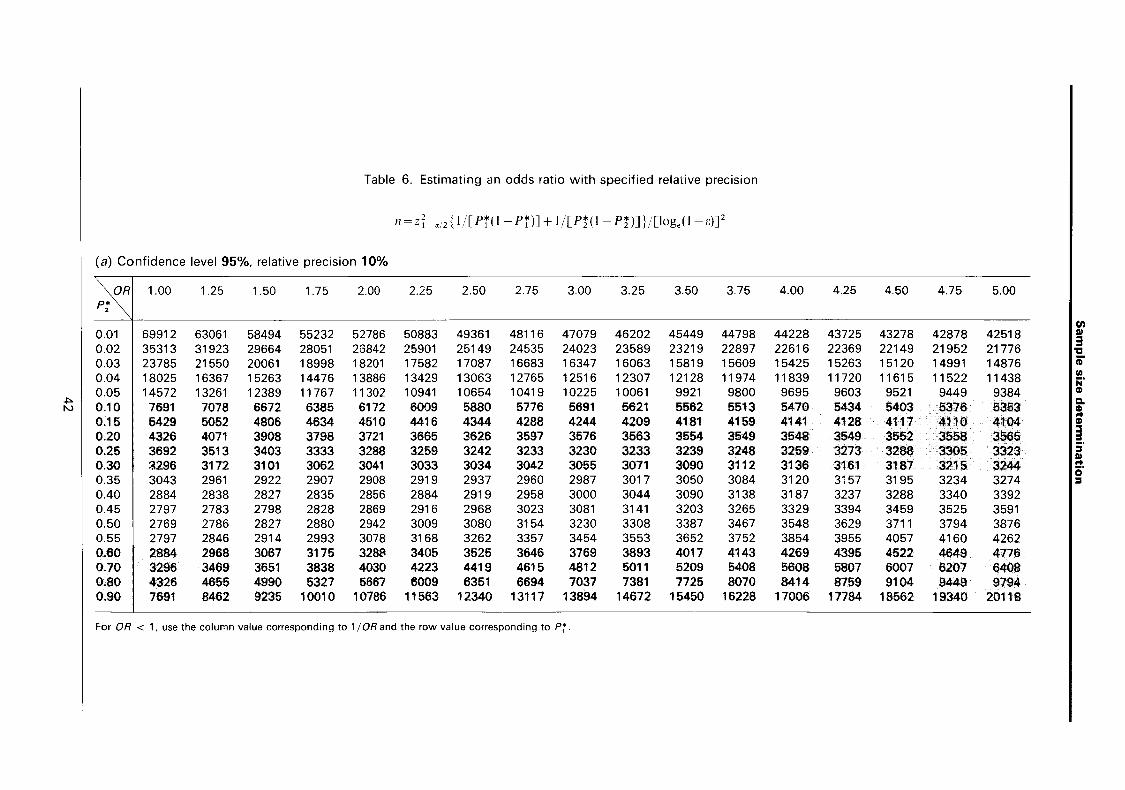
Table 6. Estimating an odds ratio with specified relative precision
n = zi -a/2 {1 /[Pi( 1 - Pi)] + 1 /[P!(1- P!)]} /[loge(1- e)Y
(a) Confidence level 95%, relative precision 10%
'\oRI 1.00 1.25 1.50 1.75 2.00 2.25 2.50 2.75 3.00 3.25 3.50 3.75 4.00 4.25 4.50 4.75 5.00 P* 2
en 0.01 69912 63061 58494 55232 52786 50883 49361 48116 47079 46202 45449 44798 44228 43725 43278 42878 42518 I»
3 0.02 35313 31923 29664 28051 26842 25901 25149 24535 24023 23589 23219 22897 22616 22369 22149 21952 21776 'tI 0.03 23785 21550 20061 18998 18201 17582 17087 16683 16347 16063 15819 15609 15425 15263 15120 14991 14876 CD 0.04 18025 16367 15263 14476 13886 13429 13063 12765 12516 12307 12128 11974 11839 11720 11615 11522 11438 III
j;j' 0.05 14572 13261 12389 11767 11302 10941 10654 10419 10225 10061 9921 9800 9695 9603 9521 9449 9384 CD
~I 0.10 7691 7078 6672 6385 6172 6009 5880 5776 5691 5621 5562 5513 5470 5434 5403 5376 5353 Q. CD
0.15 5429 4510 4416 4344 4288 4244 4209 4181 4159 4141 4128 4117 4110 4104 ..
5052 4806 4634 CD .. 0.20 4326 4071 3908 3798 3721 3665 3626 3597 3576 3563 3554 3549 3548 3549 3552 3558 3565 3 0.25 3692 3513 3403 3333 3288 3259 3242 3233 3230 3233 3239 3248 3259 3273 3288 3305 3323 5'
I» 0.30 3296 3172 3101 3062 3041 3033 3034 3042 3055 3071 3090 3112 3136 3161 3187 3215 3244 ..
0' 0.35 3043 2961 2922 2907 2908 2919 2937 2960 2987 3017 3050 3084 3120 3157 3195 3234 3274 ::I
0.40 2884 2838 2827 2835 2856 2884 2919 2958 3000 3044 3090 3138 3187 3237 3288 3340 3392 0.45 2797 2783 2798 2828 2869 2916 2968 3023 3081 3141 3203 3265 3329 3394 3459 3525 3591 0.50 2769 2786 2827 2880 2942 3009 3080 3154 3230 3308 3387 3467 3548 3629 3711 3794 3876 0.55 2797 2846 2914 2993 3078 3168 3262 3357 3454 3553 3652 3752 3854 3955 4057 4160 4262 0.60 2884 2968 3067 3175 3288 3405 3525 3646 3769 3893 4017 4143 4269 4395 4522 4649 4776 0.70 3296 3469 3651 3838 4030 4223 4419 4615 4812 5011 5209 5408 5608 5807 6007 6207 6408 0.80 4326 4655 4990 5327 5667 6009 6351 6694 7037 7381 7725 8070 8414 8759 9104 9449 9794 0.90 7691 8462 9235 10010 10786 11563 12340 13117 13894 14672 15450 16228 17006 17784 18562 19340 20118
For OR < 1, use the colur.m value corresponding to 1 lOR and the row value corresponding to Pi.

Table 6 ( continued)
(b) Confidence level 95%, relative precision 20%
\oRI 1.00 1.25 1.50 1.75 2.00 2.25 2.50 2.75 3.00 3.25 3.50 3.75 4.00 4.25 4.50 4.75 5.00 P* 2
0.01 15587 14059 13041 12314 11768 11344 11005 10727 10496 10301 10133 9988 9860 9748 9649 9560 9479 0.02 7873 7117 6614 6254 5984 5775 5607 5470 5356 5259 5177 5105 5042 4987 4938 4894 4855 0.03 5303 4805 4473 4236 4058 3920 3810 3720 3645 3581 3527 3480 3439 3403 3371 3343 3317 0.04 4019 3649 3403 3228 3096 2994 2913 2846 2791 2744 2704 2670 2640 2613 2590 2569 2550 0.05 3249 2957 2762 2624 2520 2440 2376 2323 2280 2243 2212 2185 2162 2141 2123 2107 2093 0.10 1715 1578 1488 1424 1376 1340 1311 1288 1269 1254 1240 1229 1220 1212 1205 1199 1194
I~ ~ 0.15 1211 1127 1072 1034 1006 985 969 956 946 939 932 928 924 921 918 917 915 w 0.20 965 908 872 847 830 818 809 802 798 795 793 792 791 792 792 794 795 0.25 823 784 759 744 733 727 723 721 721 721 722 724 727 730 733 737 741 0.30 735 708 692 683 678 677 677 679 681 685 689 694 699 705 711 717 724 0.35 679 660 652 649 649 651 655 660 666 673 680 688 696 704 713 721 730 0.40 643 633 631 632 637 643 651 660 669 679 689 700 711 722 733 745 757 0.45 624 621 624 631 640 650 662 674 687 701 714 728 743 757 772 786 801 0.50 618 622 631 643 656 671 687 704 721 738 755 773 791 809 828 846 865 0.55 624 635 650 668 687 707 728 749 770 792 815 837 859 882 905 928 951 0.60 643 662 684 708 733 760 786 813 841 868 896 924 952 980 1008 1037 1065 0.70 735 774 814 856 899 942 985 1029 1073 1117 1162 1206 1251 1295 1340 1384 1429 0.80 965 1038 1113 1188 1264 1340 1416 1493 1569 1646 1723 1799 1876 1953 2030 2107 2184 0.90 1715 1887 2059 2232 2405 2578 2751 2925 3098 3271 3445 3618 3792 3965 4139 4312 4486
For OR < 1, use the column value corresponding to 1/ OR and the row value corresponding to Pi.

Table 6 (continued)
(c) Confidence level 95%, relative precision 25%
""'OR I 1.00 1.25 1.50 1.75 2.00 2.25 2.50 2.75 3.00 3.25 3.50 3.75 4.00 4.25 4.50 4.75 5.00 p.
2
0.01 9378 8459 7846 7409 7081 6825 6621 6454 6315 6198 6097 6009 5933 5865 5805 5752 5703 0.02 4737 4282 3979 3763 3601 3475 3374 3291 3223 3165 3115 3072 3034 3001 2971 2945 2921 (I)
0.03 3191 2891 2691 2549 2442 2359 2292 2238 2193 2155 2122 2094 2069 2048 2028 2011 1996 III 3
0.04 2418 2196 2048 1942 1863 1802 1753 1713 1679 1651 1627 1606 1588 1572 1558 1546 1535 "CI
0.05 1955 1779 1662 1579 1516 1468 1429 1398 1372 1350 1331 1315 1301 1288 1278 1268 1259 ;-UI
(UO 1()32 960 896 867 828 806 789 775 764 1M 741 7. 734 729 726 m 118 jij'
0.16 721 078 &46 822 006 593 583 576 570 566 .1 5. 566 514 - .2 .1 CD
tl CI. 0;20 M1 M8 625 510 499 492 487 493 - 478 477 476 476 478 417 478 419 CD .. 0.28 - 472 467 448 441 438 435 4M 4M 434 435 ... - - 441 444 448 CD .. 0 .• 443 425 416 411 408 407 407 408 4'0 4'2 415 4,a 421 424 4D 432 - 3 s· 0.35 409 398 392 390 390 392 394 397 401 405 409 414 419 424 429 434 440 III
0.40 387 381 380 381 383 387 392 397 403 409 415 421 428 435 441 448 455 .. o·
0.45 376 374 376 380 385 392 399 406 414 422 430 438 447 456 464 473 482 = 0.50 372 374 380 387 395 404 414 424 434 444 455 465 476 487 498 509 520 0.55 376 382 391 402 413 425 438 451 464 477 490 504 517 531 545 558 572 0.80 387 399 412 426 441 457 473 489 506 523 539 556 573 590 - 014 041 0~70 443 ... 490 615 541 587 593 619 646 672 699 725 753 119 .. - .. 0.80 581 625 670 715 761 806 852 898 944 - 1 OIl 1083 1121 1116 1m 1. 1t14 0.90 1032 1135 1239 1343 1447 1551 1658 1760 1864 1. 2073 2177 2111 2316 2490 2_ ·2611
For OR< 1, use the column value corresponding to 1 lOR and the row value corresponding to Pi.

Table 6 ( continued)
(d) Confidence level 95%, relative precision 50%
pRi 1.00 1.25 1.50 1.75 2.00 2.25 2.50 2.75 3.00 3.25 3.50 3.75 4.00 4.25 4.50 4.75 5.00 P* 2
0.01 1616 1458 1352 1277 1220 1176 1141 1112 1088 1068 1051 1036 1022 1011 1000 991 983 0.02 816 738 686 649 621 599 582 567 556 546 537 530 523 517 512 508 504 0.03 550 498 464 439 421 407 395 386 378 372 366 361 357 353 350 347 344 0.04 417 379 353 335 321 311 302 295 290 285 281 277 274 271 269 267 265 0.05 337 307 287 272 262 253 247 241 237 233 230 227 224 222 220 219 217 0~10 118 164 155 148 143 139 136 134 132 130 129 128 127 126 125 125 124
I~ ~I 0.15 126 117 112 108 105 103 101 100 99 98 97 97 96 96 96 95 95 0.20 100 95 91 88 86 85 84 84 83 83 83 82 82 82 83 83 83 0.25 86 82 79 78 76 76 75 75 75 75 75 76 76 76 76 77 77 0.30 71 74 72 71 71 71 71 71 71 71 72 72 13 14 74 75 75 0.35 71 69 68 68 68 68 68 69 70 70 71 72 73 73 74 75 76 0.40 67 66 66 66 66 67 68 69 70 71 72 73 74 75 76 78 79 0.45 65 65 65 66 67 68 69 70 72 73 74 76 77 79 80 82 83 0.50 64 65 66 67 68 70 72 73 75 77 79 81 82 84 86 88 90 0.55 65 66 68 70 72 74 76 78 80 83 85 87 90 92 94 97 99 0.60 61 69 71 74 76 79 82 85 88 90 93 96 99 102 105 108 111 0.70 77 81 85 89 94 98 103 107 112 116 121 125 130 135 139 144 149 0.80 100 108 116 124 131 139 147 155 163 171 179 187 195 203 211 219 227 0.90 178 196 214 232 250 268 286 304 322 339 357 375 393 411 429 447 465
For OR< 1, use the column value corresponding to 1/ OR and the row value corresponding to P~.
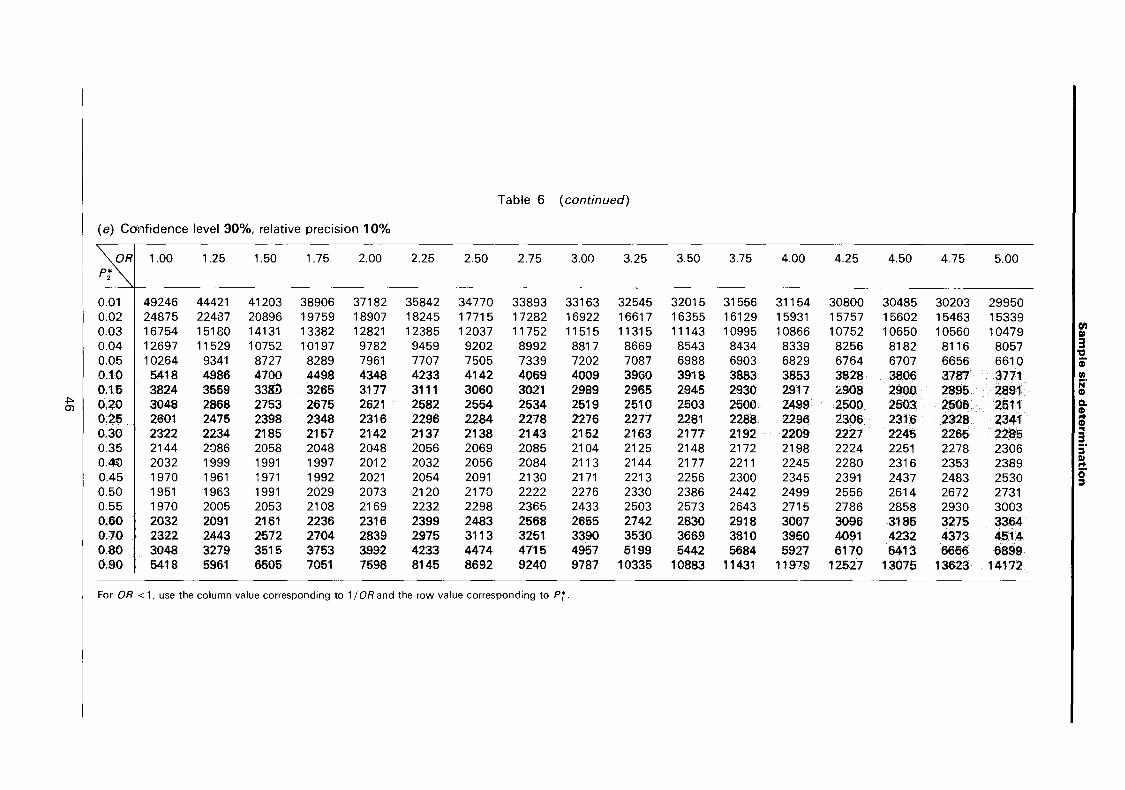
Table 6 ( continued)
(e) COi'lfidence level 90%, relative precision 10%
~oRI 1.00 1.25 1.50 1.75 2.00 2.25 2.50 2.75 3.00 3.25 3.50 3.75 4.00 4.25 4.50 4.75 5.00 P* 2
0.01 49246 44421 41203 38906 37182 35842 34770 33893 33163 32545 32015 31556 31154 30800 30485 30203 29950 0.02 24875 22487 20896 19759 18907 18245 17715 17282 16922 16617 16355 16129 15931 15757 15602 15463 15339 0.03 16754 15180 14131 13382 12821 12385 12037 11752 11515 11315 11143 10995 10866 10752 10650 10560 10479 en = 0.04 12697 11529 10752 10197 9782 9459 9202 8992 8817 8669 8543 8434 8339 8256 8182 8116 8057 3
"CI 0.05 10264 9341 8727 8289 7961 7707 7505 7339 7202 7087 6988 6903 6829 6764 6707 6656 6610 CD 0.10 5418 4986 4700 4498 4348 4233 4142 4069 4009 3960 3918 3883 3853 3828 3806 3787 3771 1/1
0.15 3824 3559 33~ 3265 3177 3111 3060 3021 2989 2965 2945 2930 2917 2908 2900 2895 2891 i;r CD
~I 0.20 3048 2868 2753 2675 2621 2582 2554 2534 2519 2510 2503 2500 2499 2500 2503 2506 2511 Q. CD
0.25 2601 2475 2398 2348 2316 2296 2284 2278 2276 2277 2281 2288 2296 2306 2316 2328 2341 .. CD
0.30 2322 2234 2185 2157 2142 2137 2138 2143 2152 2163 2177 2192 2209 2227 2245 2265 2285 .. 3
0.35 2144 2086 2058 2048 2048 2056 2069 2085 2104 2125 2148 2172 2198 2224 2251 2278 2306 = O.~ 2032 1999 1991 1997 2012 2032 2056 2084 2113 2144 2177 2211 2245 2280 2316 2353 2389 = .. 0.45 1970 1961 1971 1992 2021 2054 2091 2130 2171 2213 2256 2300 2345 2391 2437 2483 2530 o·
= 0.50 1951 1963 1991 2029 2073 2120 2170 2222 2276 2330 2386 2442 2499 2556 2614 2672 2731 0.55 1970 2005 2053 2108 2169 2232 2298 2365 2433 2503 2573 2643 2715 2786 2858 2930 3003 0.60 2032 2091 2161 2236 2316 2399 2483 2568 2655 2742 2830 2918 3007 3096 3185 3275 3364 0.70 2322 2443 2572 2704 2839 2975 3113 3251 3390 3530 3669 3810 3950 4091 4232 4373 4514 0.80 3048 3279 3515 3753 3992 4233 4474 4715 4957 5199 5442 5684 5927 6170 6413 6656 6899 0.90 5418 5961 6505 7051 7598 8145 8692 9240 9787 10335 10883 11431 11979 12527 13075 13623 14172
For OR < 1, use the column value corresponding to 1/ OR and the row value corresponding to Pi.
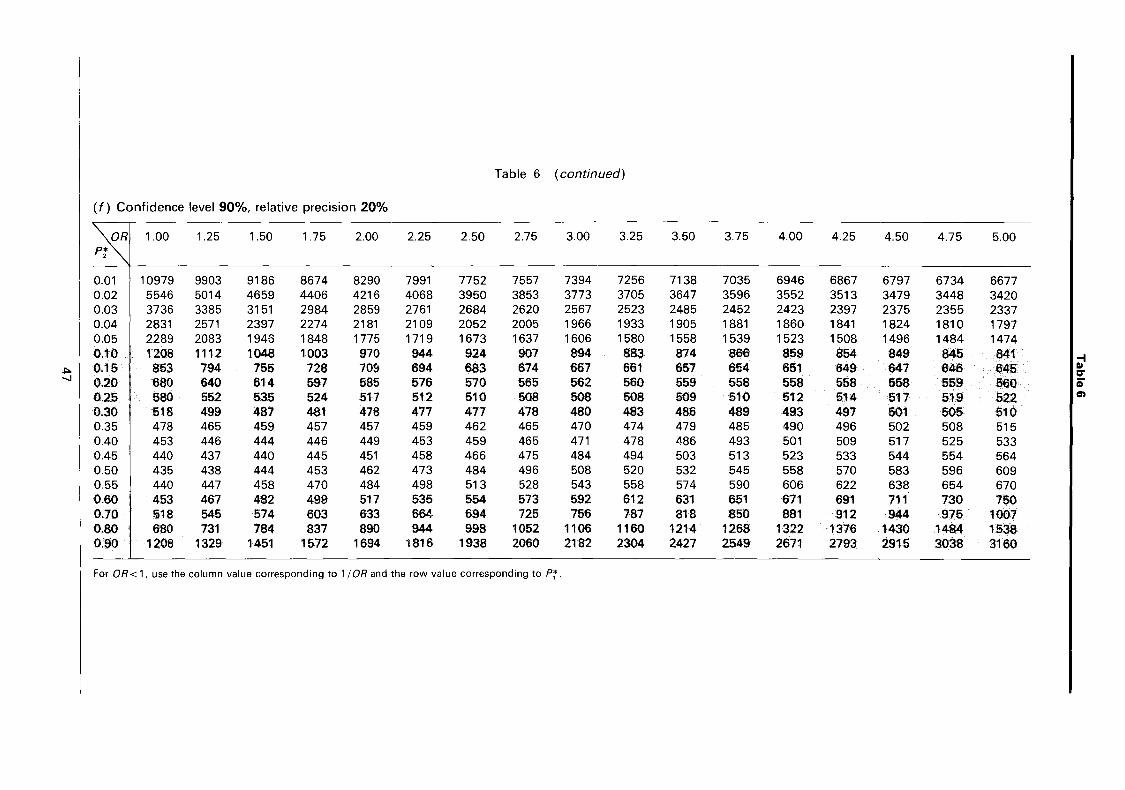
Table 6 ( continued)
(f) Confidence level 90%, relative precision 20%
,PRJ 1.00 1.25 1.50 1.75 2.00 2.25 2.50 2.75 3.00 3.25 3.50 3.75 4.00 4.25 4.50 4.75 5.00 p*
2
0.01 10979 9903 9186 8674 8290 7991 7752 7557 7394 7256 7138 7035 6946 6867 6797 6734 6677 0.02 5546 5014 4659 4406 4216 4068 3950 3853 3773 3705 3647 3596 3552 3513 3479 3448 3420 0.03 3736 3385 3151 2984 2859 2761 2684 2620 2567 2523 2485 2452 2423 2397 2375 2355 2337 0.04 2831 2571 2397 2274 2181 2109 2052 2005 1966 1933 1905 1881 1860 1841 1824 1810 1797 0.05 2289 2083 1946 1848 1775 1719 1673 1637 1606 1580 1558 1539 1523 1508 1496 1484 1474 0.10 1208 1112 1048 1003 970 944 924 907 894 883 874 866 859 854 849 845 841
I~ ~I 0.15 853 794 755 728 709 694 683 674 667 661 657 654 651 649 647 646 645 0.20 680 640 614 597 585 576 570 565 562 560 559 558 558 558 558 559 560 0.25 580 552 535 524 517 512 510 508 508 508 509 510 512 514 517 519 522 0.30 518 499 487 481 478 477 477 478 480 483 486 489 493 497 501 505 510 0.35 478 465 459 457 457 459 462 465 470 474 479 485 490 496 502 508 515 0.40 453 446 444 446 449 453 459 465 471 478 486 493 501 509 517 525 533 0.45 440 437 440 445 451 458 466 475 484 494 503 513 523 533 544 554 564 0.50 435 438 444 453 462 473 484 496 508 520 532 545 558 570 583 596 609 0.55 440 447 458 470 484 498 513 528 543 558 574 590 606 622 638 654 670 0.60 453 467 482 499 517 535 554 573 592 612 631 651 671 691 711 730 750 0.70 518 545 574 603 633 664 694 725 756 787 818 850 881 912 944 975 1007 0.80 680 731 784 837 890 944 998 1052 1106 1160 1214 1268 1322 1376 1430 1484 1538 0.90 1208 1329 1451 1572 1694 'i816 1938 2060 2182 2304 2427 2549 2671 2793 2915 3038 3160
For OR < 1, use the column value corresponding to 1/ OR and the row value corresponding to Pi.

Table 6 ( continued)
(g) Confidence level 90%, relative precision 25% \
1.00 1.25 1.50 1.75 2.00 2.25 2.50 2.75 3.00 3.25 3.50 3.75 4.00 4.25 4.50 4.75 5.00
0.01 6606 5959 5527 5219 4988 4808 4664 4547 4449 4366 4295 4233 4179 4132 4089 4052 4018 0.02 3337 3017 2803 2651 2537 2448 2377 2319 2270 2229 2194 2164 2137 2114 2093 2075 2058 rn 0.03 2248 2037 1896 1795 1720 1662 1615 1577 1545 1518 1495 1475 1458 1443 1429 1417 1406 DI
3 0.04 1703 1547 1443 1368 1312 1269 1235 1206 1183 1163 1146 1132 1119 1108 1098 1089 1081 ~
0.05 1377 1253 1171 1112 1068 1034 1007 985 966 951 938 926 916 908 900 893 887 i' III
0.10 727 669 631 604 584 568 556 546 538 532 526 521 517 514 511 508 506 N' 0.15 513 478 455 438 427 418 411 406 401 398 395 393 392 390 389 389 388 CD
~ CI. (Xl 0.20 409 385 370 359 352 347 343 340 338 337 336 336 336 336 336 337 337 CD ..
0.25 349 332 322 315 311 308 307 306 306 306 306 307 308 310 311 313 314 CD .. 0.30 312 300 293 290 288 287 287 288 289 291 292 294 297 299 302 304 307 3 0.35 288 280 277 275 275 276 278 280 283 286 289 292 295 299 302 306 310 :i'
DI
0.40 273 269 268 268 270 273 276 280 284 288 292 297 302 306 311 316 321 .. o·
0.45 265 263 265 268 271 276 281 286 292 297 303 309 315 321 327 333 340 :::I
0.50 262 264 268 273 278 285 292 298 306 313 320 328 336 343 351 359 367 0.55 265 269 276 283 291 300 309 318 327 336 346 355 365 374 384 393 403 0.60 273 281 290 300 311 322 333 345 357 368 380 392 404 416 428 440 452 0.70 312 328 345 363 381 399 418 436 455 474 493 511 530 549 568 587 606 0.80 409 440 472 504 536 568 600 633 665 698 730 763 795 828 861 893 926 0.90 727 800 873 946 . 1020 1093 1166 1240 1313 1387 1460 1534 1607 1681 1754 1828 1901
For OR < 1. use the column value corresponding to 1/ OR and the row value corresponding to Pi.

Table 6 ( continued)
(h) Confidence level 90%, relative precision 50%
" 1.00 1.25 1.50 1.75 2.00 2.25 2.50 2.75 3.00 3.25 3.50 3.75 4.00 4.25 4.50 4.75 5.00
0.Q1 1138 1027 952 899 860 829 804 784 767 752 740 730 720 712 705 698 692 0.02 575 520 483 457 437 422 410 400 391 384 378 373 369 365 361 358 355 0.03 388 351 327 310 297 287 279 272 267 262 258 255 252 249 247 244 243 0.04 294 267 249 236 226 219 213 208 204 201 198 195 193 191 190 188 187 0.05 238 216 202 192 184 179 174 170 167 164 162 160 158 157 155 154 153 0.10 126 116 109 104 101 98 96 94 93 92 91 90 90 89 88 88 88
~I 0.15 89 83 79 76 74 12 71 70 70 69 69 68 68 68 68 67 67
I~ 0.20 71 67 64 62 61 60 59 59 69 68 68 68 68 58 68 68 59 0.25 61 58 66 55 54 54 53 53 63 63 63 53 54 54 54 54 55 0.30 54 52 51 50 50 50 50 50 50 50 51 51 52 52 52 53 63 0.35 50 49 48 48 48 48 48 49 49 50 50 51 51 52 52 53 54 0.40 47 47 46 47 47 47 48 49 49 50 51 52 52 53 54 55 56 0.45 46 46 46 47 47 48 49 50 51 52 53 54 55 56 57 58 59 0.50 46 46 46 47 48 49 51 52 53 54 56 57 58 60 61 62 64 0.55 46 47 48 49 51 52 54 55 57 58 60 62 63 65 67 68 70 0.60 47 49 50 52 54 56 58 60 62 64 66 68 70 72 74 76 78 0.70 54 57 60 63 66 69 72 76 79 82 85 89 92 95 98 102 105 0.80 71 76 82 87 93 98 104 109 115 121 126 132 137 143 149 154 160 0.90 126 138 151 163 176 189 201 214 227 239 252 265 277 290 303 315 328
For OR < 1, use the column value corresponding to 1/ OR and the row value corresponding to Pi.

Table 7. Hypothesis tests for an odds ratio
n = {Zl-a/2J[2Pi(1-Pi)] +Zl-flJ[Pt(1- Pt)+ Pi(l- P!)]}2 /(Pt -Pi)2
In this formula the term 2PH1 - P~) is used instead of 21'*(1 - 1'*) because the study population is likely to be made up of many more controls than cases, and the exposure rate among the controls is often known with a high degree of precision; under the null hypothesis this is the exposure rate for the cases as well. If the investigator is in doubt about the exposure rate among the controls, however, the formula should be modified and the term 21'*(1- 1'*) used, where 1'*= (Pf+ ~)/2.
(a) Level of significance 5%, power 90%, two-sided test len III
ORa I 1.25 1.50 1.75 2.00 2.25 2.50 2.75 3.00 3.25 3.50 3.75 4.00 4.25 4.50 4.75 5.00 Il P:~ III
0.01 35761 9375 4355 2554 1700 1225 932 738 602 503 428 370 324 287 257 231 ;:i' ~
~I 0.02 18133 4771 2224 1308 873 631 482 383 313 262 224 194 170 151 135 122 Q. , 0.03 12261 3237 1514 894 598 434 332 264 217 182 156 135 119 106 95 86 ~
0.04 9327 2472 1160 687 461 335 257 205 169 142 122 106 94 83 75 68 .. 3
0.05 7569 2013 948 563 379 276 213 170 140 118 102 89 79 70 63 57 S' 0.10 4072 1102 627 318 217 161 126 101 86 72 63 61 4$ 46 40 :37'
III .. 0.1:6 2929 807 392 240 1. 124 ee 80 68 68 61 41 41 3' 34:. .. iJ: 0'
:::I
0.20 2379 666 329 204 143 1Q8 86 71 61 63 47 42 • • 32: ..•• 3I:j.: .
0.26 2068 689 296 186 131 101 81 68 68 61 46 41 37 14 .32 3I:j 0.30 1881 644 276 176 126 97 79 67 68 61 46 42 31 35 33. :1' 0.35 1769 519 267 172 125 97 80 68 59 52 47 43 40 37 35 33 0.40 1707 509 265 173 127 100 82 70 62 55 50 46 43 40 38 36 0.45 1686 510 269 177 131 104 87 75 66 59 54 50 46 43 41 39 0.50 1699 522 279 185 138 111 93 80 71 64 59 55 51 48 46 43 0.55 1747 544 294 198 149 120 101 88 78 71 66 61 57 54 51 49 0.60 .1834 679 317 216 163 132 112 9& 88 80 74 69 66 .62 69 ...... : 0.70 2170 704 394 272 209 172 141 130 118 108 101 94 89 85 . 82 .··.1 •. · •• 0.80 2948 982 660 393 307 266 221 197 179 166 166 141 139 133 1. ······1··· 0.90 6421 1861 1076 766 606 609 445 399 366 3i4O 319 303 289 2.'18 268
For ORa < 1, use the column value corresponding to 1/ ORa and the row value corresponding to Pi.

Table 7 ( continued)
(b) Level of significance 5%, power 80%, two-sided test
'''<ORal 1.25 1.50 1.75 2.00 2.25 2.50 2.75 3.00 3.25 3.50 3.75 4.00 4.25 4.50 4.75 5.00 p*
2
0.01 26421 6858 3157 1836 1213 868 656 516 419 348 295 254 221 195 174 156 0.02 13400 3492 1614 942 624 448 340 269 219 182 155 134 117 103 92 83 0.03 9063 2371 1100 644 429 309 235 186 152 127 108 94 82 73 65 59 0.04 6896 1811 843 496 331 239 183 145 119 100 85 74 65 58 52 47 0.05 5598 1476 690 407 272 198 151 121 99 83 71 62 55 49 44 40 O?f1J "':1 810 .. 231 1$7 f.f' .«). !: ....... ~. ······>j:i;\i1 I~ ~I ~.I· ... ..... ~:'l2 • .> 1~ ltf .. ... f't: . ",,,,,"C
~.lD. t~. - - '. . .. ,. "lj ... e.· 0.:··: .,:., .. ·21. 1'37· ·fT J4- iG 0 .• 1400 404 2GI 110 t4 12 II 0.35 1318 387 199 128 93 73 60 51 44 39 36 32 30 28 26 25 0.40 1273 380 198 129 95 75 62 53 46 42 38 35 32 30 29 27 0.45 1259 381 202 133 98 78 65 56 50 45 41 38 35 33 31 30 0.50 1270 391 209 139 104 84 70 61 54 49 45 42 39 37 35 33 0.55 1307 408 221 149 112 91 77 67 60 54 50 47 44 42 40 38 t.lO· 1373 .- 238 .12 113 100 85 11 U 'f 17D ,-",. 1._ .1 218: •• :1.·. 1~1 n~: 'OCI 11 u =! .. ;~E ... ~, 742 4. _.
a ,. ·1M 111 1.' 1.···· 0 .• . .., 1. 820 .. - .2 341 - * •••• For ORa < 1, use the column value corresponding to 1/ ORa and the row value corresponding to P~.

Table 8. Estimating a relative risk with specified relative precision
n=zi -~/2[(1-Pl)/Pl +(1-P2)/P2]/[loge(1-e)]2
(a) Confidence level 95%, relative precision 10%
~RRI 1.00 1.25 1.50 1.75 2.00 2.25 2.50 2.75 3.00 3.25 3.50 3.75 4.00 4.25 4.50 4.75 5.00 P2
0.01 68521 61600 56986 53690 51218 49295 47757 46499 45450 44563 43802 43143 42566 42057 41605 41200 40836 en DI
0.02 33915 30454 28147 26499 25263 24302 23533 22904 22379 21936 21555 21226 20937 20683 20457 20254 20072 3 0.03 22379 20072 18534 17436 16612 15971 15458 15039 14689 14393 14140 13920 13728 13558 13407 13272 13151 ~
i" 0.04 16612 14881 13728 12904 12286 11805 11421 11106 10844 10622 10432 10267 10123 9996 9883 9781 9690 en 0.05 13151 11767 10844 10185 9690 9306 8998 8746 8537 8359 8207 8075 7960 7858 7768 7687 7614 j;j'
CD
~I 0.10 6230 1638 6076 4747 4499 4807 4153 4027 a923 3Ia4 3768 3692 36M aE aas .34JI 14&1 Q.
C:UI 3923 3461 3164 2984 2769 2641 2538 2454 2384 2326 2275 2231 2192 ·21. 2128 2t.~ 2077· CD .. CD
0;20 2769 2423 2192 2027 1904 ,.- 1131 ,. 1615 1511 1133 1100 1411 1. 1423 1483 ,. .. 3
0.21 2077 1800 1615 1484 1_
1308 1246 1196 1164 1119 1088 t0l2 1039 :i' 0.30 1615 1_ 1231 1121 1039 975 923 1i1 146 817 DI .. 0.35 1286 1088 956 862 792 737 693 657 o· 0.40 866 750 668 606 558 520 = 1039 0.45 846 693 590 517 462 0.50 693 554 462 396 347 0.55 567 441 357 297 (l.GO 462 847 270 0.70 297 198 0;80 174 81 0.90 77
Since RR= P,/P2 • RR~ 1/P2 •
For RR < 1. use the column value corresponding to 1/ RR and the row value corresponding to P,.

Table 8 ( continued)
(b) Confidence level 95%, relative precision 20%
~RRI 1.00 1.25 1.50 1.75 2.00 2.25 2.50 2.75 3.00 3.25 3.50 3.75 4.00 4.25 4.50 4.75 5.00 P2
0.01 15276 13733 12705 11970 11419 10990 10647 10367 10133 9935 9766 9619 9490 9377 9276 9186 9104 0.02 7561 6790 6275 5908 5633 5418 5247 5107 4990 4891 4806 4732 4668 4611 4561 4516 4475 0.03 4990 4475 4132 3887 3704 3561 3447 3353 3275 3209 3153 3104 3061 3023 2989 2959 2932 0.04 3704 3318 3061 2877 2739 2632 2546 2476 2418 2368 2326 2289 2257 2229 2204 2181 2161 0.05 2932 2624 2418 2271 2161 2075 2006 1950 1904 1864 1830 1801 1775 1752 1732 1714 1698 0.10 13. 1236 1132 U)I$ 1003 911 9. .. -- - - .123 811 1" - ... 111 <U6 815 112 103 154 6 •• ill .. • &. 618 501 488 •• 412 ... • ..1 I! ~I tUO 618 541 481 *2 426 - - 372 ., ., 342 331 32& 323.· ttl ·31.3 e,a 463 481 361 331 - - it. 287 2. DO 243 131 131 0:. .361 - 216 250 m 218 206 111 ,.
'82 0.35 287 243 214 193 177 165 155 147 0.40 232 193 168 149 136 125 116 0.45 189 155 132 116 103 0.50 155 124 103 89 78 0.55 127 99 80 67 qQ ..... 1. ,. 6' ,~,.. 11 .. ~.'.: •• .' 20 .. eo' 11
Since RR=P,/P2, RR~1/P2' For RR < 1, use the column value corresponding to 1/ RR and the row value corresponding to P"
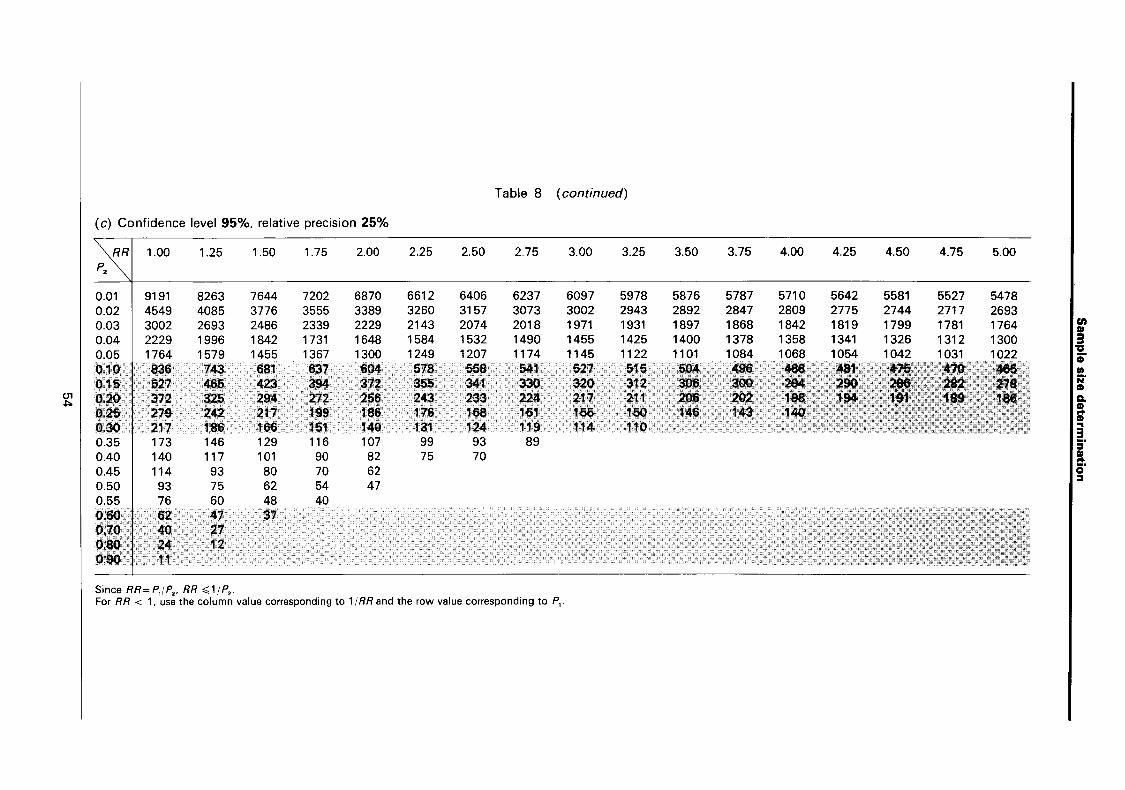
Table 8 ( continued)
(c) Confidence level 95%, relative precision 25%
~RRI 1.00 1.25 1.50 1.75 2.00 2.25 2.50 2.75 3.00 3.25 3.50 3.75 4.00 4.25 4.50 4.75 5.00 P2
0.01 9191 8263 7644 7202 6870 6612 6406 6237 6097 5978 5876 5787 5710 5642 5581 5527 5478 0.02 4549 4085 3776 3555 3389 3260 3157 3073 3002 2943 2892 2847 2809 2775 2744 2717 2693 0.03 3002 2693 2486 2339 2229 2143 2074 2018 1971 1931 1897 1868 1842 1819 1799 1781 1764 en
DI 0.04 2229 1996 1842 1731 1648 1584 1532 1490 1455 1425 1400 1378 1358 1341 1326 1312 1300 3 0.05 1764 1579 1455 1367 1300 1249 1207 1174 1145 1122 1101 1084 1068 1054 1042 1031 1022 "CI
CD 0.10 636 743 661 637 604 576 556 541 527 515 504 496 488 .1 ~;; ..... ;410. 461. 1/1
0.15 527 465 423 394 372 355 341 330 320 312 306 300 2M 290<,.;;;;211 .. ~j N' CD
~I 0 .. 20 372 325 294 272 256 243 233 224 217 211 206 .202 196 1M· ·;·"1!I~:~:1.11 -" a. ~'~~~ "o,"\W~O",,. :;: o~; ", ' CD
0.25 279 242 217 199 186 176 168 161 155 150 146 143 140 .. CD
0.30 217 186 166 151 140 131 124 119 114 110 .. ~
, ~ ~, ' 3 0.35 173 146 129 116 107 99 93 89 5' 0.40 140 117 101 90 82 75 70 DI .. 0.45 114 93 80 70 62 S'
::;, 0.50 93 75 62 54 47 0.55 76 60 48 40 0.60 62 47 37 0.70 40 27 0.80 24 12 0.90 11
Since RR=P,/ P2' RR ,;;;1/P2 ·
For RR < 1, use the column value corresponding to 1/ RR and the row value corresponding to P,.

Table 8 (continued)
(d) Confidence level 95%, relative precision 50%
"(RRI 1.00 1.25 1.50 1.75 2.00 2.25 2.50 2.75 3.00 3.25 3.50 3.75 4.00 4.25 4.50 4.75 5.00 P2
0.01 1584 1424 1317 1241 1184 1139 1104 1075 1051 1030 1013 997 984 972 962 952 944 0.02 784 704 651 613 584 562 544 530 518 507 499 491 484 478 473 468 464 0.03 518 464 429 403 384 369 358 348 340 333 327 322 318 314 310 307 304 0.04 384 344 318 299 284 273 264 257 251 246 242 238 234 231 229 226 224 0.05 304 272 251 236 224 215 208 203 198 194 190 187 184 182 180 178 176 (UO 144 128 118 no 104 100 " $4 $1 88 81 16 • 13 0.'11 91 to 73 68 G4 $2 59 17 .. 54 53 12 Sf .JQ;. ,
I~ 0'.21. M • 51 47 44 42 ~ • 81 37 - • 34 II·'· t1I t1I Qi2$ 48 42 31 35 ·31 31 2$ a 27 26 26 26 24
0.3G 31· 32 28 2. M 23 22 21 .21 1$ 0.35 30 26 23 20 19 18 16 16 0.40 24 20 18 16 14 13 12 0.45 20 16 14 12 11 0.50 16 13 11 10 8 0.55 14 11 9 7 O~.L 11 8 7 0;71. , 1 1;. .• • oi9l·· •
·Sample size less than 5. Since RR=P,/P2 , RR~ 1/P2 •
For RR< 1, use the column value corresponding to 1/ RR and the row value corresponding to P,.

Table 8 ( continued)
(e) Confidence level 90%, relative precision 10%
~RRI 1.00 1.25 1.50 1.75 2.00 2.25 2.50 2.75 3.00 3.25 3.50 3.75 4.00 4.25 4.50 4.75 5.00 P2
0.01 48266 43391 40141 37819 36078 34724 33640 32754 32015 31390 30855 30390 29984 29625 29307 29022 28765 0.02 23890 21452 19827 18666 17796 17118 16577 16133 15764 15452 15184 14952 14748 14569 14410 14267 14139 0.03 15764 14139 13056 12282 11701 11250 10889 10593 10347 10139 9960 9805 9670 9550 9444 9349 9264 tn
III
0.04 11701 10483 9670 9090 8654 8316 8045 7823 7639 7482 7348 7232 7131 7041 6961 6890 6826 3 'C
0.05 9264 8289 7639 7174 6826 6555 6338 6161 6013 5888 5781 5688 5607 5535 5472 5415 5363 ii' 0.10 4388 3901 3676 3344- 3169 3034 2926 2837 2763 2701 2647 2601 2160 2524 24'2 2464. 2411 UI
0.15 2763 2438 2221 2067 1961 ,. 1788 1729 1660 1a1 1602. 1571 . 1544 1520 '.9· '. .,. j;j' CD
01 0.20 1961 1707 1544 1428 1341 1274 1219 1175 1138 110:7 1610: 1f.)$? 1637 10U. 1003 .. 9~ Q. 0> CD
0.25 1463 1268 1138 1045 976 921 878 843 813 788 7&7 7. 732. .. CD
0.30 1138 976 867 790 732 &87 &51 621 59& 576 ~
3 0.35 906 767 674 607 558 519 488 463 5i' 0.40 732 610 529 471 427 393 366 III .. 0.45 596 488 416 364 326 o·
:::s 0.50 488 391 326 279 244 0.55 399 311 252 209 0.60 326 244 190 0.70 209 140 0.80 122 61 0.90 65
Since RR=P,/P2' RR~1/P2' For RR< 1, use the column value corresponding to 1/ RR and the row value corresponding to P,.

Table 8 ( continued)
(f) Confidence level 90%. relative precision 20%
~RRI 1.00 1.25 1.50 1.75 2.00 2.25 2.50 2.75 3.00 3.25 3.50 3.75 4.00 4.25 4.50 4.75 5.00 P2
0.01 10761 9674 8949 8432 8044 7742 7500 7303 7138 6999 6879 6776 6685 6605 6534 6470 6413 0.02 5326 4783 4421 4162 3968 3817 3696 3597 3515 3445 3385 3334 3288 3248 3213 3181 3153 0.03 3515 3153 2911 2738 2609 2508 2428 2362 2307 2261 2221 2186 2156 2130 2106 2085 2066 0.04 2609 2337 2156 2027 1930 1854 1794 1744 1703 1668 1639 1613 1590 1570 1552 1536 1522 0.05 2066 1848 1703 1600 1522 1462 1413 1374 1341 1313 1289 1269 1250 1234 1220 1208 1196 0.10 979 870 798 746 707 677 653 633 616 602 591 580 571 563 656 550 544-
I~ 0.15 616 544- 496 461 436 416 399 386 375 366 358 351 346 339 335 330 327
c..n 0.20 435 381 345 319 299 284 272 262 254 247 241 236 231 227 224 221 218 -...J
0.25 327 283 254 233 218 206 196 188 182 176 171 167 164 0.30 254 218 194 176 164 153 145 139 133 129 0.35 202 171 151 136 125 116 109 104 0.40 164 136 118 105 96 88 82 0.45 133 109 93 82 73 0.50 109 87 73 63 55 0.55 89 70 56 47 0.60 73 55 43 0.70 47 32 0.80 28 14 0.90 13
Since RR= P,/ P2 • RR~ 1 / P2 •
For RR< 1. use the column value corresponding to 1/ RR and the row value corresponding to P,.
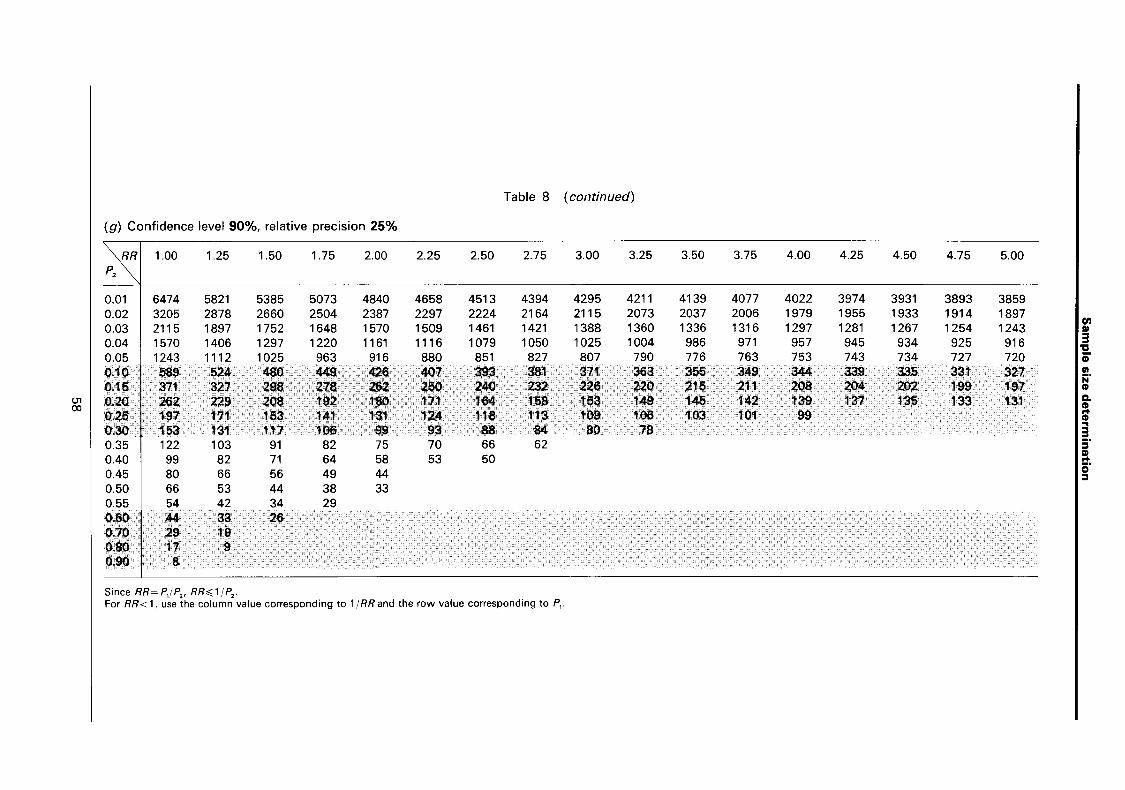
Table 8 ( continued)
(g) Confidence level 90%, relative precision 25%
,\RRI 1.00 1.25 1.50 1.75 2.00 2.25 2.50 2.75 3.00 3.25 3.50 3.75 4.00 4.25 4.50 4.75 5.00 P2
0.01 6474 5821 5385 5073 4840 4658 4513 4394 4295 4211 4139 4077 4022 3974 3931 3893 3859 0.02 3205 2878 2660 2504 2387 2297 2224 2164 2115 2073 2037 2006 1979 1955 1933 1914 1897 en 0.03 2115 1897 1752 1648 1570 1509 1461 1421 1388 1360 1336 1316 1297 1281 1267 1254 1243 DI
0.04 1570 1406 1297 1220 1161 1116 1079 1050 1025 1004 986 971 957 945 934 925 916 3 'C
0.05 1243 1112 1025 963 916 880 851 827 807 790 776 763 753 743 734 727 720 CD 0.10 589 524 480 449 426 407 393 381 371 363 355 349 344 339 335 331 327 1/1
j;j' 0.15 371 327 298 218 262 250 240 232 226 220 215 211 208 204 202 199 197 CD
(J1 0..20 262 229 208 192 180 171 164 158 153 149 145 142 139 137 135 133 131 Do 00 CD
0.25 197 171 153 141 131 124 118 113 109 106 103 101 99 .. CD
0.30 153 131 117 106 99 93 88 84 80 78 .. 3
0.35 122 103 91 82 75 70 66 62 S· 0.40 99 82 71 64 58 53 50 DI .. 0.45 80 66 56 49 44 o·
= 0.50 66 53 44 38 33 0.55 54 42 34 29 0.60 44 33 26 0.10 29 19 0.80 17 9 0.90 8
Since RR= P,/ P2 , RR";; 1 / P2 .
For RR< 1, use the column value corresponding to 1/ RR and the row value corresponding to P,.
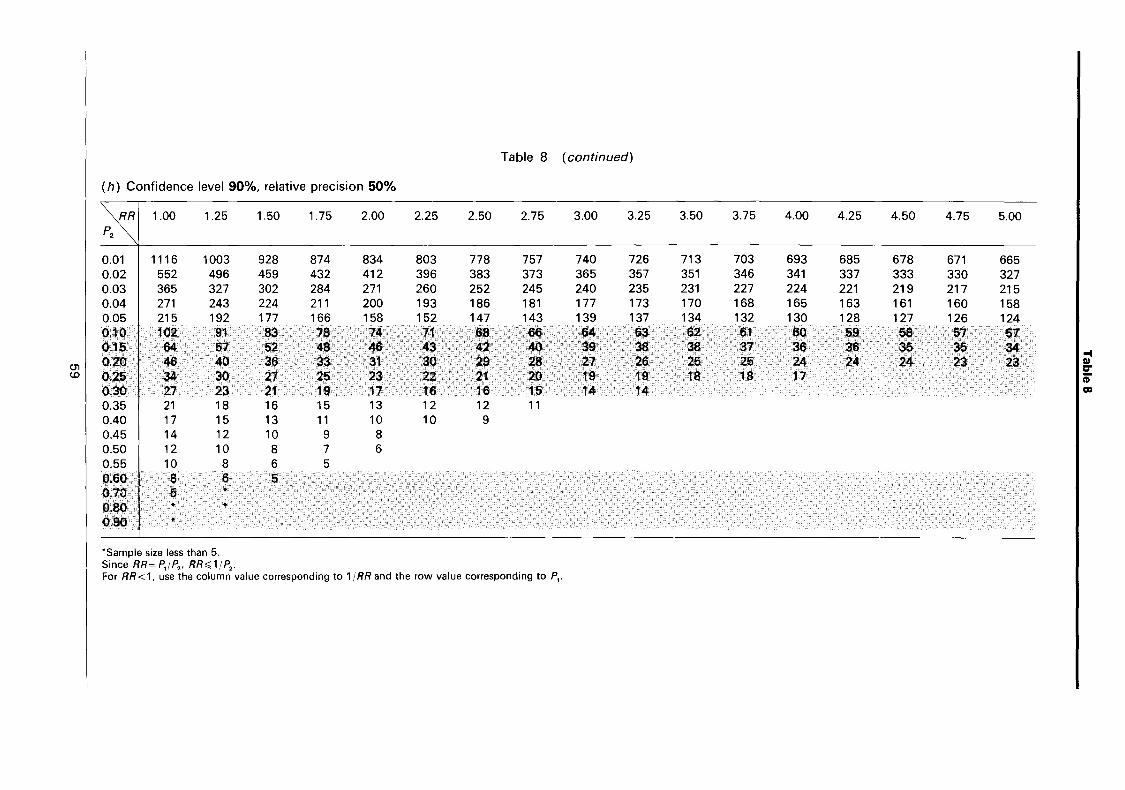

Table 9. Hypothesis tests for a relative risk
n= {zl-a/zJ[2P(l- P)] +Zl-pJ[Pl (l-Pd+Pz(l-Pz)]Y /(P 1 -Pzf
where
P=(P 1 +Pz)/2
(a) Level of significance 5%, power 90%, two-sided test
RRa) 1.25 1.50 1.75 2.00 2.25 2.50 2.75 3.00 3.25 3.50 3.75 4.00 4.25 4.50 4.75 5.00
P2 "" I:
3 'C
0.01 37411 10378 5066 3104 2149 1605 1261 1028 862 738 643 568 507 457 416 381 ii' 0.02 18492 5122 2497 1528 1056 787 618 503 421 360 313 276 246 221 201 184 1/1
0.03 12185 3371 1641 1002 692 515 403 328 274 234 203 178 159 143 129 118 N' CD
~I 0.04 9032 2495 1212 739 509 379 296 240 200 171 148 130 115 103 93 85 Q. CD
0.05 7140 1969 955 582 400 297 232 188 156 133 115 101 89 80 72 65 .. CD
0.10 3357 918 442 266 182 133 103 82 68 57 4$ 42 37 33 29 26 .. 3
0.15 2095 568 270 161 109 79 60 47 38 32 27 23 19 11 1i 13 S' 0.20 1465 393 185 109 72 52 39 30 24 19 16 13 11 & 7 6 III .. 0.25 1086 287 133 77 50 35 26 19 15 12 9 .7 0'
;:, 0.30 834 217 99 56 36 24 17 12 9 0.35 654 167 75 41 25 16 11 0.40 519 130 56 30 17 11 0.45 414 101 42 21 0.50 329 77 30 14 0.55 261 58 21 0.60 203 42 0.70 113 0.80 46
Since RRa=P,/P2' RRa ~1/P2· For RRa < 1. use the column value corresponding to 1/ RRa and the row value corresponding to P"

Table 9 ( continued)
(b) Level of significance 5%, power 80%, two-sided test
""'-,RRal 1.25 1.50 1.75 2.00 2.25 2.50 2.75 3.00 3.25 3.50 3.75 4.00 4.25 4.50 4.75 5.00 P2
0.01 27946 7752 3785 2319 1606 1199 943 769 644 552 481 425 379 342 311 285 0.02 13814 3827 1866 1142 789 589 462 376 315 269 234 207 184 166 151 138 0.03 9103 2518 1226 749 517 385 302 245 205 175 152 134 119 107 97 89 0.04 6747 1864 906 553 381 283 222 180 150 128 111 97 87 78 70 64 0.05 5334 1471 714 435 299 222 174 141 117 100 86 76 67 60 54 49 0.10 2508 686 330 200 136 100 77 62 51 43 37 32 28 25 22 20
I~ 0.15 1566 425 202 121 82 59 45 36 29 24 20 17 15 13 11 10 0)1 0.20 1095 294 138 82 54 39 29 23 18 15 12 10 8 7 6 5
0.25 812 215 100 58 38 27 20 15 12 9 7 6 0.30 623 163 74 42 27 19 13 10 7 0.35 489 125 56 31 19 13 9 0.40 388 97 42 23 14 8 0.45 309 76 32 16 0.50 247 58 23 11 0.55 195 44 16 0.60 152 32 0.70 85 0.80 35
Since RRa= P,/ P2' RRa~1/P2' For RRa< 1. use the column value corresponding to 1/ RRa and the row value corresponding to P,.

Table 9 ( continued)
(c) Level of significance 5%, power 50%, two-sided test
""!1Ra I 1.25 1.50 1.75 2.00 2.25 2.50 2.75 3.00 3.25 3.50 3.75 4.00 4.25 4.50 4.75 5.00
P2
0.01 13675 3794 1853 1136 787 588 462 377 316 271 236 209 186 168 153 140 0.02 6760 1873 914 559 387 289 227 185 155 133 115 102 91 82 75 68 0.03 4455 1233 601 367 254 189 148 121 101 86 75 66 59 53 48 44 en
III 0.04 3302 913 444 271 187 139 109 89 74 63 55 49 43 39 35 32 3 0.05 2611 721 350 214 147 110 86 70 58 50 43 38 34 30 27 25 'C
CD 0.10 1228 337 162 98 67 50 39 31 26 22 19 17 15 13 12 11 III
0.15 767 209 100 60 41 30 23 18 15 13 11 9 8 7 6 6 jij' CD Ol
0.20 536 145 69 .41 27 20 15 12 10 8 7 6 5 * • N Q.
0.25 398 106 50 29 19 14 10 8 7 5 CD .. CD
0.30 306 81 37 22 14 10 7 6 .. 3
0.35 240 62 28 16 10 7 5 S· 0.40 191 49 22 12 7 5 III .. 0.45 152 38 16 9 o·
:::I 0.50 122 29 12 6 0.55 96 22 9 0.60 75 17 0.70 42 0.80 18
'Sample size less than 5. Since RRa=P,/P2• RRa~1/P2. For RRa < 1. use the column value corresponding to 1/ RRa and the row value corresponding to P,.
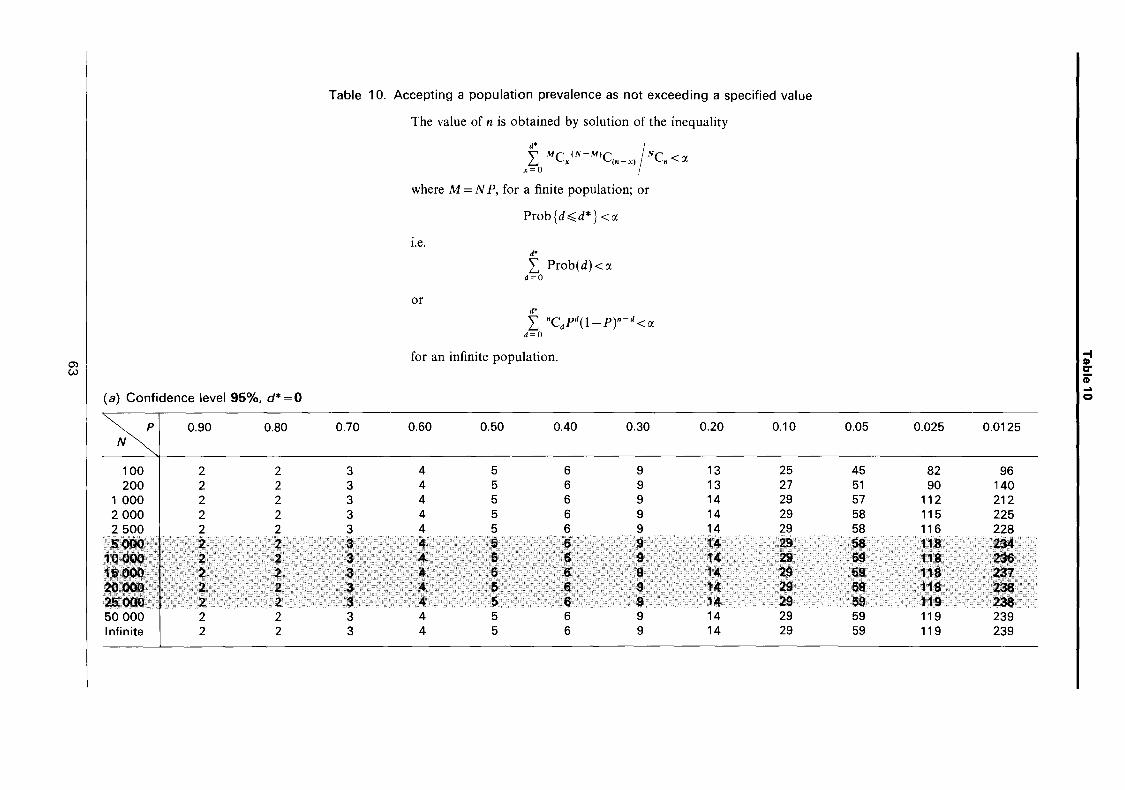
Table 10. Accepting a population prevalence as not exceeding a specified value
The value of n is obtained by solution of the inequality
M (N-M) N d* I x~o Cx C(n-x) Cn <a
where M = N P, for a finite population; or
Prob {d :::;;d*} < a
i.e. d*
I Prob(d)<a d=O
or d*
I nCdpd(l- p)"-d < a d=O
~I for an infinite population. I~
CD ... (a) Confidence level 95%, d*=O 10
P 0.90 0.80 0.70 0.60 0.50 0.40 0.30 0.20 0.10 0.05 0.025 0.0125 N
100 2 2 3 4 5 6 9 13 25 45 82 96 200 2 2 3 4 5 6 9 13 27 51 90 140
1 000 2 2 3 4 5 6 9 14 29 57 112 212 2000 2 2 3 4 5 6 9 14 29 58 115 225 2500 2 2 3 4 5 6 9 14 29 58 116 228 5000 2 2; :3 4 5 6 9 14 29 58 118 234
1Qooo 2 2 3 4 5 6 9 14 29 69 118 286 15000 2 2 3. 4 5 6 "9 14 29 59 118 237 20000 2 2 3. 4 5. 6 9 14 29 59 111 236 25000 2; 2 3. 4 5 6 9 14 29 59 119 238 50000 2 2 3 4 5 6 9 14 29 59 119 239 Infinite 2 2 3 4 5 6 9 14 29 59 119 239
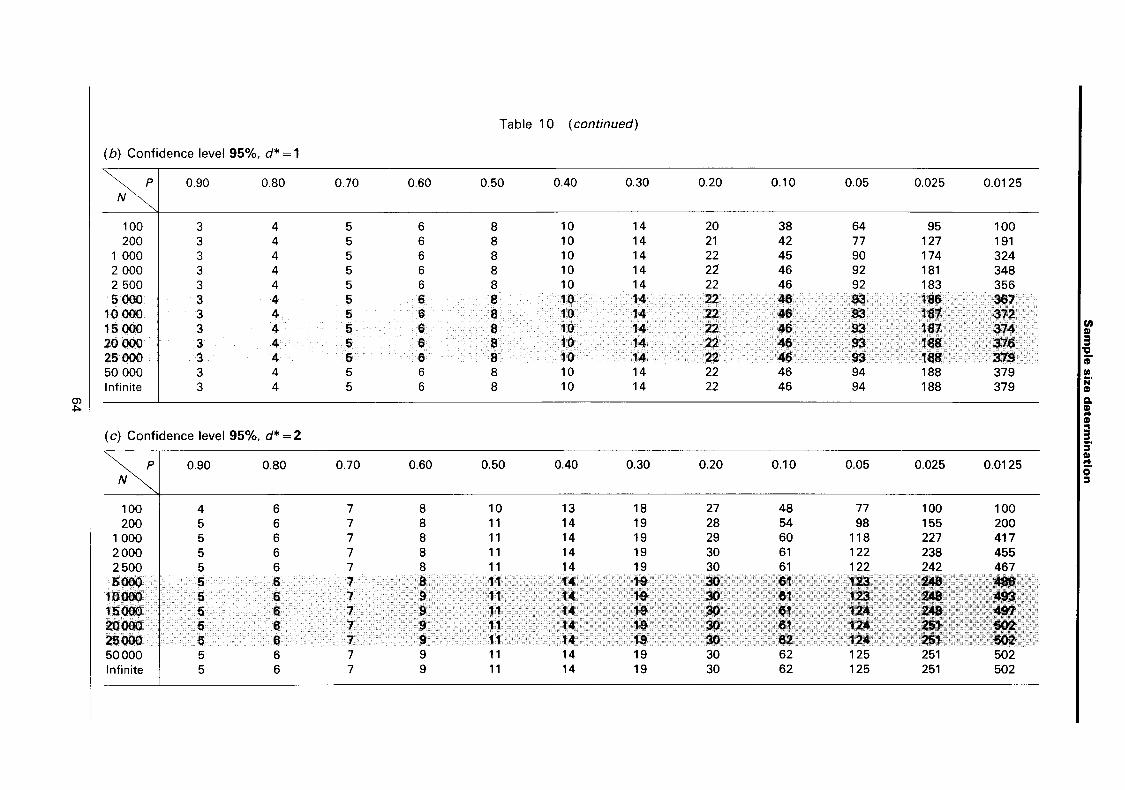
Table 10 ( continued)
(b) Confidence level 95%, d* = 1
P 0.90 0.80 0.70 0.60 0.50 0.40 0.30 0.20 0.10 0.05 0.025 0.0125 N
100 3 4 5 6 8 10 14 20 38 64 95 100 200 3 4 5 6 8 10 14 21 42 77 127 191
1 000 3 4 5 6 8 10 14 22 45 90 174 324 2000 3 4 5 6 8 10 14 22 46 92 181 348 2500 3 4 5 6 8 10 14 22 46 92 183 356 5000 3 4 5 6 8 10 14 22- 46 93 186 367
10000 3 4 5 6 8 10 14 22- 46 83 187 312 15000 3 4 5 6 8 10 14 22- 46 93 187 314
(I) 11/
20000 3 4 5 6 8 10 14 22 46 93 188 316 3 "CI
25000 3 4 5 6 8 10 14 22- 46 93 188 319 i' 50000 3 4 5 6 8 10 14 22 46 94 188 379 III
Infinite 3 4 5 6 8 10 14 22 46 94 188 379 p:j' CD
~I a-CD .. CD ..
(c) Confidence level 95%, d* = 2 I ~, :::I 11/
P 0.90 0.80 0.70 0.60 0.50 0.40 0.30 0.20 0.10 0.05 0.025 0.0125 I g' N
100 4 6 7 8 10 13 18 27 48 77 100 100 200 5 6 7 8 11 14 19 28 54 98 155 200
1000 5 6 7 8 11 14 19 29 60 118 227 417 2000 5 6 7 8 11 14 19 30 61 122 238 455 2500 5 6 7 8 11 14 19 30 61 122 242 467 5000 5 6 7 8 11 14 19 30 61 123 246 486
10000 5 6 7 9 11 14 19 30 61 123 "246 43 15000 5 6 7 9 11 14 19 30 61 124 - .., 2()000 5 6 7 9 11 14 19 30 61 124 ., -25000 5 6 7 9 11 14 19 30 62 124 201 502 50000 5 6 7 9 11 14 19 30 62 125 251 502 Infinite 5 6 7 9 11 14 19 30 62 125 251 502
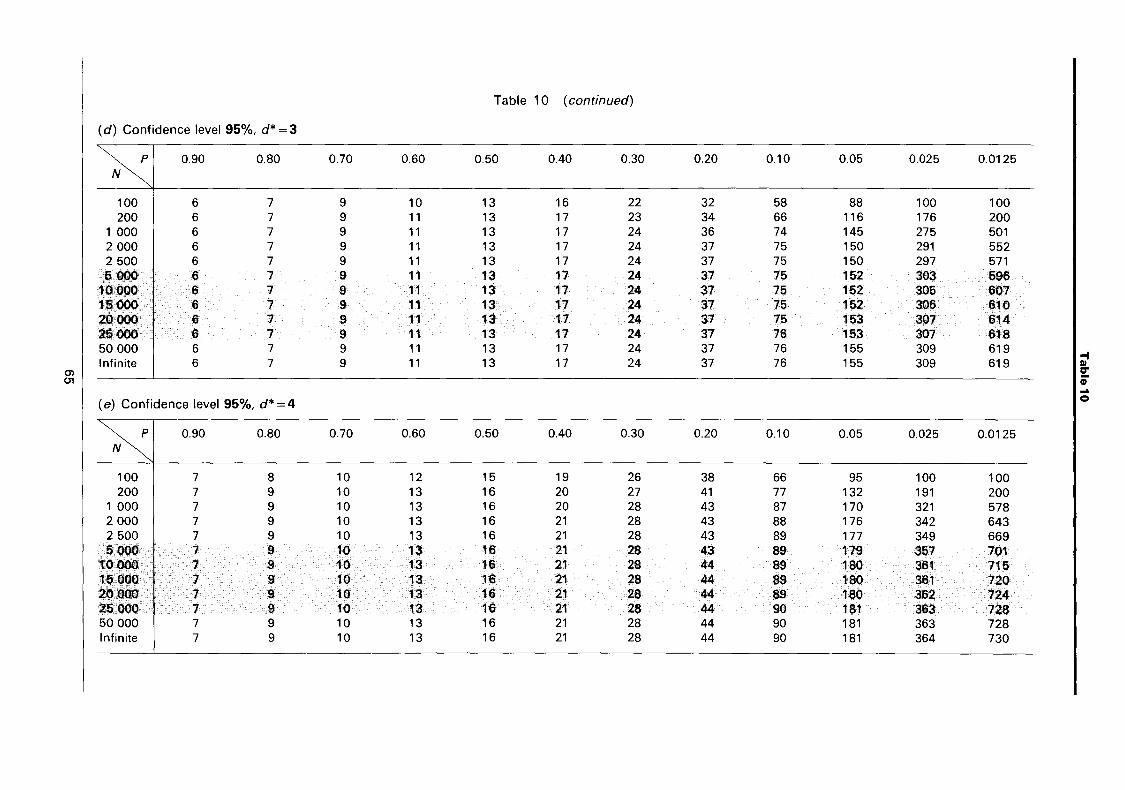
Table 10 ( continued)
(d) Confidence level 95%, d* = 3
P 0.90 0.80 0.70 0.60 0.50 0.40 0.30 0.20 0.10 0.05 0.025 0.0125 N
100 6 7 9 10 13 16 22 32 58 88 100 100 200 6 7 9 11 13 17 23 34 66 116 176 200
1 000 6 7 9 11 13 17 24 36 74 145 275 501 2000 6 7 9 11 13 17 24 37 75 150 291 552 2500 6 7 9 11 13 17 24 37 75 150 297 571 5000 6 7 9 11 13 17 24 37 75 152 303 596
10000 6 7 9 11 13 17 24 37 75 152 305 607 15000 6 7 9 11 13 17 24 37 75 152 306 610 20000 6 7 9 11 13 17 24 37 75 153 307 614 25000 6 7 9 11 13 17 24 37 76 153 307 618 50000 6 7 9 11 13 17 24 37 76 155 309 619
Ii Infinite 6 7 9 11 13 17 24 37 76 155 309 619 ~I ...
(e) Confidence level 95%, d* = 4 Ie
p 0.90 0.80 0.70 0.60 0.50 0.40 0.30 0.20 0.10 0.05 0.025 0.0125 N
100 7 8 10 12 15 19 26 38 66 95 100 100 200 7 9 10 13 16 20 27 41 77 132 191 200
1 000 7 9 10 13 16 20 28 43 87 170 321 578 2000 7 9 10 13 16 21 28 43 88 176 342 643 2500 7 9 10 13 16 21 28 43 89 177 349 669 5000 7 9 10 13 16 21 28 43 89 179 357 701
10000 7 9 10 13 16 21 28 44 89 180 361 715 15000 7 9 10 13 16 21 28 44 89 180 361 720 20000 7 9 10 13 16 21 28 44 89 180 362 724 25000 7 9 10 13 16 21 28 44 90 181 363 728 50000 7 9 10 13 16 21 28 44 90 181 363 728 Infinite 7 9 10 13 16 21 28 44 90 181 364 730
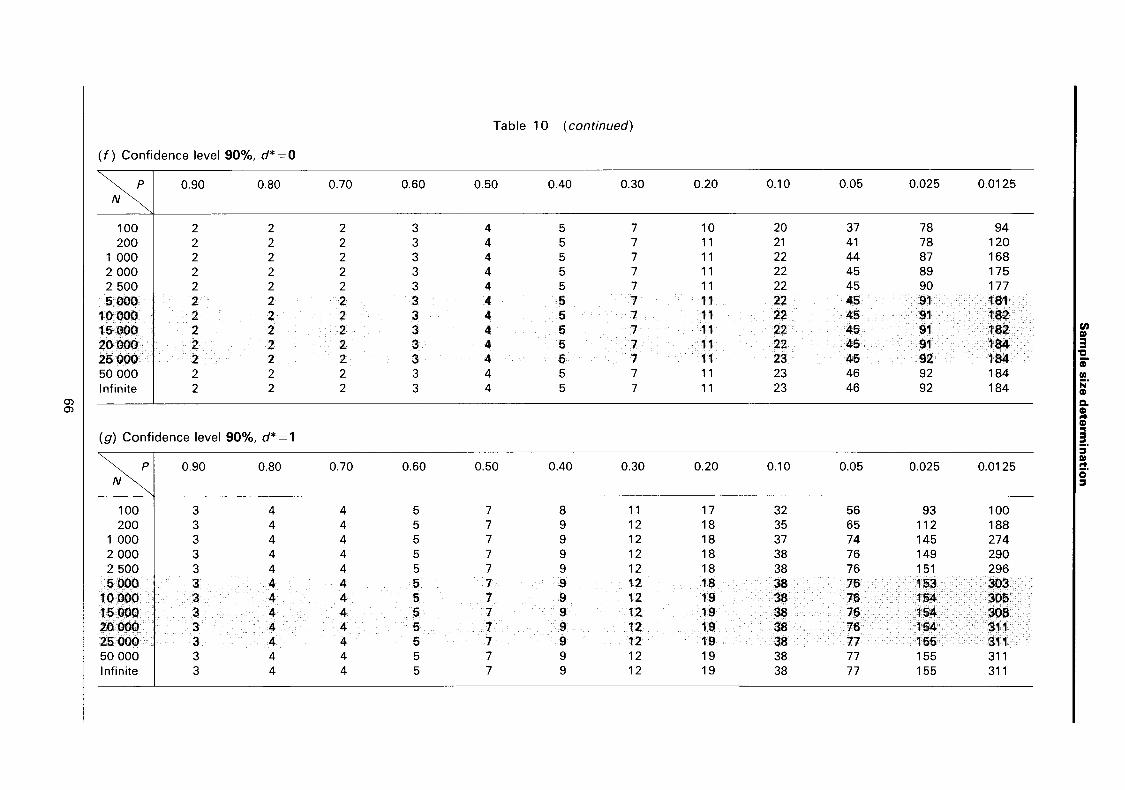
Table 10 ( continued)
(f) Confidence level 90%, d* = 0
P 0.90 0.80 0.70 0.60 0.50 0.40 0.30 0.20 0.10 0.05 0.025 0.0125 N
100 2 2 2 3 4 5 7 10 20 37 78 94 200 2 2 2 3 4 5 7 11 21 41 78 120
1 000 2 2 2 3 4 5 7 11 22 44 87 168 2000 2 2 2 3 4 5 7 11 22 45 89 175 2500 2 2 2 3 4 5 7 11 22 45 90 177 5000 2 2 2 3 4 5 7 11 22 45 91 181
10000 2 2 2 3 4 5 7 11 22 45 91 182 15000 2 2 2 3 4 5 7 11 22 45 91 182 en
QI
20000 2 2 2 3 4 5 7 11 22 45 91 184 3 25000 2 2 2 3 4 5 7 11 23 45 92 184 "C
iD 50000 2 2 2 3 4 5 7 11 23 46 92 184 1/1
Infinite 2 2 2 3 4 5 7 11 23 46 92 184 j;j' ~
(J) CI. (J) CD ..
CD .. (g) Confidence level 90%, d* = 1 I~,
:::I
N ",P I 0.90 0.80 0.70 0.60 0.50 0.40 0.30 0.20 0.10 0.05 0.025 0.0125 It 100 3 4 4 5 7 8 11 17 32 56 93 100 200 3 4 4 5 7 9 12 18 35 65 112 188
1 000 3 4 4 5 7 9 12 18 37 74 145 274 2 000 3 4 4 5 7 9 12 18 38 76 149 290 2 500 3 4 4 5 7 9 12 18 38 76 151 296 5000 3 4 4 5 7 9 12 18 38 76 153 303
10000 3 4 4 5 7 9 12 19 38 76 154 306 15000 3 4 4 5 7 9 12 19 38 76 154 308 20000 3 4 4 5 7 9 12 19 38 76 154 311 25000 . 3 4 4 5 7 9 12 19 38 77 155 311 50000 3 4 4 5 7 9 12 19 38 77 155 311 Infinite 3 4 4 5 7 9 12 19 38 77 155 311
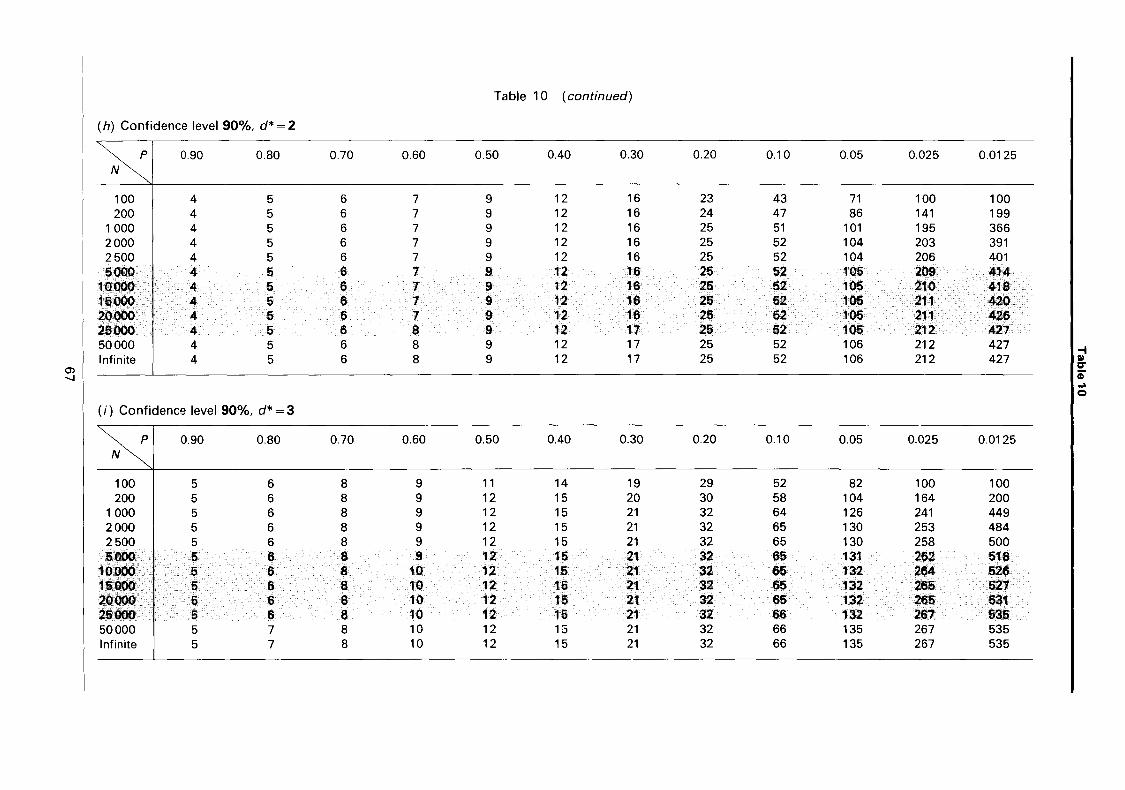
Table 10 ( continued)
(h) Confidence level 90%, d* = 2
P 0.90 0.80 0.70 0.60 0.50 OAO 0.30 0.20 0.10 0.05 0.025 0.0125 N
100 4 5 6 7 9 12 16 23 43 71 100 100 200 4 5 6 7 9 12 16 24 47 86 141 199
1000 4 5 6 7 9 12 16 25 51 101 195 366 2000 4 5 6 7 9 12 16 25 52 104 203 391 2500 4 5 6 7 9 12 16 25 52 104 206 401 5000 4 5 6 7 9 12 16 25 52 105 209 414
10000 4 5 6 7 9 12 16 25 52 105 ·210 418 15000 4 5 6 7 9 12 16 25 52 105 211 42'0 20000 4 5 6 7 9 12 16 25 52 105 211 426 25000 4 5 6 8 9 12 17 25 52 105 212 427 50000 4 5 6 8 9 12 17 25 52 106 212 427
Ii Infinite 4 5 6 8 9 12 17 25 52 106 212 427
~l ... Q
I (i) Confidence level 90%, d* = 3
P 0.90 0.80 0.70 0.60 0.50 0.40 0.30 0.20 0.10 0.05 0.025 0.0125 N
100 5 6 8 9 11 14 19 29 52 82 100 100 200 5 6 8 9 12 15 20 30 58 104 164 200
1000 5 6 8 9 12 15 21 32 64 126 241 449 2000 5 6 8 9 12 15 21 32 65 130 253 484 2500 5 6 8 9 12 15 21 32 65 130 258 500 5000 5 6 8 9 12 15 21 32 65 131 262 518
10000 5 6 8 10 12 15 21 32 65 132 264 526 15000 5 6 8 10 12 15 21 32 65 132 265 527 20000 5 6 8 10 12 15 21 32 65 132 265 531 25000 5 6 8 10 12 15 21 32 66 132 267 535 50000 5 7 8 10 12 15 21 32 66 135 267 535 Infinite 5 7 8 10 12 15 21 32 66 135 267 535

Table 10 ( continued)
( i) Confidence level 90%, d* = 4
~I 0.90 0.80 0.70 0.60 0.50 0.40 0.30 0.20 0.10 0.05 0.025 0.0125 I: 3 "C
100 7 8 9 11 14 17 23 34 60 90 100 100 CD 200 7 8 9 11 14 18 24 36 69 121 180 200
en iii'
1 000 7 8 9 11 14 18 25 38 77 150 285 527 CD
~I CI. 2000 7 8 9 11 14 18 25 38 78 155 302 572 CD .. 2500 7 8 9 11 14 18 25 38 78 156 308 595 CD .. 5000 7 8 9 11 14 18 25 38 78 157 314 619 3
10000 7 8 9 12 14 18 25 38 78 158 316 628 S' DI
1&cOOO 7 8 10 12 14 18 25 38 78 168 316 628 .. c)' JOcOOO 7 8 10 12 14 18 25 38 78 168 317 637 ~
25cOOO 7 8 10 12 14 18 25 38 79 159 318 637 50000 7 8 10 12 14 18 25 39 79 159 318 637 Infinite 7 8 10 12 14 18 25 39 79 159 318 638

I~_I"" .,. _ ...................................... • .... J .............. ~ .............
n= [Zl-aJ {Po(1- Po)} +Zl-pJ {Pa(1- Pa n]2 /(Po- Pa)2
d* = [nPO-z1-aJ {nPo(1- PO)}]
The value of d* is always rounded down to the nearest integer (for example 5.8 would become 5).
(a) Level of significance 5%, power 90%, one-sided test (Pa< Po)
\Pol 0.10 0.15 0.20 0.25 0.30 0.35 0.40 0.45 0.50 Pa
~ n d* n d* n d* n d* n d* n d* n d* n d* n d*
0.05 239 16 76 6 40 3 25 2 18 2 13 1 10 1 8 1 6 0 0.10 378 45 109 14 54 8 33 5 22 4 16 3 12 2 10 2 0.15 498 84 137 25 66 13 39 8 26 6 19 4 14 3 0.20 601 132 161 38 75 19 44 12 29 8 20 6 .; •. 686 1. 180 62 13 25 4S 11 31 10
F: 753 242 ,. ee 81. 31 10 11 till 804 218 206 80 • 38 ' ,
..",' 137 312 211 t3 Oi. 813 402
,----,-_._- I -I III
ffi I \pJ 0.55 0.60 0.65 0.70 0.75 0.80 0.85 0.90 0.95 I~ Pa
~ n d* n d* n d* n d* n d* n d* n d* n d* n d*
0.05 5 0 t t t t t t t t 0.10 8 2 6 1 5 1 t t t t t t 0.15 11 3 8 2 7 2 5 1 t t t t t 0.20 15 5 11 3 9 3 7 2 5 2 t t t t
'i\".a' 1,. I 12 I I 4 7 3 I: .I t t t ,22 t 1:1 7 t2 I I 4 , 3. &: .I t t • 1. U 11 1 • I 1, 6 8 4 .. I. I ,I. t
" • I:~ 21 II 18 22 n 15 • 11 , I 6 6 4 t ~,2I.: ,'1. It 48 11 27 3.1 17 21 12 14 a 10 I 7 4 t
0.50 852 444 210 114 91 51 49 29 30 18 19 12 13 8 9 6 5 3 0.55 834 477 203 120 87 53 46 29 27 18 17 12 11 8 7 5 0.60 798 496 191 123 80 53 42 29 24 17 14 10 8 6 0.65 746 501 176 122 72 52 36 27 20 15 11 9 0.70 676 488 156 116 62 48 30 24 15 12 - - 131 104 • -to 21 11 - - 101 18 M 3D
362 311 17 I» 221 2t4
I'" t Sample size less than 5.

Table 11 ( continued)
(b) Level of significance 5%, power 80%, one-sided test (Pa < Po)
Pol 0.10 0.15 0.20 0.25 0.30 0.35 0.40 0.45 0.50 Pa
n d* n d* n d* n d* n d* n d* n d* n d* n d*
0.05 184 11 60 4 32 2 21 1 15 1 11 1 8 0 7 0 5 0 0.10 283 32 83 10 42 5 26 3 18 2 13 2 10 1 8 1 0.15 368 60 103 18 50 9 30 6 20 4 14 3 11 2 0.20 441 95 119 27 56 13 33 8 22 6 15 4 0,2$ 501 133 133 37 61 18 35 10 23 7 0.30 548 173 142 47 65 22 37 13 0.35 683 213 149 57 67 26 0.40 606 252 163 66 0.45 617 288 len
I» 3 ~
CD
~ 1/1
0.55 0.60 0.65 0.70 0.75 0.80 0.85 0.90 0.95 i:r CD
251 Q. CD ..
n d* n d* n d* n d* n d* n d* n d* n d* n d* CD .. 3
0.05 5 0 t t t t t t t t If 0.10 6 1 5 1 t t t t t t t 0.15 8 2 7 2 5 1 t t t t t t 0.20 11 3 9 2 7 2 5 1 t t t t t 0.25 16 5 12 4 9 3 7 2 5 2 t t t t 0.30 24 9 16 6 12 5 9 4 6 2 5 2 t t t 0.35 38 15 24 10 16 7 11 5 8 3 6 3 t t t 0.40 68 30 38 17 23 11 16 8 11 5 8 4 5 2 t t 0.45 154 74 67 33 37 19 22 11 15 8 .10 5 7 4 5 3 t 0.50 615 317 151 80 65 35 35 20 21 12 13 8 9 5 6 4 t 0.55 600 340 145 84 62 37 32 19 19 12 12 8 7 4 t 0.60 573 353 136 86 57 37 29 19 16 11 10 7 5 3 0.65 534 356 125 85 50 35 25 18 13 9 7 5 0.70 483 346 109 80 43 32 20 15 9 7 0.75 419 321 91 71 33 26 14 11 0.80 342 279 69 68 22 19 0.85 253 219 44 39 0.90 150 138
t Sample size less than 5.

Table 11 ( continued)
(c) Level of significance 5%, power 50%, one-sided test (Pa < Po)
" pJ 0.10 0.15 0.20 0.25 0.30 0.35 0.40 0.45 0.50 Pa
~ n d* n d* n d* n d* n d* n d* n d* n d* n d*
0.05 98 4 35 20 13 0 10 0 7 0 6 0 5 0 t 0.10 138 13 44 4 23 2 15 1 10 1 8 0 6 0 5 0 0.15 174 26 51 7 26 3 16 2 11 1 8 1 6 0 0.20 203 40 57 11 28 5 17 3 11 2 8 1 0.25 228 57 62 15 29 7 17 4 11 2 0.30 247 74 65 19 30 9 17 5 0.35 260 91 67 23 31 10 0.40 268 107 68 27 0.45 271 121
tSample size less than 5.
Pa ~I 0.55 0.60 0.65 0.70 0.75 0.80 0.85 0.90 0.95 I~ -...II CD ...
d* d* d* d* d* d* d* d* d* . ... n n n n n n n n n
0.05 t t t t t t t t t 0.10 t t t t t t t t t 0.15 5 0 t t t t t t t t 0.20 6 1 5 1 t t t t t t t 0.25 8 2 6 1 t t t t t t t 0.30 11 3 8 2 6 1 t t t t t t 0.35 17 5 11 3 7 2 5 1 t t t t t 0.40 30 12 17 6 10 4 7 2 5 2 t t t t 0.45 67 30 29 13 16 7 10 4 6 2 t t t t 0.50 268 134 65 32 28 14 15 7 9 4 5 2 t t t 0.55 260 143 62 34 26 14 13 7 7 3 t t t 0.60 247 148 57 34 23 13 11 6 6 3 t t 0.65 228 148 51 33 20 13 9 5 t t 0.70 203 142 44 30 16 11 7 4 t 0.75 174 130 35 26 11 8 t 0.80 138 110 25 20 6 4 0.85 98 83 . 13 11 0.90 52 46
tSample size less than 5.

Sample size determination
Table 12. Estimating an incidence rate with specified relative precision
n = (Zl_~/2/f.)2
Confidence level
E 99% 95% 90%
0.01 66358 38417 27061 0.02 16590 9605 6766 0.03 7374 4269 3007 0.04 4148 2402 1692 0.05 2655 1537 1083 0.06 1844 1068 152 0.07 1355 785 553 0.08 1031 601 423 0.09 820 475 335 0.10 664 385 211 0.12 461 267 188 0.14 339 197 139 0.16 260 151 106 0.18 205 119 84 0.20 166 97 68 0.22 138 80 56 0.24 116 67 41 0.26 99 57 41 0.28 85 50 35 0.30 74 43 31 0.32 65 38 27 0.34 58 34 24 0.36 52 30 21 0.38 46 27 19 0.40 42 25 17 0.42 38 22 16 0.44 35 20 14 0.46 32 19 13 0.48 29 11 12 0.50 27 16 11
72

Table 13. Hypothesis tests for an incidence rate
F or a one-sided test
n =(Zl-aAO + Z I_pAa)2 /{}-o - )~a)2.
For a two-sided test
n = (Zl-a/2AO + Zl-pAaf /(Ao - Aa)2.
(a) Level of significance 5%, power 90%, one-sided test
,d 0.05 0.10 0.15 0.20 0.25 0.30 0.35 0.40 0.45 0.50 0.55 0.60 0.65 0.70 0.75 0.80 0.85 0.90 0.95 Aa
0.05 21 10 7 6 5 5 5 5 ~
-...J 0.10 18 57 21 13 10 8 7 7 6 6 5 5 5 5 5 5 5 CT
w 0.15 8 51 109 37 21 15 12 10 9 8 7 7 6 6 6 6 5 5 CD 0.20 6 18 102 179 57 31 21 16 13 12 10 9 8 8 7 7 7 6 ....
Co)
0.25 5 11 33 169 266 81 43 29 21 17 14 13 11 10 9 9 8 8 0.30 8 18 51 254 369 109 57 37 27 21 18 15 13 12 11 10 9 0.35 * 7 13 27 74 356 490 142 72 46 33 26 21 18 16 14 13 12 0.40 6 10 18 38 102 474 629 179 90 57 41 31 25 21 19 16 15 0.45 5 8 14 25 51 133 610 784 220 109 68 48 37 30 25 21 19 0.50 • 5 7 11 18 33 66 169 764 956 266 130 81 57 43 34 29 24 0.55 6 9 14 23 42 83 209 934 1146 315 154 94 66 50 39 33 0.60 6 8 12 18 29 51 102 254 1121 1352 369 179 109 76 57 45 0.65 5 7 10 15 23 36 62 122 303 1326 1576 428 206 125 86 64 0.70 5 7 9 13 18 27 43 74 145 356 1548 1817 490 235 142 97 0.75 5 6 8 11 15 22 33 51 88 169 413 1786 2075 557 266 160 0.80 * 6 7 10 13 18 26 38 60 102 196 474 2042 2351 629 298 0.85 * .. * 5 7 9 12 16 21 30 45 70 117 224 540 2315 2643 704 0.90 .. .. 5 6 8 10 14 18 25 35 51 80 133 254 610 2606 2952 0.95 .. .. 5 6 7 9 12 16 21 29 40 59 90 151 286 685 2913
• Sample size less than 5.

Table 13 ( continued)
(b) Level of significance 5%, power 80%, one-sided test
Ao 0.05 0.10 0.15 0.20 0.25 0.30 0.35 0.40 0.45 0.50 0.55 0.60 0.65 0.70 0.75 0.80 0.85 0.90 0.95
Aa
0.05 18 9 7 6 5 5 5
0.10 12 44 18 11 9 7 7 6 6 5 5 5 5 5 5
0.15 5 34 83 29 18 13 10 9 8 7 7 6 6 6 5 5 5 5 en III
0.20 12 69 135 44 25 18 14 11 10 9 8 7 7 7 6 6 6 3
" 0.25 7 21 117 199 62 34 23 18 14 12 11 10 9 8 8 7 7 CD
0.30 .. 5 12 34 177 275 83 44 29 22 18 15 13 11 10 10 9 8 III
0.36 .. .. 8 18 50 249 364 108 56 36 27 21 18 15 13 12 11 10 j:r
~I CD
0.40 " " 6 12 25 69 334 465 135 69 44 32 25 21 18 15 14 12 Q-CD
0.45 .. 5 9 16 34 92 431 578 165 83 53 38 29 24 20 18 16 .. CD
0.50 " " 7 12 21 45 117 540 704 199 99 62 44 34 28 23 20 .. 3
0.55 6 9 15 27 56 145 662 842 235 116 72 51 . 39 31 26 :i" 0.60 5 7 12 19 34 69 177 796 992 275 135 83 58 44 35 III .. 0.65 6 9 15 24 42 84 211 942 1155 318 155 95 66 50 cr
:=
0.70 5 8 12 18 29 50 100 249 1101 1330 364 176 108 75
0.75 5 7 10 14 21 34 60 117 290 1272 1518 412 199 121
0 •• " " 6 8 12 17 25 40 69 136 334 1456 171' 465 223
0,85 " " " .. 5 7 10 14 20 30 47 80 155 381 1652 1930 520
6,;90' " " " 5 6 9 12 16 23 34 64 92 177 431 1860 2154 .It - ...
• Sample size less than 5.

Table 13 ( continued)
(c) Level of significance 5%, power 90%, two-sided test
\ AO I 0.05 0.10 0.15 0.20 0.25 0.30 0.35 0.40 0.45 0.50 0.55 0.60 0.65 0.70 0.75 0.80 0.85 0.90 0.95
Aa
0.05 28 13 10 8 7 7 6 6 6 6 6 5 5 5 5 5 5 5 0.10 21 72 28 17 13 11 10 9 8 8 7 7 7 7 6 6 6 6 0.15 9 61 137 47 28 20 16 13 12 11 10 9 9 8 8 8 7 7 0.20 6 21 122 223 72 40 28 21 17 15 13 12 11 10 10 9 9 8 0.25 5 12 38 204 331 102 55 37 28 22 19 16 15 13 12 11 11 10 0.30 9 21 61 306 459 137 72 47 35 28 23 20 17 16 14 13 12 0.35 7 14 32 89 430 608 178 91 59 43 33 28 24 21 18 17 15 ~
DI
~l 0.40 6 11 21 45 122 575 779 223 113 72 52 40 33 28 24 21 19 C' iD
0.45 5 9 16 29 61 160 741 970 274 137 86 61 47 38 32 28 24 .... 0.50 5 8 12 21 38 79 204 928 1182 331 163 102 72 55 44 37 31
c..I
0.55 5 7 10 16 27 49 99 252 1136 1416 392 192 119 83 63 50 42 0.60 6 9 13 21 34 61 122 306 1365 1670 459 223 137 95 72 57 0.65 6 8 11 17 26 42 74 147 366 1615 1946 531 257 157 108 81 0.70 5 7 10 14 21 32 51 89 174 430 1886 2242 608 293 178 122 0.75 5 7 9 12 17 25 38 61 104 204 500 2179 2560 691 331 200 0.80 5 6 8 11 15 21 30 45 71 122 236 575 2492 2898 779 371 0.85 6 7 10 13 18 25 35 53 83 140 270 656 2826 3258 872 0.90 5 7 9 12 16 21 29 41 61 95 160 306 741 3181 3639 0.95 5 6 8 11 14 18 24 33 47 69 108 181 345 832 3557
• Sample size less than 5.

Table 13 ( continued)
(d) Level of significance 5%, power 80%, two-sided test \ ,d 0.05 0.10 0.15 0.20 0.25 0.30 0.35 0.40 0.45 0.50 0.55 0.60 0.65 0.70 0.75 0.80 0.85 0.90 0.95 Aa
0.05 23 12 9 8 7 6 6 6 6 6 5 5 5 5 5 5 5 5 0.10 14 58 23 15 12 10 9 8 8 7 7 7 6 6 6 6 6 6 (I) 0.15 6 42 108 38 23 17 14 12 10 10 9 8 8 8 7 7 7 7 III
0.20 14 86 174 58 33 23 18 15 13 12 11 10 9 9 8 8 8 3 'C
0.25 8 26 146 256 81 44 30 23 19 16 14 13 12 11 10 10 9 CD 0.30 6 14 42 221 353 108 58 38 29 23 20 17 15 14 13 12 11 III
j;j' 0.36 • 9 21 62 312 466 139 73 48 35 28 23 20 18 16 16 13 CD
~I 0.40 7 14 31 66 419 595 174 69 56 42 33 27 23 20 16 16 a.. CD
0.46 6 10 19 42 114 541 739 213 108 69 50 38 31 27 23 21 .. CD
0.50 5 8 14 26 65 146 680 899 256 128 81 58 44 36 ~
30 26 3 0.55 6 11 18 34 70 181 834 1075 302 150 94 67 51 41 34 :I
0.60 6 9 14 23 42 86 221 1003 1267 353 174 108 III
76 58 46 .. 0.65 5 7 11 17 29 52 104 265 1188 1474 407 199 123 86 65
o· :I
0.70 6 9 14 21 35 62 124 312 1389 1697 466 227 139 97 0.75 6 8 11 17 26 42 74 146 364 1606 1936 528 256 156 0.80 * 5 7 10 14 20 31 50 86 169 419 1839 2190 595 286 0.65 • 5 6 8 12 16 24 36 58 99 194 478 2087 2460 665 0.90 * * * • 6 7 10 14 19 28 42 67 114 221 541 2350 2746 0.95 • 5 7 9 12 16 23 32 48 76 129 250 609 2630
• Sample size less than 5.

Table 14. Hypothesis tests for two incidence rates in follow-up (cohort) studies (study duration not fixed)
F or a one-sided test
n1 = {Zl-,j[(1 + k)I2] + Z l-pj(U i + ;"~)}2/kVl - )"2f·
For a two-sided test
n1 = {Zl-,/2j[(1 +k)I2]+zl-pj(Ui+}"nV/k()'1-A 2f
where
A=(A 1 +)"2)/2
and k is the ratio of the sample size for the second group of subjects (n2) to that for the first group (n1 ).
For Tables 14 a-d, k= 1.
(a) Level of significance 5%, power 90%, one-sided test
A, 0.05 0.10 0.15 0.20 0.25 0.30 0.35 0.40 0.45 0.50 0.55 0.60 0.65 0.70 0.75 0.80 0.85 0.90 0.95 Ii -....I .le2 '\ -....I -0.05 41 19 14 12 11 10 9 9 9 8 8 8 8 8 8 8 8 8 .01:0
0.10 41 109 41 26 19 16 14 13 12 11 11 10 10 10 9 9 9 9 0.15 19 109 212 71 41 29 23 19 17 15 14 13 13 12 11 11 11 10 0.20 14 41 212 349 109 60 41 31 26 22 19 18 16 15 14 13 13 12 0.25 12 26 71 349 521 157 83 55 41 33 28 24 21 19 18 17 16 15 0.30 11 19 41 109 521 726 212 109 71 52 41 34 29 26 23 21 19 18 0.36 10 16 29 60 157 726 966 277 140 89 64 50 41 35 30 27 24 22 0.40 9 14 23 41 83 212 966 1240 349 174 109 78 60 49 41 35 31 28 0.45 9 13 19 31 55 109 277 1240 1549 431 212 132 93 71 57 48 41 36 0.50 9 12 17 26 41 71 140 349 1549 1891 521 254 157 109 83 66 55 47 0.55 8 11 15 22 33 52 89 174 431 1891 2268 619 300 183 127 96 76 63 0.60 8 11 14 19 28 41 64 109 212 521 2268 2680 726 349 212 146 109 86 0.65 8 10 13 18 24 34 50 78 132 254 619 2680 3125 842 403 243 167 124 0.70 8 10 13 16 21 29 41 60 93 157 300 726 3125 3605 966 460 277 189 0.75 8 10 12 15 19 26 35 49 71 109 183 349 842 3605 4119 1099 521 312 0.80 8 9 11 14 18 23 30 41 57 83 127 212 403 966 4119 4667 1240 585 0.86 8 9 11 13 17 21 27 36 48 66 96 146 243 460 1099 4667 5250 1390 0.90 8 9 '1 13 16 19 24 31 41 55 76 109 167 277 521 1240 5250 6867 0.95 8 9 10 12 15 18 22 28 36 47 63 86 124 189 312 585 1390 5867
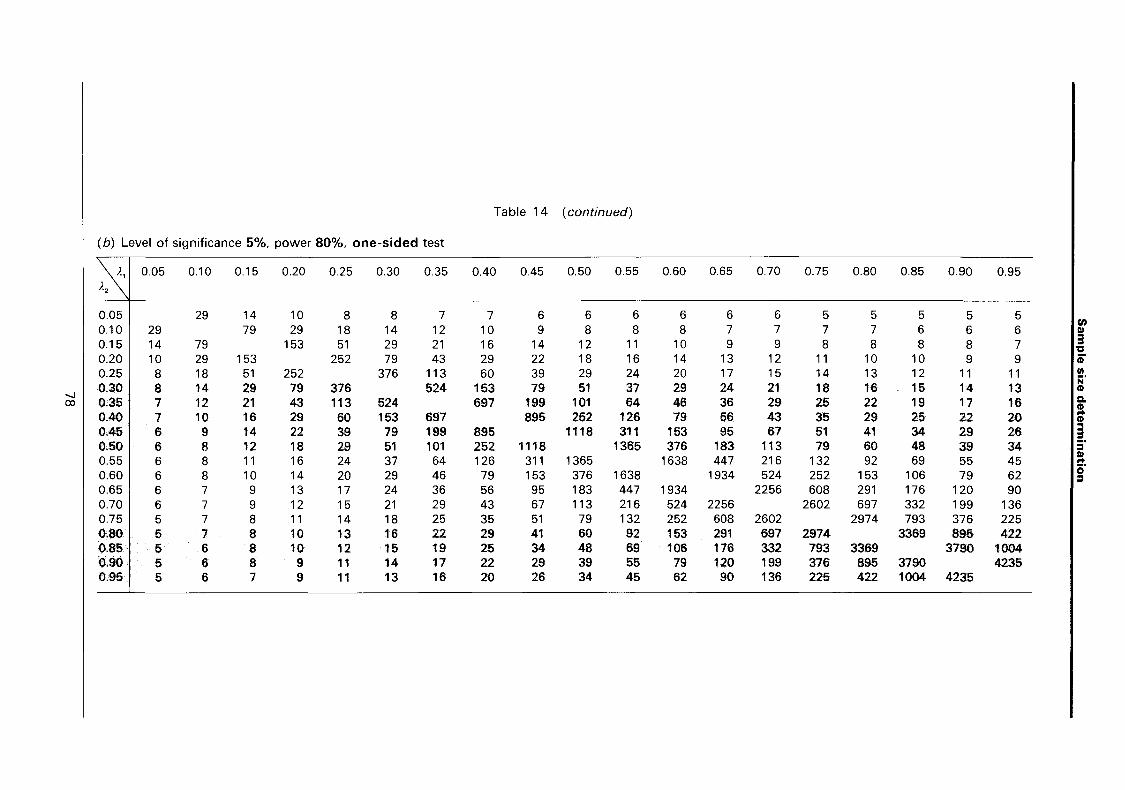
Table 14 ( continued)
(b) Level of significance 5%, power 80%, one-sided test
).,1 0.05 0.10 0.15 0.20 0.25 0.30 0.35 0.40 0.45 0.50 0.55 0.60 0.65 0.70 0.75 0.80 0.85 0.90 0.95 )'2
0.05 29 14 10 8 8 7 7 6 6 6 6 6 6 5 5 5 5 5 0.10 29 79 29 18 14 12 10 9 8 8 8 7 7 7 7 6 6 6
(I) al
0.15 14 79 153 51 29 21 16 14 12 11 10 9 9 8 8 8 8 7 3 'C
0.20 10 29 153 252 79 43 29 22 18 16 14 13 12 11 10 10 9 9 ii' 0.25 8 18 51 252 376 113 60 39 29 24 20 17 15 14 13 12 11 11 III
j;j' 0.30 8 14 29 79 376 524 153 79 51 37 29 24 21 18 16 15 14 13 ID
~I 0.35 7 12 21 43 113 524 697 199 101 64 46 36 29 25 22 19 17 16 0-lD
0.40 7 10 16 29 60 153 697 895 252 126 79 56 43 35 29 25 22 20 .. ID
0.45 6 9 14 22 39 79 199 895 1118 311 153 95 67 51 41 34 29 26 .. 3
a.50 6 8 12 18 29 51 101 252 1118 1365 376 183 113 79 60 48 39 34 5' 0.55 6 8 11 16 24 37 64 126 311 1365 1638 447 216 132 92 69 55 45
al .. 0.60 6 8 10 14 20 29 46 79 153 376 1638 1934 524 252 153 106 79 62 o·
:= 0.65 6 7 9 13 17 24 36 56 95 183 447 1934 2256 608 291 176 120 90 0.70 6 7 9 12 15 21 29 43 67 113 216 524 2256 2602 697 332 199 136 0.75 5 7 8 11 14 18 25 35 51 79 132 252 608 2602 2974 793 376 225 0.80 5 7 8 10 13 16 22 29 41 60 92 153 291 697 2974 3369 895 422 0.85 5 6 8 10 12 15 19 25 34 48 69 106 176 332 793 3369 3790 1004 0.90 5 6 8 9 11 14 17 22 29 39 55 79 120 199 376 895 3790 4235 0.95 5 6 7 9 11 13 16 20 26 34 45 62 90 136 225 422 1004 4235

Table 14 ( continued)
(c) Level of significance 5%, power 90%, two-sided test \
,1,1 0.05 0.10 0.15 0.20 0.25 0.30 0.35 0.40 0.45 0.50 0.55 0.60 0.65 0.70 0.75 0.80 0.85 0.90 0.95 . \
11.2
0.05 50 24 17 14 13 12 11 11 10 10 10 10 9 9 9 9 9 9 0.10 50 134 50 31 24 20 17 15 14 13 13 12 12 11 11 11 11 10 0.15 24 134 260 87 50 35 28 24 21 19 17 16 15 14 14 13 13 12 0.20 17 50 260 428 134 73 50 38 31 27 24 21 20 18 17 16 15 15 0.25 14 31 87 428 638 192 101 67 50 40 34 29 26 24 22 20 19 18 -I 0.30 13 24 50 134 638 891 260 134 87 63 50 41 35 31 28 25 24 22 III
U3i r:T
0.35 12 20 35 73 192 891 1185 339 171 109 78 61 50 42 37 33 30 27 CD 0.40 11 17 28 50 101 260 1185 1521 428 213 134 95 73 69 50 43 38 34 ...
.ca 0.46 11 15 24 38 67 134 339 1521 1900 528 260 162 114 87 70 58 50 44 0.50 10 14 21 31 50 87 171 428 1900 2320 638 311 192 134 101 81 67 57 0.55 10 13 19 27 40 63 109 213 528 2320 2783 759 368 225 156 117 93 76 0.60 10 13 17 24 34 50 78 134 260 638 2783 3287 891 428 260 179 134 106 0.65 10 12 16 21 29 41 61 95 162 311 759 3287 3834 1033 494 298 205 152 0.70 9 12 15 20 26 35 50 73 114 192 368 891 3834 4422 1185 564 339 231 0.75 9 11 14 18 24 31 42 59 87 134 225 428 1033 4422 5053 1348 638 382 0.80 9 11 14 17 22 28 37 50 70 101 166 260 494 1185 6053 6726 1521 718 0;85 9 11 13 16 20 26 33 43 58 81 117 179 298 564 1348 5726 6440 1705 0.90 9 11 13 15 19 24 30 38 50 67 93 134 205 339 638 1521 6440 7197 0.95 9 10 12 15 18 22 27 34 44 57 76 106 152 231 382 718 1705 7197

Table 14 ( continued)
(d) Level of significance 5%, power 80%, two-sided test
A,I 0.05 0.10 0.15 0.20 0.25 0.30 0.35 0.40 0.45 0.50 0.55 0.60 0.65 0.70 0.75 0.80 0.85 0.90 0.95 A2
0.05 37 17 13 10 9 9 8 8 7 7 7 7 7 7 7 7 6 6 (I)
0.10 37 100 37 23 17 14 13 11 10 10 9 9 9 8 8 8 8 8 III
0.15 17 100 194 64 37 26 21 17 15 14 13 12 11 10 10 10 9 9 3 'C
0.20 13 37 194 320 100 54 37 28 23 20 17 16 14 13 13 12 11 11 iD 0.25 10 23 64 320 477 143 75 50 37 30 25 22 19 17 16 15 14 13 1/1
jij' 0.30 9 17 37 100 477 665 194 100 64 47 37 31 26 23 21 19 17 16 CD
~I 0.35 9 14 26 54 143 665 885 253 128 81 58 45 37 31 27 24 22 20 CI. CD
0.40 8 13 21 37 75 194 885 1136 320 159 100 71 54 44 37 32 28 25 .. CD
0.45 8 50 100 253 1136 1419 394 194 120 85 64 52 43 37 32 ..
11 17 28 ~. 0.50 7 10 15 23 37 64 128 320 1419 1733 477 232 143 100 75 60 50 42 ::I
0.55 7 10 14 20 30 47 81 159 394 1733 2078 567 274 168 116 87 69 57 III ..
0.60 7 9 13 17 25 37 58 100 194 477 2078 2455 665 320 194 134 100 79 o· ::I
0.65 7 9 12 16 22 31 45 71 120 232 567 2455 2863 771 369 222 153 113 0.70 7 9 11 14 19 26 37 54 85 143 274 665 2863 3303 885 421 253 173 0.75 7 8 10 13 17 23 31 44 64 100 168 320 771 3303 3774 1007 477 285 0.80 7 8 10 13 16 21 27 37 52 75 116 194 369 885 3774 4277 1136 536 0.85 7 8 10 12 15 19 24 32 43 60 87 134 222 421 1007 4277 4811 1274 0.90 6 8 9 11 14 17 22 28 37 50 69 100 153 253 477 1136 4811 5376 0.95 6 8 9 11 13 16 20 25 32 42 57 79 113 173 285 536 1274 5376
Related Documents