Sample Size Determination Dr. Wan Nor Arifin Unit of Biostatistics and Research Methodology, Universiti Sains Malaysia.

Welcome message from author
This document is posted to help you gain knowledge. Please leave a comment to let me know what you think about it! Share it to your friends and learn new things together.
Transcript

Sample Size DeterminationDr. Wan Nor Arifin
Unit of Biostatistics and Research Methodology, Universiti Sains Malaysia.

Dr. Wan Nor Arifin GMT206 - Sample Size 2
Outlines
● Estimation – One Mean/Percentage● Hypothesis testing – Comparing Two
Means/Percentages

Dr. Wan Nor Arifin GMT206 - Sample Size 3
Software used
● Sample Size Calculator (web)
https://wnarifin.github.io/ssc_web.html
Dr. Wan Nor Arifin GMT206 - Sample Size 4
Estimation
1. One mean
● Estimate mean of numerical variable in population e.g. blood pressure, BMI etc.
Dr. Wan Nor Arifin GMT206 - Sample Size 5
Estimation
● Conduct a study to estimate mean systolic blood pressure (SBP) among USM medical students. How many medical students should you measure? All of them?
● Sample! Need to calculate minimum number of students to measure → get precise estimation.
Dr. Wan Nor Arifin GMT206 - Sample Size 6
Estimation
● What you need:● Standard deviation of SBP from other studies.● Set your precision (in unit of measurement, e.g.
1mmHg, 2mmHg, …).● Set Confidence level (90%, 95%, 99%).● Dropout % – % of your participants that run away
from study.
Dr. Wan Nor Arifin GMT206 - Sample Size 7
Estimation
● Let say:● SD of SBP = 15mmHg.● Precision = 2mmHg● 95% Confidence level● 20% dropout

Dr. Wan Nor Arifin GMT206 - Sample Size 8
Estimation
● Means → Single Mean → 1 mean – Estimation

Dr. Wan Nor Arifin GMT206 - Sample Size 9
Estimation
● You have to sample 272 medical students to estimate mean SBP among USM medical students, with mean SBP ± 2mmHg.
Dr. Wan Nor Arifin GMT206 - Sample Size 10
Estimation
2. One percentage/proportion
● Estimate % of of categorical variable in population e.g. obesity status, HIV, diabetes etc.

Dr. Wan Nor Arifin GMT206 - Sample Size 11
Estimation
● Conduct a study to estimate % of obesity among USM medical students. How many medical students should you sample?
Dr. Wan Nor Arifin GMT206 - Sample Size 12
Estimation
● What you need:● % of obesity among medical students from other
studies.● Set your precision (in percentage, 1%, 2%, 5%...)● Set Confidence level (90%, 95%, 99%).● Dropout % – % of your participants that run away
from study.

Dr. Wan Nor Arifin GMT206 - Sample Size 13
Estimation
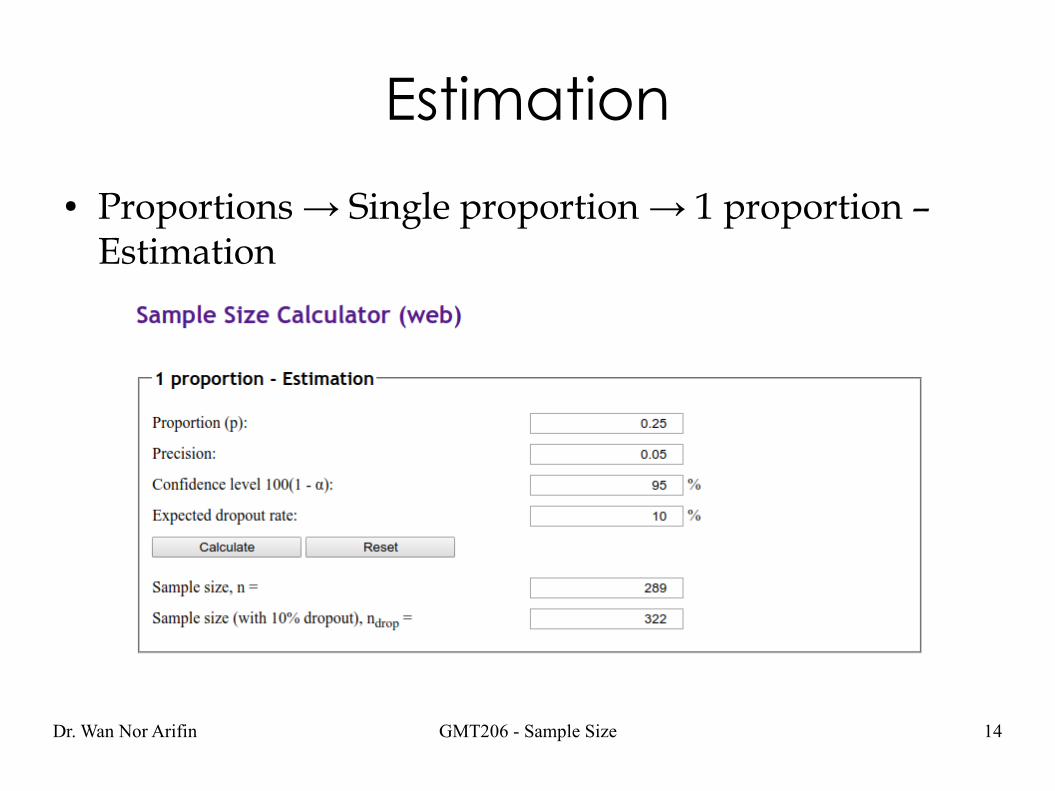
● Let say:● % of obesity = 25% = 0.25 (in proportion).● Precision = ±5% = 0.05 (in proportion).● 95% Confidence level.● 10% dropout (i.e. those who won't let you know
their BMI).
Dr. Wan Nor Arifin GMT206 - Sample Size 14
Estimation
● Proportions → Single proportion → 1 proportion – Estimation

Dr. Wan Nor Arifin GMT206 - Sample Size 15
Estimation
● You have to sample 322 medical students to estimate % of obesity among USM medical students, with % obesity ± 5%.
Dr. Wan Nor Arifin GMT206 - Sample Size 16
Hypothesis Testing
3. Comparing two means of two populations
● Testing hypothesis that means of a continuous variable for two different populations are actually different → Using independent t-test.

Dr. Wan Nor Arifin GMT206 - Sample Size 17
Hypothesis Testing
● Conduct a study to compare mean BMI of Year 5 with Year 2 medical students. How many medical students should you sample from each population?

Dr. Wan Nor Arifin GMT206 - Sample Size 18
Hypothesis Testing
● What you need:● SD of BMI of medical students from other studies
(preferably Year 5/Year 2, take the largest you could find).
● Set Expected difference in BMI between the two populations.
● Determine Significance level = 0.05, 0.01, 0.001.● Power of the test – usually 80%.● Dropout %.
Dr. Wan Nor Arifin GMT206 - Sample Size 19
Hypothesis Testing
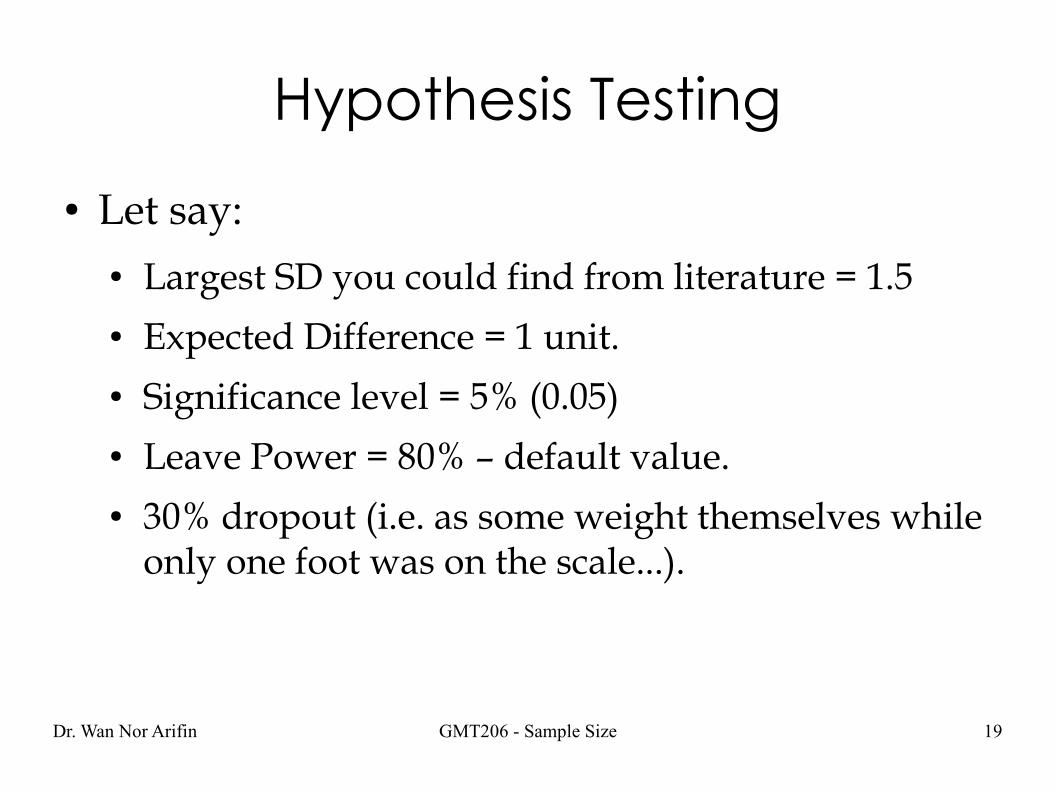
● Let say:● Largest SD you could find from literature = 1.5● Expected Difference = 1 unit.● Significance level = 5% (0.05)● Leave Power = 80% – default value.● 30% dropout (i.e. as some weight themselves while
only one foot was on the scale...).
Dr. Wan Nor Arifin GMT206 - Sample Size 20
Hypothesis Testing
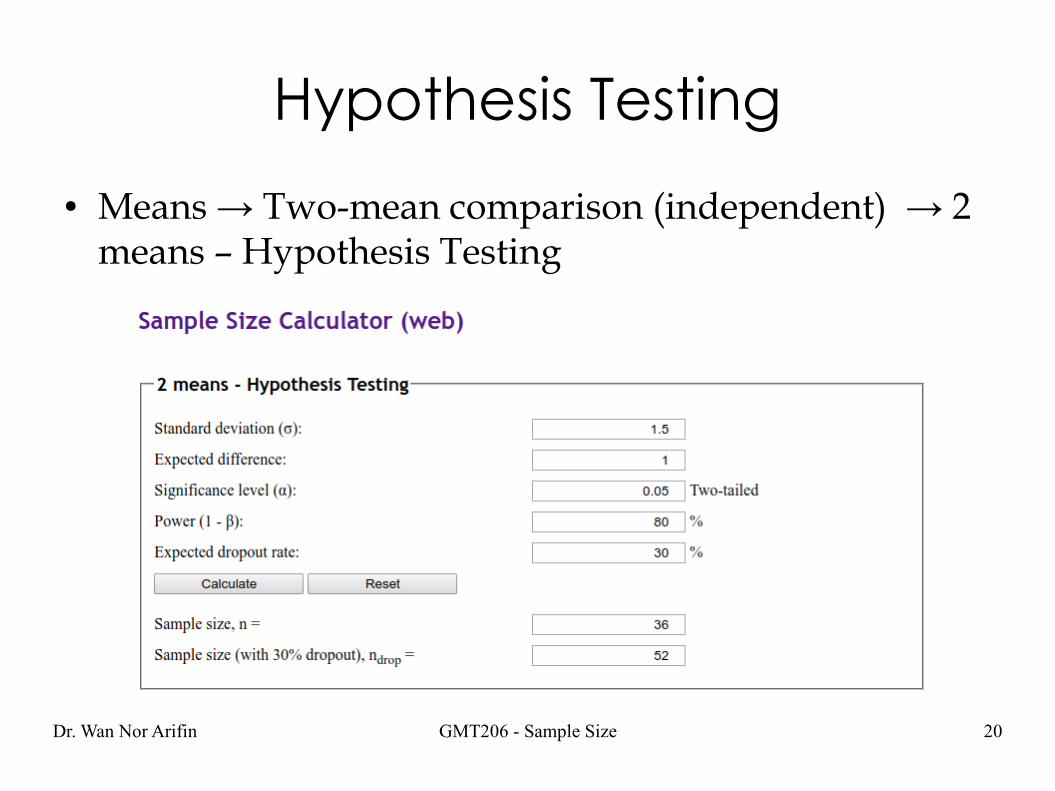
● Means → Two-mean comparison (independent) → 2 means – Hypothesis Testing

Dr. Wan Nor Arifin GMT206 - Sample Size 21
Hypothesis Testing
● You have to sample 52 Year 5 students and 52 Year 2 students to make the comparison, expecting a difference of 1 unit BMI between the two.

Dr. Wan Nor Arifin GMT206 - Sample Size 22
Hypothesis Testing
4. Comparing percentages of two populations
● Testing hypothesis that percentages of a categorical variable for two different populations are actually different → Using Chi-squared test.

Dr. Wan Nor Arifin GMT206 - Sample Size 23
Hypothesis Testing
● Conduct a study to compare % of obesity among Year 2 with Year 5 medical students. How many medical students should you sample from each population?
Dr. Wan Nor Arifin GMT206 - Sample Size 24
Hypothesis Testing
● What you need:● % of obesity of Year 2 medical students (as control,
p0) from other studies (or Year 5 as control, you decide).
● Set expected % of obesity of Year 5 students (as case, p1).
● Determine Significance level = 0.05, 0.01, 0.001● Power of the test – usually 80%.● Dropout %.

Dr. Wan Nor Arifin GMT206 - Sample Size 25
Hypothesis Testing
● Let say:● p0 = 35% = 0.35 (in proportion) → Year 2/medical
students in general as control.● p1 = 50% = 0.5 (in proportion) → If you think this
could be the % for Year 5 students.● Significance level = 5% (0.05)● Power = 80% (0.8)● 10% dropout.
Dr. Wan Nor Arifin GMT206 - Sample Size 26
Hypothesis Testing
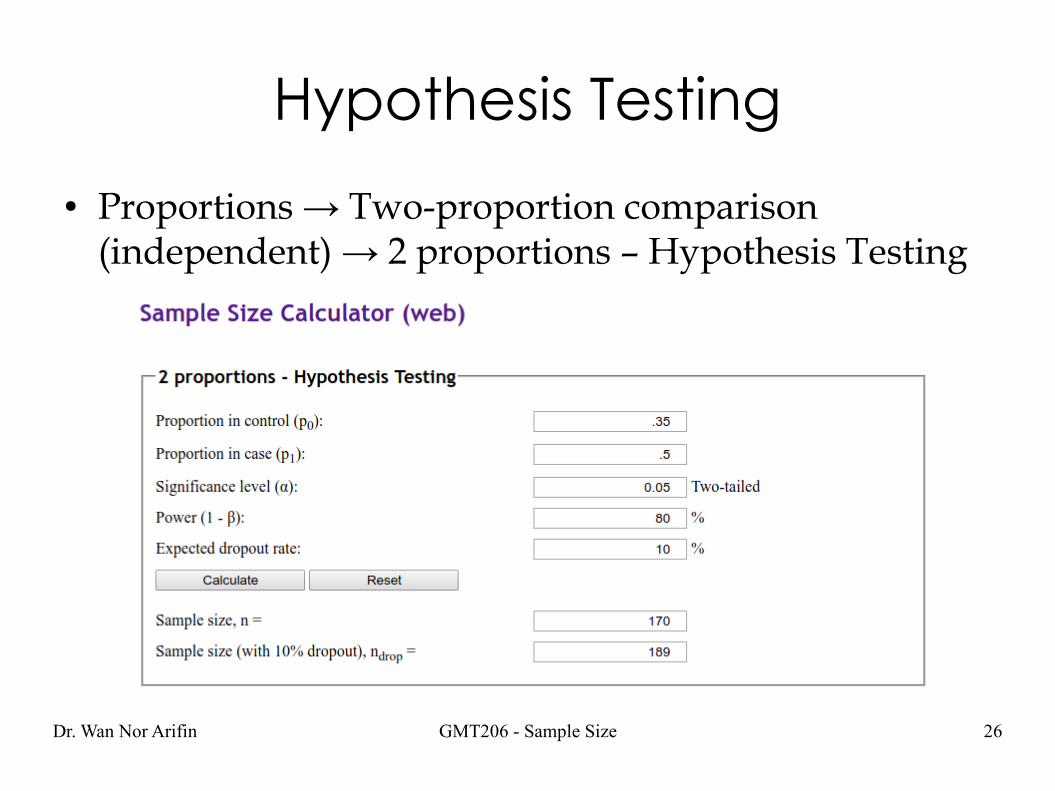
● Proportions → Two-proportion comparison (independent) → 2 proportions – Hypothesis Testing
Dr. Wan Nor Arifin GMT206 - Sample Size 27
Hypothesis Testing
● You have to sample 189 Year 2 students and 189 Year 5 students to make the comparison, expecting a difference of 15% for % of obesity between the two.
Dr. Wan Nor Arifin GMT206 - Sample Size 28
References
Arifin, W. N. (2013). Introduction to sample size calculation. Education in Medicine Journal, 5(2), e89-e96.
Arifin, W. N. (2017). Sample size calculator (web). Retrieved from http://wnarifin.github.io
Lemeshow, S., Hosmer Jr, D. W., Klar, J., Lwanga, S. K. (1990). Adequacy of sample size in health studies. England: John Wiley & Sons Ltd.
Naing, N. N. (2011). A practical guide on determination of sample size in health sciences research. Kelantan: Pustaka Aman Press.
Related Documents