Journal of Hydrology, 150 (1993) 589 614 0022-1694/93/$06.00 © 1993 Elsevier Science Publishers B.V. All rights reserved 589 [31 Salt accumulation in semi-arid floodplain soils with implications for forest health Ian D. Jolly*, Glen R. Walker, Peter J. Thorburn CSIRO Division of Water Resources and Centre for Groundwater Studies, PMB No 2. Glen Osmond, S.A. 5064. Australia (Received 15 December 1992; revision accepted 20 May 1993) Abstract Dieback of native Eucalyptus largiflorens forests is an increasing problem on the floodplains of the lower River Murray, southern Australia. Salinisation of floodplain soils, as a result of the changed hydrological management of the River Murray, appears to be a primary cause of the dieback. Regulation of the River Murray has reduced the frequency of large flood events by a factor of approximately three and caused groundwater levels beneath floodplains to rise. The higher water tables have resulted in increased discharge of the naturally saline groundwater in the floodplains by evapotranspiration, and the decreased incidence of large floods has reduced floodwater recharge and hence leaching of salt from floodplain soils. Use of soil physical properties for a range of floodplain soils, combined with measurements of groundwater discharge from bare and vegetated sites, suggests that the time-scale for complete soil salinisation can, at worst, be less than 20 years. Moreover, salt accumulation at most sites will continue to occur as the present flooding regime (of which there is limited scope for improvement) appears incapable of providing the leaching required to counteract accumulation. The analyses carried out here suggest that the 'critical' water table depth (below which groundwater discharge is balanced or exceeded by floodwater recharge) needs to be increased by 14 55% (the more clayey the soil, the larger the increase) to prevent salt accumulation. Failure to implement schemes which lower the water tables beneath the floodplain may, in the long term, cause serious damage to these important riparian forests. Introduction Dieback of native riparian forests on the floodplains of the River Murray (Australia's longest river) is an issue of considerable concern. Margules and Partners et al. (1990) estimated that approximately 18000ha of floodplain vegetation is severely degraded by factors such as saline groundwater, drown- ing or waterlogging, water stress, logging or clearing, and grazing. They concluded that the issue of greatest concern for the long-term health of * Corresponding author. Telephone: (08) 303 8700. Fax: (08) 303 8570.

Welcome message from author
This document is posted to help you gain knowledge. Please leave a comment to let me know what you think about it! Share it to your friends and learn new things together.
Transcript
Journal o f Hydrology, 150 (1993) 589 614 0022-1694/93/$06.00 © 1993 Elsevier Science Publishers B.V. All rights reserved
589
[31
Salt accumulation in semi-arid floodplain soils with implications for forest health
Ian D. Jolly*, Glen R. Walker, Peter J. Thorburn
CSIRO Division of Water Resources and Centre for Groundwater Studies, PMB No 2. Glen Osmond, S.A. 5064. Australia
(Received 15 December 1992; revision accepted 20 May 1993)
Abstract
Dieback of native Eucalyptus largiflorens forests is an increasing problem on the floodplains of the lower River Murray, southern Australia. Salinisation of floodplain soils, as a result of the changed hydrological management of the River Murray, appears to be a primary cause of the dieback. Regulation of the River Murray has reduced the frequency of large flood events by a factor of approximately three and caused groundwater levels beneath floodplains to rise. The higher water tables have resulted in increased discharge of the naturally saline groundwater in the floodplains by evapotranspiration, and the decreased incidence of large floods has reduced floodwater recharge and hence leaching of salt from floodplain soils. Use of soil physical properties for a range of floodplain soils, combined with measurements of groundwater discharge from bare and vegetated sites, suggests that the time-scale for complete soil salinisation can, at worst, be less than 20 years. Moreover, salt accumulation at most sites will continue to occur as the present flooding regime (of which there is limited scope for improvement) appears incapable of providing the leaching required to counteract accumulation. The analyses carried out here suggest that the 'critical' water table depth (below which groundwater discharge is balanced or exceeded by floodwater recharge) needs to be increased by 14 55% (the more clayey the soil, the larger the increase) to prevent salt accumulation. Failure to implement schemes which lower the water tables beneath the floodplain may, in the long term, cause serious damage to these important riparian forests.
Introduction
Dieback of native riparian forests on the floodplains of the River Murray (Australia's longest river) is an issue of considerable concern. Margules and Partners et al. (1990) estimated that approximately 18000ha of floodplain vegetation is severely degraded by factors such as saline groundwater, drown- ing or waterlogging, water stress, logging or clearing, and grazing. They concluded that the issue of greatest concern for the long-term health of
* Cor responding author . Telephone: (08) 303 8700. Fax: (08) 303 8570.
590 I.D. Jolly et al. Journal of Itydrology 150 (1993) 589 614
riparian vegetation along the River Murray is soil salinisation. Furthermore, significant portions of the areas affected or under threat are of considerable ecological value; indeed, several (including the study area) have been classified under the UNESCO Ramsar Convention (Section 14.5) as Wetlands of Inter- national Importance (National Environmental Consultancy (NEC), 1988).
To regulate the flow of the River Murray for provision of reliable year- round water supplies, a system of major reservoirs and small weirs (locally referred to as Locks) were installed along the river during the 1920s. The weirs have raised groundwater levels beneath the adjacent floodplains, and the major reservoirs have reduced the frequency of medium to large floods by a factor of three (Ohlmeyer, 1991). Discharge by evapotranspiration from the current groundwater levels (less than 3 m depth) may be significant. In the lower reaches of the river it is likely that discharge of the saline (5-40 000 mg1-1 total dissolved solids (TDS)) groundwater may have increased soil salinities (Jolly et al., 1991). Furthermore, river regulation and the development of irrigated and dryland agriculture in the catchment are thought to be the primary causes of increasing salinity of the River Murray, a problem also of great concern (Murray Darling Basin Ministerial Council, 1988).
Preliminary work by Eldridge (1991) and Jolly et al. (1992) suggested that the dieback of Eucalyptus largiflorens (black box), the predominant forest community of the floodplains along the lower reaches of the river, is due to water stress caused by a combination of osmotic effects and a reduction in water supply. The osmotic effects are caused by the high soil salt storages and reduced water supply as a result of the lower frequency of flooding. Jolly et al. (1992) hypothesised that the high salt content in the unsaturated zone is due to: (1) increased discharge of saline groundwater, caused by the elevated water table; (2) reduced leaching of salts from the soils, caused by the less frequent flooding. Hence, an understanding of groundwater discharge and soil salin- isation are important prerequisites for developing ameliorative approaches to this serious environmental problem.
Previous studies of groundwater discharge and soil salinisation have focused on agricultural areas. Talsma (1963) measured rates of groundwater discharge and salt accumulation in the soils of the Murrumbidgee irrigation area in south-eastern Australia, and concluded that the water table needed to be kept below a 'critical' depth of 1-2 m to control soil salinisation. Under dryland conditions, however, the 'critical' depths for similar soils need to be 3--5 m (Peck, 1978), as infiltration events which leach the salt from the profile are much less frequent. Although the principles developed in these studies are general, their specific findings cannot be applied to areas of differing soils, vegetation and climate.
1.D. Jolly et al. / Journal of Hydrology 150 (1993) 589 614 591
In this paper we specifically address the following questions: (1) How does groundwater discharge vary with water table depth in the
soils typically found in the study region? (2) What is the relative importance of water table depth and flood fre-
quency in determining the salinisation of floodplain soils? (3) What is the time-scale for salt accumulation in the soil profile; and
therefore, what is the flood frequency required to prevent salinisation? The approach taken is similar to that of Talsma (1963) and Peck (1978), and involves a number of components. First, soil physical parameters are obtained for a range of floodplain soils. These are used in steady-state theory which describes the relationship between groundwater discharge and the water table depth. Using this theory, the rates of groundwater discharge and the time- scales of salt accumulation are estimated. Finally, the rates of salt accumula- tion are contrasted against current-day flood frequencies to determine 'critical" water table depths required to limit soil salinisation. Furthermore, a field-based relationship between E. largiflorens health and the factors that determine the 'critical' depth is presented.
Site description
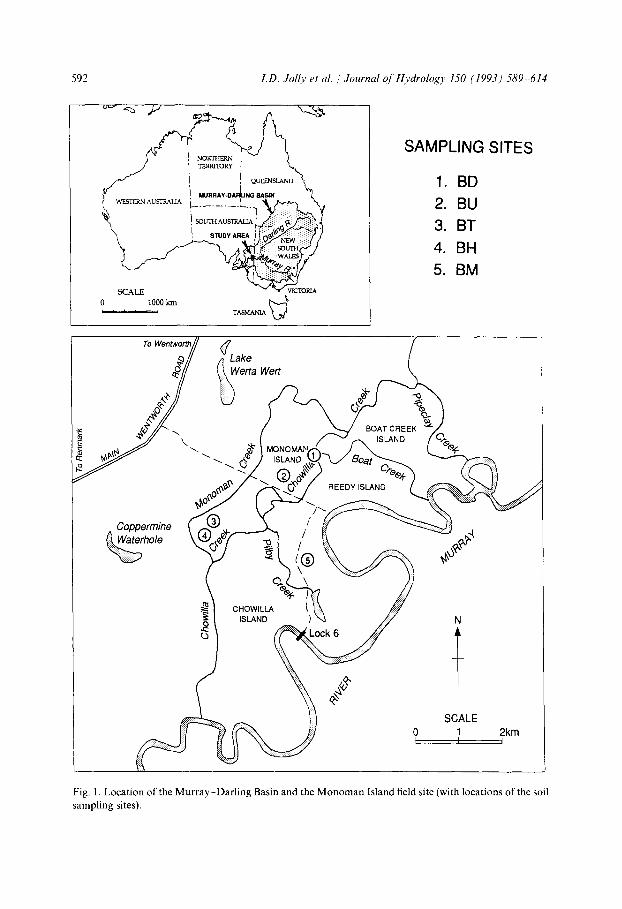
The region selected for study was the Chowilla anabranch, a 200 km 2 area of River Murray floodplain, centred on the South Australia-New South Wales border (Fig. 1). The anabranch consists of a network of streams which flow from the River Murray upstream of Lock 6 (one of the weirs used to regulate the flow of the river) across the floodplain, which is of 6-8 km width. They eventually join together to form Chowilla Creek, which discharges back into the River Murray downstream of Lock 6. Before the installation of Lock 6 the floodplain streams were ephemeral and flowed only during times of flood.
The composition and distribution of vegetation in the Chowilla anabranch has been studied in detail by NEC (1988), O'Malley (1990) and Hollingsworth et al. (1990). The predominant species are the trees black box and river red gum (E. camaldulensis), and the shrub lignum (Muehlenbeckia cunninghamii). Large areas of annual grasses are also present. The distribution of these species within the floodplain is related to flood frequency (which in turn is generally related to surface elevation) and groundwater salinity (NEC, 1988). It is important to note that small differences in surface elevation correspond to large differences in flooding frequency.
The Chowilla region has a semi-arid climate with mean rainfall of approxi- mately 260mmyear -1 and potential evaporation of about 2000mmyear -l . Annual rainfall is extremely variable, with values ranging from less than
592 I.D. Jolly et al. ,; Journal of Hydrology 150 (1993) 589 614
ct
0 1000 km ~ * TASMANIA
SAMPLING SITES
1. BD 2. BU 3. BT 4. BH 5. BM
To Wentworth !
~1.~ a Wert
LJ
BOAT CREEK ~ ISLAND /
: : ~ - ~ ~ ....
. Coppermine 4~ .~ //
CHOWILLA ~, ISLAND /
'O ~ L o c k 6
J
N
SCALE 0 1 2km I I I
Fig. 1. Location of the Murray-Dar l ing Basin and the Monoman Island field site (with locations of the soil sampling sites).
I.D. Jolly et al. / Journal of Hydrology 150 (1993) 589- 614 593
100mmyear 1 to over 500mmyear -1 The distribution of mean monthly rainfall has a slight winter dominance.
The soils of the Chowilla floodplain have been studied on a reconnaissance scale by Gill (1973a, b) and Rodgers (1978), and in more detail by Hollings- worth et al. (1990). In brief, the floodplain soils generally consist of an upper layer of grey cracking clay of alluvial origin, which has minimal profile devel- opment except for occasional gypsum, halite or calcium carbonate horizons. The surface clay (known as the Coonambidgal Clay) is up to 5 m thick, with the deepest deposits occurring close to existing or prior creeks. The Coonambidgal Clay overlies an unconsolidated alluvial sand deposit known as the Monoman Formation. This deposit is approximately 30m deep and consists of fine to coarse sand with varying amounts of clay and silt. The boundary between the Coonambidgal Clay and the Monoman Sand is often rather diffuse, and the transition zone of varying clay content can be up to 1 m in thickness.
An overview of the hydrogeology of the Chowilla region was presented by Waterhouse (1989). Briefly, the Monoman Formation is an unconfined aquifer which is thought to be in direct hydraulic contact with the regional unconfined Pliocene Sands aquifer. The Monoman Formation is also hydraulically con- nected to the streams of the floodplain (Jolly et al., 1993). Underlying the entire region is the Murray Group limestone aquifer, which is confined by the Book- purnong Beds (a shelly sand and clay formation) and Winnambool Formation (a marly limestone) aquitards. Regionally, the Murray Group aquifer has a poten- tiometric head approximately 5 m above that of the Pliocene Sands. This has led to speculation that significant upward leakage occurs from the Murray Group to the Pliocene Sands aquifer, and therefore into the Monoman Formation.
Methods
Theory
To identify the soil physical parameters which determine the rate of groundwater discharge and to examine the relationships between the soil physical parameters, water table depth and groundwater discharge, the fol- lowing theory is presented. In this analysis one-dimensional, isothermal, vertical flow is considered.
Groundwater discharge from a shallow water table The steady-state liquid water flux (q) in the upward direction in a homo-
geneous soil is described by
q = - K ( s ) ( d S + ) \ d z 1 (1)
594 I.D. Jolly et al. / Journal of Hydrology 150 (1993) 589 614
where K is the hydraulic conductivity, S is the matric suction (absolute value of matric potential) and z is the depth of the water table below the soil surface (positive downwards). Integrating Eq. (1) gives the following relationship between z and S:
z = - q dS (2) 0 1 +
K(S)
Solution of Eq. (2) requires a knowledge of the form of the K(S) relationship. A K(S) relationship commonly used for this purpose is
a K(S) - (3)
( s n + b)
where a, b and n are constants. Assuming a lower boundary condition of S = 0 at the water table, an upper boundary condition of S ~ ec at the soil surface, and that n > 1, Eq. (2) can be solved to give the maximum soil-limited steady-state upward flux (qlim) from a water table at depth z (Warrick, 1988):
qlim ---- / 3 1 - n A n a z - n (4)
where/3 -- (qb/a) + 1, and A n is a constant dependent on n. As the value of/3 can he assumed to be approximately unity, with a resultant error in qlim of 6-20% (Thorburn et al., 1992), Eq. (4) reduces to
qlim = Az n (5)
where A = Ana. It should be noted that Warrick (1988) considered depth as positive upwards, and so the parameter z in his formulations of Eqs. (4) and (5) is given as the parameter d.
Estimation of the parameter n Eq. (5) is commonly used to determine the dependence of groundwater
discharge on water table depth and soil physical properties. To apply this solution, K(S) data must be available, and they should be adequately described by Eq. (3). In field situations, K(S) data are often not available, and even when available, they are often unreliable owing to the highly variable nature of field soils. However, in many cases, soil water retention data (volumetric water content, 0, and matric suction) are available. Therefore approaches which use water retention data to estimate the K(S) relationship can be considered. One such technique is the closed-form analytical method of Van Genuchten (1980). In this approach, it is assumed that the water retention curve can be described by the following empirical relationship:
Os - Or 0 = O r ~'- (O r < 0 < 0s) (6) [1 + m
I.D. Jolly et al. / Journal of Hydrology 150 (1993) 589 614 595
where 0r and 0 s are the residual and saturated volumetric water contents, and ~, p and m are parameters which determine the shape of the curve (note that, to avoid confusion with Eq. (3), n in Eq. (1) of Van Genuchten (1980) has been denoted as p in the above equation). Assuming a theoretical pore-size distri- bution (Mualem, 1976), relative hydraulic conductivity (Kr = K / K , , where K~ is the saturated hydraulic conductivity) can be estimated from matric suction (Van Genuchten, 1980):
{1 - (c~S)P-I[1 + (aS)P]-1"} 2 Kr(S) = [1 + (aS)P] m/2 (7)
To derive estimates of the parameter n in Eq. (3) using the approach of Van Genuchten (1980), it is noted that at the dry end of the water retention curve (i.e. as S ~ oo), a S >> 1, and so Eq. (7) can be reduced to the approximate form,
Kr( S) "~ m2(c~S) - 5/2p+1/2 (8)
and hence
n ~ ~p - ½ (9)
The parameter n in Eq. (9) is the same as that in Eqs. (3), (4) and (5).
Estimating steady-state discharge using tracers Eq. (5) provides a means of determining the relationship between ground-
water discharge and depth between the water table and the soil surface. To apply this relationship, a value of A is required which can be calculated from a measurement of discharge at a single water table depth. In situations where groundwater discharge occurs by bare-surface evaporation only, under steady- state conditions, natural tracers such as chloride, deuterium and oxygen-18 can be used to obtain estimates of discharge (Barnes and Allison, 1988; Woods, 1990). In this paper, deuterium profiles are used, as they require much shorter times to reach steady state than chloride, owing to the higher diffusivity of deuterium (Barnes and Allison, 1988).
The flux (F) of a tracer at any depth z (positive downwards) can be described by the convection-diffusion equation:
Oc F = qc + Oeff~zz (10)
where q is the water flux (positive upwards), c is the concentration of the solute and Der f is the effective diffusion coefficient, given by
Deft ---- DoOfl (11)
596 I.D. Jolly et al. / Journal of Itydrology 150 (1993) 589 614
where D o is the diffusion coefficient of the solute in aqueous solution andj~ is the ' impedance factor'. Woods (1990) provided a good summary of how this parameter can be estimated.
At steady state, both F and q are constant with depth. Taking the upper boundary condition z = 0, c = Co, and the lower boundary condition z = (effectively, the depth at which c becomes approximately constant), c = Cres (the tracer concentration in the groundwater), Eq. (10) can be solved for c(z), and natural logarithms taken of both sides to give
In ]c - Cres[ = In ]c o - Cres] + ------~q Z (12) Deft
q can therefore be obtained from the slope of a plot of In [c - Cre~] vs. z. In situations where discharge is limited only by soil hydraulic conductivity,
q = qlim.
Estimating steady-state discharge from transpiration measurements Where vegetation is extracting water from a narrow zone in a soil profile
above a water table, this zone of water uptake could be considered a 'plane of evaporation' for water analogous to the surface of a bare soil (Gardner, 1958; Thorburn et al., 1992). Under these conditions, Eq. (5) would describe the movement of water to the water extraction zone, with z being replaced by z,, the depth of the water table below the extraction zone. Under steady-state conditions, where transpiration is not limited by evaporative demand, the groundwater component of the transpiration flux from the vegetation will equal the flux of water from the water table, qlim.
Application of this approach for estimating qlim at vegetated sites requires that transpiration rates be measured, the zone of water extraction within the soil profile be defined and that this zone be narrow (to approximate a plane), and soil water contents be in steady state.
Field studies
Soil sampling Sampling of the unsaturated zone was carried out in 80 holes at nine
locations in the general vicinity of Monoman Island (Fig. 1), at a number of times during the period January 1990-February 1991. Data from sites where black box (E. largiflorens) is the dominant tree-form vegetation (Sites BD, BU and BT) are presented. At each site, sampling was carried out within 50 m × 50 m plots to the depth of the water table (which was usually 2-4 m below the soil surface). Up to four holes were drilled within each plot at a given sampling time. Sampling was generally on depth intervals of 0.1 m (from
I.D. Jolly et al. / Journal of Hydrology 150 (1993) 589-614 597
0 to I m), 0.2 m (from 1 to 2 m) and 0.5 m (greater than 2 m), and was carried out using hand augers. All samples were stored in sealed glass jars before determination of gravimetric water content (by oven drying for 24h at 105°C) and chloride concentration (by colorimetry; Taras et al., 1975). The matric suction of all samples from at least one hole in each plot at each sampling time was determined with the filter paper technique (Greacen et al., 1989). Particle size distribution (Lewis, 1983) and deuterium concentra- tion (Revesz and Woods, 1990) were determined on samples from selected holes. To provide additional information on the deuterium profiles at one of the sites (BD), data from a hole drilled in March 1992 by Eldridge et al. (1993) are also presented.
Transpiration and water extraction Transpiration rates were measured at three of the sites where black box is
the dominant vegetation (BT, BH and BM; Fig. 1). Transpiration rates were measured using the heat pulse method over a 2 week period in March (autumn) 1992, within a more extensive study described by Thorburn et al. (1993a). The zone in the soil profile from which water was extracted was determined by comparison of stable isotopes in soil and tree water samples (as described by Thorburn et al. (1993a)). Soil profiles were sampled in late February 1992, and tree twigs were sampled five times from mid-February to early April. Water was extracted from soil and tree-twig samples, and the concentration of the stable isotopes deuterium and oxygen-18 was deter- mined (Thorburn et al., 1993b). Matric suction measurements (described above) were also used to indicate the zone of water extraction. This zone was indicated by sharp decreases in matric suction with increasing depth, as described in the Results section below.
Results
Chloride and matric suction profiles
A limited number of profiles are shown, to illustrate the trends which were evident. The complete dataset has been given by McEwan et al. (1991). It should be noted, however, that the site names differ from those of McEwan et al. (1991) - - Sites BD, BU and BT, respectively, are identical to Sites Black Box 1, Black Box 2 and Black Box 3 of McEwan et al. (1991).
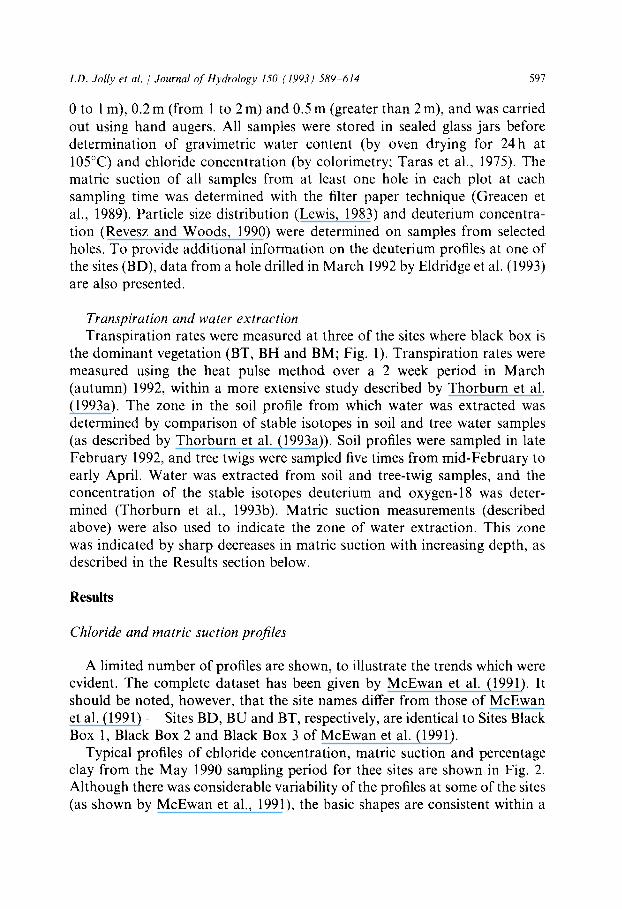
Typical profiles of chloride concentration, matric suction and percentage clay from the May 1990 sampling period for thee sites are shown in Fig. 2. Although there was considerable variability of the profiles at some of the sites (as shown by McEwan et al., 1991), the basic shapes are consistent within a
o~
SIT
E
BD
- H
OL
E
CH
O4
0
SIT
E
BU
- H
OL
E
CH
O4
1
SIT
E
BT
- H
OL
E
CH
03
2
2 "1
- I-
t~
LU
E
3
MA
TRIC
SU
CTI
ON
(lo
g kP
a)
1 2
3 4
I I
I I
i.. =-
i F
,V
10
20
30
40
(Tho
usan
ds)
CH
LOR
IDE
(ra
g/L)
% C
LAY
5 0
25
50
75 1
00
I I
I
)
50
MA
TRIC
SU
CTI
ON
(lo
g kP
a)
0 1
2 3
4
i i
I I
i .B
-o
4 g
l-
• .
.-
l'|
I i
1 ! i
! I t
: ,
i i
-" ~
~7
, ,
, ,
10
20
30
40
(Tho
usan
ds)
CH
LOR
IDE
(m
g/L)
% C
LAY
50
25
50
7
51
00
50
MA
TRIC
SU
CTI
ON
0og
kP
a)
% C
LAY
0 1
2 3
4 5
25
50
75 1
00
ol "
4 ~
!
0 10
20
30
40
50
"-~
(Tho
usan
ds)
~
CH
LOR
IDE
(ra
g/L)
~c
I
Fig.
2. C
hlor
ide
conc
entr
atio
n (s
olid
lin
e),
mat
ric
suct
ion
(dot
ted
line
) an
d pe
rcen
tage
cla
y pr
ofil
es f
or h
oles
dri
lled
in
thre
e o
f th
e bl
ack
box
plot
s in
May
199
0.
.~
I.D. Jolly et al. / Journal of Hydrology 150 (1993) 589 614 599
given site. These data illustrate the salt accumulation that has occurred in the soils at these sites. Moreover, they show clearly the relationship between the degree of salt accumulation and the health of the black box vegetation. Eldridge et al. (1993) classified the health of the black box at each of the study sites, on a scale of 4 (dead) to 20 (healthy). The health indices deter- mined in March 1992 for Sites BD, BU and BT were 4, 10 and 13, respectively.
The sites can be distinguished by soil texture, water table depth and ground- water salinity. The soil profiles generally consist of a sandy clay (Coonam- bidgal Clay) up to 2 m thick overlying a clayey sand (Monoman Sand). Site BU differs slightly in that the sandy clay layer exists throughout the entire depth of the unsaturated zone. Also, the top 1.5 m at Site BD has a clay loam texture (10-25% clay). Groundwater depth is similar at all three sites (3.75 4.0 m), with any differences likely to be the result of variations in topography. The salinity of the groundwater at Sites BD and BU is similar (approximately 20000mg1-1 chloride), and much greater than at Site BT (approximately 3500mgl 1 chloride).
The differences in groundwater salinity and water table depth between sites are reflected in the shapes of the chloride concentration and matric suction profiles. At Site BD (Fig. 2) there is a large accumulation of salt and the chloride concentration decreases approximately exponentially with depth (except in the top 0.5 m, where the concentrations are low). Matric suctions were low (less than 1000 kPa) throughout the profile, except in the top 0.5 m, where they were high owing to evaporation. The shapes of the chloride and matric suction profiles are consistent with steady-state evaporative discharge (Woods, 1990). This is not surprising, as the trees are dead, there is little or no vegetative ground cover, and the site has probably been flooded only once (in 1956) since regulation of the River Murray commenced.
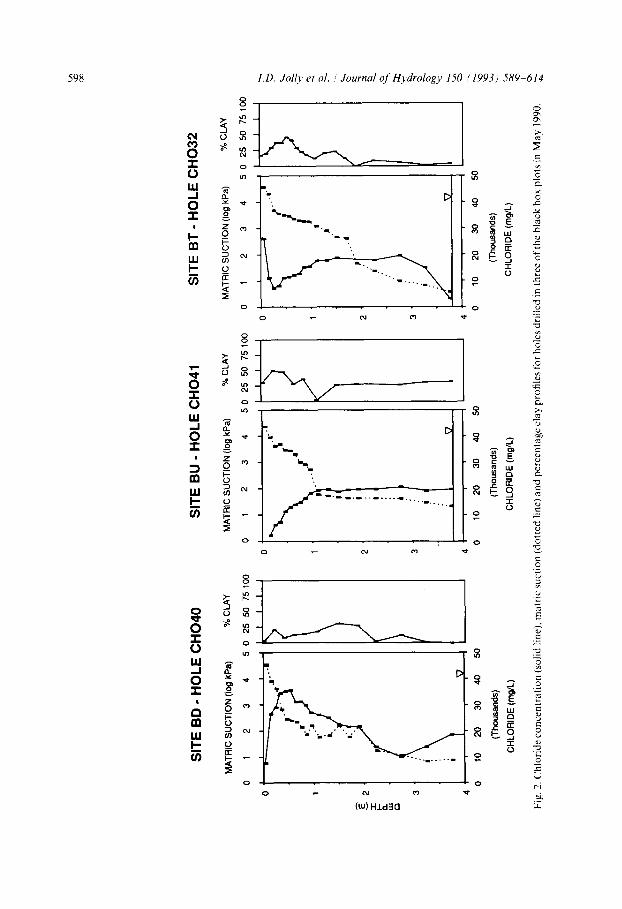
At both Sites BU and BT (Fig. 2), chloride concentrations were low in the top 1 m of the profile, then rose with increasing depth to a plateau value of approximately 20 000 mg1-1. Also, matric suctions were high (more than 1000kPa) in the zone where chloride concentrations were low, and these profile shapes are consistent through time (Fig. 3). The shapes of the chloride and matric suction profiles are consistent with water extraction by trees from areas of the profile with low chloride (also, see the autumn 1992 data of Thorburn et al. (1993a)).
Determination of soil physical parameters
Fig. 4(a) shows a plot ofmatric suction vs. gravimetric water content for all samples on which both of these parameters were measured (from all nine sites). Each sample has been classified by field texture as Coonambidgal
15
.02
.90
- H
OL
E
CH
01
9
08
.05
.90
- H
OL
E
CH
O3
2
27
.08
.90
- H
OL
E
CH
O5
9
1
T
2 W
a
MA
TRIC
SU
CTI
ON
(lo
g kP
a)
0 1
2 3
4 5
l l
I I m°
°|
/' I !
? '
°i
.4
.-
w
MA
TRIC
SU
CTI
ON
(lo
g kP
a)
0 1
2 3
4 5
I I
I I
I
I l |
..l'
V
MA
TRIC
SU
CTI
ON
(lo
g kP
a)
0 1
2 3
4 5
,
0 10
20
30
40
5O
(Tho
usan
ds)
CH
LOR
IDE
(m
g/L)
0 10
20
30
40
50
0
10
20
30
40
50
(Tho
usan
ds)
(Tho
usan
ds)
CH
LOR
IDE
(mg/
L)
CH
LOR
IDE
(mg/
L)
Fig.
3.
Chl
orid
e co
ncen
trat
ion
(sol
id l
ine)
and
mat
ric
suct
ion
(dot
ted
line
) pr
ofil
es f
or h
oles
dri
lled
in
the
[IT
plo
t at
a n
umbe
r of
tim
es t
hrou
ghou
t th
e sa
mpl
ing
peri
od.
t~
i
I.D. Jolly et al. / Journal of Hydrology 150 (1993) 589-614
5
n 1
o v
Z o_ o I-- 0
O3 5
0 - IT I"- < 4
2
0
* l l ~ l ~ _ l ~ • • Coonambidgal Clay
~el~> "I~ll; i ~ - +Transition
~o e oo+ + • ~ I + i ' ~ i o Monoman Sand
o o +++~. - . d U l l i - = i , , I = I = .
Re> .(r ~+ + " i + a,, " ~ • ~ drying curve
O + O + t"
"0" ," , , ,g t % , ' , ~*] ,~ t -~ ÷
(a) I I i I
0 0.1 0.2 0 3 0.4 0.5
\ - -- - Monoman Sand
~t~t X ........ Transition (20% clay)
~ X . . . . . Transition (30% clay)
• ~ ~ ~ Coonambidgal Clay
"-° . ~
(b) I
0 0.1 0.2 0.3 0.4 0.5
GRAVIMETRIC WATER CONTENT (g/g)
601
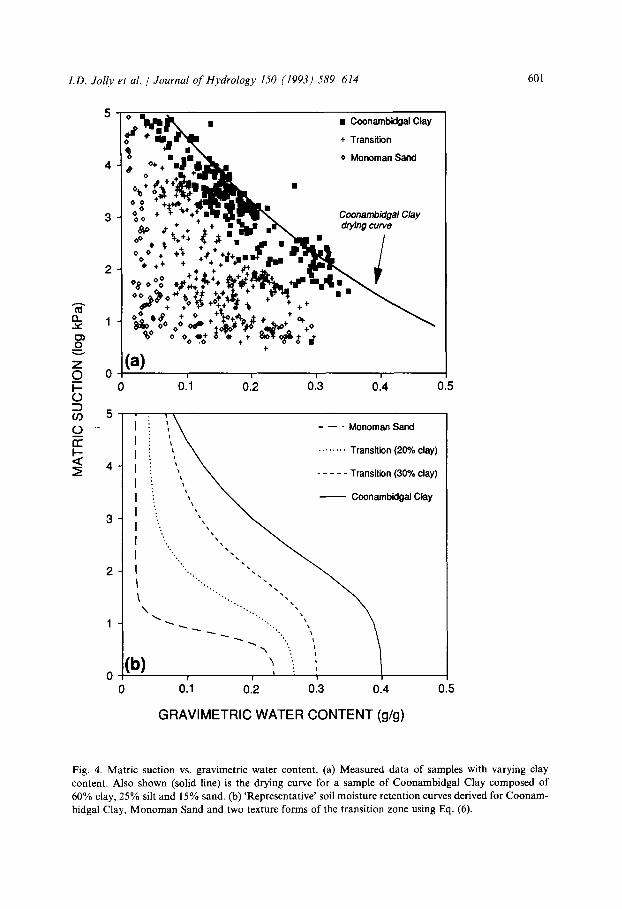
Fig. 4. Matric suction vs. gravimetric water content. (a) Measured data of samples with varying clay content. Also shown (solid line) is the drying curve for a sample of Coonambidgal Clay composed of 60% clay, 25% silt and 15% sand. (b) 'Representative' soil moisture retention curves derived for Coonam- bidgal Clay, Monoman Sand and two texture forms of the transition zone using Eq. (6).
602 I.D. Jolly et al./JournalofHydrology 150 (1993) 589-614
Clay, Monoman Sand or a transition material between the two soils. Clay contents measured on a subset of these data were in good agreement with the field classification. The data in Fig. 4(a) were used to define 'representative' water retention relationships for the Coonambidgal Clay, Monoman Sand and two forms of the transition layer (20 and 30% clay). This approach was taken because the soil profiles were too variable to derive a soil moisture characteristic for every sample. However, the soil moisture characteristic of a sample of the Coonambidgal Clay was determined (A. Holub and G. Gee, personal communication, 1992) and is also shown in Fig. 4(a). Matric suction was measured using a combination of suction (less than 50 kPa) and pressure (more than 50 kPa) plate apparatus. There is good agreement between the measured soil moisture characteristic and that derived from the field data, except at very low suctions (less than 50 kPa).
Soil moisture retention curves (Eq. 6) were fitted through the S(O) data shown in Fig. 4(a) for the Coonambidgal Clay, the Monoman Sand and two texture forms of the transition zone, and are shown in Fig. 4(b). Values of the parameters in Eq. (6) which define these curves are given in Table 1. The corresponding parameter n of Eq. (3) (calculated using Eq. (9)) is also pre- sented in Table 1. As expected, Os increased with increasing clay content, as did 0r (with the exception of 0r for the Coonambidgal Clay, which was fixed at zero to provide an adequate fit to the field data). Conversely, the parameters m, p, ct and n decreased with increasing clay content.
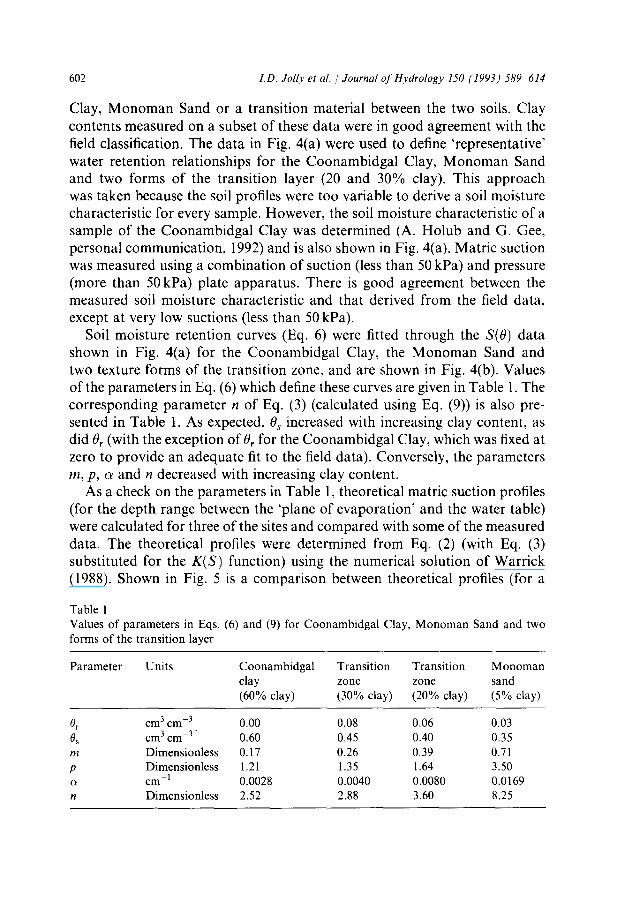
As a check on the parameters in Table 1, theoretical matric suction profiles (for the depth range between the 'plane of evaporation' and the water table) were calculated for three of the sites and compared with some of the measured data. The theoretical profiles were determined from Eq. (2) (with Eq. (3) substituted for the K(S) function) using the numerical solution of Warrick (1988). Shown in Fig. 5 is a comparison between theoretical profiles (for a
Table 1 Values of parameters in Eqs. (6) and (9) for Coonambidgal Clay, Monoman Sand and two forms of the transition layer
Parameter Units Coonambidgal Transition Transition Monoman clay zone zone sand (60% clay) (30% clay) (20% clay) (5% clay)
O r cm 3 cm -3 0.00 0.08 0.06 0.03 0s cm 3 cm -3" 0.60 0.45 0.40 0.35 m Dimensionless 0.17 0.26 0.39 0.71 p Dimensionless 1.21 1.35 1.64 3.50 c~ cm- 1 0.0028 0.0040 0.0080 0.0169 n Dimensionless 2.52 2.88 3.60 8.25
I.D. Jolly et al. / Journal ofHydrology 150 (1993) 589-614 603
0
0.2
0.4
0.6
0.8
1.0
Z=4.0 m / . . ~ / .,'"" j
//..."'/"
~ . . . . . . n=2.10 ~./; ¢" . . . . . . . n=2.88
1 2 3 4
I
ix. w o 00 09 w J z 0 (,9 Z w
0
0
0.2
0.4
0.6
0.8
1.0
(b)
z=3.2 m
/ t "2 .......... ;: . . . . . . . .
///."~,'"
4;/, ./
1' 2 :~
0
0.2
0.4
0.6
0.8
1.0
(c) / ~ S;:::: . . . . . . .
z=1.9 m / j / ~ , , "
/ . : ' / /...'y
, f / i .~.Z,. ~ / I~I /"
MATRIC SUCTION (log kPa)
Fig. 5. Comparison between theoretical and measured matric suction profiles at (a) Site BD in May 1990 (Hole CHO40), (b) Site BU in February 1990 (Hole CHO13) and (c) Site BT in July 1990 (Hole CHO49). (Note that for comparison we have plotted matric suction against dimensionless depth.)
range of values of n) and profiles from the three sampling sites which cover a range of values of z and soil texture. In each case, the comparison between theoretical and field data is reasonable. An exact correspondence between a given field profile and a single theoretical profile is not expected, as (1) soil texture varies down each of the field profiles (e.g. Fig. 2), (2) matric suction measurements made using the filter paper technique can be inaccurate at low suctions (Greacen et al., 1989), and (3) the theory assumes steady-state
604 I.D. Jolly et al. / Journal of Hydrology 150 (1993) 589 614
HOLE CH070 HOLE DB
~" 2
I
D_ w o 8
4
5 -40
t ~
i s
t J
i r
J |
-30 -20 -10 0
DEUTERIUM (per mille)
~" 2
I I - - fl_ uJ o 3
J p- |
ii t | J
i
t
| i i
, l i /
s
1
5 i
10 -40 -30 -20 -10 0 10
DEUTERIUM (per mille)
(a) (b)
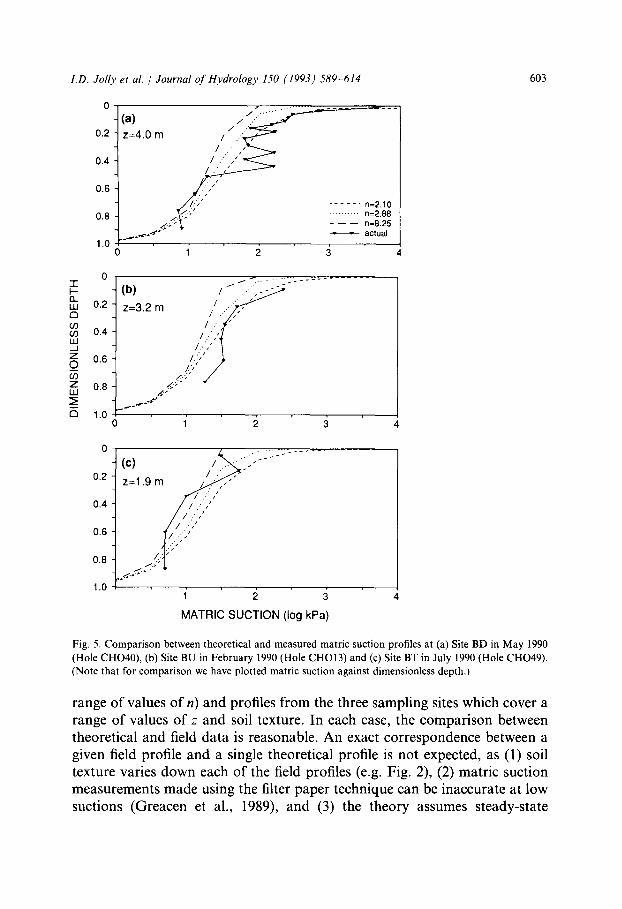
Fig. 6. Deuterium profiles from Site BD in (a) January 1991 (Hole CHO70) and (b) March 1992 (Hole DB).
HOLE CH070 HOLE DB
"r" I - - Q. LU C)
0 0
3
|
4
5 -2 -1
2 v "1" )..- Q. LM o 3
/ / |
5
In [ c - Cr~ [ In [ c - C res l
(a) (b)
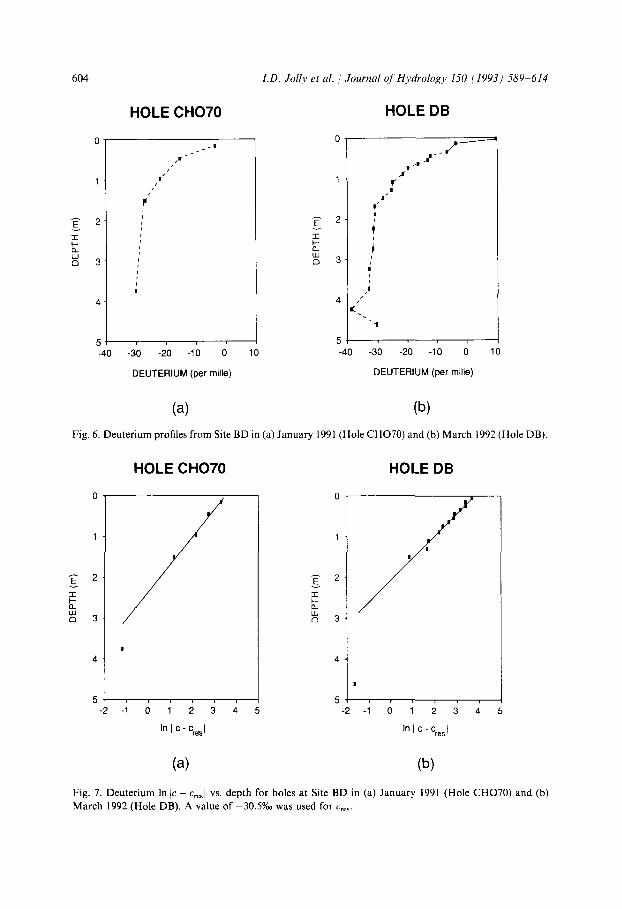
Fig. 7. Deuterium In Ic - Cres[ vs. depth for holes at Site BD in (a) January 1991 (Hole CHO70) and (b) March 1992 (Hole DB). A value of -30.5T~ was used for C~es.
I.D. Jolly et al. / Journal of Hydrology 150 (1993) 589 614 605
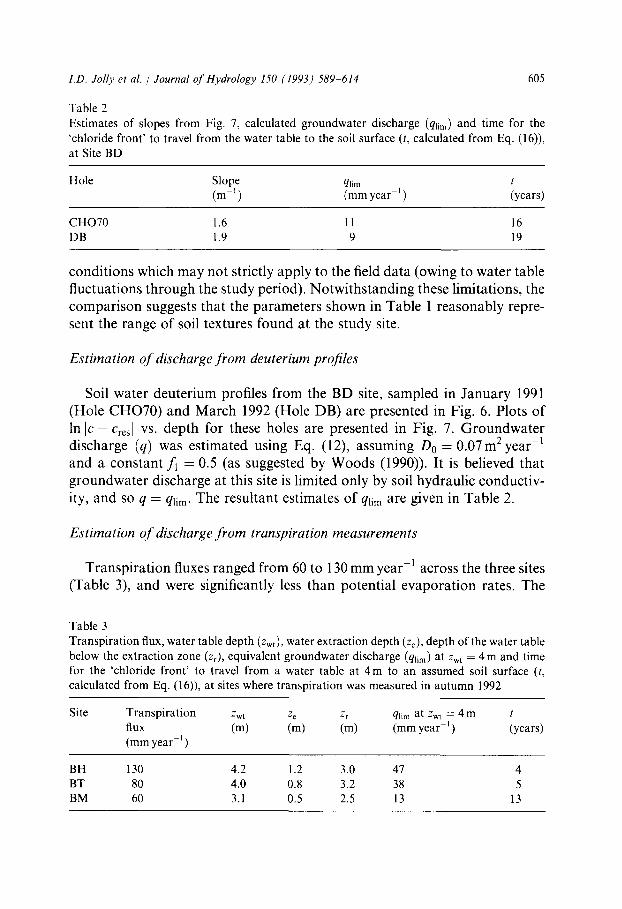
Table 2 Estimates of slopes from Fig. 7, calculated groundwater discharge (qlim) and time for the 'chloride front ' to travel from the water table to the soil surface (t, calculated from Eq. (16)), at Site BD
Hole Slope qlim t (m 1) (mmyear 1) (years)
CHO70 1.6 11 16 DB 1.9 9 19
conditions which may not strictly apply to the field data (owing to water table fluctuations through the study period). Notwithstanding these limitations, the comparison suggests that the parameters shown in Table 1 reasonably repre- sent the range of soil textures found at the study site.
Estimation of discharge from deuterium profiles
Soil water deuterium profiles from the BD site, sampled in January 1991 (Hole CHO70) and March 1992 (Hole DB) are presented in Fig. 6. Plots of In I c - Cres] vs. depth for these holes are presented in Fig. 7. Groundwater discharge (q) was estimated using Eq. (12), assuming D O = 0.07m2year t and a constant fl = 0.5 (as suggested by Woods (1990)). It is believed that groundwater discharge at this site is limited only by soil hydraulic conductiv- ity, and so q = qlim. The resultant estimates of qlim are given in Table 2.
Estimation of discharge from transpiration measurements
Transpiration fluxes ranged from 60 to 130 mm year- 1 across the three sites (Table 3), and were significantly less than potential evaporation rates. The
Table 3 Transpirat ion flux, water table depth (Zwt), water extraction depth (Ze), depth of the water table below the extraction zone (Zr), equivalent groundwater discharge (qlim) at Zwt = 4 m and time for the 'chloride front ' to travel from a water table at 4 m to an assumed soil surface (t, calculated from Eq. (16)), at sites where transpiration was measured in autumn 1992
Site Transpirat ion Zwt z e z r qlim at Zwt = 4 m t flux (m) (m) (m) (mm year 1) (years) (mm year -1)
BH 130 4.2 1.2 3.0 47 4 BT 80 4.0 0.8 3.2 38 5 BM 60 3.1 0.5 2.5 13 13
606 I.D. Jolly et al. / Journal of Hydrology 150 (1993) 589 614
stable isotope concentrations of the twig waters varied little across the five sampling times. Variations in deuterium were + 1%o and +0.5%0 for oxygen- 18. These results indicate that the isotopic composition of the water taken up by the trees was constant (compared with analytical errors) over the 2 month study period. When compared with the soil deuterium and oxygen-18 con- centrations, the stable isotope results indicated that water was being extracted in a narrow region around the depths (Ze) shown in Table 3. These depths also corresponded to sharp decreases in matric suction in the soil profiles ('drying fronts'), as would be produced by water uptake over a narrow depth range. The isotope and suction results are consistent with a 'plane of evaporation' in the soil profile that did not change depth significantly with time.
It was likely that capillary rise from the groundwater was the only source of water being used by the trees. Significant depletion of soil water through the profile would have produced variations in isotopic concentrations in the twig waters through time, and this was not observed. Thus the transpiration rates can be considered groundwater discharge fluxes (qr) from the depths z r. These rates are sufficiently high to result in measurable salt accumulations in the soil profile. To check the discharge fluxes, the increase in mass of chloride in the profile at site BH (which had the highest transpiration rates) was determined over the 6 months preceding the transpiration measurements (data not shown). When related to the groundwater chloride concentrations, the increases in soil chloride mass gave similar discharge rates to the transpiration measurements.
As water extraction can be represented by a 'plane of evaporation' at a fixed depth in the soil (i.e. soil water contents were in steady state), the supply of water to the plane should be described by Eq. (5). To compare the transpiration- derived discharge fluxes with those from the deuterium profiles at Site BD, the transpiration fluxes (qr) were re-expressed as those from a water table depth of 4 m (z0). This was achieved by taking expressions of Eq. (5) for depths z0 and Zr
n -n (groundwater discharge at and rearranging them to determine q0 = qrZrZo depth z0). Taking n = 3.6, the resultant values of q0 (expressed as qlim ; Table 3) are greater than those measured at Site BD. It should be noted, however, that the discharge fluxes determined from the transpiration measurements are likely to be upper estimates. Any errors in the assumptions made regarding the analy- sis (e.g. that soil water contents were not in steady state) would result in the transpiration rates being higher than the actual groundwater discharge fluxes.
Discussion
Soil salinity problems occur when upward groundwater fluxes (discharge), which carry salts up into the surface soils, predominate over downward fluxes
I.D. Jolly et al. / Journal of Hydrology 150 (1993) 589 614 607
(recharge) of relatively low-salinity water. In arid and semi-arid environments, recharge events occur intermittently (Gee and Hillel, 1988), as a result of extreme rainfall or flooding events. Groundwater discharge rates are related directly to the soil texture and the depth of the water table (as summarised by Thorburn et al. (1992)). At our study site, regulation of the River Murray by weirs (such as Lock 6) and major storages has reduced the frequency of flooding (by a factor of about three; Ohlmeyer, 1991) and caused water tables beneath the adjacent floodplain to rise (in many cases, the water table now resides within the Coonambidgal Clay). It is reasonable to presume that these factors have reduced recharge from floods and increased groundwater dis- charge through the soils.
With respect to salinisation of the floodplain and its effect of the health of riparian vegetation and salinity of the River Murray, there are two important questions which need to be addressed. First, are the flood events which provide leaching of the unsaturated zone still frequent enough to predomi- nate over the increased upward transport of salt owing to the higher water tables, or has salt been accumulating in the unsaturated zone? Before river regulation it is probable that there was a net recharge regime in the floodplain (i.e. no long-term salt accumulation), as seen by the general freshening of the upper part of the Monoman Sands aquifer (Jolly et al., 1993). Second, how can floodplain salinisation be managed? Possible management approaches include: (1) increasing the frequency of flooding to promote increased leach- ing of the stored salt; (2) lowering the water table to reduce groundwater discharge rates; (3) a combination of (1) and (2). There is some scope for increasing the frequency of flooding, although this is limited by possible damage it would cause to domestic and agricultural infrastructure. Therefore schemes to reduce water table levels are of interest. It is improbable that modifying existing river regulation will be sufficient to lower the water table substantially, and so artificial approaches such as groundwater pumping must be considered. Whichever method is used, knowledge of the depth to which the water table must be lowered to reduce groundwater discharge to an acceptable level is critical to its success. Moreover, any amelioration scheme must also be considered in relation to impacts it may have on the problem of increasing river salinity. Ideally, approaches which address both of these important issues are desirable (Murray-Darling Basin Commission, 1992).
Time for salt accumulation
First, the question of increased groundwater discharge and the movement of salt into the unsaturated zone owing to the rise in water table after river
608 I.D. Jolly et al. /' Journal of Hydrology 150 (1993) 589 614
regulation is considered. Let us suppose that the soil is dry to the depth of the 'chloride front', the depth at which the chloride concentration reaches a plateau value at the base of the root zone (e.g. Fig. 3). Assuming that this depth (Zcf) represents the 'plane of evaporation' , Eq. (5) can be rewritten a s
ql im = / l ( 2 w t - - Zcf) - n ( 1 3 )
where Zwt is the water table depth. Now, the rate of change in the volume of water in the zone between the water table and 'chloride front' owing to groundwater discharge is given by
- - 0 d z c f (14) q = dt
where 0 is the water content between the water table and the 'chloride front', and is assumed to be constant. By equating Eqs. (13) and (14) and integrating, the time required for the 'chloride front ' to reach the ground surface (t) is given by
ozn+ t 1 0 ( Z w t _ 2cf)O ,n + 1 t - (15)
A(n + 1) A(n + 1)
0 where Zcf is the initial depth of the 'chloride front'. If the rate of soil-limited discharge from a specified depth (i.e. qlim = qo at z = Zo) is known, then A = qoz~.
To apply this analysis to the sites where qlim is known, a number of cases are 0 is close to the water table, in considered. In the first, it is assumed that Zcf
which case the second term of Eq. (15) is approximately zero. Furthermore, if z 0 = Zwt, then Eq. (15) can be reduced to the following approximate form;
Ozo t ~ (16)
qo(n + 1)
Values of q0 range from 9 to 4 7 m m y e a r -I at z 0 = 4 m (Tables 2 and 3). Taking 0 = 0.2 and n = 3.6, the time taken for the 'chloride front' to reach the soil surface is 19 years and 4 years, respectively. However, the assumption
,,0 0 that -cf "-~ Zwt may not be valid for all of the sites. If it is assumed that zcf is located halfway between the soil surface and the water table, the time taken for the 'chloride front' to reach the soil surface is 96% of that in the first case.
0 If similar calculations are carried out assuming Zcf is a quarter and, at the extreme, a tenth of the water table depth, the time taken for the 'chloride front' to reach the soil surface is 73% and 38%, respectively, of that if Zcf° ~ Zwt. From these calculations, it is concluded that the time-scale for the
I.D. Jolly et al. / Journal of Hydrology 150 (1993) 589-614 609
movement of the 'chloride front' is short (less than 20 years) and that the 'chloride front' initially moves quickly but slows as it nears the soil surface.
The relationship between the above estimates of t and the leaching of salt as a result of flooding is now considered. Site BD is located on one of the higher landform units of the floodplain. Jolly et al. (1992) estimated that this site has been flooded only once (in 1956) since regulation of the River Murray com- menced. Assuming that all of the salt was leached from the profile at the time
0 in 1956), it can be seen that there has been adequate time for the (i.e. z~f = Zwt 'chloride front' to reach the surface (17 years). Moreover, enough time has elapsed to account for the chloride storage at concentrations above that of the groundwater (i.e. 0 -2m ; Fig. 2) which has accumulated since the chloride front reached the surface (this would take approximately 20 years to accumu- late at qlim ----- 10mmyear 1).
For the vegetated sites (Sites BH, BT and BM), as the 'chloride front' moves upwards, salts in the soil solution will be concentrated by transpira- tion (forming a 'salt bulge' in the profile). This process (which has not been considered in this paper) will slow the rise of the 'chloride front' by a factor of two to three. Thus, the times for the chloride front to reach the soil surface, assuming bare surface conditions (4-13 years; Table 3), imply that the salt front will reach the soil surface in 8-26 years under the forest. For the flood recurrence interval at these sites (about 10 years; Thorburn et al., 1993a) it is unlikely that soil salinity levels will become high enough to cause severe tree dieback.
A complicating factor not discussed above is the effect of fluctuating groundwater levels caused by varying stream levels. For the situation in which groundwater is too saline to be transpired (i.e. no 'salt bulge' exists), rises and falls in groundwater level will have a similar effect to that of the 'chloride front' moving upwards (assuming that the rising groundwater dis- places soil water). At sites where the soil water is more saline than the ground- water owing to evapotranspiration of groundwater, the 'salt bulge' will be leached to the same concentration as the groundwater as the water table returns to its normal level. As discussed above, the 'chloride front' initially rises quickly and so the initial position of the 'chloride front' does not seri- ously affect the time for salinisation unless it starts close to the soil surface. Water table fluctuations are analogous to changing the initial position of the ~chloride front', and will therefore not have a significant effect on the time for salinisation unless the water table comes close to the soil surface. At the sites studied, groundwater levels do not rise close to the surface during floods (either because of the confining nature of the Coonambidgal Clay, or because of the height of the site relative to the maximum stream level; Jolly et al.,
610 LD, Jolly et al. / Journal of Hydrology 150 {1993) 589 614
1993), so it is concluded that fluctuating groundwater levels do not unduly affect the estimates of the time for salinisation.
Relationship between f lood frequency and water table depth
It seems probable that, for a given site, a critical depth exists at which salt accumulation by groundwater discharge is balanced (over the long term) by the leaching of salt by floods. Using the work described above, it is possible to examine how the critical depth for each of the soils described in Table 1 has been modified by river regulation.
From Eq. (3), saturated hydraulic conductivity (Ks) = a/b, so from Eq. (5) it can be seen that qlim o( Ks z-n. Intuitively, it is expected that the degree of leaching is proportional to the flooding frequency and duration of inundation (W), and the saturated hydraulic conductivity of the soil profile, Ks; i.e. leaching o( Ks W. It can therefore be seen that z cx W -I/n, and so any reduc- tion in the flooding frequency will need to be compensated by an increase in the critical depth to prevent salt accumulation. As the flood frequency has been reduced by a factor of three, it can be seen that, for the four soil types described in Table 1 (n = 2.52, 2.88, 3.60, 8.25), the present depth between the water table and the 'plane of evaporation' needs to be increased by 55%, 46%, 36% and 14%, respectively, to reinstate an adequate critical depth to prevent excess salt accumulation.
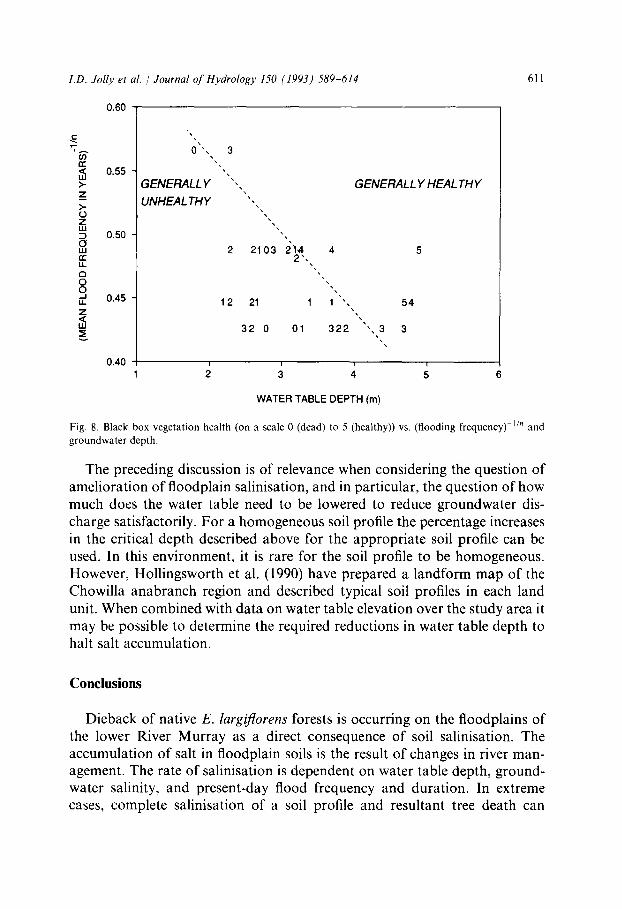
The available data do not allow a strict validation of the relationship z oc W -l/n. However, given that black box health is directly related to salt accumulation, it is possible to check the consistency of this relationship using data presented by Jolly et al. (1992). These workers used data from Hollings- worth et al. (1990) on tree health, water table depth and groundwater salinity at 120 sites on the Chowilla floodplain, combined with flooding maps of the region, to determine possible causes of the dieback of black box forests. Shown in Fig. 8 is black box health (on a scale of 0 (dead) to 5 (healthy)) vs. (flooding frequency) i/n and groundwater depth. It should be noted that only data from black box sites where the groundwater salinity (as electrical conductivity) exceeds 40 mS cm-I are depicted; Jolly et al. (1992) found that sites with groundwater salinities less than this were generally not suffering health decline. In calculating (flooding frequency) 1/n it was assumed that n = 3.0 for all sites. Also, it is not possible to plot Zr, only groundwater depth. The line drawn in Fig. 8 separates, in general, the unhealthy sites (0- 2) from the healthy sites (3-5). Although there are some outliers, it is believed that these data provide some indirect confirmation that salt accumulation (and hence vegetation health) is governed by a 'balance' between flood frequency and groundwater depth.
I.D. Jolly et al. / Journal of Hydrology 150 (1993) 589-614
0.60
611
c "T.~
¢/} nr'
Z >- 0 z LU
0 W r r LL
D 0 0 ._J l.i.
z < w
0.55
0.50
0.45
0.40
0 " , 3
GENERALL Y ",
UNHEAL THY ' , , ,
21 03 21,4 2~.
1 2 21
32 0
4
4•
1 1 ",
01 322
GENERALL Y HEAL THY
54
" , 3 3
i i i i
2 3 4 5 6
WATER TABLE DEPTH (m)
Fig. 8. Black box vegetation health (on a scale 0 (dead) to 5 (healthy)) vs. (flooding frequency) I/. and groundwater depth.
The preceding discussion is of relevance when considering the question of amelioration of floodplain salinisation, and in particular, the question of how much does the water table need to be lowered to reduce groundwater dis- charge satisfactorily. For a homogeneous soil profile the percentage increases in the critical depth described above for the appropriate soil profile can be used. In this environment, it is rare for the soil profile to be homogeneous. However, Hollingsworth et al. (1990) have prepared a landform map of the Chowilla anabranch region and described typical soil profiles in each land unit. When combined with data on water table elevation over the study area it may be possible to determine the required reductions in water table depth to halt salt accumulation.
Conclusions
Dieback of native E. largiflorens forests is occurring on the floodplains of the lower River Murray as a direct consequence of soil salinisation. The accumulation of salt in floodplain soils is the result of changes in river man- agement. The rate of salinisation is dependent on water table depth, ground- water salinity, and present-day flood frequency and duration. In extreme cases, complete salinisation of a soil profile and resultant tree death can
612 I.D. Jolly et al./JournalofHydrology 150 (1993) 589 614
occur in less than 20 years. There is limited scope for increasing the frequency and durat ion of flooding, and so ameliorative approaches should concentrate on lowering water tables. The analyses presented here suggest that 'critical' water table depths (below which groundwater discharge is balanced or exceeded by floodwater recharge) need to be increased by 14-55%, with more clayey soils requiring the greater increases. Failure to address this problem may ultimately result in the decimation of these important riparian forests.
Acknowledgements
The work described herein was supported by Research Grant 88/44 under the Priorities Program of the Australian Water Research Advisory Council (now the Land and Water Resources Research and Development Corporat ion) . P.J.T. acknowledges the support of an Australian Postgraduate Priority Research Award and a Centre for Groundwater Studies Bursary during this work, which was conducted while he was on leave from the Queensland Depar tment of Primary Industries. We would also like to thank Kerryn McEwan and Andrew Holub for field and laboratory assistance.
References
Barnes, C.J. and Allison, G.B., 1988. Tracing of water movement in the unsaturated zone using stable isotopes of hydrogen and oxygen. J. Hydrol., 100: 143-176.
Eldridge, S.R., 1991. The role of salinisation in the dieback of black box (Eucalyptus largi- florens F. Muell.) on the floodplain of the River Murray, South Australia. B.Sc. Thesis, University of Adelaide.
Eldridge, S.R., Thorburn, P.J. McEwan, K.L. and T.J. Hatton, 1993. Health and structure of Eucalyptus communities on Chowilla and Monoman Islands of the River Murray flood- plain, South Australia. CSIRO Division of Water Resources, Div. Rep., Adelaide, S.A., in press.
Gardner, W.R., 1958. Some steady-state solutions of the unsaturated moisture flow equation with application to evaporation from a water table. Soil Sci., 85:228 232.
Gee, G.W. and Hillel, D., 1988. Groundwater recharge in arid regions: review and critique of estimation methods. Hydrol Processes, 2:255 266.
Gill, E.D., 1973a. Geology and geomorphology of the Murray River region between Mildura and Renmark, Australia. Mem. Nat. Mus. Victoria, Melbourne, 34: 1-99.
Gill, E.D., 1973b. Paleopedology o the Murray River between Mildura and Renmark. Mem. Nat. Mus. Victoria, Melbourne, 34:241 253.
Greacen, E.L., Walker, G.R. and Cook, P.G., 1989. Procedure for the filter paper method of measuring soil water suction. CSIRO Division of Soils, Divisional Rep. 108 CSIRO, Adelaide, S.A., 7 pp.
Hollingsworth, I.D., Meissner, A.P. and Davies, G, 1990. A reconnaissance soil survey of the
I.D. Jolly et al. / Journal of Hydrology 150 (1993) 589 614 613
Chowilla Anabranch System of the River Murray in South Australia and New South Wales. South Australian Department of Agriculture Report to the Murray-Darling Basin Com- mission, Canberra, A.C.T.
Jolly, I.D., Walker, G.R., McEwan, K.L., Thorburn, P.J., Hatton, T.J., Bennett, J. and Hacker, J.M., 1991. The role of floodplain vegetation in salt accession to the River Murray in South Australia. Proc. Int. Hydrology and Water Resources Symp., Perth, W.A., 2 4 October 1991. The Institution of Engineers Australia National Conf. Publ. 91/22, Vol. 1, Canberra, A.C.T., pp. 53 59.
Jolly, I.D., Walker, G.R., Thorburn, P.J. and Hollingsworth, I.D., 1992. The cause of black box decline in the Chowilla anabranch region, South Australia and possible ameliorative approaches. In: Catchments of Green. Proc. Nat. Conf. on Vegetation and Water Management, Adelaide, S.A., 23 26 March 1992. Greening Australia, Canberra, pp. 33 41.
Jolly, I.D., Walker, G.R. and Narayan, K.A., 1993. Floodwater recharge processes in the Chowilla anabranch system, South Australia. Aust. J. Soil Res., submitted.
Lewis, D.W., 1983. Practical Sedimentology, Hutchinson Ross, Stroudsburg, PA, pp. 85--106. Margules and Partners, P. and J. Smith and Victorian Department of Conservation, Forests
and Lands, 1990. River Murray riparian vegetation study. Murray -Darling Basin Commis- sion, Canberra, 187 pp.
McEwan, K.L., Holub, A.N., Walker, G.R., Jolly, I.D., Thorburn, P.J. and Kennett-Smith, A.K., 1991. Compilation of soil water and chloride profiles from the Chowilla anabranch region, South Australia. CSI RO Division of Water Resources, Tech. Mem. 91/17, Adelaide, S.A., 60 pp.
Maulem, Y., 1976. A new model for predicting the hydraulic conductivity of unsaturated porous media. Water Resour. Res., 12: 513-522.
Murray- Darling Basin Commission, 1992. Chowilla Resource Management Plan Progress Report. Murray Darling Basin Commission, Canberra.
Murray -Darling Basin Ministerial Council, 1988. Murray Darling Basin Ministerial Council Salinity and Drainage Strategy. Murray Darling Basin Ministerial Council, Canberra.
National Environmental Consultancy (NEC), 1988. Chowilla salinity mitigation scheme draft environmental impact statement. Report prepared by National Environmental Con- sultancy for the Engineering and Water Supply Department of South Australia, Engineering and Water Supply Department, Adelaide, S.A., 166 pp.
Ohlmeyer, R.G., 1991. Investigation of the feasibility of manipulating water levels in the River Murray. South Australian Engineering and Water Supply Department, Library Ref. 91/11, Engineering and Water Supply Department, Adelaide, S.A., 47 pp.
O'Malley, C., 1990. Floodplain vegetation. In: C. O'Mally and F. Sheldon (Editors), Chowilla Floodplain Biological Study. Nature Conservation Society of South Australia, Adelaide, S.A., 224 pp.
Peck, A.J., 1978. Note on the role of a shallow aquifer in dryland salinity. Aust. J. Soil Res., 16: 237 240.
Revesz, K. and Woods, P,H., 1990. A method to extract soil water for stable isotope analysis. J. Hydrol., 115:397 406.
Rodgers, P.A., 1978. Chowilla. South Australian Department of Mines and Energy, Geological Survey, 1:250 000 Geological Series Explanatory Notes, Sheet S1/54-6.
Talsma, T., 1963. The control of saline groundwater. Meded. Landbouwhogesch. Wageningen, 63(10): 1 68.
Taras, M.J., Geenberg. A.E., Hoak, R.D. and Rand, M.C. (Editors), 1975. Standard Methods
614 l.D. Jollyet al. /JournalofHydrology 150 (1993) 589-614
for the Examination of Water and Wastewater, 14th edn. American Public Health Associa- tion, pp. 613 614.
Thorburn, P.J., Walker, G.R. and Woods, P.H., 1992. Comparison of diffuse discharge from shallow water tables in soils and salt flats. J. Hydrol., 136:253 274.
Thorburn, P.J., Hatton, T.J. and Walker, G.R., 1993a. Combining measurements of transpira- tion and stable isotopes of water to determine groundwater discharge from forests. J. Hydrol., 150:563 587.
Thorburn, P.J., Walker, G.R. and Brunel, J.P., 1993b. Extraction of water from Eucalyptus trees for analysis of deuterium and oxygen-18: laboratory and field techniques. Plant Cell Environ., 16: 269-277.
Van Genuchten, M.T., 1980. A closed-form equation for predicting the hydraulic conductivity of unsaturated soils. Soil Sci. Soc. Am. J., 44:892 898.
Warrick, A.W., 1988. Additional solutions for steady-state evaporation from a shallow water table. Soil Sci. 146:63 66.
Waterhouse, J., 1989. The Hydrogeology of the Chowilla Floodplain - - Status Report. Report to the Murray-Darl ing Basin Commission, Canberra, A.C.T.
Woods, P.H., 1990. Evaporative discharge of groundwater from the margin of the Great Artesian Basin near Lake Eyre, South Australia. PhD. Thesis, Flinders University of South Australia, Adelaide, S.A., 368 pp.
Related Documents


