Saliency-based color accessibility
Jul 28, 2015
Welcome message from author
This document is posted to help you gain knowledge. Please leave a comment to let me know what you think about it! Share it to your friends and learn new things together.
Transcript
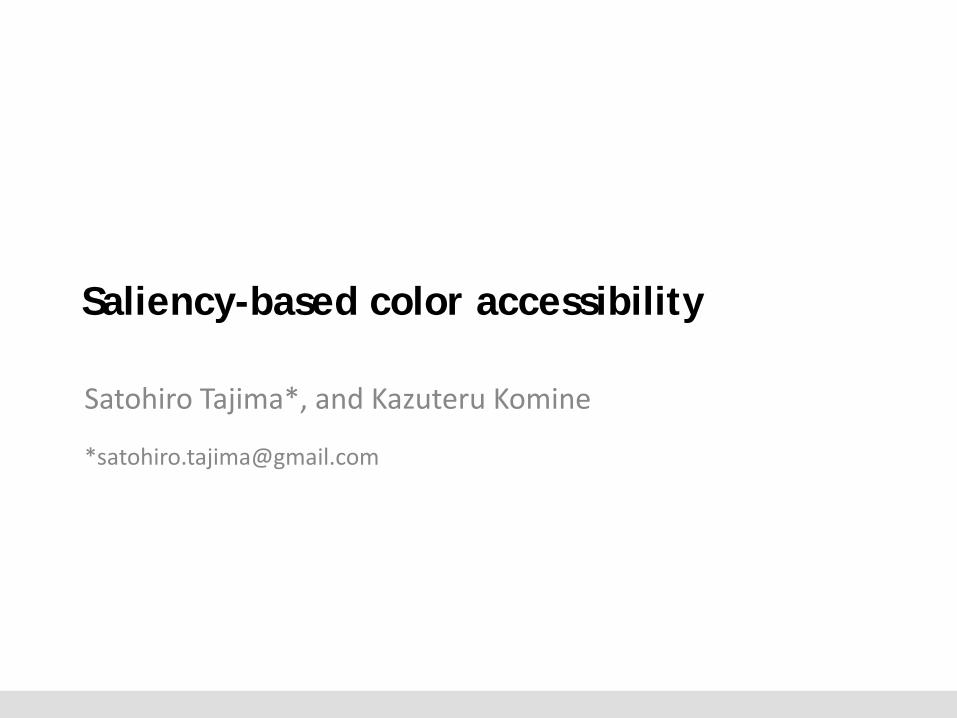
1-1.3% 0.02% 1.3% 0.02%
1-1.2% 0.01% 5.0% 0.35%
0.001% 0.03% 0.01% 0.01%
Divergence of color perception
Protanope ∙ ● ●
Deuteranope ● ∙ ●
Tritanope ● ● ∙
L M S
Male Female Male Female
Dichromacy Anomaloustrichromacy
Color deficiency ~280 million (8% of male)
Common ● ● ●
Saliency-based color accessibility
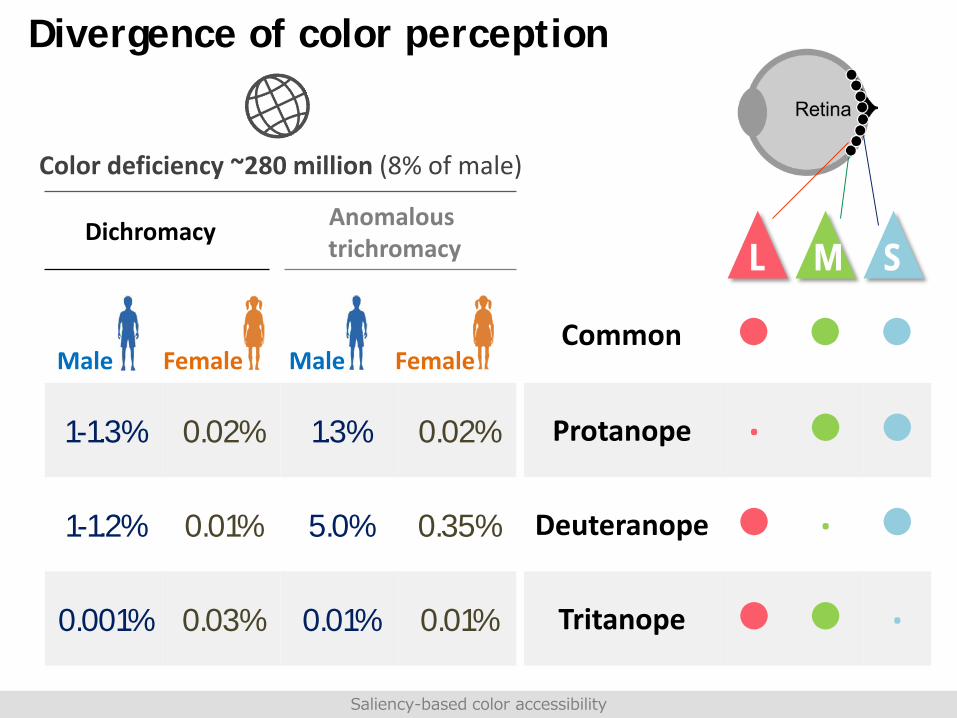
What you see ≠ What another one sees.Original image
Deuteranopia (simulation)
Saliency-based color accessibility
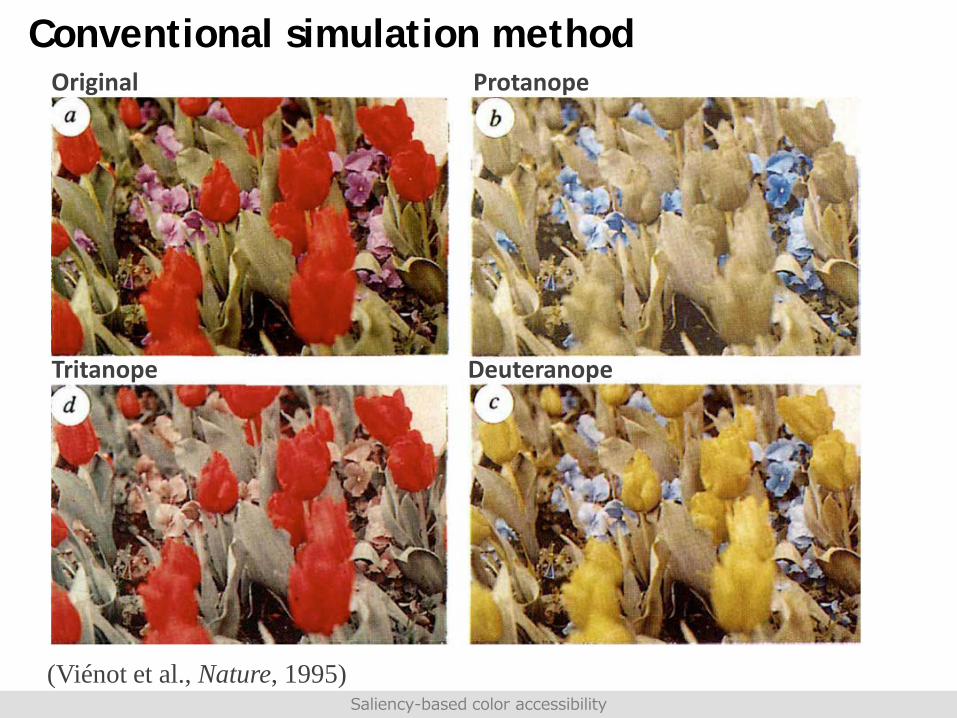
Conventional simulation methodOriginal Protanope
Tritanope Deuteranope
(Viénot et al., Nature, 1995)Saliency-based color accessibility
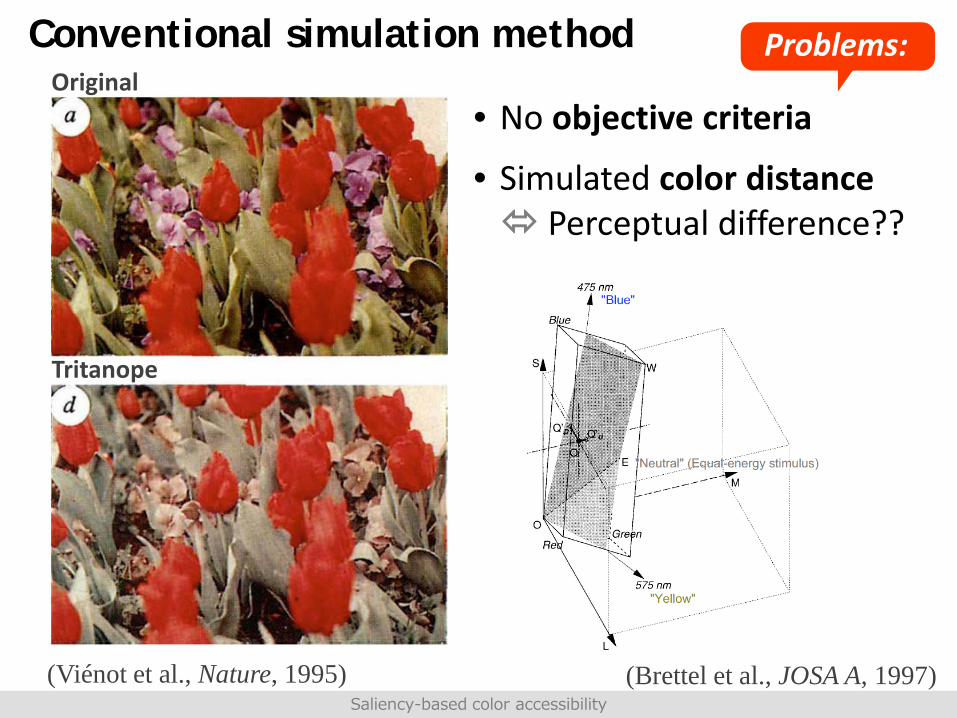
Conventional simulation method
• No objective criteria
• Simulated color distance Perceptual difference??
(Brettel et al., JOSA A, 1997)
Problems:Original
Tritanope
(Viénot et al., Nature, 1995)Saliency-based color accessibility
“Saliency-based accessibility”
• Objective criteria
• Information theoretic distanceWe propose:
Saliency-based color accessibility
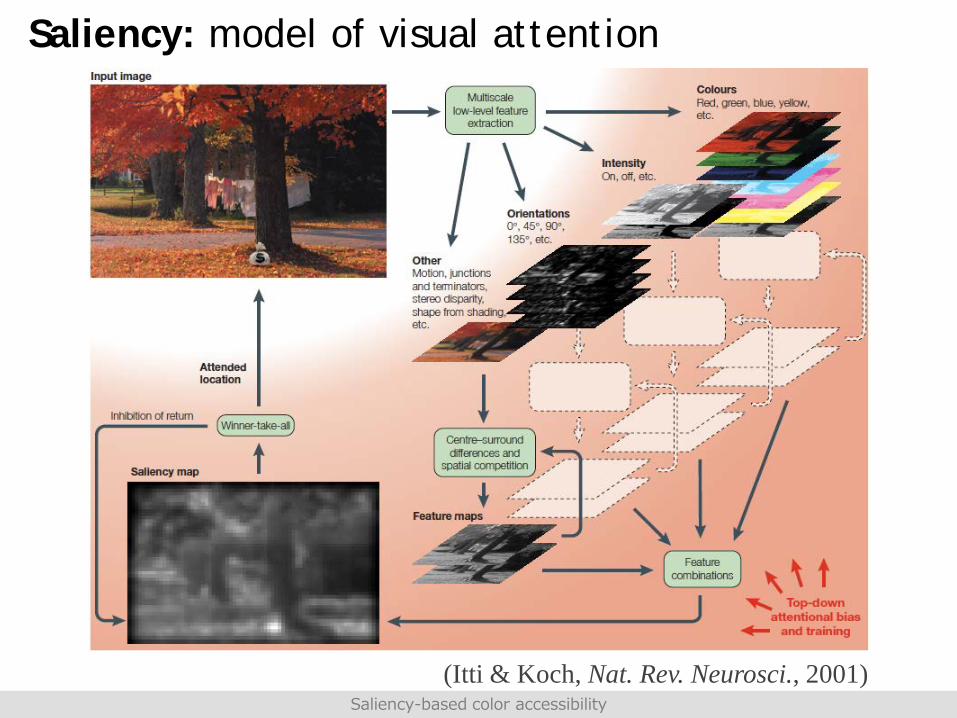
Saliency: model of visual attention
(Itti & Koch, Nat. Rev. Neurosci., 2001)Saliency-based color accessibility
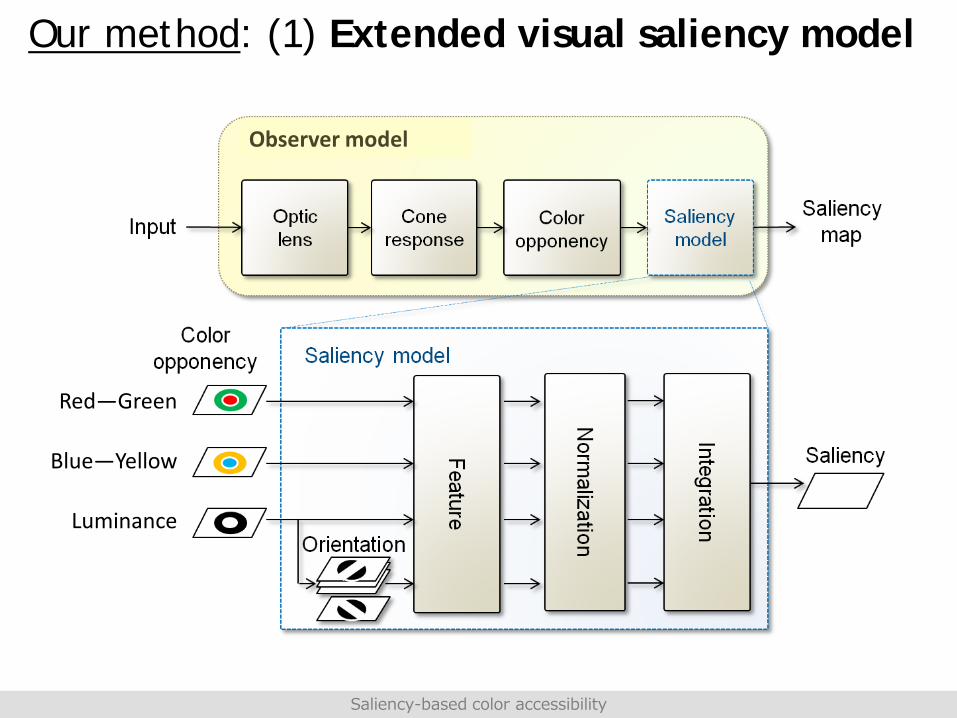
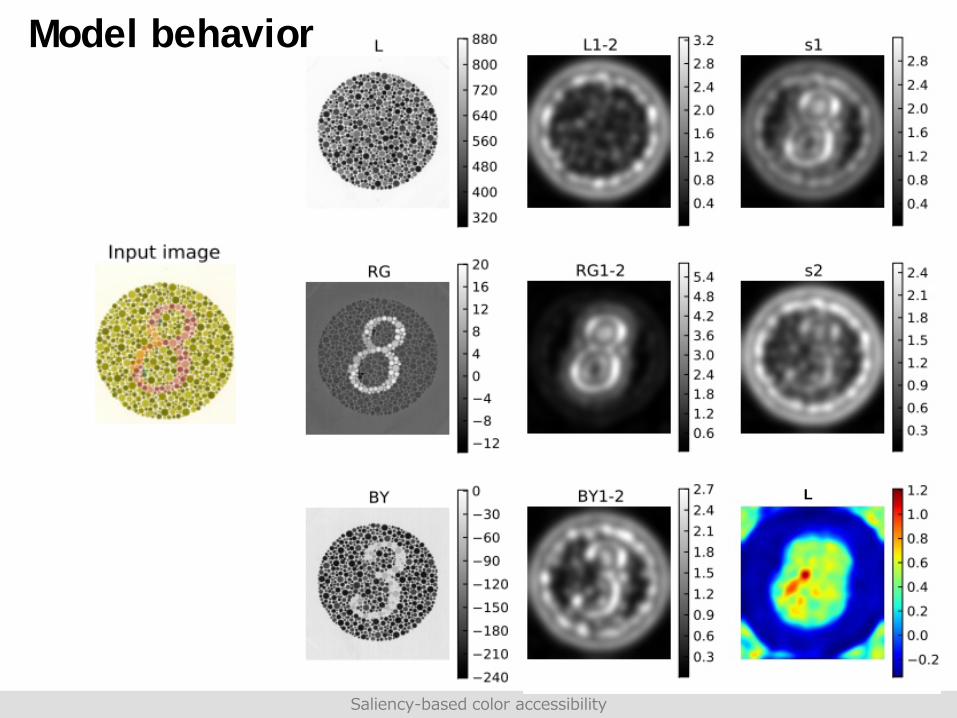
Our method: (1) Extended visual saliency model
Observer model
Red—Green
Blue—Yellow
Luminance
Saliency-based color accessibility
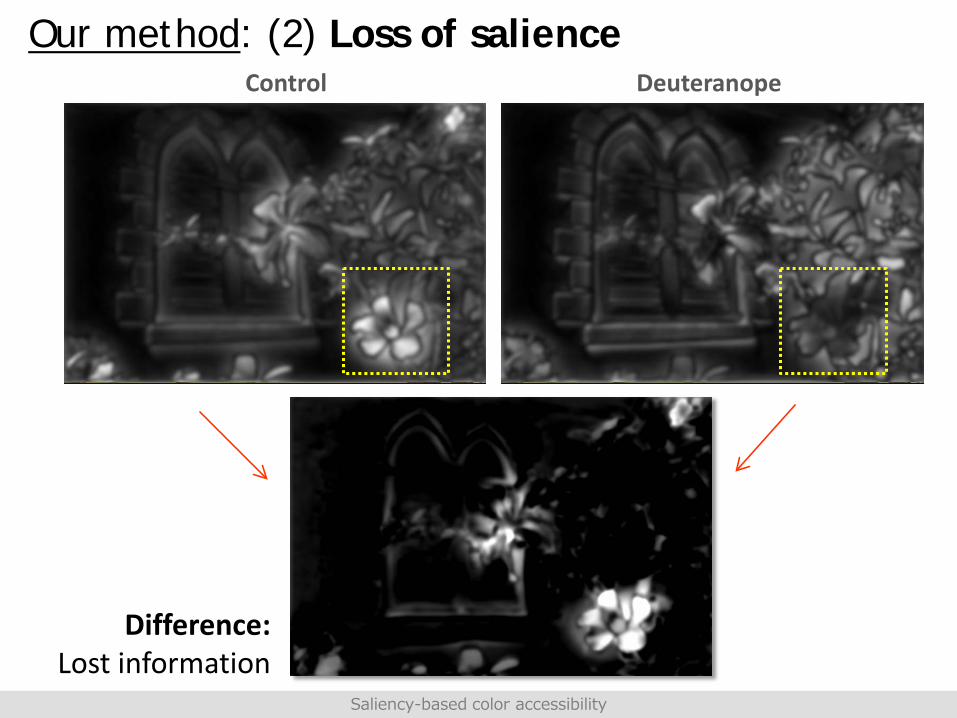
Our method: (2) Loss of salienceDeuteranopeControl
Difference:Lost information
Saliency-based color accessibility
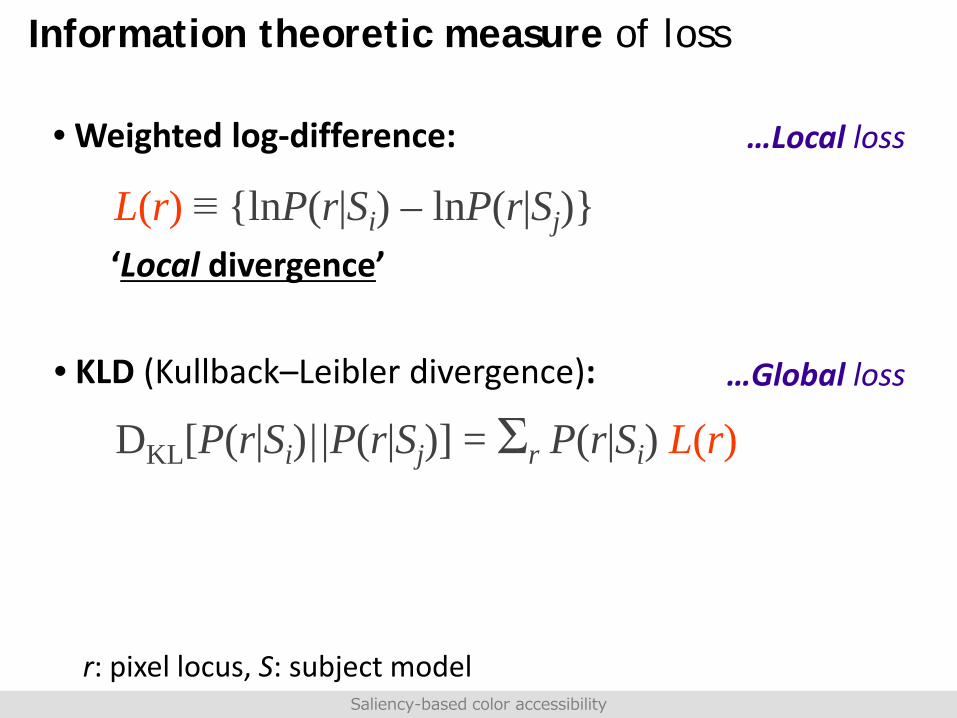
Information theoretic measure of loss
L(r) ≡ {lnP(r|Si) – lnP(r|Sj)}
• Weighted log-difference:
DKL[P(r|Si)||P(r|Sj)] = Σr P(r|Si) L(r)• KLD (Kullback–Leibler divergence):
‘Local divergence’
…Global loss
…Local loss
r: pixel locus, S: subject modelSaliency-based color accessibility
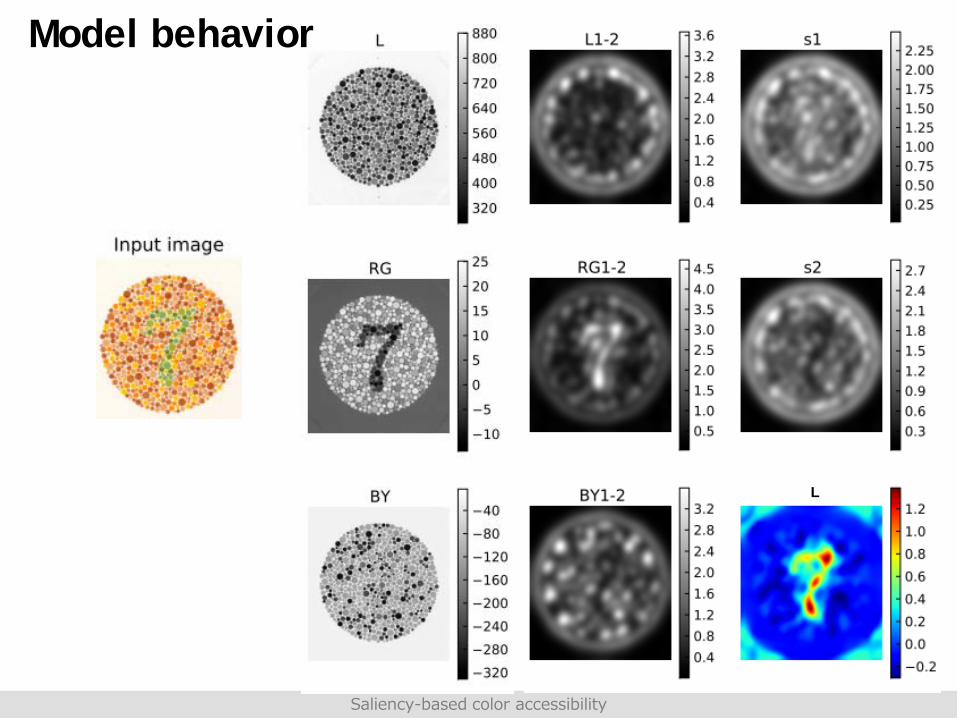
L
Model behavior
Saliency-based color accessibility
L
Model behavior
Saliency-based color accessibility
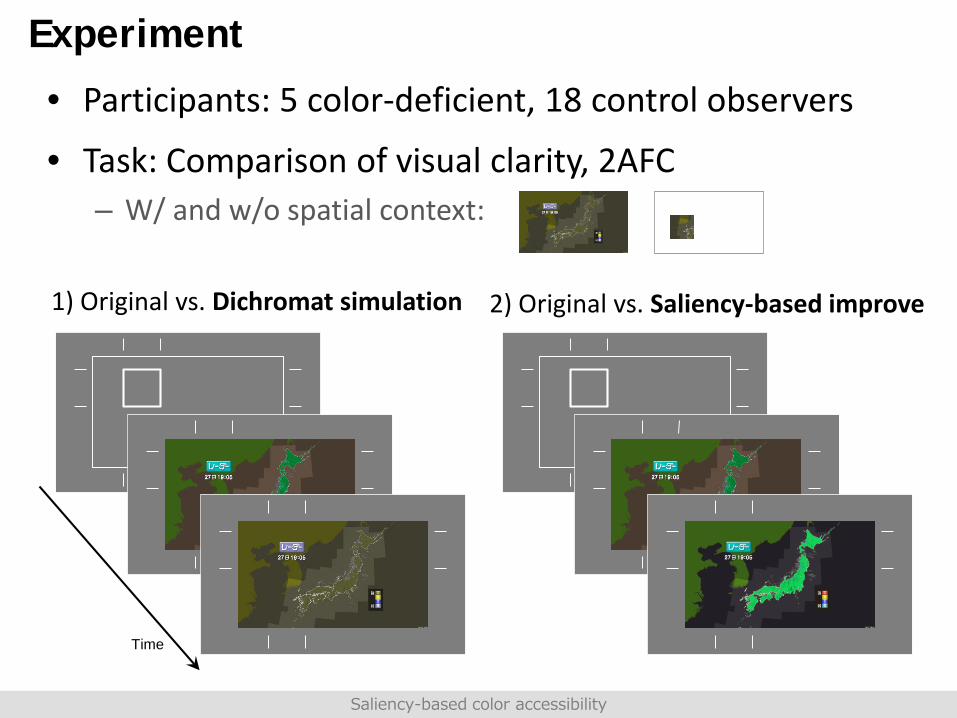
Experiment
1) Original vs. Dichromat simulation 2) Original vs. Saliency-based improve
• Participants: 5 color-deficient, 18 control observers
• Task: Comparison of visual clarity, 2AFC– W/ and w/o spatial context:
Time
Saliency-based color accessibility
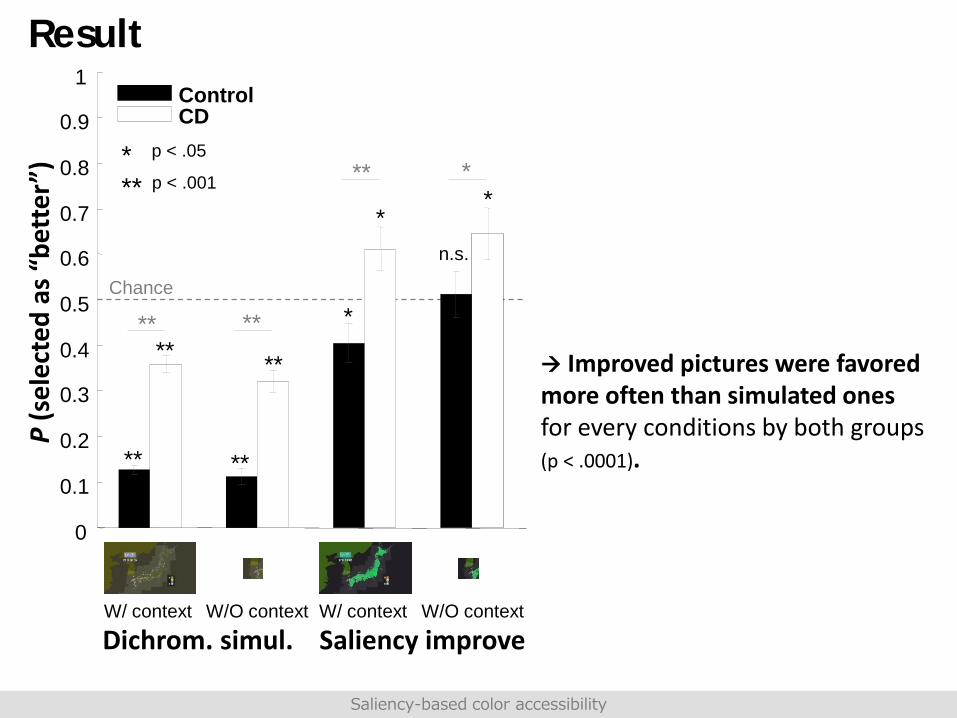
Result
W/ context W/O context
0
0.1
0.2
0.3
0.4
0.5
0.6
0.7
0.8
0.9
1ControlCD
P(s
elec
ted
as “
bett
er”)
Dichrom. simul.
Chance
**
**
**
**
* p < .05
** p < .001
** **
Saliency improveW/ context W/O context
*
**
n.s.
** *
Improved pictures were favored more often than simulated onesfor every conditions by both groups (p < .0001).
Saliency-based color accessibility
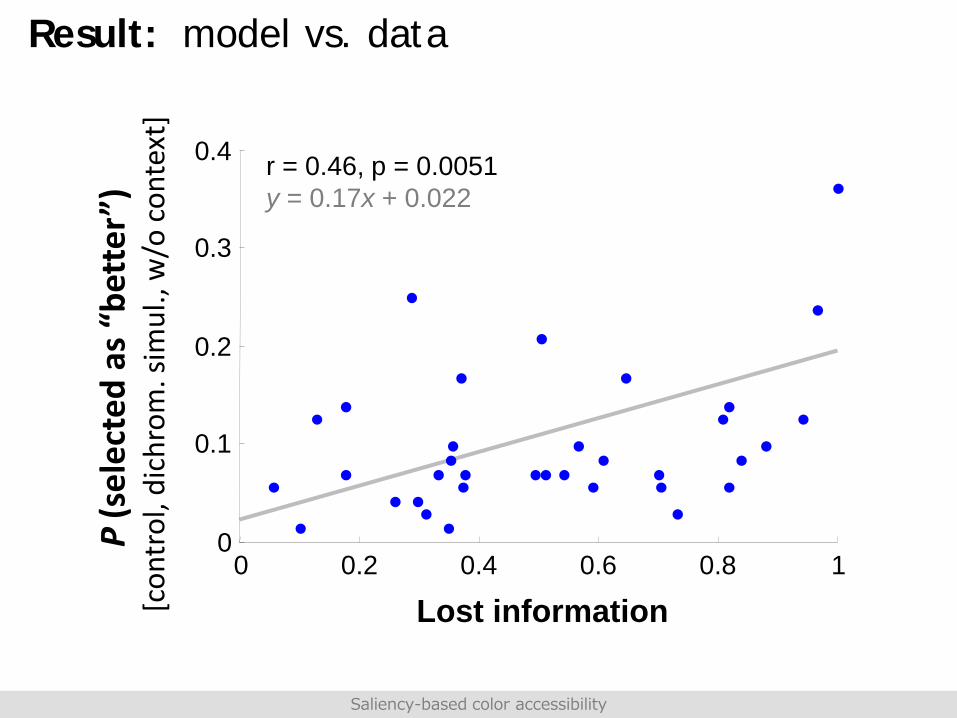
Result: model vs. data
0 0.2 0.4 0.6 0.8 10
0.1
0.2
0.3
0.4 r = 0.46, p = 0.0051y = 0.17x + 0.022
Lost information
P(s
elec
ted
as “
bett
er”)
[con
trol
,dic
hrom
.sim
ul.,
w/o
con
text
]
Saliency-based color accessibility
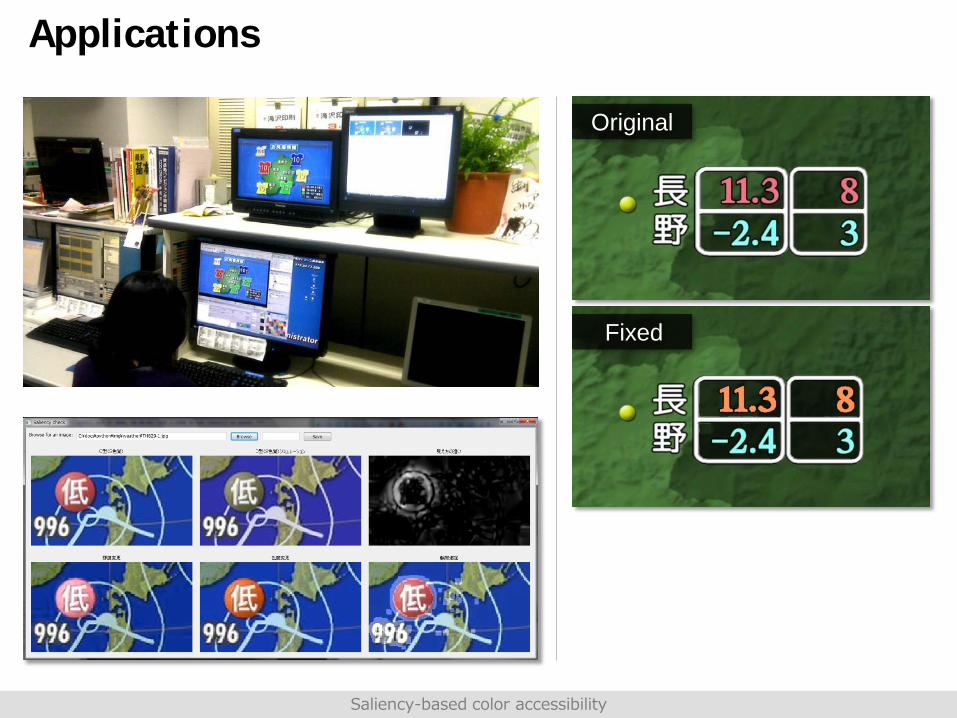
Applications
Fixed
Original
Saliency-based color accessibility
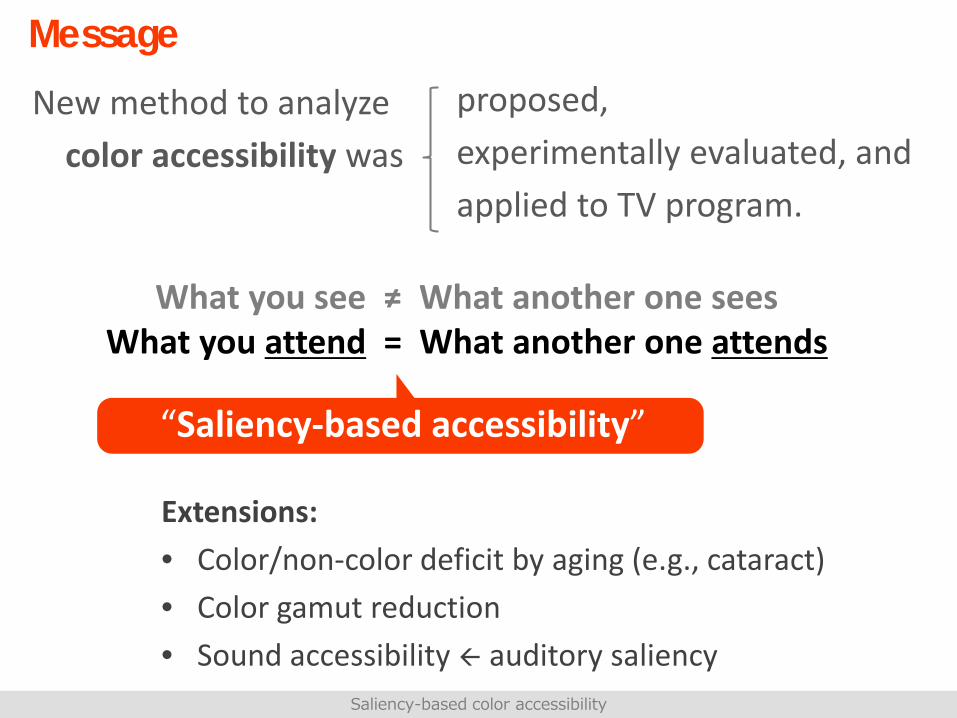
Message
New method to analyzecolor accessibility was
“Saliency-based accessibility”
Extensions:• Color/non-color deficit by aging (e.g., cataract)• Color gamut reduction• Sound accessibility auditory saliency
proposed,experimentally evaluated, andapplied to TV program.
What you see ≠ What another one sees What you attend = What another one attends
Saliency-based color accessibility
Reference:Satohiro Tajima, and Kazuteru Komine.Saliency-based color accessibility.IEEE Transactions on Image Processing, 24(3), 1115-1126, (2015).
Saliency-based color accessibility
Related Documents